Document
|
|
|
|
|
|
|
|
|
|
|
SHAREHOLDER LETTER
Q1 2025
|
|
|
|
|
|
|
|
|
|
|
|
|
|
|
|
|
|
|
Q1 |
|
| (in millions, except percentages) |
2024 |
2025 |
YoY Change |
|
|
|
|
| Revenue |
$126.6 |
$264.3 |
109% |
Transaction Value 1 |
$219.1 |
$473.1 |
116% |
| |
|
|
|
| |
|
|
|
| Gross Profit |
$23.7 |
$41.6 |
76% |
Contribution 1 |
$27.7 |
$44.0 |
59% |
|
|
|
|
| |
|
|
|
Net (Loss) |
$(1.5) |
$(2.3) |
57% |
Adjusted EBITDA 1 |
$14.4 |
$29.4 |
104% |
|
|
|
|
|
|
|
|
1.See “Key Business and Operating Metrics and Non-GAAP Financial Measures” for additional information regarding non-GAAP metrics and operating metrics used in this shareholder letter.
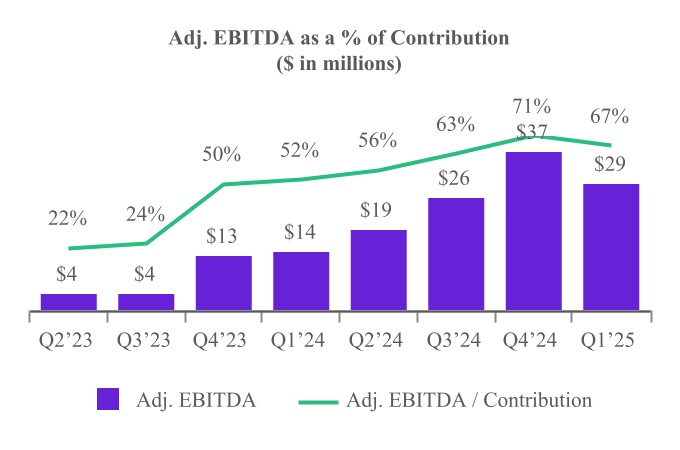
We delivered record first quarter financial results, which exceeded the high end of our guidance across all key financial metrics. Transaction Value increased 116% year over year to $473.1 million, ahead of our expectations, driven by strong performance in our Property & Casualty (P&C) insurance vertical, particularly in March. Adjusted EBITDA doubled year over year to $29.4 million—representing 67% of Contribution—highlighting the scalability of our marketplace and our efficient operating model.
Our core P&C insurance vertical grew 200% year over year. The main driver of our strong P&C results continues to be robust advertising spend by our key auto carrier partners, which has continued into the second quarter. While automotive tariff developments may put upward pressure on claims costs as the year progresses, we anticipate continued strong near-term momentum, as many insurers currently maintain margins above target levels and competition for market share remains robust.
Our Health insurance vertical, which contributed 12% of total first quarter Transaction Value, declined 17% year over year, in line with expectations. Following a comprehensive strategic review, we have made the decision to scale back certain areas of our under-65 presence and shift our focus toward Medicare Advantage—a substantial market with highly attractive long-term growth potential. While we anticipate second quarter Transaction Value in Medicare to be stable year over year, we are seeing accelerated declines in under-65. We firmly believe this strategic decision positions us to effectively capitalize on the compelling long-term opportunities within Medicare.
We continued to strengthen our balance sheet in the first quarter, ending the quarter with a net debt-to-Adjusted EBITDA ratio of under 1.0x. We remain confident in our ability to convert a meaningful portion of Adjusted EBITDA into unlevered free cash flow given our efficient operating model. As always, we are committed to managing our excess free cash flow with discipline to maximize long-term shareholder value.
We remain in active discussions with the Federal Trade Commission (FTC) regarding the settlement demand we received on October 30, 2024, which was related primarily to under-65 within our Health insurance vertical. We disagree with the FTC’s allegations and believe we have strong defenses. However, we continue to work with the agency in good faith. During the first quarter, we recorded an additional $5.0 million reserve related to this matter, bringing the total reserve to $12.0 million. Additional information can be found in our Form 10-Q filed today.
Looking ahead, we remain committed to solid execution in order to drive sustainable growth and deliver enhanced shareholder value. We are actively expanding our network of P&C Supply and Demand Partners to further increase the value of our marketplace and deepen our competitive moat. We are also further strengthening our partnerships with leading Medicare Advantage carriers to capture greater wallet share. Finally, we are strategically investing in predictive analytics and capitalizing on our scale to drive improved marketplace efficiency and unlock greater value for our partners. We are confident that these efforts will enable us to drive strong long-term growth and maximize shareholder value.
|
|
|
| Financial Discussion - Transaction Value and Revenue Metrics |
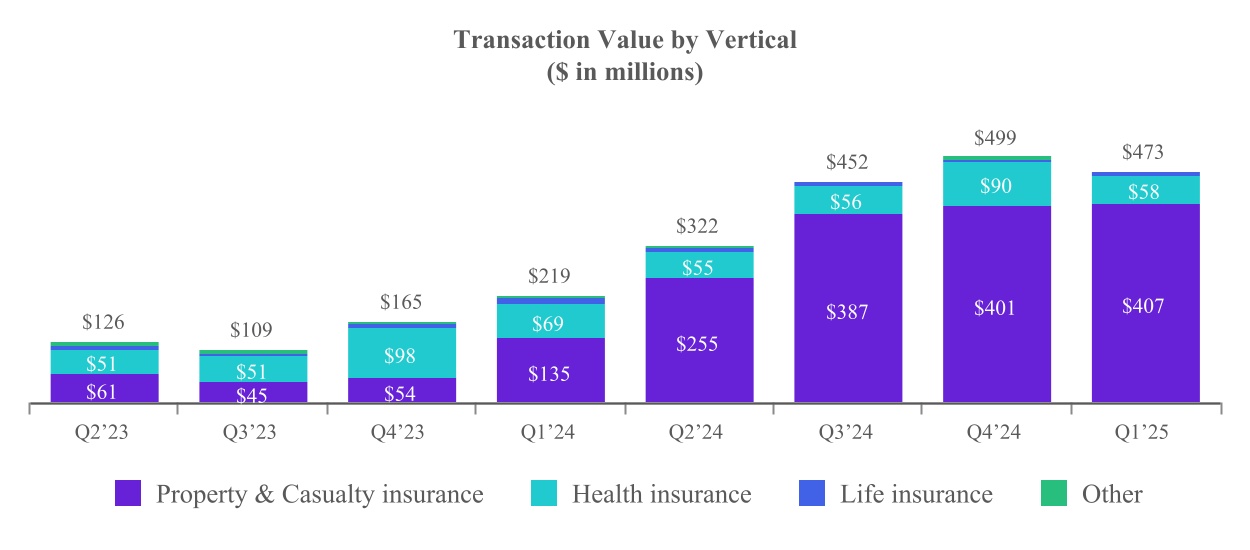
Transaction Value increased 116% year over year to $473.1 million in Q1 2025, driven primarily by a 200% increase in the P&C insurance vertical. Transaction Value represents the total gross investment in customer acquisition executed by our partners on our platform, and is one of the key metrics that reflects our ability to drive value for our partners and increase our share of wallet as budgets increasingly migrate online.
Transaction Value from our P&C insurance vertical increased 200% year over year to $406.8 million, driven by significant year-over-year increases in marketing budgets and customer acquisition spending by our carrier partners as they refocus on growth in response to improving underwriting profitability.
Transaction Value from our Health insurance vertical declined 17% year over year to $57.7 million, due to lower contribution from both under-65 health and Medicare.
Transaction Value from our Life insurance vertical declined 32% year over year to $7.0 million, driven by lower customer acquisition spending from our Demand Partners.
Transaction Value from our Other vertical, which includes travel and consumer finance, declined 62% year over year to $1.6 million.
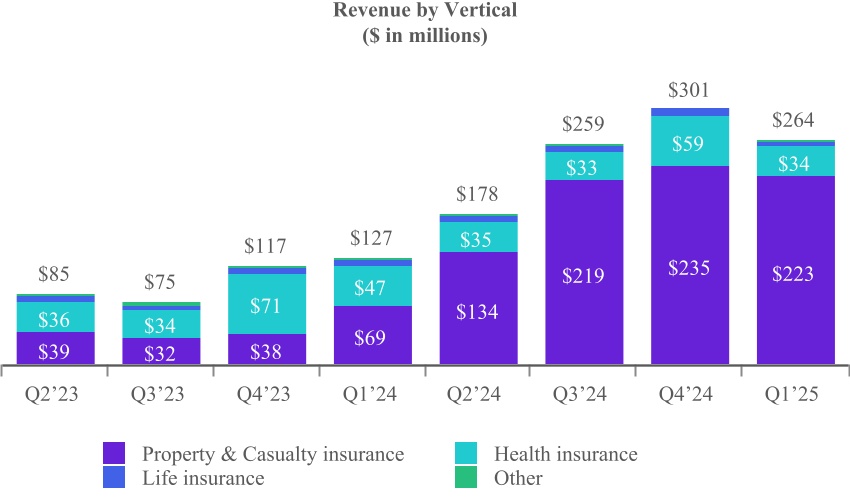
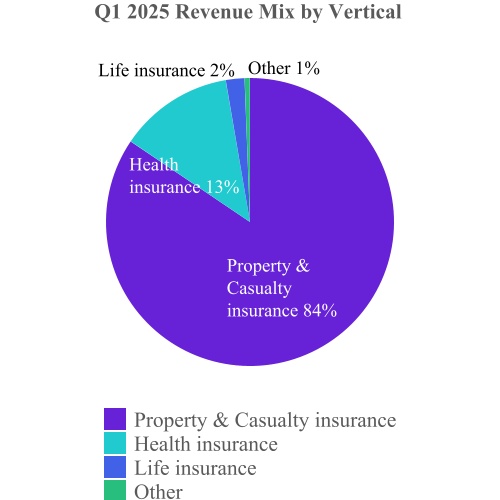
We generated $264.3 million of total revenue in Q1 2025, up 109% year over year, driven primarily by higher revenue from our P&C insurance vertical.
Revenue from our P&C insurance vertical increased 222% year over year to $223.2 million in Q1 2025, driven largely by the increase in Transaction Value.
Revenue from our Health insurance vertical declined 28% year over year to $33.9 million in Q1 2025. Health revenue declined at a higher rate than Transaction Value due to a higher mix of transactions from our Private Marketplace than in the prior year, where we recognize only our platform fee as revenue.
Revenue from our Life insurance vertical declined 26% year over year to $5.6 million in Q1 2025, driven by lower customer acquisition spending by our Demand Partners, offset in part by a higher mix of transactions from our Open Marketplace, which have a greater impact on revenue.
Revenue from our Other vertical, which consists of travel and consumer finance, declined 39% year over year to $1.6 million in Q1 2025.
|
|
|
Financial Discussion - Profitability |
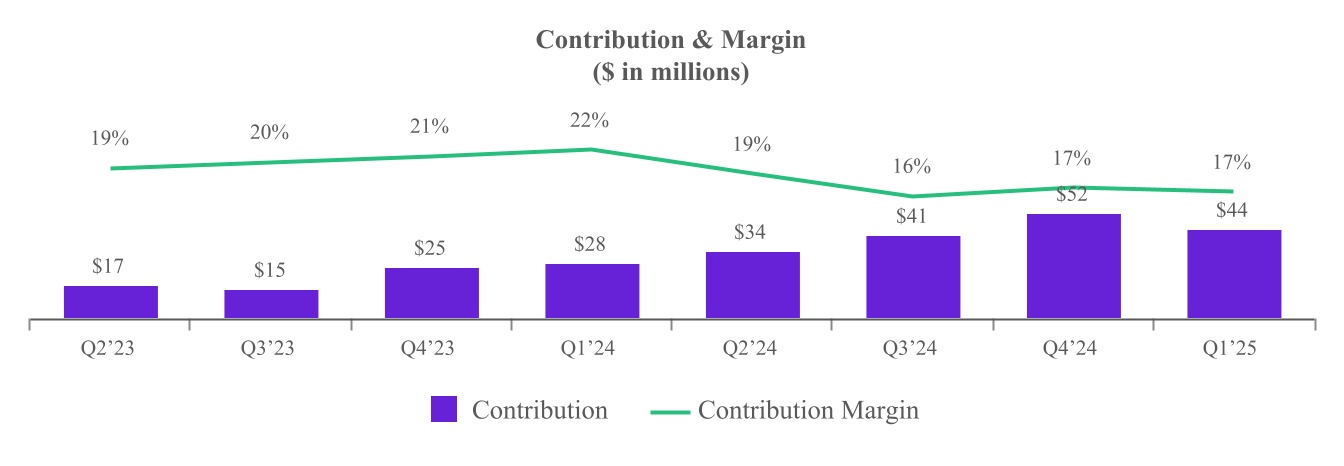
Gross profit was $41.6 million in Q1 2025, a year-over-year increase of 76%. Contribution, which generally represents revenue less revenue share payments and online advertising costs, was $44.0 million in Q1 2025, a year-over-year increase of 59%. The year-over-year increases in Gross Profit and Contribution were driven primarily by the higher revenue, offset in part by lower take rates due to a higher mix of transactions coming from our P&C vertical, which has lower average take rates due to a higher proportion of Private Marketplace transactions. Contribution Margin was 16.6% in Q1 2025, compared with 21.9% in Q1 2024.
Net loss was $2.3 million in Q1 2025, compared with a net loss of $1.5 million in Q1 2024. The increase in net loss was driven primarily by a $13.4 million charge to write-off certain intangible assets related to the Customer Helper Team acquisition and a charge of $5.0 million to increase the reserve related to the FTC Matter, offset primarily by an increase in gross profit of $18.0 million.
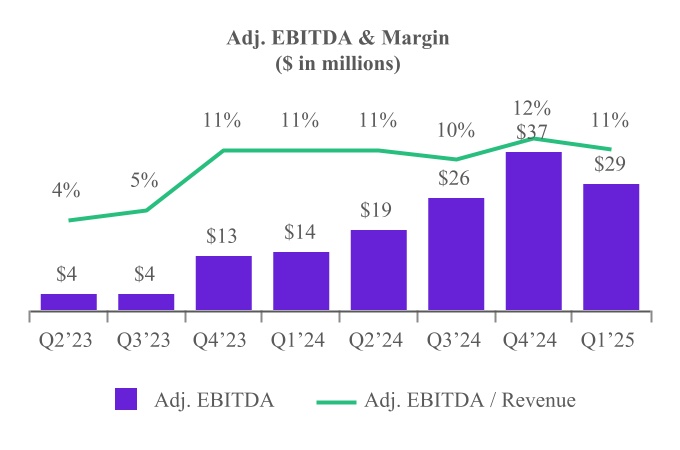
Adjusted EBITDA was $29.4 million in Q1 2025, a year-over-year increase of 104%. The increase was driven primarily by higher gross profit, partially offset by moderate headcount investments. Adjusted EBITDA margin was 11.1% in Q1 2025, compared with 11.4% in Q1 2024.
Financial Discussion - Q2 2025 Outlook 1
|
|
|
|
|
|
|
|
|
|
|
|
|
|
|
|
|
Q2 2025 |
Transaction Value 2 |
|
$470 million |
- |
$495 million |
| Y/Y Growth |
|
46% |
|
54% |
|
|
|
|
|
|
|
|
|
|
| Revenue |
|
$235 million |
- |
$255 million |
| Y/Y Growth |
|
32% |
|
43% |
|
|
|
|
|
|
|
|
|
|
Adjusted EBITDA 2 |
|
$25.0 million |
- |
$27.0 million |
| Y/Y Growth |
|
33% |
|
44% |
Our guidance for Q2 2025 reflects a continuation of the recent trends in customer acquisition spending that we have seen in our P&C insurance vertical. Although automotive tariff developments could introduce some upward pressure on claims costs later in the year, we expect Transaction Value in our P&C insurance vertical to grow 65% - 75% year over year in the second quarter, supported by strong carrier profitability and high engagement on our platform. We expect second quarter Transaction Value in our Health insurance vertical to be down 25% - 30% year over year as stable trends in Medicare are more than offset by a significant decline in under-65 as we scale back parts of that business. We expect our decision to exit Travel by the end of the second quarter to have an immaterial impact on our consolidated results.
Transaction Value: For Q2 2025, we expect Transaction Value to be in the range of $470 million - $495 million, a year-over-year increase of 50% at the midpoint.
Revenue: For Q2 2025, we expect revenue to be in the range of $235 million - $255 million, a year-over-year increase of 37% at the midpoint.
Adjusted EBITDA: For Q2 2025, we expect Adjusted EBITDA to be in the range of $25.0 million and $27.0 million, a year-over-year increase of 39% at the midpoint. We are projecting Contribution less Adjusted EBITDA to be approximately $0.5 - $1.0 million higher than in Q1 2025.
Thank you,
|
|
|
|
|
|
|
|
|
| Steve Yi |
|
Patrick Thompson |
| Chief Executive Officer, President and Co-Founder |
|
Chief Financial Officer & Treasurer |
1 With respect to the Company’s projections of Adjusted EBITDA and Contribution under “Financial Discussion – Q2 2025 Outlook”, MediaAlpha is not providing a reconciliation of Adjusted EBITDA to net income (loss), or of Contribution to gross profit, because the Company is unable to predict with reasonable certainty the reconciling items that may affect the corresponding GAAP measures without unreasonable effort. These reconciling items are uncertain, depend on various factors and could significantly impact, either individually or in the aggregate, the GAAP measures for the applicable period.
2 See “Key Business and Operating Metrics and Non-GAAP Financial Measures” for additional information regarding non-GAAP metrics and operating metrics used in this shareholder letter.
|
|
|
Key Business and Operating Metrics and Non-GAAP Financial Measures |
In addition to traditional financial metrics, we rely upon certain business and operating metrics that are not presented in accordance with GAAP to estimate the volume of spending on our platform, estimate and recognize revenue, evaluate our business performance and facilitate our operations. Such business and operating metrics should not be considered in isolation from, or as an alternative to, measures presented in accordance with GAAP and should be considered together with other operating and financial performance measures presented in accordance with GAAP. Also, such business and operating metrics may not necessarily be comparable to similarly titled measures presented by other companies.
Transaction Value
We define “Transaction Value” as the total gross dollars transacted by our partners on our platform. Transaction Value is an operating metric not presented in accordance with GAAP, and is a driver of revenue based on the economic relationships we have with our partners. Our partners use our platform to transact via Open and Private Marketplace transactions. In our Open Marketplace model, revenue recognized represents the fees paid by our Demand Partners for Consumer Referrals sold and is equal to the Transaction Value and revenue share payments to our Supply Partners represent costs of revenue. In our Private Marketplace model, revenue recognized represents a platform fee billed to the Demand Partner or Supply Partner based on an agreed-upon percentage of the Transaction Value for the Consumer Referrals transacted, and accordingly there are no associated costs of revenue. We utilize Transaction Value to assess the overall level of transaction activity through our platform. We believe it is useful to investors to assess the overall level of activity on our platform and to better understand the sources of our revenue across our different transaction models and verticals.
The following table presents Transaction Value by platform model for the three months ended March 31, 2025 and 2024:
|
|
|
|
|
|
|
|
|
|
|
|
|
|
|
|
|
Three Months Ended March 31, |
|
|
| (in thousands) |
2025 |
|
2024 |
|
|
|
|
| Open Marketplace transactions |
$ |
258,419 |
|
|
$ |
122,429 |
|
|
|
|
|
| Percentage of total Transaction Value |
54.6 |
% |
|
55.9 |
% |
|
|
|
|
| Private Marketplace transactions |
214,682 |
|
|
96,677 |
|
|
|
|
|
| Percentage of total Transaction Value |
45.4 |
% |
|
44.1 |
% |
|
|
|
|
| Total Transaction Value |
$ |
473,101 |
|
|
$ |
219,106 |
|
|
|
|
|
The following table presents Transaction Value by vertical for the three months ended March 31, 2025 and 2024:
|
|
|
|
|
|
|
|
|
|
|
|
|
|
|
|
|
Three Months Ended March 31, |
|
|
| (in thousands) |
2025 |
|
2024 |
|
|
|
|
| Property & Casualty insurance |
$ |
406,847 |
|
|
$ |
135,494 |
|
|
|
|
|
| Percentage of total Transaction Value |
86.0 |
% |
|
61.8 |
% |
|
|
|
|
| Health insurance |
57,679 |
|
|
69,087 |
|
|
|
|
|
| Percentage of total Transaction Value |
12.2 |
% |
|
31.5 |
% |
|
|
|
|
| Life insurance |
6,956 |
|
|
10,237 |
|
|
|
|
|
| Percentage of total Transaction Value |
1.5 |
% |
|
4.7 |
% |
|
|
|
|
| Other |
1,619 |
|
|
4,288 |
|
|
|
|
|
| Percentage of total Transaction Value |
0.3 |
% |
|
2.0 |
% |
|
|
|
|
| Total Transaction Value |
$ |
473,101 |
|
|
$ |
219,106 |
|
|
|
|
|
Contribution and Contribution Margin
We define “Contribution” as revenue less revenue share payments and online advertising costs, or, as reported in our consolidated statements of operations, revenue less cost of revenue (i.e., gross profit), as adjusted to exclude the following items from cost of revenue: equity-based compensation; salaries, wages, and related costs; internet and hosting costs; amortization; depreciation; other services; and merchant-related fees. We define “Contribution Margin” as Contribution expressed as a percentage of revenue for the same period. Contribution and Contribution Margin are non-GAAP financial measures that we present to supplement the financial information we present on a GAAP basis. We use Contribution and Contribution Margin to measure the return on our relationships with our Supply Partners (excluding certain fixed costs), the financial return on and efficacy of our online advertising costs to drive consumers to our proprietary websites, and our operating leverage. We do not use Contribution and Contribution Margin as measures of overall profitability. We present Contribution and Contribution Margin because they are used by our management and board of directors to manage our operating performance, including evaluating our operational performance against budget and assessing our overall operating efficiency and operating leverage. For example, if Contribution increases and our headcount costs and other operating expenses remain steady, our Adjusted EBITDA and operating leverage increase. If Contribution Margin decreases, we may choose to re-evaluate and re-negotiate our revenue share agreements with our Supply Partners, to make optimization and pricing changes with respect to our bids for keywords from primary traffic acquisition sources, or to change our overall cost structure with respect to headcount, fixed costs and other costs. Other companies may calculate Contribution and Contribution Margin differently than we do. Contribution and Contribution Margin have their limitations as analytical tools, and you should not consider them in isolation or as substitutes for analysis of our results presented in accordance with GAAP.
The following table reconciles Contribution with gross profit, the most directly comparable financial measure calculated and presented in accordance with GAAP, for the three months ended March 31, 2025 and 2024:
|
|
|
|
|
|
|
|
|
|
|
|
|
|
|
|
|
Three Months Ended March 31, |
|
|
| (in thousands) |
2025 |
|
2024 |
|
|
|
|
| Revenue |
$ |
264,309 |
|
|
$ |
126,649 |
|
|
|
|
|
| Less cost of revenue |
(222,670) |
|
|
(102,969) |
|
|
|
|
|
| Gross profit |
$ |
41,639 |
|
|
$ |
23,680 |
|
|
|
|
|
| Adjusted to exclude the following (as related to cost of revenue): |
|
|
|
|
|
|
|
| Equity-based compensation |
294 |
|
|
1,857 |
|
|
|
|
|
| Salaries, wages, and related |
816 |
|
|
908 |
|
|
|
|
|
| Internet and hosting |
171 |
|
|
131 |
|
|
|
|
|
| Other expenses |
202 |
|
|
203 |
|
|
|
|
|
| Depreciation |
6 |
|
|
5 |
|
|
|
|
|
| Other services |
712 |
|
|
828 |
|
|
|
|
|
| Merchant-related fees |
142 |
|
|
64 |
|
|
|
|
|
| Contribution |
$ |
43,982 |
|
|
$ |
27,676 |
|
|
|
|
|
| Gross margin |
15.8 |
% |
|
18.7 |
% |
|
|
|
|
| Contribution Margin |
16.6 |
% |
|
21.9 |
% |
|
|
|
|
Consumer Referrals
We define “Consumer Referral” as any consumer click, call or lead purchased by a buyer on our platform. Click revenue is recognized on a pay-per-click basis and revenue is earned and recognized when a consumer clicks on a listed buyer’s advertisement that is presented subsequent to the consumer’s search (e.g., auto insurance quote search or health insurance quote search). Call revenue is earned and recognized when a consumer transfers to a buyer and remains engaged for a requisite duration of time, as specified by each buyer. Lead revenue is recognized when we deliver data leads to buyers. Data leads are generated either through insurance carriers, insurance-focused research destination websites or other financial websites that make the data leads available for purchase through our platform, or when consumers complete a full quote request on our proprietary websites. Delivery occurs at the time of lead transfer. The data we generate from each Consumer Referral feeds into our analytics model to generate conversion probabilities for each unique consumer, enabling discovery of predicted return and cost per sale across the platform and helping us to improve our platform technology. We monitor the number of Consumer Referrals on our platform in order to measure Transaction Value, revenue and overall business performance across our verticals and platform models.
The following table presents the percentages of total Transaction Value generated from clicks, calls and leads for the three months ended March 31, 2025 and 2024:
|
|
|
|
|
|
|
|
|
|
|
|
|
|
|
|
|
Three Months Ended March 31, |
|
|
|
2025 |
|
2024 |
|
|
|
|
| Clicks |
87.0 |
% |
|
74.6 |
% |
|
|
|
|
| Calls |
6.5 |
% |
|
15.9 |
% |
|
|
|
|
| Leads |
6.5 |
% |
|
9.5 |
% |
|
|
|
|
Adjusted EBITDA
We define “Adjusted EBITDA” as net income (loss) excluding interest expense, income tax expense (benefit), depreciation expense on property and equipment, amortization of intangible assets, as well as equity-based compensation expense and certain other adjustments as listed in the table below. We define “Adjusted EBITDA Margin” as Adjusted EBITDA as a percentage of revenue. Adjusted EBITDA is a non-GAAP financial measure that we present to supplement the financial information we present on a GAAP basis. We monitor and present Adjusted EBITDA because it is a key measure used by our management to understand and evaluate our operating performance, to establish budgets and to develop operational goals for managing our business. We believe that Adjusted EBITDA helps identify underlying trends in our business that could otherwise be masked by the effect of the expenses that we exclude in the calculations of Adjusted EBITDA. Accordingly, we believe that Adjusted EBITDA provides useful information to investors and others in understanding and evaluating our operating results, enhancing the overall understanding of our past performance and future prospects. In addition, presenting Adjusted EBITDA provides investors with a metric to evaluate the capital efficiency of our business.
Adjusted EBITDA is not presented in accordance with GAAP and should not be considered in isolation of, or as an alternative to, measures presented in accordance with GAAP. There are a number of limitations related to the use of Adjusted EBITDA rather than net income, which is the most directly comparable financial measure calculated and presented in accordance with GAAP. These limitations include the fact that Adjusted EBITDA excludes interest expense on debt, income tax expense (benefit), equity-based compensation expense, depreciation and amortization, and certain other adjustments that we consider to be useful to investors and others in understanding and evaluating our operating results. In addition, other companies may use other measures to evaluate their performance, including different definitions of “Adjusted EBITDA,” which could reduce the usefulness of our Adjusted EBITDA as a tool for comparison.
The following table reconciles Adjusted EBITDA with net (loss), the most directly comparable financial measure calculated and presented in accordance with GAAP, for the three months ended March 31, 2025 and 2024:
|
|
|
|
|
|
|
|
|
|
|
|
|
|
|
|
|
Three Months Ended March 31, |
|
|
| (in thousands) |
2025 |
|
2024 |
|
|
|
|
| Net (loss) |
$ |
(2,334) |
|
|
$ |
(1,491) |
|
|
|
|
|
| Equity-based compensation expense |
7,024 |
|
|
8,634 |
|
|
|
|
|
| Interest expense |
2,955 |
|
|
3,845 |
|
|
|
|
|
| Income tax (benefit) expense |
(49) |
|
|
27 |
|
|
|
|
|
| Depreciation expense on property and equipment |
62 |
|
|
61 |
|
|
|
|
|
| Amortization of intangible assets |
1,444 |
|
|
1,609 |
|
|
|
|
|
Transaction expenses(1) |
— |
|
|
658 |
|
|
|
|
|
|
|
|
|
|
|
|
|
Write-off of intangible assets(2) |
13,416 |
|
|
— |
|
|
|
|
|
|
|
|
|
|
|
|
|
|
|
|
|
|
|
|
|
|
|
|
|
|
|
|
|
|
|
|
|
|
|
|
|
| Changes in Tax Indemnification Receivable |
(21) |
|
|
(1) |
|
|
|
|
|
|
|
|
|
|
|
|
|
Legal expenses(3) |
6,879 |
|
|
1,077 |
|
|
|
|
|
|
|
|
|
|
|
|
|
| Adjusted EBITDA |
$ |
29,376 |
|
|
$ |
14,419 |
|
|
|
|
|
(1)Transaction expenses consist of $0.7 million of legal and accounting fees incurred by us for the three months ended March 31, 2024 in connection with resale registration statements filed with the SEC.
(2)Write-off of intangible assets for the three months ended March 31, 2025 consist of a charge of $13.4 million related to the write-off of customer relationships and trademarks, trade names, and domain names intangible assets acquired as part of the acquisition of Customer Helper Team, LLC.
(3)Legal expenses of $6.9 million for the three months ended March 31, 2025, consist of a $5.0 million increase to the loss reserve established in connection with the FTC Matter and legal fees and costs incurred in connection with such matter. Legal expenses of $1.1 million for the three months ended March 31, 2024, consist of legal fees incurred in connection with the FTC Matter.
Forward-Looking Statements
This shareholder letter contains forward-looking statements within the meaning of the Private Securities Litigation Reform Act of 1995, including without limitation statements regarding our expectation of continued strong near-term momentum in our P&C insurance vertical; our expectation regarding Transaction Value in our Health vertical in the second quarter and beyond; our belief that our strategic decision to scale back certain areas of our under-65 presence and shift our focus toward Medicare Advantage positions us to effectively capitalize on the compelling long-term opportunities within Medicare; our confidence in our ability to convert a meaningful portion of Adjusted EBITDA into unlevered free cash flow given our efficient operating model; our belief that we have meritorious defenses to the FTC’s allegations; our belief that the initiatives we are pursuing in P&C insurance and Medicare Advantage will enable us to drive strong long-term growth and maximize shareholder value; and our financial outlook for the second quarter of 2025. These forward-looking statements reflect our current views with respect to, among other things, future events and our financial performance. These statements are often, but not always, made through the use of words or phrases such as “may,” “should,” “could,” “predict,” “potential,” “believe,” “will likely result,” “expect,” “continue,” “will,” “anticipate,” “seek,” “estimate,” “intend,” “plan,” “projection,” “would,” and “outlook,” or the negative version of those words or other comparable words or phrases of a future or forward-looking nature. These forward-looking statements are not historical facts, and are based on current expectations, estimates and projections about our industry, management’s beliefs and certain assumptions made by management, many of which, by their nature, are inherently uncertain and beyond our control. Accordingly, we caution you that any such forward-looking statements are not guarantees of future performance and are subject to risks, assumptions and uncertainties that are difficult to predict. Although we believe that the expectations reflected in these forward-looking statements are reasonable as of the date made, actual results may prove to be materially different from the results expressed or implied by the forward-looking statements.
There are or will be important factors that could cause our actual results to differ materially from those indicated in these forward-looking statements, including those more fully described in MediaAlpha’s filings with the Securities and Exchange Commission (“SEC”), including the Form 10-K filed on February 24, 2025 and the Form 10-Q to be filed on April 30, 2025. These factors should not be construed as exhaustive. MediaAlpha disclaims any obligation to update any forward-looking statements to reflect events or circumstances that occur after the date of this shareholder letter.