Document
Exhibit 99.1
Dear Shareholders,
Since Carvana's founding, we have had unwavering conviction about the profitability of our online sales model. In Q2 and Q3, our results resoundingly validated this conviction. In Q2 and Q3 combined, we generated $636 million of net income1 and more than $300 million of Adjusted EBITDA, which includes ~$110 million of non-recurring items.
Beneath the headline metrics, we believe the story is even stronger. First, we generated these results despite carrying the costs of significant excess capacity for future growth. In Q3, we demonstrated our ability to leverage these costs by decreasing SG&A expense per retail unit sold by more than $400 while increasing retail units by 6% sequentially.
Second, we achieved these results despite a challenging used vehicle industry environment. Used vehicle prices continue to be elevated, and interest rates remain at multi-decade highs. Despite these challenges, Carvana's profitability in Q3 reached an all-time high.
Our Q3 results highlight the significant progress we are making on our plan to drive positive free cash flow. As discussed previously, our plan has three steps:
1. Drive the business to positive Adjusted EBITDA.
2. Drive the business to significant Adjusted EBITDA per unit (also referred to as significant positive unit economics).
3. After completing Steps 1 and 2, return to growth.
In the second quarter, we completed Step 1. In the third quarter, we made significant progress in Step 2, reaching positive net income, delivering another quarter of exceptional Adjusted EBITDA results, demonstrating meaningful operating leverage, and continuing to make unit economic gains.
The impact of our efforts is evident in our results. For example, since Q1, we have reduced non-vehicle retail costs of sales by ~$600 per unit and operations expenses by ~$400 per unit, a nearly $1,000 gain in unit economics in just two quarters.
With the significant positive unit economics we are currently achieving, a natural question to ask is “When is the time to transition to Step 3 and return to growth”? To answer that question, we look at the opportunity still ahead of us in Step 2. We have built tremendous momentum in the business around many foundational initiatives that increase operating efficiency and seed the ground for profitable growth. As these initiatives come closer to maturation, we will be ready to shift to Step 3.
Our customers love our offering. Our team and execution are stronger than ever. And we still have 99% of the market to address. We have powerful infrastructure on-hand to support significant growth. Our opportunity remains as enormous as it has always been. We are firmly on the path to selling millions of cars per year and to becoming the largest and most profitable automotive retailer.
Summary of Q3 2023 Results
Q3 2023 Financial Results: All financial comparisons stated below are versus Q3 2022, unless otherwise noted. Complete financial tables appear at the end of this letter.
•Retail units sold totaled 80,987, a decrease of 21%
•Revenue totaled $2.773 billion, a decrease of 18%
•Total gross profit was $482 million, an increase of 34%
•Total gross profit per unit (“GPU”) was $5,952, an increase of $2,452
•Non-GAAP Total GPU was $6,396, an increase of $2,526
◦GAAP and Non-GAAP Total GPU included ~$500 of non-recurring benefits, which primarily consisted of selling and holding a higher-than-normalized volume of loans
•Net income margin was 26.7%, a sequential improvement of 30.2%
1 Throughout this letter, we mention third quarter positive net income due to SEC disclosure rules that require equal or greater prominence of GAAP metrics with non-GAAP metrics such as Adjusted EBITDA. Our significant Q3 positive net income was assisted by a gain on debt extinguishment from our Q3 exchange offer, which is a non-recurring benefit. We cannot guarantee we will achieve positive income in future periods.
•Net income totaled $741 million and benefitted by ~$878 million gain on debt extinguishment as a result of our corporate debt exchange2
•Adjusted EBITDA margin was 5.3%, a sequential improvement of 0.1%
◦Adjusted EBITDA totaled $148 million, including ~$40 million of non-recurring benefits2
•Basic and diluted earnings per Class A share were $7.05 and $3.60, respectively, based on 111 million and 206 million shares of Class A common stock outstanding, respectively
Other Results and Recent Events:
•On September 1, 2023, we closed the previously announced corporate debt exchange with approximately 96.4% of noteholders agreeing to exchange $5.520 billion of our unsecured notes for cash or new senior secured notes, reducing total debt by over $1.325 billion, extending maturities, and decreasing required cash interest payments by more than $455 million per year for the next two years.
•On November 1, 2023, we extended our Floor Plan Facility with Ally to April 2025.
•In Q3, we completed four securitizations, selling an aggregate of over $1.0 billion of loan principal.
Fourth Quarter Outlook
Our third quarter results demonstrated continued significant progress on our path to profitability. We achieved positive net income and, for the second consecutive quarter, realized significant positive Adjusted EBITDA both with and without benefits from non-recurring items.
While the macroeconomic and industry environment continues to be uncertain, looking toward the fourth quarter of 2023, we expect the following as long as the environment remains stable:
•A sequential decline in retail units sold, driven primarily by industry and seasonal patterns,
•Non-GAAP Total GPU above $5,000 for the third consecutive quarter3, and
•Positive Adjusted EBITDA for the third consecutive quarter3.
Looking toward 2024, we expect to drive significant Total GPU and Adjusted EBITDA3 for the second consecutive year.
Our Three-Step Plan
In our Q4 2022 shareholder letter we introduced our three-step plan for driving positive free cash flow.
Step 1 (return to positive Adjusted EBITDA, achieved in Q2 2023) was primarily focused on right-sizing our staffing, advertising, and inventory for the current economic environment.
Step 2 (drive significant Adjusted EBITDA per unit, our current focus) is primarily focused on driving fundamental operating efficiency across the business. In Step 2, we are maintaining relatively stable levels of staffing, advertising, and inventory while we focus on numerous technology, process, and product initiatives that bolster unit economics and we expect will position us well for future growth.
Step 3 (return to growth) will be focused on long-term profitable growth, starting from our current base of ~1% of the U.S. used vehicle retail market. In Step 3 we will shift our management and product development focus to growth initiatives while growing inventory, advertising, and staffing to drive the flywheel of growth that we demonstrated from 2013 through 2021.
Why We Are Excited About Step 2
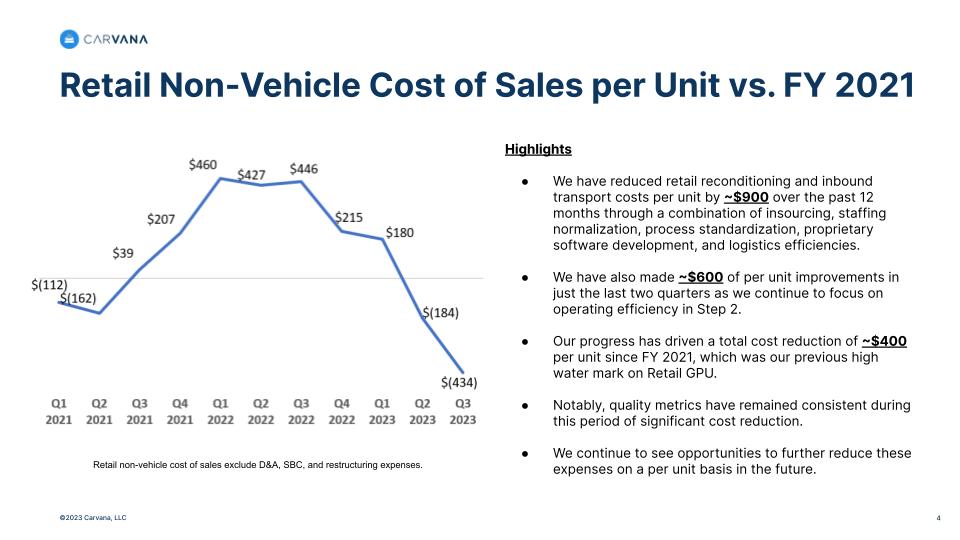
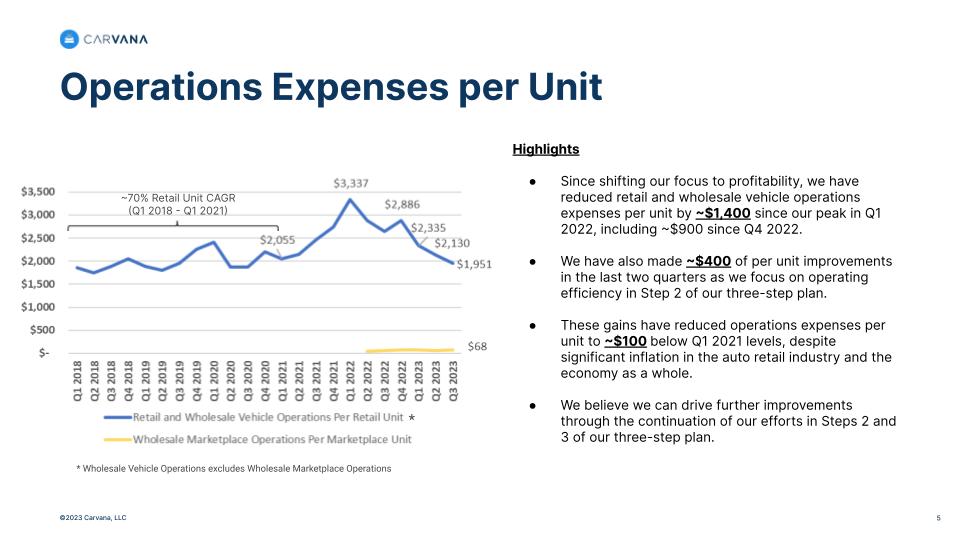
Our Q3 results demonstrate significant gains from our Step 2 focus on operating efficiency. The charts below, which can also be found in the “Cost Structure Detail” deck on our Investor Relations website, illustrate the exceptional progress we are making in two key drivers of variable unit economics: retail cost of sales and operations expenses per retail unit sold.
2 Net income and Adjusted EBITDA both benefited from ~$40 million of non-recurring items, which primarily consisted of selling and holding a higher-than-normalized volume of loans.
3 In order to clearly demonstrate our progress and highlight the most meaningful drivers within our business, we continue to use forecasted Non-GAAP financial measures, including forecasted Non-GAAP Total GPU and Adjusted EBITDA, as we look toward Q4 2023 and beyond. We have not provided a quantitative reconciliation of forecasted GAAP measures to forecasted Non-GAAP measures within this communication because we are unable, without making unreasonable efforts, to calculate one-time or restructuring expenses. These items could materially affect the computation of forward-looking GAAP GPU and Net Income.
Retail Cost of Sales Efficiency
Our Step 2 focus has resulted in significant and sustainable improvements in retail cost of sales, which has contributed to our strength in Retail GPU over the last few quarters.
Operations Expense Efficiency
Our Step 2 focus is also showing meaningful gains in operations expenses per retail unit sold.4
4 Operations expenses include the fulfillment, customer service, and transaction expenses associated with completing retail and wholesale vehicle sales (Carvana), and wholesale marketplace sales (ADESA). Operations expenses tend to be more variable in nature, although they also have semi-fixed components, resulting from, for example, operations management payroll and under-utilization of logistics haulers.
Why We Are Excited About Step 3
While we remain focused on Step 2 today, we see a clear opportunity to demonstrate significant operating leverage when we return to growth in Step 3 due to the substantial volume supported by our existing infrastructure.
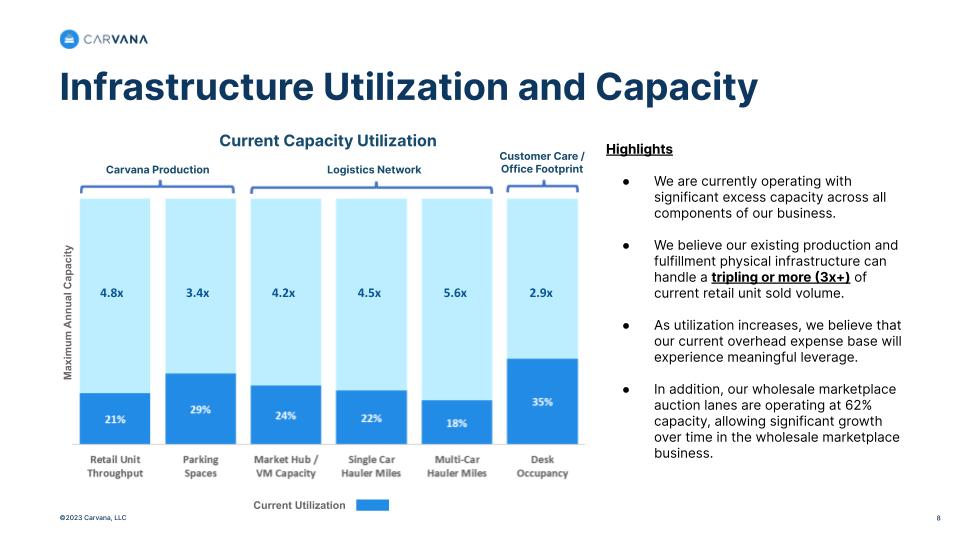
Significant Excess Capacity
Our existing infrastructure can handle multiples of current production and fulfillment needs, which unlocks a significant opportunity for efficient and profitable growth. The graph below illustrates our current infrastructure utilization as a percent of maximum annual capacity.
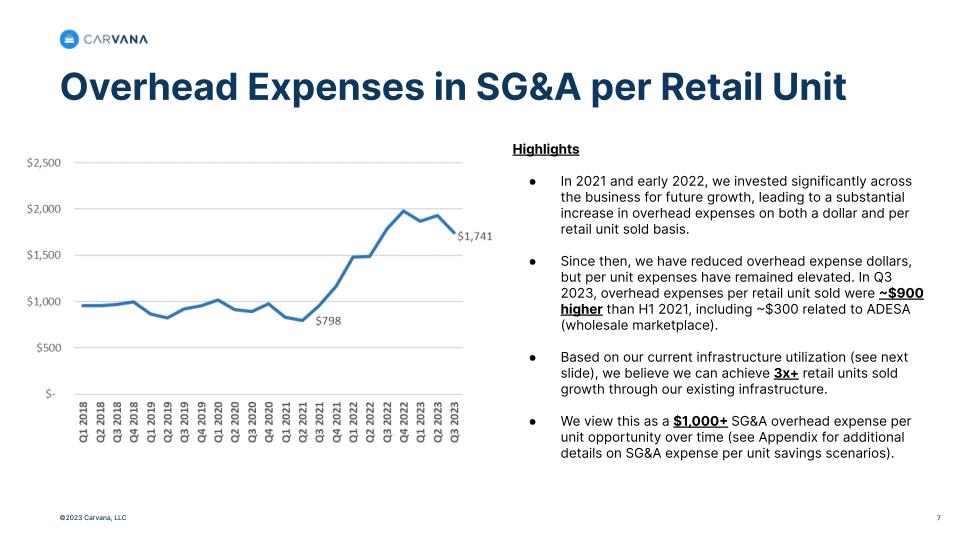
Overhead Expense Leverage
Our substantial capacity also means we are carrying significantly more than a normalized level of overhead expenses.5 This presents a large opportunity for operating leverage when we return to growth in Step 3.
Management Objectives
Consistent with the priorities shared in the last several letters, our current focus remains centered on lowering expenses and driving positive free cash flow. However, this letter maintains our historical format built around the three objectives (1) Grow Retail Units and Revenue; (2) Increase Total Gross Profit Per Unit; and (3) Demonstrate Operating Leverage, to discuss our key results.
1 Net Income margin in Q3 2023 benefited from a one-time gain on debt extinguishment of ~$878 million.
2 Adjusted EBITDA is defined as net income (loss) plus income tax provision, interest expense, other (income) expense, net, depreciation and amortization in cost of sales and SG&A, goodwill impairment, share-based compensation including the CEO Milestone Gift in cost of sales and SG&A, and restructuring costs, minus revenue related to our Root warrants and gain on debt extinguishment. For additional information on Adjusted EBITDA and other Non-GAAP financial metrics referenced in this letter, please see the financial tables at the end of this letter and our Q3 2023 supplemental financial tables posted on our investor relations website.
3 EBITDA Margin is calculated as GAAP Net Income (Loss) plus income tax expense, interest expense, and depreciation and amortization, divided by revenues.
Objective #1: Grow Retail Units and Revenue
Retail units sold totaled 80,987 in Q3, a sequential increase of 6%. Revenue was $2.773 billion in Q3, a sequential decrease of 7%, primarily due to lower retail average selling prices and a reduction in wholesale vehicle revenue relative to retail revenue. While our recent efficiency initiatives have created a headwind to unit growth in recent quarters, our Q3 2023 retail units sold volume and total revenue generated a 5-year compound annual growth rate (CAGR) of 26% and 39%, respectively.
5 Overhead expenses include facilities, corporate, and technology expenses associated with supporting retail and wholesale vehicle sales (Carvana) and wholesale marketplace sales (ADESA). Overhead expenses tend to be more fixed in nature, although they may have semi-variable components, resulting from, for example, certain corporate payroll and technology expenses.
Objective #2: Increase Total Gross Profit Per Unit
Our Total GPU in Q3 2023 was primarily driven by substantial fundamental improvements in the operations of the business.
For Q3 2023
•Total
◦Total GPU was $5,952 vs. $3,500 in Q3 2022 and $6,520 in Q2 2023.
◦Non-GAAP Total GPU was $6,396 vs. $3,870 in Q3 2022 and $7,030 in Q2 2023.6
▪Total GPU included an aggregate ~$500 per retail unit benefit from non-recurring items, including ~$400 from selling and holding a higher-than-normalized volume of loans and ~$100 from inventory allowance adjustment.7
•Retail
◦Retail GPU was $2,692 vs. $1,131 in Q3 2022 and $2,666 in Q2 2023.
◦Non-GAAP Retail GPU was $2,877 vs. $1,268 in Q3 2022 and $2,862 in Q2 2023.
◦The sequential increase in Retail GPU was primarily driven by lower average days to sale, lower reconditioning and inbound transport costs, and wider spreads between wholesale and retail market prices, partially offset by higher retail depreciation rates and a smaller inventory allowance adjustment benefit compared to Q2.
◦Year-over-year changes in Retail GPU were primarily driven by the same factors.
•Wholesale
◦Wholesale GPU was $618 vs. $448 in Q3 20228 and $849 in Q2 2023.
◦Non-GAAP Wholesale GPU was $951 vs. $681 in Q3 2022 and $1,228 in Q2 2023.
6 Consistent with the last three quarters of financial reporting, we are presenting two metrics for total GPU and for each GPU component: GAAP gross profit per unit and non-GAAP gross profit per unit, which excludes the impacts of depreciation and amortization, share-based compensation, Root warrant revenue, and restructuring costs. For additional information, please see our Q3 2023 supplemental financial tables.
7 For additional details on non-recurring items, please see the Appendix I.
8 Wholesale gross profit and wholesale GPU includes gross profit from the sale of wholesale marketplace vehicles at our acquired ADESA locations.
◦Wholesale Vehicle
▪Wholesale Vehicle GPU was $347 vs. $321 in Q3 2022 and $509 in Q2 2023.
▪Non-GAAP Wholesale Vehicle GPU was $372 vs. $340 in Q3 2022 and $548 in Q2 2023.
▪Sequential changes in Wholesale Vehicle GPU were primarily driven by higher wholesale market depreciation rates in Q3 compared to Q2 and a lower ratio of wholesale units sold to retail units sold.
▪Year-over-year improvement was primarily driven by a higher ratio of wholesale units sold to retail units sold and lower inbound transport costs.
◦Wholesale Marketplace
▪Wholesale Marketplace GPU was $271 vs. $127 in Q3 2022 and $340 in Q2 2023.
▪Non-GAAP Wholesale Marketplace GPU was $579 vs. $341 in Q3 2022 and $680 in Q2 2023.
▪Sequential changes in Wholesale Marketplace GPU were primarily driven by seasonally lower volume, while year-over-year changes were primarily driven by higher volume in Q3 2023 compared to Q3 2022.
•Other
◦Other GPU was $2,642 vs. $1,921 in Q3 2022 and $3,005 in Q2 2023.
◦Non-GAAP Other GPU was $2,568 vs. $1,921 in Q3 2022 and $2,940 in Q2 2023.
◦Sequential changes in Other GPU were impacted by the volume of loans held and sold in Q2 and Q3. We estimate that a higher-than-normalized volume of loans held and sold increased Other GPU by ~$650 in Q2 and ~$400 in Q3, other things being equal. Aside from these impacts, Other GPU in Q3 was primarily impacted by lower origination interest rates relative to benchmark interest rates, partially offset by lower credit spreads.
◦Year-over-year improvement was primarily driven by the higher volume of loans held and sold relative to retail units sold volume in Q3 2023 as well as higher finance penetration rates and higher origination interest rates relative to benchmark interest rates, partially offset by wider market credit spreads.
◦For additional details on our finance platform strategy in FY 2024, please see Appendix II.
Objective #3: Demonstrate Operating Leverage
On a sequential basis, Q3 2023 net income margin and Adjusted EBITDA margin improved by 30.2% and 0.1%, respectively. On a year-over-year basis Q3 2023 net loss margin and Adjusted EBITDA margin improved by 41.7% and 10.8%, respectively, each driven by our company-wide focus on improving profitability and reducing SG&A expenses as described throughout this letter and net income margin benefitting from gains on debt extinguishment as a result of our corporate debt exchange.
For Q3 2023, as a percentage of revenue:
•Several components of SG&A increased sequentially. Total SG&A increased by 0.4% and non-advertising SG&A increased by 0.3%. Compensation and benefits increased by 0.3%, advertising and logistics both increased by 0.1%, and market occupancy and other SG&A were both flat.
•Year-over-year, all components of SG&A improved. Total SG&A decreased by 3.8% and non-advertising SG&A decreased by 2.3%. Compensation and benefits decreased 0.8%, advertising decreased by 1.5%, logistics and market occupancy decreased by 0.8%, and other SG&A decreased by 0.8%.
For additional details on SG&A leverage please see our discussion earlier in this letter.
Summary
We are proud of the results we posted this quarter. Thinking back to just one year ago, this speed would have been very difficult for most to imagine. The progress has been made because of the incredible work of our incredible team.
And that team remains hard at work today. While our current focus remains on step 2 of our plan, the people inside of Carvana know that is not the end goal. The end goal is to sell millions of cars and to become the largest and most profitable automotive retailer. Based on the progress outlined here, we believe we are well on our way.
The march continues,
Ernie Garcia, III, Chairman and CEO Our Total GPU in Q3 2023 was primarily driven by substantial fundamental improvements in the operations of the business.
Mark Jenkins, CFO
Appendix I: Additional Details on GPU
These fundamental improvements have been particularly impactful on Retail GPU, with Q3 results delivering fundamental gains consistent with our expected range of $600-1,100 of gains compared to our FY 2021 baseline of ~$1,600 GAAP and ~$1,700 Non-GAAP Retail GPU. Non-recurring factors are also noted below.
(1) Non-Recurring Factors Impacting Q3
1.Higher-than-normalized volume of loans held and sold. In Q4 2022 and Q1 2023, we sold a lower volume of loans than we originated. This led to an increase in loans held for sale on our balance sheet at the end of Q1 and Q2. In Q3, we sold more loan principal than we originated, reducing our loans held for sale balance from $1.1 billion at the end of Q2 to $0.7 billion at the end of Q3. We estimate that selling and holding a higher-than-normalized volume of loans increased Other GPU by ~$400, other things being equal.
2.Small inventory allowance adjustment. Retail and Wholesale GPU benefitted from a combined ~$100 per retail unit inventory allowance adjustment in Q3, split ~70/30 between retail and wholesale inventory. We expect the impact of our inventory allowance to be even smaller in the upcoming quarters and do not expect it to be a noteworthy driver of subsequent results.
(2) Long-Term Fundamental Gains Impacting Q3
3.Return to normalized inventory size. Over the last several quarters we made significant progress towards right-sizing inventory relative to sales volumes. Our average days to sale for retail units sold in Q3 was 66 days, near the more-favorable end of our 65-75 day outlook range. We believe that our inventory is now in an appropriately sized range to support current sales volumes and expect average days to sale on retail units sold in Q4 to be in the low-to-mid 60s.
4.Higher than FY 2021 customer sourcing rate. We have enhanced our offering of buying cars from customers and sourced ~85% of retail units sold from customers in YTD 2023 compared to 73% in FY 2021.
5.Higher than FY 2021 revenue from additional services. Our first-party logistics network has allowed us to generate ~$300 of additional revenue per retail unit sold in YTD 2023 compared to FY 2021, while maintaining industry-leading free shipping selection in most of our markets.
6.Lower than FY 2021 reconditioning and inbound transport costs. Since early 2022, our inventory and fulfillment teams have been focused on driving operating efficiencies, and these efforts are flowing through to our results. Total reconditioning and inbound transport costs (excluding depreciation and amortization, shared-based compensation, and restructuring expenses) on retail units sold in Q3 were $434 per unit lower than in FY 2021, better than the favorable end of our $300-400 outlook range.
7.Higher than FY 2021 wholesale marketplace gross profit. In May 2022, we acquired ADESA U.S., the second largest U.S. wholesale used vehicle auction marketplace. ADESA’s wholesale marketplace generated $271 GAAP and $579 Non-GAAP Wholesale GPU in Q3 2023, a long-term addition to Total GPU.
We believe these significant fundamental gains allow us to maintain a meaningfully higher Total GPU than FY 2021 on a long-term basis.
Appendix II: FY 2024 Capital Allocation
The second and third quarters of 2023 have significantly changed the financial profile of our business and our outlook for future cash generation. In particular:
1.Over the last two quarters, we generated more than $600 million of net income and $300 million of Adjusted EBITDA, and we expect positive Adjusted EBITDA again in Q4.9 We also expect to generate significant positive Adjusted EBITDA in FY 2024.9
2.We have relatively limited capital expenditure requirements given the significant excess capacity in our IRC, auction, and logistics network. As a result, our capital expenditure budget for FY 2024 is only ~$100 million, similar to FY 2023.
The combination of these positive developments means we are now in a strong position to allocate capital toward increasing total profitability and long-term cash flow. To this end, in FY 2024 we plan to take a more flexible approach to retaining vs. selling the residual certificates of our auto loan securitizations. For example, we may retain additional residual certificates at the time of securitization and then sell them after 3 to 12 months, while maintaining the ability to choose the most efficient strategy for each quarter.
Through the first three quarters of 2023, we have sold ~$160 million of residual certificates in seven securitizations at a blended investor yield that we estimate to be over 20%. This yield equates to an incremental finance profit (without discounting) per securitized loan above and beyond our current Other GPU on the order of $1,000. Historically, this yield has accrued to external residual certificate investors.
We believe this strategy lowers the effective cost of funds in our finance platform, allowing us to increase profitability or make lower rates available to customers over time, ultimately leading to a larger and more profitable business.
9 In order to clearly demonstrate our progress and highlight the most meaningful drivers within our business, we continue to use forecasted Non-GAAP financial measures such as Adjusted EBITDA as we look toward Q4 2023 and beyond. We have not provided a quantitative reconciliation of forecasted GAAP measures to forecasted Non-GAAP measures within this communication because we are unable, without making unreasonable efforts, to calculate one-time or restructuring expenses. These items could materially affect the computation of forward-looking GAAP Net Income.
Appendix III
Conference Call Details
Carvana will host a conference call today, November 2, 2023, at 5:30 p.m. EST (2:30 p.m. PST) to discuss financial results. To participate in the live call, analysts and investors should dial (833) 255-2830 or (412) 902-6715. A live audio webcast of the conference call along with supplemental financial information will also be accessible on the company's website at investors.carvana.com. Following the webcast, an archived version will also be available on the Investor Relations section of the company’s website. A telephonic replay of the conference call will be available until Thursday, November 9, 2023, by dialing (877) 344-7529 or (412) 317-0088 and entering passcode 2688992#.
Forward Looking Statements
This letter contains forward-looking statements within the meaning of the Private Securities Litigation Reform Act of 1995. These forward-looking statements reflect Carvana’s current expectations and projections with respect to, among other things, its financial condition, results of operations, plans, objectives, strategy, future performance, and business. These statements may be preceded by, followed by or include the words "aim," "anticipate," "believe," "estimate," "expect," "forecast," "intend," "likely," "outlook," "plan," "potential," "project," "projection," "seek," "can," "could," "may," "should," "would," "will," the negatives thereof and other words and terms of similar meaning.
Forward-looking statements include all statements that are not historical facts, including expectations regarding our operational and efficiency initiatives, our strategy, expected gross profit per unit, forecasted results, and expectations regarding the effect of Carvana’s actions to improve performance. Such forward-looking statements are subject to various risks and uncertainties. Accordingly, there are or will be important factors that could cause actual outcomes or results to differ materially from those indicated in these statements. Among these factors are risks related to: the impact on our business from the larger automotive ecosystem and macroeconomic conditions, including consumer demand, global supply chain challenges, heightened inflation and rising interest rates; our ability to raise additional capital, the quality of the financial markets, and our substantial indebtedness; our history of losses and ability to achieve or maintain profitability in the future; our ability to sell loans into the market; the seasonal and other fluctuations in our quarterly operating results; our ability to compete in the highly competitive industry in which we participate; the changes in prices of new and used vehicles; our ability to sell our inventory expeditiously; and the other risks identified under the “Risk Factors” section in our Annual Report on Form 10-K for 2022 and Quarterly Reports on Form 10-Q for the second and third quarters of 2023.
There is no assurance that any forward-looking statements will materialize. You are cautioned not to place undue reliance on forward-looking statements, which reflect expectations only as of this date. Carvana does not undertake any obligation to publicly update or review any forward-looking statement, whether as a result of new information, future developments, or otherwise.
Use of Non-GAAP Financial Measures
As appropriate, we supplement our results of operations determined in accordance with U.S. generally accepted accounting principles (“GAAP”) with certain non-GAAP financial measurements that are used by management, and which we believe are useful to investors, as supplemental operational measurements to evaluate our financial performance. These measurements should not be considered in isolation or as a substitute for reported GAAP results because they may include or exclude certain items as compared to similar GAAP-based measurements, and such measurements may not be comparable to similarly-titled measurements reported by other companies. Rather, these measurements should be considered as an additional way of viewing aspects of our operations that provide a more complete understanding of our business. We strongly encourage investors to review our consolidated financial statements included in publicly filed reports in their entirety and not rely solely on any one, single financial measurement or communication.
Reconciliations of our non-GAAP measurements to their most directly comparable GAAP-based financial measurements are included at the end of this letter.
Investor Relations Contact Information: Mike Mckeever, investors@carvana.com
CARVANA CO. AND SUBSIDIARIES
CONDENSED CONSOLIDATED BALANCE SHEETS
(Unaudited)
(In millions, except number of shares, which are reflected in thousands, and par values)
|
|
|
|
|
|
|
|
|
|
|
|
|
September 30, 2023 |
|
December 31, 2022 |
| ASSETS |
|
|
|
| Current assets: |
|
|
|
| Cash and cash equivalents |
$ |
544 |
|
|
$ |
434 |
|
| Restricted cash |
72 |
|
|
194 |
|
| Accounts receivable, net |
318 |
|
|
253 |
|
| Finance receivables held for sale, net |
650 |
|
|
1,334 |
|
|
|
|
|
|
|
|
|
| Vehicle inventory |
1,085 |
|
|
1,876 |
|
| Beneficial interests in securitizations |
371 |
|
|
321 |
|
Other current assets, including $0 and $6, respectively, due from related parties |
146 |
|
|
182 |
|
| Total current assets |
3,186 |
|
|
4,594 |
|
| Property and equipment, net |
3,051 |
|
|
3,244 |
|
Operating lease right-of-use assets, including $11 and $14, respectively, from leases with related parties |
473 |
|
|
536 |
|
| Intangible assets, net |
56 |
|
|
70 |
|
|
|
|
|
Other assets, including $0 and $1, respectively, due from related parties |
259 |
|
|
254 |
|
| Total assets |
$ |
7,025 |
|
|
$ |
8,698 |
|
| LIABILITIES & STOCKHOLDERS' DEFICIT |
|
|
|
| Current liabilities: |
|
|
|
Accounts payable and accrued liabilities, including $1 and $16, respectively, due to related parties |
$ |
681 |
|
|
$ |
777 |
|
| Short-term revolving facilities |
429 |
|
|
1,534 |
|
| Current portion of long-term debt |
200 |
|
|
201 |
|
Other current liabilities, including $3 and $4, respectively, from leases with related parties |
85 |
|
|
80 |
|
| Total current liabilities |
1,395 |
|
|
2,592 |
|
| Long-term debt, excluding current portion |
5,305 |
|
|
6,574 |
|
|
|
|
|
Operating lease liabilities, excluding current portion, including $7 and $9, respectively, from leases with related parties |
450 |
|
|
507 |
|
Other liabilities, including $11 and $0, respectively, due to related parties |
77 |
|
|
78 |
|
| Total liabilities |
7,227 |
|
|
9,751 |
|
| Commitments and contingencies |
|
|
|
|
|
|
|
| Stockholders' deficit: |
|
|
|
|
|
|
|
|
|
|
|
Preferred stock, $0.01 par value - 50,000 shares authorized; none issued and outstanding as of September 30, 2023 and December 31, 2022 |
— |
|
|
— |
|
Class A common stock, $0.001 par value - 500,000 shares authorized; 113,975 and 106,037 shares issued and outstanding as of September 30, 2023 and December 31, 2022, respectively |
— |
|
|
— |
|
Class B common stock, $0.001 par value - 125,000 shares authorized; 85,619 and 82,900 shares issued and outstanding as of September 30, 2023 and December 31, 2022, respectively |
— |
|
|
— |
|
| Additional paid-in capital |
1,851 |
|
|
1,558 |
|
|
|
|
|
| Accumulated deficit |
(1,512) |
|
|
(2,076) |
|
| Total stockholders' equity (deficit) attributable to Carvana Co. |
339 |
|
|
(518) |
|
| Non-controlling interests |
(541) |
|
|
(535) |
|
| Total stockholders' deficit |
(202) |
|
|
(1,053) |
|
| Total liabilities & stockholders' deficit |
$ |
7,025 |
|
|
$ |
8,698 |
|
CARVANA CO. AND SUBSIDIARIES
CONDENSED CONSOLIDATED STATEMENTS OF OPERATIONS
(Unaudited)
(In millions, except number of shares, which are reflected in thousands, and per share amounts)
|
|
|
|
|
|
|
|
|
|
|
|
|
|
|
|
|
|
|
|
|
|
|
|
|
Three Months Ended September 30, |
|
Nine Months Ended September 30, |
|
2023 |
|
2022 |
|
2023 |
|
2022 |
| Sales and operating revenues: |
|
|
|
|
|
|
|
| Retail vehicle sales, net |
$ |
1,949 |
|
|
$ |
2,492 |
|
|
$ |
5,737 |
|
|
$ |
8,186 |
|
Wholesale sales and revenues, including $4, $6, $14 and $27, respectively, from related parties |
610 |
|
|
697 |
|
|
2,005 |
|
|
1,976 |
|
Other sales and revenues, including $35, $39, $104 and $137, respectively, from related parties |
214 |
|
|
197 |
|
|
605 |
|
|
605 |
|
|
|
|
|
|
|
|
|
| Net sales and operating revenues |
2,773 |
|
|
3,386 |
|
|
8,347 |
|
|
10,767 |
|
Cost of sales, including $1, $2, $3 and $20, respectively, to related parties |
2,291 |
|
|
3,027 |
|
|
7,025 |
|
|
9,714 |
|
| Gross profit |
482 |
|
|
359 |
|
|
1,322 |
|
|
1,053 |
|
Selling, general and administrative expenses, including $8, $7, $26 and $20, respectively, to related parties |
433 |
|
|
656 |
|
|
1,357 |
|
|
2,104 |
|
|
|
|
|
|
|
|
|
| Interest expense |
153 |
|
|
153 |
|
|
467 |
|
|
333 |
|
| Gain on debt extinguishment |
(878) |
|
|
— |
|
|
(878) |
|
|
— |
|
| Other (income) expense, net |
4 |
|
|
58 |
|
|
(1) |
|
|
68 |
|
| Net income (loss) before income taxes |
770 |
|
|
(508) |
|
|
377 |
|
|
(1,452) |
|
| Income tax provision |
29 |
|
|
— |
|
|
27 |
|
|
1 |
|
| Net income (loss) |
741 |
|
|
(508) |
|
|
350 |
|
|
(1,453) |
|
| Net loss attributable to non-controlling interests |
(41) |
|
|
(225) |
|
|
(214) |
|
|
(672) |
|
| Net income (loss) attributable to Carvana Co. |
$ |
782 |
|
|
$ |
(283) |
|
|
$ |
564 |
|
|
$ |
(781) |
|
|
|
|
|
|
|
|
|
|
|
|
|
|
|
|
|
|
|
|
|
|
|
|
|
|
|
|
|
|
|
|
|
|
|
|
|
|
|
|
|
| Net earnings (loss) per share of Class A common stock - basic |
$ |
7.05 |
|
|
$ |
(2.67) |
|
|
$ |
5.24 |
|
|
$ |
(7.88) |
|
| Net earnings (loss) per share of Class A common stock - diluted |
$ |
3.60 |
|
|
$ |
(2.67) |
|
|
$ |
1.78 |
|
|
$ |
(7.88) |
|
|
|
|
|
|
|
|
|
Weighted-average shares of Class A common stock outstanding - basic (1) |
110,844 |
|
|
105,857 |
|
|
107,692 |
|
|
99,134 |
|
| Weighted-average shares of Class A common stock outstanding - diluted |
205,958 |
|
|
105,857 |
|
|
197,124 |
|
|
99,134 |
|
(1) Weighted-average shares of Class A common stock outstanding - basic, have been adjusted for unvested restricted stock awards.
CARVANA CO. AND SUBSIDIARIES
CONDENSED CONSOLIDATED STATEMENTS OF CASH FLOWS
(Unaudited, In millions)
|
|
|
|
|
|
|
|
|
|
|
|
|
Nine Months Ended September 30, |
|
2023 |
|
2022 |
| Cash Flows from Operating Activities: |
|
|
|
| Net income (loss) |
$ |
350 |
|
|
$ |
(1,453) |
|
| Adjustments to reconcile net income (loss) to net cash provided by (used in) operating activities: |
|
|
|
| Depreciation and amortization expense |
270 |
|
|
179 |
|
| Equity-based compensation expense |
52 |
|
|
57 |
|
| Loss on disposal of property and equipment |
8 |
|
|
3 |
|
| Gain on debt extinguishment |
(878) |
|
|
— |
|
| Payment-in-kind interest expense |
46 |
|
|
— |
|
| Provision for bad debt and valuation allowance |
34 |
|
|
11 |
|
| Amortization and write-off of debt issuance costs and debt premium |
20 |
|
|
20 |
|
| Unrealized (gain) loss on warrants to acquire Root's Class A common stock |
(3) |
|
|
77 |
|
| Unrealized (gain) loss on beneficial interests in securitization |
(12) |
|
|
1 |
|
|
|
|
|
| Changes in finance receivable related assets: |
|
|
|
| Originations of finance receivables |
(4,509) |
|
|
(5,690) |
|
| Proceeds from sale of finance receivables, net |
5,207 |
|
|
5,628 |
|
|
|
|
|
| Gain on loan sales |
(360) |
|
|
(361) |
|
| Principal payments received on finance receivables held for sale |
160 |
|
|
146 |
|
| Other changes in assets and liabilities: |
|
|
|
| Vehicle inventory |
777 |
|
|
638 |
|
| Accounts receivable |
(73) |
|
|
40 |
|
|
|
|
|
| Other assets |
27 |
|
|
(75) |
|
| Accounts payable and accrued liabilities |
(84) |
|
|
155 |
|
| Operating lease right-of-use assets |
63 |
|
|
(132) |
|
|
|
|
|
|
|
|
|
| Operating lease liabilities |
(52) |
|
|
178 |
|
| Other liabilities |
(1) |
|
|
(7) |
|
| Net cash provided by (used in) operating activities |
1,042 |
|
|
(585) |
|
| Cash Flows from Investing Activities: |
|
|
|
|
|
|
|
| Purchases of property and equipment |
(69) |
|
|
(451) |
|
| Proceeds from disposal of property and equipment |
58 |
|
|
— |
|
| Payments for acquisitions, net of cash acquired |
(7) |
|
|
(2,189) |
|
| Principal payments received on and proceeds from sale of beneficial interests |
40 |
|
|
72 |
|
|
|
|
|
| Net cash provided by (used in) investing activities |
22 |
|
|
(2,568) |
|
| Cash Flows from Financing Activities: |
|
|
|
| Proceeds from short-term revolving facilities |
5,756 |
|
|
10,596 |
|
| Payments on short-term revolving facilities |
(6,861) |
|
|
(12,074) |
|
| Proceeds from issuance of long-term debt |
110 |
|
|
3,435 |
|
| Payments on long-term debt |
(470) |
|
|
(111) |
|
| Payments of debt issuance costs |
(52) |
|
|
(75) |
|
| Net proceeds from issuance of Class A common stock and LLC Units |
453 |
|
|
1,227 |
|
| Proceeds from equity-based compensation plans |
— |
|
|
4 |
|
| Tax withholdings related to restricted stock units and awards |
(12) |
|
|
(8) |
|
|
|
|
|
|
|
|
|
|
|
|
|
| Net cash (used in) provided by financing activities |
(1,076) |
|
|
2,994 |
|
| Net decrease in cash, cash equivalents and restricted cash |
(12) |
|
|
(159) |
|
| Cash, cash equivalents and restricted cash at beginning of period |
628 |
|
|
636 |
|
| Cash, cash equivalents and restricted cash at end of period |
$ |
616 |
|
|
$ |
477 |
|
CARVANA CO. AND SUBSIDIARIES
OUTSTANDING SHARES AND LLC UNITS
(Unaudited)
The following table presents potentially dilutive securities, as of the end of the period, excluded from the computations of diluted net earnings (loss) per share of Class A common stock for the three and nine months ended September 30, 2023 and 2022.
|
|
|
|
|
|
|
|
|
|
|
|
|
|
|
|
|
|
|
|
|
|
|
|
|
Three Months Ended September 30, |
|
Nine Months Ended September 30, |
|
2023 |
|
2022 |
|
2023 |
|
2022 |
|
|
|
|
|
|
|
|
|
(in thousands) |
Options (1) |
640 |
|
|
1,265 |
|
|
979 |
|
|
1,265 |
|
Restricted Stock Units and Awards (1) |
650 |
|
|
826 |
|
|
1,822 |
|
|
826 |
|
Class A Units (2) |
— |
|
|
82,963 |
|
|
— |
|
|
82,963 |
|
Class B Units (2) |
— |
|
|
1,580 |
|
|
— |
|
|
1,580 |
|
(1) Represents number of instruments outstanding at the end of the period that were evaluated under the treasury stock method for potentially dilutive effects and were determined to be anti-dilutive.
(2) Represents the weighted-average as-converted LLC units that were evaluated under the if-converted method for potentially dilutive effects and were determined to be anti-dilutive.
CARVANA CO. AND SUBSIDIARIES
RESULTS OF OPERATIONS
(Unaudited)
|
|
|
|
|
|
|
|
|
|
|
|
|
|
|
|
|
|
|
|
|
|
|
|
|
|
|
|
|
|
|
|
|
|
|
|
|
Three Months Ended September 30, |
|
|
|
Nine Months Ended September 30, |
|
|
|
2023 |
|
2022 |
|
Change |
|
2023 |
|
2022 |
|
Change |
|
|
|
|
|
|
|
|
|
|
|
|
|
(in millions, except unit and per unit amounts) |
|
|
|
(in millions, except unit and per unit amounts) |
|
|
| Net sales and operating revenues: |
|
|
|
|
|
|
|
|
|
|
| Retail vehicle sales, net |
$ |
1,949 |
|
|
$ |
2,492 |
|
|
(21.8) |
% |
|
$ |
5,737 |
|
|
$ |
8,186 |
|
|
(29.9) |
% |
Wholesale sales and revenues (1) |
610 |
|
|
697 |
|
|
(12.5) |
% |
|
2,005 |
|
|
1,976 |
|
|
1.5 |
% |
Other sales and revenues (2) |
214 |
|
|
197 |
|
|
8.6 |
% |
|
605 |
|
|
605 |
|
|
— |
% |
| Total net sales and operating revenues |
$ |
2,773 |
|
|
$ |
3,386 |
|
|
(18.1) |
% |
|
$ |
8,347 |
|
|
$ |
10,767 |
|
|
(22.5) |
% |
| Gross profit: |
|
|
|
|
|
|
|
|
|
|
|
Retail vehicle gross profit (3) |
$ |
218 |
|
|
$ |
116 |
|
|
87.9 |
% |
|
$ |
532 |
|
|
$ |
334 |
|
|
59.3 |
% |
Wholesale gross profit (1) |
50 |
|
|
46 |
|
|
8.7 |
% |
|
185 |
|
|
114 |
|
|
62.3 |
% |
Other gross profit (2) |
214 |
|
|
197 |
|
|
8.6 |
% |
|
605 |
|
|
605 |
|
|
— |
% |
| Total gross profit |
$ |
482 |
|
|
$ |
359 |
|
|
34.3 |
% |
|
$ |
1,322 |
|
|
$ |
1,053 |
|
|
25.5 |
% |
|
|
|
|
|
|
|
|
|
|
|
|
|
|
|
|
|
|
|
|
|
|
|
|
|
|
|
|
|
|
|
|
|
|
|
|
|
|
|
|
|
|
|
|
|
|
|
|
|
|
|
|
|
|
|
|
|
|
|
|
|
|
|
|
|
|
|
|
|
|
|
|
|
|
|
|
|
|
|
|
|
|
|
|
|
|
|
|
|
|
|
|
|
|
|
|
|
|
|
|
|
|
|
|
|
|
|
|
| Unit sales information: |
|
|
|
|
|
|
|
|
|
|
|
| Retail vehicle unit sales |
80,987 |
|
|
102,570 |
|
|
(21.0) |
% |
|
236,757 |
|
|
325,319 |
|
|
(27.2) |
% |
| Wholesale vehicle unit sales |
40,886 |
|
|
47,763 |
|
|
(14.4) |
% |
|
122,449 |
|
|
153,342 |
|
|
(20.1) |
% |
|
|
|
|
|
|
|
|
|
|
|
|
| Per unit selling prices: |
|
|
|
|
|
|
|
|
|
|
|
| Retail vehicles |
24,066 |
|
|
24,296 |
|
|
(0.9) |
% |
|
24,232 |
|
|
25,163 |
|
|
(3.7) |
% |
Wholesale vehicles (4) |
9,612 |
|
|
10,552 |
|
|
(8.9) |
% |
|
11,058 |
|
|
10,923 |
|
|
1.2 |
% |
|
|
|
|
|
|
|
|
|
|
|
|
| Per retail unit gross profit: |
|
|
|
|
|
|
|
|
|
|
|
Retail vehicle gross profit (5) |
$ |
2,692 |
|
|
$ |
1,131 |
|
|
138.0 |
% |
|
$ |
2,247 |
|
|
$ |
1,027 |
|
|
118.8 |
% |
| Wholesale gross profit |
618 |
|
|
448 |
|
|
37.9 |
% |
|
781 |
|
|
350 |
|
|
123.1 |
% |
|
|
|
|
|
|
|
|
|
|
|
|
| Other gross profit |
2,642 |
|
|
1,921 |
|
|
37.5 |
% |
|
2,555 |
|
|
1,860 |
|
|
37.4 |
% |
| Total gross profit |
$ |
5,952 |
|
|
$ |
3,500 |
|
|
70.1 |
% |
|
$ |
5,583 |
|
|
$ |
3,237 |
|
|
72.5 |
% |
| Per wholesale unit gross profit: |
|
|
|
|
|
|
|
|
|
|
|
Wholesale vehicle gross profit (6) |
$ |
685 |
|
|
$ |
691 |
|
|
(0.9) |
% |
|
$ |
906 |
|
|
$ |
626 |
|
|
44.7 |
% |
|
|
|
|
|
|
|
|
|
|
|
|
Wholesale marketplace: |
|
|
|
|
|
|
|
|
|
|
|
| Wholesale marketplace units sold |
221,368 |
|
|
193,061 |
|
14.7% |
|
662,830 |
|
|
304,944 |
|
NM |
| Wholesale marketplace revenues |
$ |
217 |
|
|
$ |
193 |
|
|
12.4% |
|
$ |
651 |
|
|
$ |
301 |
|
|
NM |
Wholesale marketplace gross profit (7) |
$ |
22 |
|
|
$ |
13 |
|
|
69.2% |
|
$ |
74 |
|
|
$ |
18 |
|
|
NM |
|
|
|
|
|
|
|
|
|
|
|
|
|
|
|
|
|
|
|
|
|
|
|
|
|
|
|
|
|
|
|
|
|
|
|
|
|
|
|
|
|
|
|
|
|
|
|
|
|
|
|
|
|
|
|
|
|
|
|
|
(1) Includes $4, $6, $14 and $27, respectively, of wholesale sales and revenues from related parties.
(2) Includes $35, $39, $104 and $137, respectively, of other sales and revenues from related parties.
(3) Includes $0, $2, $0 and $16, respectively, of share-based compensation expense related to the CEO Milestone Gift.
(4) Excludes wholesale marketplace revenues and wholesale marketplace units sold.
(5) Includes $0, $19, $0 and $146, respectively, of share-based compensation expense related to the CEO Milestone Gift.
(6) Excludes wholesale marketplace gross profit and wholesale marketplace units sold.
(7) Includes $25, $22, $77 and $37, respectively, of depreciation and amortization expense.
NM = Not Meaningful (For the nine months ended September 30, 2022 only includes wholesale marketplace data from the date of the ADESA Acquisition of May 9, 2022.)
CARVANA CO. AND SUBSIDIARIES
COMPONENTS OF SG&A
(Unaudited)
|
|
|
|
|
|
|
|
|
|
|
|
|
|
|
|
|
|
|
|
|
|
|
|
|
|
|
|
|
|
|
Three Months Ended |
|
Sep 30, 2022 |
|
Dec 31, 2022 |
|
Mar 31, 2023 |
|
Jun 30, 2023 |
|
Sep 30, 2023 |
|
|
|
|
|
|
|
|
|
|
|
(in millions) |
Compensation and benefits (1) |
$ |
221 |
|
|
$ |
212 |
|
|
$ |
177 |
|
|
$ |
163 |
|
|
$ |
160 |
|
CEO Milestone Gift (2) |
2 |
|
|
— |
|
|
(1) |
|
|
— |
|
|
— |
|
| Advertising |
117 |
|
|
87 |
|
|
56 |
|
|
57 |
|
|
56 |
|
Market occupancy (3) |
23 |
|
|
23 |
|
|
21 |
|
|
18 |
|
|
16 |
|
Logistics (4) |
57 |
|
|
51 |
|
|
35 |
|
|
29 |
|
|
29 |
|
Other (5) |
236 |
|
|
259 |
|
|
184 |
|
|
185 |
|
|
172 |
|
| Total |
$ |
656 |
|
|
$ |
632 |
|
|
$ |
472 |
|
|
$ |
452 |
|
|
$ |
433 |
|
|
|
|
|
|
|
|
|
|
|
|
|
|
|
|
|
|
|
|
|
|
|
|
|
|
|
|
|
|
|
_________________________
(1) Compensation and benefits includes all payroll and related costs, including benefits, payroll taxes, and equity-based compensation, except those related to preparing vehicles for sale, which are included in cost of sales, and those related to the development of software products for internal use, which are capitalized to software and depreciated over the estimated useful lives of the related assets.
(2) CEO Milestone Gift includes all equity-based compensation and payroll tax costs associated with the Gift, except those Gift costs related to preparing vehicles for sale, which are included in cost of sales.
(3) Market occupancy costs includes occupancy costs of our vending machine and hubs. It excludes occupancy costs related to reconditioning vehicles which are included in cost of sales and the portion related to corporate occupancy which are included in other costs.
(4) Logistics includes fuel, maintenance and depreciation related to operating our own transportation fleet, and third-party transportation fees, except the portion related to inbound transportation, which is included in cost of sales.
(5) Other costs include all other selling, general and administrative expenses such as IT expenses, corporate occupancy, professional services and insurance, limited warranty, and title and registration.
CARVANA CO. AND SUBSIDIARIES
LIQUIDITY RESOURCES
(Unaudited)
We had the following committed liquidity resources as well as pledging and other basket capacity available as of September 30, 2023 and December 31, 2022:
|
|
|
|
|
|
|
|
|
|
|
|
|
September 30,
2023 |
|
December 31,
2022 |
|
|
|
|
|
(in millions) |
| Cash and cash equivalents |
$ |
544 |
|
|
$ |
434 |
|
Availability under short-term revolving facilities (1) |
1,043 |
|
|
1,314 |
|
|
|
|
|
| Committed liquidity resources available |
$ |
1,587 |
|
|
$ |
1,748 |
|
|
|
|
|
Unpledged real estate not included above (2) |
— |
|
|
1,971 |
|
Super senior debt capacity (3) |
1,262 |
|
|
— |
|
Pari passu senior debt capacity (3) |
250 |
|
|
— |
|
Unpledged beneficial interests in securitizations (4) |
83 |
|
|
69 |
|
Total liquidity resources (5) |
$ |
3,182 |
|
|
$ |
3,788 |
|
1.Availability under short-term revolving facilities is the available amount we can borrow under our existing vehicle inventory floor plan and finance receivable facilities based on the pledgeable value of vehicle inventory and finance receivables on our balance sheet on the period end date. Availability under short-term revolving facilities is distinct from the total commitment amount of these facilities because it represents the currently borrowable amount, rather than committed future amounts that could be borrowed to finance future additional assets. Effective November 1, 2023, we amended our vehicle inventory Floor Plan Facility to resize the line of credit to $1.5 billion through April 30, 2025.
2.Unpledged real estate assets include real estate acquired as part of the ADESA Acquisition, and IRC, vending machine, and hub real estate assets that have not been sold and are not pledged on the period end date. Since our first sale-leaseback transaction in 2017, we have historically had flexible access to real estate financing and may continue to use various forms of real estate financing in the future, subject to the indentures governing the Senior Secured Notes. As of September 30, 2023, substantially all real estate was pledged as security for the Senior Secured Notes.
3.Super senior debt capacity and pari passu senior debt capacity represents basket capacity to incur additional debt that could be senior or pari passu in lien priority as to the collateral securing the obligations under the Senior Secured Notes, subject to the terms and conditions set forth in the indentures governing the Senior Secured Notes. The availability of such additional sources depends on many factors and there can be no assurance that financing alternatives will be available to us in the future.
4.Unpledged beneficial interests in securitizations includes retained beneficial interests in securitizations that have not been previously pledged or sold. We historically have financed the majority of our retained beneficial interests in securitizations and expect to continue to do so in the future.
5.Our total liquidity resources are composed of cash and cash equivalents, availability under existing credit facilities, additional unpledged assets, including real estate and securities, on our balance sheet that can be financed using traditional asset-based financing sources, and additional capacity under the indentures governing our Senior Secured Notes, which allow us to incur additional debt that can be senior or pari passu in lien priority as to the collateral securing the obligations under the Senior Secured Notes.
CARVANA CO. AND SUBSIDIARIES
RECONCILIATION OF GAAP TO NON-GAAP FINANCIAL MEASURES (continued)
(Unaudited)
Adjusted EBITDA; Adjusted EBITDA margin; Gross profit, non-GAAP; Total gross profit per retail unit, non-GAAP; SG&A, non-GAAP; and Total SG&A per retail unit, non-GAAP
Adjusted EBITDA; Adjusted EBITDA margin; Gross profit, non-GAAP; Total gross profit per retail unit, non-GAAP; SG&A, non-GAAP; and Total SG&A per retail unit, non-GAAP are supplemental measures of operating performance that do not represent and should not be considered an alternative to net income (loss), gross profit, or SG&A, as determined by U.S. GAAP.
Adjusted EBITDA is defined as net income (loss) plus income tax provision, interest expense, other (income) expense, net, depreciation and amortization in cost of sales and SG&A, goodwill impairment, share-based compensation including the CEO Milestone Gift in cost of sales and SG&A, and restructuring costs, minus revenue related to our Warrants and gain on debt extinguishment. Following the ADESA Acquisition, we are also excluding depreciation and amortization in cost of sales, which was historically only a small component of cost of sales. Adjusted EBITDA margin is Adjusted EBITDA as a percentage of total revenues.
Gross profit, non-GAAP is defined as GAAP gross profit plus depreciation and amortization in cost of sales, share-based compensation including the CEO Milestone Gift in cost of sales, and restructuring costs, minus revenue related to our Warrants. Total gross profit per retail unit, non-GAAP is Gross profit, non-GAAP divided by retail vehicle unit sales.
SG&A, non-GAAP is defined as GAAP SG&A minus depreciation and amortization in SG&A, share-based compensation including the CEO Milestone Gift in SG&A, and restructuring costs. Total SG&A per retail unit, non-GAAP is SG&A, non-GAAP divided by retail vehicle unit sales.
We use these non-GAAP measures to measure the operating performance of our business as a whole and relative to our total revenues and retail vehicle unit sales. We believe that these metrics are useful measures to us and to our investors because they exclude certain financial, capital structure, and non-cash items that we do not believe directly reflect our core operations and may not be indicative of our recurring operations, in part because they may vary widely across time and within our industry independent of the performance of our core operations. We believe that excluding these items enables us to more effectively evaluate our performance period-over-period and relative to our competitors. Adjusted EBITDA; Adjusted EBITDA margin; Gross profit, non-GAAP; Total gross profit per retail unit, non-GAAP; SG&A, non-GAAP; and Total SG&A per retail unit, non-GAAP may not be comparable to similarly titled measures provided by other companies due to potential differences in methods of calculations.
A reconciliation of Adjusted EBITDA to net income (loss), Gross profit, non-GAAP to gross profit, and SG&A, non-GAAP to SG&A, which are the most directly comparable U.S. GAAP measures, and calculations of Adjusted EBITDA margin, Total gross profit per retail unit, non-GAAP, and Total SG&A per retail unit, non-GAAP is as follows:
|
|
|
|
|
|
|
|
|
|
|
|
|
|
|
|
|
|
|
|
|
|
|
|
|
|
|
|
|
|
|
|
|
|
|
|
|
|
|
|
|
For the Three Months Ended |
| (dollars in millions, except per unit amounts) |
|
|
|
|
|
Sep 30, 2022 |
|
Dec 31, 2022 |
|
Mar 31, 2023 |
|
Jun 30, 2023 |
|
Sep 30, 2023 |
| Net income (loss) |
|
|
|
|
|
$ |
(508) |
|
|
$ |
(1,441) |
|
|
$ |
(286) |
|
|
$ |
(105) |
|
|
$ |
741 |
|
| Income tax (benefit) provision |
|
|
|
|
|
— |
|
|
— |
|
|
(2) |
|
|
— |
|
|
29 |
|
| Interest expense |
|
|
|
|
|
153 |
|
|
153 |
|
|
159 |
|
|
155 |
|
|
153 |
|
| Other (income) expense, net |
|
|
|
|
|
58 |
|
|
2 |
|
|
(2) |
|
|
(3) |
|
|
4 |
|
| Depreciation and amortization expense in cost of sales |
|
|
|
|
|
36 |
|
|
43 |
|
|
44 |
|
|
44 |
|
|
42 |
|
| Depreciation and amortization expense in SG&A |
|
|
|
|
|
57 |
|
|
57 |
|
|
49 |
|
|
46 |
|
|
45 |
|
| Share-based compensation expense in cost of sales |
|
|
|
|
|
2 |
|
|
— |
|
|
— |
|
|
— |
|
|
— |
|
| Share-based compensation expense in SG&A |
|
|
|
|
|
16 |
|
|
12 |
|
|
15 |
|
|
20 |
|
|
18 |
|
| Root warrant revenue |
|
|
|
|
|
— |
|
|
(7) |
|
|
(5) |
|
|
(5) |
|
|
(6) |
|
| Goodwill impairment |
|
|
|
|
|
— |
|
|
847 |
|
|
— |
|
|
— |
|
|
— |
|
| Gain on debt extinguishment |
|
|
|
|
|
— |
|
|
— |
|
|
— |
|
|
— |
|
|
(878) |
|
Restructuring (1) |
|
|
|
|
|
— |
|
|
43 |
|
|
4 |
|
|
3 |
|
|
— |
|
| Adjusted EBITDA |
|
|
|
|
|
$ |
(186) |
|
|
$ |
(291) |
|
|
$ |
(24) |
|
|
$ |
155 |
|
|
$ |
148 |
|
|
|
|
|
|
|
|
|
|
|
|
|
|
|
|
| Total revenues |
|
|
|
|
|
$ |
3,386 |
|
|
$ |
2,837 |
|
|
$ |
2,606 |
|
|
$ |
2,968 |
|
|
$ |
2,773 |
|
| Net income (loss) margin |
|
|
|
|
|
(15.0) |
% |
|
(50.8) |
% |
|
(11.0) |
% |
|
(3.5) |
% |
|
26.7 |
% |
| Adjusted EBITDA margin |
|
|
|
|
|
(5.5) |
% |
|
(10.3) |
% |
|
(0.9) |
% |
|
5.2 |
% |
|
5.3 |
% |
|
|
|
|
|
|
|
|
|
|
|
|
|
|
|
| Gross profit |
|
|
|
|
|
$ |
359 |
|
|
$ |
193 |
|
|
$ |
341 |
|
|
$ |
499 |
|
|
$ |
482 |
|
| Depreciation and amortization expense in cost of sales |
|
|
|
|
|
36 |
|
|
43 |
|
|
44 |
|
|
44 |
|
|
42 |
|
| Share-based compensation expense in cost of sales |
|
|
|
|
|
2 |
|
|
— |
|
|
— |
|
|
— |
|
|
— |
|
| Root warrant revenue |
|
|
|
|
|
— |
|
|
(7) |
|
|
(5) |
|
|
(5) |
|
|
(6) |
|
Restructuring (1) |
|
|
|
|
|
— |
|
|
3 |
|
|
— |
|
|
— |
|
|
— |
|
| Gross profit, non-GAAP |
|
|
|
|
|
$ |
397 |
|
|
$ |
232 |
|
|
$ |
380 |
|
|
$ |
538 |
|
|
$ |
518 |
|
|
|
|
|
|
|
|
|
|
|
|
|
|
|
|
| Retail vehicle unit sales |
|
|
|
|
|
102,570 |
|
|
86,977 |
|
|
79,240 |
|
|
76,530 |
|
|
80,987 |
|
| Total gross profit per retail unit |
|
|
|
|
|
$ |
3,500 |
|
|
$ |
2,219 |
|
|
$ |
4,303 |
|
|
$ |
6,520 |
|
|
$ |
5,952 |
|
| Total gross profit per retail unit, non-GAAP |
|
|
|
|
|
$ |
3,870 |
|
|
$ |
2,667 |
|
|
$ |
4,796 |
|
|
$ |
7,030 |
|
|
$ |
6,396 |
|
|
|
|
|
|
|
|
|
|
|
|
|
|
|
|
| SG&A |
|
|
|
|
|
$ |
656 |
|
|
$ |
632 |
|
|
$ |
472 |
|
|
$ |
452 |
|
|
$ |
433 |
|
| Depreciation and amortization expense in SG&A |
|
|
|
|
|
57 |
|
|
57 |
|
|
49 |
|
|
46 |
|
|
45 |
|
| Share-based compensation expense in SG&A |
|
|
|
|
|
16 |
|
|
12 |
|
|
15 |
|
|
20 |
|
|
18 |
|
Restructuring (1) |
|
|
|
|
|
— |
|
|
40 |
|
|
4 |
|
|
3 |
|
|
— |
|
| SG&A, non-GAAP |
|
|
|
|
|
$ |
583 |
|
|
$ |
523 |
|
|
$ |
404 |
|
|
$ |
383 |
|
|
$ |
370 |
|
|
|
|
|
|
|
|
|
|
|
|
|
|
|
|
| Retail vehicle unit sales |
|
|
|
|
|
102,570 |
|
|
86,977 |
|
|
79,240 |
|
|
76,530 |
|
|
80,987 |
|
| Total SG&A per retail unit |
|
|
|
|
|
$ |
6,396 |
|
|
$ |
7,266 |
|
|
$ |
5,957 |
|
|
$ |
5,906 |
|
|
$ |
5,347 |
|
| Total SG&A per retail unit, non-GAAP |
|
|
|
|
|
$ |
5,684 |
|
|
$ |
6,013 |
|
|
$ |
5,098 |
|
|
$ |
5,005 |
|
|
$ |
4,569 |
|
(1) Restructuring includes costs related to our November 2022 reduction in force, as well as lease termination and other restructuring expenses.
|
|
|
|
|
|
|
|
|
|
|
|
|
|
|
|
|
|
|
|
|
|
|
|
|
|
|
|
|
|
|
|
|
|
|
|
|
|
|
|
|
|
|
|
|
|
|
|
|
|
|
|
|
|
|
|
|
|
|
For the Year Ended |
|
For the Three Months Ended |
| (dollars in millions, except per unit amounts) |
|
|
|
|
|
Dec 31, 2021 |
|
Mar 31, 2022 |
|
Jun 30, 2022 |
|
Sep 30, 2022 |
|
Dec 31, 2022 |
|
Mar 31, 2023 |
|
Jun 30, 2023 |
|
Sep 30, 2023 |
| Retail gross profit |
|
|
|
|
|
$ |
697 |
|
|
$ |
85 |
|
|
$ |
133 |
|
|
$ |
116 |
|
|
$ |
37 |
|
|
$ |
110 |
|
|
$ |
204 |
|
|
$ |
218 |
|
| Depreciation and amortization expense in cost of sales |
|
|
|
|
|
20 |
|
|
7 |
|
|
11 |
|
|
12 |
|
|
15 |
|
|
16 |
|
|
15 |
|
|
15 |
|
| Share-based compensation expense in cost of sales |
|
|
|
|
|
— |
|
|
8 |
|
|
6 |
|
|
2 |
|
|
— |
|
|
— |
|
|
— |
|
|
— |
|
Restructuring (1) |
|
|
|
|
|
— |
|
|
— |
|
|
4 |
|
|
— |
|
|
3 |
|
|
— |
|
|
— |
|
|
— |
|
| Retail gross profit, non-GAAP |
|
|
|
|
|
$ |
717 |
|
|
$ |
100 |
|
|
$ |
154 |
|
|
$ |
130 |
|
|
$ |
55 |
|
|
$ |
126 |
|
|
$ |
219 |
|
|
$ |
233 |
|
|
|
|
|
|
|
|
|
|
|
|
|
|
|
|
|
|
|
|
|
|
| Retail vehicle unit sales |
|
|
|
|
|
425,237 |
|
|
105,185 |
|
|
117,564 |
|
|
102,570 |
|
|
86,977 |
|
|
79,240 |
|
|
76,530 |
|
|
80,987 |
|
| Retail gross profit per retail unit |
|
|
|
|
|
$ |
1,639 |
|
|
$ |
808 |
|
|
$ |
1,131 |
|
|
$ |
1,131 |
|
|
$ |
425 |
|
|
$ |
1,388 |
|
|
$ |
2,666 |
|
|
$ |
2,692 |
|
| Retail gross profit per retail unit, non-GAAP |
|
|
|
|
|
$ |
1,686 |
|
|
$ |
950 |
|
|
$ |
1,309 |
|
|
$ |
1,268 |
|
|
$ |
632 |
|
|
$ |
1,591 |
|
|
$ |
2,862 |
|
|
$ |
2,877 |
|
|
|
|
|
|
|
|
|
|
|
|
|
|
|
|
|
|
|
|
|
|
| Wholesale vehicle gross profit |
|
|
|
|
|
$ |
189 |
|
|
$ |
23 |
|
|
$ |
40 |
|
|
$ |
33 |
|
|
$ |
16 |
|
|
$ |
44 |
|
|
$ |
39 |
|
|
$ |
28 |
|
| Depreciation and amortization expense in cost of sales |
|
|
|
|
|
4 |
|
|
1 |
|
|
1 |
|
|
2 |
|
|
3 |
|
|
2 |
|
|
3 |
|
|
2 |
|
| Wholesale vehicle gross profit, non-GAAP |
|
|
|
|
|
$ |
193 |
|
|
$ |
24 |
|
|
$ |
41 |
|
|
$ |
35 |
|
|
$ |
19 |
|
|
$ |
46 |
|
|
$ |
42 |
|
|
$ |
30 |
|
|
|
|
|
|
|
|
|
|
|
|
|
|
|
|
|
|
|
|
|
|
| Retail vehicle unit sales |
|
|
|
|
|
425,237 |
|
|
105,185 |
|
|
117,564 |
|
|
102,570 |
|
|
86,977 |
|
|
79,240 |
|
|
76,530 |
|
|
80,987 |
|
| Wholesale vehicle gross profit per retail unit |
|
|
|
|
|
$ |
445 |
|
|
$ |
219 |
|
|
$ |
340 |
|
|
$ |
321 |
|
|
$ |
184 |
|
|
$ |
555 |
|
|
$ |
509 |
|
|
$ |
347 |
|
| Wholesale vehicle gross profit per retail unit, non-GAAP |
|
|
|
|
|
$ |
454 |
|
|
$ |
229 |
|
|
$ |
349 |
|
|
$ |
340 |
|
|
$ |
218 |
|
|
$ |
580 |
|
|
$ |
548 |
|
|
$ |
372 |
|
|
|
|
|
|
|
|
|
|
|
|
|
|
|
|
|
|
|
|
|
|
| Wholesale marketplace gross profit |
|
|
|
|
|
$ |
— |
|
|
$ |
— |
|
|
$ |
5 |
|
|
$ |
13 |
|
|
$ |
4 |
|
|
$ |
26 |
|
|
$ |
26 |
|
|
$ |
22 |
|
| Depreciation and amortization expense in cost of sales |
|
|
|
|
|
— |
|
|
— |
|
|
15 |
|
|
22 |
|
|
25 |
|
|
26 |
|
|
26 |
|
|
25 |
|
| Wholesale marketplace gross profit, non-GAAP |
|
|
|
|
|
$ |
— |
|
|
$ |
— |
|
|
$ |
20 |
|
|
$ |
35 |
|
|
$ |
29 |
|
|
$ |
52 |
|
|
$ |
52 |
|
|
$ |
47 |
|
|
|
|
|
|
|
|
|
|
|
|
|
|
|
|
|
|
|
|
|
|
| Retail vehicle unit sales |
|
|
|
|
|
425,237 |
|
|
105,185 |
|
|
117,564 |
|
|
102,570 |
|
|
86,977 |
|
|
79,240 |
|
|
76,530 |
|
|
80,987 |
|
| Wholesale marketplace gross profit per retail unit |
|
|
|
|
|
$ |
— |
|
|
$ |
— |
|
|
$ |
43 |
|
|
$ |
127 |
|
|
$ |
46 |
|
|
$ |
328 |
|
|
$ |
340 |
|
|
$ |
271 |
|
| Wholesale marketplace gross profit per retail unit, non-GAAP |
|
|
|
|
|
$ |
— |
|
|
$ |
— |
|
|
$ |
171 |
|
|
$ |
341 |
|
|
$ |
333 |
|
|
$ |
656 |
|
|
$ |
680 |
|
|
$ |
579 |
|
|
|
|
|
|
|
|
|
|
|
|
|
|
|
|
|
|
|
|
|
|
| Other gross profit |
|
|
|
|
|
$ |
1,043 |
|
|
$ |
190 |
|
|
$ |
218 |
|
|
$ |
197 |
|
|
$ |
136 |
|
|
$ |
161 |
|
|
$ |
230 |
|
|
$ |
214 |
|
| Root warrant revenue |
|
|
|
|
|
— |
|
|
— |
|
|
— |
|
|
— |
|
|
(7) |
|
|
(5) |
|
|
(5) |
|
|
(6) |
|
| Other gross profit, non-GAAP |
|
|
|
|
|
$ |
1,043 |
|
|
$ |
190 |
|
|
$ |
218 |
|
|
$ |
197 |
|
|
$ |
129 |
|
|
$ |
156 |
|
|
$ |
225 |
|
|
$ |
208 |
|
|
|
|
|
|
|
|
|
|
|
|
|
|
|
|
|
|
|
|
|
|
| Retail vehicle unit sales |
|
|
|
|
|
425,237 |
|
|
105,185 |
|
|
117,564 |
|
|
102,570 |
|
|
86,977 |
|
|
79,240 |
|
|
76,530 |
|
|
80,987 |
|
| Other gross profit per retail unit |
|
|
|
|
|
$ |
2,453 |
|
|
$ |
1,806 |
|
|
$ |
1,854 |
|
|
$ |
1,921 |
|
|
$ |
1,564 |
|
|
$ |
2,032 |
|
|
$ |
3,005 |
|
|
$ |
2,642 |
|
| Other gross profit per retail unit, non-GAAP |
|
|
|
|
|
$ |
2,453 |
|
|
$ |
1,806 |
|
|
$ |
1,854 |
|
|
$ |
1,921 |
|
|
$ |
1,483 |
|
|
$ |
1,969 |
|
|
$ |
2,940 |
|
|
$ |
2,568 |
|
(1) Restructuring includes costs related to our May 2022 and November 2022 reductions in force.
|
|
|
|
|
|
|
|
|
|
|
|
|
|
|
|
|
|
|
|
|
|
|
|
|
|
|
|
|
|
|
|
|
|
|
|
|
|
|
|
|
|
|
|
|
|
|
|
|
|
|
|
|
For the Years Ended December 31, |
| (dollars in millions, except per unit amounts) |
|
|
|
|
|
2016 |
|
2017 |
|
2018 |
|
2019 |
|
2020 |
|
2021 |
|
2022 |
| Net loss |
|
|
|
|
|
$ |
(93) |
|
|
$ |
(164) |
|
|
$ |
(255) |
|
|
$ |
(365) |
|
|
$ |
(462) |
|
|
$ |
(287) |
|
|
$ |
(2,894) |
|
| Income tax provision |
|
|
|
|
|
— |
|
|
— |
|
|
— |
|
|
— |
|
|
— |
|
|
1 |
|
|
1 |
|
| Interest expense |
|
|
|
|
|
4 |
|
|
8 |
|
|
25 |
|
|
81 |
|
|
131 |
|
|
176 |
|
|
486 |
|
| Other (income) expense, net |
|
|
|
|
|
— |
|
|
1 |
|
|
1 |
|
|
4 |
|
|
(1) |
|
|
6 |
|
|
70 |
|
| Depreciation and amortization expense in cost of sales |
|
|
|
|
|
— |
|
|
— |
|
|
— |
|
|
— |
|
|
10 |
|
|
24 |
|
|
114 |
|
| Depreciation and amortization expense in SG&A |
|
|
|
|
|
4 |
|
|
11 |
|
|
24 |
|
|
41 |
|
|
74 |
|
|
105 |
|
|
200 |
|
| Share-based compensation expense in cost of sales |
|
|
|
|
|
— |
|
|
— |
|
|
4 |
|
|
5 |
|
|
1 |
|
|
— |
|
|
16 |
|
| Share-based compensation expense in SG&A |
|
|
|
|
|
1 |
|
|
6 |
|
|
21 |
|
|
30 |
|
|
25 |
|
|
39 |
|
|
69 |
|
| Root warrant revenue |
|
|
|
|
|
— |
|
|
— |
|
|
— |
|
|
— |
|
|
— |
|
|
— |
|
|
(7) |
|
| Goodwill impairment |
|
|
|
|
|
— |
|
|
— |
|
|
— |
|
|
— |
|
|
— |
|
|
— |
|
|
847 |
|
Restructuring (1) |
|
|
|
|
|
— |
|
|
— |
|
|
— |
|
|
— |
|
|
— |
|
|
— |
|
|
57 |
|
| Adjusted EBITDA |
|
|
|
|
|
$ |
(84) |
|
|
$ |
(138) |
|
|
$ |
(180) |
|
|
$ |
(204) |
|
|
$ |
(222) |
|
|
$ |
64 |
|
|
$ |
(1,041) |
|
|
|
|
|
|
|
|
|
|
|
|
|
|
|
|
|
|
|
|
| Total revenues |
|
|
|
|
|
$ |
365 |
|
|
$ |
859 |
|
|
$ |
1,955 |
|
|
$ |
3,940 |
|
|
$ |
5,587 |
|
|
$ |
12,814 |
|
|
$ |
13,604 |
|
| Net loss margin |
|
|
|
|
|
(25.5) |
% |
|
(19.1) |
% |
|
(13.0) |
% |
|
(9.3) |
% |
|
(8.3) |
% |
|
(2.2) |
% |
|
(21.3) |
% |
| Adjusted EBITDA margin |
|
|
|
|
|
(23.0) |
% |
|
(16.1) |
% |
|
(9.2) |
% |
|
(5.2) |
% |
|
(4.0) |
% |
|
0.5 |
% |
|
(7.7) |
% |
|
|
|
|
|
|
|
|
|
|
|
|
|
|
|
|
|
|
|
| Gross profit |
|
|
|
|
|
$ |
19 |
|
|
$ |
68 |
|
|
$ |
197 |
|
|
$ |
506 |
|
|
$ |
794 |
|
|
$ |
1,929 |
|
|
$ |
1,246 |
|
| Depreciation and amortization expense in cost of sales |
|
|
|
|
|
— |
|
|
— |
|
|
— |
|
|
— |
|
|
10 |
|
|
24 |
|
|
114 |
|
| Share-based compensation expense in cost of sales |
|
|
|
|
|
— |
|
|
— |
|
|
4 |
|
|
5 |
|
|
1 |
|
|
— |
|
|
16 |
|
| Root warrant revenue |
|
|
|
|
|
— |
|
|
— |
|
|
— |
|
|
— |
|
|
— |
|
|
— |
|
|
(7) |
|
Restructuring (1) |
|
|
|
|
|
— |
|
|
— |
|
|
— |
|
|
— |
|
|
— |
|
|
— |
|
|
7 |
|
| Gross profit, non-GAAP |
|
|
|
|
|
$ |
19 |
|
|
$ |
68 |
|
|
$ |
201 |
|
|
$ |
511 |
|
|
$ |
805 |
|
|
$ |
1,953 |
|
|
$ |
1,376 |
|
|
|
|
|
|
|
|
|
|
|
|
|
|
|
|
|
|
|
|
| Retail vehicle unit sales |
|
|
|
|
|
18,761 |
|
|
44,252 |
|
|
94,108 |
|
|
177,549 |
|
|
244,111 |
|
|
425,237 |
|
|
412,296 |
|
| Total gross profit per retail unit |
|
|
|
|
|
$ |
1,023 |
|
|
$ |
1,539 |
|
|
$ |
2,090 |
|
|
$ |
2,852 |
|
|
$ |
3,253 |
|
|
$ |
4,537 |
|
|
$ |
3,022 |
|
| Total gross profit per retail unit, non-GAAP |
|
|
|
|
|
$ |
1,013 |
|
|
$ |
1,537 |
|
|
$ |
2,136 |
|
|
$ |
2,878 |
|
|
$ |
3,298 |
|
|
$ |
4,593 |
|
|
$ |
3,337 |
|
|
|
|
|
|
|
|
|
|
|
|
|
|
|
|
|
|
|
|
| SG&A |
|
|
|
|
|
$ |
109 |
|
|
$ |
223 |
|
|
$ |
425 |
|
|
$ |
787 |
|
|
$ |
1,126 |
|
|
$ |
2,033 |
|
|
$ |
2,736 |
|
| Depreciation and amortization expense in SG&A |
|
|
|
|
|
4 |
|
|
11 |
|
|
24 |
|
|
41 |
|
|
74 |
|
|
105 |
|
|
200 |
|
| Share-based compensation expense in SG&A |
|
|
|
|
|
1 |
|
|
6 |
|
|
21 |
|
|
30 |
|
|
25 |
|
|
39 |
|
|
69 |
|
Restructuring (1) |
|
|
|
|
|
— |
|
|
— |
|
|
— |
|
|
— |
|
|
— |
|
|
— |
|
|
50 |
|
| SG&A, non-GAAP |
|
|
|
|
|
$ |
104 |
|
|
$ |
206 |
|
|
$ |
380 |
|
|
$ |
716 |
|
|
$ |
1,027 |
|
|
$ |
1,889 |
|
|
$ |
2,417 |
|
|
|
|
|
|
|
|
|
|
|
|
|
|
|
|
|
|
|
|
| Retail vehicle unit sales |
|
|
|
|
|
18,761 |
|
|
44,252 |
|
|
94,108 |
|
|
177,549 |
|
|
244,111 |
|
|
425,237 |
|
|
412,296 |
|
| Total SG&A per retail unit |
|
|
|
|
|
$ |
5,810 |
|
|
$ |
5,039 |
|
|
$ |
4,516 |
|
|
$ |
4,433 |
|
|
$ |
4,613 |
|
|
$ |
4,781 |
|
|
$ |
6,636 |
|
| Total SG&A per retail unit, non-GAAP |
|
|
|
|
|
$ |
5,543 |
|
|
$ |
4,655 |
|
|
$ |
4,038 |
|
|
$ |
4,033 |
|
|
$ |
4,207 |
|
|
$ |
4,442 |
|
|
$ |
5,862 |
|
(1) Restructuring includes costs related to our May 2022 and November 2022 reductions in force, as well as lease termination and other restructuring expenses.
|
|
|
|
|
|
|
|
|
|
|
|
|
|
|
|
|
|
|
|
|
|
|
|
|
|
|
|
|
|
|
|
|
|
|
|
|
|
|
|
|
|
|
|
|
|
|
|
|
|
|
|
|
|
|
|
|
|
|
|
|
|
|
|
|
|
|
|
|
|
|
For the Three Months Ended September 30, |
| (dollars in millions, except per unit amounts) |
|
|
|
|
|
2014 |
|
2015 |
|
2016 |
|
2017 |
|
2018 |
|
2019 |
|
2020 |
|
2021 |
|
2022 |
|
2023 |
| Net income (loss) |
|
|
|
|
|
$ |
(4) |
|
|
$ |
(8) |
|
|
$ |
(23) |
|
|
$ |
(41) |
|
|
$ |
(64) |
|
|
$ |
(93) |
|
|
$ |
(18) |
|
|
$ |
(68) |
|
|
$ |
(508) |
|
|
$ |
741 |
|
| Income tax benefit |
|
|
|
|
|
— |
|
|
— |
|
|
— |
|
|
— |
|
|
— |
|
|
— |
|
|
— |
|
|
— |
|
|
— |
|
|
29 |
|
| Interest expense |
|
|
|
|
|
— |
|
|
— |
|
|
1 |
|
|
1 |
|
|
6 |
|
|
21 |
|
|
20 |
|
|
48 |
|
|
153 |
|
|
153 |
|
| Other (income) expense, net |
|
|
|
|
|
— |
|
|
— |
|
|
— |
|
|
1 |
|
|
— |
|
|
1 |
|
|
(9) |
|
|
(3) |
|
|
58 |
|
|
4 |
|
| Depreciation and amortization expense in cost of sales |
|
|
|
|
|
— |
|
|
— |
|
|
— |
|
|
— |
|
|
— |
|
|
— |
|
|
2 |
|
|
6 |
|
|
36 |
|
|
42 |
|
| Depreciation and amortization expense in SG&A |
|
|
|
|
|
— |
|
|
1 |
|
|
1 |
|
|
3 |
|
|
6 |
|
|
11 |
|
|
19 |
|
|
26 |
|
|
57 |
|
|
45 |
|
| Share-based compensation expense in cost of sales |
|
|
|
|
|
— |
|
|
— |
|
|
— |
|
|
— |
|
|
1 |
|
|
1 |
|
|
— |
|
|
— |
|
|
2 |
|
|
— |
|
| Share-based compensation expense in SG&A |
|
|
|
|
|
— |
|
|
— |
|
|
1 |
|
|
2 |
|
|
10 |
|
|
9 |
|
|
6 |
|
|
11 |
|
|
16 |
|
|
18 |
|
| Root warrant revenue |
|
|
|
|
|
— |
|
|
— |
|
|
— |
|
|
— |
|
|
— |
|
|
— |
|
|
— |
|
|
— |
|
|
— |
|
|
(6) |
|
|
|
|
|
|
|
|
|
|
|
|
|
|
|
|
|
|
|
|
|
|
|
|
|
|
| Gain on debt extinguishment |
|
|
|
|
|
— |
|
|
— |
|
|
— |
|
|
— |
|
|
— |
|
|
— |
|
|
— |
|
|
— |
|
|
— |
|
|
(878) |
|
|
|
|
|
|
|
|
|
|
|
|
|
|
|
|
|
|
|
|
|
|
|
|
|
|
| Adjusted EBITDA |
|
|
|
|
|
$ |
(4) |
|
|
$ |
(7) |
|
|
$ |
(20) |
|
|
$ |
(34) |
|
|
$ |
(41) |
|
|
$ |
(50) |
|
|
$ |
20 |
|
|
$ |
20 |
|
|
$ |
(186) |
|
|
$ |
148 |
|
|
|
|
|
|
|
|
|
|
|
|
|
|
|
|
|
|
|
|
|
|
|
|
|
|
| Total revenues |
|
|
|
|
|
$ |
12 |
|
|
$ |
36 |
|
|
$ |
99 |
|
|
$ |
225 |
|
|
$ |
535 |
|
|
$ |
1,095 |
|
|
$ |
1,544 |
|
|
$ |
3,480 |
|
|
$ |
3,386 |
|
|
$ |
2,773 |
|
| Net income (loss) margin |
|
|
|
|
|
(36.1) |
% |
|
(26.0) |
% |
|
(22.2) |
% |
|
(17.6) |
% |
|
(12.0) |
% |
|
(8.4) |
% |
|
(1.2) |
% |
|
(2.0) |
% |
|
(15.0) |
% |
|
26.7 |
% |
| Adjusted EBITDA margin |
|
|
|
|
|
(32.4) |
% |
|
(22.9) |
% |
|
(20.1) |
% |
|
(14.8) |
% |
|
(7.6) |
% |
|
(4.5) |
% |
|
1.3 |
% |
|
0.6 |
% |
|
(5.5) |
% |
|
5.3 |
% |
|
|
|
|
|
|
|
|
|
|
|
|
|
|
|
|
|
|
|
|
|
|
|
|
|
| Gross profit |
|
|
|
|
|
$ |
— |
|
|
$ |
— |
|
|
$ |
7 |
|
|
$ |
20 |
|
|
$ |
58 |
|
|
$ |
138 |
|
|
$ |
262 |
|
|
$ |
523 |
|
|
$ |
359 |
|
|
$ |
482 |
|
| Depreciation and amortization expense in cost of sales |
|
|
|
|
|
— |
|
|
— |
|
|
— |
|
|
— |
|
|
— |
|
|
— |
|
|
2 |
|
|
6 |
|
|
36 |
|
|
42 |
|
| Share-based compensation expense in cost of sales |
|
|
|
|
|
— |
|
|
— |
|
|
— |
|
|
— |
|
|
1 |
|
|
1 |
|
|
— |
|
|
— |
|
|
2 |
|
|
— |
|
| Root warrant revenue |
|
|
|
|
|
— |
|
|
— |
|
|
— |
|
|
— |
|
|
— |
|
|
— |
|
|
— |
|
|
— |
|
|
— |
|
|
(6) |
|
|
|
|
|
|
|
|
|
|
|
|
|
|
|
|
|
|
|
|
|
|
|
|
|
|
| Gross profit, non-GAAP |
|
|
|
|
|
$ |
— |
|
|
$ |
— |
|
|
$ |
7 |
|
|
$ |
20 |
|
|
$ |
59 |
|
|
$ |
139 |
|
|
$ |
264 |
|
|
$ |
529 |
|
|
$ |
397 |
|
|
$ |
518 |
|
|
|
|
|
|
|
|
|
|
|
|
|
|
|
|
|
|
|
|
|
|
|
|
|
|
| Retail vehicle unit sales |
|
|
|
|
|
579 |
|
|
1,776 |
|
|
5,023 |
|
|
11,719 |
|
|
25,324 |
|
|
46,413 |
|
|
64,414 |
|
|
111,949 |
|
|
102,570 |
|
|
80,987 |
|
| Total gross profit per retail unit |
|
|
|
|
|
$ |
(429) |
|
|
$ |
130 |
|
|
$ |
1,347 |
|
|
$ |
1,742 |
|
|
$ |
2,263 |
|
|
$ |
2,963 |
|
|
$ |
4,056 |
|
|
$ |
4,672 |
|
|
$ |
3,500 |
|
|
$ |
5,952 |
|
| Total gross profit per retail unit, non-GAAP |
|
|
|
|
|
$ |
(429) |
|
|
$ |
130 |
|
|
$ |
1,347 |
|
|
$ |
1,742 |
|
|
$ |
2,302 |
|
|
$ |
2,993 |
|
|
$ |
4,098 |
|
|
$ |
4,725 |
|
|
$ |
3,870 |
|
|
$ |
6,396 |
|
|
|
|
|
|
|
|
|
|
|
|
|
|
|
|
|
|
|
|
|
|
|
|
|
|
| SG&A |
|
|
|
|
|
$ |
4 |
|
|
$ |
9 |
|
|
$ |
29 |
|
|
$ |
59 |
|
|
$ |
116 |
|
|
$ |
209 |
|
|
$ |
269 |
|
|
$ |
546 |
|
|
$ |
656 |
|
|
$ |
433 |
|
| Depreciation and amortization expense in SG&A |
|
|
|
|
|
— |
|
|
1 |
|
|
1 |
|
|
3 |
|
|
6 |
|
|
11 |
|
|
19 |
|
|
26 |
|
|
57 |
|
|
45 |
|
| Share-based compensation expense in SG&A |
|
|
|
|
|
— |
|
|
— |
|
|
1 |
|
|
2 |
|
|
10 |
|
|
9 |
|
|
6 |
|
|
11 |
|
|
16 |
|
|
18 |
|
|
|
|
|
|
|
|
|
|
|
|
|
|
|
|
|
|
|
|
|
|
|
|
|
|
| SG&A, non-GAAP |
|
|
|
|
|
$ |
4 |
|
|
$ |
8 |
|
|
$ |
27 |
|
|
$ |
54 |
|
|
$ |
100 |
|
|
$ |
189 |
|
|
$ |
244 |
|
|
$ |
509 |
|
|
$ |
583 |
|
|
$ |
370 |
|
|
|
|
|
|
|
|
|
|
|
|
|
|
|
|
|
|
|
|
|
|
|
|
|
|
| Retail vehicle unit sales |
|
|
|
|
|
579 |
|
|
1,776 |
|
|
5,023 |
|
|
11,719 |
|
|
25,324 |
|
|
46,413 |
|
|
64,414 |
|
|
111,949 |
|
|
102,570 |
|
|
80,987 |
|
| Total SG&A per retail unit |
|
|
|
|
|
$ |
6,930 |
|
|
$ |
5,190 |
|
|
$ |
5,573 |
|
|
$ |
5,007 |
|
|
$ |
4,571 |
|
|
$ |
4,481 |
|
|
$ |
4,158 |
|
|
$ |
4,877 |
|
|
$ |
6,396 |
|
|
$ |
5,347 |
|
| Total SG&A per retail unit, non-GAAP |
|
|
|
|
|
$ |
6,181 |
|
|
$ |
4,728 |
|
|
$ |
5,308 |
|
|
$ |
4,581 |
|
|
$ |
3,912 |
|
|
$ |
4,058 |
|
|
$ |
3,779 |
|
|
$ |
4,547 |
|
|
$ |
5,684 |
|
|
$ |
4,569 |
|
|
|
|
|
|
|
|
|
|
|
|
|
|
|
|
|
|
|
|
|
|
|
|
|
|
|
|
|
|
|
|
|
|
|
|
|
|
|
|
|
|
|
|
|
|
|
|
|
|
|