Document
Exhibit 99.1
Dear Shareholders,
The second quarter was a gratifying and validating quarter for Carvana.
It was gratifying because the Carvana team set a plan, charted a course, executed against our plan, and delivered.
It was validating because it provided the hard data points that remind us all of the power of our customer offering and our business model. Our customers love our offering and our business is highly differentiated, highly efficient, and extremely hard to replicate.
In the quarter, we hit records in Total GPU, Adjusted EBITDA, and Adjusted EBITDA margin while also cutting SG&A expenses by an additional ~$20m.
The quarter benefitted from a number of non-recurring benefits that we describe below in the letter. When controlling for these benefits, the results were still exceptionally strong.
As discussed previously, our plan has three steps:
1. Drive the business to positive Adjusted EBITDA.
2. Drive the business to significant positive unit economics.
3. After completing steps 1 and 2, return to growth.
In the second quarter, we completed step 1. Our plan from here is to complete step 2 and then move on to step 3, return to growth.
Our customers love our offering, our team has been made stronger by the last year and a half and is executing, we currently have about 1% nationwide market penetration, and our opportunity is the same it has always been.
We remain firmly on the path to selling millions of cars per year and to becoming the largest and most profitable automotive retailer.
Summary of Q2 2023 Results
Q2 2023 Financial Results: All financial comparisons stated below are versus Q2 2022, unless otherwise noted. Complete financial tables appear at the end of this letter.
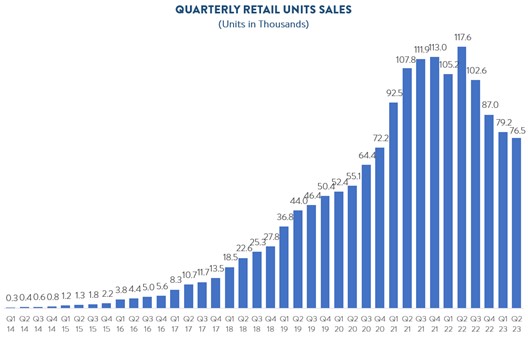
•Retail units sold totaled 76,530, a decrease of 35%
•Revenue totaled $2.968 billion, a decrease of 24%
•Total gross profit was $499 million, an increase of 26%
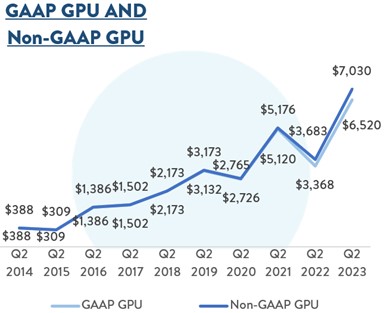
•Total gross profit per unit (“GPU”) was $6,520, an increase of $3,152
•Non-GAAP Total GPU was $7,030, an increase of $3,347
◦GAAP and Non-GAAP Total GPU benefited from ~$900 of non-recurring items, including selling and holding a higher-than-normalized volume of loans and a benefit from our retail inventory allowance
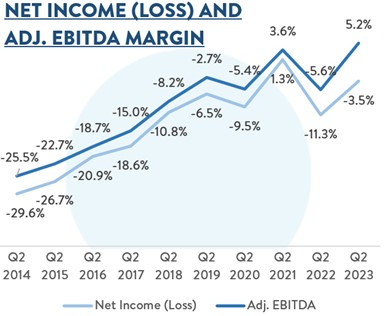
•Net loss margin was (3.5%), a sequential improvement from (11.0%)
•Adjusted EBITDA margin1 was 5.2% a sequential improvement from (0.9%)
◦Adjusted EBITDA benefitted by ~$70 million from non-recurring items, including selling and holding a higher-than-normalized volume of loans and a benefit from our retail inventory allowance
◦Basic and diluted net loss per Class A share was $0.55 based on 106 million shares of Class A common stock outstanding
1 Consistent with our Q4 2022 and Q1 2023 reporting, Adjusted EBITDA is defined as net loss plus income tax expense, interest expense, other (income) expense, net, depreciation and amortization in cost of sales and SG&A, goodwill impairment, share-based compensation including the CEO Milestone Gift in cost of sales and SG&A, and restructuring costs, minus revenue related to our Root warrants. For additional information on Adjusted EBITDA and other Non-GAAP financial metrics referenced in this letter, please see our Q2 2023 supplemental financial tables.
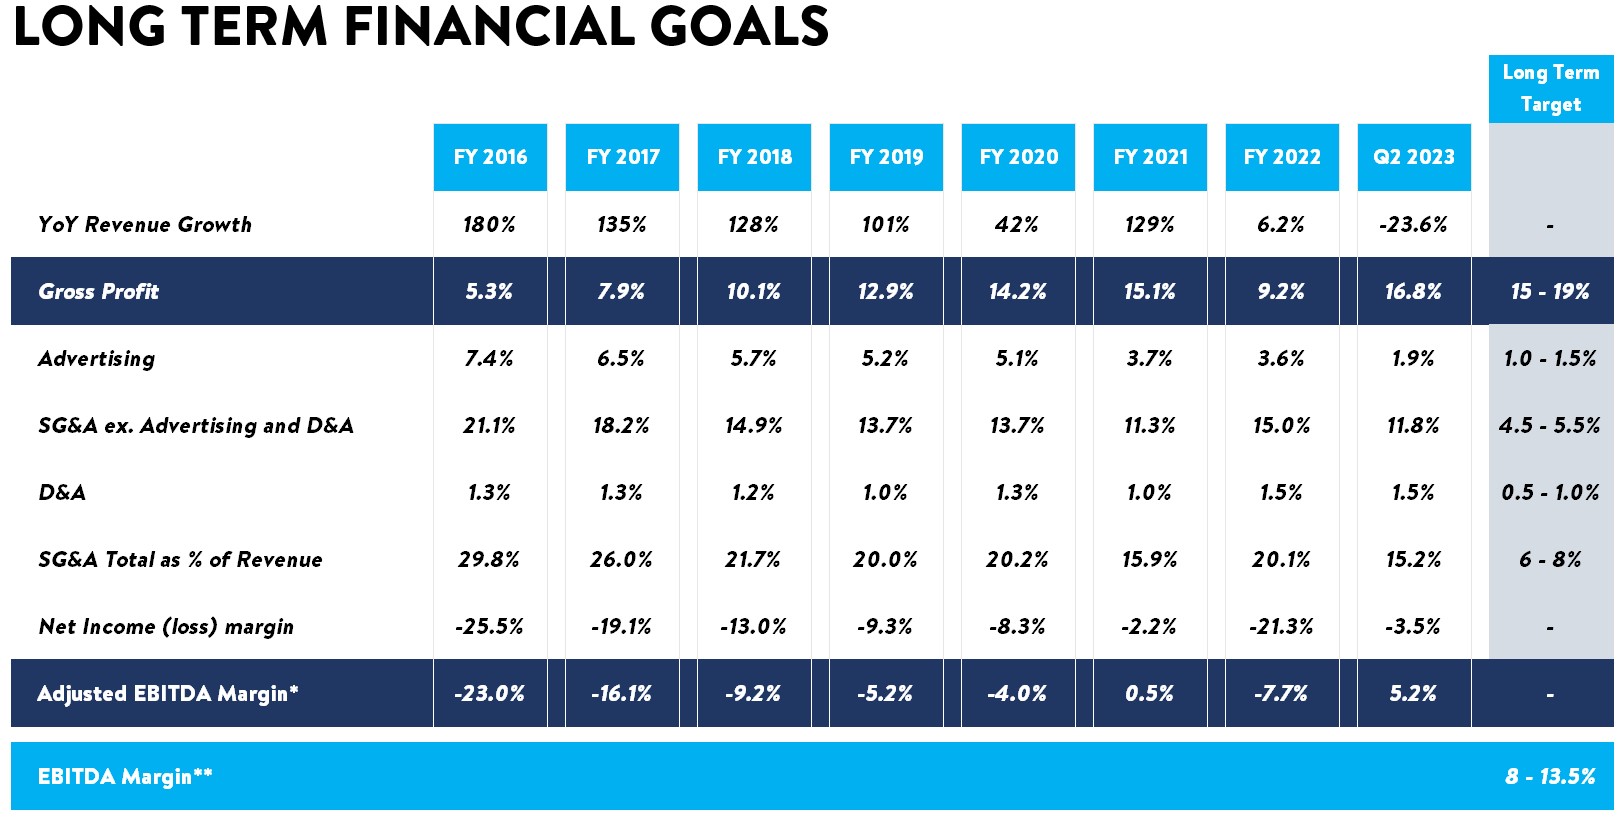
Path to Profitability
As stated in our last shareholder letter, our top management objective is to drive our business to positive free cash flow. This objective can be broken down into three steps:
1.Drive the business to positive Adjusted EBITDA.
2.Drive the business to significant positive unit economics.
3.After completing steps 1 and 2, return to growth.
Over the last several quarters, we have been focused on the first step of this three-step plan. With our results in Q2, we have completed Step 1 and are ready to move on to Step 2.
Second Quarter Results
Q2 2023 was a pivotal quarter for Carvana. We significantly exceeded our goal of driving positive Adjusted EBITDA, both with and without the benefits of non-recurring items.
We achieved company-record GAAP and Non-GAAP Total GPU of $6,520 and $7,030 respectively, both inclusive of ~$900 of non-recurring benefits.
We further reduced SG&A expenses and achieved Net Loss and Adjusted EBITDA of -$105 million and +$155 million, respectively, both inclusive of ~$70 million of non-recurring benefits. These results reflect a significant step forward on our path to driving positive free cash flow.
Part 1: Retail Units
Retail units sold totaled 76,530 in Q2, a sequential reduction of 3% and a year-over-year reduction of 35%.
Retail units sold in Q2 were impacted by the same set of factors we have discussed in our recent letters. We reduced inventory by 12% sequentially and 55% YoY. We increased advertising expense by 2% sequentially and reduced it by 56% YoY. Interest rates in the quarter increased sequentially and continued to be up significantly YoY. Finally, we continue to focus on our profitability initiatives. All of these factors create a headwind to retail units sold volume, other things being equal.
Looking forward, we expect inventory size to remain close to current levels, and we expect advertising spend to have reached a low point in Q1 for the near term. In addition, while we expect to continue executing our profitability initiatives for at least several more quarters, we believe the pace of these new initiatives will eventually slow, reducing internally driven impacts to sales volume.
Part 2: Total GPU
Total GPU in Q2 2023 was $6,520 and $7,030 on a GAAP and Non-GAAP basis, respectively. Total GPU was positively impacted by two non-recurring items that we estimate increased GAAP and Non-GAAP GPU by ~$900. We provide more detail on the factors impacting Q2 2023 GPU below.
(1) Non-Recurring Factors Impacting Q2
1.Higher-than-normalized volume of loans held and sold. In Q4 2022 and Q1 2023, we sold a lower volume of loans than we originated. This led to an increase in loans held for sale on our balance sheet at the end of Q1. In Q2, we sold ~$1.93 billion of loan principal, which was more than we originated, reducing our loans held for sale balance from $1.6 billion at the end of Q1 to $1.1 billion at the end of Q2. We estimate that selling and earning interest on a higher-than-normalized volume of loans relative to retail units sold in Q2 increased Other Gross Profit by ~$50 million, or ~$650 per retail unit sold, other things being equal.
2.Retail inventory allowance adjustment. Retail GPU in Q2 benefitted from a ~$20 million retail inventory allowance adjustment as we successfully reduced our inventory size and sold through more of our aged retail inventory that we reserved against in Q4 2022. This benefitted Q2 Retail GPU by ~$250 per retail unit, other things being equal.
(2) Other Factors Positively Impacting Q2
3.Used vehicle market seasonality. The second quarter is typically our strongest quarter for retail and wholesale GPU, since used vehicles typically transition from a period of higher depreciation in Q4 and early Q1 to a period of lower depreciation or appreciation in late Q1 and early Q2. Thus seasonality positively impacted Q2 retail and wholesale GPU, other things being equal.
4.Higher spreads between retail market prices and wholesale acquisition prices. In the second half of 2022 and early 2023, we saw higher-than-normalized spreads between wholesale and retail market prices. We believe this pattern would typically be followed by higher-than-normalized retail market depreciation; however, we did not see this to the expected degree in Q2. This dynamic positively impacted Retail GPU in Q2 other things being equal. In addition, we acquired fewer retail vehicles than we acquired in Q4 and Q1, which positively impacts Retail GPU other things being equal.
(3) Long-Term Fundamental Gains Impacting Q2
6.Return to normalized inventory size. Over the last several quarters we have made significant progress towards right-sizing inventory relative to expected sales volumes. Since December 2022, we have reduced inventory by 31%, and year-over-year inventory has declined by 55%. At the end of Q2 we held ~52,500 units in retail inventory and sold 76,530 retail units, which implies a turn time of ~62 days, consistent with many historical periods. We believe that our inventory is now in an appropriately sized range to support current sales volumes.
7.Higher than FY21 customer sourcing rate. We have continued to enhance our offering of buying cars from customers and are sourcing a higher share of our retail units sold directly from customers than we were in FY 2021.
8.Higher than FY21 revenue from additional services. Compared to FY 2021, we are generating more revenue from the unique services we offer our customers, including nationwide shipping and home delivery.
9.Lower than FY21 reconditioning and inbound transport costs. Since early 2022, our inventory and fulfillment teams have been focused on driving efficiencies in reconditioning and inbound transport. Total reconditioning and inbound transport costs per unit are now below FY 2021.
10.Higher than FY21 wholesale marketplace gross profit. In May 2022, we acquired ADESA U.S., the second largest U.S. wholesale used vehicle auction marketplace. ADESA’s wholesale marketplace generated significant gross profit in Q2 2023, a long-term addition to total gross profit.
We believe these significant fundamental gains allow us to maintain a meaningfully higher Total GPU than FY 2021 on a long-term basis.
Part 3: SG&A Expense
Over the past several quarters, we have made significant progress reducing SG&A expenses, completing $1.1 billion of annualized SG&A expense reductions since Q2 2022 on a GAAP and Non-GAAP basis.
In Q2 2023, we continued our sequential reductions of non-advertising SG&A expense, reducing GAAP and Non-GAAP expenses, excluding advertising, by $21 million and $22 million, respectively.
Advertising expenses were approximately flat in Q2 compared to Q1. We expect Q1 to be our near-term low point on quarterly advertising expenses, as we continue to seek to optimize our spend to balance unit volume and profitability.
We believe the cost reductions we've achieved over the past year are long-lasting and sustainable, and we believe we have further efficiencies to realize in all areas.
Looking forward, we see three primary drivers to reduce SG&A per retail unit sold.
1.In step 2 of our three-step plan (drive significant unit economics), we continue to see opportunities to reduce operations expenses on a per retail unit sold basis by completing our pipeline of projects to automate manual work, optimize staffing and routing, and increase deep funnel conversion.
2.Similarly, in step 2 of our three-step plan, we continue to see opportunities to reduce and optimize our corporate, technology, and facilities expenses on an absolute dollar basis through a continued focus on zero-based budgeting and other efficiency gains.
3.Finally, in step 3 of our three-step plan (return to growth), we see a significant opportunity to leverage our corporate, technology, and facilities expense base, leading to significant leverage on a per retail unit sold basis at higher volumes.
Third Quarter Outlook
Our second quarter results demonstrated significant progress on our path to profitability. We significantly exceeded our goal of driving positive Adjusted EBITDA, both with and without benefits from non-recurring items. This is a significant milestone, completing step 1 of our three-step plan toward positive free cash flow.
While the macroeconomic and industry environment continues to be uncertain, looking toward Q3 2023, we expect the following as long as the environment remains stable:
•On retail units, we currently expect similar retail units sold in Q3 2023 compared to Q2 2023.
•On GPU, we currently expect Non-GAAP Total GPU above $5,000 in Q3 2023.2
•On SG&A, we expect similar Non-GAAP SG&A expense in Q3 compared to Q2. We continue to see significant opportunities to further reduce Non-GAAP SG&A expense over time.
•Finally, we expect to generate positive Adjusted EBITDA in Q3 2023 for the second consecutive quarter, further demonstrating the first step in our three-step plan toward positive free cash flow.
We see upside to the above Total GPU and Adjusted EBITDA numbers, but given the early date of this earnings call within the quarter, we are electing to provide a conservative outlook.
Expansion
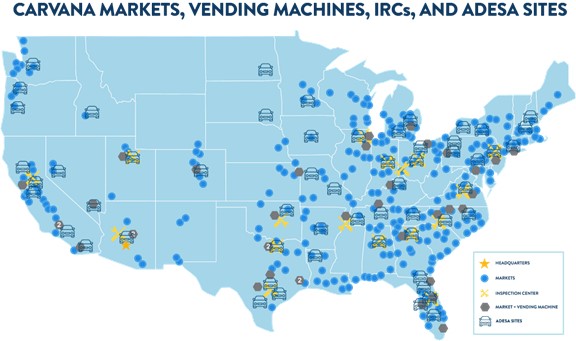
In 2023, we have paused expansion efforts other than completing existing projects as we focus our efforts on our profitability initiatives by leveraging our existing nationwide footprint. During Q2 2023, we completed two vending machines, one in Fort Worth, TX, and another near Chicago, IL, bringing our national total to 37 at quarter end.
*As of July 19, 2023
For a complete list of our market and vending machine opening history, estimated populations, and estimated total industry used vehicle sales by market, along with details on our IRCs, please see: https://investors.carvana.com/investor-resources/investor-materials
2 In order to clearly demonstrate our progress and highlight the most meaningful drivers within our business, we continue to use forecasted Non-GAAP financial measures (forecasted Non-GAAP Total GPU, Non-GAAP SG&A expense, and Adjusted EBITDA) as we look toward Q3 2023 and beyond. We have not provided a quantitative reconciliation of forecasted GAAP measures to forecasted Non-GAAP measures within this communication because we are unable, without making unreasonable efforts, to calculate one-time or restructuring expenses. These items could materially affect the computation of forward-looking GAAP GPU.
Management Objectives
Consistent with the priorities shared in the last several letters, our current focus remains centered on lowering expenses and driving positive free cash flow. However, this letter maintains our historical format built around the three objectives (1) Grow Retail Units and Revenue; (2) Increase Total Gross Profit Per Unit; and (3) Demonstrate Operating Leverage, to discuss our key results.
* Adjusted EBITDA is defined as net loss plus income tax expense, interest expense, other (income) expense, net, depreciation and amortization in cost of sales and SG&A, goodwill impairment, share-based compensation including the CEO Milestone Gift in cost of sales and SG&A, and restructuring costs, minus revenue related to our Root warrants. For additional information on Adjusted EBITDA and other Non-GAAP financial metrics referenced in this letter, please see the financial tables at the end of this letter and our Q2 2023 supplemental financial tables posted on our investor relations website.
** EBITDA Margin is calculated as GAAP Net Income (Loss) plus income tax expense, interest expense, and depreciation and amortization, divided by revenues.
Objective #1: Grow Retail Units and Revenue
Retail units sold totaled 76,530 in Q2, a sequential reduction of 3%. Revenue was $2.968 billion in Q2, a sequential increase of 14%. While our recent efficiency initiatives have created a headwind to unit growth in recent quarters, our Q2 2023 retail units sold volume and total revenue represent a 5-year compound annual growth rate (CAGR) of 28% and 44%, respectively.
For additional details on retail unit growth, please see the Second Quarter Results section of the letter.
Objective #2: Increase Total Gross Profit Per Unit
Total GPU increased significantly sequentially in Q2 2023, driven by a variety of factors, some non-recurring and others driven by fundamental improvements in the business, described in more detail below and in the Second Quarter Results section of this letter.
For Q2 2023
•Total
◦Total GPU was $6,520 vs. $3,368 in Q2 2022 and $4,303 in Q1 2023.
◦Non-GAAP Total GPU was $7,030 vs. $3,683 in Q2 2022 and $4,796 in Q1 2023.3
▪Total GPU included an aggregate ~$900 per unit benefit from two non-recurring items, which are described in more detail below.
•Retail
◦Retail GPU was $2,666 vs. $1,131 in Q2 2022 and $1,388 in Q1 2023.
◦Non-GAAP Retail GPU was $2,862 vs. $1,309 in Q2 2022 and $1,591 in Q1 2023.
▪Retail GPU benefitted from a ~$250 impact from an adjustment to our retail inventory allowance as we continued to reduce our inventory size and sell through more of our aged retail inventory that we reserved against in Q4 2022.
◦The significant sequential increase in Retail GPU (both with and without inventory allowance adjustment impacts) was primarily driven by lower average days to sale, lower retail market depreciation, wider spreads between wholesale and retail market prices, and lower reconditioning and inbound transport costs.
◦Year-over-year changes in Retail GPU were primarily driven by wider spreads between wholesale and retail market prices, higher shipping revenue, and lower reconditioning and inbound transport costs.
•Wholesale
◦Wholesale GPU was $849 vs. $383 in Q2 20224 and $883 in Q1 2023.
◦Non-GAAP Wholesale GPU was $1,228 vs. $520 in Q2 2022 and $1,236 in Q1 2023.
◦Wholesale Vehicle
◦Wholesale Vehicle GPU was $509 vs. $340 in Q2 2022 and $555 in Q1 2023.
◦Non-GAAP Wholesale Vehicle GPU was $548 vs. $349 in Q2 2022 and $580 in Q1 2023.
◦Sequential changes in Wholesale Vehicle GPU were primarily driven by lower gross profit per wholesale unit sold primarily offset by higher wholesale units sold volume. The former was primarily driven by higher wholesale market depreciation rates in Q2 compared to Q1, and the latter was primarily driven by operational improvements that allowed us to handle more volume.
◦Year-over-year improvement was primarily driven by a higher ratio of wholesale units sold to retail units sold and lower inbound transport costs.
•Wholesale Marketplace
◦Wholesale Marketplace GPU was $340 vs. $43 in Q2 2022 and $328 in Q1 2023.
◦Non-GAAP Wholesale Marketplace GPU was $680 vs. $171 in Q2 2022 and $656 in Q1 2023.
◦Year-over-year improvement was primarily driven by Q2 2022 consisting of a partial quarter following the closing of our acquisition of ADESA.
3 Consistent with our Q4 2022 and Q1 2023 reporting, we are presenting two metrics for total GPU and for each GPU component: GAAP gross profit per unit and non-GAAP gross profit per unit, which excludes the impacts of depreciation and amortization, share-based compensation, Root warrant revenue, and restructuring costs. For additional information, please see our Q2 2023 supplemental financial tables.
4 Wholesale gross profit and wholesale GPU includes gross profit from the sale of wholesale marketplace vehicles at our acquired ADESA locations.
•Other
◦Other GPU was $3,005 vs. $1,854 in Q2 2022 and $2,032 in Q1 2023.
◦Non-GAAP Other GPU was $2,940 vs. $1,854 in Q2 2022 and $1,969 in Q1 2023.
◦Sequential improvement in Other GPU was primarily driven by a greater volume of loans sold in Q2 compared to Q1. We estimate that higher-than-normalized volume of loans held and sold in Q2 increased Other GPU by ~$650, other things being equal. Sequential changes in Other GPU were also driven by higher origination interest rates relative to benchmark interest rates and higher average loan size.
◦Year-over-year improvement was primarily driven by the higher volume of loans held and sold relative to retail units sold volume in Q2 2023 as well as higher origination interest rates relative to benchmark interest rates.
Objective #3: Demonstrate Operating Leverage
On a sequential basis, Q2 2023 net loss margin and Adjusted EBITDA margin improved by 7.5% and 6.1%, respectively. On a year-over-year basis Q2 2023 net loss margin and Adjusted EBITDA margin improved by 7.8% and 10.8%, respectively, each driven by our company-wide focus on improving profitability and reducing SG&A expenses as described throughout this letter.
For Q2 2023, as a percentage of revenue:
•All components of SG&A improved sequentially. Total SG&A decreased by 2.9% and non-advertising SG&A decreased by 2.7%. Compensation and benefits decreased by 1.3%, advertising decreased by 0.2%, logistics and market occupancy decreased by 0.6%, and other SG&A decreased by 0.8%.
•Year-over-year, Total SG&A decreased by 3.3% and non-advertising SG&A decreased by 1.9%. Compensation and benefits decreased 1.0%, advertising decreased by 1.5%, logistics and market occupancy decreased by 0.9%, and other SG&A remained flat.
For additional details on SG&A leverage please see our discussion earlier in this letter.
Summary
Inside Carvana, the team has been doing highly focused, high quality work at high speed. The results are beginning to show up.
We still have a long way to go and we are keeping our heads down.
Completing our 3 step plan is our focus and we will continue to update you along the way.
In addition, the most important lesson we will take from this experience is the value of pressure. We have faced very high levels of pressure over the last 18 months and it has made us better. Going forward we will embed this lesson into our culture and processes so the benefits are enduring.
The march continues,
Mark Jenkins, CFO
Appendix
Conference Call Details
Ernie Garcia, III, Chairman and CEO Carvana will host a conference call today, July 19, 2023, at 8:00 a.m. EST (5:00 a.m. PST) to discuss financial results. To participate in the live call, analysts and investors should dial (833) 255-2830 or (412) 902-6715. A live audio webcast of the conference call along with supplemental financial information will also be accessible on the company's website at investors.carvana.com. Following the webcast, an archived version will also be available on the Investor Relations section of the company’s website. A telephonic replay of the conference call will be available until Wednesday, July 26, 2023 by dialing (877) 344-7529 or (412) 317-0088 and entering passcode 2140013#.
Forward Looking Statements
This letter contains forward-looking statements within the meaning of the Private Securities Litigation Reform Act of 1995. These forward-looking statements reflect Carvana’s current expectations and projections with respect to, among other things, its financial condition, results of operations, plans, objectives, strategy, future performance, and business. These statements may be preceded by, followed by or include the words "aim," "anticipate," "believe," "estimate," "expect," "forecast," "intend," "likely," "outlook," "plan," "potential," "project," "projection," "seek," "can," "could," "may," "should," "would," "will," the negatives thereof and other words and terms of similar meaning.
Forward-looking statements include all statements that are not historical facts, including expectations regarding our operational and efficiency initiatives, our strategy, expected gross profit per unit, forecasted results, and expectations regarding the effect of Carvana’s actions to improve performance. Such forward-looking statements are subject to various risks and uncertainties. Accordingly, there are or will be important factors that could cause actual outcomes or results to differ materially from those indicated in these statements. Among these factors are risks related to: the impact on our business from the larger automotive ecosystem and macroeconomic conditions, including consumer demand, global supply chain challenges, heightened inflation and rising interest rates; our ability to raise additional capital, the quality of the financial markets, and our substantial indebtedness; our history of losses and ability to achieve or maintain profitability in the future; our ability to sell loans into the market; the seasonal and other fluctuations in our quarterly operating results; our ability to compete in the highly competitive industry in which we participate; the changes in prices of new and used vehicles; our ability to sell our inventory expeditiously; and the other risks identified under the “Risk Factors” section in our Annual Report on Form 10-K for 2022 and Quarterly Report on Form 10-Q for the second quarter of 2023.
There is no assurance that any forward-looking statements will materialize. You are cautioned not to place undue reliance on forward-looking statements, which reflect expectations only as of this date. Carvana does not undertake any obligation to publicly update or review any forward-looking statement, whether as a result of new information, future developments, or otherwise.
Use of Non-GAAP Financial Measures
As appropriate, we supplement our results of operations determined in accordance with U.S. generally accepted accounting principles (“GAAP”) with certain non-GAAP financial measurements that are used by management, and which we believe are useful to investors, as supplemental operational measurements to evaluate our financial performance. These measurements should not be considered in isolation or as a substitute for reported GAAP results because they may include or exclude certain items as compared to similar GAAP-based measurements, and such measurements may not be comparable to similarly-titled measurements reported by other companies. Rather, these measurements should be considered as an additional way of viewing aspects of our operations that provide a more complete understanding of our business. We strongly encourage investors to review our consolidated financial statements included in publicly filed reports in their entirety and not rely solely on any one, single financial measurement or communication.
Reconciliations of our non-GAAP measurements to their most directly comparable GAAP-based financial measurements are included at the end of this letter.
Investor Relations Contact Information: : Mike Mckeever, investors@carvana.com
CARVANA CO. AND SUBSIDIARIES
CONDENSED CONSOLIDATED BALANCE SHEETS
(Unaudited)
(In millions, except number of shares, which are reflected in thousands, and par values)
|
|
|
|
|
|
|
|
|
|
|
|
|
June 30, 2023 |
|
December 31, 2022 |
| ASSETS |
|
|
|
| Current assets: |
|
|
|
| Cash and cash equivalents |
$ |
541 |
|
|
$ |
434 |
|
| Restricted cash |
136 |
|
|
194 |
|
| Accounts receivable, net |
335 |
|
|
253 |
|
| Finance receivables held for sale, net |
1,098 |
|
|
1,334 |
|
|
|
|
|
|
|
|
|
| Vehicle inventory |
1,302 |
|
|
1,876 |
|
| Beneficial interests in securitizations |
335 |
|
|
321 |
|
Other current assets, including $5 and $6, respectively, due from related parties |
165 |
|
|
182 |
|
| Total current assets |
3,912 |
|
|
4,594 |
|
| Property and equipment, net |
3,126 |
|
|
3,244 |
|
Operating lease right-of-use assets, including $12 and $14, respectively, from leases with related parties |
489 |
|
|
536 |
|
| Intangible assets, net |
61 |
|
|
70 |
|
|
|
|
|
Other assets, including $2 and $1, respectively, due from related parties |
261 |
|
|
254 |
|
| Total assets |
$ |
7,849 |
|
|
$ |
8,698 |
|
| LIABILITIES & STOCKHOLDERS' DEFICIT |
|
|
|
| Current liabilities: |
|
|
|
Accounts payable and accrued liabilities, including $6 and $16, respectively, due to related parties |
$ |
739 |
|
|
$ |
777 |
|
| Short-term revolving facilities |
1,161 |
|
|
1,534 |
|
| Current portion of long-term debt |
199 |
|
|
201 |
|
Other current liabilities, including $3 and $4, respectively, from leases with related parties |
80 |
|
|
80 |
|
| Total current liabilities |
2,179 |
|
|
2,592 |
|
| Long-term debt, excluding current portion |
6,542 |
|
|
6,574 |
|
|
|
|
|
Operating lease liabilities, excluding current portion, including $8 and $9, respectively, from leases with related parties |
466 |
|
|
507 |
|
| Other liabilities |
68 |
|
|
78 |
|
| Total liabilities |
9,255 |
|
|
9,751 |
|
| Commitments and contingencies |
|
|
|
|
|
|
|
| Stockholders' deficit: |
|
|
|
|
|
|
|
|
|
|
|
Preferred stock, $0.01 par value - 50,000 shares authorized; none issued and outstanding as of June 30, 2023 and December 31, 2022 |
— |
|
|
— |
|
Class A common stock, $0.001 par value - 500,000 shares authorized; 106,469 and 106,037 shares issued and outstanding as of June 30, 2023 and December 31, 2022, respectively |
— |
|
|
— |
|
Class B common stock, $0.001 par value - 125,000 shares authorized; 82,900 shares issued and outstanding as of June 30, 2023 and December 31, 2022 |
— |
|
|
— |
|
| Additional paid-in capital |
1,597 |
|
|
1,558 |
|
|
|
|
|
| Accumulated deficit |
(2,294) |
|
|
(2,076) |
|
| Total stockholders' deficit attributable to Carvana Co. |
(697) |
|
|
(518) |
|
| Non-controlling interests |
(709) |
|
|
(535) |
|
| Total stockholders' deficit |
(1,406) |
|
|
(1,053) |
|
| Total liabilities & stockholders' deficit |
$ |
7,849 |
|
|
$ |
8,698 |
|
CARVANA CO. AND SUBSIDIARIES
CONDENSED CONSOLIDATED STATEMENTS OF OPERATIONS
(Unaudited)
(In millions, except number of shares, which are reflected in thousands, and per share amounts)
|
|
|
|
|
|
|
|
|
|
|
|
|
|
|
|
|
|
|
|
|
|
|
|
|
Three Months Ended June 30, |
|
Six Months Ended June 30, |
|
2023 |
|
2022 |
|
2023 |
|
2022 |
| Sales and operating revenues: |
|
|
|
|
|
|
|
| Retail vehicle sales, net |
$ |
1,961 |
|
|
$ |
2,962 |
|
|
$ |
3,788 |
|
|
$ |
5,694 |
|
Wholesale sales and revenues, including $5, $7, $10 and $21, respectively, from related parties |
777 |
|
|
704 |
|
|
1,395 |
|
|
1,279 |
|
Other sales and revenues, including $33, $50, $69 and $98, respectively, from related parties |
230 |
|
|
218 |
|
|
391 |
|
|
408 |
|
|
|
|
|
|
|
|
|
| Net sales and operating revenues |
2,968 |
|
|
3,884 |
|
|
5,574 |
|
|
7,381 |
|
Cost of sales, including $1, $9, $2 and $18, respectively, to related parties |
2,469 |
|
|
3,488 |
|
|
4,734 |
|
|
6,687 |
|
| Gross profit |
499 |
|
|
396 |
|
|
840 |
|
|
694 |
|
Selling, general and administrative expenses, including $10, $7, $18 and $13, respectively, to related parties |
452 |
|
|
721 |
|
|
924 |
|
|
1,448 |
|
|
|
|
|
|
|
|
|
| Interest expense |
155 |
|
|
116 |
|
|
314 |
|
|
180 |
|
| Other (income) expense, net |
(3) |
|
|
(3) |
|
|
(5) |
|
|
10 |
|
| Net loss before income taxes |
(105) |
|
|
(438) |
|
|
(393) |
|
|
(944) |
|
| Income tax (benefit) provision |
— |
|
|
1 |
|
|
(2) |
|
|
1 |
|
| Net loss |
(105) |
|
|
(439) |
|
|
(391) |
|
|
(945) |
|
| Net loss attributable to non-controlling interests |
(47) |
|
|
(201) |
|
|
(173) |
|
|
(447) |
|
| Net loss attributable to Carvana Co. |
$ |
(58) |
|
|
$ |
(238) |
|
|
$ |
(218) |
|
|
$ |
(498) |
|
|
|
|
|
|
|
|
|
|
|
|
|
|
|
|
|
|
|
|
|
|
|
|
|
|
|
|
|
|
|
|
|
| Net loss per share of Class A common stock, basic and diluted |
$ |
(0.55) |
|
|
$ |
(2.35) |
|
|
$ |
(2.05) |
|
|
$ |
(5.20) |
|
|
|
|
|
|
|
|
|
|
|
|
|
|
|
|
|
Weighted-average shares of Class A common stock outstanding, basic and diluted (1) |
106,222 |
|
|
101,450 |
|
|
106,117 |
|
|
95,773 |
|
|
|
|
|
|
|
|
|
(1) Weighted-average shares of Class A common stock outstanding have been adjusted for unvested restricted stock awards.
CARVANA CO. AND SUBSIDIARIES
CONDENSED CONSOLIDATED STATEMENTS OF CASH FLOWS
(Unaudited)
(In millions)
|
|
|
|
|
|
|
|
|
|
|
|
|
Six Months Ended June 30, |
|
2023 |
|
2022 |
| Cash Flows from Operating Activities: |
|
|
|
| Net loss |
$ |
(391) |
|
|
$ |
(945) |
|
| Adjustments to reconcile net loss to net cash provided by (used in) operating activities: |
|
|
|
| Depreciation and amortization expense |
183 |
|
|
101 |
|
| Equity-based compensation expense |
34 |
|
|
42 |
|
| Loss on disposal of property and equipment |
6 |
|
|
2 |
|
| Provision for bad debt and valuation allowance |
25 |
|
|
8 |
|
| Amortization and write-off of debt issuance costs |
14 |
|
|
12 |
|
| Unrealized loss on warrants to acquire Root's Class A common stock |
— |
|
|
5 |
|
| Unrealized (gain) loss on beneficial interests in securitization |
(5) |
|
|
10 |
|
|
|
|
|
| Changes in finance receivable related assets: |
|
|
|
| Originations of finance receivables |
(2,913) |
|
|
(3,960) |
|
| Proceeds from sale of finance receivables, net |
3,118 |
|
|
3,921 |
|
|
|
|
|
| Gain on loan sales |
(214) |
|
|
(235) |
|
| Principal payments received on finance receivables held for sale |
132 |
|
|
113 |
|
| Other changes in assets and liabilities: |
|
|
|
| Vehicle inventory |
564 |
|
|
333 |
|
| Accounts receivable |
(86) |
|
|
(29) |
|
|
|
|
|
| Other assets |
4 |
|
|
(19) |
|
| Accounts payable and accrued liabilities |
(24) |
|
|
122 |
|
| Operating lease right-of-use assets |
47 |
|
|
(102) |
|
|
|
|
|
|
|
|
|
| Operating lease liabilities |
(41) |
|
|
140 |
|
| Other liabilities |
(10) |
|
|
(6) |
|
| Net cash provided by (used in) operating activities |
443 |
|
|
(487) |
|
| Cash Flows from Investing Activities: |
|
|
|
|
|
|
|
| Purchases of property and equipment |
(50) |
|
|
(361) |
|
| Proceeds from disposal of property and equipment |
33 |
|
|
— |
|
| Payments for acquisitions, net of cash acquired |
(7) |
|
|
(2,189) |
|
| Principal payments received on and proceeds from sale of beneficial interests |
30 |
|
|
25 |
|
|
|
|
|
| Net cash provided by (used in) investing activities |
6 |
|
|
(2,525) |
|
| Cash Flows from Financing Activities: |
|
|
|
| Proceeds from short-term revolving facilities |
4,536 |
|
|
8,159 |
|
| Payments on short-term revolving facilities |
(4,909) |
|
|
(9,094) |
|
| Proceeds from issuance of long-term debt |
62 |
|
|
3,416 |
|
| Payments on long-term debt |
(85) |
|
|
(66) |
|
| Payments of debt issuance costs |
(2) |
|
|
(65) |
|
| Net proceeds from issuance of Class A common stock |
— |
|
|
1,227 |
|
| Proceeds from equity-based compensation plans |
— |
|
|
3 |
|
| Tax withholdings related to restricted stock units and awards |
(2) |
|
|
(7) |
|
|
|
|
|
|
|
|
|
|
|
|
|
| Net cash (used in) provided by financing activities |
(400) |
|
|
3,573 |
|
| Net increase in cash, cash equivalents and restricted cash |
49 |
|
|
561 |
|
| Cash, cash equivalents and restricted cash at beginning of period |
628 |
|
|
636 |
|
| Cash, cash equivalents and restricted cash at end of period |
$ |
677 |
|
|
$ |
1,197 |
|
CARVANA CO. AND SUBSIDIARIES
OUTSTANDING SHARES AND LLC UNITS
(Unaudited)
LLC Units (adjusted for the exchange ratio and participation thresholds) are considered potentially dilutive shares of Class A common stock because they are exchangeable into shares of Class A common stock, if the Company elects not to settle exchanges in cash. Weighted-average shares of Class A common stock and as-exchanged LLC Units, which were evaluated for potentially dilutive effects and were determined to be anti-dilutive, are as follows:
|
|
|
|
|
|
|
|
|
|
|
|
|
|
|
|
|
|
|
|
|
|
|
|
|
Three Months Ended June 30, |
|
Six Months Ended June 30, |
|
2023 |
|
2022 |
|
2023 |
|
2022 |
|
|
|
|
|
|
|
|
|
(in thousands) |
| Weighted-average shares of Class A common stock outstanding |
106,222 |
|
|
101,450 |
|
|
106,117 |
|
|
95,773 |
|
| Weighted-average as-exchanged LLC Units for shares of Class A common stock |
83,951 |
|
|
84,647 |
|
|
83,819 |
|
|
84,798 |
|
|
190,173 |
|
|
186,097 |
|
|
189,936 |
|
|
180,571 |
|
|
|
|
|
|
|
|
|
|
|
|
|
|
|
|
|
CARVANA CO. AND SUBSIDIARIES
RESULTS OF OPERATIONS
(Unaudited)
|
|
|
|
|
|
|
|
|
|
|
|
|
|
|
|
|
|
|
|
|
|
|
|
|
|
|
|
|
|
|
|
|
|
|
|
|
Three Months Ended June 30, |
|
|
|
Six Months Ended June 30, |
|
|
|
2023 |
|
2022 |
|
Change |
|
2023 |
|
2022 |
|
Change |
|
|
|
|
|
|
|
|
|
|
|
|
|
(in millions, except unit and per unit amounts) |
|
|
|
(in millions, except unit and per unit amounts) |
|
|
| Net sales and operating revenues: |
|
|
|
|
|
|
|
|
|
|
| Retail vehicle sales, net |
$ |
1,961 |
|
|
$ |
2,962 |
|
|
(33.8) |
% |
|
$ |
3,788 |
|
|
$ |
5,694 |
|
|
(33.5) |
% |
Wholesale sales and revenues (1) |
777 |
|
|
704 |
|
|
10.4 |
% |
|
1,395 |
|
|
1,279 |
|
|
9.1 |
% |
Other sales and revenues (2) |
230 |
|
|
218 |
|
|
5.5 |
% |
|
391 |
|
|
408 |
|
|
(4.2) |
% |
| Total net sales and operating revenues |
$ |
2,968 |
|
|
$ |
3,884 |
|
|
(23.6) |
% |
|
$ |
5,574 |
|
|
$ |
7,381 |
|
|
(24.5) |
% |
| Gross profit: |
|
|
|
|
|
|
|
|
|
|
|
Retail vehicle gross profit (3) |
$ |
204 |
|
|
$ |
133 |
|
|
53.4 |
% |
|
$ |
314 |
|
|
$ |
218 |
|
|
44.0 |
% |
Wholesale gross profit (1) |
65 |
|
|
45 |
|
|
44.4 |
% |
|
135 |
|
|
68 |
|
|
98.5 |
% |
Other gross profit (2) |
230 |
|
|
218 |
|
|
5.5 |
% |
|
391 |
|
|
408 |
|
|
(4.2) |
% |
| Total gross profit |
$ |
499 |
|
|
$ |
396 |
|
|
26.0 |
% |
|
$ |
840 |
|
|
$ |
694 |
|
|
21.0 |
% |
|
|
|
|
|
|
|
|
|
|
|
|
|
|
|
|
|
|
|
|
|
|
|
|
|
|
|
|
|
|
|
|
|
|
|
|
|
|
|
|
|
|
|
|
|
|
|
|
|
|
|
|
|
|
|
|
|
|
|
|
|
|
|
|
|
|
|
|
|
|
|
|
|
|
|
|
|
|
|
|
|
|
|
|
|
|
|
|
|
|
|
|
|
|
|
|
|
|
|
|
|
|
|
|
|
|
|
|
| Unit sales information: |
|
|
|
|
|
|
|
|
|
|
|
| Retail vehicle unit sales |
76,530 |
|
|
117,564 |
|
|
(34.9) |
% |
|
155,770 |
|
|
222,749 |
|
|
(30.1) |
% |
| Wholesale vehicle unit sales |
46,453 |
|
|
55,299 |
|
|
(16.0) |
% |
|
81,563 |
|
|
105,579 |
|
|
(22.7) |
% |
|
|
|
|
|
|
|
|
|
|
|
|
| Per unit selling prices: |
|
|
|
|
|
|
|
|
|
|
|
| Retail vehicles |
25,624 |
|
|
25,195 |
|
|
1.7 |
% |
|
24,318 |
|
|
25,562 |
|
|
(4.9) |
% |
Wholesale vehicles (4) |
11,926 |
|
|
10,778 |
|
|
10.7 |
% |
|
11,782 |
|
|
11,091 |
|
|
6.2 |
% |
|
|
|
|
|
|
|
|
|
|
|
|
| Per retail unit gross profit: |
|
|
|
|
|
|
|
|
|
|
|
Retail vehicle gross profit (5) |
$ |
2,666 |
|
|
$ |
1,131 |
|
|
135.7 |
% |
|
$ |
2,016 |
|
|
$ |
979 |
|
|
105.9 |
% |
| Wholesale gross profit |
849 |
|
|
383 |
|
|
121.7 |
% |
|
867 |
|
|
305 |
|
|
184.3 |
% |
|
|
|
|
|
|
|
|
|
|
|
|
| Other gross profit |
3,005 |
|
|
1,854 |
|
|
62.1 |
% |
|
2,510 |
|
|
1,832 |
|
|
37.0 |
% |
| Total gross profit |
$ |
6,520 |
|
|
$ |
3,368 |
|
|
93.6 |
% |
|
$ |
5,393 |
|
|
$ |
3,116 |
|
|
73.1 |
% |
| Per wholesale unit gross profit: |
|
|
|
|
|
|
|
|
|
|
|
Wholesale vehicle gross profit (6) |
$ |
840 |
|
|
$ |
723 |
|
|
16.2 |
% |
|
$ |
1,018 |
|
|
$ |
597 |
|
|
70.5 |
% |
|
|
|
|
|
|
|
|
|
|
|
|
Wholesale marketplace: (7) |
|
|
|
|
|
|
|
|
|
|
|
| Wholesale marketplace units sold |
227,698 |
|
|
111,883 |
|
NM |
|
441,462 |
|
|
111,883 |
|
NM |
| Wholesale marketplace revenues |
$ |
223 |
|
|
$ |
108 |
|
|
NM |
|
$ |
434 |
|
|
$ |
108 |
|
|
NM |
Wholesale marketplace gross profit (8) |
$ |
26 |
|
|
$ |
5 |
|
|
NM |
|
$ |
52 |
|
|
$ |
5 |
|
|
NM |
|
|
|
|
|
|
|
|
|
|
|
|
|
|
|
|
|
|
|
|
|
|
|
|
|
|
|
|
|
|
|
|
|
|
|
|
|
|
|
|
|
|
|
|
|
|
|
|
|
|
|
|
|
|
|
|
|
|
|
|
(1) Includes $5, $7, $10 and $21, respectively, of wholesale sales and revenues from related parties.
(2) Includes $33, $50, $69 and $98, respectively, of other sales and revenues from related parties.
(3) Includes $0, $6, $0 and $14, respectively, of share-based compensation expense related to the CEO Milestone Gift.
(4) Excludes wholesale marketplace revenues and wholesale marketplace units sold.
(5) Includes $0, $51, $0 and $63, respectively, of share-based compensation expense related to the CEO Milestone Gift.
(6) Excludes wholesale marketplace gross profit and wholesale marketplace units sold.
(7) Represents results of ADESA and its subsidiaries, which the Company has designated as unrestricted subsidiaries. These amounts do not include units sold, revenues, or gross profit received from Company purchases and sales through the wholesale marketplace, which are eliminated in consolidation.
(8) Includes $26, $15, $52 and $15, respectively, of depreciation and amortization expense.
NM = Not Meaningful, for the three and six months ended June 30, 2022 only includes wholesale marketplace data from the date of the ADESA Acquisition of May 9, 2022.
CARVANA CO. AND SUBSIDIARIES
COMPONENTS OF SG&A
(Unaudited)
|
|
|
|
|
|
|
|
|
|
|
|
|
|
|
|
|
|
|
|
|
|
|
|
|
|
|
|
|
|
|
Three Months Ended |
|
Jun 30, 2022 |
|
Sep 30, 2022 |
|
Dec 31, 2022 |
|
Mar 31, 2023 |
|
Jun 30, 2023 |
|
|
|
|
|
|
|
|
|
|
|
(in millions) |
Compensation and benefits (1) |
$ |
248 |
|
|
$ |
221 |
|
|
$ |
212 |
|
|
$ |
177 |
|
|
$ |
163 |
|
CEO Milestone Gift (2) |
4 |
|
|
2 |
|
|
— |
|
|
(1) |
|
|
— |
|
| Advertising |
131 |
|
|
117 |
|
|
87 |
|
|
56 |
|
|
57 |
|
Market occupancy (3) |
24 |
|
|
23 |
|
|
23 |
|
|
21 |
|
|
18 |
|
Logistics (4) |
71 |
|
|
57 |
|
|
51 |
|
|
35 |
|
|
29 |
|
Other (5) |
243 |
|
|
236 |
|
|
259 |
|
|
184 |
|
|
185 |
|
| Total |
$ |
721 |
|
|
$ |
656 |
|
|
$ |
632 |
|
|
$ |
472 |
|
|
$ |
452 |
|
|
|
|
|
|
|
|
|
|
|
|
|
|
|
|
|
|
|
|
|
|
|
|
|
|
|
|
|
|
|
_________________________
(1) Compensation and benefits includes all payroll and related costs, including benefits, payroll taxes, and equity-based compensation, except those related to preparing vehicles for sale, which are included in cost of sales, and those related to the development of software products for internal use, which are capitalized to software and depreciated over the estimated useful lives of the related assets.
(2) CEO Milestone Gift includes all equity-based compensation and payroll tax costs associated with the Gift, except those Gift costs related to preparing vehicles for sale, which are included in cost of sales.
(3) Market occupancy costs includes occupancy costs of our vending machine and hubs. It excludes occupancy costs related to reconditioning vehicles which are included in cost of sales and the portion related to corporate occupancy which are included in other costs.
(4) Logistics includes fuel, maintenance and depreciation related to operating our own transportation fleet, and third-party transportation fees, except the portion related to inbound transportation, which is included in cost of sales.
(5) Other costs include all other selling, general and administrative expenses such as IT expenses, corporate occupancy, professional services and insurance, limited warranty, and title and registration.
CARVANA CO. AND SUBSIDIARIES
LIQUIDITY RESOURCES
(Unaudited)
We had the following liquidity resources available as of June 30, 2023 and December 31, 2022:
|
|
|
|
|
|
|
|
|
|
|
|
|
June 30,
2023 |
|
December 31,
2022 |
|
|
|
|
|
(in millions) |
| Cash and cash equivalents |
$ |
541 |
|
|
$ |
434 |
|
Availability under short-term revolving facilities (1) |
964 |
|
|
1,314 |
|
|
|
|
|
| Committed liquidity resources available |
$ |
1,505 |
|
|
$ |
1,748 |
|
|
|
|
|
Unpledged real estate not included above (2) |
1,985 |
|
|
1,971 |
|
Unpledged beneficial interests in securitizations (3) |
70 |
|
|
69 |
|
Total liquidity resources (4) |
$ |
3,560 |
|
|
$ |
3,788 |
|
1.Availability under short-term revolving facilities is the available amount we can borrow under our existing vehicle inventory floor plan and finance receivable facilities based on the pledgable value of vehicle inventory and finance receivables on our balance sheet on the period end date, excluding the impact to restricted cash requirements. This is distinct from the total commitment amount of these facilities because it represents the currently borrowable amount, rather than committed future amounts that could be borrowed to finance future additional assets.
2.Unpledged real estate assets include IRC, ADESA locations and vending machine real estate assets that have not been previously pledged or sold. Since our first sale-leaseback transaction in 2017, we have historically had flexible access to real estate financing and expect to continue to use various forms of real estate financing in the future.
3.Unpledged beneficial interests in securitizations includes retained beneficial interests in securitizations that have not been previously pledged or sold. We historically have financed the majority of our retained beneficial interests in securitizations and expect to continue to do so in the future.
4.Total liquidity resources is composed of cash and equivalents, availability under existing credit facilities, and additional unpledged assets, including vehicle inventory, finance receivables, real estate, and securities on our balance sheet that can be financed using traditional asset-based financing sources. To optimize our cost of capital, in any given period we may choose not to maximize borrowings on our short-term revolving facilities, maximize revolving commitment size, or immediately sale-leaseback or pledge real estate and retained beneficial interests in securitizations. This has the benefit of reducing interest expense and debt issuance costs and providing flexibility to minimize financing costs over time.
CARVANA CO. AND SUBSIDIARIES
RECONCILIATION OF GAAP TO NON-GAAP FINANCIAL MEASURES (continued)
(Unaudited)
Adjusted EBITDA; Adjusted EBITDA margin; Gross profit, non-GAAP; Total gross profit per retail unit, non-GAAP; SG&A, non-GAAP; and Total SG&A per retail unit, non-GAAP
Adjusted EBITDA; Adjusted EBITDA margin; Gross profit, non-GAAP; Total gross profit per retail unit, non-GAAP; SG&A, non-GAAP; and Total SG&A per retail unit, non-GAAP are supplemental measures of operating performance that do not represent and should not be considered an alternative to net loss, gross profit, or SG&A, as determined by U.S. GAAP.
Adjusted EBITDA is defined as net loss plus income tax expense, interest expense, other (income) expense, net, depreciation and amortization in cost of sales and SG&A, goodwill impairment, share-based compensation including the CEO Milestone Gift in cost of sales and SG&A, and restructuring costs, minus revenue related to our Root warrants. Following the ADESA Acquisition, we are also excluding depreciation and amortization in cost of sales, which was historically only a small component of cost of sales. Adjusted EBITDA margin is Adjusted EBITDA as a percentage of total revenues.
Gross profit, non-GAAP is defined as GAAP gross profit plus depreciation and amortization in cost of sales and share-based compensation including the CEO Milestone Gift in cost of sales, minus revenue related to our Root warrants. Total gross profit per retail unit, non-GAAP is Gross profit, non-GAAP divided by retail vehicle unit sales.
SG&A, non-GAAP is defined as GAAP SG&A minus depreciation and amortization in SG&A, share-based compensation including the CEO Milestone Gift in SG&A, and restructuring costs. Total SG&A per retail unit, non-GAAP is SG&A, non-GAAP divided by retail vehicle unit sales.
We use these non-GAAP measures to measure the operating performance of our business as a whole and relative to our total revenues and retail vehicle unit sales. We believe that these metrics are useful measures to us and to our investors because they exclude certain financial, capital structure, and non-cash items that we do not believe directly reflect our core operations and may not be indicative of our recurring operations, in part because they may vary widely across time and within our industry independent of the performance of our core operations. We believe that excluding these items enables us to more effectively evaluate our performance period-over-period and relative to our competitors. Adjusted EBITDA; Adjusted EBITDA margin; Gross profit, non-GAAP; Total gross profit per retail unit, non-GAAP; SG&A, non-GAAP; and Total SG&A per retail unit, non-GAAP may not be comparable to similarly titled measures provided by other companies due to potential differences in methods of calculations.
A reconciliation of Adjusted EBITDA to net loss, Gross profit, non-GAAP to gross profit, and SG&A, non-GAAP to SG&A, which are the most directly comparable U.S. GAAP measures, and calculations of Adjusted EBITDA margin, Total gross profit per retail unit, non-GAAP, and Total SG&A per retail unit, non-GAAP is as follows:
|
|
|
|
|
|
|
|
|
|
|
|
|
|
|
|
|
|
|
|
|
|
|
|
|
|
|
|
|
|
|
|
|
|
|
|
|
|
|
|
|
For the Three Months Ended |
| (dollars in millions, except per unit amounts) |
|
|
|
|
|
Jun 30, 2022 |
|
Sep 30, 2022 |
|
Dec 31, 2022 |
|
Mar 31, 2023 |
|
Jun 30, 2023 |
| Net loss |
|
|
|
|
|
$ |
(439) |
|
|
$ |
(508) |
|
|
$ |
(1,441) |
|
|
$ |
(286) |
|
|
$ |
(105) |
|
| Income tax (benefit) provision |
|
|
|
|
|
1 |
|
|
— |
|
|
— |
|
|
(2) |
|
|
— |
|
| Interest expense |
|
|
|
|
|
116 |
|
|
153 |
|
|
153 |
|
|
159 |
|
|
155 |
|
| Other (income) expense, net |
|
|
|
|
|
(3) |
|
|
58 |
|
|
2 |
|
|
(2) |
|
|
(3) |
|
| Depreciation and amortization expense in cost of sales |
|
|
|
|
|
27 |
|
|
36 |
|
|
43 |
|
|
44 |
|
|
44 |
|
| Depreciation and amortization expense in SG&A |
|
|
|
|
|
49 |
|
|
57 |
|
|
57 |
|
|
49 |
|
|
46 |
|
| Goodwill impairment |
|
|
|
|
|
— |
|
|
— |
|
|
847 |
|
|
— |
|
|
— |
|
| Share-based compensation expense in cost of sales |
|
|
|
|
|
6 |
|
|
2 |
|
|
— |
|
|
— |
|
|
— |
|
| Share-based compensation expense in SG&A |
|
|
|
|
|
13 |
|
|
16 |
|
|
12 |
|
|
15 |
|
|
20 |
|
| Root warrant revenue |
|
|
|
|
|
— |
|
|
— |
|
|
(7) |
|
|
(5) |
|
|
(5) |
|
Restructuring (1) |
|
|
|
|
|
14 |
|
|
— |
|
|
43 |
|
|
4 |
|
|
3 |
|
| Adjusted EBITDA |
|
|
|
|
|
$ |
(216) |
|
|
$ |
(186) |
|
|
$ |
(291) |
|
|
$ |
(24) |
|
|
$ |
155 |
|
|
|
|
|
|
|
|
|
|
|
|
|
|
|
|
| Total revenues |
|
|
|
|
|
$ |
3,884 |
|
|
$ |
3,386 |
|
|
$ |
2,837 |
|
|
$ |
2,606 |
|
|
$ |
2,968 |
|
| Net loss margin |
|
|
|
|
|
(11.3) |
% |
|
(15.0) |
% |
|
(50.8) |
% |
|
(11.0) |
% |
|
(3.5) |
% |
| Adjusted EBITDA margin |
|
|
|
|
|
(5.6) |
% |
|
(5.5) |
% |
|
(10.3) |
% |
|
(0.9) |
% |
|
5.2 |
% |
|
|
|
|
|
|
|
|
|
|
|
|
|
|
|
| Gross profit |
|
|
|
|
|
$ |
396 |
|
|
$ |
359 |
|
|
$ |
193 |
|
|
$ |
341 |
|
|
$ |
499 |
|
| Depreciation and amortization expense in cost of sales |
|
|
|
|
|
27 |
|
|
36 |
|
|
43 |
|
|
44 |
|
|
44 |
|
| Share-based compensation expense in cost of sales |
|
|
|
|
|
6 |
|
|
2 |
|
|
— |
|
|
— |
|
|
— |
|
| Root warrant revenue |
|
|
|
|
|
— |
|
|
— |
|
|
(7) |
|
|
(5) |
|
|
(5) |
|
Restructuring (1) |
|
|
|
|
|
4 |
|
|
— |
|
|
3 |
|
|
— |
|
|
— |
|
| Gross profit, non-GAAP |
|
|
|
|
|
$ |
433 |
|
|
$ |
397 |
|
|
$ |
232 |
|
|
$ |
380 |
|
|
$ |
538 |
|
|
|
|
|
|
|
|
|
|
|
|
|
|
|
|
| Retail vehicle unit sales |
|
|
|
|
|
117,564 |
|
|
102,570 |
|
|
86,977 |
|
|
79,240 |
|
|
76,530 |
|
| Total gross profit per retail unit |
|
|
|
|
|
$ |
3,368 |
|
|
$ |
3,500 |
|
|
$ |
2,219 |
|
|
$ |
4,303 |
|
|
$ |
6,520 |
|
| Total gross profit per retail unit, non-GAAP |
|
|
|
|
|
$ |
3,683 |
|
|
$ |
3,870 |
|
|
$ |
2,667 |
|
|
$ |
4,796 |
|
|
$ |
7,030 |
|
|
|
|
|
|
|
|
|
|
|
|
|
|
|
|
| SG&A |
|
|
|
|
|
$ |
721 |
|
|
$ |
656 |
|
|
$ |
632 |
|
|
$ |
472 |
|
|
$ |
452 |
|
| Depreciation and amortization expense in SG&A |
|
|
|
|
|
49 |
|
|
57 |
|
|
57 |
|
|
49 |
|
|
46 |
|
| Share-based compensation expense in SG&A |
|
|
|
|
|
13 |
|
|
16 |
|
|
12 |
|
|
15 |
|
|
20 |
|
Restructuring (1) |
|
|
|
|
|
10 |
|
|
— |
|
|
40 |
|
|
4 |
|
|
3 |
|
| SG&A, non-GAAP |
|
|
|
|
|
$ |
649 |
|
|
$ |
583 |
|
|
$ |
523 |
|
|
$ |
404 |
|
|
$ |
383 |
|
|
|
|
|
|
|
|
|
|
|
|
|
|
|
|
| Retail vehicle unit sales |
|
|
|
|
|
117,564 |
|
|
102,570 |
|
|
86,977 |
|
|
79,240 |
|
|
76,530 |
|
| Total SG&A per retail unit |
|
|
|
|
|
$ |
6,133 |
|
|
$ |
6,396 |
|
|
$ |
7,266 |
|
|
$ |
5,957 |
|
|
$ |
5,906 |
|
| Total SG&A per retail unit, non-GAAP |
|
|
|
|
|
$ |
5,520 |
|
|
$ |
5,684 |
|
|
$ |
6,013 |
|
|
$ |
5,098 |
|
|
$ |
5,005 |
|
(1) Restructuring includes costs related to our May 2022 and November 2022 reductions in force, as well as lease termination and other restructuring expenses.
|
|
|
|
|
|
|
|
|
|
|
|
|
|
|
|
|
|
|
|
|
|
|
|
|
|
|
|
|
|
|
|
|
|
|
|
|
|
|
|
|
|
|
|
|
|
|
|
|
|
|
|
|
For the Year Ended |
|
For the Three Months Ended |
| (dollars in millions, except per unit amounts) |
|
|
|
|
|
Dec 31, 2021 |
|
Mar 31, 2022 |
|
Jun 30, 2022 |
|
Sep 30, 2022 |
|
Dec 31, 2022 |
|
Mar 31, 2023 |
|
Jun 30, 2023 |
| Retail gross profit |
|
|
|
|
|
$ |
697 |
|
|
$ |
85 |
|
|
$ |
133 |
|
|
$ |
116 |
|
|
$ |
37 |
|
|
$ |
110 |
|
|
$ |
204 |
|
| Depreciation and amortization expense in cost of sales |
|
|
|
|
|
20 |
|
|
7 |
|
|
11 |
|
|
12 |
|
|
15 |
|
|
16 |
|
|
15 |
|
| Share-based compensation expense in cost of sales |
|
|
|
|
|
— |
|
|
8 |
|
|
6 |
|
|
2 |
|
|
— |
|
|
— |
|
|
— |
|
Restructuring (1) |
|
|
|
|
|
— |
|
|
— |
|
|
4 |
|
|
— |
|
|
3 |
|
|
— |
|
|
— |
|
| Retail gross profit, non-GAAP |
|
|
|
|
|
$ |
717 |
|
|
$ |
100 |
|
|
$ |
154 |
|
|
$ |
130 |
|
|
$ |
55 |
|
|
$ |
126 |
|
|
$ |
219 |
|
|
|
|
|
|
|
|
|
|
|
|
|
|
|
|
|
|
|
|
| Retail vehicle unit sales |
|
|
|
|
|
425,237 |
|
|
105,185 |
|
|
117,564 |
|
|
102,570 |
|
|
86,977 |
|
|
79,240 |
|
|
76,530 |
|
| Retail gross profit per retail unit |
|
|
|
|
|
$ |
1,639 |
|
|
$ |
808 |
|
|
$ |
1,131 |
|
|
$ |
1,131 |
|
|
$ |
425 |
|
|
$ |
1,388 |
|
|
$ |
2,666 |
|
| Retail gross profit per retail unit, non-GAAP |
|
|
|
|
|
$ |
1,686 |
|
|
$ |
950 |
|
|
$ |
1,309 |
|
|
$ |
1,268 |
|
|
$ |
632 |
|
|
$ |
1,591 |
|
|
$ |
2,862 |
|
|
|
|
|
|
|
|
|
|
|
|
|
|
|
|
|
|
|
|
| Wholesale vehicle gross profit |
|
|
|
|
|
$ |
189 |
|
|
$ |
23 |
|
|
$ |
40 |
|
|
$ |
33 |
|
|
$ |
16 |
|
|
$ |
44 |
|
|
$ |
39 |
|
| Depreciation and amortization expense in cost of sales |
|
|
|
|
|
4 |
|
|
1 |
|
|
1 |
|
|
2 |
|
|
3 |
|
|
2 |
|
|
3 |
|
| Wholesale vehicle gross profit, non-GAAP |
|
|
|
|
|
$ |
193 |
|
|
$ |
24 |
|
|
$ |
41 |
|
|
$ |
35 |
|
|
$ |
19 |
|
|
$ |
46 |
|
|
$ |
42 |
|
|
|
|
|
|
|
|
|
|
|
|
|
|
|
|
|
|
|
|
| Retail vehicle unit sales |
|
|
|
|
|
425,237 |
|
|
105,185 |
|
|
117,564 |
|
|
102,570 |
|
|
86,977 |
|
|
79,240 |
|
|
76,530 |
|
| Wholesale vehicle gross profit per retail unit |
|
|
|
|
|
$ |
445 |
|
|
$ |
219 |
|
|
$ |
340 |
|
|
$ |
321 |
|
|
$ |
184 |
|
|
$ |
555 |
|
|
$ |
509 |
|
| Wholesale vehicle gross profit per retail unit, non-GAAP |
|
|
|
|
|
$ |
454 |
|
|
$ |
229 |
|
|
$ |
349 |
|
|
$ |
340 |
|
|
$ |
218 |
|
|
$ |
580 |
|
|
$ |
548 |
|
|
|
|
|
|
|
|
|
|
|
|
|
|
|
|
|
|
|
|
| Wholesale marketplace gross profit |
|
|
|
|
|
$ |
— |
|
|
$ |
— |
|
|
$ |
5 |
|
|
$ |
13 |
|
|
$ |
4 |
|
|
$ |
26 |
|
|
$ |
26 |
|
| Depreciation and amortization expense in cost of sales |
|
|
|
|
|
— |
|
|
— |
|
|
15 |
|
|
22 |
|
|
25 |
|
|
26 |
|
|
26 |
|
| Wholesale marketplace gross profit, non-GAAP |
|
|
|
|
|
$ |
— |
|
|
$ |
— |
|
|
$ |
20 |
|
|
$ |
35 |
|
|
$ |
29 |
|
|
$ |
52 |
|
|
$ |
52 |
|
|
|
|
|
|
|
|
|
|
|
|
|
|
|
|
|
|
|
|
| Retail vehicle unit sales |
|
|
|
|
|
425,237 |
|
|
105,185 |
|
|
117,564 |
|
|
102,570 |
|
|
86,977 |
|
|
79,240 |
|
|
76,530 |
|
| Wholesale marketplace gross profit per retail unit |
|
|
|
|
|
$ |
— |
|
|
$ |
— |
|
|
$ |
43 |
|
|
$ |
127 |
|
|
$ |
46 |
|
|
$ |
328 |
|
|
$ |
340 |
|
| Wholesale marketplace gross profit per retail unit, non-GAAP |
|
|
|
|
|
$ |
— |
|
|
$ |
— |
|
|
$ |
171 |
|
|
$ |
341 |
|
|
$ |
333 |
|
|
$ |
656 |
|
|
$ |
680 |
|
|
|
|
|
|
|
|
|
|
|
|
|
|
|
|
|
|
|
|
| Other gross profit |
|
|
|
|
|
$ |
1,043 |
|
|
$ |
190 |
|
|
$ |
218 |
|
|
$ |
197 |
|
|
$ |
136 |
|
|
$ |
161 |
|
|
$ |
230 |
|
| Root warrant revenue |
|
|
|
|
|
— |
|
|
— |
|
|
— |
|
|
— |
|
|
(7) |
|
|
(5) |
|
|
(5) |
|
| Other gross profit, non-GAAP |
|
|
|
|
|
$ |
1,043 |
|
|
$ |
190 |
|
|
$ |
218 |
|
|
$ |
197 |
|
|
$ |
129 |
|
|
$ |
156 |
|
|
$ |
225 |
|
|
|
|
|
|
|
|
|
|
|
|
|
|
|
|
|
|
|
|
| Retail vehicle unit sales |
|
|
|
|
|
425,237 |
|
|
105,185 |
|
|
117,564 |
|
|
102,570 |
|
|
86,977 |
|
|
79,240 |
|
|
76,530 |
|
| Other gross profit per retail unit |
|
|
|
|
|
$ |
2,453 |
|
|
$ |
1,806 |
|
|
$ |
1,854 |
|
|
$ |
1,921 |
|
|
$ |
1,564 |
|
|
$ |
2,032 |
|
|
$ |
3,005 |
|
| Other gross profit per retail unit, non-GAAP |
|
|
|
|
|
$ |
2,453 |
|
|
$ |
1,806 |
|
|
$ |
1,854 |
|
|
$ |
1,921 |
|
|
$ |
1,483 |
|
|
$ |
1,969 |
|
|
$ |
2,940 |
|
(1) Restructuring includes costs related to our May 2022 and November 2022 reductions in force.
|
|
|
|
|
|
|
|
|
|
|
|
|
|
|
|
|
|
|
|
|
|
|
|
|
|
|
|
|
|
|
|
|
|
|
|
|
|
|
|
|
|
|
|
|
|
|
|
|
|
|
|
|
For the Years Ended December 31, |
| (dollars in millions, except per unit amounts) |
|
|
|
|
|
2016 |
|
2017 |
|
2018 |
|
2019 |
|
2020 |
|
2021 |
|
2022 |
| Net loss |
|
|
|
|
|
$ |
(93) |
|
|
$ |
(164) |
|
|
$ |
(255) |
|
|
$ |
(365) |
|
|
$ |
(462) |
|
|
$ |
(287) |
|
|
$ |
(2,894) |
|
| Income tax provision |
|
|
|
|
|
— |
|
|
— |
|
|
— |
|
|
— |
|
|
— |
|
|
1 |
|
|
1 |
|
| Interest expense |
|
|
|
|
|
4 |
|
|
8 |
|
|
25 |
|
|
81 |
|
|
131 |
|
|
176 |
|
|
486 |
|
| Other (income) expense, net |
|
|
|
|
|
— |
|
|
1 |
|
|
1 |
|
|
4 |
|
|
(1) |
|
|
6 |
|
|
70 |
|
| Depreciation and amortization expense in cost of sales |
|
|
|
|
|
— |
|
|
— |
|
|
— |
|
|
— |
|
|
10 |
|
|
24 |
|
|
114 |
|
| Depreciation and amortization expense in SG&A |
|
|
|
|
|
4 |
|
|
11 |
|
|
24 |
|
|
41 |
|
|
74 |
|
|
105 |
|
|
200 |
|
| Goodwill impairment |
|
|
|
|
|
— |
|
|
— |
|
|
— |
|
|
— |
|
|
— |
|
|
— |
|
|
847 |
|
| Share-based compensation expense in cost of sales |
|
|
|
|
|
— |
|
|
— |
|
|
4 |
|
|
5 |
|
|
1 |
|
|
— |
|
|
16 |
|
| Share-based compensation expense in SG&A |
|
|
|
|
|
1 |
|
|
6 |
|
|
21 |
|
|
30 |
|
|
25 |
|
|
39 |
|
|
69 |
|
| Root warrant revenue |
|
|
|
|
|
— |
|
|
— |
|
|
— |
|
|
— |
|
|
— |
|
|
— |
|
|
(7) |
|
Restructuring (1) |
|
|
|
|
|
— |
|
|
— |
|
|
— |
|
|
— |
|
|
— |
|
|
— |
|
|
57 |
|
| Adjusted EBITDA |
|
|
|
|
|
$ |
(84) |
|
|
$ |
(138) |
|
|
$ |
(180) |
|
|
$ |
(204) |
|
|
$ |
(222) |
|
|
$ |
64 |
|
|
$ |
(1,041) |
|
|
|
|
|
|
|
|
|
|
|
|
|
|
|
|
|
|
|
|
| Total revenues |
|
|
|
|
|
$ |
365 |
|
|
$ |
859 |
|
|
$ |
1,955 |
|
|
$ |
3,940 |
|
|
$ |
5,587 |
|
|
$ |
12,814 |
|
|
$ |
13,604 |
|
| Net loss margin |
|
|
|
|
|
(25.5) |
% |
|
(19.1) |
% |
|
(13.0) |
% |
|
(9.3) |
% |
|
(8.3) |
% |
|
(2.2) |
% |
|
(21.3) |
% |
| Adjusted EBITDA margin |
|
|
|
|
|
(23.0) |
% |
|
(16.1) |
% |
|
(9.2) |
% |
|
(5.2) |
% |
|
(4.0) |
% |
|
0.5 |
% |
|
(7.7) |
% |
|
|
|
|
|
|
|
|
|
|
|
|
|
|
|
|
|
|
|
| Gross profit |
|
|
|
|
|
$ |
19 |
|
|
$ |
68 |
|
|
$ |
197 |
|
|
$ |
506 |
|
|
$ |
794 |
|
|
$ |
1,929 |
|
|
$ |
1,246 |
|
| Depreciation and amortization expense in cost of sales |
|
|
|
|
|
— |
|
|
— |
|
|
— |
|
|
— |
|
|
10 |
|
|
24 |
|
|
114 |
|
| Share-based compensation expense in cost of sales |
|
|
|
|
|
— |
|
|
— |
|
|
4 |
|
|
5 |
|
|
1 |
|
|
— |
|
|
16 |
|
| Root warrant revenue |
|
|
|
|
|
— |
|
|
— |
|
|
— |
|
|
— |
|
|
— |
|
|
— |
|
|
(7) |
|
Restructuring (1) |
|
|
|
|
|
— |
|
|
— |
|
|
— |
|
|
— |
|
|
— |
|
|
— |
|
|
7 |
|
| Gross profit, non-GAAP |
|
|
|
|
|
$ |
19 |
|
|
$ |
68 |
|
|
$ |
201 |
|
|
$ |
511 |
|
|
$ |
805 |
|
|
$ |
1,953 |
|
|
$ |
1,376 |
|
|
|
|
|
|
|
|
|
|
|
|
|
|
|
|
|
|
|
|
| Retail vehicle unit sales |
|
|
|
|
|
18,761 |
|
|
44,252 |
|
|
94,108 |
|
|
177,549 |
|
|
244,111 |
|
|
425,237 |
|
|
412,296 |
|
| Total gross profit per retail unit |
|
|
|
|
|
$ |
1,023 |
|
|
$ |
1,539 |
|
|
$ |
2,090 |
|
|
$ |
2,852 |
|
|
$ |
3,253 |
|
|
$ |
4,537 |
|
|
$ |
3,022 |
|
| Total gross profit per retail unit, non-GAAP |
|
|
|
|
|
$ |
1,013 |
|
|
$ |
1,537 |
|
|
$ |
2,136 |
|
|
$ |
2,878 |
|
|
$ |
3,298 |
|
|
$ |
4,593 |
|
|
$ |
3,337 |
|
|
|
|
|
|
|
|
|
|
|
|
|
|
|
|
|
|
|
|
| SG&A |
|
|
|
|
|
$ |
109 |
|
|
$ |
223 |
|
|
$ |
425 |
|
|
$ |
787 |
|
|
$ |
1,126 |
|
|
$ |
2,033 |
|
|
$ |
2,736 |
|
| Depreciation and amortization expense in SG&A |
|
|
|
|
|
4 |
|
|
11 |
|
|
24 |
|
|
41 |
|
|
74 |
|
|
105 |
|
|
200 |
|
| Share-based compensation expense in SG&A |
|
|
|
|
|
1 |
|
|
6 |
|
|
21 |
|
|
30 |
|
|
25 |
|
|
39 |
|
|
69 |
|
Restructuring (1) |
|
|
|
|
|
— |
|
|
— |
|
|
— |
|
|
— |
|
|
— |
|
|
— |
|
|
50 |
|
| SG&A, non-GAAP |
|
|
|
|
|
$ |
104 |
|
|
$ |
206 |
|
|
$ |
380 |
|
|
$ |
716 |
|
|
$ |
1,027 |
|
|
$ |
1,889 |
|
|
$ |
2,417 |
|
|
|
|
|
|
|
|
|
|
|
|
|
|
|
|
|
|
|
|
| Retail vehicle unit sales |
|
|
|
|
|
18,761 |
|
|
44,252 |
|
|
94,108 |
|
|
177,549 |
|
|
244,111 |
|
|
425,237 |
|
|
412,296 |
|
| Total SG&A per retail unit |
|
|
|
|
|
$ |
5,810 |
|
|
$ |
5,039 |
|
|
$ |
4,516 |
|
|
$ |
4,433 |
|
|
$ |
4,613 |
|
|
$ |
4,781 |
|
|
$ |
6,636 |
|
| Total SG&A per retail unit, non-GAAP |
|
|
|
|
|
$ |
5,543 |
|
|
$ |
4,655 |
|
|
$ |
4,038 |
|
|
$ |
4,033 |
|
|
$ |
4,207 |
|
|
$ |
4,442 |
|
|
$ |
5,862 |
|
(1) Restructuring includes costs related to our May 2022 and November 2022 reductions in force, as well as lease termination and other restructuring expenses.
|
|
|
|
|
|
|
|
|
|
|
|
|
|
|
|
|
|
|
|
|
|
|
|
|
|
|
|
|
|
|
|
|
|
|
|
|
|
|
|
|
|
|
|
|
|
|
|
|
|
|
|
|
|
|
|
|
|
|
|
|
|
|
|
|
|
|
|
|
|
|
For the Three Months Ended June 30, |
| (dollars in millions, except per unit amounts) |
|
|
|
|
|
2014 |
|
2015 |
|
2016 |
|
2017 |
|
2018 |
|
2019 |
|
2020 |
|
2021 |
|
2022 |
|
2023 |
| Net loss |
|
|
|
|
|
$ |
(3) |
|
|
$ |
(8) |
|
|
$ |
(18) |
|
|
$ |
(39) |
|
|
$ |
(51) |
|
|
$ |
(64) |
|
|
$ |
(106) |
|
|
$ |
45 |
|
|
$ |
(439) |
|
|
$ |
(105) |
|
| Income tax benefit |
|
|
|
|
|
— |
|
|
— |
|
|
— |
|
|
— |
|
|
— |
|
|
— |
|
|
— |
|
|
— |
|
|
1 |
|
|
— |
|
| Interest expense |
|
|
|
|
|
— |
|
|
— |
|
|
1 |
|
|
3 |
|
|
4 |
|
|
19 |
|
|
20 |
|
|
43 |
|
|
116 |
|
|
155 |
|
| Other (income) expense, net |
|
|
|
|
|
— |
|
|
— |
|
|
— |
|
|
— |
|
|
— |
|
|
1 |
|
|
(3) |
|
|
(6) |
|
|
(3) |
|
|
(3) |
|
| Depreciation and amortization expense in cost of sales |
|
|
|
|
|
— |
|
|
— |
|
|
— |
|
|
— |
|
|
— |
|
|
— |
|
|
2 |
|
|
6 |
|
|
27 |
|
|
44 |
|
| Depreciation and amortization expense in SG&A |
|
|
|
|
|
— |
|
|
1 |
|
|
1 |
|
|
3 |
|
|
5 |
|
|
9 |
|
|
17 |
|
|
24 |
|
|
49 |
|
|
46 |
|
|
|
|
|
|
|
|
|
|
|
|
|
|
|
|
|
|
|
|
|
|
|
|
|
|
| Share-based compensation expense in cost of sales |
|
|
|
|
|
— |
|
|
— |
|
|
— |
|
|
— |
|
|
— |
|
|
2 |
|
|
— |
|
|
— |
|
|
6 |
|
|
— |
|
| Share-based compensation expense in SG&A |
|
|
|
|
|
— |
|
|
— |
|
|
— |
|
|
2 |
|
|
3 |
|
|
7 |
|
|
6 |
|
|
9 |
|
|
13 |
|
|
20 |
|
| Root warrant revenue |
|
|
|
|
|
— |
|
|
— |
|
|
— |
|
|
— |
|
|
— |
|
|
— |
|
|
— |
|
|
— |
|
|
— |
|
|
(5) |
|
| Restructuring |
|
|
|
|
|
— |
|
|
— |
|
|
— |
|
|
— |
|
|
— |
|
|
— |
|
|
— |
|
|
— |
|
|
14 |
|
|
3 |
|
| Adjusted EBITDA |
|
|
|
|
|
$ |
(3) |
|
|
$ |
(7) |
|
|
$ |
(16) |
|
|
$ |
(31) |
|
|
$ |
(39) |
|
|
$ |
(26) |
|
|
$ |
(64) |
|
|
$ |
121 |
|
|
$ |
(216) |
|
|
$ |
155 |
|
|
|
|
|
|
|
|
|
|
|
|
|
|
|
|
|
|
|
|
|
|
|
|
|
|
| Total revenues |
|
|
|
|
|
$ |
9 |
|
|
$ |
29 |
|
|
$ |
87 |
|
|
$ |
209 |
|
|
$ |
475 |
|
|
$ |
986 |
|
|
$ |
1,118 |
|
|
$ |
3,336 |
|
|
$ |
3,884 |
|
|
$ |
2,968 |
|
| Net loss margin |
|
|
|
|
|
(29.6) |
% |
|
(26.7) |
% |
|
(20.9) |
% |
|
(18.6) |
% |
|
(10.8) |
% |
|
(6.5) |
% |
|
(9.5) |
% |
|
1.3 |
% |
|
(11.3) |
% |
|
(3.5) |
% |
| Adjusted EBITDA margin |
|
|
|
|
|
(25.5) |
% |
|
(22.7) |
% |
|
(18.7) |
% |
|
(15.0) |
% |
|
(8.2) |
% |
|
(2.7) |
% |
|
(5.4) |
% |
|
3.6 |
% |
|
(5.6) |
% |
|
5.2 |
% |
|
|
|
|
|
|
|
|
|
|
|
|
|
|
|
|
|
|
|
|
|
|
|
|
|
| Gross profit |
|
|
|
|
|
$ |
— |
|
|
$ |
— |
|
|
$ |
6 |
|
|
$ |
16 |
|
|
$ |
49 |
|
|
$ |
138 |
|
|
$ |
150 |
|
|
$ |
552 |
|
|
$ |
396 |
|
|
$ |
499 |
|
| Depreciation and amortization expense in cost of sales |
|
|
|
|
|
— |
|
|
— |
|
|
— |
|
|
— |
|
|
— |
|
|
— |
|
|
2 |
|
|
6 |
|
|
27 |
|
|
44 |
|
| Share-based compensation expense in cost of sales |
|
|
|
|
|
— |
|
|
— |
|
|
— |
|
|
— |
|
|
— |
|
|
2 |
|
|
— |
|
|
— |
|
|
6 |
|
|
— |
|
| Root warrant revenue |
|
|
|
|
|
— |
|
|
— |
|
|
— |
|
|
— |
|
|
— |
|
|
— |
|
|
— |
|
|
— |
|
|
— |
|
|
(5) |
|
| Restructuring |
|
|
|
|
|
|
|
|
|
|
|
— |
|
|
— |
|
|
— |
|
|
— |
|
|
— |
|
|
4 |
|
|
— |
|
| Gross profit, non-GAAP |
|
|
|
|
|
$ |
— |
|
|
$ |
— |
|
|
$ |
6 |
|
|
$ |
16 |
|
|
$ |
49 |
|
|
$ |
140 |
|
|
$ |
152 |
|
|
$ |
558 |
|
|
$ |
433 |
|
|
$ |
538 |
|
|
|
|
|
|
|
|
|
|
|
|
|
|
|
|
|
|
|
|
|
|
|
|
|
|
| Retail vehicle unit sales |
|
|
|
|
|
436 |
|
|
1,343 |
|
|
4,355 |
|
|
10,682 |
|
|
22,570 |
|
|
44,000 |
|
|
55,098 |
|
|
107,815 |
|
|
117,564 |
|
|
76,530 |
|
| Total gross profit per retail unit |
|
|
|
|
|
$ |
388 |
|
|
$ |
309 |
|
|
$ |
1,386 |
|
|
$ |
1,502 |
|
|
$ |
2,173 |
|
|
$ |
3,132 |
|
|
$ |
2,726 |
|
|
$ |
5,120 |
|
|
$ |
3,368 |
|
|
$ |
6,520 |
|
| Total gross profit per retail unit, non-GAAP |
|
|
|
|
|
$ |
388 |
|
|
$ |
309 |
|
|
$ |
1,386 |
|
|
$ |
1,502 |
|
|
$ |
2,173 |
|
|
$ |
3,173 |
|
|
$ |
2,765 |
|
|
$ |
5,176 |
|
|
$ |
3,683 |
|
|
$ |
7,030 |
|
|
|
|
|
|
|
|
|
|
|
|
|
|
|
|
|
|
|
|
|
|
|
|
|
|
| SG&A |
|
|
|
|
|
$ |
3 |
|
|
$ |
8 |
|
|
$ |
24 |
|
|
$ |
52 |
|
|
$ |
95 |
|
|
$ |
183 |
|
|
$ |
239 |
|
|
$ |
470 |
|
|
$ |
721 |
|
|
$ |
452 |
|
| Depreciation and amortization expense in SG&A |
|
|
|
|
|
— |
|
|
1 |
|
|
1 |
|
|
3 |
|
|
5 |
|
|
9 |
|
|
17 |
|
|
24 |
|
|
49 |
|
|
46 |
|
| Share-based compensation expense in SG&A |
|
|
|
|
|
— |
|
|
— |
|
|
— |
|
|
2 |
|
|
3 |
|
|
7 |
|
|
6 |
|
|
9 |
|
|
13 |
|
|
20 |
|
| Restructuring |
|
|
|
|
|
— |
|
|
— |
|
|
— |
|
|
— |
|
|
— |
|
|
— |
|
|
— |
|
|
— |
|
|
10 |
|
|
3 |
|
| SG&A, non-GAAP |
|
|
|
|
|
$ |
3 |
|
|
$ |
7 |
|
|
$ |
23 |
|
|
$ |
47 |
|
|
$ |
87 |
|
|
$ |
167 |
|
|
$ |
216 |
|
|
$ |
437 |
|
|
$ |
649 |
|
|
$ |
383 |
|
|
|
|
|
|
|
|
|
|
|
|
|
|
|
|
|
|
|
|
|
|
|
|
|
|
| Retail vehicle unit sales |
|
|
|
|
|
436 |
|
|
1,343 |
|
|
4,355 |
|
|
10,682 |
|
|
22,570 |
|
|
44,000 |
|
|
55,098 |
|
|
107,815 |
|
|
117,564 |
|
|
76,530 |
|
| Total SG&A per retail unit |
|
|
|
|
|
$ |
6,791 |
|
|
$ |
5,675 |
|
|
$ |
5,360 |
|
|
$ |
4,869 |
|
|
$ |
4,238 |
|
|
$ |
4,133 |
|
|
$ |
4,355 |
|
|
$ |
4,359 |
|
|
$ |
6,133 |
|
|
$ |
5,906 |
|
| Total SG&A per retail unit, non-GAAP |
|
|
|
|
|
$ |
5,923 |
|
|
$ |
5,141 |
|
|
$ |
5,109 |
|
|
$ |
4,440 |
|
|
$ |
3,891 |
|
|
$ |
3,767 |
|
|
$ |
3,922 |
|
|
$ |
4,053 |
|
|
$ |
5,520 |
|
|
$ |
5,005 |
|
|
|
|
|
|
|
|
|
|
|
|
|
|
|
|
|
|
|
|
|
|
|
|
|
|
|
|
|
|
|
|
|
|
|
|
|
|
|
|
|
|
|
|
|
|
|
|
|
|
|