UNITED STATES
SECURITIES AND EXCHANGE COMMISSION
Washington, D.C. 20549
FORM 8-K
CURRENT REPORT
Pursuant to Section 13 OR 15(d) of the
Securities Exchange Act of 1934
Date of Report (Date of earliest event reported): July 11, 2024
DELTA AIR LINES, INC.
(Exact name of registrant as specified in its charter)
| Delaware | 001-05424 | 58-0218548 | ||
| (State or other jurisdiction of incorporation) |
(Commission File Number) |
(IRS Employer Identification No.) |
P.O. Box 20706, Atlanta, Georgia 30320-6001
(Address of principal executive offices)
Registrant’s telephone number, including area code: (404) 715-2600
Registrant’s Web site address: www.delta.com
Check the appropriate box below if the Form 8-K filing is intended to simultaneously satisfy the filing obligation of the registrant under any of the following provisions (see General Instruction A.2. below):
☐ Written communications pursuant to Rule 425 under the Securities Act (17 CFR 230.425)
☐ Soliciting material pursuant to Rule 14a-12 under the Exchange Act (17 CFR 240.14a-12)
☐ Pre-commencement communications pursuant to Rule 14d-2(b) under the Exchange Act (17 CFR 240.14d-2(b))
☐ Pre-commencement communications pursuant to Rule 13e-4(c) under the Exchange Act (17 CFR 240.13e-4(c))
Securities registered pursuant to Section 12(b) of the Act:
| Title of each class | Trading Symbol | Name of each exchange on which registered |
| Common Stock, par value $0.0001 per share | DAL | New York Stock Exchange |
Indicate by check mark whether the registrant is an emerging growth company as defined in Rule 405 of the Securities Act of 1933 (17 CFR 230.405) or Rule 12b-2 of the Securities Exchange Act of 1934 (17 CFR 240.12b-2).
Emerging growth company ☐
If an emerging growth company, indicate by check mark if the registrant has elected not to use the extended transition period for complying with any new or revised financial accounting standards provided pursuant to Section 13(a) of the Exchange Act. ☐
|
|
| Item 2.02 | Results of Operations and Financial Condition. |
Delta Air Lines, Inc. today issued a press release reporting financial results for the quarter ended June 30, 2024. The press release is furnished as Exhibit 99.1 to this Form 8-K. In addition, a summary containing supplemental information is being furnished as Exhibit 99.2 to this Form 8-K.
The information furnished in this Form 8-K, including Exhibits 99.1 and 99.2 attached hereto, shall not be deemed incorporated by reference into any other filing with the Securities and Exchange Commission.
| Item 9.01 | Financial Statements and Exhibits. |
(d) Exhibits.
| Exhibit 99.1 | Press Release dated July 11, 2024 titled “Delta Air Lines Announces June Quarter 2024 Financial Results” |
| Exhibit 99.2 | Supplemental Information |
| Exhibit 104 | The cover page from this Current Report on Form 8-K, formatted in Inline XBRL |
|
|
SIGNATURES
Pursuant to the requirements of the Securities Exchange Act of 1934, the registrant has duly caused this report to be signed on its behalf by the undersigned hereunto duly authorized.
| DELTA AIR LINES, INC. | ||
| By: | /s/ Daniel C. Janki | |
| Daniel C. Janki | ||
| Executive Vice President & Chief Financial Officer | ||
July 11, 2024
|
|
Exhibit 99.1

| CONTACT: | Investor Relations | Corporate Communications |
| 404-715-2170 | 404-715-2554 | |
| InvestorRelations@delta.com | Media@delta.com |
Delta Air Lines Announces June Quarter 2024 Financial Results
Delivered industry-leading operational performance, underpinning trusted brand and customer loyalty
Record June quarter revenue with mid-teens operating margin and strong cash generation
Continued debt repayment, progressing balance sheet toward investment grade metrics
Announced a 50 percent increase to dividend payment beginning in September quarter
Reiterating full year guide for EPS of $6 to $7 and free cash flow of $3 to $4 billion
ATLANTA, July 11, 2024 – Delta Air Lines (NYSE: DAL) today reported financial results for the June quarter and provided its outlook for the September quarter. Highlights of the June quarter, including both GAAP and adjusted metrics, are on page five and incorporated here.
“Thanks to the incredible work of our 100,000 people, Delta is delivering industry-leading operational performance and best-in-class service for our customers. We delivered record June quarter revenue and pre-tax income of $2 billion with a 15 percent operating margin. Our people are the best in the industry, and we are pleased to recognize their efforts with more than $640 million accrued in the first half toward next year's profit sharing," said Ed Bastian, Delta’s chief executive officer.
"For the September quarter, we expect a double-digit operating margin and a pre-tax profit of approximately $1.5 billion. With strong first half results and visibility into the second half, we remain confident in our full-year guidance."
June Quarter 2024 GAAP Financial Results
| • | Operating revenue of $16.7 billion | |
| • | Operating income of $2.3 billion with an operating margin of 13.6 percent | |
| • | Pre-tax income of $1.8 billion with a pre-tax margin of 10.6 percent | |
| • | Earnings per share of $2.01 | |
| • | Operating cash flow of $2.5 billion | |
| • | Payments on debt and finance lease obligations of $1.4 billion | |
| • | Total debt and finance lease obligations of $18.0 billion at quarter end |
June Quarter 2024 Adjusted Financial Results
| • | Operating revenue of $15.4 billion, 5.4 percent higher than the June quarter 2023 | |
| • | Operating income of $2.3 billion with an operating margin of 14.7 percent | |
| • | Pre-tax income of $2.0 billion with a pre-tax margin of 13.0 percent | |
| • | Earnings per share of $2.36 | |
| • | Operating cash flow of $2.5 billion | |
| • | Free cash flow of $1.3 billion | |
| • | Adjusted debt to EBITDAR of 2.8x, down from 3.0x at the end of 2023 | |
| • | Return on invested capital of 13.1 percent |
|
|
Financial Guidance1
| FY 2024 Forecast | ||
| Earnings Per Share | $6 - $7 | |
| Free Cash Flow ($B) | $3 - $4 | |
| Adjusted Debt to EBITDAR | 2x - 3x |
| 3Q24 Forecast | ||
| Total Revenue YoY | Up 2% - 4% | |
| Operating Margin | 11% - 13% | |
| Earnings Per Share | $1.70 - $2.00 | |
|
1Non-GAAP measures; Refer to Non-GAAP reconciliations for historical comparison figures |
||
Additional metrics for financial modeling can be found in the Supplemental Information section under Quarterly Results on ir.delta.com.
Revenue Environment and Outlook
“Peak summer travel demand remains strong and Delta is delivering elevated experiences for our customers. Consistent with our guidance, we generated record June quarter revenue 5.4 percent higher than the prior year. Diverse revenue streams, including premium and loyalty, contributed higher growth and margins, underpinning Delta’s industry-leading financial performance and increasing our financial durability,” said Glen Hauenstein, Delta’s president.
“As our international network and core hubs approach full restoration and we return to a normal cadence of retiring aircraft, Delta’s capacity growth is decelerating into the second half. We expect September quarter capacity growth of 5 to 6 percent and revenue growth of 2 to 4 percent, with sequential improvement in unit revenue trends through the quarter.”
| • | Record June quarter revenue with leading operational performance: Delta delivered June quarter revenue that was 5.4 percent higher than 2023, driven by strong demand and best-in-class operations. Year to date, Delta has led the industry in completion factor and on-time performance, and operated 39 cancel-free, brand-perfect days. Adjusted total unit revenue (TRASM) was down 2.6 percent from the prior year. | |
| • | Revenue diversification driving Delta's differentiation: Premium, loyalty and other diversified revenue streams comprised 56 percent of total revenue. Premium revenue grew 10 percent versus the June quarter 2023, with premium unit revenues positive year-over-year. Loyalty revenue was up 8 percent, driven by co-brand spend growth and increasing premium card mix. Remuneration from American Express for the June quarter was $1.9 billion, approximately 9 percent higher than 2023. Cargo revenue grew 16 percent year-over-year, a significant improvement from prior trends. | |
| • | Corporate travel demand grew at double-digit levels: Managed corporate travel volumes* have grown double-digits for six consecutive months, with broad-based demand as all sectors increased year-over-year. Recent corporate survey results indicate that 90 percent of companies expect their travel volumes to increase or stay the same in the September quarter and beyond. | |
| • | International performance built on record 2023: International passenger revenue was 4 percent higher than June quarter of 2023. Demand across the Transatlantic remains very strong, with unit revenue in line with last year's record performance excluding the impact from the summer Olympics in Paris. Pacific and Latin America accounted for the majority of international capacity growth on continued network restoration and improving connectivity with our JV partners. |
*Corporate travel volumes represent the number of tickets sold to corporate contracted customers, including tickets for travel during and beyond the referenced time period
|
|
Cost Performance and Outlook
“For the June quarter, we came in at the midpoint of our guidance with earnings of $2.36 per share. Delta's operational excellence drove an incremental point of capacity growth and unit cost favorability, with non-fuel unit costs 0.6 percent higher than last year,” said Dan Janki, Delta’s chief financial officer. “Growth continues to normalize and our teams are consistently running a great operation, enabling us to deliver efficiency. In the September quarter, we expect non-fuel unit costs to increase 1 to 2 percent year-over-year as capacity growth moderates.”
June Quarter 2024 Cost Performance
| • | Operating expense of $14.4 billion and adjusted operating expense of $13.1 billion | |
| • | Adjusted non-fuel costs of $9.8 billion | |
| • | Non-fuel CASM was 13.14¢, an increase of 0.6 percent year-over-year | |
| • | Adjusted fuel expense of $2.8 billion was up 12 percent year-over-year | |
| • | Adjusted fuel price of $2.64 per gallon increased 5 percent year-over-year with a refinery benefit of 6¢ per gallon | |
| • | Fuel efficiency, defined as gallons per 1,000 ASMs, was 14.3, a 1.1 percent improvement year-over-year |
Balance Sheet, Cash and Liquidity
“Through the first half of the year, Delta delivered $2.7 billion in free cash flow, enabling $2.1 billion in debt repayment and a 50 percent increase in our quarterly dividend beginning in the September quarter,” Janki said. “Debt reduction remains our top financial priority and we are progressing toward investment grade ratings, with gross leverage improving to 2.8x at the end of the first half.”
| • | Adjusted net debt of $19.2 billion at June quarter end, a reduction of $2.3 billion from the end of 2023 | |
| • | Payments on debt and finance lease obligations for the June quarter of $1.4 billion | |
| • | Weighted average interest rate of 4.3 percent with 94 percent fixed rate debt and 6 percent variable rate debt | |
| • | Adjusted operating cash flow in the June quarter of $2.5 billion, and with gross capital expenditures of $1.2 billion, free cash flow was $1.3 billion | |
| • | Air Traffic Liability ended the quarter at $9.4 billion, up $2.4 billion compared to the end of 2023 |
|
|
June Quarter 2024 Highlights
Operations, Network and Fleet
| • | Named best U.S. airline by The Points Guy for the sixth consecutive year based on operational reliability, customer experience, network, cost and loyalty offerings | |
| • | Accepted the 2024 Airline of the Year award from aviation publication Air Transport World for Delta’s outstanding operational performance, commitment to safety and premium customer service | |
| • | Operated the most reliable airline among our competitors, leading on all key metrics, including completion factor, and on-time departures and arrivals1 | |
| • | Took delivery of 11 aircraft in the June quarter, bringing the total year-to-date to 18, including the A321neo, A220-300 and A350-900 | |
| • | Announced an agreement with Riyadh Air to build a partnership that will expand connectivity and premium travel options across North America, the Kingdom of Saudi Arabia and beyond, including future Delta service between the U.S. and King Khalid International Airport in Riyadh | |
| • | Implemented the largest ever international summer schedule in Delta's history with more than 1,700 weekly flights to 80 international destinations | |
| • | Announced the offering of Delta Premium Select on select JFK-LAX flights beginning in September | |
| • | Launched a new route from Seattle to Taipei in June, further expanding Delta’s network in Asia | |
| • | Announced two new routes between Florida and Europe with the October launch of Tampa to Amsterdam and Orlando to London, and resumed daily nonstop service to Tel Aviv from JFK in June | |
| • | Delta TechOps was named Best Total Solutions Provider by The145 in their 2024 Top Shop Awards, and honored with a 2024 Grand Laureate Award by Aviation Week Network |
Culture and People
| • | Accrued $519 million in profit sharing in the June quarter, resulting in $644 million accrued year-to-date | |
| • | Provided a 5 percent base pay increase for eligible employees worldwide, effective June 1, 2024, maintaining our philosophy of industry-leading pay for industry-leading performance | |
| • | Named No. 4 in the Fortune ReturnOnLeadership® ranking of the top 100 companies in the Fortune 500 based on strategic clarity, leadership alignment, connection to purpose and focused action, the only airline included in the top 5 rankings | |
| • | Named to Glassdoor’s Best Led Companies list, the only airline to make the list | |
| • | Delta was honored to partner with the Best Defense Foundation to charter a flight for 48 WWII veterans back to Normandy, France to commemorate the 80th anniversary of D-Day | |
| • | Recognized as the No. 1 corporate blood drive sponsor with the American Red Cross for the seventh consecutive year with a record 15,585 units of blood collected at 373 blood drives in the last 12 months |
Customer Experience and Loyalty
| • | Top-ranked airline by J.D. Power for First Class/Business and Premium Economy passenger satisfaction | |
| • | Named Best Airline in North America for a fourth consecutive year and ranked No. 1 for Best Airline Staff for a third consecutive year at the Skytrax World Airline Awards | |
| • | Unveiled the new Delta One Lounge in JFK, the first of its kind, and spanning 40,000 square feet. The club is the largest and most premium club in Delta’s network, offering customers a variety of experiences and amenities from fine dining to spa-like wellness treatments and valet services | |
| • | Announced a partnership with Italian luxury brand Missoni to bring new amenity kits to Delta One passengers, available mid-July on select flights to Italy and Paris before launching worldwide in September | |
| • | Enhanced Delta Sky Clubs across the system with expansions at Miami and LaGuardia airports | |
| • | Continued to roll out fast, free Wi-Fi for SkyMiles members across the fleet, bringing the total number of aircraft equipped to more than 690 | |
| • | Introduced refreshed menus onboard across all cabins for the summer, including recipes from award-winning chefs around the world | |
| • | Launched the limited edition Boeing 747 Delta SkyMiles Reserve Card, made from retired Delta aircraft |
Environmental, Social and Governance
| • | Issued Delta’s 2023 ESG Report, which shows how Delta is prioritizing safety and investing in its people and local communities, all while advancing a more sustainable future of travel | |
| • | Hosted “Rising with Resilience,” the inaugural convening of cross-divisional diversity, equity and inclusion (DEI) leaders, influencers and allies | |
| • | Recognized by the Port of Seattle through its Sustainable Century Awards program as having the highest percentage of fuel-efficient aircraft in use at Seattle-Tacoma International Airport | |
| • | Joined a collaborative project between Hartsfield-Jackson Atlanta International Airport, Airbus and Plug Power to assess the feasibility of hydrogen fueling at the world's busiest airport |
1FlightStats preliminary data for Delta flights mainline system and for Delta's competitive set (AA, UA, B6, AS, WN, and DL), from Apr 1 - June 30, 2024. On-time is defined as A0.
|
|
June Quarter 2024 Results
June quarter results have been adjusted primarily for the third-party refinery sales, unrealized gains/losses on investments and loss on extinguishment of debt as described in the reconciliations in Note A.
| GAAP | $ | % | ||||||||||||||
| ($ in millions except per share and unit costs) | 2Q24 | 2Q23 | Change | Change | ||||||||||||
| Operating income | 2,267 | 2,491 | (224 | ) | (9 | )% | ||||||||||
| Operating margin | 13.6 | % | 16.0 | % | (2.4 | ) pts | (15 | )% | ||||||||
| Pre-tax income | 1,773 | 2,317 | (544 | ) | (23 | )% | ||||||||||
| Pre-tax margin | 10.6 | % | 14.9 | % | (4.3 | ) pts | (29 | )% | ||||||||
| Net income | 1,305 | 1,827 | (522 | ) | (29 | )% | ||||||||||
| Diluted earnings per share | 2.01 | 2.84 | (0.83 | ) | (29 | )% | ||||||||||
| Operating revenue | 16,658 | 15,578 | 1,080 | 7 | % | |||||||||||
| Total revenue per available seat mile (TRASM) (cents) | 22.31 | 22.58 | (0.27 | ) | (1 | )% | ||||||||||
| Operating expense | 14,391 | 13,087 | 1,304 | 10 | % | |||||||||||
| Cost per available seat mile (CASM) (cents) | 19.28 | 18.97 | 0.31 | 2 | % | |||||||||||
| Fuel expense | 2,813 | 2,516 | 297 | 12 | % | |||||||||||
| Average fuel price per gallon | 2.64 | 2.52 | 0.12 | 5 | % | |||||||||||
| Operating cash flow | 2,450 | 2,609 | (159 | ) | (6 | )% | ||||||||||
| Capital expenditures | 1,308 | 1,452 | (144 | ) | (10 | )% | ||||||||||
| Total debt and finance lease obligations | 17,983 | 20,205 | (2,222 | ) | (11 | )% | ||||||||||
| Adjusted | $ | % | ||||||||||||||
| ($ in millions except per share and unit costs) | 2Q24 | 2Q23 | Change | Change | ||||||||||||
| Operating income | 2,269 | 2,494 | (225 | ) | (9 | )% | ||||||||||
| Operating margin | 14.7 | % | 17.1 | % | (2.3 | ) pts | (14 | )% | ||||||||
| Pre-tax income | 2,002 | 2,220 | (218 | ) | (10 | )% | ||||||||||
| Pre-tax margin | 13.0 | % | 15.2 | % | (2.2 | ) pts | (14 | )% | ||||||||
| Net income | 1,528 | 1,723 | (195 | ) | (11 | )% | ||||||||||
| Diluted earnings per share | 2.36 | 2.68 | (0.32 | ) | (12 | )% | ||||||||||
| Operating revenue | 15,407 | 14,613 | 794 | 5.4 | % | |||||||||||
| TRASM (cents) | 20.64 | 21.18 | (0.54 | ) | (2.6 | )% | ||||||||||
| Operating expense | 13,138 | 12,119 | 1,019 | 8 | % | |||||||||||
| Non-fuel cost | 9,808 | 9,011 | 797 | 9 | % | |||||||||||
| Non-fuel unit cost (CASM-Ex) (cents) | 13.14 | 13.06 | 0.08 | 0.6 | % | |||||||||||
| Fuel expense | 2,811 | 2,513 | 298 | 12 | % | |||||||||||
| Average fuel price per gallon | 2.64 | 2.52 | 0.11 | 5 | % | |||||||||||
| Operating cash flow | 2,458 | 2,648 | (190 | ) | (7 | )% | ||||||||||
| Free cash flow | 1,274 | 1,094 | 180 | 16 | % | |||||||||||
| Gross capital expenditures | 1,216 | 1,572 | (356 | ) | (23 | )% | ||||||||||
| Adjusted net debt | 19,170 | 19,841 | (671 | ) | (3 | )% | ||||||||||
|
|
About Delta Air Lines Through exceptional service and the power of innovation, Delta Air Lines (NYSE: DAL) never stops looking for ways to make every trip feel tailored to every customer.
There are 100,000 Delta people leading the way to deliver a world-class customer experience on over 4,000 daily flights to more than 290 destinations on six continents, connecting people to places and to each other.
Delta served more than 190 million customers in 2023 -- safely, reliably and with industry-leading customer service innovation – and was recognized by J.D. Power this year for being No. 1 in First/Business and Premium Economy Passenger Satisfaction. The airline also was again recognized as North America’s most on-time airline by Cirium.
We remain committed to ensuring that the future of travel is connected, personalized and enjoyable. Our people’s genuine and enduring motivation is to make every customer feel welcomed and cared for across every point of their journey with us.
Headquartered in Atlanta, Delta operates significant hubs and key markets in Amsterdam, Atlanta, Bogota, Boston, Detroit, Lima, London-Heathrow, Los Angeles, Mexico City, Minneapolis-St. Paul, New York-JFK and LaGuardia, Paris-Charles de Gaulle, Salt Lake City, Santiago (Chile), Sao Paulo, Seattle, Seoul-Incheon and Tokyo.
As the leading global airline, Delta's mission to connect the world creates opportunities, fosters understanding and expands horizons by connecting people and communities to each other and to their own potential.
Powered by innovative and strategic partnerships with Aeromexico, Air France-KLM, China Eastern, Korean Air, LATAM, Virgin Atlantic and WestJet, Delta brings more choice and competition to customers worldwide. Delta’s premium product line is elevated by its unique partnership with Wheels Up Experience.
Delta is America's most-awarded airline thanks to the dedication, passion and professionalism of its people. In addition to the awards from J.D. Power and Cirium, Delta has been recognized as the top U.S. airline by the Wall Street Journal; among Fast Company’s Most Innovative Companies; the World’s Most Admired Airline and one of the Best 100 Companies to Work For according to Fortune; and as one of Glassdoor’s Best Places to Work. In addition, Delta has been named to the Civic 50 by Points of Light for the past seven years as one of the most community minded companies in the U.S.
Forward Looking Statements
Statements made in this press release that are not historical facts, including statements regarding our estimates, expectations, beliefs, intentions, projections, goals, aspirations, commitments or strategies for the future, should be considered “forward-looking statements” under the Securities Act of 1933, as amended, the Securities Exchange Act of 1934, as amended, and the Private Securities Litigation Reform Act of 1995. Such statements are not guarantees or promised outcomes and should not be construed as such. All forward-looking statements involve a number of risks and uncertainties that could cause actual results to differ materially from the estimates, expectations, beliefs, intentions, projections, goals, aspirations, commitments and strategies reflected in or suggested by the forward-looking statements. These risks and uncertainties include, but are not limited to, the possible effects of serious accidents involving our aircraft or aircraft of our airline partners; breaches or lapses in the security of technology systems we use and rely on, which could compromise the data stored within them, as well as failure to comply with evolving global privacy and security regulatory obligations or adequately address increasing customer focus on privacy issues and data security; disruptions in our information technology infrastructure; our dependence on technology in our operations; increases in the cost of aircraft fuel; extended disruptions in the supply of aircraft fuel, including from Monroe Energy, LLC (“Monroe”), a wholly-owned subsidiary of Delta that operates the Trainer refinery; failure to receive the expected results or returns from our commercial relationships with airlines in other parts of the world and the investments we have in certain of those airlines; the effects of a significant disruption in the operations or performance of third parties on which we rely; failure to comply with the financial and other covenants in our financing agreements; labor issues; the effects on our business of seasonality and other factors beyond our control, such as changes in value in our equity investments, severe weather conditions, natural disasters or other environmental events, including from the impact of climate change; failure or inability of insurance to cover a significant liability at Monroe’s refinery; failure to comply with existing and future environmental regulations to which Monroe’s refinery operations are subject, including costs related to compliance with renewable fuel standard regulations; significant damage to our reputation and brand, including from exposure to significant adverse publicity or inability to achieve certain sustainability goals; our ability to retain senior management and other key employees, and to maintain our company culture; disease outbreaks, such as the COVID-19 pandemic or similar public health threats, and measures implemented to combat them; the effects of terrorist attacks, geopolitical conflict or security events; competitive conditions in the airline industry; extended interruptions or disruptions in service at major airports at which we operate or significant problems associated with types of aircraft or engines we operate; the effects of extensive government regulation we are subject to; the impact of environmental regulation, including but not limited to regulation of hazardous substances, increased regulation to reduce emissions and other risks associated with climate change, and the cost of compliance with more stringent environmental regulations; and unfavorable economic or political conditions in the markets in which we operate or volatility in currency exchange rates.
Additional information concerning risks and uncertainties that could cause differences between actual results and forward-looking statements is contained in our Securities and Exchange Commission filings, including our Annual Report on Form 10-K for the fiscal year ended December 31, 2023. Caution should be taken not to place undue reliance on our forward-looking statements, which represent our views only as of the date of this press release, and which we undertake no obligation to update except to the extent required by law.
|
|
DELTA AIR LINES, INC.
Consolidated Statements of Operations
(Unaudited)
| Three Months Ended | Six Months Ended | |||||||||||||||||||||||||||||||
| June 30, | June 30, | |||||||||||||||||||||||||||||||
| (in millions, except per share data) | 2024 | 2023 | $ Change | % Change | 2024 | 2023 | $ Change | % Change | ||||||||||||||||||||||||
| Operating Revenue: | ||||||||||||||||||||||||||||||||
| Passenger | $ | 13,841 | $ | 13,205 | $ | 636 | 5 | % | $ | 24,972 | $ | 23,616 | $ | 1,356 | 6 | % | ||||||||||||||||
| Cargo | 199 | 172 | 27 | 16 | % | 377 | 381 | (4 | ) | (1 | )% | |||||||||||||||||||||
| Other | 2,618 | 2,201 | 417 | 19 | % | 5,057 | 4,340 | 717 | 17 | % | ||||||||||||||||||||||
| Total operating revenue | 16,658 | 15,578 | 1,080 | 7 | % | 30,406 | 28,337 | 2,069 | 7 | % | ||||||||||||||||||||||
| Operating Expense: | ||||||||||||||||||||||||||||||||
| Salaries and related costs | 4,012 | 3,692 | 320 | 9 | % | 7,803 | 7,078 | 725 | 10 | % | ||||||||||||||||||||||
| Aircraft fuel and related taxes | 2,813 | 2,516 | 297 | 12 | % | 5,410 | 5,192 | 218 | 4 | % | ||||||||||||||||||||||
| Ancillary businesses and refinery | 1,463 | 1,173 | 290 | 25 | % | 2,833 | 2,298 | 535 | 23 | % | ||||||||||||||||||||||
| Contracted services | 1,041 | 994 | 47 | 5 | % | 2,065 | 2,004 | 61 | 3 | % | ||||||||||||||||||||||
| Landing fees and other rents | 766 | 617 | 149 | 24 | % | 1,515 | 1,201 | 314 | 26 | % | ||||||||||||||||||||||
| Aircraft maintenance materials and outside repairs | 684 | 614 | 70 | 11 | % | 1,363 | 1,199 | 164 | 14 | % | ||||||||||||||||||||||
| Depreciation and amortization | 620 | 573 | 47 | 8 | % | 1,235 | 1,137 | 98 | 9 | % | ||||||||||||||||||||||
| Passenger commissions and other selling expenses | 672 | 651 | 21 | 3 | % | 1,222 | 1,152 | 70 | 6 | % | ||||||||||||||||||||||
| Regional carrier expense | 580 | 559 | 21 | 4 | % | 1,130 | 1,117 | 13 | 1 | % | ||||||||||||||||||||||
| Passenger service | 463 | 442 | 21 | 5 | % | 876 | 859 | 17 | 2 | % | ||||||||||||||||||||||
| Profit sharing | 519 | 595 | (76 | ) | (13 | )% | 644 | 667 | (23 | ) | (3 | )% | ||||||||||||||||||||
| Aircraft rent | 138 | 132 | 6 | 5 | % | 274 | 264 | 10 | 4 | % | ||||||||||||||||||||||
| Pilot agreement and related expenses | – | – | – | – | % | – | 864 | (864 | ) | (100 | )% | |||||||||||||||||||||
| Other | 620 | 529 | 91 | 17 | % | 1,155 | 1,090 | 65 | 6 | % | ||||||||||||||||||||||
| Total operating expense | 14,391 | 13,087 | 1,304 | 10 | % | 27,525 | 26,122 | 1,403 | 5 | % | ||||||||||||||||||||||
| Operating Income | 2,267 | 2,491 | (224 | ) | (9 | )% | 2,881 | 2,215 | 666 | 30 | % | |||||||||||||||||||||
| Non-Operating Expense: | ||||||||||||||||||||||||||||||||
| Interest expense, net | (188 | ) | (203 | ) | 15 | (7 | )% | (394 | ) | (430 | ) | 36 | (8 | )% | ||||||||||||||||||
| Gain/(loss) on investments, net | (196 | ) | 128 | (324 | ) | NM | (423 | ) | 251 | (674 | ) | NM | ||||||||||||||||||||
| Loss on extinguishment of debt | (32 | ) | (29 | ) | (3 | ) | 10 | % | (36 | ) | (50 | ) | 14 | (28 | )% | |||||||||||||||||
| Miscellaneous, net | (78 | ) | (70 | ) | (8 | ) | 11 | % | (133 | ) | (174 | ) | 41 | (24 | )% | |||||||||||||||||
| Total non-operating expense, net | (494 | ) | (174 | ) | (320 | ) | NM | (986 | ) | (403 | ) | (583 | ) | NM | ||||||||||||||||||
| Income Before Income Taxes | 1,773 | 2,317 | (544 | ) | (23 | )% | 1,895 | 1,812 | 83 | 5 | % | |||||||||||||||||||||
| Income Tax Provision | (468 | ) | (490 | ) | 22 | (4 | )% | (553 | ) | (348 | ) | (205 | ) | 59 | % | |||||||||||||||||
| Net Income | $ | 1,305 | $ | 1,827 | $ | (522 | ) | (29 | )% | $ | 1,342 | $ | 1,464 | $ | (122 | ) | (8 | )% | ||||||||||||||
| Basic Earnings Per Share | $ | 2.04 | $ | 2.86 | $ | 2.10 | $ | 2.29 | ||||||||||||||||||||||||
| Diluted Earnings Per Share | $ | 2.01 | $ | 2.84 | $ | 2.08 | $ | 2.28 | ||||||||||||||||||||||||
| Basic Weighted Average Shares Outstanding | 641 | 639 | 640 | 639 | ||||||||||||||||||||||||||||
| Diluted Weighted Average Shares Outstanding | 648 | 642 | 647 | 642 | ||||||||||||||||||||||||||||
|
|
DELTA AIR LINES, INC.
Passenger Revenue
(Unaudited)
| Three Months Ended | Six Months Ended | |||||||||||||||||||||||||||||||
| June 30, | June 30, | |||||||||||||||||||||||||||||||
| (in millions) | 2024 | 2023 | $ Change | % Change | 2024 | 2023 | $ Change | % Change | ||||||||||||||||||||||||
| Ticket - Main cabin | $ | 6,716 | $ | 6,694 | $ | 22 | – | % | $ | 12,141 | $ | 11,917 | $ | 224 | 2 | % | ||||||||||||||||
| Ticket - Premium products | 5,633 | 5,135 | 498 | 10 | % | 10,041 | 9,151 | 890 | 10 | % | ||||||||||||||||||||||
| Loyalty travel awards | 975 | 902 | 73 | 8 | % | 1,820 | 1,645 | 175 | 11 | % | ||||||||||||||||||||||
| Travel-related services | 517 | 474 | 43 | 9 | % | 970 | 903 | 67 | 7 | % | ||||||||||||||||||||||
| Passenger revenue | $ | 13,841 | $ | 13,205 | $ | 636 | 5 | % | $ | 24,972 | $ | 23,616 | $ | 1,356 | 6 | % | ||||||||||||||||
DELTA AIR LINES, INC.
Other Revenue
(Unaudited)
| Three Months Ended | Six Months Ended | |||||||||||||||||||||||||||||||
| June 30, | June 30, | |||||||||||||||||||||||||||||||
| (in millions) | 2024 | 2023 | $ Change | % Change | 2024 | 2023 | $ Change | % Change | ||||||||||||||||||||||||
| Refinery | $ | 1,251 | $ | 965 | $ | 286 | 30 | % | $ | 2,436 | $ | 1,882 | $ | 554 | 29 | % | ||||||||||||||||
| Loyalty program | 836 | 774 | 62 | 8 | % | 1,631 | 1,500 | 131 | 9 | % | ||||||||||||||||||||||
| Ancillary businesses | 213 | 214 | (1 | ) | – | % | 393 | 445 | (52 | ) | (12 | )% | ||||||||||||||||||||
| Miscellaneous | 318 | 248 | 70 | 28 | % | 597 | 513 | 84 | 16 | % | ||||||||||||||||||||||
| Other revenue | $ | 2,618 | $ | 2,201 | $ | 417 | 19 | % | $ | 5,057 | $ | 4,340 | $ | 717 | 17 | % | ||||||||||||||||
DELTA AIR LINES, INC.
Total Revenue
(Unaudited)
| Increase (Decrease) | ||||||||||||||||||||
| 2Q24 vs 2Q23 | ||||||||||||||||||||
| Revenue | 2Q24 ($M) | Change | Unit Revenue | Yield | Capacity | |||||||||||||||
| Domestic | $ | 9,398 | 5 | % | (2 | )% | (2 | )% | 8 | % | ||||||||||
| Atlantic | 2,825 | 1 | % | (1 | )% | 1 | % | 2 | % | |||||||||||
| Latin America | 964 | 4 | % | (12 | )% | (12 | )% | 19 | % | |||||||||||
| Pacific | 654 | 23 | % | (5 | )% | (4 | )% | 30 | % | |||||||||||
| Passenger Revenue | $ | 13,841 | 5 | % | (3 | )% | (2 | )% | 8 | % | ||||||||||
| Cargo Revenue | 199 | 16 | % | |||||||||||||||||
| Other Revenue | 2,618 | 19 | % | |||||||||||||||||
| Total Revenue | $ | 16,658 | 7 | % | (1 | )% | ||||||||||||||
| Third Party Refinery Sales | (1,251 | ) | ||||||||||||||||||
| Total Revenue, adjusted | $ | 15,407 | 5.4 | % | (2.6 | )% | ||||||||||||||
|
|
DELTA AIR LINES, INC.
Statistical Summary
(Unaudited)
| Three Months Ended | Six Months Ended | |||||||||||||||||||||||
| June 30, | June 30, | |||||||||||||||||||||||
| 2024 | 2023 | Change | 2024 | 2023 | Change | |||||||||||||||||||
| Revenue passenger miles (millions) | 65,241 | 60,804 | 7 | % | 119,448 | 110,491 | 8 | % | ||||||||||||||||
| Available seat miles (millions) | 74,656 | 68,993 | 8 | % | 140,198 | 130,345 | 8 | % | ||||||||||||||||
| Passenger mile yield (cents) | 21.22 | 21.72 | (2 | )% | 20.91 | 21.37 | (2 | )% | ||||||||||||||||
| Passenger revenue per available seat mile (cents) | 18.54 | 19.14 | (3 | )% | 17.81 | 18.12 | (2 | )% | ||||||||||||||||
| Total revenue per available seat mile (cents) | 22.31 | 22.58 | (1 | )% | 21.69 | 21.74 | – | % | ||||||||||||||||
| TRASM, adjusted - see Note A (cents) | 20.64 | 21.18 | (2.6 | )% | 19.95 | 20.30 | (2 | )% | ||||||||||||||||
| Cost per available seat mile (cents) | 19.28 | 18.97 | 2 | % | 19.63 | 20.04 | (2 | )% | ||||||||||||||||
| CASM-Ex - see Note A (cents) | 13.14 | 13.06 | 0.6 | % | 13.58 | 13.44 | 1 | % | ||||||||||||||||
| Passenger load factor | 87 | % | 88 | % | (1 | ) pt | 85 | % | 85 | % | – | pt | ||||||||||||
| Fuel gallons consumed (millions) | 1,066 | 997 | 7 | % | 1,998 | 1,885 | 6 | % | ||||||||||||||||
| Average price per fuel gallon | $ | 2.64 | $ | 2.52 | 5 | % | $ | 2.71 | $ | 2.75 | (1 | )% | ||||||||||||
| Average price per fuel gallon, adjusted - see Note A | $ | 2.64 | $ | 2.52 | 5 | % | $ | 2.69 | $ | 2.77 | (3 | )% | ||||||||||||
|
|
DELTA AIR LINES, INC.
Consolidated Statements of Cash Flows
(Unaudited)
| Three Months Ended | ||||||||
| June 30, | ||||||||
| (in millions) | 2024 | 2023 | ||||||
| Cash Flows From Operating Activities: | ||||||||
| Net Income | $ | 1,305 | $ | 1,827 | ||||
| Depreciation and amortization | 620 | 573 | ||||||
| Changes in air traffic liability | (756 | ) | (766 | ) | ||||
| Changes in profit sharing | 519 | 595 | ||||||
| Changes in balance sheet and other, net | 762 | 380 | ||||||
| Net cash provided by operating activities | 2,450 | 2,609 | ||||||
| Cash Flows From Investing Activities: | ||||||||
| Property and equipment additions: | ||||||||
| Flight equipment, including advance payments | (1,007 | ) | (1,074 | ) | ||||
| Ground property and equipment, including technology | (301 | ) | (378 | ) | ||||
| Purchase of short-term investments | – | (1,013 | ) | |||||
| Redemption of short-term investments | 467 | 1,064 | ||||||
| Other, net | 32 | 19 | ||||||
| Net cash used in investing activities | (809 | ) | (1,382 | ) | ||||
| Cash Flows From Financing Activities: | ||||||||
| Payments on debt and finance lease obligations | (1,436 | ) | (1,820 | ) | ||||
| Cash dividends | (64 | ) | – | |||||
| Other, net | (12 | ) | (12 | ) | ||||
| Net cash used in financing activities | (1,512 | ) | (1,832 | ) | ||||
| Net Increase/(Decrease) in Cash, Cash Equivalents and Restricted Cash Equivalents | 129 | (605 | ) | |||||
| Cash, cash equivalents and restricted cash equivalents at beginning of period | 4,379 | 3,429 | ||||||
| Cash, cash equivalents and restricted cash equivalents at end of period | $ | 4,507 | $ | 2,824 | ||||
| The following table provides a reconciliation of cash, cash equivalents and restricted cash reported within the Consolidated Balance Sheets to the total of the same such amounts shown above: | ||||||||
| Current assets: | ||||||||
| Cash and cash equivalents | $ | 4,110 | $ | 2,668 | ||||
| Restricted cash included in prepaid expenses and other | 114 | 156 | ||||||
| Other assets: | ||||||||
| Restricted cash included in other noncurrent assets | 283 | – | ||||||
| Total cash, cash equivalents and restricted cash equivalents | $ | 4,507 | $ | 2,824 | ||||
|
|
DELTA AIR LINES, INC.
Consolidated Balance Sheets
(Unaudited)
| June 30, | December 31, | |||||||
| (in millions) | 2024 | 2023 | ||||||
| ASSETS | ||||||||
| Current Assets: | ||||||||
| Cash and cash equivalents | $ | 4,110 | $ | 2,741 | ||||
| Short-term investments | 124 | 1,127 | ||||||
| Accounts receivable, net | 3,812 | 3,130 | ||||||
| Fuel inventory, expendable parts and supplies inventories, net | 1,486 | 1,314 | ||||||
| Prepaid expenses and other | 2,056 | 1,957 | ||||||
| Total current assets | 11,588 | 10,269 | ||||||
| Property and Equipment, Net: | ||||||||
| Property and equipment, net | 36,339 | 35,486 | ||||||
| Other Assets: | ||||||||
| Operating lease right-of-use assets | 6,808 | 7,004 | ||||||
| Goodwill | 9,753 | 9,753 | ||||||
| Identifiable intangibles, net | 5,979 | 5,983 | ||||||
| Equity investments | 3,022 | 3,457 | ||||||
| Other noncurrent assets | 1,708 | 1,692 | ||||||
| Total other assets | 27,270 | 27,889 | ||||||
| Total assets | $ | 75,197 | $ | 73,644 | ||||
| LIABILITIES AND STOCKHOLDERS' EQUITY | ||||||||
| Current Liabilities: | ||||||||
| Current maturities of debt and finance leases | $ | 2,950 | $ | 2,983 | ||||
| Current maturities of operating leases | 775 | 759 | ||||||
| Air traffic liability | 9,437 | 7,044 | ||||||
| Accounts payable | 4,876 | 4,446 | ||||||
| Accrued salaries and related benefits | 3,655 | 4,561 | ||||||
| Loyalty program deferred revenue | 4,038 | 3,908 | ||||||
| Fuel card obligation | 1,100 | 1,100 | ||||||
| Other accrued liabilities | 1,928 | 1,617 | ||||||
| Total current liabilities | 28,759 | 26,418 | ||||||
| Noncurrent Liabilities: | ||||||||
| Debt and finance leases | 15,033 | 17,071 | ||||||
| Pension, postretirement and related benefits | 3,453 | 3,601 | ||||||
| Loyalty program deferred revenue | 4,596 | 4,512 | ||||||
| Noncurrent operating leases | 6,053 | 6,468 | ||||||
| Deferred income taxes, net | 1,410 | 908 | ||||||
| Other noncurrent liabilities | 3,507 | 3,561 | ||||||
| Total noncurrent liabilities | 34,052 | 36,121 | ||||||
| Commitments and Contingencies | ||||||||
| Stockholders' Equity: | 12,386 | 11,105 | ||||||
| Total liabilities and stockholders' equity | $ | 75,197 | $ | 73,644 | ||||
|
|
Note A: The following tables show reconciliations of non-GAAP financial measures. The reasons Delta uses these measures are described below. Reconciliations may not calculate due to rounding.
Delta sometimes uses information ("non-GAAP financial measures") that is derived from the Consolidated Financial Statements, but that is not presented in accordance with accounting principles generally accepted in the U.S. (“GAAP”). Under the Securities and Exchange Commission rules, non-GAAP financial measures may be considered in addition to results prepared in accordance with GAAP, but should not be considered a substitute for or superior to GAAP results. The tables below show reconciliations of non-GAAP financial measures used in this release to the most directly comparable GAAP financial measures.
Forward Looking Projections. Delta is not able to reconcile forward looking non-GAAP financial measures without unreasonable effort because the adjusting items such as those used in the reconciliations below will not be known until the end of the period and could be significant.
Adjustments. These reconciliations include certain adjustments to GAAP measures that are made to provide comparability between the reported periods, if applicable, and for the reasons indicated below:
MTM adjustments on investments. Mark-to-market ("MTM") unrealized gains/losses result from our equity investments that are accounted for at fair value in non-operating expense. The gains/losses are driven by changes in stock prices, foreign currency fluctuations and other valuation techniques for investments in certain companies, particularly those without publicly-traded shares. Adjusting for these gains/losses allows investors to better understand and analyze our core operational performance in the periods shown.
MTM adjustments and settlements on hedges. MTM adjustments are defined as fair value changes recorded in periods other than the settlement period. Such fair value changes are not necessarily indicative of the actual settlement value of the underlying hedge in the contract settlement period, and therefore we remove this impact to allow investors to better understand and analyze our core performance. Settlements represent cash received or paid on hedge contracts settled during the applicable period.
Loss on extinguishment of debt. This adjustment relates to early termination of a portion of our debt. Adjusting for these losses allows investors to better understand and analyze our core operational performance in the periods shown.
Third-party refinery sales. Refinery sales to third parties, and related expenses, are not related to our airline segment. Excluding these sales therefore provides a more meaningful comparison of our airline operations to the rest of the airline industry.
One-time pilot agreement expenses. In the March 2023 quarter, Delta pilots ratified a new four-year Pilot Working Agreement effective January 1, 2023. The agreement included a provision for a one-time payment made upon ratification in the March 2023 quarter of $735 million. Additionally, we recorded adjustments to other benefit-related items of approximately $130 million. Adjusting for these expenses allows investors to better understand and analyze our core cost performance.
Pre-Tax Income, Net Income, and Diluted Earnings per Share, adjusted
| Three Months Ended | Three Months Ended | |||||||||||||||
| June 30, 2024 | June 30, 2024 | |||||||||||||||
| Pre-Tax | Income | Net | Earnings | |||||||||||||
| (in millions, except per share data) | Income | Tax | Income | Per Diluted Share | ||||||||||||
| GAAP | $ | 1,773 | $ | (468 | ) | $ | 1,305 | $ | 2.01 | |||||||
| Adjusted for: | ||||||||||||||||
| MTM adjustments on investments | 196 | |||||||||||||||
| MTM adjustments and settlements on hedges | 1 | |||||||||||||||
| Loss on extinguishment of debt | 32 | |||||||||||||||
| Non-GAAP | $ | 2,002 | $ | (475 | ) | $ | 1,528 | $ | 2.36 | |||||||
| Three Months Ended | Three Months Ended | |||||||||||||||
| June 30, 2023 | June 30, 2023 | |||||||||||||||
| Pre-Tax | Income | Net | Earnings | |||||||||||||
| (in millions, except per share data) | Income | Tax | Income | Per Diluted Share | ||||||||||||
| GAAP | $ | 2,317 | $ | (490 | ) | $ | 1,827 | $ | 2.84 | |||||||
| Adjusted for: | ||||||||||||||||
| MTM adjustments on investments | (128 | ) | ||||||||||||||
| MTM adjustments and settlements on hedges | 3 | |||||||||||||||
| Loss on extinguishment of debt | 29 | |||||||||||||||
| Non-GAAP | $ | 2,220 | $ | (498 | ) | $ | 1,723 | $ | 2.68 | |||||||
|
|
Operating Margin, adjusted
| Three Months Ended | ||||||||
| June 30, 2024 | June 30, 2023 | |||||||
| Operating margin | 13.6 | % | 16.0 | % | ||||
| Adjusted for: | ||||||||
| Third-party refinery sales | 1.1 | 1.1 | ||||||
| Operating margin, adjusted | 14.7 | % | 17.1 | % | ||||
Operating Revenue, adjusted and Total Revenue Per Available Seat Mile ("TRASM"), adjusted
| Three Months Ended | 2Q24 vs 2Q23 | |||||||||||||||
| (in millions) | June 30, 2024 | September 30, 2023 | June 30, 2023 | % Change | ||||||||||||
| Operating revenue | $ | 16,658 | $ | 15,488 | $ | 15,578 | ||||||||||
| Adjusted for: | ||||||||||||||||
| Third-party refinery sales | (1,251 | ) | (935 | ) | (965 | ) | ||||||||||
| Operating revenue, adjusted | $ | 15,407 | $ | 14,553 | $ | 14,613 | 5.4 | % | ||||||||
| Three Months Ended | % Change | |||||||||||
| June 30, 2024 | June 30, 2023 | |||||||||||
| TRASM (cents) | 22.31 | 22.58 | ||||||||||
| Adjusted for: | ||||||||||||
| Third-party refinery sales | (1.68 | ) | (1.40 | ) | ||||||||
| TRASM, adjusted | 20.64 | 21.18 | (2.6 | )% | ||||||||
| Six Months Ended | ||||||||
| June 30, 2024 | June 30, 2023 | |||||||
| TRASM (cents) | 21.69 | 21.74 | ||||||
| Adjusted for: | ||||||||
| Third-party refinery sales | (1.74 | ) | (1.44 | ) | ||||
| TRASM, adjusted | 19.95 | 20.30 | ||||||
Operating Income, adjusted
| Three Months Ended | ||||||||
| (in millions) | June 30, 2024 | June 30, 2023 | ||||||
| Operating income | $ | 2,267 | $ | 2,491 | ||||
| Adjusted for: | ||||||||
| MTM adjustments and settlements on hedges | 1 | 3 | ||||||
| Operating income, adjusted | $ | 2,269 | $ | 2,494 | ||||
Pre-Tax Margin, adjusted
| Three Months Ended | ||||||||
| June 30, 2024 | June 30, 2023 | |||||||
| Pre-tax margin | 10.6 | % | 14.9 | % | ||||
| Adjusted for: | ||||||||
| MTM adjustments on investments | 1.2 | (0.8 | ) | |||||
| Third-party refinery sales | 1.0 | 0.9 | ||||||
| Loss on extinguishment of debt | 0.2 | 0.2 | ||||||
| Pre-tax margin, adjusted | 13.0 | % | 15.2 | % | ||||
|
|
Operating Cash Flow, adjusted. We present operating cash flow, adjusted because management believes adjusting for the following item provides a more meaningful measure for investors:
Net cash flows related to certain airport construction projects and other. Cash flows related to certain airport construction projects are included in our GAAP operating activities. We have adjusted for these items, which were primarily funded by cash restricted for airport construction, to provide investors a better understanding of the company's operating cash flow that is core to our operations in the periods shown.
| Three Months Ended | ||||||||
| (in millions) | June 30, 2024 | June 30, 2023 | ||||||
| Net cash provided by operating activities | $ | 2,450 | $ | 2,609 | ||||
| Adjusted for: | ||||||||
| Net cash flows related to certain airport construction projects and other | 8 | 38 | ||||||
| Net cash provided by operating activities, adjusted | $ | 2,458 | $ | 2,648 | ||||
Free Cash Flow. We present free cash flow because management believes this metric is helpful to investors to evaluate the company's ability to generate cash that is available for use for debt service or general corporate initiatives. Free cash flow is also used internally as a component of our incentive compensation programs. Free cash flow is defined as net cash from operating activities and net cash from investing activities, adjusted for (i) net redemptions of short-term investments, (ii) net cash flows related to certain airport construction projects and other, and (iii) financed aircraft acquisitions. These adjustments are made for the following reasons:
Net redemptions of short-term investments. Net redemptions of short-term investments represent the net purchase and sale activity of investments and marketable securities in the period, including gains and losses. We adjust for this activity to provide investors a better understanding of the company's free cash flow generated by our operations.
Net cash flows related to certain airport construction projects and other. Cash flows related to certain airport construction projects are included in our GAAP operating activities and capital expenditures. We have adjusted for these items, which were primarily funded by cash restricted for airport construction, to provide investors a better understanding of the company's free cash flow and capital expenditures that are core to our operations in the periods shown.
Financed aircraft acquisitions. This adjustment reflects aircraft deliveries that are leased as capital expenditures. The adjustment is based on their original contractual purchase price or an estimate of the aircraft's fair value and provides a more meaningful view of our investing activities.
| Three Months Ended | ||||||||
| (in millions) | June 30, 2024 | June 30, 2023 | ||||||
| Net cash provided by operating activities | $ | 2,450 | $ | 2,609 | ||||
| Net cash used in investing activities | (809 | ) | (1,382 | ) | ||||
| Adjusted for: | ||||||||
| Net redemptions of short-term investments | (467 | ) | (51 | ) | ||||
| Net cash flows related to certain airport construction projects and other | 99 | 81 | ||||||
| Financed aircraft acquisitions | – | (162 | ) | |||||
| Free cash flow | $ | 1,274 | $ | 1,094 | ||||
| Six Months Ended | ||||
| (in millions) | June 30, 2024 | |||
| Net cash provided by operating activities | $ | 4,857 | ||
| Net cash used in investing activities | (1,446 | ) | ||
| Adjusted for: | ||||
| Net redemptions of short-term investments | (1,013 | ) | ||
| Net cash flows related to certain airport construction projects and other | 253 | |||
| Free cash flow | $ | 2,652 | ||
|
|
Adjusted Debt to Earnings Before Interest, Taxes, Depreciation, Amortization and Rent ("EBITDAR"). We present adjusted debt to EBITDAR because management believes this metric is helpful to investors in assessing the company's overall debt profile. Adjusted debt includes operating lease liabilities and sale leaseback liabilities. We calculate EBITDAR by adding depreciation and amortization to GAAP operating income and adjusting for the fixed portion of operating lease expense.
| (in billions) | June 30, 2024 | December 31, 2023 | ||||||
| Debt and finance lease obligations | $ | 18.0 | $ | 20.1 | ||||
| Plus: Operating lease liability | 6.8 | 7.2 | ||||||
| Plus: Sale leaseback liability | 1.9 | 1.9 | ||||||
| Adjusted Debt | $ | 26.7 | $ | 29.3 | ||||
| Twelve Months Ended | ||||||||
| (in billions) | June 30, 2024 | December 31, 2023 | ||||||
| GAAP operating income | $ | 6.2 | $ | 5.5 | ||||
| Adjusted for: | ||||||||
| One-time pilot agreement expenses | – | 0.9 | ||||||
| Operating income, adjusted | 6.2 | 6.3 | ||||||
| Adjusted for: | ||||||||
| Depreciation and amortization | 2.4 | 2.3 | ||||||
| Fixed portion of operating lease expense | 1.0 | 1.0 | ||||||
| EBITDAR | $ | 9.6 | $ | 9.6 | ||||
| Adjusted Debt to EBITDAR | 2.8 | x | 3.0 | x | ||||
After-tax Return on Invested Capital ("ROIC"). We present after-tax return on invested capital as management believes this metric is helpful to investors in assessing the company's ability to generate returns using its invested capital as a measure against the industry. Return on invested capital is tax-effected adjusted total pre-tax income divided by average adjusted invested capital. Average adjusted invested capital represents the sum of the adjusted book value of equity at the end of the last five quarters, adjusted for pension impacts within other comprehensive income. Average adjusted gross debt is calculated using amounts as of the end of the last five quarters. All adjustments to calculate ROIC are intended to provide a more meaningful comparison of our results to the airline industry.
Amortization of retirement actuarial loss. This adjustment relates to actuarial gains/losses on our benefit plans. Adjusting for these results allows investors to better understand our core operational performance in the periods shown as it removes prior period differences in assumptions and actual experience within our benefit plans.
Interest expense, net and interest expense included in aircraft rent. This adjustment relates to interest expense related to debt and financing transactions. Adjusting for these results allows investors to better understand our core operational performance in the periods shown as it neutralizes the effect of our capital structure.
| Twelve Months Ended | ||||
| (in millions) | June 30, 2024 | |||
| Pre-tax income | $ | 5,691 | ||
| Adjusted for: | ||||
| MTM adjustments on investments | (589 | ) | ||
| MTM adjustments and settlements on hedges | 14 | |||
| Loss on extinguishment of debt | 49 | |||
| Amortization of retirement actuarial loss | 240 | |||
| Interest expense, net and interest expense included in aircraft rent | 1,170 | |||
| Pre-tax adjusted income | $ | 6,575 | ||
| Tax effect | (1,524 | ) | ||
| Tax-effected adjusted total pre-tax income | $ | 5,051 | ||
| Adjusted book value of equity | $ | 16,618 | ||
| Average adjusted gross debt | 21,803 | |||
| Averaged adjusted invested capital | $ | 38,421 | ||
| After-tax Return on Invested Capital | 13.1 | % | ||
|
|
Operating revenue, adjusted related to premium products and diverse revenue streams
| Three Months Ended | ||||
| (in millions) | June 30, 2024 | |||
| Operating revenue | $ | 16,658 | ||
| Adjusted for: | ||||
| Third-party refinery sales | (1,251 | ) | ||
| Operating revenue, adjusted | $ | 15,407 | ||
| Less: main cabin revenue | (6,716 | ) | ||
| Operating revenue, adjusted related to premium products and diverse revenue streams | $ | 8,691 | ||
| Percent of operating revenue, adjusted related to premium products and diverse revenue streams | 56 | % | ||
Adjusted Non-Fuel Cost and Non-Fuel Unit Cost or Cost per Available Seat Mile, ("CASM-Ex")
We adjust operating expense and CASM for certain items described above, as well as the following items and reasons described below:
Aircraft fuel and related taxes. The volatility in fuel prices impacts the comparability of year-over-year financial performance. The adjustment for aircraft fuel and related taxes allows investors to better understand and analyze our non-fuel costs and year-over-year financial performance.
Profit sharing. We adjust for profit sharing because this adjustment allows investors to better understand and analyze our recurring cost performance and provides a more meaningful comparison of our core operating costs to the airline industry.
| Three Months Ended | ||||||||
| (in millions) | June 30, 2024 | June 30, 2023 | ||||||
| Operating expense | $ | 14,391 | $ | 13,087 | ||||
| Adjusted for: | ||||||||
| Aircraft fuel and related taxes | (2,813 | ) | (2,516 | ) | ||||
| Third-party refinery sales | (1,251 | ) | (965 | ) | ||||
| Profit sharing | (519 | ) | (595 | ) | ||||
| Non-Fuel Cost | $ | 9,808 | $ | 9,011 | ||||
| Three Months Ended | 2Q24 vs 2Q23 | |||||||||||||||
| June 30, 2024 | September 30, 2023 | June 30, 2023 | % Change | |||||||||||||
| CASM (cents) | 19.28 | 18.44 | 18.97 | |||||||||||||
| Adjusted for: | ||||||||||||||||
| Aircraft fuel and related taxes | (3.77 | ) | (4.01 | ) | (3.65 | ) | ||||||||||
| Third-party refinery sales | (1.68 | ) | (1.28 | ) | (1.40 | ) | ||||||||||
| Profit sharing | (0.70 | ) | (0.57 | ) | (0.86 | ) | ||||||||||
| CASM-Ex | 13.14 | 12.59 | 13.06 | 0.6 | % | |||||||||||
| Six Months Ended | ||||||||
| June 30, 2024 | June 30, 2023 | |||||||
| CASM (cents) | 19.63 | 20.04 | ||||||
| Adjusted for: | ||||||||
| Aircraft fuel and related taxes | (3.86 | ) | (3.98 | ) | ||||
| Third-party refinery sales | (1.74 | ) | (1.44 | ) | ||||
| Profit sharing | (0.46 | ) | (0.51 | ) | ||||
| One-time pilot agreement expenses | – | (0.66 | ) | |||||
| CASM-Ex | 13.58 | 13.44 | ||||||
|
|
Operating Expense, adjusted
| Three Months Ended | ||||||||
| (in millions) | June 30, 2024 | June 30, 2023 | ||||||
| Operating expense | $ | 14,391 | $ | 13,087 | ||||
| Adjusted for: | ||||||||
| Third-party refinery sales | (1,251 | ) | (965 | ) | ||||
| MTM adjustments and settlements on hedges | (1 | ) | (3 | ) | ||||
| Operating expense, adjusted | $ | 13,138 | $ | 12,119 | ||||
Total fuel expense, adjusted and Average fuel price per gallon, adjusted
| Average Price Per Gallon | ||||||||||||||||||||||||
| Three Months Ended | Three Months Ended | |||||||||||||||||||||||
| June 30, | June 30, | June 30, | June 30, | |||||||||||||||||||||
| (in millions, except per gallon data) | 2024 | 2023 | % Change | 2024 | 2023 | % Change | ||||||||||||||||||
| Total fuel expense | $ | 2,813 | $ | 2,516 | $ | 2.64 | $ | 2.52 | ||||||||||||||||
| Adjusted for: | ||||||||||||||||||||||||
| MTM adjustments and settlements on hedges | (1 | ) | (3 | ) | – | – | ||||||||||||||||||
| Total fuel expense, adjusted | $ | 2,811 | $ | 2,513 | 12 | % | $ | 2.64 | $ | 2.52 | 5 | % | ||||||||||||
| Six Months Ended | ||||||||||||
| June 30, | June 30, | |||||||||||
| 2024 | 2023 | % Change | ||||||||||
| Total fuel price per gallon | $ | 2.71 | $ | 2.75 | ||||||||
| Adjusted for: | ||||||||||||
| MTM adjustments and settlements on hedges | (0.01 | ) | 0.02 | |||||||||
| Total fuel price per gallon, adjusted | $ | 2.69 | $ | 2.77 | (3 | )% | ||||||
Adjusted Net Debt. Delta uses adjusted total debt, including aircraft rent, in addition to adjusted debt and finance leases, to present estimated financial obligations. Delta reduces adjusted total debt by cash, cash equivalents, short-term investments and LGA restricted cash, resulting in adjusted net debt, to present the amount of assets needed to satisfy the debt. Management believes this metric is helpful to investors in assessing the company's overall debt profile.
| (in millions) | June 30, 2024 | December 31, 2023 | June 30, 2023 | 2Q24 vs 4Q23 $ Change |
||||||||||||
| Debt and finance lease obligations | $ | 17,983 | $ | 20,054 | $ | 20,205 | ||||||||||
| Plus: sale-leaseback financing liabilities | 1,862 | 1,887 | 1,912 | |||||||||||||
| Plus: unamortized discount/(premium) and debt issue cost, net and other | 49 | 83 | 99 | |||||||||||||
| Adjusted debt and finance lease obligations | $ | 19,894 | $ | 22,024 | $ | 22,216 | ||||||||||
| Plus: 7x last twelve months' aircraft rent | 3,794 | 3,724 | 3,661 | |||||||||||||
| Adjusted total debt | $ | 23,687 | $ | 25,748 | $ | 25,877 | ||||||||||
| Less: cash, cash equivalents and short-term investments | (4,235 | ) | (3,869 | ) | (6,036 | ) | ||||||||||
| Less: LGA restricted cash | (283 | ) | (455 | ) | – | |||||||||||
| Adjusted net debt | $ | 19,170 | $ | 21,424 | $ | 19,841 | $ | (2,254 | ) | |||||||
|
|
Gross Capital Expenditures. We adjust capital expenditures for the following items to determine gross capital expenditures for the reasons described below:
Financed aircraft acquisitions. This adjusts capital expenditures to reflect aircraft deliveries that are leased as capital expenditures. The adjustment is based on their original contractual purchase price or an estimate of the aircraft's fair value and provides a more meaningful view of our investing activities.
Net cash flows related to certain airport construction projects. Cash flows related to certain airport construction projects are included in capital expenditures. We have adjusted for these items because management believes investors should be informed that a portion of these capital expenditures from airport construction projects are either funded with restricted cash specific to these projects or reimbursed by a third party.
| Three Months Ended | ||||||||
| (in millions) | June 30, 2024 | June 30, 2023 | ||||||
| Flight equipment, including advance payments | $ | 1,007 | $ | 1,074 | ||||
| Ground property and equipment, including technology | 301 | 378 | ||||||
| Adjusted for: | ||||||||
| Financed aircraft acquisitions | – | 162 | ||||||
| Net cash flows related to certain airport construction projects | (92 | ) | (42 | ) | ||||
| Gross capital expenditures | $ | 1,216 | $ | 1,572 | ||||
|
|
Exhibit 99.2
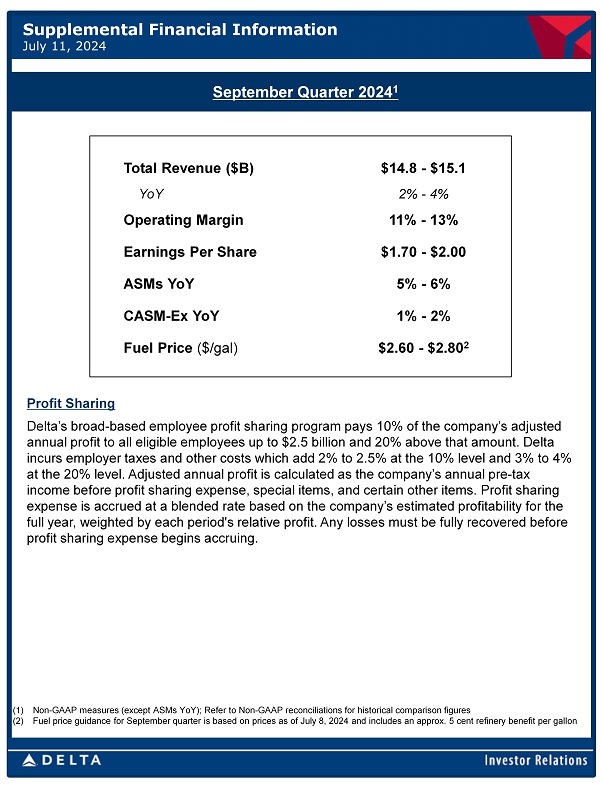
$14.8 - $15.1 Total Revenue ($B) 2% - 4% YoY 11% - 13% Operating Margin $1.70 - $2.00 Earnings Per Share 5% - 6% ASMs YoY 1% - 2% CASM - Ex YoY $2.60 - $2.80 2 Fuel Price ($/gal) September Quarter 2024 1 Supplemental Financial Information July 11, 2024 (1) Non - GAAP measures (except ASMs YoY); Refer to Non - GAAP reconciliations for historical comparison figures (2) Fuel price guidance for September quarter is based on prices as of July 8, 2024 and includes an approx. 5 cent refinery benefit per gallon Profit Sharing Delta’s broad - based employee profit sharing program pays 10% of the company’s adjusted annual profit to all eligible employees up to $2.5 billion and 20% above that amount. Delta incurs employer taxes and other costs which add 2% to 2.5% at the 10% level and 3% to 4% at the 20% level. Adjusted annual profit is calculated as the company’s annual pre - tax income before profit sharing expense, special items, and certain other items. Profit sharing expense is accrued at a blended rate based on the company’s estimated profitability for the full year , weighted by each period's relative profit. Any losses must be fully recovered before profit sharing expense begins accruing.
Forward Looking Statements Statements made in this presentation that are not historical facts, including statements regarding our estimates, expectations, beliefs, intentions, projections, goals, aspirations, commitments or strategies for the future, should be considered “forward - looking statements” under the Securities Act of 1933, as amended, the Securities Exchange Act of 1934, as amended, and the Private Securities Litigation Reform Act of 1995. Such statements are not guarantees or promised outcomes and should not be construed as such. All forward - looking statements involve a number of risks and uncertainties that could cause actual results to differ materially from the estimates, expectations, beliefs, intentions, projections, goals, aspirations, commitments and strategies reflected in or suggested by the forward - looking statements. These risks and uncertainties include, but are not limited to, the possible effects of serious accidents involving our aircra ft or aircraft of our airline partners; breaches or lapses in the security of technology systems we use and rely on, which could compromise the data stored within them, as well as failure to comply with evolving global privacy and security regulatory obligations or adequately address increasing customer focus on privacy issues and data security; disruptions in our information technology infrastructure; our dependence on technology in our operations; increases in the cost of aircraft fuel; extended disruptions in the supply of aircraft fuel, including from Monroe Energy, LLC (“Monroe”), a wholly - owned subsidiary of Delta that operates the Trainer refinery; failure to receive the expected results or returns from our commercia l relationships with airlines in other parts of the world and the investments we have in certain of those airlines; the effects of a significant disruption in the operations or performance of third parties on which we rely; failure to comply with the financial and other covenants in our financing agreements; labor issues; the effects on our business of seasonality and other factors beyond our control, such as changes in value in our equity investments, severe weather conditions, natural disasters or other environmental events, including from the impact of climate change; failure or inability of insurance to cover a significant liability at Monroe’s refinery; failure to comply with existing and future environmental regulations to which Monroe’s refinery operations are subject, including costs related to compliance with renewable fuel standard regulations; significant damage to our reputation and brand, including from exposure to significant adverse publicity or inability to achieve certain sustainability goals; our ability to retain senior management and other key employees, and to maintain our company culture; disease outbreaks, such as the COVID - 19 pandemic or similar public health threats, and measures implemented to combat them; the effects of terrorist attacks, geopolitical conflict or security events; competitive conditions in the airline industry; extended interruptions or disruptions in service at major airports at which we operate or significant problems associated with types of aircraft or engines we operate; the effects of extensive government regulation we are subject to; the impact of environmental regulation, including but not limited to regulation of hazardous substances, increased regulation to reduce emissions and other risks associated with climate change, and the cost of compliance with more stringent environmental regulations; and unfavorable economic or political conditions in the markets in which we operate or volatility in currency exchange rates. Additional information concerning risks and uncertainties that could cause differences between actual results and forward - looking statements is contained in our Securities and Exchange Commission filings, including our Annual Report on Form 10 - K for the fiscal year ended December 31, 2023. Caution should be taken not to place undue reliance on our forward - looking statements, which represent our views only as of the date of this presentation, and which we undertake no obligation to update except to the extent required by law.
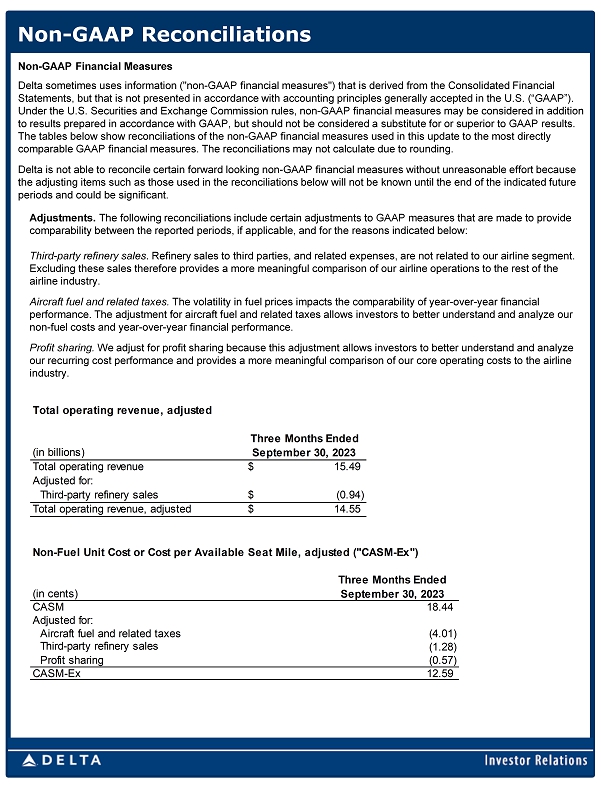
Non - GAAP Reconciliations Non - GAAP Financial Measures Delta sometimes uses information ("non - GAAP financial measures") that is derived from the Consolidated Financial Statements, but that is not presented in accordance with accounting principles generally accepted in the U.S. (“GAAP”). Under the U.S. Securities and Exchange Commission rules, non - GAAP financial measures may be considered in addition to results prepared in accordance with GAAP, but should not be considered a substitute for or superior to GAAP results. The tables below show reconciliations of the non - GAAP financial measures used in this update to the most directly comparable GAAP financial measures. The reconciliations may not calculate due to rounding. Delta is not able to reconcile certain forward looking non - GAAP financial measures without unreasonable effort because the adjusting items such as those used in the reconciliations below will not be known until the end of the indicated future periods and could be significant. Adjustments. The following reconciliations include certain adjustments to GAAP measures that are made to provide comparability between the reported periods, if applicable, and for the reasons indicated below: Third - party refinery sales . Refinery sales to third parties, and related expenses, are not related to our airline segment. Excluding these sales therefore provides a more meaningful comparison of our airline operations to the rest of the airline industry. Aircraft fuel and related taxes. The volatility in fuel prices impacts the comparability of year - over - year financial performance. The adjustment for aircraft fuel and related taxes allows investors to better understand and analyze our non - fuel costs and year - over - year financial performance. Profit sharing. We adjust for profit sharing because this adjustment allows investors to better understand and analyze our recurring cost performance and provides a more meaningful comparison of our core operating costs to the airline industry. Three Months Ended (in cents) September 30, 2023 CASM 18.44 Aircraft fuel and related taxes (4.01) Third-party refinery sales (1.28) Profit sharing (0.57) 12.59 CASM-Ex Adjusted for: Non-Fuel Unit Cost or Cost per Available Seat Mile, adjusted ("CASM-Ex") Three Months Ended (in billions) September 30, 2023 15.49$ Third-party refinery sales (0.94)$ 14.55$ Total operating revenue, adjusted Total operating revenue Adjusted for: Total operating revenue, adjusted