Document
|
|
|
|
|
|
| Contacts: |
|
| Thomas G. Zernick |
Scott J. McKim |
| Chief Executive Officer |
Chief Financial Officer |
| 727.399.5680 |
727.521.7085 |
BayFirst Financial Corp. Reports First Quarter 2025 Results
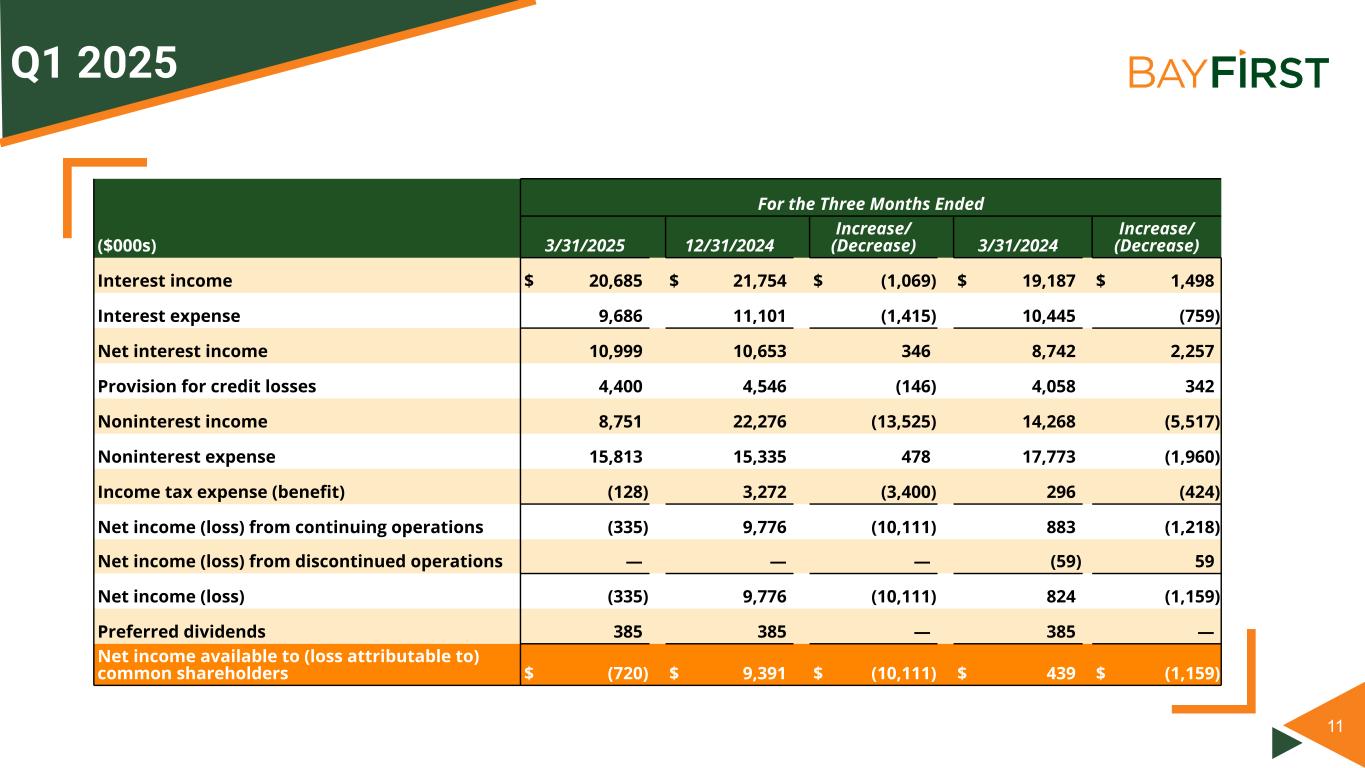
ST. PETERSBURG, FL. — April 24, 2025 — BayFirst Financial Corp. (NASDAQ: BAFN) (“BayFirst” or the “Company”), parent company of BayFirst National Bank (the “Bank”) today reported a net loss of $0.3 million, or $0.17 per common share and diluted common share, for the first quarter of 2025, a decrease of 103.4% compared to $9.8 million, or $2.27 per common share or $2.11 per diluted common share, in the fourth quarter of 2024.
“While we were encouraged by net interest margin expansion and steady operating expenses during the quarter, our operating results were impacted by deteriorating economic conditions, resulting in net charge-offs and provision expense continuing to be elevated and lower valuations on our portfolio of loans measured at fair value,” stated Thomas G. Zernick, Chief Executive Officer. “Our business customers have been impacted by inflationary pressures, the continued high interest rate environment, recent macro economic changes and the resulting uncertainty. While we wait for clarity regarding the level and duration of the tariffs and begin to see the impact to the general economy from the recent policy changes, we will continue our practice of robust loan oversight and maintain close contact with our borrowers to better understand the longer-term implication to their businesses.”
“Part of our strategic plan is to grow recurring revenue through net interest income, thereby resulting in less reliance on the gain on sale from government guaranteed loans,” Zernick continued. “A critical element of this strategy focuses on growing our low-cost deposit account base to fund our rapidly expanding conventional commercial and consumer loan portfolios. During the quarter, we did a good job of growing core deposit accounts while letting higher-cost time deposits run off. We serve individuals, families and small businesses, with a focus on checking and savings accounts which are not only less rate sensitive but also are far less volatile. Moreover, our focus on providing checking and savings accounts to a broad segment of the communities we serve expands our overall franchise in the attractive Tampa Bay region and increases opportunities for offering consumer loans, residential mortgages, and small business loans throughout our markets. As management works diligently to address credit concerns moving forward, we are exploring strategies to de-risk unguaranteed SBA loan balances on our balance sheet including portfolio sales and continuing to strengthen credit underwriting on SBA 7(a) loans.”
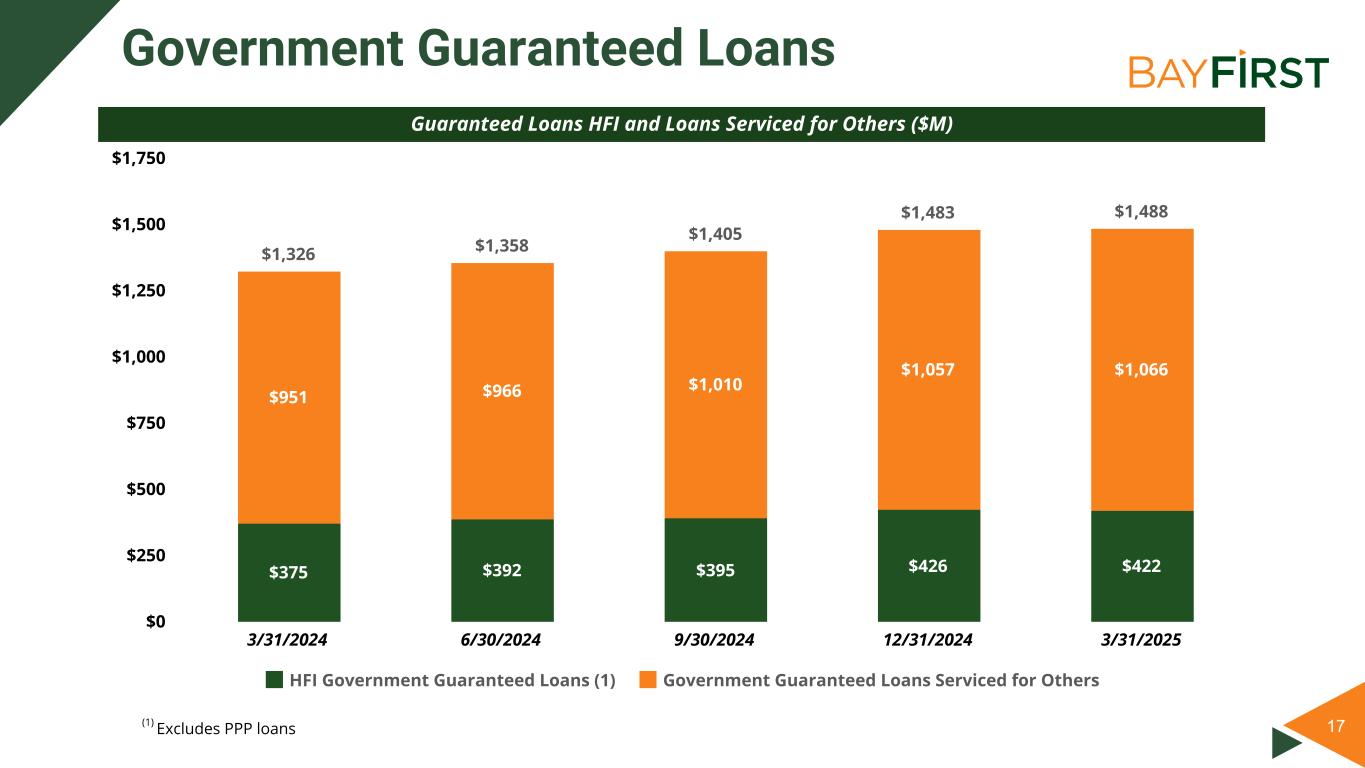
“One of the highlights of the first quarter was strong loan growth within the community bank, supported by steady loan demand in the greater Tampa Bay market,” said Zernick. “Total loans held for investment increased nearly 2% during the first quarter and 16% over the past year. Community bank loans increased 4% during the current quarter, which included increases in CRE and consumer loans, while government guaranteed loan balances decreased 2% during the quarter. Despite a volatile national economic environment, our focus on local relationships and personalized banking solutions remains at the core of our success. We remain confident in our ability to return to profitability and drive long-term shareholder value while staying true to our mission of supporting the financial well-being of our local communities.”
First Quarter 2025 Performance Review
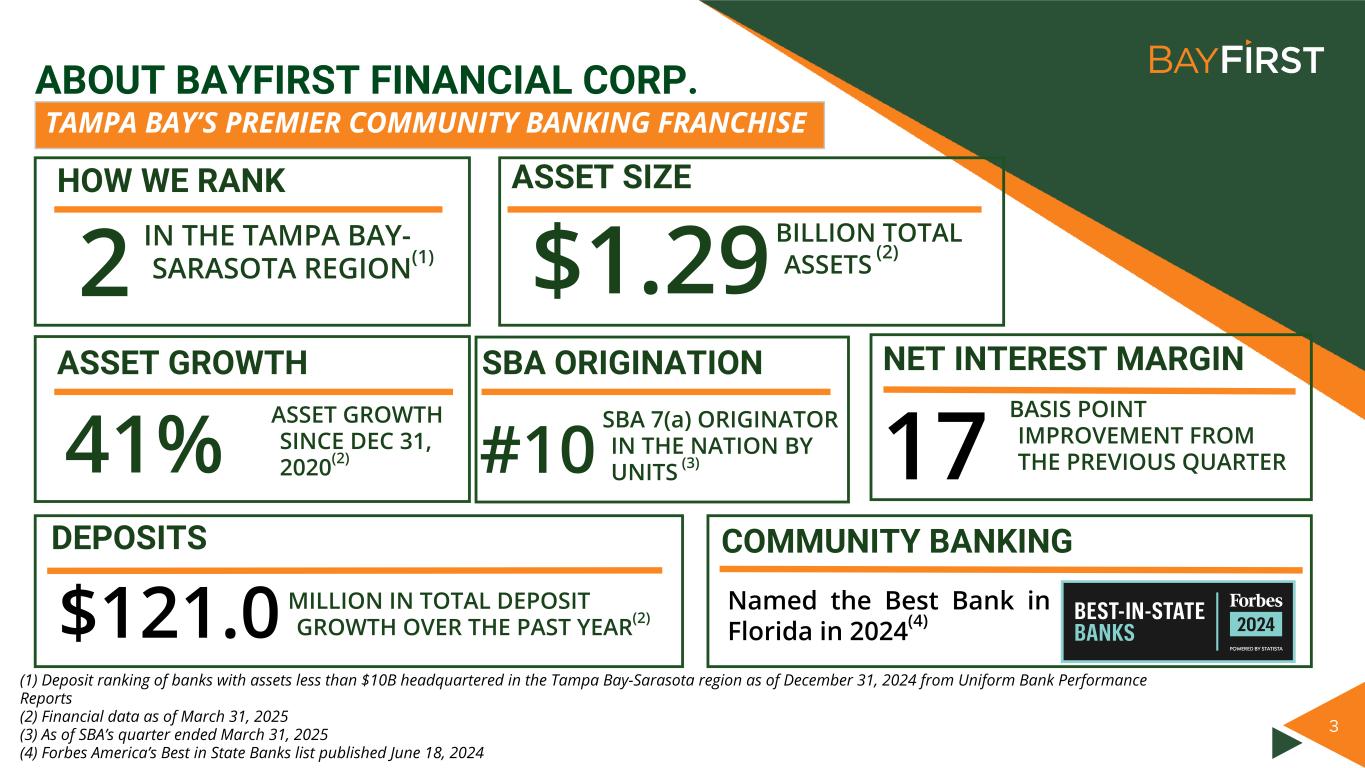
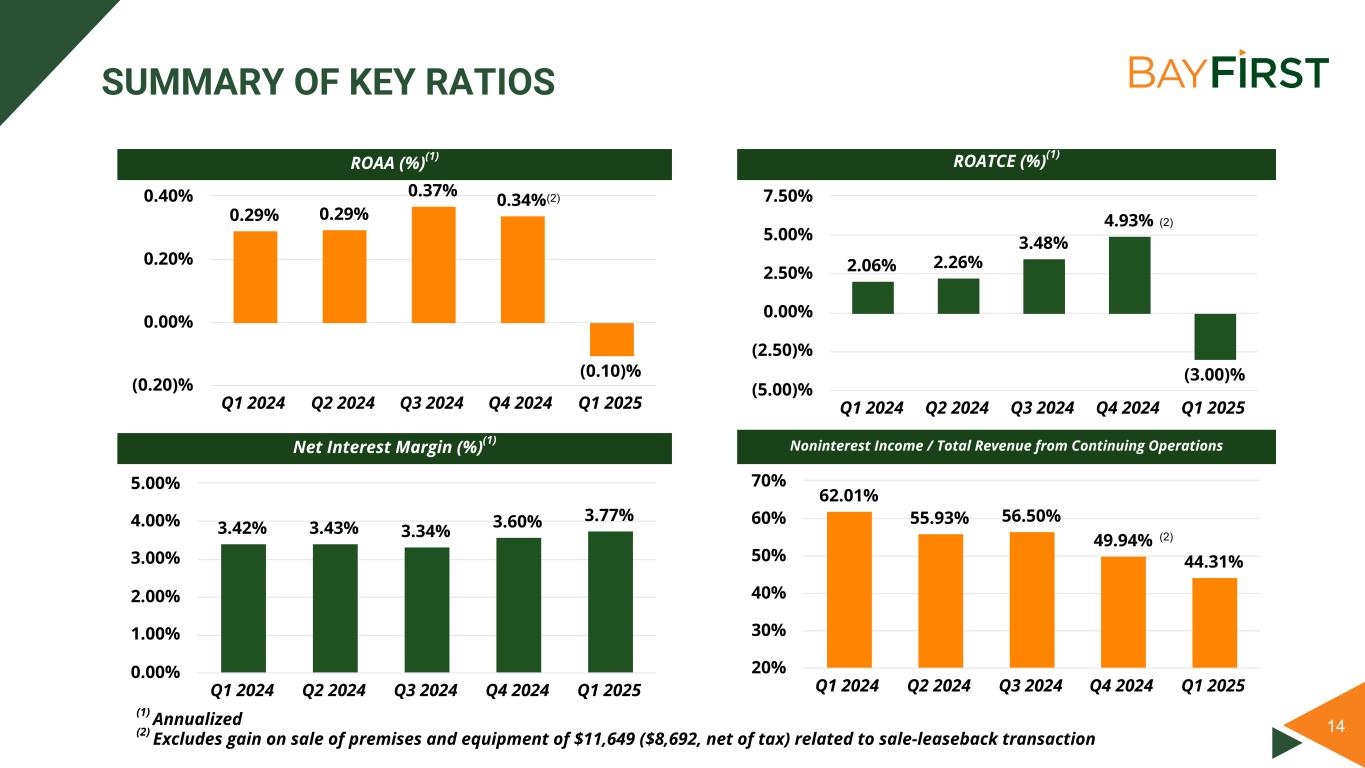
•Net interest margin was 3.77% in the first quarter of 2025, an increase of 17 basis points from 3.60% in the fourth quarter of 2024 and an increase of 35 basis points from 3.42% in the first quarter of 2024.
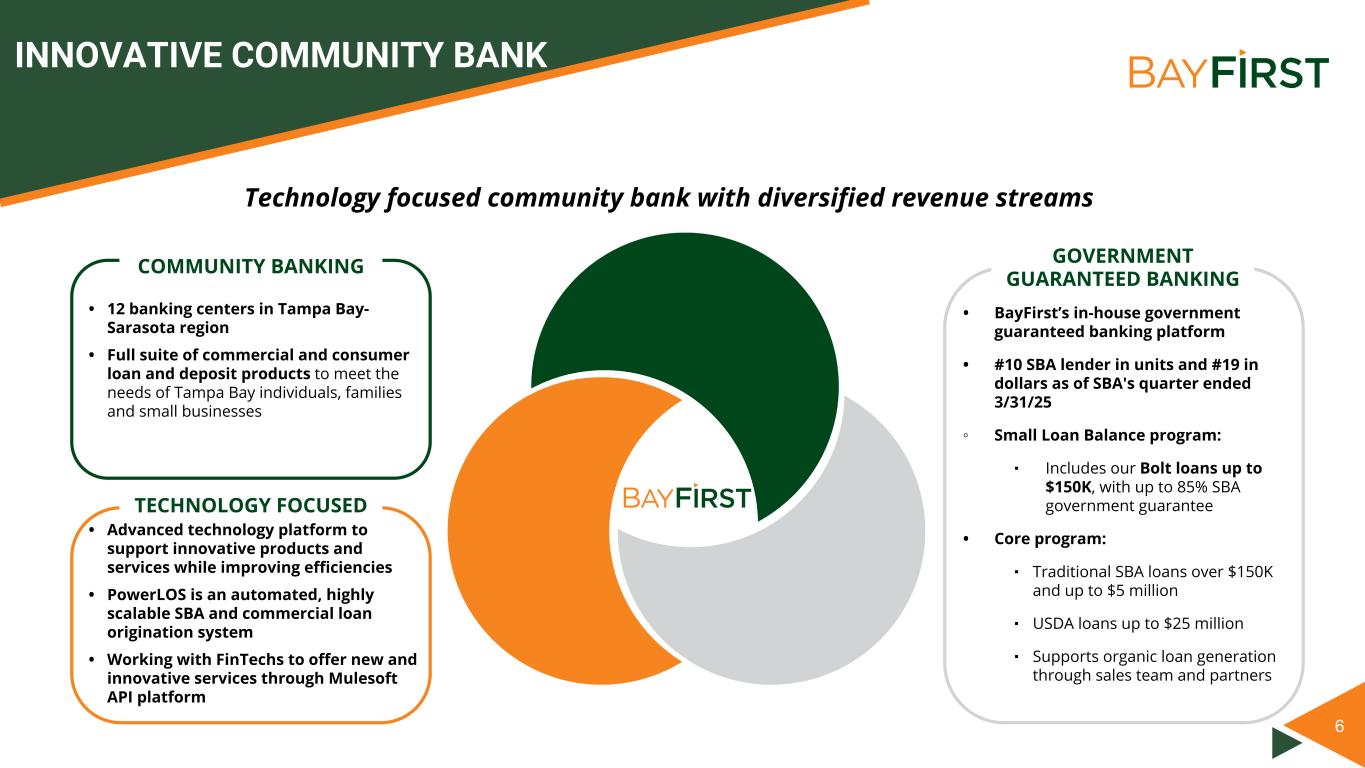
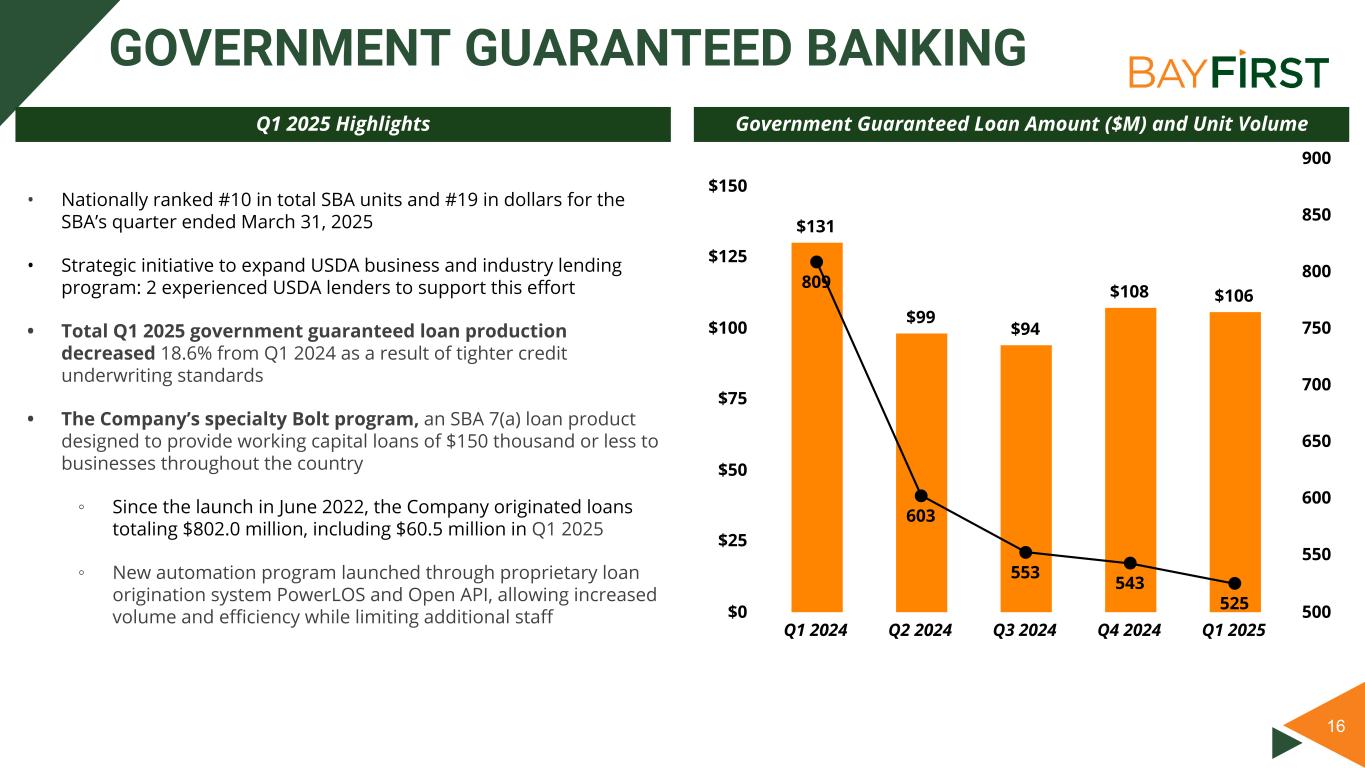
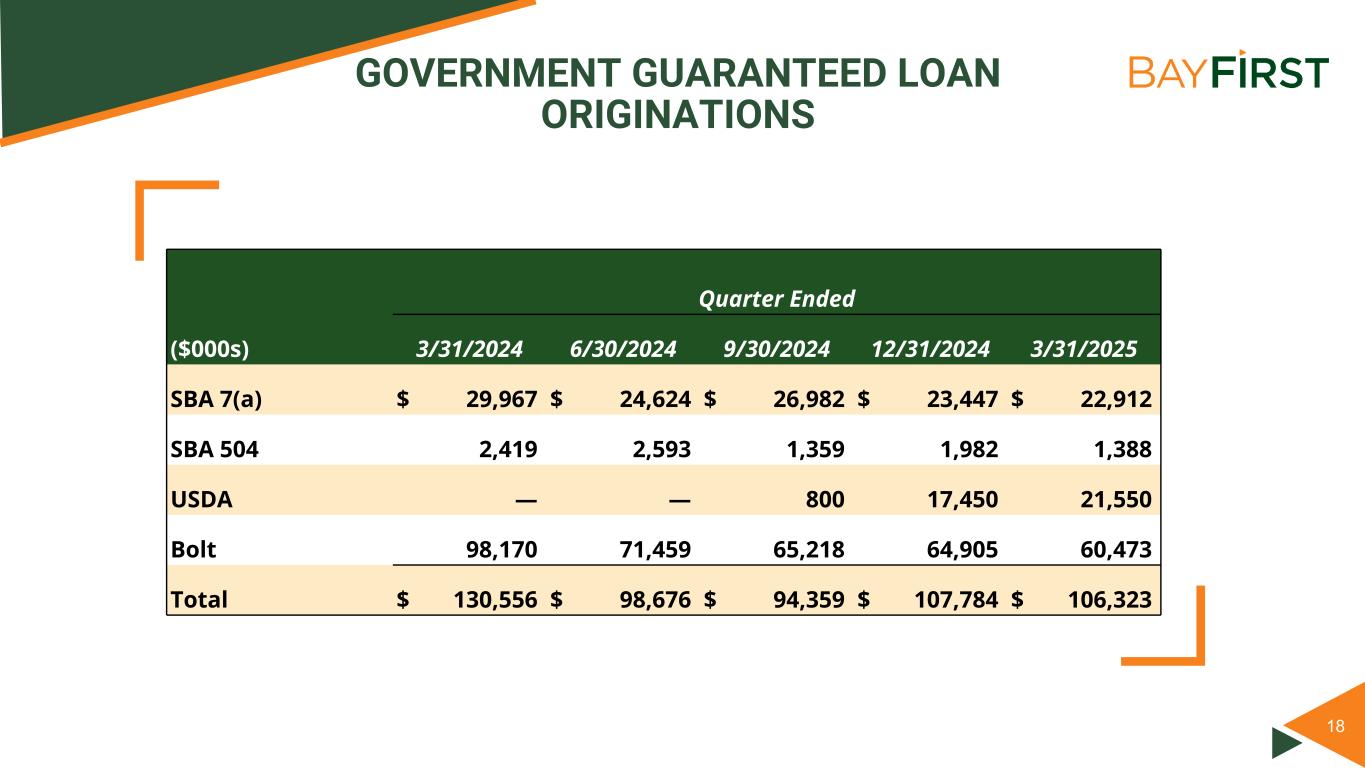
•The Company’s government guaranteed loan team originated $106.3 million in new loans during the first quarter of 2025, a slight decrease from $107.8 million of loans produced in the previous quarter, and a decrease from $130.6 million of loans produced during the first quarter of 2024. Since the launch in 2022 of the Company's Bolt loan program, an SBA 7(a) loan product designed to expeditiously provide working capital loans of $150 thousand or less, the Company has originated 6,207 Bolt loans totaling $802.0 million, of which 481 Bolt loans totaling $60.5 million were originated during the first quarter.
BayFirst Financial Corp. Reports First Quarter 2025 Results
April 24, 2025
Page 2
•As we reported last quarter, the Company is pausing the practice of electing to measure SBA 7(a) loans at fair value and continued that in the first quarter, however one originated USDA guaranteed loan for $4.8 million was measured at fair value during the first quarter of 2025 versus no loans in the fourth quarter of 2024 and $37 million in the first quarter of 2024.
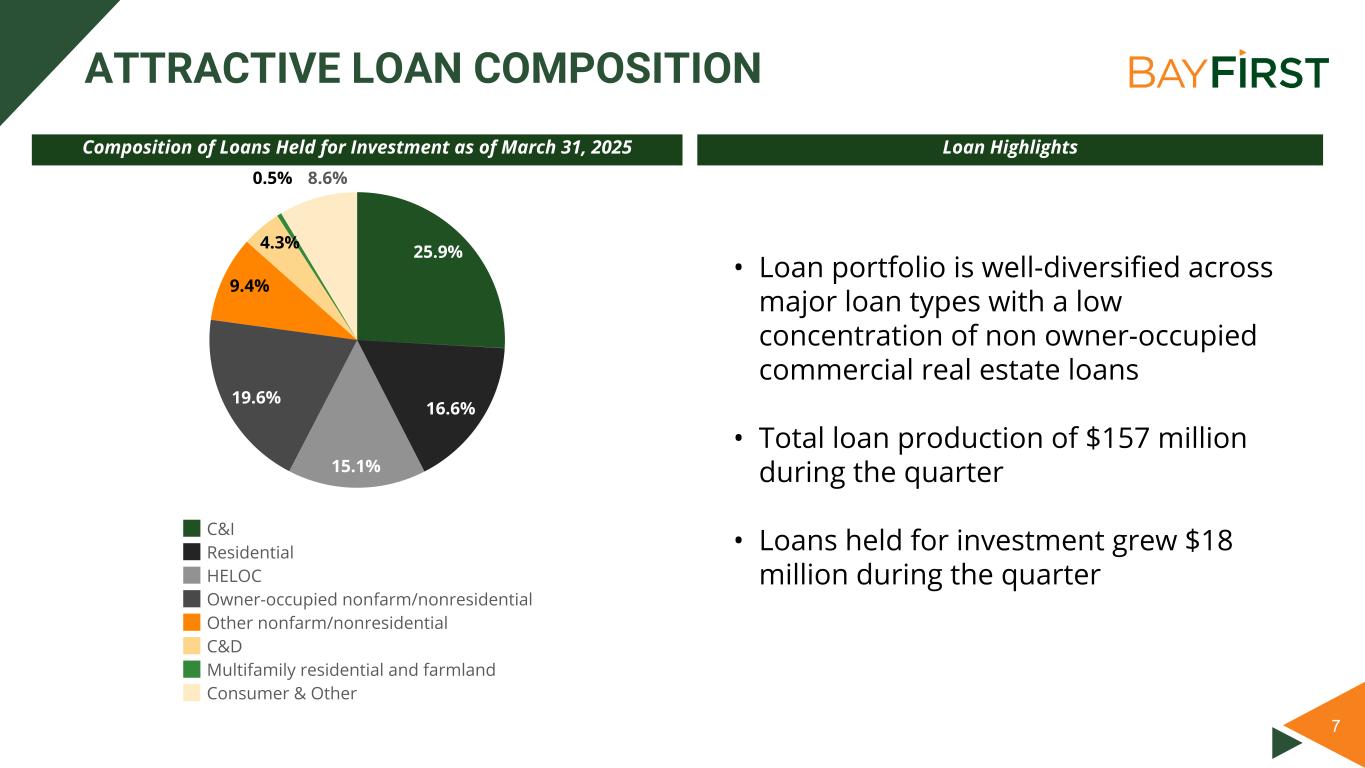
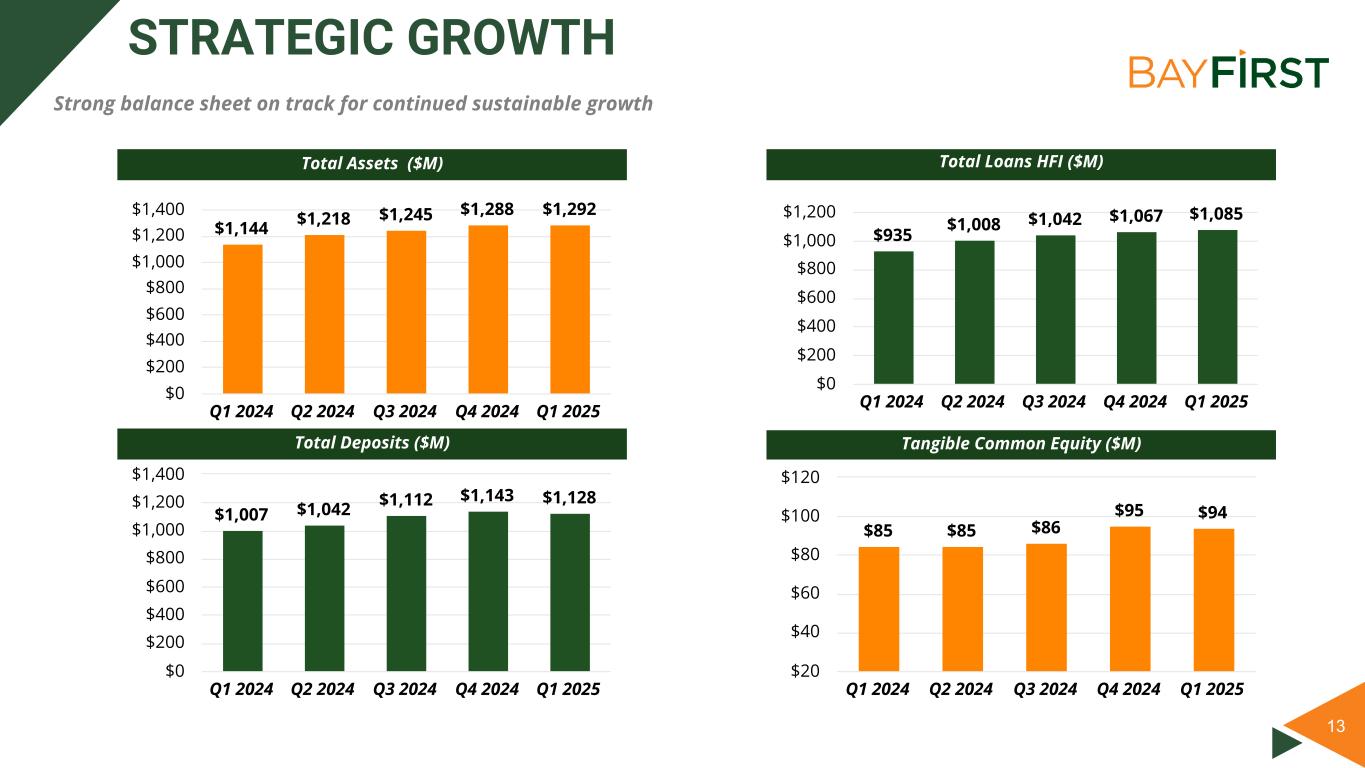
•Loans held for investment increased by $18.3 million, or 1.7%, during the first quarter of 2025 to $1.08 billion and increased $149.9 million, or 16.0%, over the past year. During the quarter, the Company originated $157.5 million of loans and sold $72.5 million of government guaranteed loan balances.
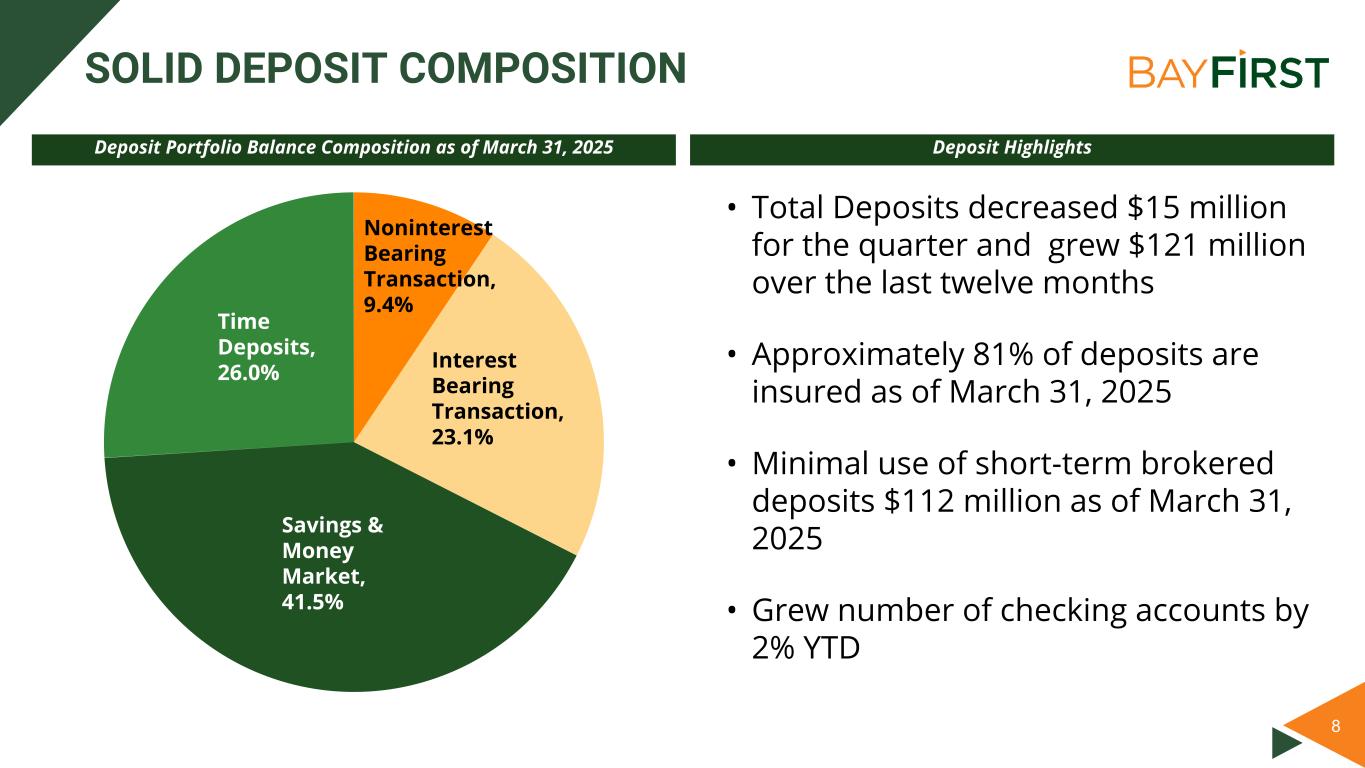
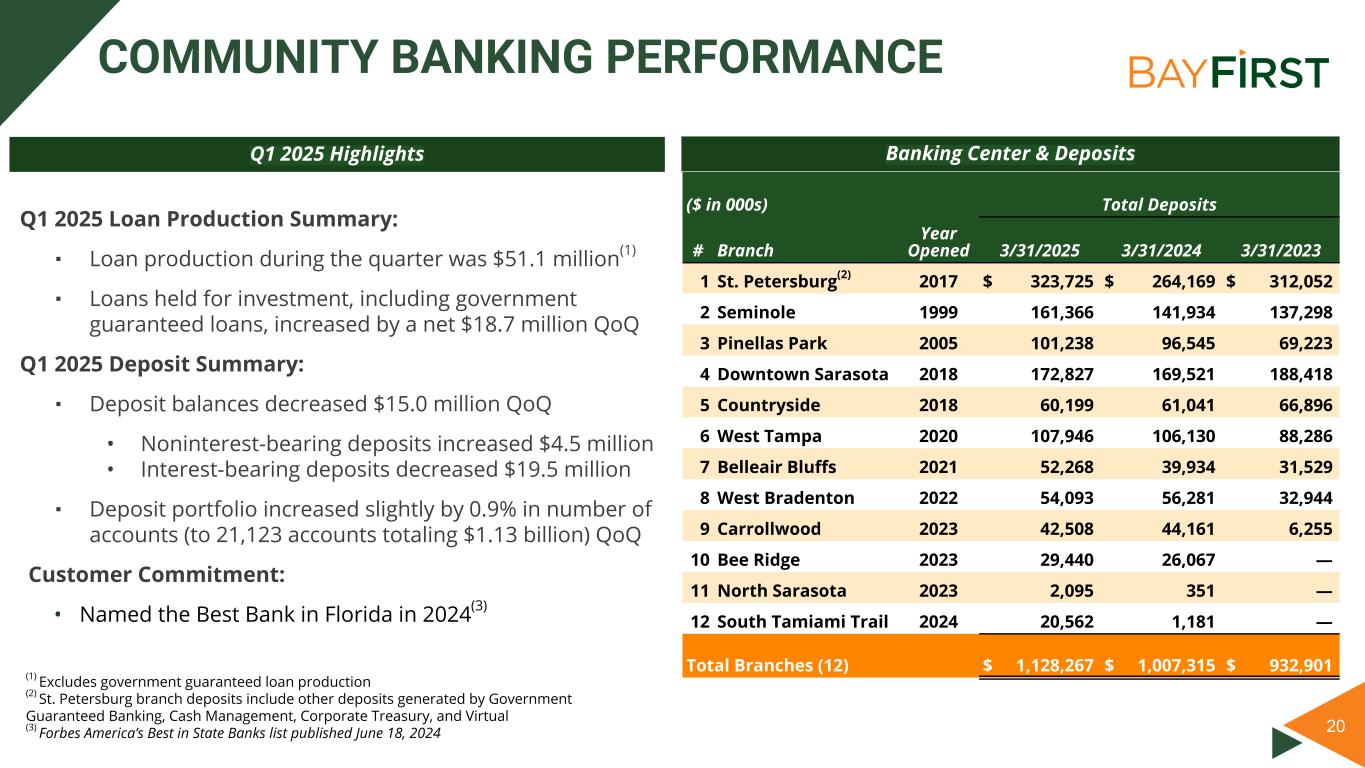
•Deposits decreased $15.0 million, or 1.3%, during the first quarter of 2025 and increased $121.0 million, or 12.0%, over the past year to $1.13 billion. A $19.5 million decrease in deposits during the quarter was in primarily high cost interest-bearing time deposits while noninterest-bearing checking accounts increased $4.5 million during the quarter.
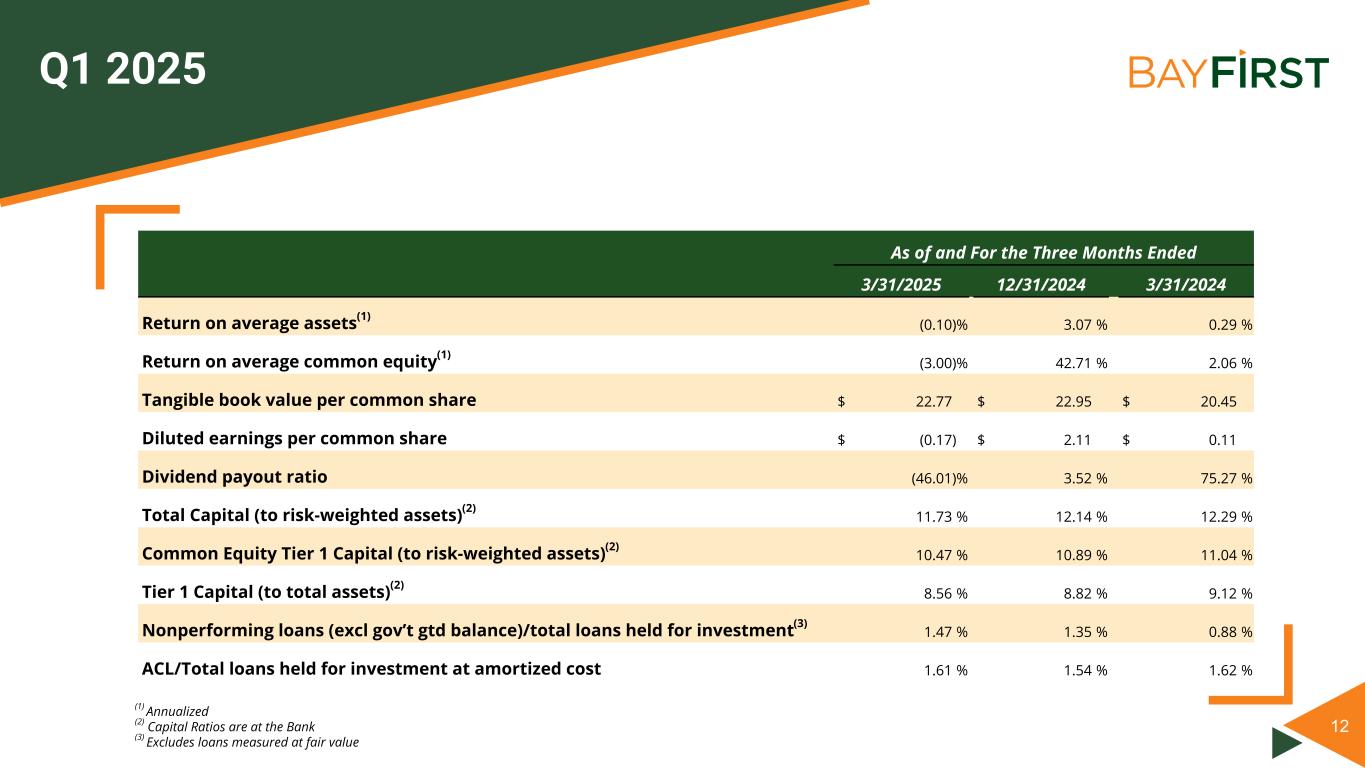
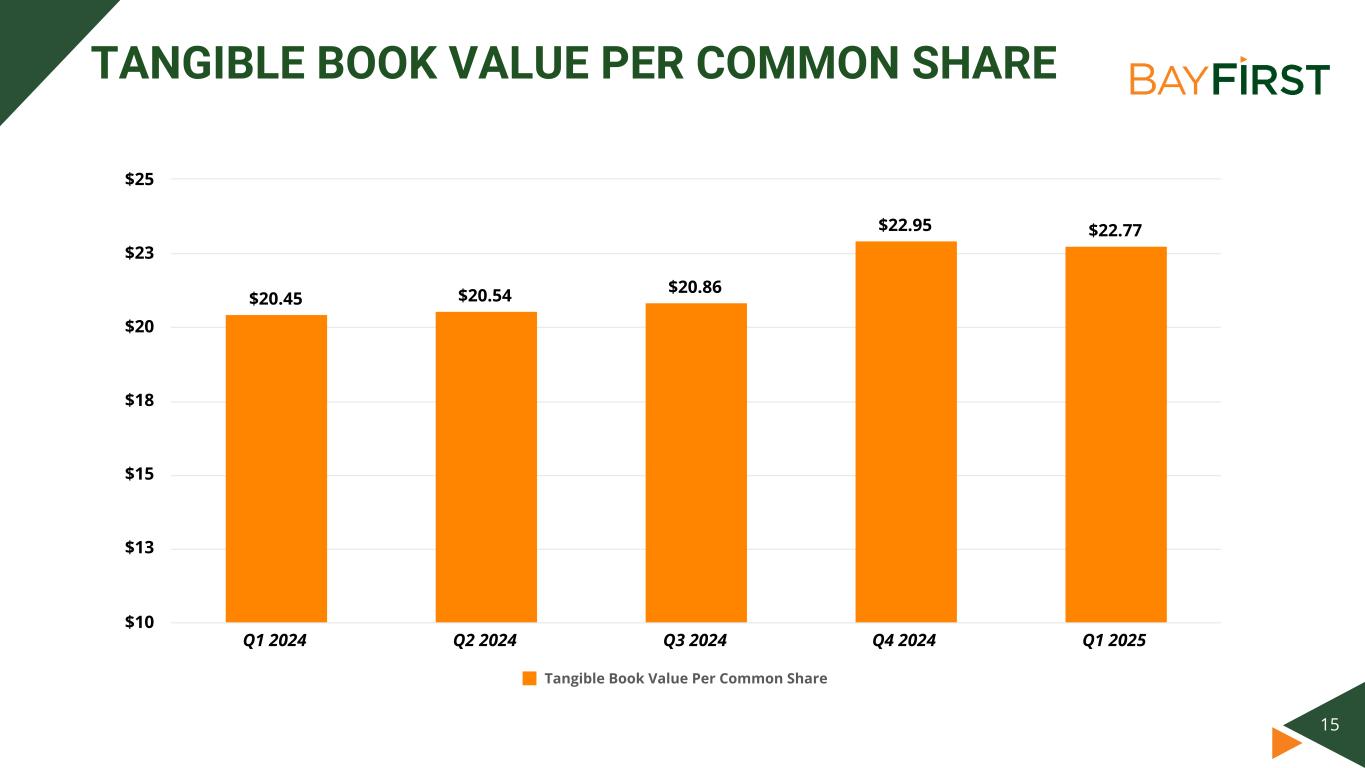
•Book value and tangible book value at March 31, 2025 were $22.77 per common share, a decrease from $22.95 at December 31, 2024.
Results of Operations
Net Income (Loss)
The Company had a net loss of $0.3 million for the first quarter of 2025, compared to net income of $9.8 million in the fourth quarter of 2024 and $0.8 million in the first quarter of 2024. The change in the first quarter of 2025 from the preceding quarter was primarily the result of the pre-tax gain on sale of two branch office properties of $11.6 million in the fourth quarter of 2024, which was part of a sale-leaseback transaction. Also contributing to lower earnings was a decrease in gain on sale of government guaranteed loans of $1.1 million, a decrease in government guaranteed loan fair value gains of $0.7 million, and an increase in noninterest expense of $0.5 million, primarily higher occupancy and data processing costs, partially offset by an increase in net interest income of $0.3 million and a decrease in income tax expense on continuing operations of $3.4 million. The change from the first quarter of 2024 was due to a decrease in gain on sale of government guaranteed loans of $0.8 million, a decrease in government guaranteed loan fair value gains of $4.1 million, and a decrease in government guaranteed loan packaging fees of $0.7 million. This was partially offset by an increase in net interest income of $2.3 million and a decrease in noninterest expense of $2.0 million.
Net Interest Income and Net Interest Margin
Net interest income from continuing operations was $11.0 million in the first quarter of 2025, an increase from $10.7 million during the fourth quarter of 2024, and an increase from $8.7 million during the first quarter of 2024. The net interest margin was 3.77% in the first quarter of 2025, an increase of 17 basis points from 3.60% in the fourth quarter of 2024 and an increase of 35 basis points from 3.42% in the first quarter of 2024.
The increase in net interest income from continuing operations during the first quarter of 2025, as compared to the fourth quarter of 2024, was mainly due to a decrease in interest cost on deposits of $1.2 million, partially offset by a decrease in loan interest income, including fees, of $1.0 million.
The increase in net interest income from continuing operations during the first quarter of 2025, as compared to the year ago quarter, was mainly due to an increase in loan interest income, including fees, of $1.5 million and a decrease in interest expense on deposits of $0.8 million.
Noninterest Income
Noninterest income from continuing operations was $8.8 million for the first quarter of 2025, which was a decrease from $22.3 million in the fourth quarter of 2024 and a decrease from $14.3 million in the first quarter of 2024. This $5.5 million decrease is due to lower borrower demand combined with tighter credit guidelines deployed over the past year. The decrease in the first quarter of 2025, as compared to the fourth quarter of 2024, was primarily the result of the pre-tax gain on sale of two branch office properties of $11.6 million in the fourth quarter of 2024, which was part of a sale-leaseback transaction, and decreases in gain on sale of government guaranteed loans of $1.1 million and government guaranteed loan fair value gains of $0.7 million.
BayFirst Financial Corp. Reports First Quarter 2025 Results
April 24, 2025
Page 3
The decrease in the first quarter of 2025, as compared to the first quarter of 2024, was the result of decreases in gain on sale of government guaranteed loans of $0.8 million, fair value gains on government guaranteed loans of $4.1 million, and government guaranteed loan packaging fees of $0.7 million.
Noninterest Expense
Noninterest expense from continuing operations was $15.8 million in the first quarter of 2025 compared to $15.3 million in the fourth quarter of 2024 and $17.8 million in the first quarter of 2024. The increase in the first quarter of 2025, as compared to the prior quarter, was primarily due to increases in occupancy expense of $0.4 million, data processing expense of $0.3 million, and loan origination and collection expenses of $0.3 million, partially offset by a decrease in compensation expense of $0.4 million. The decrease in the first quarter of 2025, as compared to the first quarter of 2024, was primarily due to lower compensation expense of $1.5 million, professional fees of $0.6 million, and loan origination and collection expenses of $0.7 million. This was partially offset by higher occupancy expense of $0.5 million and data processing expense of $0.5 million.
Balance Sheet
Assets
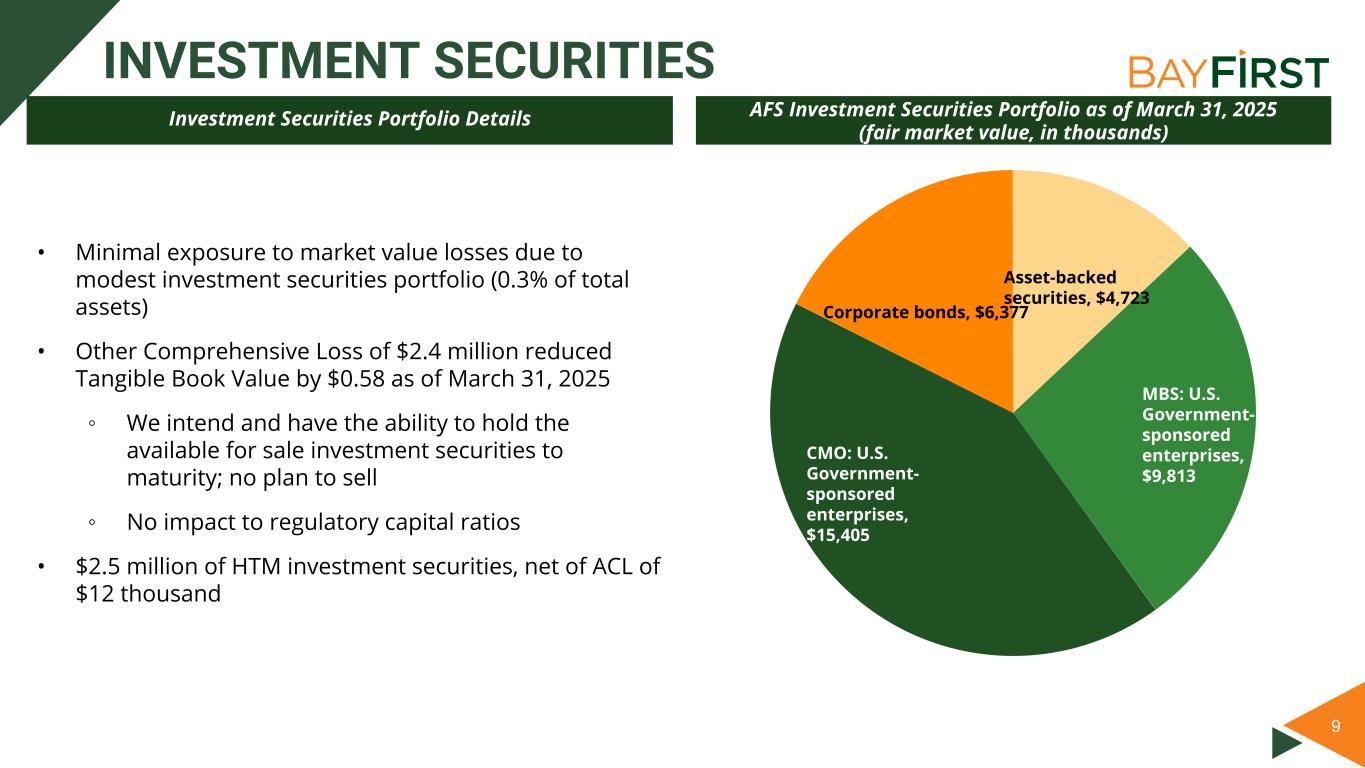
Total assets increased $3.7 million, or 0.3%, during the first quarter of 2025 to $1.29 billion, mainly due to increases in loans held for investment of $18.3 million, partially offset by a decrease in cash and cash equivalents of $14.6 million. Compared to the end of the first quarter last year, total assets increased $147.8 million, or 12.9%, driven primarily by growth of loans held for investment of $149.9 million.
Loans
Loans held for investment increased $18.3 million, or 1.7%, during the first quarter of 2025 and $149.9 million, or 16.0%, over the past year to $1.08 billion, due to originations in both conventional community bank loans and government guaranteed loans, partially offset by government guaranteed loan sales.
Deposits
Deposits decreased $15.0 million, or 1.3%, during the first quarter of 2025 and increased $121.0 million, or 12.0%, from the first quarter of 2024, ending March 31, 2025 at $1.13 billion. During the first quarter, there were decreases in savings and money market deposit account balances of $6.7 million and time deposit balances of $17.1 million, partially offset by increases in noninterest-bearing deposit account balances of $4.5 million and interest-bearing transaction account balances of $4.3 million. The majority of the deposits are generated through the community bank in the Tampa Bay/Sarasota area. At March 31, 2025, approximately 81% of total deposits were insured by the FDIC. At times, the Bank has brokered time deposit and non-maturity deposit relationships available to diversify its funding sources. At March 31, 2025, December 31, 2024, and March 31, 2024, the Company had $112.3 million, $112.1 million, and $30.5 million, respectively, of brokered deposits.
Asset Quality
The Company recorded a provision for credit losses in the first quarter of $4.4 million, compared to provisions of $4.5 million for the fourth quarter of 2024 and $4.1 million during the first quarter of 2024.
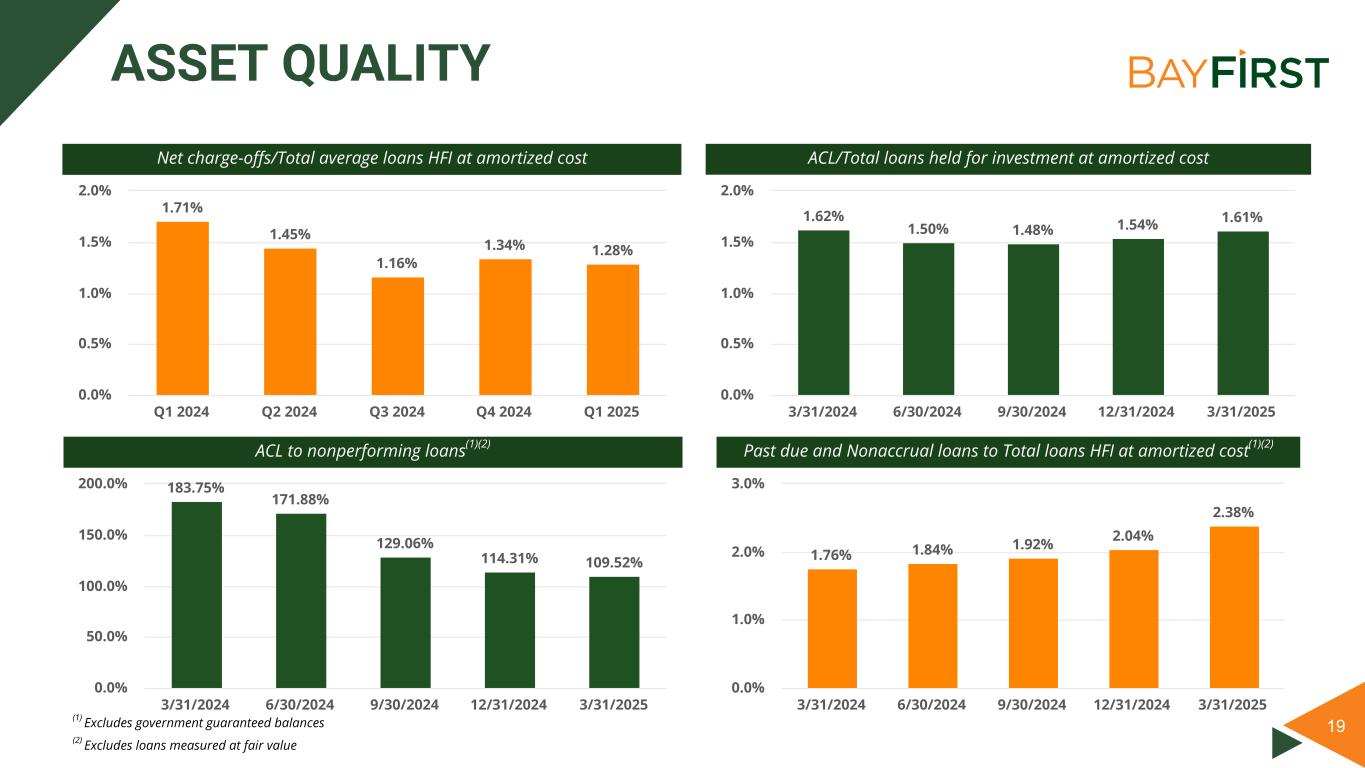
The ratio of ACL to total loans held for investment at amortized cost was 1.61% at March 31, 2025, 1.54% as of December 31, 2024, and 1.62% as of March 31, 2024. The ratio of ACL to total loans held for investment at amortized cost, excluding government guaranteed loan balances, was 1.84% at March 31, 2025, 1.79% as of December 31, 2024, and 1.88% as of March 31, 2024.
Net charge-offs for the first quarter of 2025 were $3.3 million, which was a decrease from $3.4 million for the fourth quarter of 2024 and $3.7 million in the first quarter of 2024. Annualized net charge-offs as a percentage of average loans held for investment at amortized cost were 1.28% for the first quarter of 2025, compared to 1.34% in the fourth quarter of 2024 and 1.71% in the first quarter of 2024. Nonperforming assets were 2.08% of total assets as of March 31, 2025, compared to 1.50% as of December 31, 2024, and 0.97% as of March 31, 2024.
BayFirst Financial Corp. Reports First Quarter 2025 Results
April 24, 2025
Page 4
Nonperforming assets, excluding government guaranteed loan balances, were 1.22% of total assets as of March 31, 2025, compared to 1.06% as of December 31, 2024, and 0.70% as of March 31, 2024. As we discussed in previous quarters, the Bank developed an express modification program for SBA 7(a) borrowers to help those borrowers who are challenged with larger payments in the higher interest rate environment compared to interest rates at the time the loans were originated.
Capital
The Bank’s Tier 1 leverage ratio was 8.56% as of March 31, 2025, compared to 8.82% as of December 31, 2024, and 9.12% as of March 31, 2024. The CET 1 and Tier 1 capital ratio to risk-weighted assets were 10.47% as of March 31, 2025, compared to 10.89% as of December 31, 2024, and 11.04% as of March 31, 2024. The total capital to risk-weighted assets ratio was 11.73% as of March 31, 2025, compared to 12.14% as of December 31, 2024, and 12.29% as of March 31, 2024.
Liquidity
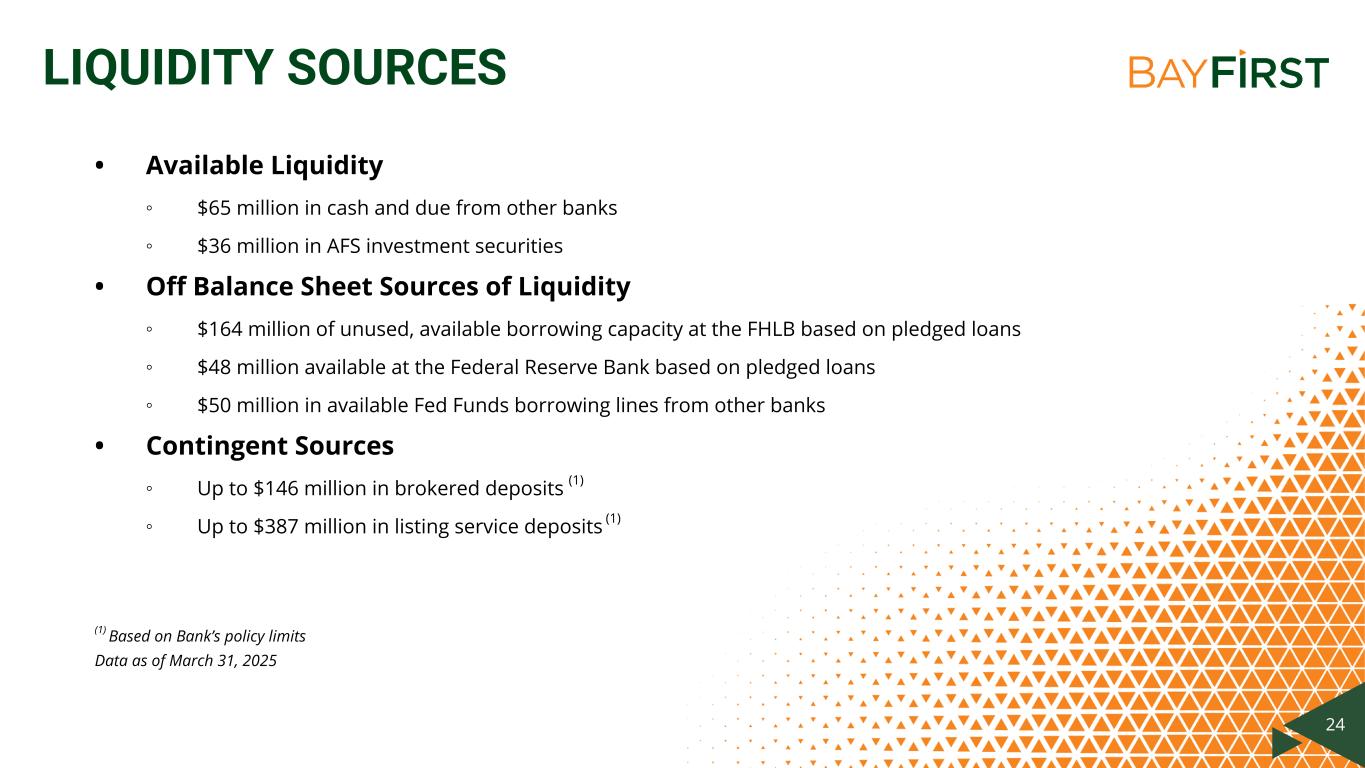
The Bank's overall liquidity position remains strong and stable with liquidity in excess of internal minimums as stated by policy and monitored by management and the Board. The on-balance sheet liquidity ratio at March 31, 2025 was 8.04%, as compared to 9.17% at December 31, 2024. The Bank has robust liquidity resources which include secured borrowings available from the Federal Home Loan Bank, the Federal Reserve, and lines of credit with other financial institutions. As of March 31, 2025, the Bank had $20.0 million of borrowings from the FHLB and no borrowings from the FRB or other financial institutions. This compared to no borrowings from FHLB, the FRB, or other financial institutions at December 31, 2024.
Recent Events
Share Repurchase Program. During the first quarter of 2025, the Company announced that its Board of Directors has adopted a share repurchase program. Under the repurchase program, the Company may repurchase up to $2.0 million of the Company’s outstanding shares, over a period beginning on January 28, 2025, and continuing until the earlier of the completion of the repurchase, or December 31, 2025, or termination of the program by the Board of Directors. To date, the Company has purchased $335 thousand of shares through this share repurchase program.
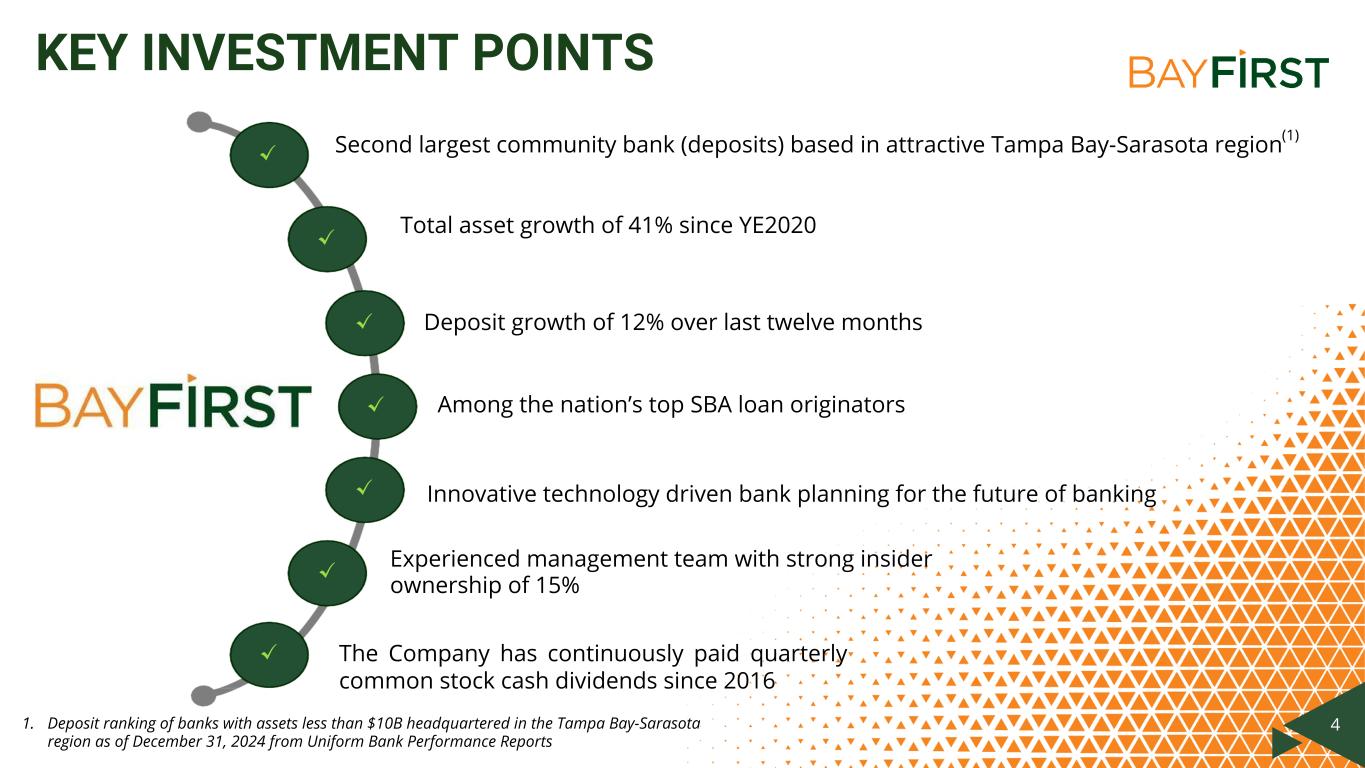
Second Quarter Common Stock Dividend. On April 22, 2025, BayFirst’s Board of Directors declared a second quarter 2025 cash dividend of $0.08 per common share. The dividend will be payable June 15, 2025 to common shareholders of record as of June 1, 2025. The Company has continuously paid quarterly common stock cash dividends since 2016.
Conference Call
BayFirst’s management team will host a conference call on Friday, April 25, 2025, at 9:00 a.m. ET to discuss its first quarter results. Interested investors may listen to the call live under the Investor Relations tab at www.bayfirstfinancial.com. Investment professionals are invited to dial (800) 549-8228 to participate in the call using Conference ID 90275. A replay of the call will be available for one year at www.bayfirstfinancial.com.
About BayFirst Financial Corp.
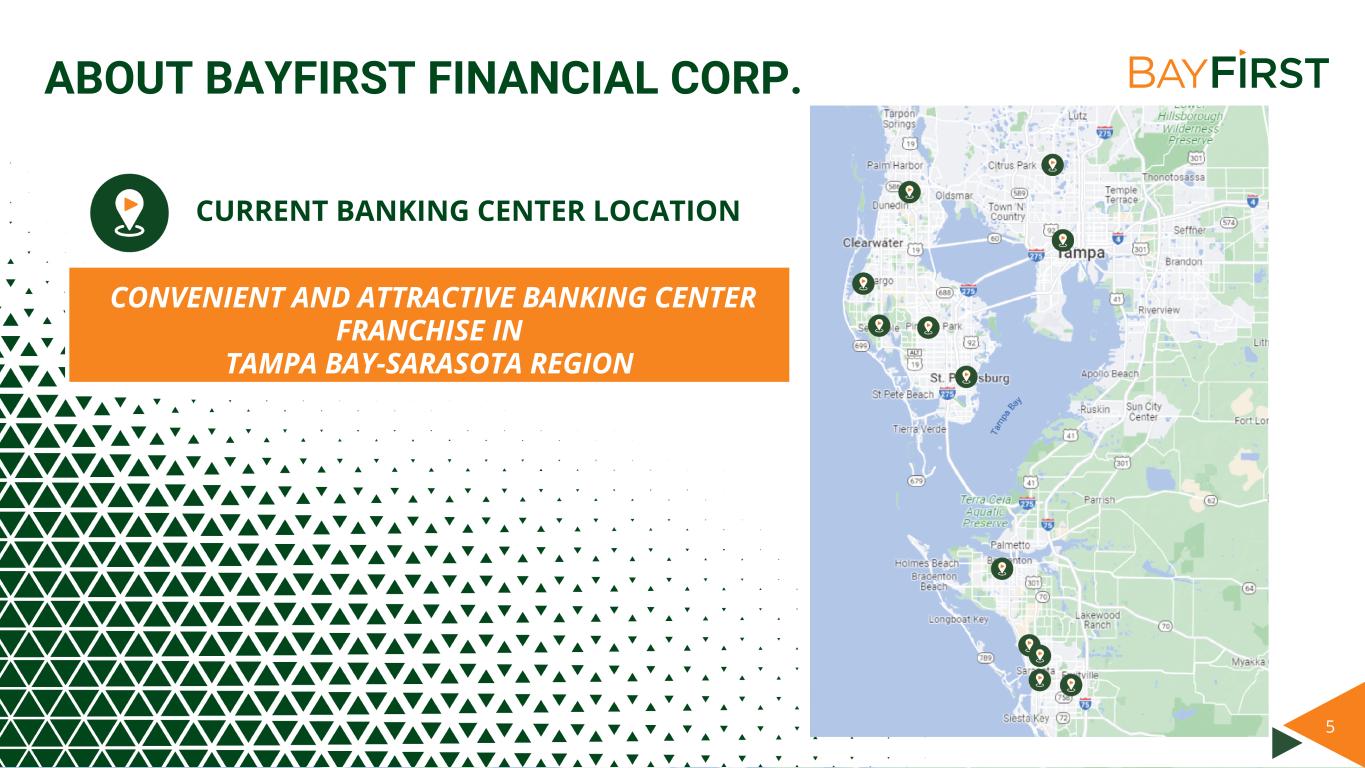
BayFirst Financial Corp. is a registered bank holding company based in St. Petersburg, Florida which commenced operations on September 1, 2000. Its primary source of income is derived from its wholly owned subsidiary, BayFirst National Bank, a national banking association which commenced business operations on February 12, 1999. The Bank currently operates twelve full-service banking offices throughout the Tampa Bay-Sarasota region and offers a broad range of commercial and consumer banking services to businesses and individuals. It was named the best bank in Florida in 2024, according to Forbes and was the 10th largest SBA 7(a) lender by number of units originated and 19th largest by dollar volume nationwide through the SBA's quarter ended March 31, 2025. As of March 31, 2025, BayFirst Financial Corp. had $1.29 billion in total assets.
BayFirst Financial Corp. Reports First Quarter 2025 Results
April 24, 2025
Page 5
Forward-Looking Statements
In addition to the historical information contained herein, this presentation includes "forward-looking statements" within the meaning of such term in the Private Securities Litigation Reform Act of 1995. These statements are subject to many risks and uncertainties, including, but not limited to, the effects of health crises, global military hostilities, weather events, or climate change, including their effects on the economic environment, our customers and our operations, as well as any changes to federal, state or local government laws, regulations or orders in connection with them; the ability of the Company to implement its strategy and expand its banking operations; changes in interest rates and other general economic, business and political conditions, including changes in the financial markets; changes in business plans as circumstances warrant; risks related to mergers and acquisitions; changes in benchmark interest rates used to price loans and deposits, changes in tax laws, regulations and guidance; and other risks detailed from time to time in filings made by the Company with the SEC, including, but not limited to those “Risk Factors” described in our most recent Form 10-K and Form 10-Q. Readers should note that the forward-looking statements included herein are not a guarantee of future events, and that actual events may differ materially from those made in or suggested by the forward-looking statements.
BayFirst Financial Corp. Reports First Quarter 2025 Results
April 24, 2025
Page 6
BAYFIRST FINANCIAL CORP.
SELECTED FINANCIAL DATA (Unaudited)
|
|
|
|
|
|
|
|
|
|
|
|
|
|
|
|
|
|
|
|
|
|
|
|
|
|
|
|
|
|
|
At or for the three months ended |
| (Dollars in thousands, except for share data) |
3/31/2025 |
|
12/31/2024 |
|
9/30/2024 |
|
6/30/2024 |
|
3/31/2024 |
| Net income (loss) |
$ |
(335) |
|
|
$ |
9,776 |
|
|
$ |
1,137 |
|
|
$ |
866 |
|
|
$ |
824 |
|
| Balance sheet data: |
|
|
|
|
|
|
|
|
|
| Average loans held for investment at amortized cost |
1,027,648 |
|
|
1,003,867 |
|
|
948,528 |
|
|
902,417 |
|
|
855,040 |
|
| Average total assets |
1,287,618 |
|
|
1,273,296 |
|
|
1,228,040 |
|
|
1,178,501 |
|
|
1,126,315 |
|
| Average common shareholders’ equity |
96,053 |
|
|
87,961 |
|
|
86,381 |
|
|
84,948 |
|
|
85,385 |
|
| Total loans held for investment |
1,084,817 |
|
|
1,066,559 |
|
|
1,042,445 |
|
|
1,008,314 |
|
|
934,868 |
|
|
|
|
|
|
|
|
|
|
|
| Total loans held for investment, excl gov’t gtd loan balances |
943,979 |
|
|
917,075 |
|
|
885,444 |
|
|
844,659 |
|
|
776,302 |
|
| Allowance for credit losses |
16,513 |
|
|
15,512 |
|
|
14,186 |
|
|
13,843 |
|
|
13,906 |
|
| Total assets |
1,291,957 |
|
|
1,288,297 |
|
|
1,245,099 |
|
|
1,217,869 |
|
|
1,144,194 |
|
| Total deposits |
1,128,267 |
|
|
1,143,229 |
|
|
1,112,196 |
|
|
1,042,388 |
|
|
1,007,315 |
|
| Common shareholders’ equity |
94,034 |
|
|
94,869 |
|
|
86,242 |
|
|
84,911 |
|
|
84,578 |
|
| Share data: |
|
|
|
|
|
|
|
|
|
| Basic earnings (loss) per common share |
$ |
(0.17) |
|
|
$ |
2.27 |
|
|
$ |
0.18 |
|
|
$ |
0.12 |
|
|
$ |
0.11 |
|
| Diluted earnings (loss) per common share |
(0.17) |
|
|
2.11 |
|
|
0.18 |
|
|
0.12 |
|
|
0.11 |
|
| Dividends per common share |
0.08 |
|
|
0.08 |
|
|
0.08 |
|
|
0.08 |
|
|
0.08 |
|
| Book value per common share |
22.77 |
|
|
22.95 |
|
|
20.86 |
|
|
20.54 |
|
|
20.45 |
|
Tangible book value per common share (1) |
22.77 |
|
|
22.95 |
|
|
20.86 |
|
|
20.54 |
|
|
20.45 |
|
| Performance and capital ratios: |
|
|
|
|
|
|
|
|
|
Return on average assets(2) |
(0.10) |
% |
|
3.07 |
% |
|
0.37 |
% |
|
0.29 |
% |
|
0.29 |
% |
Return on average common equity(2) |
(3.00) |
% |
|
42.71 |
% |
|
3.48 |
% |
|
2.26 |
% |
|
2.06 |
% |
Net interest margin(2) |
3.77 |
% |
|
3.60 |
% |
|
3.34 |
% |
|
3.43 |
% |
|
3.42 |
% |
| Dividend payout ratio |
(46.01) |
% |
|
3.52 |
% |
|
43.98 |
% |
|
68.91 |
% |
|
75.27 |
% |
|
|
|
|
|
|
|
|
|
|
|
|
|
|
|
|
|
|
|
|
|
|
|
|
|
|
|
|
|
|
|
|
|
|
|
|
|
|
|
|
| Asset quality ratios: |
|
|
|
|
|
|
|
|
|
| Net charge-offs |
$ |
3,301 |
|
|
$ |
3,369 |
|
|
$ |
2,757 |
|
|
$ |
3,261 |
|
|
$ |
3,652 |
|
Net charge-offs/avg loans held for investment at amortized cost(2) |
1.28 |
% |
|
1.34 |
% |
|
1.16 |
% |
|
1.45 |
% |
|
1.71 |
% |
Nonperforming loans(3) |
$ |
24,806 |
|
|
$ |
17,607 |
|
|
$ |
15,489 |
|
|
$ |
12,312 |
|
|
$ |
9,877 |
|
Nonperforming loans (excluding gov't gtd balance)(3) |
$ |
15,078 |
|
|
$ |
13,570 |
|
|
$ |
10,992 |
|
|
$ |
8,054 |
|
|
$ |
7,568 |
|
Nonperforming loans/total loans held for investment(3) |
2.42 |
% |
|
1.75 |
% |
|
1.62 |
% |
|
1.34 |
% |
|
1.15 |
% |
Nonperforming loans (excl gov’t gtd balance)/total loans held for investment(3) |
1.47 |
% |
|
1.35 |
% |
|
1.15 |
% |
|
0.87 |
% |
|
0.88 |
% |
| ACL/Total loans held for investment at amortized cost |
1.61 |
% |
|
1.54 |
% |
|
1.48 |
% |
|
1.50 |
% |
|
1.62 |
% |
|
|
|
|
|
|
|
|
|
|
| ACL/Total loans held for investment at amortized cost, excl government guaranteed loans |
1.84 |
% |
|
1.79 |
% |
|
1.70 |
% |
|
1.73 |
% |
|
1.88 |
% |
| Other Data: |
|
|
|
|
|
|
|
|
|
| Full-time equivalent employees |
305 |
|
299 |
|
295 |
|
302 |
|
313 |
| Banking center offices |
12 |
|
12 |
|
12 |
|
12 |
|
12 |
|
|
|
|
|
|
|
|
|
|
(1) See section entitled "GAAP Reconciliation and Management Explanation of Non-GAAP Financial Measures" below for a reconciliation to most comparable GAAP equivalent. |
(2) Annualized |
(3) Excludes loans measured at fair value |
|
|
|
|
|
|
|
|
|
|
BayFirst Financial Corp. Reports First Quarter 2025 Results
April 24, 2025
Page 7
Reconciliation and Management Explanation of Non-GAAP Financial Measures
Some of the financial measures included in this report are not measures of financial condition or performance recognized by GAAP. These non-GAAP financial measures include tangible common shareholders' equity and tangible book value per common share. Our management uses these non-GAAP financial measures in its analysis of our performance, and we believe that providing this information to financial analysts and investors allows them to evaluate capital adequacy.
The following presents the calculation of the non-GAAP financial measures.
|
|
|
|
|
|
|
|
|
|
|
|
|
|
|
|
|
|
|
|
|
|
|
|
|
|
|
|
|
|
|
|
|
| Tangible Common Shareholders' Equity and Tangible Book Value Per Common Share (Unaudited) |
|
|
As of |
| (Dollars in thousands, except for share data) |
|
March 31, 2025 |
|
December 31, 2024 |
|
September 30, 2024 |
|
June 30, 2024 |
|
March 31, 2024 |
| Total shareholders’ equity |
|
$ |
110,085 |
|
|
$ |
110,920 |
|
|
$ |
102,293 |
|
|
$ |
100,962 |
|
|
$ |
100,629 |
|
| Less: Preferred stock liquidation preference |
|
(16,051) |
|
|
(16,051) |
|
|
(16,051) |
|
|
(16,051) |
|
|
(16,051) |
|
| Total equity available to common shareholders |
|
94,034 |
|
|
94,869 |
|
|
86,242 |
|
|
84,911 |
|
|
84,578 |
|
| Less: Goodwill |
|
— |
|
|
— |
|
|
— |
|
|
— |
|
|
— |
|
| Tangible common shareholders' equity |
|
$ |
94,034 |
|
|
$ |
94,869 |
|
|
$ |
86,242 |
|
|
$ |
84,911 |
|
|
$ |
84,578 |
|
|
|
|
|
|
|
|
|
|
|
|
| Common shares outstanding |
|
4,129,027 |
|
|
4,132,986 |
|
|
4,134,059 |
|
|
4,134,219 |
|
|
4,134,914 |
|
| Tangible book value per common share |
|
$ |
22.77 |
|
|
$ |
22.95 |
|
|
$ |
20.86 |
|
|
$ |
20.54 |
|
|
$ |
20.45 |
|
BayFirst Financial Corp. Reports First Quarter 2025 Results
April 24, 2025
Page 8
|
|
|
|
|
|
|
|
|
|
|
|
| BAYFIRST FINANCIAL CORP. |
| CONSOLIDATED BALANCE SHEETS |
| (Dollars in thousands) |
3/31/2025 |
12/31/2024 |
3/31/2024 |
| Assets |
(Unaudited) |
|
(Unaudited) |
| Cash and due from banks |
$ |
6,517 |
|
$ |
4,499 |
|
$ |
4,425 |
|
| Interest-bearing deposits in banks |
56,637 |
|
73,289 |
|
53,080 |
|
| Cash and cash equivalents |
63,154 |
|
77,788 |
|
57,505 |
|
| Time deposits in banks |
2,025 |
|
2,270 |
|
3,000 |
|
Investment securities available for sale, at fair value (amortized cost $39,507, $40,279, and $46,816 at March 31, 2025, December 31, 2024, and March 31, 2024, respectively) |
36,318 |
|
36,291 |
|
42,514 |
|
Investment securities held to maturity, at amortized cost, net of allowance for credit losses of $12, $12, and $14 (fair value: $2,356, $2,346, and $2,352 at March 31, 2025, December 31, 2024, and March 31, 2024, respectively) |
2,488 |
|
2,488 |
|
2,487 |
|
Nonmarketable equity securities |
5,480 |
|
4,526 |
|
5,228 |
|
|
|
|
|
| Government guaranteed loans held for sale |
— |
|
— |
|
2,226 |
|
Government guaranteed loans held for investment, at fair value |
57,901 |
|
60,833 |
|
77,769 |
|
| Loans held for investment, at amortized cost |
1,026,916 |
|
1,005,726 |
|
857,099 |
|
| Allowance for credit losses on loans |
(16,513) |
|
(15,512) |
|
(13,906) |
|
| Net Loans held for investment, at amortized cost |
1,010,403 |
|
990,214 |
|
843,193 |
|
| Accrued interest receivable |
9,153 |
|
9,155 |
|
7,625 |
|
| Premises and equipment, net |
32,769 |
|
33,249 |
|
39,327 |
|
| Loan servicing rights |
16,460 |
|
16,534 |
|
15,742 |
|
|
|
|
|
| Right-of-use operating lease assets |
15,484 |
|
15,814 |
|
2,499 |
|
| Bank owned life insurance |
26,696 |
|
26,513 |
|
25,974 |
|
| Other real estate owned |
132 |
|
132 |
|
404 |
|
| Other assets |
13,494 |
|
12,490 |
|
18,401 |
|
| Assets from discontinued operations |
— |
|
— |
|
300 |
|
| Total assets |
$ |
1,291,957 |
|
$ |
1,288,297 |
|
$ |
1,144,194 |
|
| Liabilities: |
|
|
|
| Noninterest-bearing deposit accounts |
$ |
106,236 |
|
$ |
101,743 |
|
$ |
96,977 |
|
| Interest-bearing transaction accounts |
261,074 |
|
256,793 |
|
250,478 |
|
| Savings and money market deposit accounts |
467,766 |
|
474,425 |
|
391,915 |
|
| Time deposits |
293,191 |
|
310,268 |
|
267,945 |
|
| Total deposits |
1,128,267 |
|
1,143,229 |
|
1,007,315 |
|
|
|
|
|
| FHLB borrowings |
20,000 |
|
— |
|
15,000 |
|
| Subordinated debentures |
5,957 |
5,956 |
5,950 |
| Notes payable |
1,820 |
|
1,934 |
|
2,276 |
|
|
|
|
|
| Accrued interest payable |
1,053 |
|
1,036 |
|
1,598 |
|
| Operating lease liabilities |
14,102 |
|
14,510 |
|
2,673 |
|
| Deferred income tax liabilities |
648 |
|
301 |
|
728 |
|
| Accrued expenses and other liabilities |
10,025 |
|
10,411 |
|
7,496 |
|
| Liabilities from discontinued operations |
— |
|
— |
|
529 |
|
| Total liabilities |
1,181,872 |
|
1,177,377 |
|
1,043,565 |
|
BayFirst Financial Corp. Reports First Quarter 2025 Results
April 24, 2025
Page 9
|
|
|
|
|
|
|
|
|
|
|
|
| BAYFIRST FINANCIAL CORP. |
| CONSOLIDATED BALANCE SHEETS |
| (Dollars in thousands) |
3/31/2025 |
12/31/2024 |
3/31/2024 |
| Shareholders’ equity: |
(Unaudited) |
|
(Unaudited) |
Preferred stock, Series A; no par value, 10,000 shares authorized, 6,395 shares issued and outstanding at March 31, 2025, December 31, 2024, and March 31, 2024; aggregate liquidation preference of $6,395 each period |
6,161 |
|
6,161 |
|
6,161 |
|
Preferred stock, Series B; no par value, 20,000 shares authorized, 3,210 shares issued and outstanding at March 31, 2025, December 31, 2024, and March 31, 2024; aggregate liquidation preference of $3,210 each period |
3,123 |
|
3,123 |
|
3,123 |
|
Preferred stock, Series C; no par value, 10,000 shares authorized, 6,446 shares issued and outstanding at March 31, 2025, December 31, 2024, and March 31, 2024; aggregate liquidation preference of $6,446 at March 31, 2025, December 31, 2024, and March 31, 2024 |
6,446 |
|
6,446 |
|
6,446 |
|
Common stock and additional paid-in capital; no par value, 15,000,000 shares authorized, 4,129,027, 4,132,986, and 4,134,914 shares issued and outstanding at March 31, 2025, December 31, 2024, and March 31, 2024, respectively |
54,657 |
|
54,764 |
|
54,776 |
|
| Accumulated other comprehensive loss, net |
(2,378) |
|
(2,956) |
|
(3,188) |
|
| Unearned compensation |
(1,006) |
|
(752) |
|
(1,192) |
|
| Retained earnings |
43,082 |
|
44,134 |
|
34,503 |
|
| Total shareholders’ equity |
110,085 |
|
110,920 |
|
100,629 |
|
| Total liabilities and shareholders’ equity |
$ |
1,291,957 |
|
$ |
1,288,297 |
|
$ |
1,144,194 |
|
BayFirst Financial Corp. Reports First Quarter 2025 Results
April 24, 2025
Page 10
|
|
|
|
|
|
|
|
|
|
|
|
|
|
|
|
|
|
|
|
|
|
| BAYFIRST FINANCIAL CORP. |
| CONSOLIDATED STATEMENTS OF INCOME |
|
For the Quarter Ended |
|
|
| (Dollars in thousands, except per share data) |
3/31/2025 |
|
12/31/2024 |
|
3/31/2024 |
|
|
|
|
| Interest income: |
(Unaudited) |
|
(Unaudited) |
|
(Unaudited) |
|
|
|
|
| Loans, including fees |
$ |
19,751 |
|
|
$ |
20,747 |
|
|
$ |
18,228 |
|
|
|
|
|
| Interest-bearing deposits in banks and other |
934 |
|
|
1,007 |
|
|
959 |
|
|
|
|
|
| Total interest income |
20,685 |
|
|
21,754 |
|
|
19,187 |
|
|
|
|
|
| Interest expense: |
|
|
|
|
|
|
|
|
|
| Deposits |
9,431 |
|
|
10,600 |
|
|
10,215 |
|
|
|
|
|
| Other |
255 |
|
|
501 |
|
|
230 |
|
|
|
|
|
| Total interest expense |
9,686 |
|
|
11,101 |
|
|
10,445 |
|
|
|
|
|
| Net interest income |
10,999 |
|
|
10,653 |
|
|
8,742 |
|
|
|
|
|
| Provision for credit losses |
4,400 |
|
|
4,546 |
|
|
4,058 |
|
|
|
|
|
| Net interest income after provision for credit losses |
6,599 |
|
|
6,107 |
|
|
4,684 |
|
|
|
|
|
| Noninterest income: |
|
|
|
|
|
|
|
|
|
|
|
|
|
|
|
|
|
|
|
| Loan servicing income, net |
736 |
|
|
582 |
|
|
795 |
|
|
|
|
|
| Gain on sale of government guaranteed loans, net |
7,327 |
|
|
8,425 |
|
|
8,089 |
|
|
|
|
|
| Service charges and fees |
449 |
|
|
451 |
|
|
444 |
|
|
|
|
|
| Government guaranteed loans fair value gain (loss), net |
(755) |
|
|
(80) |
|
|
3,305 |
|
|
|
|
|
| Government guaranteed loan packaging fees |
716 |
|
|
773 |
|
|
1,407 |
|
|
|
|
|
| Gain on sale of premises and equipment |
— |
|
|
11,649 |
|
|
— |
|
|
|
|
|
| Other noninterest income |
278 |
|
|
476 |
|
|
228 |
|
|
|
|
|
| Total noninterest income |
8,751 |
|
|
22,276 |
|
|
14,268 |
|
|
|
|
|
| Noninterest Expense: |
|
|
|
|
|
|
|
|
|
| Salaries and benefits |
7,998 |
|
|
7,351 |
|
|
8,005 |
|
|
|
|
|
| Bonus, commissions, and incentives |
71 |
|
|
1,074 |
|
|
1,571 |
|
|
|
|
|
|
|
|
|
|
|
|
|
|
|
| Occupancy and equipment |
1,634 |
|
|
1,217 |
|
|
1,110 |
|
|
|
|
|
| Data processing |
2,045 |
|
|
1,749 |
|
|
1,560 |
|
|
|
|
|
| Marketing and business development |
487 |
|
|
390 |
|
|
588 |
|
|
|
|
|
| Professional services |
732 |
|
|
803 |
|
|
1,349 |
|
|
|
|
|
| Loan origination and collection |
1,035 |
|
|
758 |
|
|
1,719 |
|
|
|
|
|
| Employee recruiting and development |
617 |
|
|
445 |
|
|
597 |
|
|
|
|
|
| Regulatory assessments |
339 |
|
|
379 |
|
|
282 |
|
|
|
|
|
|
|
|
|
|
|
|
|
|
|
| Other noninterest expense |
855 |
|
|
1,169 |
|
|
992 |
|
|
|
|
|
| Total noninterest expense |
15,813 |
|
|
15,335 |
|
|
17,773 |
|
|
|
|
|
| Income (loss) before taxes from continuing operations |
(463) |
|
|
13,048 |
|
|
1,179 |
|
|
|
|
|
| Income tax expense (benefit) from continuing operations |
(128) |
|
|
3,272 |
|
|
296 |
|
|
|
|
|
| Net income (loss) from continuing operations |
(335) |
|
|
9,776 |
|
|
883 |
|
|
|
|
|
| Loss from discontinued operations before income taxes |
— |
|
|
— |
|
|
(78) |
|
|
|
|
|
| Income tax benefit from discontinued operations |
— |
|
|
— |
|
|
(19) |
|
|
|
|
|
| Net loss from discontinued operations |
— |
|
|
— |
|
|
(59) |
|
|
|
|
|
|
|
|
|
|
|
|
|
|
|
| Net income (loss) |
(335) |
|
|
9,776 |
|
|
824 |
|
|
|
|
|
| Preferred dividends |
385 |
|
|
385 |
|
|
385 |
|
|
|
|
|
Net income available to (loss attributable to) common shareholders |
$ |
(720) |
|
|
$ |
9,391 |
|
|
$ |
439 |
|
|
|
|
|
|
|
|
|
|
|
|
|
|
|
BayFirst Financial Corp. Reports First Quarter 2025 Results
April 24, 2025
Page 11
|
|
|
|
|
|
|
|
|
|
|
|
|
|
|
|
|
|
|
|
|
|
| BAYFIRST FINANCIAL CORP. |
| CONSOLIDATED STATEMENTS OF INCOME |
|
For the Quarter Ended |
|
|
| (Dollars in thousands, except per share data) |
3/31/2025 |
|
12/31/2024 |
|
3/31/2024 |
|
|
|
|
| Basic earnings (loss) per common share: |
(Unaudited) |
|
(Unaudited) |
|
(Unaudited) |
|
|
|
|
| Continuing operations |
$ |
(0.17) |
|
|
$ |
2.27 |
|
|
$ |
0.12 |
|
|
|
|
|
| Discontinued operations |
— |
|
|
— |
|
|
(0.01) |
|
|
|
|
|
| Basic earnings (loss) per common share |
$ |
(0.17) |
|
|
$ |
2.27 |
|
|
$ |
0.11 |
|
|
|
|
|
|
|
|
|
|
|
|
|
|
|
| Diluted earnings (loss) per common share: |
|
|
|
|
|
|
|
|
|
| Continuing operations |
$ |
(0.17) |
|
|
$ |
2.11 |
|
|
$ |
0.12 |
|
|
|
|
|
| Discontinued operations |
— |
|
|
— |
|
|
(0.01) |
|
|
|
|
|
| Diluted earnings (loss) per common share |
$ |
(0.17) |
|
|
$ |
2.11 |
|
|
$ |
0.11 |
|
|
|
|
|
BayFirst Financial Corp. Reports First Quarter 2025 Results
April 24, 2025
Page 12
Loan Composition
|
|
|
|
|
|
|
|
|
|
|
|
|
|
|
|
|
|
|
|
|
|
|
|
|
|
|
|
|
|
(Dollars in thousands) |
3/31/2025 |
|
12/31/2024 |
|
9/30/2024 |
|
6/30/2024 |
|
3/31/2024 |
|
(Unaudited) |
|
|
|
(Unaudited) |
|
(Unaudited) |
|
(Unaudited) |
Real estate: |
|
|
|
|
|
|
|
|
|
Residential |
$ |
339,886 |
|
|
$ |
330,870 |
|
|
$ |
321,740 |
|
|
$ |
304,234 |
|
|
$ |
285,214 |
|
Commercial |
296,351 |
|
|
305,721 |
|
|
292,026 |
|
|
288,185 |
|
|
273,227 |
|
Construction and land |
46,740 |
|
|
32,914 |
|
|
33,784 |
|
|
35,759 |
|
|
36,764 |
|
Commercial and industrial |
234,384 |
|
|
226,522 |
|
|
200,212 |
|
|
192,140 |
|
|
182,264 |
|
Commercial and industrial - PPP |
457 |
|
|
941 |
|
|
1,656 |
|
|
2,324 |
|
|
2,965 |
|
Consumer and other |
93,889 |
|
|
93,826 |
|
|
92,546 |
|
|
85,789 |
|
|
63,854 |
|
Loans held for investment, at amortized cost, gross |
1,011,707 |
|
|
990,794 |
|
|
941,964 |
|
|
908,431 |
|
|
844,288 |
|
Deferred loan costs, net |
20,521 |
|
|
19,499 |
|
|
18,060 |
|
|
17,299 |
|
|
16,233 |
|
Discount on government guaranteed loans |
(8,727) |
|
|
(8,306) |
|
|
(7,880) |
|
|
(7,731) |
|
|
(7,674) |
|
Premium on loans purchased, net |
3,415 |
|
|
3,739 |
|
|
3,860 |
|
|
4,173 |
|
|
4,252 |
|
Loans held for investment, at amortized cost, net |
1,026,916 |
|
|
1,005,726 |
|
|
956,004 |
|
|
922,172 |
|
|
857,099 |
|
| Government guaranteed loans held for investment, at fair value |
57,901 |
|
|
60,833 |
|
|
86,441 |
|
|
86,142 |
|
|
77,769 |
|
Total loans held for investment, net |
$ |
1,084,817 |
|
|
$ |
1,066,559 |
|
|
$ |
1,042,445 |
|
|
$ |
1,008,314 |
|
|
$ |
934,868 |
|
Nonperforming Assets (Unaudited)
|
|
|
|
|
|
|
|
|
|
|
|
|
|
|
|
|
|
|
|
|
|
|
|
|
|
|
|
|
|
| (Dollars in thousands) |
3/31/2025 |
|
12/31/2024 |
|
9/30/2024 |
|
6/30/2024 |
|
3/31/2024 |
Nonperforming loans (government guaranteed balances), at amortized cost, gross |
$ |
9,728 |
|
|
$ |
4,037 |
|
|
$ |
4,497 |
|
|
$ |
4,258 |
|
|
$ |
2,309 |
|
Nonperforming loans (unguaranteed balances), at amortized cost, gross |
15,078 |
|
|
13,570 |
|
|
10,992 |
|
|
8,054 |
|
|
7,568 |
|
Total nonperforming loans, at amortized cost, gross |
24,806 |
|
|
17,607 |
|
|
15,489 |
|
|
12,312 |
|
|
9,877 |
|
Nonperforming loans (government guaranteed balances), at fair value |
507 |
|
|
— |
|
|
24 |
|
|
341 |
|
|
94 |
|
Nonperforming loans (unguaranteed balances), at fair value |
1,419 |
|
|
1,490 |
|
|
1,535 |
|
|
1,284 |
|
|
729 |
|
Total nonperforming loans, at fair value |
1,926 |
|
|
1,490 |
|
|
1,559 |
|
|
1,625 |
|
|
823 |
|
OREO |
132 |
|
|
132 |
|
|
— |
|
|
1,633 |
|
|
404 |
|
| Repossessed assets |
36 |
|
|
36 |
|
|
94 |
|
|
— |
|
|
— |
|
Total nonperforming assets, gross |
$ |
26,900 |
|
|
$ |
19,265 |
|
|
$ |
17,142 |
|
|
$ |
15,570 |
|
|
$ |
11,104 |
|
Nonperforming loans as a percentage of total loans held for investment(1) |
2.42 |
% |
|
1.75 |
% |
|
1.62 |
% |
|
1.34 |
% |
|
1.15 |
% |
Nonperforming loans (excluding government guaranteed balances) to total loans held for investment(1) |
1.47 |
% |
|
1.35 |
% |
|
1.15 |
% |
|
0.87 |
% |
|
0.88 |
% |
Nonperforming assets as a percentage of total assets |
2.08 |
% |
|
1.50 |
% |
|
1.38 |
% |
|
1.28 |
% |
|
0.97 |
% |
Nonperforming assets (excluding government guaranteed balances) to total assets |
1.22 |
% |
|
1.06 |
% |
|
0.88 |
% |
|
0.82 |
% |
|
0.70 |
% |
ACL to nonperforming loans(1) |
66.57 |
% |
|
88.10 |
% |
|
91.59 |
% |
|
112.44 |
% |
|
140.79 |
% |
ACL to nonperforming loans (excluding government guaranteed balances)(1) |
109.52 |
% |
|
114.31 |
% |
|
129.06 |
% |
|
171.88 |
% |
|
183.75 |
% |
(1) Excludes loans measured at fair value
Note: Transmitted on Globe Newswire on April 24, 2025, at 4:00 p.m. ET.

