
Q3 2024 Update 1 Exhibit 99.1
Highlights 03 Financial Summary 04 Operational Summary 06 Vehicle Capacity 07 Core Technology 08 Other Highlights 09 Outlook 10 Photos & Charts 11 Key Metrics 23 Financial Statements 25 Additional Information 31 2

S U M M A R YH I G H L I G H T S (1) Excludes SBC (stock-based compensation), net of tax; (2) Free cash flow = operating cash flow less capex; (3) Includes cash, cash equivalents and investments; (4) Active driver supervision required; does not make the vehicle autonomous; (5)Calculated by dividing Cost of Automotive Sales Revenue by respective quarter’s new deliveries (ex-operating leases) Profitability $2.7B GAAP operating income in Q3 $2.2B GAAP net income in Q3 $2.5B non-GAAP net income1 in Q3 We delivered strong results in Q3 with growth in vehicle deliveries both sequentially and year-on-year, resulting in record third-quarter volumes. We also recognized our second- highest quarter of regulatory credit revenues as other OEMs are still behind on meeting emissions requirements. Our cost of goods sold (COGS) per vehicle5 came down to its lowest level ever at ~$35,100. In order to continue accelerating the world’s transition to sustainable energy, we need to make EVs affordable for everyone, including making total cost of ownership per mile competitive with all forms of transportation. Preparations remain underway for our offering of new vehicles – including more affordable models – which we will begin launching in the first half of 2025. At our "We, Robot" event on October 10, we detailed our long-term goal of offering autonomous transport with a cost per mile below rideshare, personal car ownership and even public transit. The Energy business achieved another strong quarter with a record gross margin. Additionally, the Megafactory in Lathrop produced 200 Megapacks in a week, and Powerwall deployments reached a record for the second quarter in a row as we continue to ramp Powerwall 3. Despite sustained macroeconomic headwinds and others pulling back on EV investments, we remain focused on expanding our vehicle and energy product lineup, reducing costs and making critical investments in AI projects and production capacity. We believe these efforts will allow us to capitalize on the ongoing transition in the transportation and energy sectors. Cash Operating cash flow of $6.3B in Q3 Free cash flow2 of $2.7B in Q3 $2.9B increase in our cash and investments3 in Q3 to $33.6B Operations Increased AI training compute by over 75% in Q3 Cybertruck became the third best-selling EV in Q3 in the U.S. (behind only Model Y and Model 3) Over two billion miles driven cumulatively on FSD (Supervised)4 as of Q3 with more than 50% on V12 3
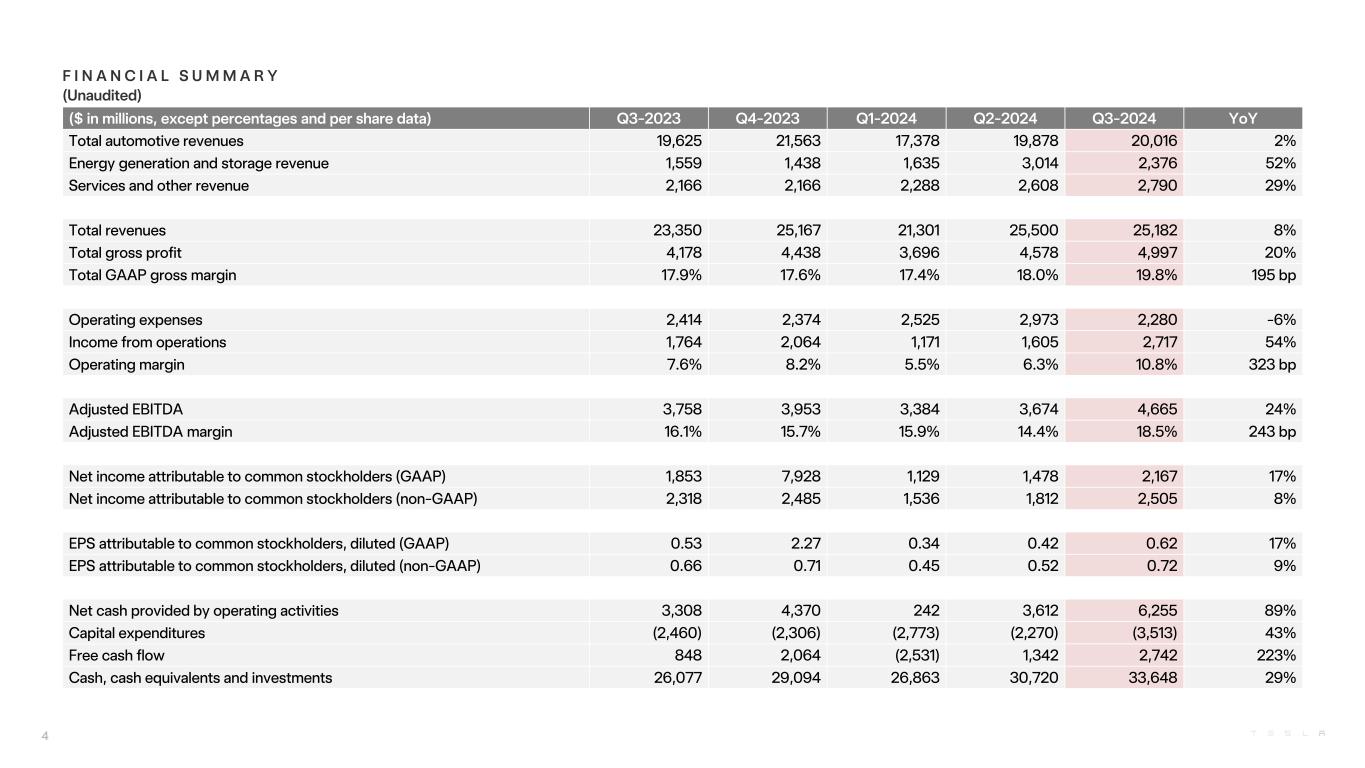
F I N A N C I A L S U M M A R Y (Unaudited) ($ in millions, except percentages and per share data) Q3-2023 Q4-2023 Q1-2024 Q2-2024 Q3-2024 YoY Total automotive revenues 19,625 21,563 17,378 19,878 20,016 2% Energy generation and storage revenue 1,559 1,438 1,635 3,014 2,376 52% Services and other revenue 2,166 2,166 2,288 2,608 2,790 29% Total revenues 23,350 25,167 21,301 25,500 25,182 8% Total gross profit 4,178 4,438 3,696 4,578 4,997 20% Total GAAP gross margin 17.9% 17.6% 17.4% 18.0% 19.8% 195 bp Operating expenses 2,414 2,374 2,525 2,973 2,280 -6% Income from operations 1,764 2,064 1,171 1,605 2,717 54% Operating margin 7.6% 8.2% 5.5% 6.3% 10.8% 323 bp Adjusted EBITDA 3,758 3,953 3,384 3,674 4,665 24% Adjusted EBITDA margin 16.1% 15.7% 15.9% 14.4% 18.5% 243 bp Net income attributable to common stockholders (GAAP) 1,853 7,928 1,129 1,478 2,167 17% Net income attributable to common stockholders (non-GAAP) 2,318 2,485 1,536 1,812 2,505 8% EPS attributable to common stockholders, diluted (GAAP) 0.53 2.27 0.34 0.42 0.62 17% EPS attributable to common stockholders, diluted (non-GAAP) 0.66 0.71 0.45 0.52 0.72 9% Net cash provided by operating activities 3,308 4,370 242 3,612 6,255 89% Capital expenditures (2,460) (2,306) (2,773) (2,270) (3,513) 43% Free cash flow 848 2,064 (2,531) 1,342 2,742 223% Cash, cash equivalents and investments 26,077 29,094 26,863 30,720 33,648 29% 4
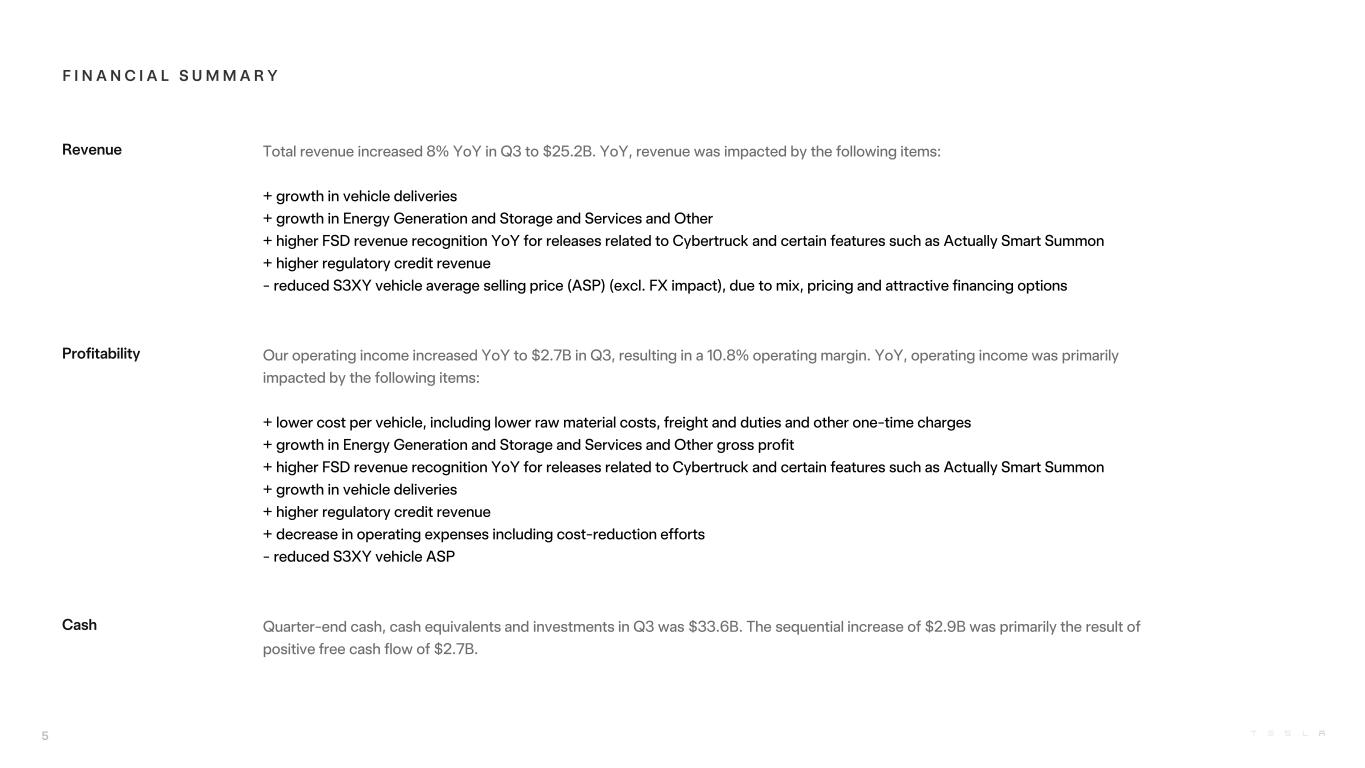
F I N A N C I A L S U M M A R Y Revenue Total revenue increased 8% YoY in Q3 to $25.2B. YoY, revenue was impacted by the following items: + growth in vehicle deliveries + growth in Energy Generation and Storage and Services and Other + higher FSD revenue recognition YoY for releases related to Cybertruck and certain features such as Actually Smart Summon + higher regulatory credit revenue - reduced S3XY vehicle average selling price (ASP) (excl. FX impact), due to mix, pricing and attractive financing options Profitability Our operating income increased YoY to $2.7B in Q3, resulting in a 10.8% operating margin. YoY, operating income was primarily impacted by the following items: + lower cost per vehicle, including lower raw material costs, freight and duties and other one-time charges + growth in Energy Generation and Storage and Services and Other gross profit + higher FSD revenue recognition YoY for releases related to Cybertruck and certain features such as Actually Smart Summon + growth in vehicle deliveries + higher regulatory credit revenue + decrease in operating expenses including cost-reduction efforts - reduced S3XY vehicle ASP Cash Quarter-end cash, cash equivalents and investments in Q3 was $33.6B. The sequential increase of $2.9B was primarily the result of positive free cash flow of $2.7B. 5
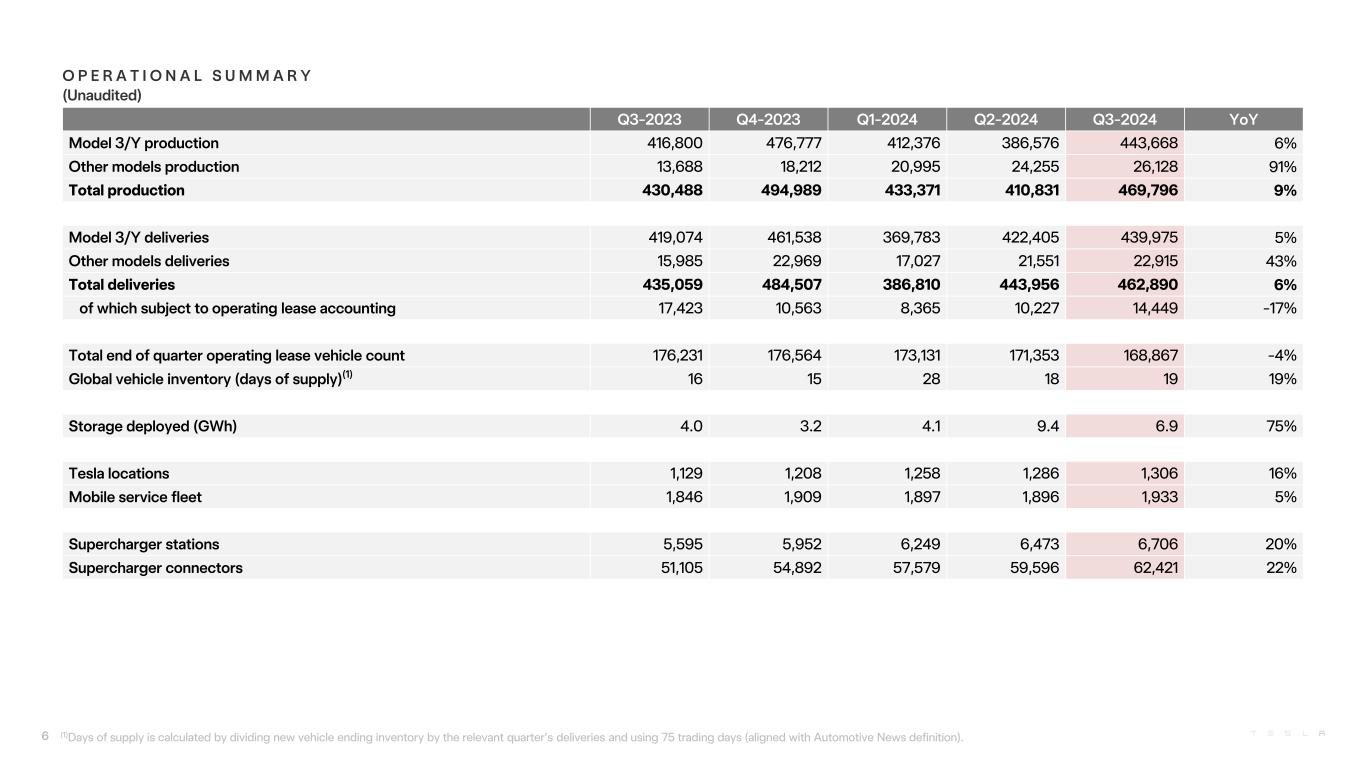
Q3-2023 Q4-2023 Q1-2024 Q2-2024 Q3-2024 YoY Model 3/Y production 416,800 476,777 412,376 386,576 443,668 6% Other models production 13,688 18,212 20,995 24,255 26,128 91% Total production 430,488 494,989 433,371 410,831 469,796 9% Model 3/Y deliveries 419,074 461,538 369,783 422,405 439,975 5% Other models deliveries 15,985 22,969 17,027 21,551 22,915 43% Total deliveries 435,059 484,507 386,810 443,956 462,890 6% of which subject to operating lease accounting 17,423 10,563 8,365 10,227 14,449 -17% Total end of quarter operating lease vehicle count 176,231 176,564 173,131 171,353 168,867 -4% Global vehicle inventory (days of supply)(1) 16 15 28 18 19 19% Storage deployed (GWh) 4.0 3.2 4.1 9.4 6.9 75% Tesla locations 1,129 1,208 1,258 1,286 1,306 16% Mobile service fleet 1,846 1,909 1,897 1,896 1,933 5% Supercharger stations 5,595 5,952 6,249 6,473 6,706 20% Supercharger connectors 51,105 54,892 57,579 59,596 62,421 22% (1)Days of supply is calculated by dividing new vehicle ending inventory by the relevant quarter’s deliveries and using 75 trading days (aligned with Automotive News definition). O P E R A T I O N A L S U M M A R Y (Unaudited) 6
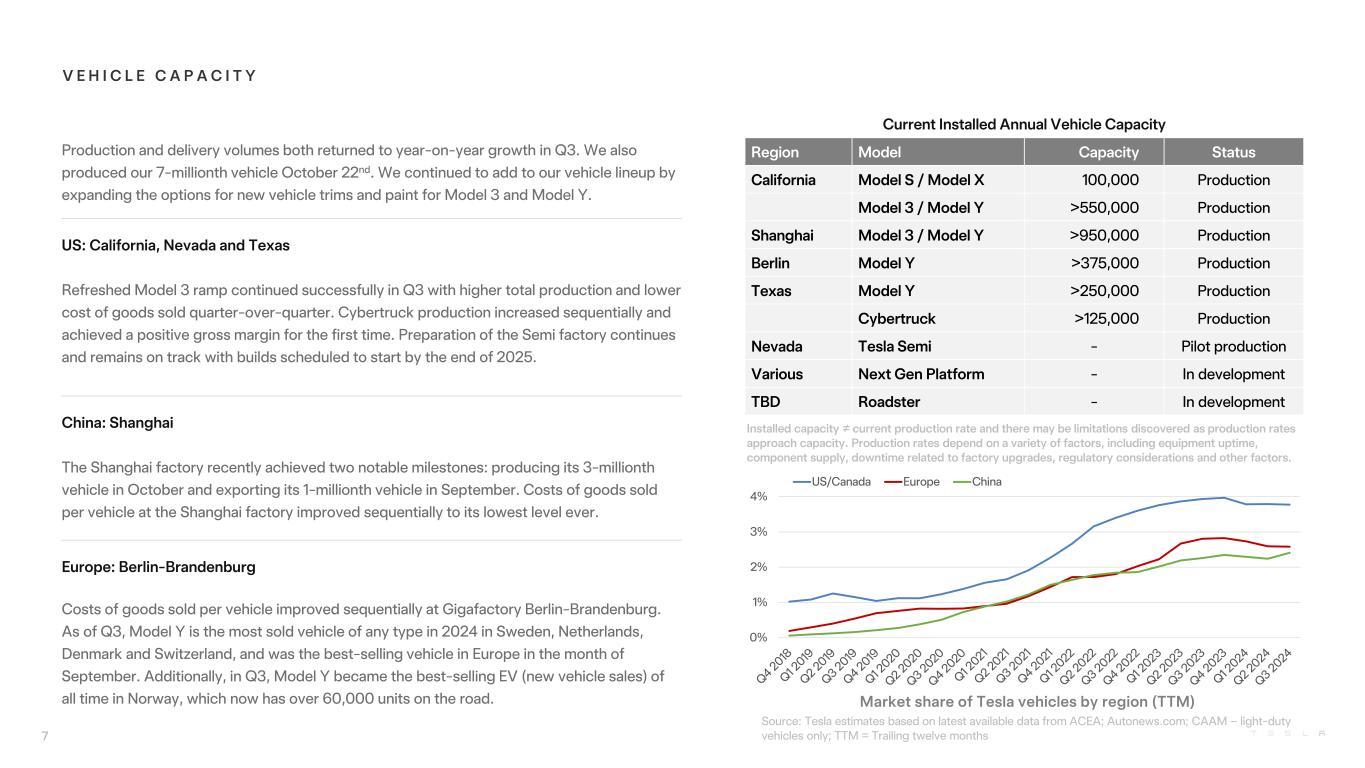
V E H I C L E C A P A C I T Y Current Installed Annual Vehicle Capacity Region Model Capacity Status California Model S / Model X 100,000 Production Model 3 / Model Y >550,000 Production Shanghai Model 3 / Model Y >950,000 Production Berlin Model Y >375,000 Production Texas Model Y >250,000 Production Cybertruck >125,000 Production Nevada Tesla Semi - Pilot production Various Next Gen Platform - In development TBD Roadster - In development Installed capacity ≠ current production rate and there may be limitations discovered as production rates approach capacity. Production rates depend on a variety of factors, including equipment uptime, component supply, downtime related to factory upgrades, regulatory considerations and other factors. Market share of Tesla vehicles by region (TTM) Source: Tesla estimates based on latest available data from ACEA; Autonews.com; CAAM – light-duty vehicles only; TTM = Trailing twelve months Production and delivery volumes both returned to year-on-year growth in Q3. We also produced our 7-millionth vehicle October 22nd. We continued to add to our vehicle lineup by expanding the options for new vehicle trims and paint for Model 3 and Model Y. US: California, Nevada and Texas Refreshed Model 3 ramp continued successfully in Q3 with higher total production and lower cost of goods sold quarter-over-quarter. Cybertruck production increased sequentially and achieved a positive gross margin for the first time. Preparation of the Semi factory continues and remains on track with builds scheduled to start by the end of 2025. China: Shanghai The Shanghai factory recently achieved two notable milestones: producing its 3-millionth vehicle in October and exporting its 1-millionth vehicle in September. Costs of goods sold per vehicle at the Shanghai factory improved sequentially to its lowest level ever. Europe: Berlin-Brandenburg Costs of goods sold per vehicle improved sequentially at Gigafactory Berlin-Brandenburg. As of Q3, Model Y is the most sold vehicle of any type in 2024 in Sweden, Netherlands, Denmark and Switzerland, and was the best-selling vehicle in Europe in the month of September. Additionally, in Q3, Model Y became the best-selling EV (new vehicle sales) of all time in Norway, which now has over 60,000 units on the road. 7 0% 1% 2% 3% 4% US/Canada Europe China
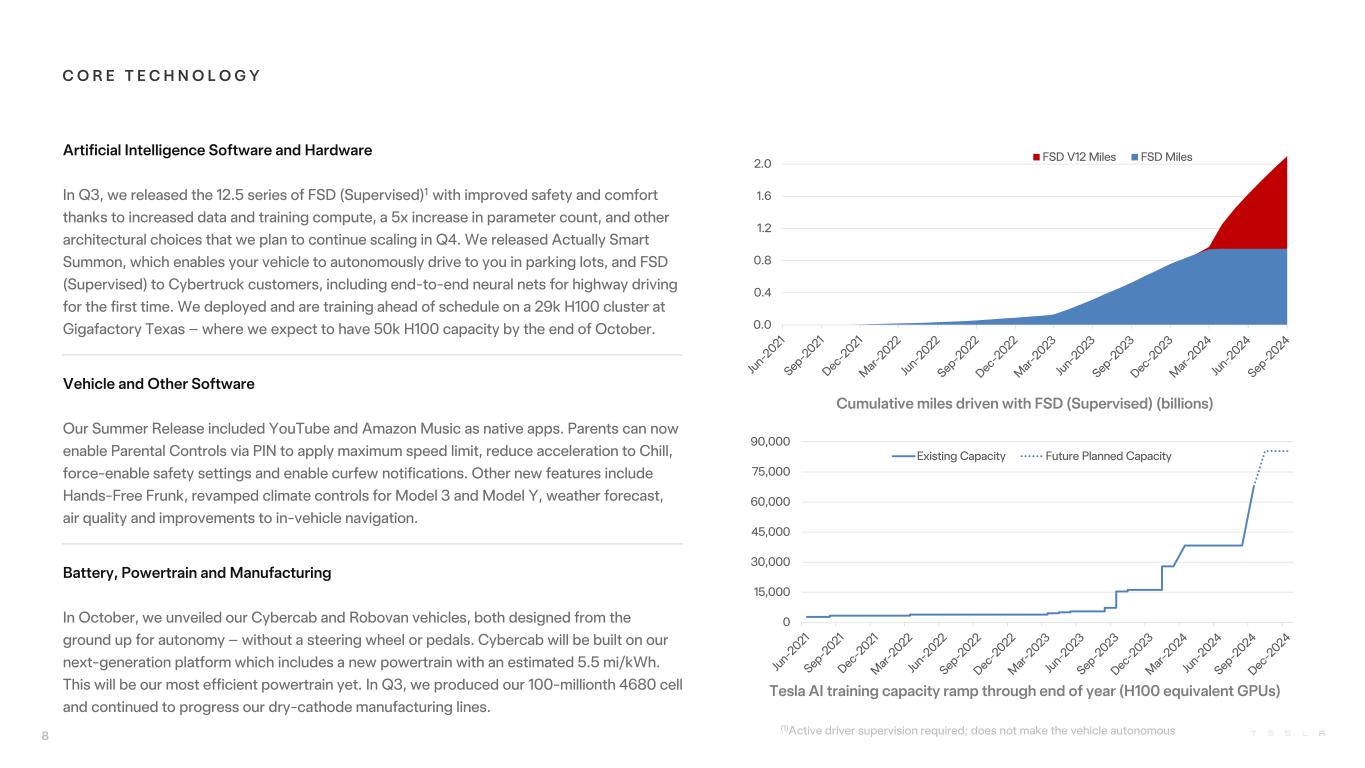
Tesla AI training capacity ramp through end of year (H100 equivalent GPUs) C O R E T E C H N O L O G Y Cumulative miles driven with FSD (Supervised) (billions) Artificial Intelligence Software and Hardware In Q3, we released the 12.5 series of FSD (Supervised)1 with improved safety and comfort thanks to increased data and training compute, a 5x increase in parameter count, and other architectural choices that we plan to continue scaling in Q4. We released Actually Smart Summon, which enables your vehicle to autonomously drive to you in parking lots, and FSD (Supervised) to Cybertruck customers, including end-to-end neural nets for highway driving for the first time. We deployed and are training ahead of schedule on a 29k H100 cluster at Gigafactory Texas – where we expect to have 50k H100 capacity by the end of October. Vehicle and Other Software Our Summer Release included YouTube and Amazon Music as native apps. Parents can now enable Parental Controls via PIN to apply maximum speed limit, reduce acceleration to Chill, force-enable safety settings and enable curfew notifications. Other new features include Hands-Free Frunk, revamped climate controls for Model 3 and Model Y, weather forecast, air quality and improvements to in-vehicle navigation. Battery, Powertrain and Manufacturing In October, we unveiled our Cybercab and Robovan vehicles, both designed from the ground up for autonomy – without a steering wheel or pedals. Cybercab will be built on our next-generation platform which includes a new powertrain with an estimated 5.5 mi/kWh. This will be our most efficient powertrain yet. In Q3, we produced our 100-millionth 4680 cell and continued to progress our dry-cathode manufacturing lines. 8 (1)Active driver supervision required; does not make the vehicle autonomous 0.0 0.4 0.8 1.2 1.6 2.0 FSD V12 Miles FSD Miles 0 15,000 30,000 45,000 60,000 75,000 90,000 Existing Capacity Future Planned Capacity
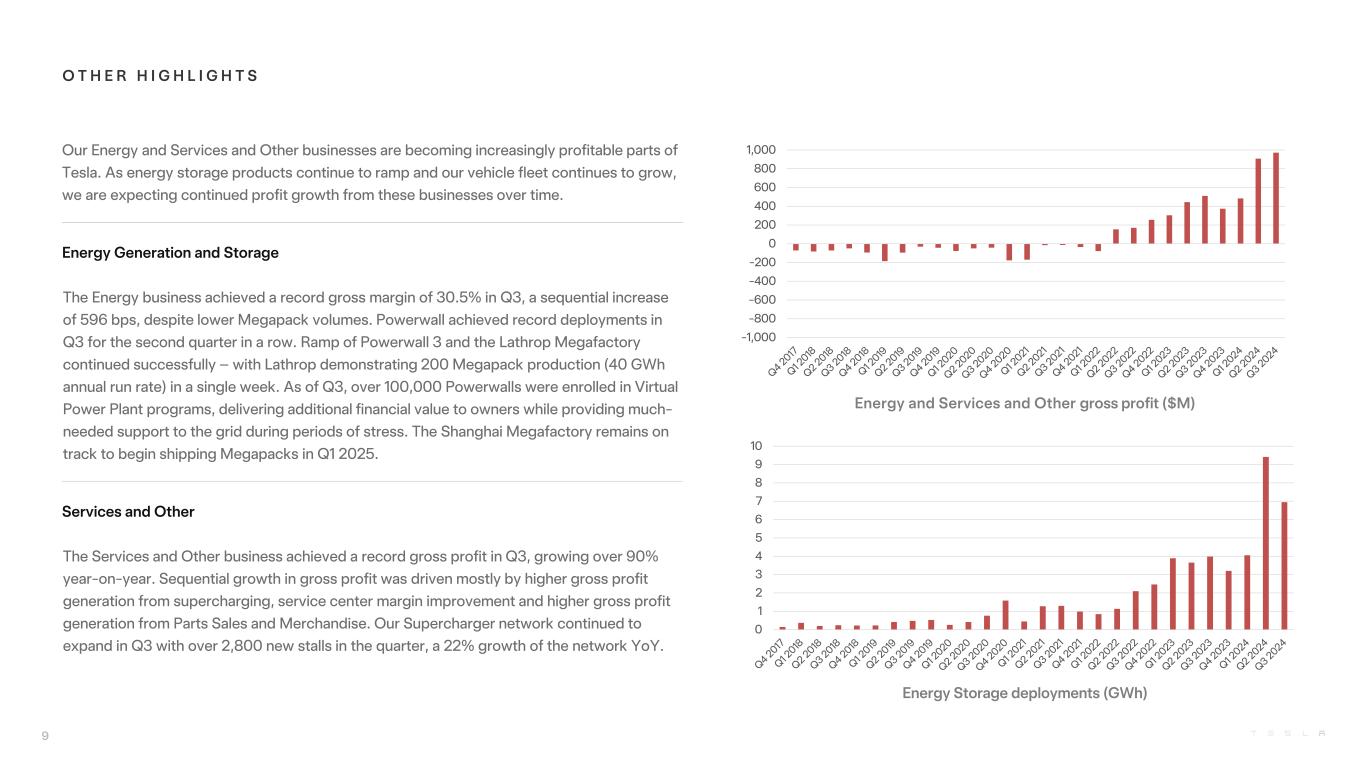
O T H E R H I G H L I G H T S Energy Storage deployments (GWh) Energy and Services and Other gross profit ($M) Our Energy and Services and Other businesses are becoming increasingly profitable parts of Tesla. As energy storage products continue to ramp and our vehicle fleet continues to grow, we are expecting continued profit growth from these businesses over time. Energy Generation and Storage The Energy business achieved a record gross margin of 30.5% in Q3, a sequential increase of 596 bps, despite lower Megapack volumes. Powerwall achieved record deployments in Q3 for the second quarter in a row. Ramp of Powerwall 3 and the Lathrop Megafactory continued successfully – with Lathrop demonstrating 200 Megapack production (40 GWh annual run rate) in a single week. As of Q3, over 100,000 Powerwalls were enrolled in Virtual Power Plant programs, delivering additional financial value to owners while providing much- needed support to the grid during periods of stress. The Shanghai Megafactory remains on track to begin shipping Megapacks in Q1 2025. Services and Other The Services and Other business achieved a record gross profit in Q3, growing over 90% year-on-year. Sequential growth in gross profit was driven mostly by higher gross profit generation from supercharging, service center margin improvement and higher gross profit generation from Parts Sales and Merchandise. Our Supercharger network continued to expand in Q3 with over 2,800 new stalls in the quarter, a 22% growth of the network YoY. 9 0 1 2 3 4 5 6 7 8 9 10 -1,000 -800 -600 -400 -200 0 200 400 600 800 1,000
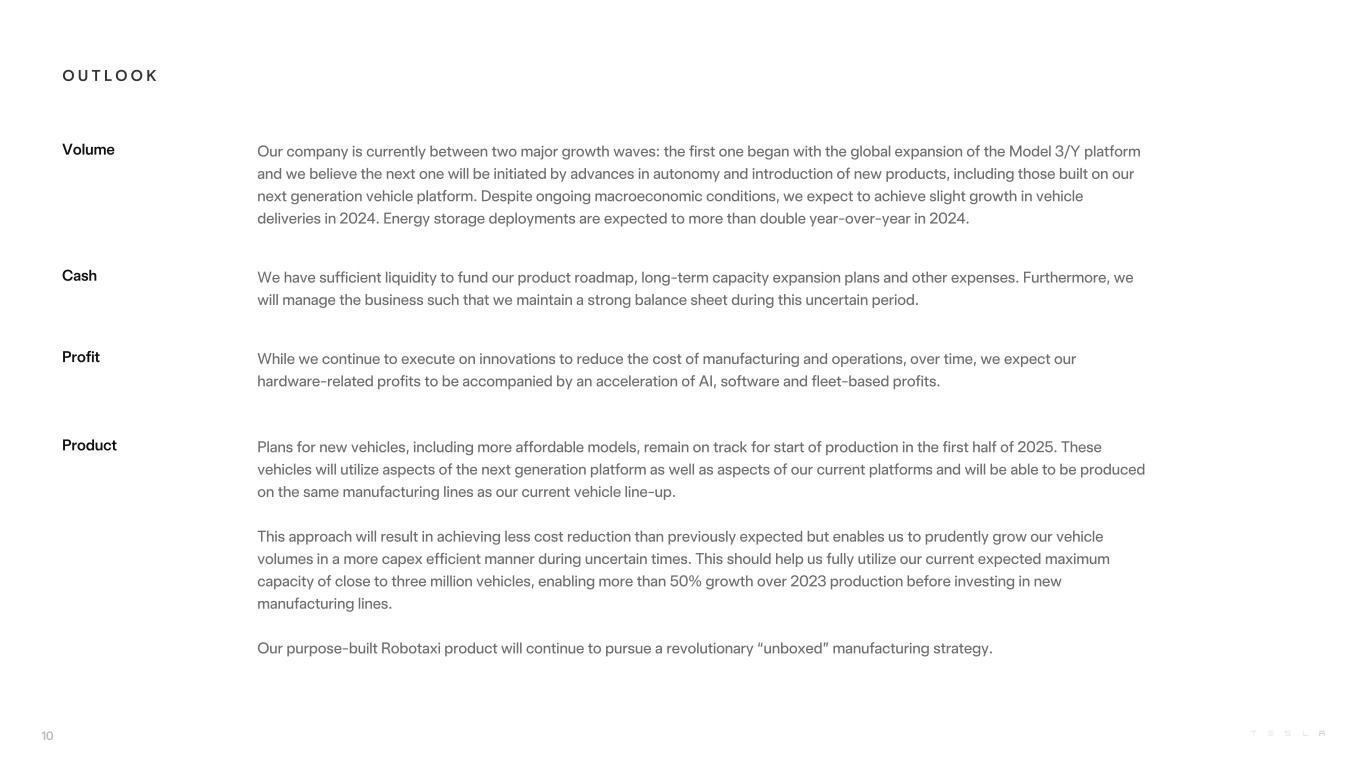
O U T L O O K Volume Our company is currently between two major growth waves: the first one began with the global expansion of the Model 3/Y platform and we believe the next one will be initiated by advances in autonomy and introduction of new products, including those built on our next generation vehicle platform. Despite ongoing macroeconomic conditions, we expect to achieve slight growth in vehicle deliveries in 2024. Energy storage deployments are expected to more than double year-over-year in 2024. Cash We have sufficient liquidity to fund our product roadmap, long-term capacity expansion plans and other expenses. Furthermore, we will manage the business such that we maintain a strong balance sheet during this uncertain period. Profit While we continue to execute on innovations to reduce the cost of manufacturing and operations, over time, we expect our hardware-related profits to be accompanied by an acceleration of AI, software and fleet-based profits. Product Plans for new vehicles, including more affordable models, remain on track for start of production in the first half of 2025. These vehicles will utilize aspects of the next generation platform as well as aspects of our current platforms and will be able to be produced on the same manufacturing lines as our current vehicle line-up. This approach will result in achieving less cost reduction than previously expected but enables us to prudently grow our vehicle volumes in a more capex efficient manner during uncertain times. This should help us fully utilize our current expected maximum capacity of close to three million vehicles, enabling more than 50% growth over 2023 production before investing in new manufacturing lines. Our purpose-built Robotaxi product will continue to pursue a revolutionary “unboxed” manufacturing strategy. 10

P H O T O S & C H A R T S
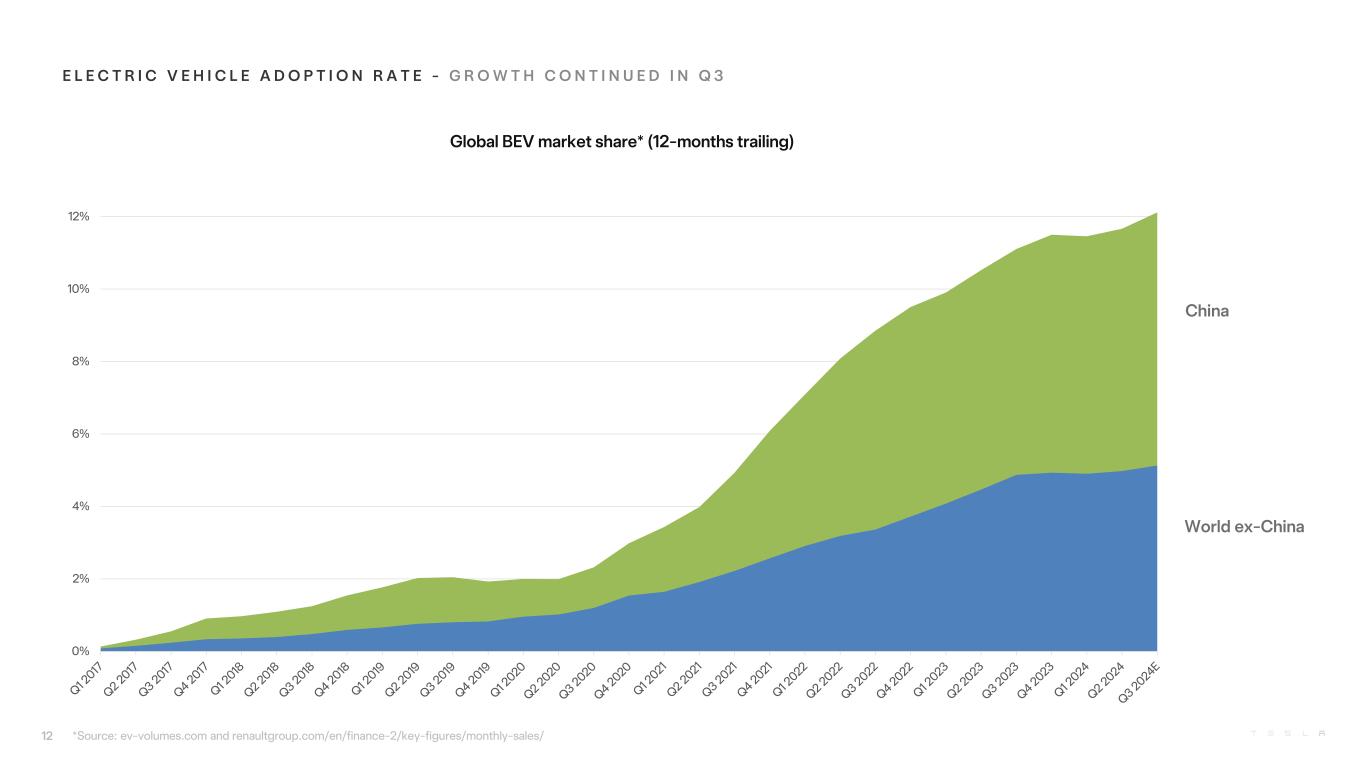
E L E C T R I C V E H I C L E A D O P T I O N R A T E - G R O W T H C O N T I N U E D I N Q 3 Global BEV market share* (12-months trailing) China World ex-China *Source: ev-volumes.com and renaultgroup.com/en/finance-2/key-figures/monthly-sales/12 0% 2% 4% 6% 8% 10% 12%

A U T O N O M Y W I L L F U R T H E R A C C E L E R A T E O U R M I S S I O N 13 Estimated Lifecycle Emissions of Gas Cars versus Robotaxi (gCO2e/mi) Robotaxi Gas Cars

C Y B E R C A B - T W O - S E A T E R V E H I C L E D E S I G N E D F O R A U T O N O M Y 14

C Y B E R C A B - S P A C I O U S I N T E R I O R A N D E X T R A L A R G E T R U N K 15

R O B O V A N - S P A C E F O R U P T O 2 0 & D E S I G N E D F O R A U T O N O M Y 16

R O B O T A X I C H A R G I N G - W I R E L E S S C H A R G I N G R E M O V E S N E E D F O R A H U M A N 17

O P T I M U S - D A N C I N G A T “ W E , R O B O T ” 18

O P T I M U S H A N D - L A T E S T G E N E R A T I O N W I T H 2 X D E G R E E S O F F R E E D O M 19
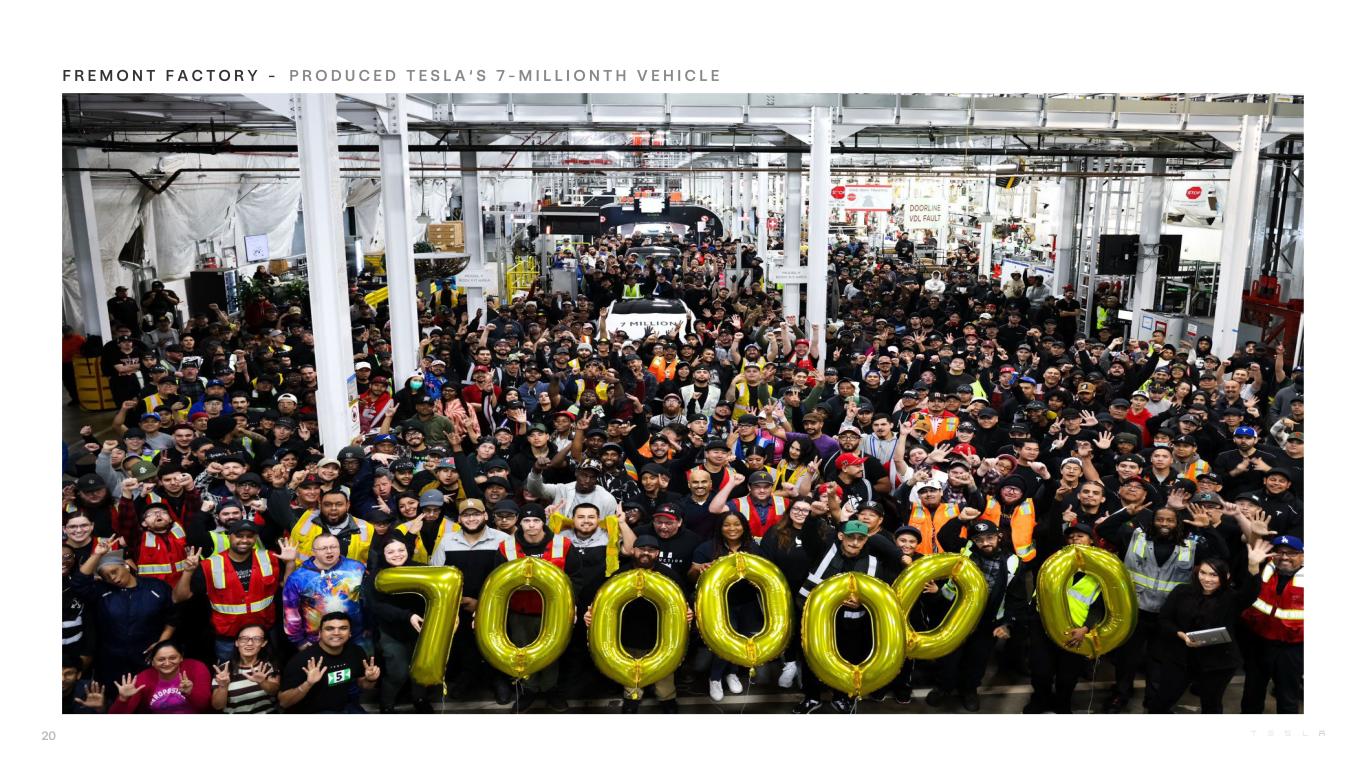
F R E M O N T F A C T O R Y - P R O D U C E D T E S L A ‘ S 7 - M I L L I O N T H V E H I C L E 20

P O W E R W A L L 3 - A V A I L A B L E N O W 21
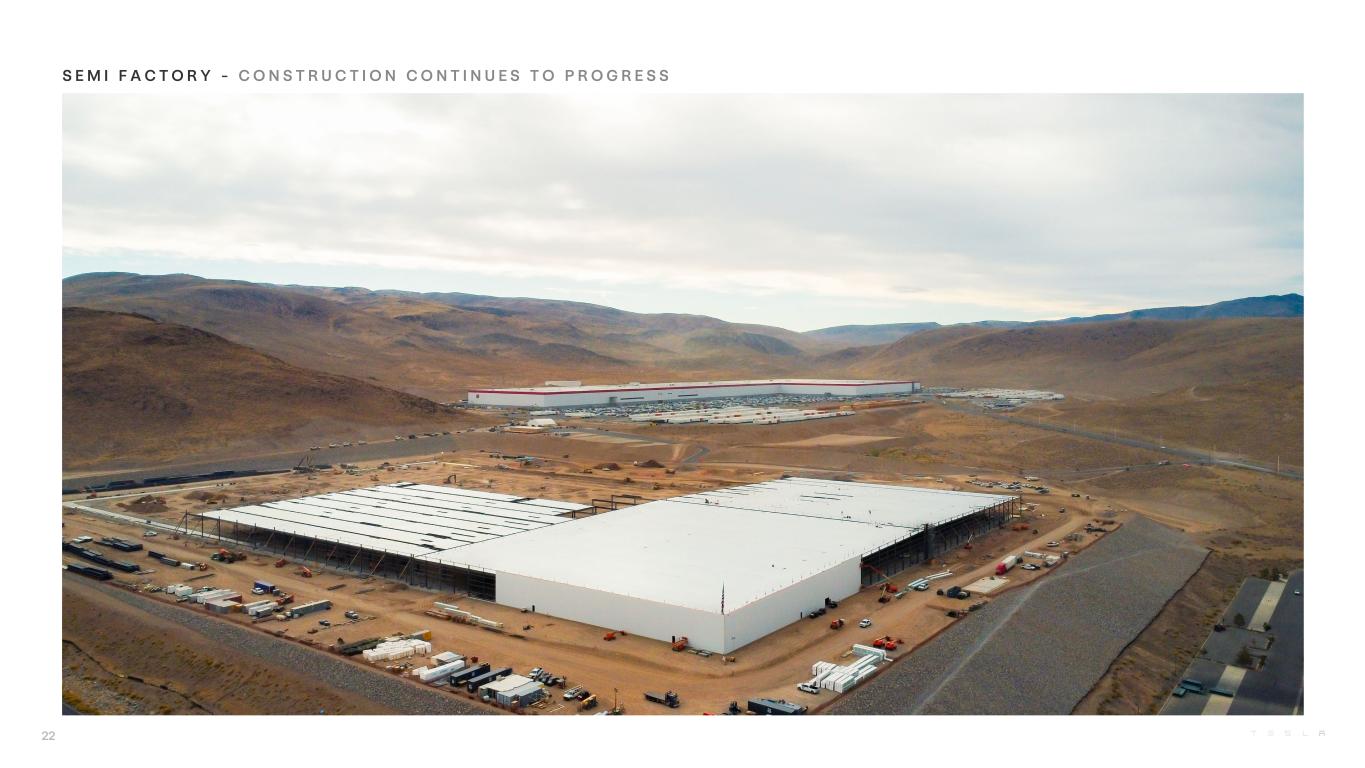
S E M I F A C T O R Y - C O N S T R U C T I O N C O N T I N U E S T O P R O G R E S S 22
Vehicle Deliveries (millions of units) K E Y M E T R I C S Q U A R T E R L Y (Unaudited) Operating Cash Flow ($B) Free Cash Flow ($B) Net Income ($B) Adjusted EBITDA ($B) 23 0.0 0.1 0.2 0.3 0.4 0.5 4 Q -2 0 2 1 1Q -2 0 2 2 2 Q -2 0 2 2 3 Q -2 0 2 2 4 Q -2 0 2 2 1Q -2 0 2 3 2 Q -2 0 2 3 3 Q -2 0 2 3 4 Q -2 0 2 3 1Q -2 0 2 4 2 Q -2 0 2 4 3 Q -2 0 2 4 0 1 2 3 4 5 6 7 8 4 Q -2 0 2 1 1Q -2 0 2 2 2 Q -2 0 2 2 3 Q -2 0 2 2 4 Q -2 0 2 2 1Q -2 0 2 3 2 Q -2 0 2 3 3 Q -2 0 2 3 4 Q -2 0 2 3 1Q -2 0 2 4 2 Q -2 0 2 4 3 Q -2 0 2 4 -3 -2 -1 0 1 2 3 4 5 6 7 4 Q -2 0 2 1 1Q -2 0 2 2 2 Q -2 0 2 2 3 Q -2 0 2 2 4 Q -2 0 2 2 1Q -2 0 2 3 2 Q -2 0 2 3 3 Q -2 0 2 3 4 Q -2 0 2 3 1Q -2 0 2 4 2 Q -2 0 2 4 3 Q -2 0 2 4
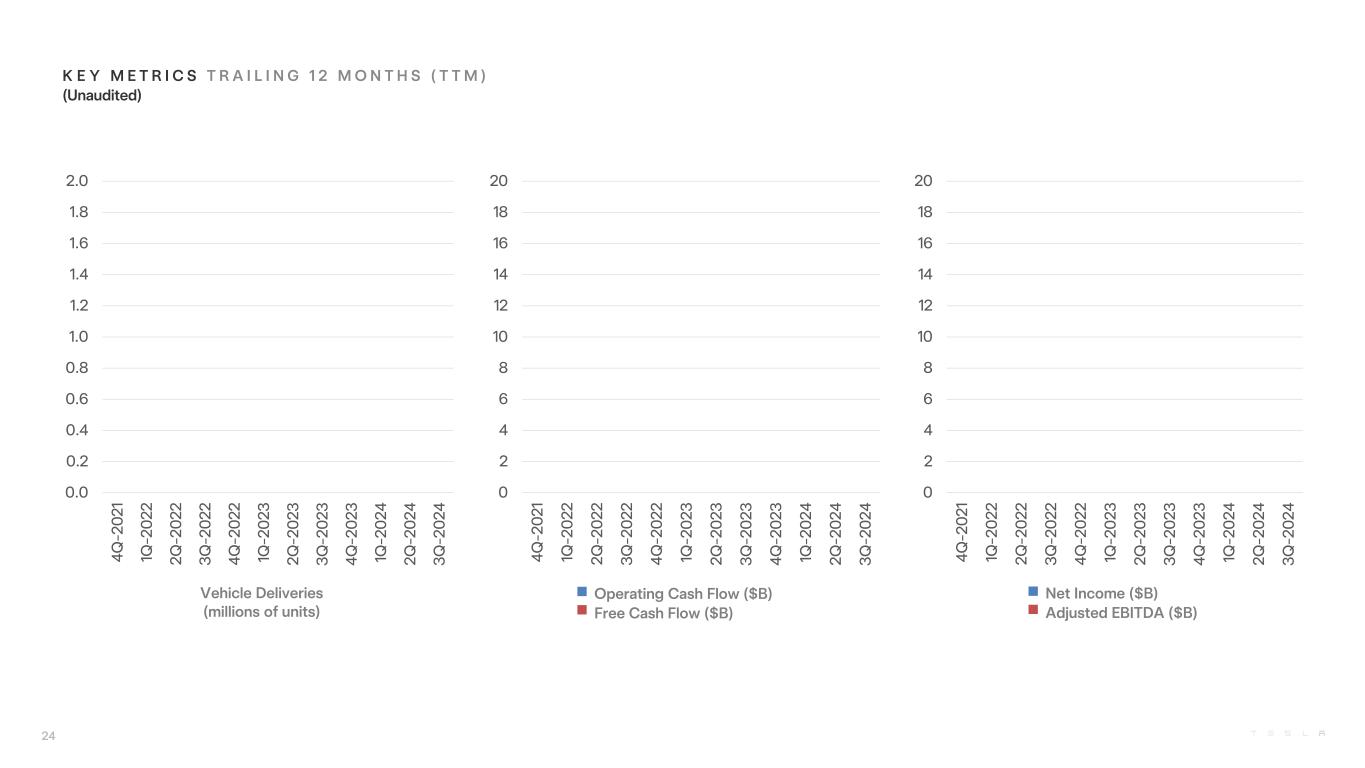
Operating Cash Flow ($B) Free Cash Flow ($B) K E Y M E T R I C S T R A I L I N G 1 2 M O N T H S ( T T M ) (Unaudited) Net Income ($B) Adjusted EBITDA ($B) Vehicle Deliveries (millions of units) 24 0.0 0.2 0.4 0.6 0.8 1.0 1.2 1.4 1.6 1.8 2.0 4 Q -2 0 2 1 1Q -2 0 2 2 2 Q -2 0 2 2 3 Q -2 0 2 2 4 Q -2 0 2 2 1Q -2 0 2 3 2 Q -2 0 2 3 3 Q -2 0 2 3 4 Q -2 0 2 3 1Q -2 0 2 4 2 Q -2 0 2 4 3 Q -2 0 2 4 0 2 4 6 8 10 12 14 16 18 20 4 Q -2 0 2 1 1Q -2 0 2 2 2 Q -2 0 2 2 3 Q -2 0 2 2 4 Q -2 0 2 2 1Q -2 0 2 3 2 Q -2 0 2 3 3 Q -2 0 2 3 4 Q -2 0 2 3 1Q -2 0 2 4 2 Q -2 0 2 4 3 Q -2 0 2 4 0 2 4 6 8 10 12 14 16 18 20 4 Q -2 0 2 1 1Q -2 0 2 2 2 Q -2 0 2 2 3 Q -2 0 2 2 4 Q -2 0 2 2 1Q -2 0 2 3 2 Q -2 0 2 3 3 Q -2 0 2 3 4 Q -2 0 2 3 1Q -2 0 2 4 2 Q -2 0 2 4 3 Q -2 0 2 4

F I N A N C I A L S T A T E M E N T S
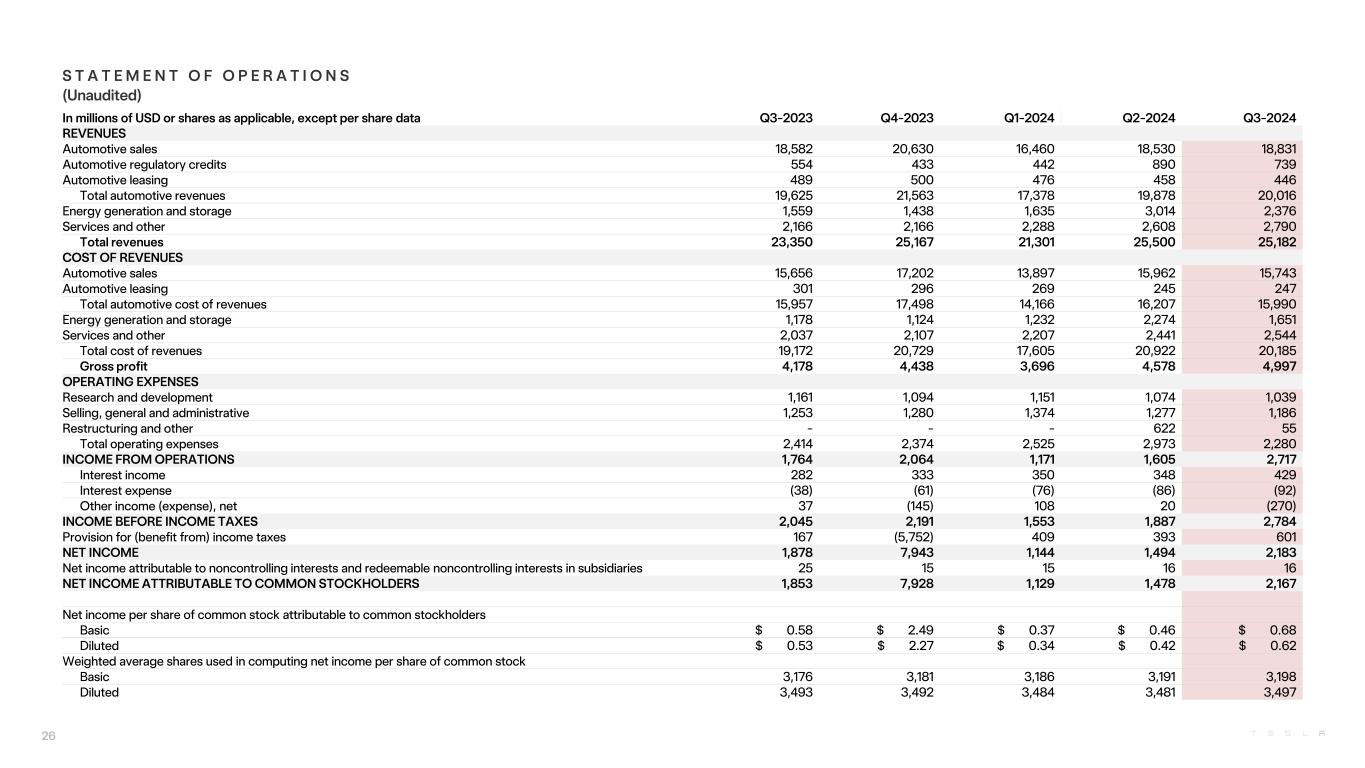
In millions of USD or shares as applicable, except per share data Q3-2023 Q4-2023 Q1-2024 Q2-2024 Q3-2024 REVENUES Automotive sales 18,582 20,630 16,460 18,530 18,831 Automotive regulatory credits 554 433 442 890 739 Automotive leasing 489 500 476 458 446 Total automotive revenues 19,625 21,563 17,378 19,878 20,016 Energy generation and storage 1,559 1,438 1,635 3,014 2,376 Services and other 2,166 2,166 2,288 2,608 2,790 Total revenues 23,350 25,167 21,301 25,500 25,182 COST OF REVENUES Automotive sales 15,656 17,202 13,897 15,962 15,743 Automotive leasing 301 296 269 245 247 Total automotive cost of revenues 15,957 17,498 14,166 16,207 15,990 Energy generation and storage 1,178 1,124 1,232 2,274 1,651 Services and other 2,037 2,107 2,207 2,441 2,544 Total cost of revenues 19,172 20,729 17,605 20,922 20,185 Gross profit 4,178 4,438 3,696 4,578 4,997 OPERATING EXPENSES Research and development 1,161 1,094 1,151 1,074 1,039 Selling, general and administrative 1,253 1,280 1,374 1,277 1,186 Restructuring and other - - - 622 55 Total operating expenses 2,414 2,374 2,525 2,973 2,280 INCOME FROM OPERATIONS 1,764 2,064 1,171 1,605 2,717 Interest income 282 333 350 348 429 Interest expense (38) (61) (76) (86) (92) Other income (expense), net 37 (145) 108 20 (270) INCOME BEFORE INCOME TAXES 2,045 2,191 1,553 1,887 2,784 Provision for (benefit from) income taxes 167 (5,752) 409 393 601 NET INCOME 1,878 7,943 1,144 1,494 2,183 Net income attributable to noncontrolling interests and redeemable noncontrolling interests in subsidiaries 25 15 15 16 16 NET INCOME ATTRIBUTABLE TO COMMON STOCKHOLDERS 1,853 7,928 1,129 1,478 2,167 Net income per share of common stock attributable to common stockholders Basic $ 0.58 $ 2.49 $ 0.37 $ 0.46 $ 0.68 Diluted $ 0.53 $ 2.27 $ 0.34 $ 0.42 $ 0.62 Weighted average shares used in computing net income per share of common stock Basic 3,176 3,181 3,186 3,191 3,198 Diluted 3,493 3,492 3,484 3,481 3,497 S T A T E M E N T O F O P E R A T I O N S (Unaudited) 26
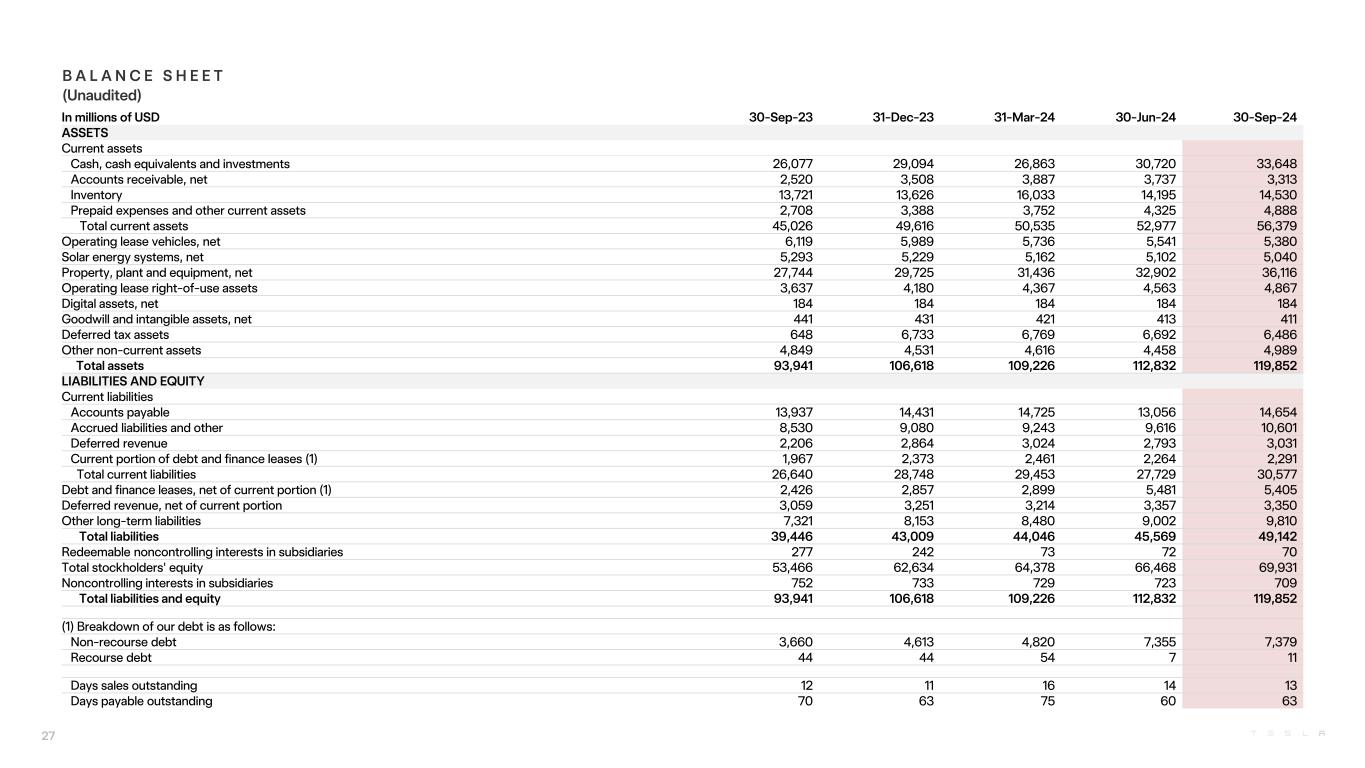
B A L A N C E S H E E T (Unaudited) In millions of USD 30-Sep-23 31-Dec-23 31-Mar-24 30-Jun-24 30-Sep-24 ASSETS Current assets Cash, cash equivalents and investments 26,077 29,094 26,863 30,720 33,648 Accounts receivable, net 2,520 3,508 3,887 3,737 3,313 Inventory 13,721 13,626 16,033 14,195 14,530 Prepaid expenses and other current assets 2,708 3,388 3,752 4,325 4,888 Total current assets 45,026 49,616 50,535 52,977 56,379 Operating lease vehicles, net 6,119 5,989 5,736 5,541 5,380 Solar energy systems, net 5,293 5,229 5,162 5,102 5,040 Property, plant and equipment, net 27,744 29,725 31,436 32,902 36,116 Operating lease right-of-use assets 3,637 4,180 4,367 4,563 4,867 Digital assets, net 184 184 184 184 184 Goodwill and intangible assets, net 441 431 421 413 411 Deferred tax assets 648 6,733 6,769 6,692 6,486 Other non-current assets 4,849 4,531 4,616 4,458 4,989 Total assets 93,941 106,618 109,226 112,832 119,852 LIABILITIES AND EQUITY Current liabilities Accounts payable 13,937 14,431 14,725 13,056 14,654 Accrued liabilities and other 8,530 9,080 9,243 9,616 10,601 Deferred revenue 2,206 2,864 3,024 2,793 3,031 Current portion of debt and finance leases (1) 1,967 2,373 2,461 2,264 2,291 Total current liabilities 26,640 28,748 29,453 27,729 30,577 Debt and finance leases, net of current portion (1) 2,426 2,857 2,899 5,481 5,405 Deferred revenue, net of current portion 3,059 3,251 3,214 3,357 3,350 Other long-term liabilities 7,321 8,153 8,480 9,002 9,810 Total liabilities 39,446 43,009 44,046 45,569 49,142 Redeemable noncontrolling interests in subsidiaries 277 242 73 72 70 Total stockholders' equity 53,466 62,634 64,378 66,468 69,931 Noncontrolling interests in subsidiaries 752 733 729 723 709 Total liabilities and equity 93,941 106,618 109,226 112,832 119,852 (1) Breakdown of our debt is as follows: Non-recourse debt 3,660 4,613 4,820 7,355 7,379 Recourse debt 44 44 54 7 11 Days sales outstanding 12 11 16 14 13 Days payable outstanding 70 63 75 60 63 27
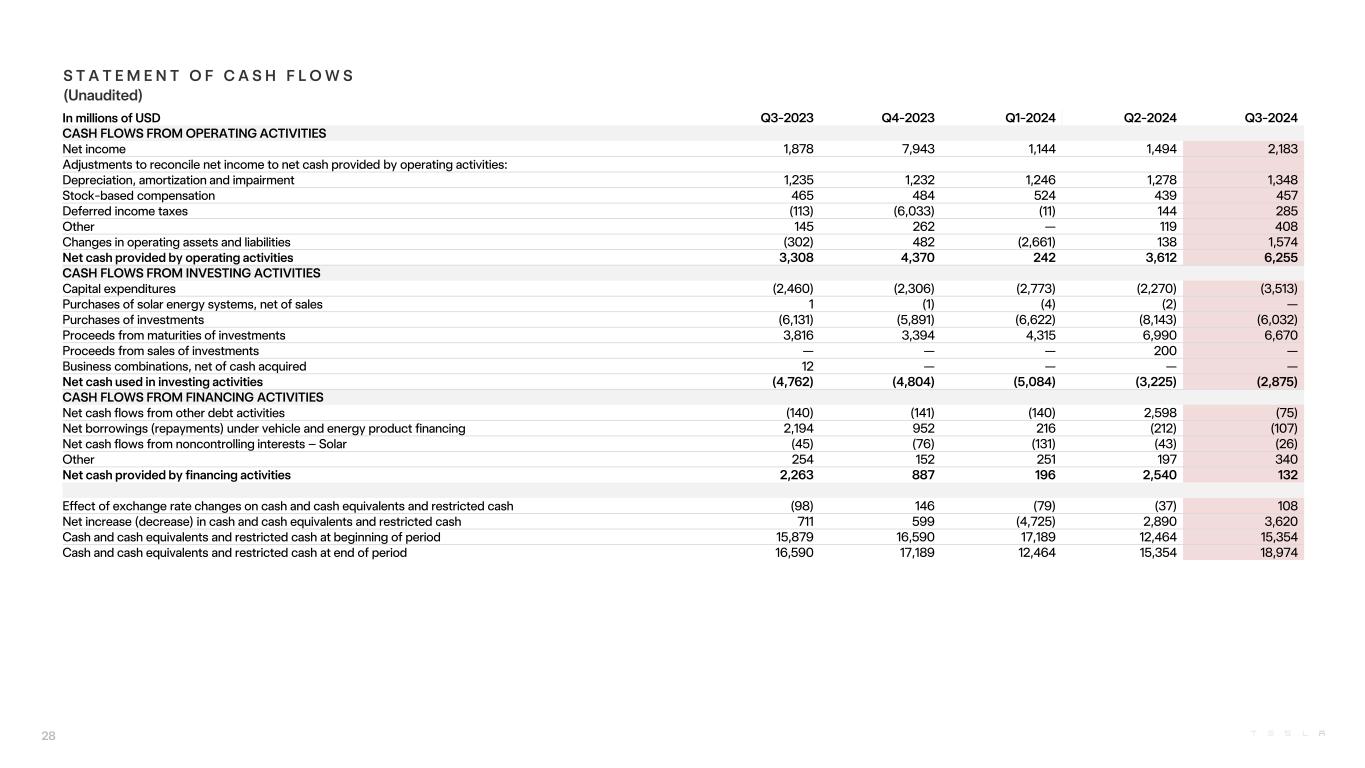
In millions of USD Q3-2023 Q4-2023 Q1-2024 Q2-2024 Q3-2024 CASH FLOWS FROM OPERATING ACTIVITIES Net income 1,878 7,943 1,144 1,494 2,183 Adjustments to reconcile net income to net cash provided by operating activities: Depreciation, amortization and impairment 1,235 1,232 1,246 1,278 1,348 Stock-based compensation 465 484 524 439 457 Deferred income taxes (113) (6,033) (11) 144 285 Other 145 262 — 119 408 Changes in operating assets and liabilities (302) 482 (2,661) 138 1,574 Net cash provided by operating activities 3,308 4,370 242 3,612 6,255 CASH FLOWS FROM INVESTING ACTIVITIES Capital expenditures (2,460) (2,306) (2,773) (2,270) (3,513) Purchases of solar energy systems, net of sales 1 (1) (4) (2) — Purchases of investments (6,131) (5,891) (6,622) (8,143) (6,032) Proceeds from maturities of investments 3,816 3,394 4,315 6,990 6,670 Proceeds from sales of investments — — — 200 — Business combinations, net of cash acquired 12 — — — — Net cash used in investing activities (4,762) (4,804) (5,084) (3,225) (2,875) CASH FLOWS FROM FINANCING ACTIVITIES Net cash flows from other debt activities (140) (141) (140) 2,598 (75) Net borrowings (repayments) under vehicle and energy product financing 2,194 952 216 (212) (107) Net cash flows from noncontrolling interests – Solar (45) (76) (131) (43) (26) Other 254 152 251 197 340 Net cash provided by financing activities 2,263 887 196 2,540 132 Effect of exchange rate changes on cash and cash equivalents and restricted cash (98) 146 (79) (37) 108 Net increase (decrease) in cash and cash equivalents and restricted cash 711 599 (4,725) 2,890 3,620 Cash and cash equivalents and restricted cash at beginning of period 15,879 16,590 17,189 12,464 15,354 Cash and cash equivalents and restricted cash at end of period 16,590 17,189 12,464 15,354 18,974 S T A T E M E N T O F C A S H F L O W S (Unaudited) 28

In millions of USD or shares as applicable, except per share data Q3-2023 Q4-2023 Q1-2024 Q2-2024 Q3-2024 Net income attributable to common stockholders (GAAP) 1,853 7,928 1,129 1,478 2,167 Stock-based compensation expense, net of tax 465 484 407 334 338 Release of valuation allowance on deferred tax assets — (5,927) — — — Net income attributable to common stockholders (non-GAAP) 2,318 2,485 1,536 1,812 2,505 Less: Buy-outs of noncontrolling interests 2 1 (42) — — Net income used in computing diluted EPS attributable to common stockholders (non-GAAP) 2,316 2,484 1,578 1,812 2,505 EPS attributable to common stockholders, diluted (GAAP) 0.53 2.27 0.34 0.42 0.62 Stock-based compensation expense per share, net of tax 0.13 0.14 0.11 0.10 0.10 Release of valuation allowance on deferred tax assets per share — (1.70) — — — EPS attributable to common stockholders, diluted (non-GAAP) 0.66 0.71 0.45 0.52 0.72 Shares used in EPS calculation, diluted (GAAP and non-GAAP) 3,493 3,492 3,484 3,481 3,497 Net income attributable to common stockholders (GAAP) 1,853 7,928 1,129 1,478 2,167 Interest expense 38 61 76 86 92 Provision for (benefit from) income taxes 167 (5,752) 409 393 601 Depreciation, amortization and impairment 1,235 1,232 1,246 1,278 1,348 Stock-based compensation expense 465 484 524 439 457 Adjusted EBITDA (non-GAAP) 3,758 3,953 3,384 3,674 4,665 Total revenues 23,350 25,167 21,301 25,500 25,182 Adjusted EBITDA margin (non-GAAP) 16.1% 15.7% 15.9% 14.4% 18.5% R E C O N C I L I A T I O N O F G A A P T O N O N – G A A P F I N A N C I A L I N F O R M A T I O N (Unaudited) 29
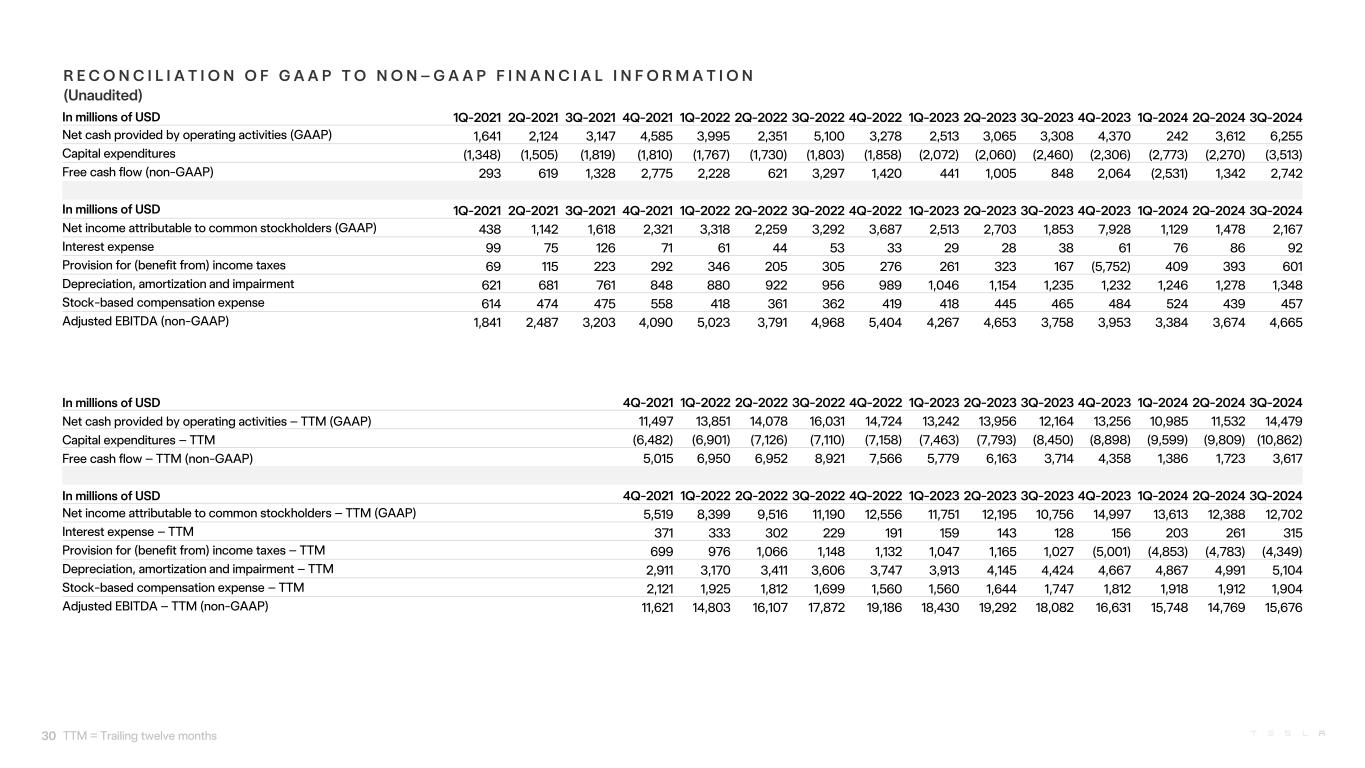
R E C O N C I L I A T I O N O F G A A P T O N O N – G A A P F I N A N C I A L I N F O R M A T I O N (Unaudited) In millions of USD 4Q-2021 1Q-2022 2Q-2022 3Q-2022 4Q-2022 1Q-2023 2Q-2023 3Q-2023 4Q-2023 1Q-2024 2Q-2024 3Q-2024 Net cash provided by operating activities – TTM (GAAP) 11,497 13,851 14,078 16,031 14,724 13,242 13,956 12,164 13,256 10,985 11,532 14,479 Capital expenditures – TTM (6,482) (6,901) (7,126) (7,110) (7,158) (7,463) (7,793) (8,450) (8,898) (9,599) (9,809) (10,862) Free cash flow – TTM (non-GAAP) 5,015 6,950 6,952 8,921 7,566 5,779 6,163 3,714 4,358 1,386 1,723 3,617 In millions of USD 4Q-2021 1Q-2022 2Q-2022 3Q-2022 4Q-2022 1Q-2023 2Q-2023 3Q-2023 4Q-2023 1Q-2024 2Q-2024 3Q-2024 Net income attributable to common stockholders – TTM (GAAP) 5,519 8,399 9,516 11,190 12,556 11,751 12,195 10,756 14,997 13,613 12,388 12,702 Interest expense – TTM 371 333 302 229 191 159 143 128 156 203 261 315 Provision for (benefit from) income taxes – TTM 699 976 1,066 1,148 1,132 1,047 1,165 1,027 (5,001) (4,853) (4,783) (4,349) Depreciation, amortization and impairment – TTM 2,911 3,170 3,411 3,606 3,747 3,913 4,145 4,424 4,667 4,867 4,991 5,104 Stock-based compensation expense – TTM 2,121 1,925 1,812 1,699 1,560 1,560 1,644 1,747 1,812 1,918 1,912 1,904 Adjusted EBITDA – TTM (non-GAAP) 11,621 14,803 16,107 17,872 19,186 18,430 19,292 18,082 16,631 15,748 14,769 15,676 TTM = Trailing twelve months In millions of USD 1Q-2021 2Q-2021 3Q-2021 4Q-2021 1Q-2022 2Q-2022 3Q-2022 4Q-2022 1Q-2023 2Q-2023 3Q-2023 4Q-2023 1Q-2024 2Q-2024 3Q-2024 Net cash provided by operating activities (GAAP) 1,641 2,124 3,147 4,585 3,995 2,351 5,100 3,278 2,513 3,065 3,308 4,370 242 3,612 6,255 Capital expenditures (1,348) (1,505) (1,819) (1,810) (1,767) (1,730) (1,803) (1,858) (2,072) (2,060) (2,460) (2,306) (2,773) (2,270) (3,513) Free cash flow (non-GAAP) 293 619 1,328 2,775 2,228 621 3,297 1,420 441 1,005 848 2,064 (2,531) 1,342 2,742 In millions of USD 1Q-2021 2Q-2021 3Q-2021 4Q-2021 1Q-2022 2Q-2022 3Q-2022 4Q-2022 1Q-2023 2Q-2023 3Q-2023 4Q-2023 1Q-2024 2Q-2024 3Q-2024 Net income attributable to common stockholders (GAAP) 438 1,142 1,618 2,321 3,318 2,259 3,292 3,687 2,513 2,703 1,853 7,928 1,129 1,478 2,167 Interest expense 99 75 126 71 61 44 53 33 29 28 38 61 76 86 92 Provision for (benefit from) income taxes 69 115 223 292 346 205 305 276 261 323 167 (5,752) 409 393 601 Depreciation, amortization and impairment 621 681 761 848 880 922 956 989 1,046 1,154 1,235 1,232 1,246 1,278 1,348 Stock-based compensation expense 614 474 475 558 418 361 362 419 418 445 465 484 524 439 457 Adjusted EBITDA (non-GAAP) 1,841 2,487 3,203 4,090 5,023 3,791 4,968 5,404 4,267 4,653 3,758 3,953 3,384 3,674 4,665 30

A D D I T I O N A L I N F O R M A T I O N WEBCAST INFORMATION Tesla will provide a live webcast of its third quarter 2024 financial results conference call beginning at 4:30 p.m. CT on October 23, 2024 at ir.tesla.com. This webcast will also be available for replay for approximately one year thereafter. CERTAIN TERMS When used in this update, certain terms have the following meanings. Our vehicle deliveries include only vehicles that have been transferred to end customers with all paperwork correctly completed. Our energy product deployment volume includes both customer units when installed and equipment sales at time of delivery. "Adjusted EBITDA" is equal to (i) net income (loss) attributable to common stockholders before (ii)(a) interest expense, (b) provision for income taxes, (c) depreciation, amortization and impairment and (d) stock-based compensation expense. "Free cash flow" is operating cash flow less capital expenditures. Average cost per vehicle is cost of automotive sales divided by new vehicle deliveries (excluding operating leases). “Days sales outstanding” is equal to (i) average accounts receivable, net for the period divided by (ii) total revenues and multiplied by (iii) the number of days in the period. “Days payable outstanding” is equal to (i) average accounts payable for the period divided by (ii) total cost of revenues and multiplied by (iii) the number of days in the period. “Days of supply” is calculated by dividing new car ending inventory by the relevant quarter’s deliveries and using 75 trading days. Constant currency impacts are calculated by comparing actuals against current results converted into USD using average exchange rates from the prior period. NON-GAAP FINANCIAL INFORMATION Consolidated financial information has been presented in accordance with GAAP as well as on a non-GAAP basis to supplement our consolidated financial results. Our non-GAAP financial measures include non-GAAP net income (loss) attributable to common stockholders, non-GAAP net income (loss) attributable to common stockholders on a diluted per share basis (calculated using weighted average shares for GAAP diluted net income (loss) attributable to common stockholders), Adjusted EBITDA, Adjusted EBITDA margin and free cash flow. These non-GAAP financial measures also facilitate management’s internal comparisons to Tesla’s historical performance as well as comparisons to the operating results of other companies. Management believes that it is useful to supplement its GAAP financial statements with this non-GAAP information because management uses such information internally for its operating, budgeting and financial planning purposes. Management also believes that presentation of the non-GAAP financial measures provides useful information to our investors regarding our financial condition and results of operations, so that investors can see through the eyes of Tesla management regarding important financial metrics that Tesla uses to run the business and allowing investors to better understand Tesla’s performance. Non-GAAP information is not prepared under a comprehensive set of accounting rules and therefore, should only be read in conjunction with financial information reported under U.S. GAAP when understanding Tesla’s operating performance. A reconciliation between GAAP and non-GAAP financial information is provided above. FORWARD-LOOKING STATEMENTS Certain statements in this update, including, but not limited to, statements in the “Outlook” section; statements relating to the development, strategy, ramp, production and capacity, demand and market growth, cost, pricing and profitability, investment, deliveries, deployment, availability and other features and improvements and timing of existing and future Tesla products and services; statements regarding operating margin, operating profits, spending and liquidity; and statements regarding expansion, improvements and/or ramp and related timing at our factories are “forward-looking statements” within the meaning of the Private Securities Litigation Reform Act of 1995. Forward-looking statements are based on assumptions and management’s current expectations, involve certain risks and uncertainties, and are not guarantees. Future results may differ materially from those expressed in any forward-looking statement. The following important factors, without limitation, could cause actual results to differ materially from those in the forward-looking statements: the risk of delays in launching and/or manufacturing our products, services and features cost-effectively; our ability to build and/or grow our products and services, sales, delivery, installation, servicing and charging capabilities and effectively manage this growth; our ability to successfully and timely develop, introduce and scale, as well as our consumers’ demand for, products and services based on artificial intelligence, robotics and automation, electric vehicles, Autopilot and FSD (Supervised) features, and ride-hailing services generally and our vehicles and services specifically; the ability of suppliers to deliver components according to schedules, prices, quality and volumes acceptable to us, and our ability to manage such components effectively; any issues with lithium-ion cells or other components manufactured at our factories; our ability to ramp our factories in accordance with our plans; our ability to procure supply of battery cells, including through our own manufacturing; risks relating to international expansion; any failures by Tesla products to perform as expected or if product recalls occur; the risk of product liability claims; competition in the automotive, transportation and energy product and services markets; our ability to maintain public credibility and confidence in our long- term business prospects; our ability to manage risks relating to our various product financing programs; the status of government and economic incentives for electric vehicles and energy products; our ability to attract, hire and retain key employees and qualified personnel; our ability to maintain the security of our information and production and product systems; our compliance with various regulations and laws applicable to our operations and products, which may evolve from time to time; risks relating to our indebtedness and financing strategies; and adverse foreign exchange movements. More information on potential factors that could affect our financial results is included from time to time in our Securities and Exchange Commission filings and reports, including the risks identified under the section captioned “Risk Factors” in our annual report on Form 10-K filed with the SEC on January 26, 2024 and subsequent quarterly reports on Form 10-Q. Tesla disclaims any obligation to update information contained in these forward-looking statements whether as a result of new information, future events or otherwise. 31


