Document
Exhibit 99.1
October 16, 2024
Fellow Shareholders,
For the third quarter, we earned net income to common stockholders of $4.5 million, or $0.19 per diluted share.
Discussion of the Quarter
Here are the things I think investors should keep top of mind about the quarter:
•The freight recession is closer to ending than when it began, but that does not necessarily mean it will end soon. We are 33 months into a freight recession. That makes it the longest since deregulation in 1980. Brokers and carriers are feeling the pressure. There are new bankruptcy filings nearly every week. Weaker capacity is leaving the system, but not at a dramatic rate. We do not have an opinion to express about when this cycle will end. Our primary job is to power through it and serve the needs of our customers; our secondary job is to make the best of this difficult environment by expanding market share.
•Expenses were within our target range. We called our shot on expenses being under $97 million and we hit it. We intend to do the same in Q4. We remain disciplined on the things we can control.
•TriumphPay returned to EBITDA positive. Despite the freight recession and our investments in the future, our payments segment returned to a positive EBITDA margin. Performance should continue to improve from here, but it is unlikely to be linear.
•We are at the official starting line for LoadPay and Factoring as a Service (“FaaS”). In prior letters, we identified these offerings as part of our journey to achieving $1 billion of revenue from our transportation fintech platform. We have taken the next steps in the deployment of LoadPay and FaaS with C.H. Robinson. We also expect to offer both products to a host of customers through multiple distribution channels in the future. I have included a deeper dive into the unit economics of LoadPay in a later section.
•Credit continues to be a modest headwind to earnings. Our year-to-date credit loss expense is $14.3 million. It has run approximately 12 basis points for each of the last 3 quarters. That compares well to many community banks, but it does not meet my expectations. We can tell individual stories about credits, but nobody cares to hear the excuses. A nominally small amount of our historical credit loss is associated with factoring or payments, which are our growth businesses. They have performed as we predicted they would in that the risk in those businesses is revenue volatility more than credit loss. In all of our lines of business, it is our job to keep that risk within acceptable parameters. Beyond credit expense, classified assets are higher than our historical norms. Most of this balance continues to perform, and the classification takes the current interest rate environment into account.
KPIs for the Quarter
The tables below outline some of our key operating metrics.
|
|
|
|
|
|
|
|
|
|
|
|
|
|
|
|
|
|
|
|
|
|
|
|
|
|
|
|
|
|
|
|
|
|
|
As of and for the Three Months Ended |
|
|
| (Dollars in thousands) |
September 30,
2024 |
|
June 30,
2024 |
|
March 31,
2024 |
|
December 31,
2023 |
|
September 30,
2023 |
|
|
|
|
| Financial Highlights: |
|
|
|
|
|
|
|
|
|
|
|
|
|
| Loans held for investment |
$ |
4,332,967 |
|
|
$ |
4,288,417 |
|
|
$ |
4,195,120 |
|
|
$ |
4,163,100 |
|
|
$ |
4,371,528 |
|
|
|
|
|
| Deposits |
$ |
4,706,694 |
|
|
$ |
4,392,018 |
|
|
$ |
4,450,963 |
|
|
$ |
3,977,478 |
|
|
$ |
4,487,051 |
|
|
|
|
|
| Net income available to common stockholders |
$ |
4,546 |
|
|
$ |
1,945 |
|
|
$ |
3,357 |
|
|
$ |
8,825 |
|
|
$ |
11,993 |
|
|
|
|
|
| Diluted earnings per common share |
$ |
0.19 |
|
|
$ |
0.08 |
|
|
$ |
0.14 |
|
|
$ |
0.37 |
|
|
$ |
0.51 |
|
|
|
|
|
Return on average assets(1) |
0.36 |
% |
|
0.19 |
% |
|
0.31 |
% |
|
0.70 |
% |
|
0.93 |
% |
|
|
|
|
Yield on loans(1) |
8.85 |
% |
|
9.10 |
% |
|
9.09 |
% |
|
9.29 |
% |
|
9.16 |
% |
|
|
|
|
Cost of total funds(1) |
1.57 |
% |
|
1.62 |
% |
|
1.45 |
% |
|
1.47 |
% |
|
1.41 |
% |
|
|
|
|
| Non-performing assets to total assets |
2.07 |
% |
|
1.60 |
% |
|
1.61 |
% |
|
1.42 |
% |
|
1.07 |
% |
|
|
|
|
| ACL to total loans |
0.95 |
% |
|
0.92 |
% |
|
0.91 |
% |
|
0.85 |
% |
|
0.80 |
% |
|
|
|
|
Total capital to risk-weighted assets(2) |
16.62 |
% |
|
16.51 |
% |
|
16.69 |
% |
|
16.75 |
% |
|
15.77 |
% |
|
|
|
|
Common equity tier 1 capital to risk-weighted assets(2) |
11.85 |
% |
|
11.71 |
% |
|
11.85 |
% |
|
11.94 |
% |
|
11.18 |
% |
|
|
|
|
(1) Current quarter ratios are annualized
(2) Current period ratios are preliminary
|
|
|
|
|
|
|
|
|
|
|
|
|
|
|
|
|
|
|
|
|
|
|
|
|
|
|
|
|
|
|
|
|
|
|
|
|
|
|
|
|
|
|
|
|
|
|
|
|
|
|
|
|
|
|
September 30,
2024 |
|
June 30,
2024 |
|
March 31,
2024 |
|
December 31,
2023 |
|
September 30,
2023 |
|
Current Quarter Q/Q |
|
Current Year Y/Y |
| For the Qtr Ending |
|
|
|
|
|
Change |
|
% Change |
|
Change |
|
% Change |
| Factoring: |
|
|
|
|
|
|
|
|
|
|
|
|
|
|
|
|
|
| Invoice Volume |
1,480,824 |
|
|
1,432,366 |
|
|
1,367,625 |
|
|
1,404,861 |
|
|
1,428,463 |
|
|
48,458 |
|
|
3.4 |
% |
|
52,361 |
|
|
3.7 |
% |
| Purchased Volume |
$ |
2,610,177,000 |
|
|
$ |
2,542,327,000 |
|
|
$ |
2,469,797,000 |
|
|
$ |
2,570,442,000 |
|
|
$ |
2,606,323,000 |
|
|
$ |
67,850,000 |
|
|
2.7 |
% |
|
$ |
3,854,000 |
|
|
0.1 |
% |
| Average Transportation Invoice Size |
$ |
1,724 |
|
|
$ |
1,738 |
|
|
$ |
1,771 |
|
|
$ |
1,781 |
|
|
$ |
1,772 |
|
|
$ |
(14) |
|
|
(0.8) |
% |
|
$ |
(48) |
|
|
(2.7) |
% |
| Payments: |
|
|
|
|
|
|
|
|
|
|
|
|
|
|
|
|
|
| Invoice Volume |
6,278,246 |
|
|
6,062,779 |
|
|
5,717,016 |
|
|
5,703,740 |
|
|
5,037,841 |
|
|
215,467 |
|
|
3.6 |
% |
|
1,240,405 |
|
|
24.6 |
% |
| Payment Volume |
$ |
7,091,493,000 |
|
|
$ |
6,687,587,000 |
|
|
$ |
6,379,680,000 |
|
|
$ |
6,217,323,000 |
|
|
$ |
5,329,580,000 |
|
|
$ |
403,906,000 |
|
|
6.0 |
% |
|
$ |
1,761,913,000 |
|
|
33.1 |
% |
| Network Invoice Volume |
661,628 |
|
|
701,768 |
|
|
621,209 |
|
|
442,353 |
|
|
303,300 |
|
|
(40,140) |
|
|
(5.7) |
% |
|
358,328 |
|
|
118.1 |
% |
| Network Payment Volume |
$ |
1,063,228,000 |
|
|
$ |
1,133,118,000 |
|
|
$ |
1,035,099,000 |
|
|
$ |
740,048,000 |
|
|
$ |
510,298,000 |
|
|
$ |
(69,890,000) |
|
|
(6.2) |
% |
|
$ |
552,930,000 |
|
|
108.4 |
% |
|
|
|
|
|
|
|
|
|
|
|
|
|
|
|
|
|
|
|
|
|
|
|
|
|
|
|
|
|
|
|
|
|
|
|
|
Payments
For our Payments segment discussion, we will cover the following topics:
1.Analysis of financial and operational performance for the quarter
2.Progression towards 50% density target
3.NextGen Audit
4.LoadPay update
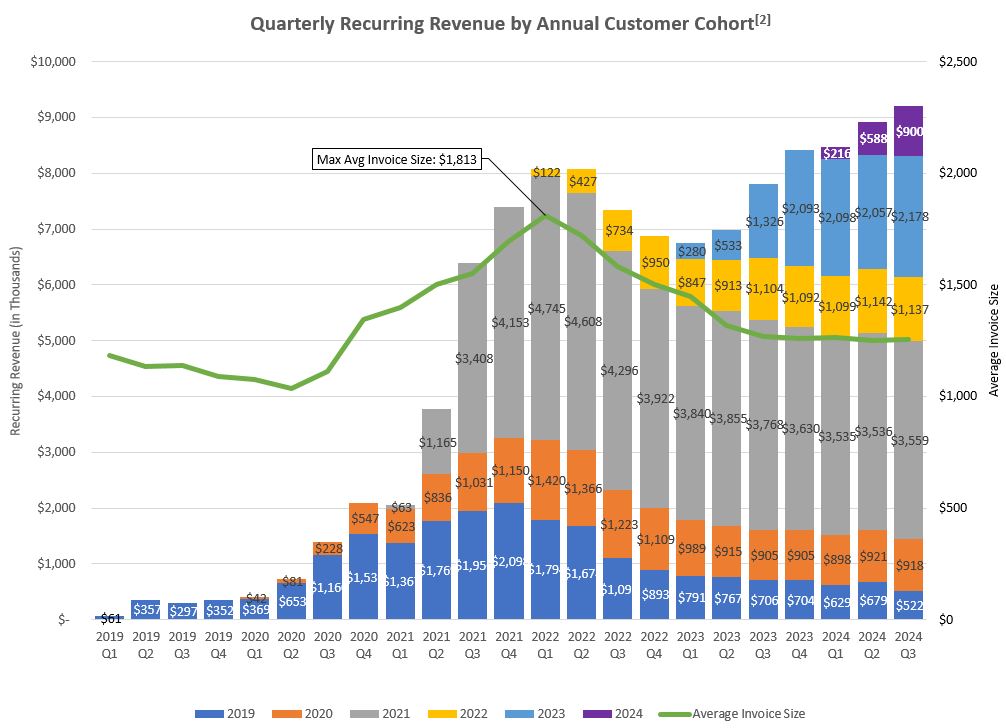
Analysis of financial and operational performance for the quarter. The chart on the following page provides a visual demonstration of how we continue to grow revenue in our Payments segment despite the freight recession. In the chart, the line represents invoice sizes[1], while the bars represent revenue. The revenue bars highlight quickpay and fee income that can be attributed to a specific customer in a specific year and excludes other supply chain finance income and float. Noninterest income in our Payments segment grew 7.8% this quarter and is up 30.0% versus Q3 2023. This includes the fees we generate from network transactions and other highly scalable network activities.
In the chart below, we highlight the continued revenue growth and its trend over the last eight quarters against the backdrop of our payment volumes. Our third quarter run rate was $59.5 million. We have generated a roughly 43.0% CAGR in revenue over the last two years.
In the chart below, we highlight the trend lines in EBITDA margin relative to revenue. We crossed back into positive EBITDA margin territory in Q3 (just barely!). I expect revenue and margin to continue to improve from here, but it will not be linear. As demonstrated with product rollouts for LoadPay and FaaS, we continue to focus on product development and product fit to create value for our customers even though it puts pressure on expenses. We are firmly convinced this will create long-term shareholder value.
In the short-term, earnings performance will be impacted by the freight market, which has been a steady headwind. Despite those headwinds, you can see in the chart below that we continue to grow revenue organically. We have added over $30 million of annualized run rate revenue in the last 24 months. Bear in mind that neither LoadPay nor FaaS are yet contributing to revenue. Moreover, there are material portions of broker payment volume that we expect to further monetize in the near future. I will go into further detail on that later in this section. In sum, we remain excited to execute on the opportunity we see in front of us.

Progression towards 50% density in brokered freight target[3]. I have spoken in prior letters about the importance of density. We believe that the entire brokered market in truckload (“TL”) is approximately $110 billion, annually. For the quarter, TriumphPay’s invoice volume increased 3.6%, and total payment volume increased by 6.0% to $28.4 billion, annualized. Our broker clients represent $25.0 billion of that figure, while the remaining $3.4 billion is related to shipper clients. The average invoice paid by TriumphPay increased 2.4% in size. Our annualized unique broker audit dollar volume was up slightly from Q2 at $15.8 billion, and our annualized unique factor audit volume was down slightly at $11.8 billion. The unique broker and factor audit volumes coupled with our broker payment volumes, represent our network engagement[4]. In Q3, our annualized network engagement was approximately $52.5 billion in brokered freight, thus representing about 48% of that market. Of the overall market, the top 25 brokers represent approximately $52.4 billion of the total. To add density quickly, it makes sense to focus on the largest brokers. The chart below shows where we are with this cohort. Note that the largest broker, C.H. Robinson, is shown in teal, but its volume did not begin to hit the network until after the quarter ended. That volume will begin to scale in Q4.
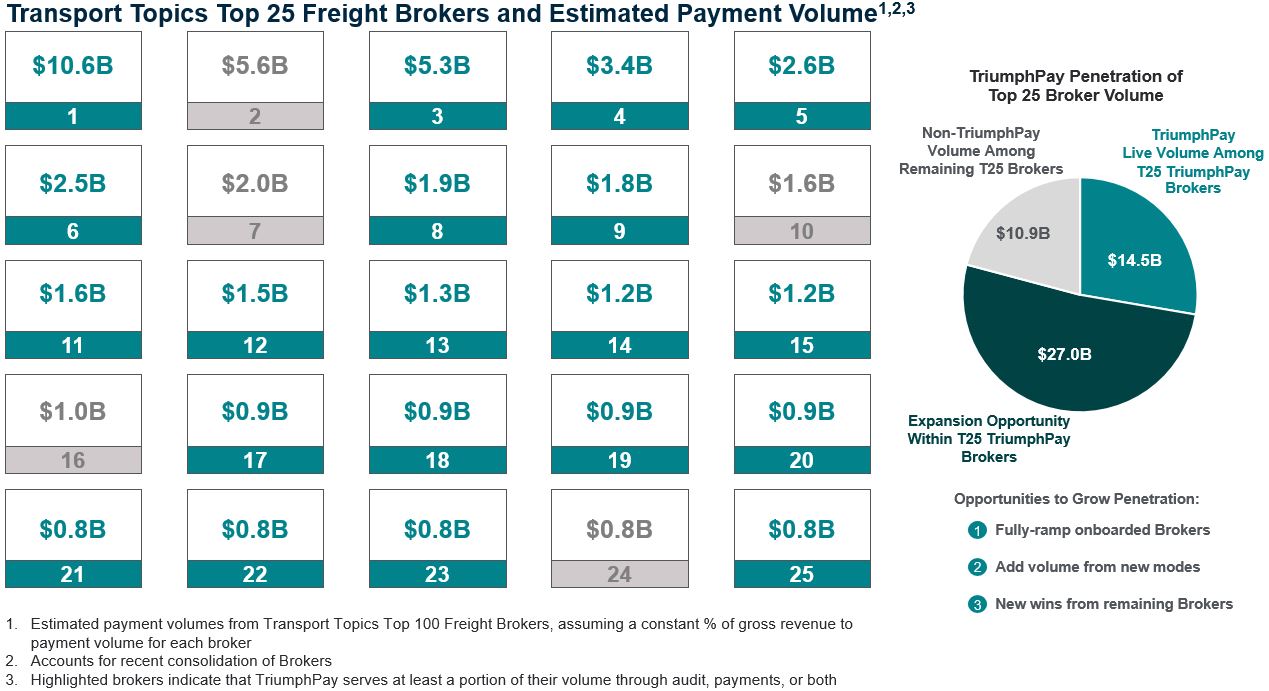
Once again, it is important to understand that a broker highlighted in teal does not indicate we have fully onboarded or fully monetized that relationship. It is also important for investors to understand that for some of the companies represented above, we provide our audit solution, for some we provide our payment services and for some we do both. Bringing more brokers onto the platform for both offerings is an embedded revenue opportunity. Further, some of our longest tenured customers use our legacy version of the audit product, which is priced substantially below our NextGen audit product (and has far less functionality). As more customers migrate to our NextGen product, we will deliver more value to them and enhance our revenue. Finally, we are expanding our audit and payment offering into less-than-truckload (“LTL”). That module in our audit product goes live in the fourth quarter, and we plan to onboard more customers during our general release planned for the first half of 2025. Expanding modes within our customer base is another opportunity to grow revenue. When you add all of that together, I feel confident in saying that we believe we are just scratching the surface of the revenue opportunity before us. As the ecosystem matures and network effects become more pronounced, revenue should grow and EBITDA margin will improve, and we will begin to measure net margin. It will not be overnight, but I see evidence of it happening right in front of us every quarter.
With all the good news regarding density increases and product improvements, we need to be fair and point out one metric that did not improve quarter over quarter. Total network volume decreased in Q3 over Q2 by 5.7%. The decline is attributed to the loss of one tier 1 factor on the network. The transportation industry has continued to struggle in this prolonged freight recession, and that has been particularly hard on factoring companies. Prolonged pressure of this kind requires companies to make difficult decisions. Given the overall market share held by the top 20 factors in the industry, a decision by one of our large clients can have an impact on our short-term results. I am comforted by the pipeline of volume I see coming on to the system, including the broader launch of FaaS. Based on those elements alone, I fully expect to return to network volume growth by Q1 of next year if not sooner. We now have 63 factors on TriumphPay and 37 factors on the network. Our broker quickpay penetration average was 5.6%, and we generated payment transaction fees on approximately 23.4% of our payments invoices. We also earned revenue of $2.6 million[5] on the net float generated through payments made on behalf of our clients. TriumphPay's non-interest expenses this quarter were $17.5 million, down 2.0% compared to the prior quarter.
NextGen Audit. Since I mentioned NextGen Audit in the paragraph above, it seems fitting to give investors some insights into how this product improves on our original offering. When we began offering Audit via our acquisition of HubTran, it was one of the first tools that automated invoice review and created efficiencies for brokers and factors. Earlier this year, we made enhancements to our original Audit product that can enable 85%+ touchless invoice processing.
Additionally, our AI/ML technology is 94%+ accurate when extracting data from invoices. I will not go into specifics here about features we are releasing for competitive reasons. What I will say is that over the next few quarters, we will continue to invest, focusing on proactive features which prevent exceptions before they are created and further increase the percentage of invoices that are approved and paid without being touched.
LoadPay Update. The promise of LoadPay is to allow carriers access to a digital bank account that can receive payments without time constraints. LoadPay allows carriers to elect to receive real-time payment through any TriumphPay network source, 24 hours a day, 365 days a year, including holidays, weekends, and after hours. This means access to payments even when legacy banks have gone home and the ACH rails are closed. These capabilities are no longer confined to whiteboards and strategy sessions. They are real and the benefits are being realized every day by carriers using LoadPay. There are further details in the Factoring segment discussion below.
We believe providing carriers access to their earned working capital in this manner and allowing freight brokers and factors to pay carriers around the clock will be a key differentiator and competitive driver for our LoadPay and FaaS partners. Triumph pays billions of dollars to carriers on behalf of our TriumphPay network of brokers and from our own factoring business. This is a very large marketing funnel for LoadPay. This is important for investors to understand – many fintechs spend too much time thinking about their product and not enough thinking about their distribution. We believe we can do both well.
Our initial target market for LoadPay is the owner operator (“O/O”). An O/O is defined as a carrier who operates between 1-3 power units. Based on our data, we estimate there are about 200,000 O/O currently active in the US. This may be conservative as the Owner-Operator Independent Drivers Association publishes the number as 350,000. In the current market environment, we do not believe all of those O/O are active.
The product and distribution may be great and the market size enormous, but what about the unit economics? We believe that each O/O LoadPay account will generate about $750 of gross revenue annually at inception. We hope that number will go up over time, but even if it remains at that level of revenue, it will be very profitable to Triumph. I say “hope” because we must make some assumptions in arriving at a calculation. Those assumptions will be augmented by real world usage and become more precise over time. What I can say now is that most of the LoadPay revenue is interchange revenue generated from embedded debit cards. The second component of revenue is tied to the float generated by the accounts, which will fluctuate with interest rates. These are high value revenue streams compared to capital-intensive interest income. We have plans for other product offerings within LoadPay that should increase the revenue per client and the addressable market, but we are not ready to talk about those publicly at this time.
Factoring
1.Analysis of financial and operational performance for the quarter
2.Transportation market update
3.Technology, FaaS and TriumphPay
Analysis of financial and operational performance for the quarter. During the third quarter, our average transportation invoice price dropped to $1,724, down $48 from the same quarter in 2023 and decreased $14 from the second quarter of 2024. Purchased volume increased 2.7% relative to the second quarter.
Factoring segment operating income was $8.0 million, or $3.3 million higher than the prior quarter. This was primarily due to lower credit loss expenses and some non-recurring items impacting last quarter. Net interest income grew just over 2% as higher purchasing activity was offset by lower average invoice prices through most of the quarter. Yield on average receivables balances was down, falling 0.57% to 13.57%. Charge-offs were in line with historical trends at 0.07%.
Transportation Market Update. While carriers did get some relief early in the quarter, we found that the July 4 holiday was similar to previous holiday impacts where prices recovered then retreated. Invoice prices declined throughout the remainder of the quarter, hitting a low of $1,698. September was the lowest we have seen since July 2020. While lower invoice prices are usually not good for carriers (and certainly not for factors), our carriers did see some mild relief as spot rates were relatively stable and fuel prices fell from $3.87 to $3.53 from early July to late September. It is worth noting our transaction counts through this same period have held up well, as overall volumes have not seen a corresponding level of stress. Over the same 12-month period ending in Q3 2024 represented in the chart on the following page where, net of additions, client counts in our small trucker group decreased by 1,372, our number of invoices purchased increased 3.7%.
We continue to see carriers exit the market, albeit at a slower pace than required for prices to trend upwards. Our own factoring data is a good proxy for the industry. You can see the trend clearly in the chart on the following page, which details O/O client increase/decrease at Triumph Factoring. The interesting thing is that while many of these carriers may have abandoned their O/O business (and thus left Triumph Factoring), we do not believe they have left the industry. Many of these O/O have migrated and “leased on” to work for larger carriers, who generally have more stable clients and volume. We know the trend will reverse over time, and the market will become more balanced. Until that time (and even after that time comes), we intend to just keep doing the next right thing.
Diesel prices were down for ten consecutive weeks during the quarter and reached a low that we have not seen since October 2021. As mentioned previously, diesel prices fell from $3.87 to $3.53 during the quarter. The $0.34 differential saves the carrier $51.00 on an average load without discounts. If a carrier is using our fuel program, they would have saved an additional $75.00 ($0.50 per gallon in Q3) on each 150 gallon in-network refuel. As a result, the lower invoice prices had a less negative impact on the carrier than the factor. In the short run, that is good for our clients, but not so good for us. However, we know that what is good for our clients will be good for us over the long run. Despite lower fuel costs, this revenue per mile is not enough to allow many smaller carriers to operate profitably. Last quarter, we published a chart from Raymond James demonstrating the issue. The updated chart below is materially unchanged.
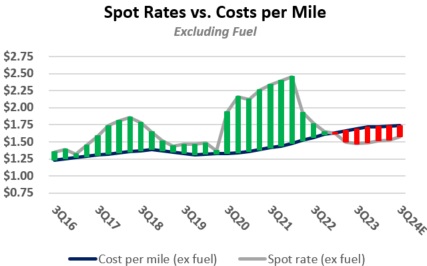
Source: American Transportation Research Institute, DAT Trendlines, Internet Truckstop, U.S. Energy Information Administration, Raymond James Estimates
Technology, FaaS and TriumphPay. The further we go on the journey, bringing unique technology to our factoring and payment offerings, the more common touch points there are for our services. To assist investors in better understanding our offerings, let me offer a few bullet points.
•Triumph’s technology investment for its own factoring business. We continue to make enhancements to our operating platform to make us faster and more efficient. One such enhancement is “Instant Decision.” Instant Decision was designed to offer our clients a frictionless experience. Funding a client has improved from an average of three hours to receive, review and purchase an invoice down to a minute or less on loads eligible for Instant Decision. This significantly increases operational efficiency and creates a positive experience for our client.
Since our update last quarter, our Instant Decision tool has scaled up to 50% of our small carrier segment, and we continue to broaden its application. Invoices purchased by our Instant Decision tool compared to our previous workflow are being disputed 38.6% less, reduce chargebacks by 84.5% and short payments by 74.7%[6.7]
We are already experiencing significant savings in the portfolio where this is being deployed. More important than the immediate cost savings, we believe this innovation will provide our customers faster access to funding, allowing them to more quickly move on to their next load without worrying about working capital, which makes them stickier. Happy (and sticky) customers create long-term value for shareholders.
When using Instant Decision with LoadPay, the value proposition becomes very tangible. I would like to provide the specifics of just one of these experiences to give investors a real-world example. Ally Recovery and Transport LLC, a Triumph factoring client, has been part of a beta group of carriers testing LoadPay as a funding destination for factored invoices. Ally moved a load on Saturday, October 12 with a drop time of 7:00 am. After being unloaded and obtaining the receiver’s signature, they submitted their load documents and invoice to Triumph, which then immediately passed through our Instant Decision model. This invoice was approved by the model without any human intervention in 9 seconds and was fully purchased and funded into their LoadPay wallet in 21 seconds. This means the carrier had money in their account from a completed load in under 30 seconds after submitting the invoice. Not only did this occur on a Saturday, but it occurred on a Saturday that preceded a bank holiday on Monday (Columbus Day). Without LoadPay, Ally would not have received their funds until Tuesday morning, a difference of three full days that could be used to generate more revenue with another load or return home to their family. The level of technological investment, industry knowledge and payments integration required to make this benefit real for carriers is something unmatched in the industry.
•Triumph’s technology investment for FaaS. Anything Triumph does for itself, it will do for its FaaS clients, and they will share in those technology benefits. This includes Instant Decision and factoring’s integration with LoadPay and the TriumphPay network as we work towards broad application of 24x7x365 funding. We have been investing in our proprietary operating system (Delta) to support white-labeling for our FaaS initiatives. Other enhancements have focused on resiliency, operational efficiency, and scalability.
•TriumphPay’s technology investment for the factoring industry. I have written about this at length in the past. Anything TriumphPay does for Triumph, it also does for any network factor (whether they are a FaaS customer or not). Let me give you a specific example from our own factoring company. When we examine in-network invoices from TriumphPay in our factoring operations, we find they turn on average every 30.1 days[8]. We arrive at this number as an average of 30.1 days to pay for invoices without exception and 32.8 days for invoices with an exception. Without TriumphPay, the invoices with exception would be 45 days plus. This delay is normal and exists because the factor is not aware of the exception until the payment date (usually 30 days) has passed. This has been a problem for as long I can remember. TriumphPay’s integration to the broker allows any network factor to identify invoices with exceptions weeks earlier, so factors can work to clear exceptions much sooner. This improves days sales outstanding (“DSO”). For each day we improve DSO, we realize about $1 million in savings annually at scale. That number will only go up as density grows. This is a benefit that any network factor can obtain.
Banking
For discussion of our Banking segment, we will cover the following topics:
1.Analysis of financial and operational performance for the quarter
2.Credit update
Analysis of financial and operational performance for the quarter. Banking segment operating income fell $1.2 million, or 4.0%, from the prior quarter due primarily to higher credit expense. Our core deposit base was up significantly on the quarter related to a planned influx of noninterest bearing servicing deposits sourced through the customers of our Mortgage Warehouse business. As a result, our cost of funds declined slightly by 5 basis points to 1.57%. We remain mildly asset sensitive. The Fed cut rates 50 bps in September, and as we look forward, our modeling suggests that each 25 bps rate cut would reduce our quarterly net interest income by $0.5 - 1.0 million.
Credit Update. While in line with recent quarters, credit expenses were elevated again this quarter, and we experienced some deterioration in our asset quality metrics. In prior quarters, I have mentioned our increases in the general reserve on our equipment portfolio as a catalyst for elevated credit costs this year. As expected, that did not continue this quarter. There are, I believe, four unique items this quarter, unrelated to systemic or market issues, which warrant specific mention.
•We downgraded two CRE loans totaling $42 million to substandard. Both loans experienced short term cash flow issues that were mitigated through guarantor support, remain well-secured and have not required any specific reserves.
•We reserved $2.4 million for a C&I client that filed for bankruptcy with specific and organized fraud. The fraud has created uncertainty regarding the value of our collateral and priority of our claims, so we have reserved the entire balance.
•We also downgraded a long-standing equipment finance client to nonaccrual due to issues in one of its ancillary businesses. The client’s core trucking business, which is our primary borrower, remains healthy and viable, but the ancillary businesses will require additional cash to resolve those issues. We believe we are adequately collateralized, and we maintain dominion of cash through our factoring relationship. Nonetheless, the current stress on cash flows warranted a downgrade to nonaccrual, which was the primary driver of the NPA ratio degradation this quarter. We have $32 million in equipment finance loans and a well-secured letter of credit associated with this downgrade.
•One loan in our liquid credit portfolio required a specific reserve of $1.3 million. This portfolio, now just under $60 million of exposure, is less than half the size it was a year ago.
Closing Thoughts on Guidance, Expenses and Capital Management
We don’t give forward guidance. We do give investors near-term guidance on expenses, because that is something we largely control. We expect expenses for Q4 to be below $97 million once again. One caveat I will add to that – it is possible we will negotiate an exit with some of the tenants in our recently acquired headquarters building to accommodate our future occupancy needs. That could show up as a one-time item next quarter.
The other general piece of guidance I will give relates to Q1 2025. The freight market is soft right now. Catastrophic weather events and geopolitics will add volatility, but they alone will not be a permanent fix for the supply/demand imbalance in the market. I expect seasonality to make it softer in Q1. As a reminder, we typically see a reduction in factoring volumes in the first quarter of somewhere between 4% and 6%. At the same time, we will fight expense pressures that come up in Q1 every year tied to compensation resets, health insurance premium changes, etc. In other words, I do not expect Q1 2025 earnings to be great. We have options to make them better, but each of those would involve taking undue risk or pulling back on the investments we need to make in order to create the network we want to build. We will not do that. We will stick to the long-term plan. I know some investors with shorter investment horizons might not like that – my job is not to make it easy to like what I say, my job is to make sure you never have reason to doubt what I say.
No one at Triumph enjoys our current ROA profile nor will we enjoy a rough start to next year, which we believe is likely. But we can separate the temporary discomfort from our long-term optimism. A difficult quarter or even a difficult year is not going to sway us. One reason I can say that is because of how we have stewarded our capital during the good times. I’d like to use some farmer’s math on this topic to conclude this letter:
•Since we acquired the bank in November 2010, we have raised ~$467 million from investors (privately and publicly).
•During that same time, we have issued ~$84 million of stock-based compensation.
•During that same time, we have earned net income to common shareholders (i.e., after tax) of ~$543 million.
There are two things we do not do that most banks do. We do not seek to grow assets, and we do not pay dividends on our common stock. On the asset side of the equation, my goal is for Triumph’s market capitalization (~$1.9 billion) to eventually exceed its total assets (~$5.9 billion). To do that will require growing our stock price or shrinking our asset base, or both. We believe the growth opportunity for us is in the type of revenue that is not generated by the left-hand side of our balance sheet.
Since we do not pay a dividend, it is a fair question to ask what we have done with the $543 million of net income over the last 14 years. It would be impossible to detail it all here, but I can account for ~90% of it as follows:
•We hold $260 million of excess capital relative to our CET1 target. That is equivalent to $11 per share. We hold that capital to weather hard times like these and to be opportunistic when others are not able to weather the same environment.
•We have used $245 million to repurchase 18.5% of the company at a blended price of $46.35 per share.
Our journey as a company has not been linear or predictable, but I do believe we have created value for our long-term shareholders. We are grateful to have that job, and we will continue to do it to the best of our ability.
With warm regards,
Aaron P. Graft Founder, Vice Chairman & CEO [1] Average invoice sizes in our payments segment are generally smaller than average invoice sizes in our factoring segment as a transportation factor generally will only factor long-haul trucking invoices.
Less than truckload ("LTL") and parcel typically are not regularly serviced by the transportation factoring industry due to their small ticket size. Our payments business pays all transportation invoices of a freight broker and as such includes some LTL, parcel and shorter hauls that a transportation factor normally will not service.
[2] Recurring cohort revenue is defined as quickpay revenue and fee revenue attributable to clients onboarded in the annual cohorts shown. It does not include nonrecurring fees or gains, float revenue, or other supply chain finance income aside from quickpays.
[3] This reference to brokered freight is specific to domestic truckload (“TL”) freight only. Thus, this calculation would exclude less than truckload ("LTL"), parcel, etc. It would also exclude shipper volumes. Admittedly, this is a difficult percentage to calculate with precision, and it will move from year to year. That being said, we can evaluate the number of payments received in our factoring segment as a proxy for the percentage of TL freight TriumphPay is touching and also use industry data points to make informed assumptions. In the end, this goal is not intended to be a precise measurement in the same way as we would measure earnings. It is a directional and blunt measurement of the reach of the Payments network.
[4] We define network engagement as the amount of freight touched through our payments, audit or full AP automation products. It is an indicator of our broker volume density in the market, the source for growing available network transactions, and a key value driver for factors on the network.
[5] Float revenue in TriumphPay is generated on the net remaining float after funding balance sheet exposure in the payments segment. Float balances in TriumphPay at 9/30/2024 were $357 million. Net float balances were $187 million.
[6] Chargeback refers to the factor's ability to look back to a client for an invoice purchased when it is clear that the invoice is uncollectible for a variety of reasons including holds or disputes, bad or missing paperwork, fraud, etc.
[7] Short payments refer to a situation where a broker or a shipper only pays a portion of the invoice, for a a variety of reasons, rather than the full face amount of the invoice.
[8] Triumph factoring's portfolio of accounts receivable turns every 36.5 days. This is a little higher than the industry average of 35 days, given our disproportionate number of shipper account debtors compared with most factors due to our ability to service larger fleets. “In-network” invoices refer to invoices where the factor and broker are both participating in the TriumphPay network allowing the benefits of the automation and efficiency in the network to be realized.
Conference Call Information
Aaron P. Graft, Vice Chairman and CEO, and Brad Voss, CFO, will review the financial results in a conference call with investors and analysts beginning at 9:30 a.m. central time on Thursday, October 17, 2024.
The live video conference option may be accessed directly through this link, https://triumph-financial-inc-earnings-q3fy24.open-exchange.net/ or via the Company's website at tfin.com through the News & Events, Events & Presentations links. Alternatively, a live conference call option is available by dialing 1-833-928-4610 (International: +1-800-456-1369) requesting to be joined to meeting ID 984 7640 9638 at the prompt. An archive of this conference call will subsequently be available at this same location, referenced above, on the Company’s website.
About Triumph Financial
Triumph Financial, Inc. (Nasdaq: TFIN) is a financial holding company focused on payments, factoring and banking. Headquartered in Dallas, Texas, its diversified portfolio of brands includes TriumphPay, Triumph and TBK Bank. www.tfin.com
Forward-Looking Statements
This letter to shareholders contains forward-looking statements. Any statements about our expectations, beliefs, plans, predictions, forecasts, objectives, assumptions or future events or performance are not historical facts and may be forward-looking. You can identify forward-looking statements by the use of forward-looking terminology such as “believes,” “expects,” “could,” “may,” “will,” “should,” “seeks,” “likely,” “intends,” “plans,” “pro forma,” “projects,” “estimates” or “anticipates” or the negative of these words and phrases or similar words or phrases that are predictions of or indicate future events or trends and that do not relate solely to historical matters. You can also identify forward-looking statements by discussions of strategy, plans or intentions. Forward-looking statements involve numerous risks and uncertainties and you should not rely on them as predictions of future events. Forward-looking statements depend on assumptions, data or methods that may be incorrect or imprecise and we may not be able to realize them. We do not guarantee that the transactions and events described will happen as described (or that they will happen at all). The following factors, among others, could cause actual results and future events to differ materially from those set forth or contemplated in the forward-looking statements: business and economic conditions generally and in the bank and non-bank financial services industries, nationally and within our local market areas; our ability to mitigate our risk exposures; our ability to maintain our historical earnings trends; changes in management personnel; interest rate risk; concentration of our products and services in the transportation industry; credit risk associated with our loan portfolio; lack of seasoning in our loan portfolio; deteriorating asset quality and higher loan charge-offs; time and effort necessary to resolve nonperforming assets; inaccuracy of the assumptions and estimates we make in establishing reserves for probable loan losses and other estimates; risks related to the integration of acquired businesses and any future acquisitions; our ability to successfully identify and address the risks associated with our possible future acquisitions, and the risks that our prior and possible future acquisitions make it more difficult for investors to evaluate our business, financial condition and results of operations, and impairs our ability to accurately forecast our future performance; lack of liquidity; fluctuations in the fair value and liquidity of the securities we hold for sale; impairment of investment securities, goodwill, other intangible assets or deferred tax assets; our risk management strategies; environmental liability associated with our lending activities; increased competition in the bank and non-bank financial services industries, nationally, regionally or locally, which may adversely affect pricing and terms; the accuracy of our financial statements and related disclosures; material weaknesses in our internal control over financial reporting; system failures or failures to prevent breaches of our network security; the institution and outcome of litigation and other legal proceedings against us or to which we become subject; changes in carry-forwards of net operating losses; changes in federal tax law or policy; the impact of recent and future legislative and regulatory changes, including changes in banking, securities and tax laws and regulations, such as the Dodd-Frank Act and their application by our regulators; governmental monetary and fiscal policies; changes in the scope and cost of FDIC, insurance and other coverages; failure to receive regulatory approval for future acquisitions and increases in our capital requirements.
While forward-looking statements reflect our good-faith beliefs, they are not guarantees of future performance. All forward-looking statements are necessarily only estimates of future results. Accordingly, actual results may differ materially from those expressed in or contemplated by the particular forward-looking statement, and, therefore, you are cautioned not to place undue reliance on such statements. Further, any forward-looking statement speaks only as of the date on which it is made, and we undertake no obligation to update any forward-looking statement to reflect events or circumstances after the date on which the statement is made or to reflect the occurrence of unanticipated events or circumstances, except as required by applicable law. For a discussion of such risks and uncertainties, which could cause actual results to differ from those contained in the forward-looking statements, see "Risk Factors" and the forward-looking statement disclosure contained in Triumph Financial’s Annual Report on Form 10-K, filed with the Securities and Exchange Commission on February 13, 2024.
Non-GAAP Financial Measures
This letter to shareholders includes certain non‐GAAP financial measures intended to supplement, not substitute for, comparable GAAP measures. Reconciliations of non‐GAAP financial measures to GAAP financial measures are provided at the end of this letter to shareholders.
The following table sets forth key metrics used by Triumph Financial to monitor our operations. Footnotes in this table can be found in our definitions of non-GAAP financial measures at the end of this document.
|
|
|
|
|
|
|
|
|
|
|
|
|
|
|
|
|
|
|
|
|
|
|
|
|
|
|
|
|
|
|
|
|
|
|
|
|
|
|
|
|
|
|
As of and for the Three Months Ended |
|
As of and for the Nine Months Ended |
| (Dollars in thousands) |
September 30,
2024 |
|
June 30,
2024 |
|
March 31,
2024 |
|
December 31,
2023 |
|
September 30,
2023 |
|
September 30,
2024 |
|
September 30,
2023 |
| Financial Highlights: |
|
|
|
|
|
|
|
|
|
|
|
|
|
| Total assets |
$ |
5,866,046 |
|
|
$ |
5,783,334 |
|
|
$ |
5,575,493 |
|
|
$ |
5,347,334 |
|
|
$ |
5,599,794 |
|
|
$ |
5,866,046 |
|
|
$ |
5,599,794 |
|
| Loans held for investment |
$ |
4,332,967 |
|
|
$ |
4,288,417 |
|
|
$ |
4,195,120 |
|
|
$ |
4,163,100 |
|
|
$ |
4,371,528 |
|
|
$ |
4,332,967 |
|
|
$ |
4,371,528 |
|
| Deposits |
$ |
4,706,694 |
|
|
$ |
4,392,018 |
|
|
$ |
4,450,963 |
|
|
$ |
3,977,478 |
|
|
$ |
4,487,051 |
|
|
$ |
4,706,694 |
|
|
$ |
4,487,051 |
|
| Net income available to common stockholders |
$ |
4,546 |
|
|
$ |
1,945 |
|
|
$ |
3,357 |
|
|
$ |
8,825 |
|
|
$ |
11,993 |
|
|
$ |
9,848 |
|
|
$ |
29,050 |
|
|
|
|
|
|
|
|
|
|
|
|
|
|
|
| Performance Ratios - Annualized: |
|
|
|
|
|
|
|
|
|
|
|
|
|
| Return on average assets |
0.36 |
% |
|
0.19 |
% |
|
0.31 |
% |
|
0.70 |
% |
|
0.93 |
% |
|
0.29 |
% |
|
0.78 |
% |
| Return on average total equity |
2.39 |
% |
|
1.26 |
% |
|
1.90 |
% |
|
4.40 |
% |
|
5.95 |
% |
|
1.85 |
% |
|
4.94 |
% |
| Return on average common equity |
2.14 |
% |
|
0.94 |
% |
|
1.62 |
% |
|
4.25 |
% |
|
5.89 |
% |
|
1.57 |
% |
|
4.82 |
% |
Return on average tangible common equity (1) |
3.07 |
% |
|
1.35 |
% |
|
2.33 |
% |
|
6.20 |
% |
|
8.70 |
% |
|
2.26 |
% |
|
7.16 |
% |
Yield on loans(2) |
8.85 |
% |
|
9.10 |
% |
|
9.09 |
% |
|
9.29 |
% |
|
9.16 |
% |
|
9.01 |
% |
|
9.17 |
% |
| Cost of interest bearing deposits |
2.20 |
% |
|
2.34 |
% |
|
1.99 |
% |
|
1.84 |
% |
|
1.83 |
% |
|
2.18 |
% |
|
1.21 |
% |
| Cost of total deposits |
1.23 |
% |
|
1.39 |
% |
|
1.17 |
% |
|
1.11 |
% |
|
1.15 |
% |
|
1.26 |
% |
|
0.73 |
% |
| Cost of total funds |
1.57 |
% |
|
1.62 |
% |
|
1.45 |
% |
|
1.47 |
% |
|
1.41 |
% |
|
1.55 |
% |
|
1.12 |
% |
Net interest margin(2) |
6.81 |
% |
|
7.07 |
% |
|
7.29 |
% |
|
7.55 |
% |
|
7.48 |
% |
|
7.05 |
% |
|
7.70 |
% |
| Net noninterest expense to average assets |
5.29 |
% |
|
5.67 |
% |
|
5.62 |
% |
|
5.29 |
% |
|
5.28 |
% |
|
5.52 |
% |
|
5.68 |
% |
|
|
|
|
|
|
|
|
|
|
|
|
|
|
| Efficiency ratio |
90.06 |
% |
|
92.64 |
% |
|
89.45 |
% |
|
82.24 |
% |
|
82.36 |
% |
|
90.73 |
% |
|
85.21 |
% |
|
|
|
|
|
|
|
|
|
|
|
|
|
|
|
|
|
|
|
|
|
|
|
|
|
|
|
|
Asset Quality:(3) |
|
|
|
|
|
|
|
|
|
|
|
|
|
| Past due to total loans |
2.62 |
% |
|
2.21 |
% |
|
1.90 |
% |
|
2.00 |
% |
|
1.94 |
% |
|
2.62 |
% |
|
1.94 |
% |
| Non-performing loans to total loans |
2.62 |
% |
|
1.94 |
% |
|
1.98 |
% |
|
1.65 |
% |
|
1.22 |
% |
|
2.62 |
% |
|
1.22 |
% |
| Non-performing assets to total assets |
2.07 |
% |
|
1.60 |
% |
|
1.61 |
% |
|
1.42 |
% |
|
1.07 |
% |
|
2.07 |
% |
|
1.07 |
% |
| ACL to non-performing loans |
36.28 |
% |
|
47.48 |
% |
|
45.93 |
% |
|
51.15 |
% |
|
65.33 |
% |
|
36.28 |
% |
|
65.33 |
% |
| ACL to total loans |
0.95 |
% |
|
0.92 |
% |
|
0.91 |
% |
|
0.85 |
% |
|
0.80 |
% |
|
0.95 |
% |
|
0.80 |
% |
| Net charge-offs to average loans |
0.08 |
% |
|
0.06 |
% |
|
0.05 |
% |
|
0.13 |
% |
|
0.03 |
% |
|
0.20 |
% |
|
0.34 |
% |
|
|
|
|
|
|
|
|
|
|
|
|
|
|
| Capital: |
|
|
|
|
|
|
|
|
|
|
|
|
|
Tier 1 capital to average assets(4) |
12.21 |
% |
|
12.38 |
% |
|
12.99 |
% |
|
12.64 |
% |
|
12.36 |
% |
|
12.21 |
% |
|
12.36 |
% |
Tier 1 capital to risk-weighted assets(4) |
13.57 |
% |
|
13.45 |
% |
|
13.62 |
% |
|
13.74 |
% |
|
12.90 |
% |
|
13.57 |
% |
|
12.90 |
% |
Common equity tier 1 capital to risk-weighted assets(4) |
11.85 |
% |
|
11.71 |
% |
|
11.85 |
% |
|
11.94 |
% |
|
11.18 |
% |
|
11.85 |
% |
|
11.18 |
% |
| Total capital to risk-weighted assets |
16.62 |
% |
|
16.51 |
% |
|
16.69 |
% |
|
16.75 |
% |
|
15.77 |
% |
|
16.62 |
% |
|
15.77 |
% |
| Total equity to total assets |
15.10 |
% |
|
15.12 |
% |
|
15.65 |
% |
|
16.17 |
% |
|
15.19 |
% |
|
15.10 |
% |
|
15.19 |
% |
Tangible common stockholders' equity to tangible assets(1) |
10.50 |
% |
|
10.39 |
% |
|
10.71 |
% |
|
11.04 |
% |
|
10.21 |
% |
|
10.50 |
% |
|
10.21 |
% |
|
|
|
|
|
|
|
|
|
|
|
|
|
|
| Per Share Amounts: |
|
|
|
|
|
|
|
|
|
|
|
|
|
| Book value per share |
$ |
35.95 |
|
|
$ |
35.51 |
|
|
$ |
35.45 |
|
|
$ |
35.16 |
|
|
$ |
34.58 |
|
|
$ |
35.95 |
|
|
$ |
34.58 |
|
Tangible book value per share (1) |
$ |
25.22 |
|
|
$ |
24.60 |
|
|
$ |
24.42 |
|
|
$ |
24.12 |
|
|
$ |
23.41 |
|
|
$ |
25.22 |
|
|
$ |
23.41 |
|
| Basic earnings per common share |
$ |
0.19 |
|
|
$ |
0.08 |
|
|
$ |
0.14 |
|
|
$ |
0.38 |
|
|
$ |
0.52 |
|
|
$ |
0.42 |
|
|
$ |
1.25 |
|
| Diluted earnings per common share |
$ |
0.19 |
|
|
$ |
0.08 |
|
|
$ |
0.14 |
|
|
$ |
0.37 |
|
|
$ |
0.51 |
|
|
$ |
0.42 |
|
|
$ |
1.23 |
|
|
|
|
|
|
|
|
|
|
|
|
|
|
|
| Shares outstanding end of period |
23,387,522 |
|
|
23,353,519 |
|
|
23,334,997 |
|
|
23,302,414 |
|
|
23,291,693 |
|
|
23,387,522 |
|
|
23,291,693 |
|
Unaudited consolidated balance sheet as of:
|
|
|
|
|
|
|
|
|
|
|
|
|
|
|
|
|
|
|
|
|
|
|
|
|
|
|
|
|
|
| (Dollars in thousands) |
September 30,
2024 |
|
June 30,
2024 |
|
March 31,
2024 |
|
December 31,
2023 |
|
September 30,
2023 |
| ASSETS |
|
|
|
|
|
|
|
|
|
| Total cash and cash equivalents |
$ |
489,280 |
|
|
$ |
500,663 |
|
|
$ |
417,033 |
|
|
$ |
286,635 |
|
|
$ |
337,583 |
|
| Securities - available for sale |
403,186 |
|
|
339,661 |
|
|
320,101 |
|
|
299,644 |
|
|
292,324 |
|
| Securities - held to maturity, net |
2,121 |
|
|
2,787 |
|
|
3,010 |
|
|
2,977 |
|
|
3,311 |
|
| Equity securities with readily determinable fair value |
4,583 |
|
|
4,422 |
|
|
4,441 |
|
|
4,488 |
|
|
4,289 |
|
| Loans held for sale |
26 |
|
|
1,051 |
|
|
3,712 |
|
|
1,236 |
|
|
6,416 |
|
| Loans held for investment |
4,332,967 |
|
|
4,288,417 |
|
|
4,195,120 |
|
|
4,163,100 |
|
|
4,371,528 |
|
| Allowance for credit losses |
(41,243) |
|
|
(39,591) |
|
|
(38,232) |
|
|
(35,219) |
|
|
(34,815) |
|
| Loans, net |
4,291,724 |
|
|
4,248,826 |
|
|
4,156,888 |
|
|
4,127,881 |
|
|
4,336,713 |
|
| FHLB and other restricted stock |
7,112 |
|
|
14,040 |
|
|
4,764 |
|
|
14,278 |
|
|
10,101 |
|
| Premises and equipment, net |
156,462 |
|
|
159,588 |
|
|
162,544 |
|
|
113,457 |
|
|
113,062 |
|
| Capitalized software, net |
34,481 |
|
|
30,582 |
|
|
26,435 |
|
|
22,365 |
|
|
19,451 |
|
| Goodwill |
233,709 |
|
|
233,709 |
|
|
233,709 |
|
|
233,709 |
|
|
233,709 |
|
| Intangible assets, net |
17,316 |
|
|
20,943 |
|
|
23,842 |
|
|
23,646 |
|
|
26,400 |
|
| Bank-owned life insurance |
42,381 |
|
|
42,225 |
|
|
42,077 |
|
|
41,946 |
|
|
41,822 |
|
| Deferred tax asset, net |
10,667 |
|
|
6,641 |
|
|
7,946 |
|
|
8,800 |
|
|
9,594 |
|
| Other assets |
172,998 |
|
|
178,196 |
|
|
168,991 |
|
|
166,272 |
|
|
165,019 |
|
| Total assets |
$ |
5,866,046 |
|
|
$ |
5,783,334 |
|
|
$ |
5,575,493 |
|
|
$ |
5,347,334 |
|
|
$ |
5,599,794 |
|
| LIABILITIES |
|
|
|
|
|
|
|
|
|
| Noninterest bearing deposits |
$ |
2,103,092 |
|
|
$ |
1,689,531 |
|
|
$ |
1,747,544 |
|
|
$ |
1,632,022 |
|
|
$ |
1,632,559 |
|
| Interest bearing deposits |
2,603,602 |
|
|
2,702,487 |
|
|
2,703,419 |
|
|
2,345,456 |
|
|
2,854,492 |
|
| Total deposits |
4,706,694 |
|
|
4,392,018 |
|
|
4,450,963 |
|
|
3,977,478 |
|
|
4,487,051 |
|
|
|
|
|
|
|
|
|
|
|
| Federal Home Loan Bank advances |
30,000 |
|
|
280,000 |
|
|
30,000 |
|
|
255,000 |
|
|
30,000 |
|
| Subordinated notes |
109,072 |
|
|
108,939 |
|
|
108,807 |
|
|
108,678 |
|
|
108,454 |
|
| Junior subordinated debentures |
42,196 |
|
|
42,042 |
|
|
41,889 |
|
|
41,740 |
|
|
41,592 |
|
| Other liabilities |
92,320 |
|
|
86,086 |
|
|
71,495 |
|
|
100,038 |
|
|
82,315 |
|
| Total liabilities |
4,980,282 |
|
|
4,909,085 |
|
|
4,703,154 |
|
|
4,482,934 |
|
|
4,749,412 |
|
| EQUITY |
|
|
|
|
|
|
|
|
|
| Preferred Stock |
45,000 |
|
|
45,000 |
|
|
45,000 |
|
|
45,000 |
|
|
45,000 |
|
| Common stock |
291 |
|
|
291 |
|
|
290 |
|
|
290 |
|
|
290 |
|
| Additional paid-in-capital |
564,464 |
|
|
559,072 |
|
|
555,613 |
|
|
550,743 |
|
|
547,212 |
|
| Treasury stock, at cost |
(268,352) |
|
|
(268,352) |
|
|
(265,119) |
|
|
(265,038) |
|
|
(265,016) |
|
| Retained earnings |
546,179 |
|
|
541,633 |
|
|
539,688 |
|
|
536,331 |
|
|
527,506 |
|
| Accumulated other comprehensive income (loss) |
(1,818) |
|
|
(3,395) |
|
|
(3,133) |
|
|
(2,926) |
|
|
(4,610) |
|
| Total stockholders' equity |
885,764 |
|
|
874,249 |
|
|
872,339 |
|
|
864,400 |
|
|
850,382 |
|
| Total liabilities and equity |
$ |
5,866,046 |
|
|
$ |
5,783,334 |
|
|
$ |
5,575,493 |
|
|
$ |
5,347,334 |
|
|
$ |
5,599,794 |
|
Unaudited consolidated statement of income:
|
|
|
|
|
|
|
|
|
|
|
|
|
|
|
|
|
|
|
|
|
|
|
|
|
|
|
|
|
|
|
|
|
|
|
|
|
|
|
|
|
|
|
For the Three Months Ended |
|
For the Nine Months Ended |
| (Dollars in thousands) |
September 30,
2024 |
|
June 30,
2024 |
|
March 31,
2024 |
|
December 31,
2023 |
|
September 30,
2023 |
|
September 30,
2024 |
|
September 30,
2023 |
| Interest income: |
|
|
|
|
|
|
|
|
|
|
|
|
|
| Loans, including fees |
$ |
52,886 |
|
|
$ |
54,900 |
|
|
$ |
53,552 |
|
|
$ |
58,963 |
|
|
$ |
59,669 |
|
|
$ |
161,338 |
|
|
$ |
169,465 |
|
| Factored receivables, including fees |
40,598 |
|
|
40,028 |
|
|
37,909 |
|
|
40,723 |
|
|
39,161 |
|
|
118,535 |
|
|
119,884 |
|
| Securities |
6,500 |
|
|
5,523 |
|
|
5,351 |
|
|
5,243 |
|
|
5,205 |
|
|
17,374 |
|
|
14,552 |
|
| FHLB and other restricted stock |
379 |
|
|
234 |
|
|
232 |
|
|
289 |
|
|
397 |
|
|
845 |
|
|
741 |
|
| Cash deposits |
7,712 |
|
|
6,330 |
|
|
4,903 |
|
|
3,510 |
|
|
3,101 |
|
|
18,945 |
|
|
9,051 |
|
| Total interest income |
108,075 |
|
|
107,015 |
|
|
101,947 |
|
|
108,728 |
|
|
107,533 |
|
|
317,037 |
|
|
313,693 |
|
| Interest expense: |
|
|
|
|
|
|
|
|
|
|
|
|
|
| Deposits |
14,041 |
|
|
15,520 |
|
|
12,152 |
|
|
11,765 |
|
|
12,474 |
|
|
41,713 |
|
|
22,553 |
|
| Subordinated notes |
1,227 |
|
|
1,225 |
|
|
1,224 |
|
|
1,317 |
|
|
1,315 |
|
|
3,676 |
|
|
3,936 |
|
| Junior subordinated debentures |
1,172 |
|
|
1,162 |
|
|
1,184 |
|
|
1,156 |
|
|
1,169 |
|
|
3,518 |
|
|
3,293 |
|
| Other borrowings |
2,936 |
|
|
1,193 |
|
|
1,352 |
|
|
2,571 |
|
|
1,248 |
|
|
5,481 |
|
|
7,751 |
|
| Total interest expense |
19,376 |
|
|
19,100 |
|
|
15,912 |
|
|
16,809 |
|
|
16,206 |
|
|
54,388 |
|
|
37,533 |
|
| Net interest income |
88,699 |
|
|
87,915 |
|
|
86,035 |
|
|
91,919 |
|
|
91,327 |
|
|
262,649 |
|
|
276,160 |
|
| Credit loss expense (benefit) |
4,263 |
|
|
4,155 |
|
|
5,896 |
|
|
6,135 |
|
|
812 |
|
|
14,314 |
|
|
6,068 |
|
| Net interest income after credit loss expense (benefit) |
84,436 |
|
|
83,760 |
|
|
80,139 |
|
|
85,784 |
|
|
90,515 |
|
|
248,335 |
|
|
270,092 |
|
| Noninterest income: |
|
|
|
|
|
|
|
|
|
|
|
|
|
| Service charges on deposits |
1,865 |
|
|
1,810 |
|
|
1,727 |
|
|
1,791 |
|
|
1,728 |
|
|
5,402 |
|
|
5,210 |
|
| Card income |
2,135 |
|
|
2,085 |
|
|
1,868 |
|
|
2,029 |
|
|
2,065 |
|
|
6,088 |
|
|
6,152 |
|
| Net gains (losses) on sale of securities |
— |
|
|
— |
|
|
— |
|
|
97 |
|
|
5 |
|
|
— |
|
|
5 |
|
| Net gains (losses) on sale of loans |
253 |
|
|
123 |
|
|
(192) |
|
|
(87) |
|
|
203 |
|
|
184 |
|
|
206 |
|
| Fee income |
9,129 |
|
|
8,517 |
|
|
8,683 |
|
|
8,525 |
|
|
8,108 |
|
|
26,329 |
|
|
21,720 |
|
| Insurance commissions |
1,472 |
|
|
1,505 |
|
|
1,568 |
|
|
1,058 |
|
|
1,074 |
|
|
4,545 |
|
|
3,970 |
|
| Other |
2,643 |
|
|
3,127 |
|
|
1,345 |
|
|
817 |
|
|
227 |
|
|
7,115 |
|
|
(1,320) |
|
| Total noninterest income |
17,497 |
|
|
17,167 |
|
|
14,999 |
|
|
14,230 |
|
|
13,410 |
|
|
49,663 |
|
|
35,943 |
|
| Noninterest expense: |
|
|
|
|
|
|
|
|
|
|
|
|
|
| Salaries and employee benefits |
55,447 |
|
|
56,005 |
|
|
54,185 |
|
|
50,818 |
|
|
50,884 |
|
|
165,637 |
|
|
159,789 |
|
| Occupancy, furniture and equipment |
8,701 |
|
|
8,565 |
|
|
7,636 |
|
|
7,348 |
|
|
7,542 |
|
|
24,902 |
|
|
21,537 |
|
| FDIC insurance and other regulatory assessments |
679 |
|
|
641 |
|
|
653 |
|
|
656 |
|
|
682 |
|
|
1,973 |
|
|
1,968 |
|
| Professional fees |
4,734 |
|
|
4,558 |
|
|
3,541 |
|
|
3,116 |
|
|
3,941 |
|
|
12,833 |
|
|
10,061 |
|
| Amortization of intangible assets |
3,600 |
|
|
2,869 |
|
|
2,724 |
|
|
2,754 |
|
|
2,849 |
|
|
9,193 |
|
|
8,700 |
|
| Advertising and promotion |
1,416 |
|
|
2,008 |
|
|
1,214 |
|
|
1,901 |
|
|
1,839 |
|
|
4,638 |
|
|
4,839 |
|
| Communications and technology |
12,422 |
|
|
14,307 |
|
|
11,894 |
|
|
11,645 |
|
|
10,784 |
|
|
38,623 |
|
|
34,034 |
|
| Software amortization |
1,484 |
|
|
1,357 |
|
|
1,174 |
|
|
1,398 |
|
|
1,024 |
|
|
4,015 |
|
|
3,054 |
|
| Other |
7,163 |
|
|
7,033 |
|
|
7,350 |
|
|
7,662 |
|
|
6,714 |
|
|
21,546 |
|
|
21,954 |
|
| Total noninterest expense |
95,646 |
|
|
97,343 |
|
|
90,371 |
|
|
87,298 |
|
|
86,259 |
|
|
283,360 |
|
|
265,936 |
|
| Net income before income tax |
6,287 |
|
|
3,584 |
|
|
4,767 |
|
|
12,716 |
|
|
17,666 |
|
|
14,638 |
|
|
40,099 |
|
| Income tax expense |
940 |
|
|
837 |
|
|
609 |
|
|
3,089 |
|
|
4,872 |
|
|
2,386 |
|
|
8,645 |
|
| Net income |
$ |
5,347 |
|
|
$ |
2,747 |
|
|
$ |
4,158 |
|
|
$ |
9,627 |
|
|
$ |
12,794 |
|
|
$ |
12,252 |
|
|
$ |
31,454 |
|
| Dividends on preferred stock |
(801) |
|
|
(802) |
|
|
(801) |
|
|
(802) |
|
|
(801) |
|
|
(2,404) |
|
|
(2,404) |
|
| Net income available to common stockholders |
$ |
4,546 |
|
|
$ |
1,945 |
|
|
$ |
3,357 |
|
|
$ |
8,825 |
|
|
$ |
11,993 |
|
|
$ |
9,848 |
|
|
$ |
29,050 |
|
Earnings per share:
|
|
|
|
|
|
|
|
|
|
|
|
|
|
|
|
|
|
|
|
|
|
|
|
|
|
|
|
|
|
|
|
|
|
|
|
|
|
|
|
|
|
|
For the Three Months Ended |
|
Nine Months Ended |
| (Dollars in thousands) |
September 30,
2024 |
|
June 30,
2024 |
|
March 31,
2024 |
|
December 31,
2023 |
|
September 30,
2023 |
|
September 30,
2024 |
|
September 30,
2023 |
| Basic |
|
|
|
|
|
|
|
|
|
|
|
|
|
| Net income to common stockholders |
$ |
4,546 |
|
|
$ |
1,945 |
|
|
$ |
3,357 |
|
|
$ |
8,825 |
|
|
$ |
11,993 |
|
|
$ |
9,848 |
|
|
$ |
29,050 |
|
| Weighted average common shares outstanding |
23,330,635 |
|
|
23,274,089 |
|
|
23,201,259 |
|
|
23,171,751 |
|
|
23,162,614 |
|
|
23,268,887 |
|
|
23,220,331 |
|
| Basic earnings per common share |
$ |
0.19 |
|
|
$ |
0.08 |
|
|
$ |
0.14 |
|
|
$ |
0.38 |
|
|
$ |
0.52 |
|
|
$ |
0.42 |
|
|
$ |
1.25 |
|
|
|
|
|
|
|
|
|
|
|
|
|
|
|
| Diluted |
|
|
|
|
|
|
|
|
|
|
|
|
|
| Net income to common stockholders - diluted |
$ |
4,546 |
|
|
$ |
1,945 |
|
|
$ |
3,357 |
|
|
$ |
8,825 |
|
|
$ |
11,993 |
|
|
$ |
9,848 |
|
|
$ |
29,050 |
|
| Weighted average common shares outstanding |
23,330,635 |
|
|
23,274,089 |
|
|
23,201,259 |
|
|
23,171,751 |
|
|
23,162,614 |
|
|
23,268,887 |
|
|
23,220,331 |
|
| Dilutive effects of: |
|
|
|
|
|
|
|
|
|
|
|
|
|
| Assumed exercises of stock options |
95,472 |
|
|
86,645 |
|
|
87,567 |
|
|
82,463 |
|
|
82,909 |
|
|
89,349 |
|
|
77,286 |
|
| Restricted stock awards |
40,259 |
|
|
60,614 |
|
|
102,417 |
|
|
90,912 |
|
|
80,841 |
|
|
67,805 |
|
|
101,842 |
|
| Restricted stock units |
130,331 |
|
|
118,919 |
|
|
137,321 |
|
|
107,933 |
|
|
84,137 |
|
|
129,047 |
|
|
86,844 |
|
| Performance stock units - market based |
128,157 |
|
|
121,907 |
|
|
119,777 |
|
|
83,821 |
|
|
47,248 |
|
|
117,101 |
|
|
85,218 |
|
| Employee stock purchase plan |
470 |
|
|
2,931 |
|
|
1,921 |
|
|
798 |
|
|
1,165 |
|
|
1,774 |
|
|
908 |
|
| Weighted average shares outstanding - diluted |
23,725,324 |
|
|
23,665,105 |
|
|
23,650,262 |
|
|
23,537,678 |
|
|
23,458,914 |
|
|
23,673,963 |
|
|
23,572,429 |
|
| Diluted earnings per common share |
$ |
0.19 |
|
|
$ |
0.08 |
|
|
$ |
0.14 |
|
|
$ |
0.37 |
|
|
$ |
0.51 |
|
|
$ |
0.42 |
|
|
$ |
1.23 |
|
Shares that were not considered in computing diluted earnings per common share because they were antidilutive or have not met the thresholds to be considered in the dilutive calculation are as follows:
|
|
|
|
|
|
|
|
|
|
|
|
|
|
|
|
|
|
|
|
|
|
|
|
|
|
|
|
|
|
|
|
|
|
|
|
|
|
|
|
|
|
|
For the Three Months Ended |
|
Nine Months Ended |
|
September 30,
2024 |
|
June 30,
2024 |
|
March 31,
2024 |
|
December 31,
2023 |
|
September 30,
2023 |
|
September 30,
2024 |
|
September 30,
2023 |
| Stock options |
64,315 |
|
|
77,520 |
|
|
45,764 |
|
|
100,818 |
|
|
101,138 |
|
|
43,389 |
|
|
104,114 |
|
| Restricted stock awards |
— |
|
|
— |
|
|
— |
|
|
— |
|
|
— |
|
|
— |
|
|
— |
|
| Restricted stock units |
7,500 |
|
|
7,500 |
|
|
7,500 |
|
|
7,500 |
|
|
11,250 |
|
|
7,818 |
|
|
11,250 |
|
| Performance stock units - market based |
— |
|
|
55,677 |
|
|
— |
|
|
12,020 |
|
|
14,424 |
|
|
24,798 |
|
|
14,424 |
|
| Employee stock purchase plan |
— |
|
|
— |
|
|
— |
|
|
— |
|
|
— |
|
|
— |
|
|
— |
|
|
|
|
|
|
|
|
|
|
|
|
|
|
|
Loans held for investment summarized as of:
|
|
|
|
|
|
|
|
|
|
|
|
|
|
|
|
|
|
|
|
|
|
|
|
|
|
|
|
|
|
| (Dollars in thousands) |
September 30,
2024 |
|
June 30,
2024 |
|
March 31,
2024 |
|
December 31,
2023 |
|
September 30,
2023 |
| Commercial real estate |
$ |
762,343 |
|
|
$ |
842,342 |
|
|
$ |
819,721 |
|
|
$ |
812,704 |
|
|
$ |
817,064 |
|
| Construction, land development, land |
217,148 |
|
|
216,531 |
|
|
222,859 |
|
|
136,720 |
|
|
131,862 |
|
| 1-4 family residential properties |
126,103 |
|
|
128,508 |
|
|
130,200 |
|
|
125,916 |
|
|
129,588 |
|
| Farmland |
57,621 |
|
|
58,495 |
|
|
58,431 |
|
|
63,568 |
|
|
62,698 |
|
| Commercial |
1,093,477 |
|
|
1,092,280 |
|
|
1,160,870 |
|
|
1,170,365 |
|
|
1,251,939 |
|
| Factored receivables |
1,201,495 |
|
|
1,207,480 |
|
|
1,154,047 |
|
|
1,116,654 |
|
|
1,213,702 |
|
| Consumer |
6,990 |
|
|
7,596 |
|
|
7,176 |
|
|
8,326 |
|
|
8,166 |
|
| Mortgage warehouse |
867,790 |
|
|
735,185 |
|
|
641,816 |
|
|
728,847 |
|
|
756,509 |
|
| Total loans |
$ |
4,332,967 |
|
|
$ |
4,288,417 |
|
|
$ |
4,195,120 |
|
|
$ |
4,163,100 |
|
|
$ |
4,371,528 |
|
Our banking loan portfolio consists of traditional community bank loans as well as commercial finance product lines focused on businesses that require specialized financial solutions and national lending product lines that further diversify our lending operations.
Banking loans held for investment are further summarized below:
|
|
|
|
|
|
|
|
|
|
|
|
|
|
|
|
|
|
|
|
|
|
|
|
|
|
|
|
|
|
| (Dollars in thousands) |
September 30,
2024 |
|
June 30,
2024 |
|
March 31,
2024 |
|
December 31,
2023 |
|
September 30,
2023 |
| Commercial real estate |
$ |
762,343 |
|
|
$ |
842,342 |
|
|
$ |
819,721 |
|
|
$ |
812,704 |
|
|
$ |
817,064 |
|
| Construction, land development, land |
217,148 |
|
|
216,531 |
|
|
222,859 |
|
|
136,720 |
|
|
131,862 |
|
| 1-4 family residential |
126,103 |
|
|
128,508 |
|
|
130,200 |
|
|
125,916 |
|
|
129,588 |
|
| Farmland |
57,621 |
|
|
58,495 |
|
|
58,431 |
|
|
63,568 |
|
|
62,698 |
|
| Commercial - General |
284,989 |
|
|
294,670 |
|
|
308,145 |
|
|
303,332 |
|
|
306,430 |
|
| Commercial - Agriculture |
52,997 |
|
|
50,604 |
|
|
46,986 |
|
|
47,059 |
|
|
49,479 |
|
| Commercial - Equipment |
488,326 |
|
|
468,661 |
|
|
440,458 |
|
|
460,008 |
|
|
486,110 |
|
| Commercial - Asset-based lending |
205,476 |
|
|
203,634 |
|
|
260,043 |
|
|
246,065 |
|
|
271,623 |
|
| Commercial - Liquid Credit |
59,539 |
|
|
74,711 |
|
|
105,238 |
|
|
113,901 |
|
|
138,297 |
|
| Consumer |
6,990 |
|
|
7,596 |
|
|
7,176 |
|
|
8,326 |
|
|
8,166 |
|
| Mortgage Warehouse |
867,790 |
|
|
735,185 |
|
|
641,816 |
|
|
728,847 |
|
|
756,509 |
|
| Total banking loans held for investment |
$ |
3,129,322 |
|
|
$ |
3,080,937 |
|
|
$ |
3,041,073 |
|
|
$ |
3,046,446 |
|
|
$ |
3,157,826 |
|
The following table presents the Company’s operating segments:
|
|
|
|
|
|
|
|
|
|
|
|
|
|
|
|
|
|
|
|
|
|
|
|
|
|
|
|
|
|
|
|
|
|
|
|
|
|
|
| (Dollars in thousands) |
|
|
|
|
|
|
|
Total |
|
Corporate |
|
|
| Three months ended September 30, 2024 |
|
Banking |
|
Factoring |
|
Payments |
|
Segments |
|
and Other(1) |
|
Consolidated |
| Total interest income |
|
$ |
67,390 |
|
|
$ |
34,905 |
|
|
$ |
5,693 |
|
|
$ |
107,988 |
|
|
$ |
87 |
|
|
$ |
108,075 |
|
| Intersegment interest allocations |
|
6,711 |
|
|
(9,280) |
|
|
2,569 |
|
|
— |
|
|
— |
|
|
— |
|
| Total interest expense |
|
16,976 |
|
|
— |
|
|
— |
|
|
16,976 |
|
|
2,400 |
|
|
19,376 |
|
| Net interest income (expense) |
|
57,125 |
|
|
25,625 |
|
|
8,262 |
|
|
91,012 |
|
|
(2,313) |
|
|
88,699 |
|
| Credit loss expense (benefit) |
|
3,719 |
|
|
328 |
|
|
(5) |
|
|
4,042 |
|
|
221 |
|
|
4,263 |
|
| Net interest income after credit loss expense |
|
53,406 |
|
|
25,297 |
|
|
8,267 |
|
|
86,970 |
|
|
(2,534) |
|
|
84,436 |
|
| Noninterest income |
|
7,538 |
|
|
2,170 |
|
|
6,322 |
|
|
16,030 |
|
|
1,467 |
|
|
17,497 |
|
| Noninterest expense |
|
32,009 |
|
|
19,969 |
|
|
16,598 |
|
|
68,576 |
|
|
27,070 |
|
|
95,646 |
|
Net intersegment noninterest income (expense)(2) |
|
139 |
|
|
465 |
|
|
(604) |
|
|
— |
|
|
— |
|
|
— |
|
| Operating income (loss) |
|
$ |
29,074 |
|
|
$ |
7,963 |
|
|
$ |
(2,613) |
|
|
$ |
34,424 |
|
|
$ |
(28,137) |
|
|
$ |
6,287 |
|
|
|
|
|
|
|
|
|
|
|
|
|
|
|
|
|
|
|
|
|
|
|
|
|
|
|
|
|
|
|
|
|
|
|
|
|
|
|
|
| (Dollars in thousands) |
|
|
|
|
|
|
|
Total |
|
Corporate |
|
|
| Three months ended June 30, 2024 |
|
Banking |
|
Factoring |
|
Payments |
|
Segments |
|
and Other(1) |
|
Consolidated |
| Total interest income |
|
$ |
66,900 |
|
|
$ |
34,307 |
|
|
$ |
5,721 |
|
|
$ |
106,928 |
|
|
$ |
87 |
|
|
$ |
107,015 |
|
| Intersegment interest allocations |
|
7,188 |
|
|
(9,198) |
|
|
2,010 |
|
|
— |
|
|
— |
|
|
— |
|
| Total interest expense |
|
16,713 |
|
|
— |
|
|
— |
|
|
16,713 |
|
|
2,387 |
|
|
19,100 |
|
| Net interest income (expense) |
|
57,375 |
|
|
25,109 |
|
|
7,731 |
|
|
90,215 |
|
|
(2,300) |
|
|
87,915 |
|
| Credit loss expense (benefit) |
|
1,961 |
|
|
2,176 |
|
|
(9) |
|
|
4,128 |
|
|
27 |
|
|
4,155 |
|
| Net interest income after credit loss expense |
|
55,414 |
|
|
22,933 |
|
|
7,740 |
|
|
86,087 |
|
|
(2,327) |
|
|
83,760 |
|
| Noninterest income |
|
7,599 |
|
|
2,016 |
|
|
5,867 |
|
|
15,482 |
|
|
1,685 |
|
|
17,167 |
|
| Noninterest expense |
|
32,865 |
|
|
20,695 |
|
|
17,070 |
|
|
70,630 |
|
|
26,713 |
|
|
97,343 |
|
Intersegment noninterest income (expense)(2) |
|
137 |
|
|
373 |
|
|
(510) |
|
|
— |
|
|
— |
|
|
— |
|
| Operating income (loss) |
|
$ |
30,285 |
|
|
$ |
4,627 |
|
|
$ |
(3,973) |
|
|
$ |
30,939 |
|
|
$ |
(27,355) |
|
|
$ |
3,584 |
|
(1) Includes revenue and expense from the Company’s holding company, which does not meet the definition of an operating segment. Also includes corporate shared service costs such as the majority of salaries and benefits expense for our executive leadership team, as well as other selling, general, and administrative shared services costs including human resources, accounting, finance, risk management and a significant amount of information technology expense.
(2) Intersegment noninterest income (expense) includes:
|
|
|
|
|
|
|
|
|
|
|
|
|
|
|
|
|
|
|
|
|
| (Dollars in thousands) |
|
Banking |
|
Factoring |
|
Payments |
| Three Months Ended September 30, 2024 |
|
|
|
|
|
|
| Factoring revenue received from Payments |
|
$ |
— |
|
|
$ |
864 |
|
|
$ |
(864) |
|
| Payments revenue received from Factoring |
|
— |
|
|
(289) |
|
|
289 |
|
| Banking revenue received from Payments and Factoring |
|
139 |
|
|
(110) |
|
|
(29) |
|
| Intersegment noninterest income (expense) |
|
$ |
139 |
|
|
$ |
465 |
|
|
$ |
(604) |
|
|
|
|
|
|
|
|
| Three Months Ended June 30, 2024 |
|
|
|
|
|
|
| Factoring revenue received from Payments |
|
$ |
— |
|
|
$ |
750 |
|
|
$ |
(750) |
|
| Payments revenue received from Factoring |
|
— |
|
|
(264) |
|
|
264 |
|
| Banking revenue received from Payments and Factoring |
|
137 |
|
|
(113) |
|
|
(24) |
|
| Intersegment noninterest income (expense) |
|
$ |
137 |
|
|
$ |
373 |
|
|
$ |
(510) |
|
Information pertaining to our factoring segment, summarized as of and for the quarters ended:
|
|
|
|
|
|
|
|
|
|
|
|
|
|
|
|
|
|
|
|
|
|
|
|
|
|
|
|
|
|
|
|
|
| Factoring |
|
September 30,
2024 |
|
June 30,
2024 |
|
March 31,
2024 |
|
December 31,
2023 |
|
September 30,
2023 |
| Factored receivable period end balance |
|
$ |
1,031,633,000 |
|
|
$ |
1,035,159,000 |
|
|
$ |
976,761,000 |
|
|
$ |
941,926,000 |
|
|
$ |
1,041,448,000 |
|
| Commercial loans period end balance |
|
$ |
2,150,000 |
|
|
$ |
— |
|
|
$ |
— |
|
|
$ |
— |
|
|
$ |
— |
|
| Yield on average receivable balance |
|
13.57 |
% |
|
14.14 |
% |
|
13.98 |
% |
|
13.71 |
% |
|
13.59 |
% |
| Current quarter charge-off rate |
|
0.07 |
% |
|
0.15 |
% |
|
0.13 |
% |
|
0.12 |
% |
|
0.12 |
% |
| Factored receivables - transportation concentration |
|
97 |
% |
|
97 |
% |
|
97 |
% |
|
96 |
% |
|
96 |
% |
|
|
|
|
|
|
|
|
|
|
|
| Interest income, including fees |
|
$ |
34,905,000 |
|
|
$ |
34,307,000 |
|
|
$ |
32,752,000 |
|
|
$ |
35,448,000 |
|
|
$ |
34,244,000 |
|
| Noninterest income |
|
2,170,000 |
|
|
2,016,000 |
|
|
2,903,000 |
|
|
2,725,000 |
|
|
2,546,000 |
|
| Intersegment noninterest income |
|
864,000 |
|
|
750,000 |
|
|
750,000 |
|
|
510,000 |
|
|
510,000 |
|
| Factored receivable total revenue |
|
37,939,000 |
|
|
37,073,000 |
|
|
36,405,000 |
|
|
38,683,000 |
|
|
37,300,000 |
|
| Average net funds employed |
|
915,257,000 |
|
|
873,355,000 |
|
|
839,136,000 |
|
|
927,996,000 |
|
|
898,989,000 |
|
| Yield on average net funds employed |
|
16.49 |
% |
|
17.07 |
% |
|
17.45 |
% |
|
16.54 |
% |
|
16.46 |
% |
|
|
|
|
|
|
|
|
|
|
|
| Accounts receivable purchased |
|
$ |
2,610,177,000 |
|
|
$ |
2,542,327,000 |
|
|
$ |
2,469,797,000 |
|
|
$ |
2,570,442,000 |
|
|
$ |
2,606,323,000 |
|
| Number of invoices purchased |
|
1,480,824 |
|
|
1,432,366 |
|
|
1,367,625 |
|
|
1,404,861 |
|
|
1,428,463 |
|
| Average invoice size |
|
$ |
1,763 |
|
|
$ |
1,775 |
|
|
$ |
1,806 |
|
|
$ |
1,830 |
|
|
$ |
1,825 |
|
| Average invoice size - transportation |
|
$ |
1,724 |
|
|
$ |
1,738 |
|
|
$ |
1,771 |
|
|
$ |
1,781 |
|
|
$ |
1,772 |
|
| Average invoice size - non-transportation |
|
$ |
4,940 |
|
|
$ |
4,561 |
|
|
$ |
4,099 |
|
|
$ |
5,858 |
|
|
$ |
5,631 |
|
Information pertaining to our Payments segment, summarized as of and for the quarters ended:
|
|
|
|
|
|
|
|
|
|
|
|
|
|
|
|
|
|
|
|
|
|
|
|
|
|
|
|
|
|
|
|
|
| Payments |
|
September 30,
2024 |
|
June 30,
2024 |
|
March 31,
2024 |
|
December 31,
2023 |
|
September 30,
2023 |
| Supply chain financing factored receivables |
|
$ |
101,336,000 |
|
|
$ |
95,163,000 |
|
|
$ |
98,593,000 |
|
|
$ |
100,829,000 |
|
|
$ |
87,590,000 |
|
| Quickpay and other factored receivables |
|
68,526,000 |
|
|
77,158,000 |
|
|
78,693,000 |
|
|
73,899,000 |
|
|
84,664,000 |
|
| Total factored receivable period end balance |
|
$ |
169,862,000 |
|
|
$ |
172,321,000 |
|
|
$ |
177,286,000 |
|
|
$ |
174,728,000 |
|
|
$ |
172,254,000 |
|
|
|
|
|
|
|
|
|
|
|
|
| Total revenue |
|
|
|
|
|
|
|
|
|
|
| Supply chain finance interest income |
|
$ |
2,897,000 |
|
|
$ |
2,649,000 |
|
|
$ |
2,553,000 |
|
|
$ |
2,476,000 |
|
|
$ |
2,316,000 |
|
| Quickpay interest income |
|
2,796,000 |
|
|
3,072,000 |
|
|
2,604,000 |
|
|
2,799,000 |
|
|
2,601,000 |
|
| Intersegment interest income allocation |
|
2,569,000 |
|
|
2,010,000 |
|
|
2,161,000 |
|
|
1,951,000 |
|
|
1,334,000 |
|
| Total interest income |
|
8,262,000 |
|
|
7,731,000 |
|
|
7,318,000 |
|
|
7,226,000 |
|
|
6,251,000 |
|
| Broker noninterest income |
|
4,804,000 |
|
|
4,392,000 |
|
|
4,115,000 |
|
|
3,880,000 |
|
|
3,372,000 |
|
| Factor noninterest income |
|
1,339,000 |
|
|
1,296,000 |
|
|
1,295,000 |
|
|
1,301,000 |
|
|
1,312,000 |
|
| Other noninterest income |
|
179,000 |
|
|
179,000 |
|
|
133,000 |
|
|
263,000 |
|
|
133,000 |
|
| Intersegment noninterest income |
|
289,000 |
|
|
264,000 |
|
|
265,000 |
|
|
267,000 |
|
|
268,000 |
|
| Total noninterest income |
|
6,611,000 |
|
|
6,131,000 |
|
|
5,808,000 |
|
|
5,711,000 |
|
|
5,085,000 |
|
|
|
$ |
14,873,000 |
|
|
$ |
13,862,000 |
|
|
$ |
13,126,000 |
|
|
$ |
12,937,000 |
|
|
$ |
11,336,000 |
|
|
|
|
|
|
|
|
|
|
|
|
| Total expense |
|
|
|
|
|
|
|
|
|
|
|
|
|
|
|
|
|
|
|
|
|
| Credit loss expense (benefit) |
|
$ |
(5,000) |
|
|
$ |
(9,000) |
|
|
$ |
69,000 |
|
|
$ |
5,000 |
|
|
$ |
14,000 |
|
| Noninterest expense |
|
16,598,000 |
|
|
17,070,000 |
|
|
16,485,000 |
|
|
14,783,000 |
|
|
14,556,000 |
|
| Intersegment noninterest expense |
|
893,000 |
|
|
774,000 |
|
|
775,000 |
|
|
510,000 |
|
|
510,000 |
|
|
|
$ |
17,486,000 |
|
|
$ |
17,835,000 |
|
|
$ |
17,329,000 |
|
|
$ |
15,298,000 |
|
|
$ |
15,080,000 |
|
|
|
|
|
|
|
|
|
|
|
|
| Pre-tax operating income (loss) |
|
$ |
(2,613,000) |
|
|
$ |
(3,973,000) |
|
|
$ |
(4,203,000) |
|
|
$ |
(2,361,000) |
|
|
$ |
(3,744,000) |
|
|
|
|
|
|
|
|
|
|
|
|
| Depreciation expense |
|
253,000 |
|
|
263,000 |
|
|
244,000 |
|
|
261,000 |
|
|
181,000 |
|
| Software amortization expense |
|
743,000 |
|
|
580,000 |
|
|
527,000 |
|
|
433,000 |
|
|
177,000 |
|
| Intangible amortization expense |
|
1,687,000 |
|
|
1,687,000 |
|
|
1,702,000 |
|
|
1,703,000 |
|
|
1,703,000 |
|
Earnings (losses) before interest, taxes, depreciation, and amortization(1) |
|
$ |
70,000 |
|
|
$ |
(1,443,000) |
|
|
$ |
(1,730,000) |
|
|
$ |
36,000 |
|
|
$ |
(1,683,000) |
|
|
|
|
|
|
|
|
|
|
|
|
|
|
|
|
|
|
|
|
|
|
|
|
|
|
|
|
|
|
|
|
|
|
| EBITDA Margin |
|
0.5 |
% |
|
(10) |
% |
|
(13) |
% |
|
— |
% |
|
(15) |
% |
|
|
|
|
|
|
|
|
|
|
|
| Number of invoices processed |
|
6,278,246 |
|
6,062,779 |
|
5,717,016 |
|
5,703,740 |
|
5,037,841 |
| Amount of payments processed |
|
$7,091,493,000 |
|
$6,687,587,000 |
|
$6,379,680,000 |
|
$6,217,323,000 |
|
$5,329,580,000 |
| Network invoice volume |
|
661,628 |
|
701,768 |
|
621,209 |
|
442,353 |
|
303,300 |
| Network payment volume |
|
$1,063,228,000 |
|
$1,133,118,000 |
|
$1,035,099,000 |
|
$740,048,000 |
|
$510,298,000 |
(1)Earnings (losses) before interest, taxes, depreciation, and amortization ("EBITDA") is a non-GAAP financial measure used as a supplemental measure to evaluate the performance of our Payments segment.
Deposits summarized as of:
|
|
|
|
|
|
|
|
|
|
|
|
|
|
|
|
|
|
|
|
|
|
|
|
|
|
|
|
|
|
| (Dollars in thousands) |
September 30,
2024 |
|
June 30,
2024 |
|
March 31,
2024 |
|
December 31,
2023 |
|
September 30,
2023 |
| Non-interest bearing demand |
$ |
2,103,092 |
|
|
$ |
1,689,531 |
|
|
$ |
1,747,544 |
|
|
$ |
1,632,022 |
|
|
$ |
1,632,559 |
|
| Interest bearing demand |
700,928 |
|
|
847,387 |
|
|
744,208 |
|
|
757,455 |
|
|
795,246 |
|
| Individual retirement accounts |
46,096 |
|
|
48,991 |
|
|
50,730 |
|
|
52,195 |
|
|
55,296 |
|
| Money market |
606,321 |
|
|
592,667 |
|
|
601,685 |
|
|
568,772 |
|
|
540,235 |
|
| Savings |
533,553 |
|
|
545,807 |
|
|
547,471 |
|
|
555,047 |
|
|
542,985 |
|
| Certificates of deposit |
242,093 |
|
|
252,641 |
|
|
261,614 |
|
|
265,525 |
|
|
269,416 |
|
| Brokered time deposits |
474,611 |
|
|
414,987 |
|
|
397,645 |
|
|
146,458 |
|
|
451,273 |
|
| Other brokered deposits |
— |
|
|
7 |
|
|
100,066 |
|
|
4 |
|
|
200,041 |
|
| Total deposits |
$ |
4,706,694 |
|
|
$ |
4,392,018 |
|
|
$ |
4,450,963 |
|
|
$ |
3,977,478 |
|
|
$ |
4,487,051 |
|
Net interest margin summarized for the three months ended:
|
|
|
|
|
|
|
|
|
|
|
|
|
|
|
|
|
|
|
|
|
|
|
|
|
|
|
|
|
|
|
|
|
|
|
|
|
September 30, 2024 |
|
June 30, 2024 |
| (Dollars in thousands) |
Average
Balance |
|
Interest |
|
Average
Rate(4)
|
|
Average
Balance |
|
Interest |
|
Average
Rate(4)
|
| Interest earning assets: |
|
|
|
|
|
|
|
|
|
|
|
| Interest earning cash balances |
$ |
563,683 |
|
|
$ |
7,712 |
|
|
5.44 |
% |
|
$ |
463,759 |
|
|
$ |
6,330 |
|
|
5.49 |
% |
| Taxable securities |
398,265 |
|
|
6,479 |
|
|
6.47 |
% |
|
328,987 |
|
|
5,501 |
|
|
6.73 |
% |
| Tax-exempt securities |
3,129 |
|
|
21 |
|
|
2.67 |
% |
|
3,153 |
|
|
22 |
|
|
2.81 |
% |
| FHLB and other restricted stock |
13,587 |
|
|
379 |
|
|
11.10 |
% |
|
7,598 |
|
|
234 |
|
|
12.39 |
% |
Loans(1) |
4,200,306 |
|
|
93,484 |
|
|
8.85 |
% |
|
4,195,669 |
|
|
94,928 |
|
|
9.10 |
% |
| Total interest earning assets |
$ |
5,178,970 |
|
|
$ |
108,075 |
|
|
8.30 |
% |
|
$ |
4,999,166 |
|
|
$ |
107,015 |
|
|
8.61 |
% |
| Non-interest earning assets: |
|
|
|
|
|
|
|
|
|
|
|
| Other assets |
692,933 |
|
|
|
|
|
|
691,601 |
|
|
|
|
|
| Total assets |
$ |
5,871,903 |
|
|
|
|
|
|
$ |
5,690,767 |
|
|
|
|
|
| Interest bearing liabilities: |
|
|
|
|
|
|
|
|
|
|
|
| Deposits: |
|
|
|
|
|
|
|
|
|
|
|
| Interest bearing demand |
$ |
721,482 |
|
|
$ |
987 |
|
|
0.54 |
% |
|
$ |
748,699 |
|
|
$ |
1,164 |
|
|
0.63 |
% |
| Individual retirement accounts |
47,397 |
|
|
158 |
|
|
1.33 |
% |
|
49,917 |
|
|
175 |
|
|
1.41 |
% |
| Money market |
580,281 |
|
|
4,128 |
|
|
2.83 |
% |
|
565,612 |
|
|
4,097 |
|
|
2.91 |
% |
| Savings |
538,367 |
|
|
1,609 |
|
|
1.19 |
% |
|
541,408 |
|
|
1,480 |
|
|
1.10 |
% |
| Certificates of deposit |
248,126 |
|
|
2,087 |
|
|
3.35 |
% |
|
257,292 |
|
|
1,945 |
|
|
3.04 |
% |
| Brokered time deposits |
404,537 |
|
|
5,072 |
|
|
4.99 |
% |
|
433,096 |
|
|
5,698 |
|
|
5.29 |
% |
| Other brokered deposits |
— |
|
|
— |
|
|
— |
% |
|
71,196 |
|
|
961 |
|
|
5.43 |
% |
| Total interest bearing deposits |
2,540,190 |
|
|
14,041 |
|
|
2.20 |
% |
|
2,667,220 |
|
|
15,520 |
|
|
2.34 |
% |
| Federal Home Loan Bank advances |
213,424 |
|
|
2,936 |
|
|
5.47 |
% |
|
85,769 |
|
|
1,193 |
|
|
5.59 |
% |
| Subordinated notes |
108,984 |
|
|
1,227 |
|
|
4.48 |
% |
|
108,868 |
|
|
1,225 |
|
|
4.53 |
% |
| Junior subordinated debentures |
42,105 |
|
|
1,172 |
|
|
11.07 |
% |
|
41,951 |
|
|
1,162 |
|
|
11.14 |
% |
| Other borrowings |
11 |
|
|
— |
|
|
— |
% |
|
— |
|
|
— |
|
|
— |
% |
| Total interest bearing liabilities |
$ |
2,904,714 |
|
|
$ |
19,376 |
|
|
2.65 |
% |
|
$ |
2,903,808 |
|
|
$ |
19,100 |
|
|
2.65 |
% |
| Noninterest bearing liabilities and equity: |
|
|
|
|
|
|
|
|
|
|
|
| Non-interest bearing demand deposits |
1,991,042 |
|
|
|
|
|
|
1,832,154 |
|
|
|
|
|
| Other liabilities |
87,712 |
|
|
|
|
|
|
74,578 |
|
|
|
|
|
| Total equity |
888,435 |
|
|
|
|
|
|
880,227 |
|
|
|
|
|
| Total liabilities and equity |
$ |
5,871,903 |
|
|
|
|
|
|
$ |
5,690,767 |
|
|
|
|
|
| Net interest income |
|
|
$ |
88,699 |
|
|
|
|
|
|
$ |
87,915 |
|
|
|
Interest spread(2) |
|
|
|
|
5.65 |
% |
|
|
|
|
|
5.96 |
% |
Net interest margin(3) |
|
|
|
|
6.81 |
% |
|
|
|
|
|
7.07 |
% |
(1) Loan balance totals include respective nonaccrual assets.
(2) Net interest spread is the yield on average interest earning assets less the rate on interest bearing liabilities.
(3) Net interest margin is the ratio of net interest income to average interest earning assets.
(4) Average rates have been annualized.
Additional information pertaining to our loan portfolio, including loans held for investment and loans held for sale, summarized for the quarters ended:
|
|
|
|
|
|
|
|
|
|
|
|
|
|
|
|
|
|
|
|
|
|
|
|
|
|
|
|
|
|
| (Dollars in thousands) |
September 30,
2024 |
|
June 30,
2024 |
|
March 31,
2024 |
|
December 31,
2023 |
|
September 30,
2023 |
| Average Banking loans |
$ |
3,008,767 |
|
|
$ |
3,035,612 |
|
|
$ |
2,932,646 |
|
|
$ |
3,053,526 |
|
|
$ |
3,109,630 |
|
| Average Factoring receivables |
1,023,570 |
|
|
976,087 |
|
|
942,414 |
|
|
1,025,978 |
|
|
999,345 |
|
| Average Payments receivables |
167,969 |
|
|
183,970 |
|
|
170,306 |
|
|
176,852 |
|
|
173,847 |
|
| Average total loans |
$ |
4,200,306 |
|
|
$ |
4,195,669 |
|
|
$ |
4,045,366 |
|
|
$ |
4,256,356 |
|
|
$ |
4,282,822 |
|
| Banking yield |
6.99 |
% |
|
7.27 |
% |
|
7.34 |
% |
|
7.66 |
% |
|
7.61 |
% |
| Factoring yield |
13.57 |
% |
|
14.14 |
% |
|
13.98 |
% |
|
13.71 |
% |
|
13.59 |
% |
| Payments yield |
13.48 |
% |
|
12.51 |
% |
|
12.18 |
% |
|
11.83 |
% |
|
11.22 |
% |
| Total loan yield |
8.85 |
% |
|
9.10 |
% |
|
9.09 |
% |
|
9.29 |
% |
|
9.16 |
% |
Metrics and non-GAAP financial:
|
|
|
|
|
|
|
|
|
|
|
|
|
|
|
|
|
|
|
|
|
|
|
|
|
|
|
|
|
|
|
|
|
|
|
|
|
|
|
|
|
|
|
|
|
|
|
As of and for the Three Months Ended |
|
As of and for the Nine Months Ended |
(Dollars in thousands,
except per share amounts) |
|
September 30,
2024 |
|
June 30,
2024 |
|
March 31,
2024 |
|
December 31,
2023 |
|
September 30,
2023 |
|
September 30,
2024 |
|
September 30,
2023 |
|
|
|
|
|
|
|
|
|
|
|
|
|
|
|
|
|
|
|
|
|
|
|
|
|
|
|
|
|
|
|
|
|
|
|
|
|
|
|
|
|
|
|
|
|
|
|
|
|
|
|
|
|
|
|
|
|
|
|
|
|
|
|
|
|
|
|
|
|
|
|
|
|
|
|
|
|
|
|
|
|
|
|
|
|
|
|
|
|
|
|
|
|
|
|
|
|
|
|
|
|
|
|
|
|
|
|
|
|
|
|
|
|
|
|
|
|
|
|
|
|
|
|
|
|
|
|
|
|
|
|
|
|
|
|
| Average total stockholders' equity |
|
$ |
888,435 |
|
|
$ |
880,227 |
|
|
$ |
879,825 |
|
|
$ |
868,396 |
|
|
$ |
853,375 |
|
|
$ |
882,849 |
|
|
$ |
851,139 |
|
| Average preferred stock liquidation preference |
|
(45,000) |
|
|
(45,000) |
|
|
(45,000) |
|
|
(45,000) |
|
|
(45,000) |
|
|
(45,000) |
|
|
(45,000) |
|
| Average total common stockholders' equity |
|
843,435 |
|
|
835,227 |
|
|
834,825 |
|
|
823,396 |
|
|
808,375 |
|
|
837,849 |
|
|
806,139 |
|
| Average goodwill and other intangibles |
|
(253,656) |
|
|
(256,552) |
|
|
(256,070) |
|
|
(258,807) |
|
|
(261,619) |
|
|
(255,431) |
|
|
(263,814) |
|
| Average tangible common stockholders' equity |
|
$ |
589,779 |
|
|
$ |
578,675 |
|
|
$ |
578,755 |
|
|
$ |
564,589 |
|
|
$ |
546,756 |
|
|
$ |
582,418 |
|
|
$ |
542,325 |
|
|
|
|
|
|
|
|
|
|
|
|
|
|
|
|
| Net income available to common stockholders |
|
$ |
4,546 |
|
|
$ |
1,945 |
|
|
$ |
3,357 |
|
|
$ |
8,825 |
|
|
$ |
11,993 |
|
|
$ |
9,848 |
|
|
$ |
29,050 |
|
| Average tangible common equity |
|
589,779 |
|
|
578,675 |
|
|
578,755 |
|
|
564,589 |
|
|
546,756 |
|
|
582,418 |
|
|
542,325 |
|
| Return on average tangible common equity |
|
3.07 |
% |
|
1.35 |
% |
|
2.33 |
% |
|
6.20 |
% |
|
8.70 |
% |
|
2.26 |
% |
|
7.16 |
% |
|
|
|
|
|
|
|
|
|
|
|
|
|
|
|
|
|
|
|
|
|
|
|
|
|
|
|
|
|
|
|
|
|
|
|
|
|
|
|
|
|
|
|
|
|
|
|
|
|
|
|
|
|
|
|
|
|
|
|
|
|
|
|
|
|
|
|
|
|
|
|
|
|
|
|
|
|
|
|
|
|
|
|
|
|
|
|
|
|
|
|
|
|
|
|
|
|
|
|
|
|
|
|
|
|
|
|
|
|
|
|
|
|
|
|
|
|
|
|
|
|
|
|
|
|
|
|
|
|
|
|
|
|
|
|
|
|
|
|
|
|
|
|
|
|
|
|
|
|
|
|
|
|
|
|
|
|
|
|
|
|
|
|
|
|
| Net interest income |
|
$ |
88,699 |
|
|
$ |
87,915 |
|
|
$ |
86,035 |
|
|
$ |
91,919 |
|
|
$ |
91,327 |
|
|
$ |
262,649 |
|
|
$ |
276,160 |
|
| Noninterest income |
|
17,497 |
|
|
17,167 |
|
|
14,999 |
|
|
14,230 |
|
|
13,410 |
|
|
49,663 |
|
|
35,943 |
|
| Operating revenue |
|
$ |
106,196 |
|
|
$ |
105,082 |
|
|
$ |
101,034 |
|
|
$ |
106,149 |
|
|
$ |
104,737 |
|
|
$ |
312,312 |
|
|
$ |
312,103 |
|
| Noninterest expenses |
|
$ |
95,646 |
|
|
$ |
97,343 |
|
|
$ |
90,371 |
|
|
$ |
87,298 |
|
|
$ |
86,259 |
|
|
$ |
283,360 |
|
|
$ |
265,936 |
|
| Efficiency ratio |
|
90.06 |
% |
|
92.64 |
% |
|
89.45 |
% |
|
82.24 |
% |
|
82.36 |
% |
|
90.73 |
% |
|
85.21 |
% |
|
|
|
|
|
|
|
|
|
|
|
|
|
|
|
|
|
|
|
|
|
|
|
|
|
|
|
|
|
|
|
|
|
|
|
|
|
|
|
|
|
|
|
|
|
|
|
|
|
|
|
|
|
|
|
|
|
|
|
|
|
|
|
|
|
|
|
|
|
|
|
|
|
|
|
|
|
|
|
|
|
|
|
|
|
|
|
|
|
|
|
|
|
|
|
|
|
|
|
|
|
|
|
|
|
|
|
|
|
|
|
|
|
|
|
|
|
|
|
|
|
|
|
|
|
|
|
|
|
|
|
|
|
|
|
|
|
|
|
|
|
|
|
|
|
|
|
|
|
|
|
|
|
|
|
|
|
|
|
|
|
|
|
|
|
|
|
|
|
|
|
|
|
|
|
|
|
|
|
|
| Net non-interest expense to average assets ratio: |
|
|
|
|
|
|
|
|
|
|
|
|
|
|
| Noninterest expenses |
|
$ |
95,646 |
|
|
$ |
97,343 |
|
|
$ |
90,371 |
|
|
$ |
87,298 |
|
|
$ |
86,259 |
|
|
$ |
283,360 |
|
|
$ |
265,936 |
|
| Noninterest income |
|
$ |
17,497 |
|
|
$ |
17,167 |
|
|
$ |
14,999 |
|
|
$ |
14,230 |
|
|
$ |
13,410 |
|
|
$ |
49,663 |
|
|
$ |
35,943 |
|
| Net noninterest expenses |
|
$ |
78,149 |
|
|
$ |
80,176 |
|
|
$ |
75,372 |
|
|
$ |
73,068 |
|
|
$ |
72,849 |
|
|
$ |
233,697 |
|
|
$ |
229,993 |
|
| Average total assets |
|
$ |
5,871,903 |
|
|
$ |
5,690,767 |
|
|
$ |
5,391,520 |
|
|
$ |
5,478,707 |
|
|
$ |
5,472,000 |
|
|
$ |
5,654,804 |
|
|
$ |
5,415,269 |
|
| Net noninterest expense to average assets ratio |
|
5.29 |
% |
|
5.67 |
% |
|
5.62 |
% |
|
5.29 |
% |
|
5.28 |
% |
|
5.52 |
% |
|
5.68 |
% |
|
|
|
|
|
|
|
|
|
|
|
|
|
|
|
| Total stockholders' equity |
|
$ |
885,764 |
|
|
$ |
874,249 |
|
|
$ |
872,339 |
|
|
$ |
864,400 |
|
|
$ |
850,382 |
|
|
$ |
885,764 |
|
|
$ |
850,382 |
|
| Preferred stock liquidation preference |
|
(45,000) |
|
|
(45,000) |
|
|
(45,000) |
|
|
(45,000) |
|
|
(45,000) |
|
|
(45,000) |
|
|
(45,000) |
|
| Total common stockholders' equity |
|
840,764 |
|
|
829,249 |
|
|
827,339 |
|
|
819,400 |
|
|
805,382 |
|
|
840,764 |
|
|
805,382 |
|
| Goodwill and other intangibles |
|
(251,025) |
|
|
(254,652) |
|
|
(257,551) |
|
|
(257,355) |
|
|
(260,109) |
|
|
(251,025) |
|
|
(260,109) |
|
| Tangible common stockholders' equity |
|
$ |
589,739 |
|
|
$ |
574,597 |
|
|
$ |
569,788 |
|
|
$ |
562,045 |
|
|
$ |
545,273 |
|
|
$ |
589,739 |
|
|
$ |
545,273 |
|
| Common shares outstanding |
|
23,387,522 |
|
|
23,353,519 |
|
|
23,334,997 |
|
|
23,302,414 |
|
|
23,291,693 |
|
|
23,387,522 |
|
|
23,291,693 |
|
| Tangible book value per share |
|
$ |
25.22 |
|
|
$ |
24.60 |
|
|
$ |
24.42 |
|
|
$ |
24.12 |
|
|
$ |
23.41 |
|
|
$ |
25.22 |
|
|
$ |
23.41 |
|
|
|
|
|
|
|
|
|
|
|
|
|
|
|
|
| Total assets at end of period |
|
$ |
5,866,046 |
|
|
$ |
5,783,334 |
|
|
$ |
5,575,493 |
|
|
$ |
5,347,334 |
|
|
$ |
5,599,794 |
|
|
$ |
5,866,046 |
|
|
$ |
5,599,794 |
|
| Goodwill and other intangibles |
|
(251,025) |
|
|
(254,652) |
|
|
(257,551) |
|
|
(257,355) |
|
|
(260,109) |
|
|
(251,025) |
|
|
(260,109) |
|
| Tangible assets at period end |
|
$ |
5,615,021 |
|
|
$ |
5,528,682 |
|
|
$ |
5,317,942 |
|
|
$ |
5,089,979 |
|
|
$ |
5,339,685 |
|
|
$ |
5,615,021 |
|
|
$ |
5,339,685 |
|
| Tangible common stockholders' equity ratio |
|
10.50 |
% |
|
10.39 |
% |
|
10.71 |
% |
|
11.04 |
% |
|
10.21 |
% |
|
10.50 |
% |
|
10.21 |
% |
1)Triumph Financial uses certain non-GAAP financial measures to provide meaningful supplemental information regarding Triumph Financial's operational performance and to enhance investors' overall understanding of such financial performance. The non-GAAP measures used by Triumph Financial include the following:
•"Tangible common stockholders' equity" is defined as common stockholders' equity less goodwill and other intangible assets.
•"Total tangible assets" is defined as total assets less goodwill and other intangible assets.
•"Tangible book value per share" is defined as tangible common stockholders' equity divided by total common shares outstanding. This measure is important to investors interested in changes from period-to-period in book value per share exclusive of changes in intangible assets.
•"Tangible common stockholders' equity ratio" is defined as the ratio of tangible common stockholders' equity divided by total tangible assets. We believe that this measure is important to many investors in the marketplace who are interested in relative changes from period-to period in common equity and total assets, each exclusive of changes in intangible assets.
•"Return on Average Tangible Common Equity" is defined as net income available to common stockholders divided by average tangible common stockholders' equity.
2)Performance ratios include discount accretion on purchased loans for the periods presented as follows:
|
|
|
|
|
|
|
|
|
|
|
|
|
|
|
|
|
|
|
|
|
|
|
|
|
|
|
|
|
|
|
|
|
|
|
|
|
|
|
|
|
|
|
For the Three Months Ended |
|
For the Nine Months Ended |
| (Dollars in thousands) |
September 30,
2024 |
|
June 30,
2024 |
|
March 31,
2024 |
|
December 31,
2023 |
|
September 30,
2023 |
|
September 30,
2024 |
|
September 30,
2023 |
| Loan discount accretion |
$ |
893 |
|
|
$ |
1,127 |
|
|
$ |
471 |
|
|
$ |
1,039 |
|
|
$ |
1,403 |
|
|
$ |
2,491 |
|
|
$ |
4,203 |
|
3)Asset quality ratios exclude loans held for sale, except for non-performing assets to total assets.
4)Current quarter ratios are preliminary.
Source: Triumph Financial, Inc.
###
Investor Relations:
Luke Wyse
Senior Vice President, Head of Investor Relations
lwyse@tfin.com
214-365-6936
Media Contact:
Amanda Tavackoli
Senior Vice President, Director of Corporate Communication
atavackoli@tfin.com
214-365-6930