Document
Exhibit 99.1
July 17, 2024
Fellow Shareholders,
For the second quarter, we earned net income to common stockholders of $1.9 million, or $0.08 per diluted share.
Discussion of the Quarter
If I had to describe this quarter with a phrase, I might quote Charles Dickens – “It was the best of times, it was the worst of times…” That statement overdoes it both to the positive and the negative, but it is directionally correct. It comes down to this — our quarterly earnings were anemic. Beyond the quarter, our trailing twelve-month earnings are well below our historical performance. The cause is simple enough to spot: expenses have risen while revenue has stagnated. Revenue has stagnated because we are in the longest freight recession in history. Faced with that, most companies would go into cost cutting mode. We have chosen not to do so because of our conviction that we are in a unique window of time to transform an industry. Therefore, we have made the decision to forego some near-term profitability in favor of investing in the resources necessary to achieve critical mass before the window of opportunity closes. We are in the density building phase of our network development, which is the most difficult phase. We will be in this phase through the rest of this year and much of 2025. We will remain primarily focused on the task of building density regardless of freight recessions, Fed tightening cycles or any other events outside of our control. We are not doing this in a cavalier fashion – we have momentum to support our thesis. With the announcements this quarter, we have a trajectory towards network engagement with over 50% of all brokered freight by the end of this year[1,2]. Long term, we intend to achieve well beyond 50% network engagement. I have said in several past letters that “our plan is to stick to the plan.” If ever there was a time to keep doing just that, this is the time.
Here are four points related to this quarter and our go-forward strategy that investors should not miss:
•Freight is in a slump, and predicting the end of slumps is almost impossible. There is still too much capacity in the system for the freight that is being moved. Until capacity decreases or there are broader demand shocks, we will be in a slump. I have been saying this for several quarters, but now I can add something a bit more hopeful to end it: there are more signs of life late in Q2 and early Q3 than we have seen for some time. We are hopeful that the market follows these signals, but it is too early to call.
•Earnings remain under pressure. As stated in the introductory paragraph, the cause is primarily (i) revenue weakness due to freight weakness, (ii) investment in our technology platform and (iii) elevated credit expenses relative to historical averages. We cannot control the freight market, but we do control our internal investment. I will give investors a deeper explanation of our thought process related to expenses in the next section of this letter. I ask investors to consider that we are not trying to optimize for 2024 earnings or even 2025. Decisions that create the most long-term value must be made with relative indifference to short-term outcomes.
•A cap on expenses is appropriate for the next several quarters. Notwithstanding the foregoing principle of taking a long-term view, guardrails are appropriate. We have roughly doubled our expenses over the last five years as we morphed from a community bank into a financial technology platform. The level of talent we have assembled in that time makes us almost unrecognizable compared to the company we once were. Despite that remarkable change, we must remember that we are a bank, and banks are supposed to consistently make money. Further, living through the Great Financial Crisis while trying to keep Triumph (as it then existed) afloat, has left me with a permanent and healthy fear of spending tomorrow’s money today. I believe we are positioned to continue to build out the infrastructure we need inside the expense base we have today. This should be true for some time to come. Doing this will require us to make choices and to prioritize certain projects over others. It will require us to be more intentional in our talent management. Both of these are healthy disciplines for us.
•We anticipate achieving 50% density in brokered freight by the end of this year[2]. Density is a very important thing to measure. Network economies are such that the value realized by our customers (and ultimately, our shareholders) increases as the number of network users increases. As of the end of Q2, our network engagement
in brokered freight is just under 47%. During the quarter, we announced a strategic relationship with C.H. Robinson (CHRW), who will join our network either at the end of this year or early next. In addition, ArcBest, a multibillion-dollar integrated logistics company, also went live on the network during the quarter. Due to this new volume and the incremental volume already in the pipeline, I believe we will achieve our 50% density target for brokered freight by the end of this year. We will not stop at 50%.
A Deeper Dive into Expenses
Let's start with the main thing and be plain-spoken about it: Due to elevated expenses, we missed consensus earnings estimates by approximately $3.3 million this quarter. There are things we could have delayed or neglected that would have closed much of the gap even with some lumpy expenses this quarter. I believe that would have been a poor decision even if it made the market happy in the short term. Our pipelines of prospects and products are full, and we intend to execute with speed and excellence to achieve our long-term goals. It is my hope that our long-term investors see this and appreciate it.
Holding our expenses closer to flat for the foreseeable future is easy enough to model, but I want to give investors more insight into how we think about our role as stewards. Expenses were $97.3 million for Q2, which was a 7.7% increase over Q1. That material increase deserves an explanation, which I will do in this section. We expect Q3 expenses to be approximately $97 million. In the absence of M&A or other unforeseen events, we intend to hold expenses at approximately this level through the remainder of this year and the beginning of next year.
What explains the expense increase between Q1 and Q2? There were four major drivers: (i) communications and technology [$2.4 million]; salaries and benefits [$1.8 million]; legal expenses [$1.1 million]; and occupancy expenses [$0.9 million]. The increase in occupancy expense is the easiest to explain. Our newly acquired HQ building added $1.7 million of expense for the quarter (note that not all of the expense showed up in occupancy), but it also contributed $1.6 million in revenue from rental income. From a bottom-line perspective, it was effectively neutral. Over time, that cost will go up as we refinish and occupy more of the building.
The timing of legal expenses are hard to predict, so I have no further guidance to offer here. This leaves us with $4.2 million of expense increase that is divided between technology and hiring (and annual compensation increases, which occur in March). What are we spending that money on (or, as I think about it, investing that money in)? We are investing in LoadPay, Factoring-as-a-Service (“FaaS”) and the general build out and enhancement of our freight technology platform. That has driven most of our expense increase over the last few years, not just in the last quarter.
This letter discusses LoadPay and FaaS in further detail in later sections, so I won’t go into the strategy of each here. It is; however, important to address how we think about allocating our resources considering the probability of success. I think this may be the most important question for a long-term investor to answer. Are we chasing the next shiny thing, or are we purposefully investing through the cycle to win? I believe it is the latter. Here is the rationale behind my thinking: At this point, I would assign the probability of Triumph Financial achieving our goals related to our network engagement as extremely high. Our density is growing and the EBITDA margin in our Payments segment is roughly break-even despite the freight recession and technology investments we are making. That is a firm foundation which derisks ancillary offerings. Further, our density gives us a unique distribution mechanism for add-on products. We are investing in enhancements that our customers and prospects have requested and are willing to pay for. In light of these factors relative to the probability of success plus the size of the addressable market, we have the conviction to move forward despite the headwinds. We know that the probability of hitting a home run is lower than the probability of getting a hit, but each of these offerings builds on the other. Stacking hits leads to runs, which leads to wins.
A wise investor said, “opportunity abounds when there are the fewest takers.” I believe this wholeheartedly. Investing as we have would be more comfortable if we had the same tailwinds we did in 2021. On the other hand, every dollar goes further when your competition is playing defense. We can invest because we have stewarded our resources to be prepared for this environment. We have over $250 million of excess capital above the well-capitalized limits for banks. We do not intend to dip into that reserve, but it contributes to our confidence to continue to invest despite all of the uncertainties in the world.
Here are a few closing thoughts on our thinking about technology and operational expenses.
Technology expense and customer retention philosophy. As it relates to our Payments business (which has seen the largest % expense growth), bear in mind that we sell a high margin product because of the efficiencies it produces at scale. The same could be said for our factoring business, although the economies of scale are not the same due to balance sheet requirements to support factoring.
Our customers trust us with an especially important function – handling their money. Our chairman taught me years ago that trust was built on competency and character. Competency means our software must be innovative, secure, and solve real problems. This requires ongoing investment. It means that our team members must be excellent in their roles. They must know the product and communicate the value proposition to our customers consistently and clearly. We need to hire and retain the best sales and relationship management talent we can. Character means that we are known to pursue our clients’ best interest as we pursue our own. We do not win at their expense; we win when they win. We want to be paid and paid well for the solution we deliver, but only in the context of simultaneously creating exceptional value for our clients. In other words, we do not just want customers, we want fans. It is in challenging times like these that businesses that can produce efficiencies at scale and share part of those benefits with their customers take market share which is rarely given back. That is the long-term value of trust. Building that is my obsession.
Operational and development expense philosophy. As stated above, operational and technology expenses have risen substantially over the past five years. I have said in prior letters that most of this expense growth is behind us. I stand by that; however, there are certain things we must do to achieve our goals. Our work will never be completely done. For example, we must continue to invest in information security because the cost of not doing so can be asymmetric – both to our financials and to the trust of our customers. Criminals do not rest, so neither can we.
While the Payments segment accounts for the lion’s share of expense growth over the past five years, a major portion of our expense increase over the last six quarters has been borne by our Corporate segment. The Corporate segment does not engage in business on its own. Rather, it is a collection of shared services that benefit multiple operating segments (Payments, Factoring, and Banking). This includes most of our executive leadership team, shared services costs including HR, accounting, finance, risk management and a significant amount of information technology expense. Also reflected in this segment is the interest expense on our subordinated debt and trust preferred securities. Any expense directly attributable to one of the three operating segments is still borne by that segment. For example, we have team members in IT, HR, finance, credit, and marketing who are dedicated solely to one of the segments and, even though they are part of a shared services team and may report to someone in the Corporate segment, their expense is allocated to the segment they support.
Below is a comparison of Corporate segment expenses for each of the last six quarters. The goal here is to provide an illustration of where we are spending and how that has grown over time rather than to set a new quarterly disclosure expectation. Our Corporate segment is consistent with the entire business in that about 64% of our expense is in compensation and benefits, a material portion of which is focused on investments in our freight technology platform. Overall, we spend about 58% on compensation and benefits. The top 3 categories comprise about 88% of our total expense base in the Corporate segment.
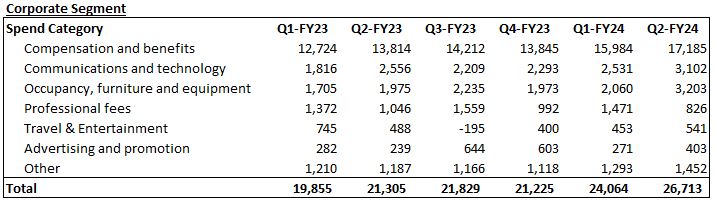
TriumphX, our technology organization that supports the entire enterprise, represents the largest investment in the Corporate segment at about 30% of the segment’s spend. It contributed to just under 50% of the expense growth over the period represented above. It has grown over the last several years as we have scaled up to support the larger, more complex enterprise we are building. We made these investments to capitalize on the opportunities we see ahead of us and to minimize the risk of damage to our franchise and reputation that could result from a network failure or material information security breach. Our information security function has been enhanced, and we have added numerous technology tools, all of which require ongoing investment. All of this has been to empower our ability to scale. Without those investments, the announcements we made this quarter would have been unlikely to happen. Once the infrastructure is built, the expansion happens at very high margins.
In conclusion, we understand that winning is not just about growing volume and revenue. We must do it profitably. This requires managing expenses wisely. I believe we can do that within our current expense level for the foreseeable future.
KPIs for the Quarter
The tables below outline some of our key operating metrics.
|
|
|
|
|
|
|
|
|
|
|
|
|
|
|
|
|
|
|
|
|
|
|
|
|
|
|
|
|
|
|
|
|
|
|
As of and for the Three Months Ended |
|
|
| (Dollars in thousands) |
June 30,
2024 |
|
March 31,
2024 |
|
December 31,
2023 |
|
September 30,
2023 |
|
June 30,
2023 |
|
|
|
|
| Financial Highlights: |
|
|
|
|
|
|
|
|
|
|
|
|
|
| Loans held for investment |
$ |
4,288,417 |
|
|
$ |
4,195,120 |
|
|
$ |
4,163,100 |
|
|
$ |
4,371,528 |
|
|
$ |
4,324,758 |
|
|
|
|
|
| Deposits |
$ |
4,392,018 |
|
|
$ |
4,450,963 |
|
|
$ |
3,977,478 |
|
|
$ |
4,487,051 |
|
|
$ |
4,293,466 |
|
|
|
|
|
| Net income available to common stockholders |
$ |
1,945 |
|
|
$ |
3,357 |
|
|
$ |
8,825 |
|
|
$ |
11,993 |
|
|
$ |
6,848 |
|
|
|
|
|
| Diluted earnings per common share |
$ |
0.08 |
|
|
$ |
0.14 |
|
|
$ |
0.37 |
|
|
$ |
0.51 |
|
|
$ |
0.29 |
|
|
|
|
|
Return on average assets(1) |
0.19 |
% |
|
0.31 |
% |
|
0.70 |
% |
|
0.93 |
% |
|
0.56 |
% |
|
|
|
|
Yield on loans(1) |
9.10 |
% |
|
9.09 |
% |
|
9.29 |
% |
|
9.16 |
% |
|
9.14 |
% |
|
|
|
|
Cost of total funds(1) |
1.62 |
% |
|
1.45 |
% |
|
1.47 |
% |
|
1.41 |
% |
|
1.23 |
% |
|
|
|
|
| Non-performing assets to total assets |
1.60 |
% |
|
1.61 |
% |
|
1.42 |
% |
|
1.07 |
% |
|
0.68 |
% |
|
|
|
|
| ACL to total loans |
0.92 |
% |
|
0.91 |
% |
|
0.85 |
% |
|
0.80 |
% |
|
0.81 |
% |
|
|
|
|
Total capital to risk-weighted assets(2) |
16.51 |
% |
|
16.69 |
% |
|
16.75 |
% |
|
15.77 |
% |
|
15.59 |
% |
|
|
|
|
Common equity tier 1 capital to risk-weighted assets(2) |
11.71 |
% |
|
11.85 |
% |
|
11.94 |
% |
|
11.18 |
% |
|
10.93 |
% |
|
|
|
|
(1) Current quarter ratios are annualized
(2) Current period ratios are preliminary
|
|
|
|
|
|
|
|
|
|
|
|
|
|
|
|
|
|
|
|
|
|
|
|
|
|
|
|
|
|
|
|
|
|
|
|
|
|
|
|
|
|
|
|
|
|
|
|
|
|
|
|
|
|
|
June 30,
2024 |
|
March 31,
2024 |
|
December 31,
2023 |
|
September 30,
2023 |
|
June 30,
2023 |
|
Current Quarter Q/Q |
|
Current Year Y/Y |
| For the Qtr Ending |
|
|
|
|
|
Change |
|
% Change |
|
Change |
|
% Change |
| Factoring: |
|
|
|
|
|
|
|
|
|
|
|
|
|
|
|
|
|
| Invoice Volume |
1,432,366 |
|
|
1,367,625 |
|
|
1,404,861 |
|
|
1,428,463 |
|
|
1,494,963 |
|
|
64,741 |
|
|
4.7 |
% |
|
(62,597) |
|
|
(4.2) |
% |
| Purchased Volume |
$ |
2,542,327,000 |
|
|
$ |
2,469,797,000 |
|
|
$ |
2,570,442,000 |
|
|
$ |
2,606,323,000 |
|
|
$ |
2,732,976,000 |
|
|
$ |
72,530,000 |
|
|
2.9 |
% |
|
$ |
(190,649,000) |
|
|
(7.0) |
% |
| Average Transportation Invoice Size |
$ |
1,738 |
|
|
$ |
1,771 |
|
|
$ |
1,781 |
|
|
$ |
1,772 |
|
|
$ |
1,773 |
|
|
$ |
(33) |
|
|
(1.9) |
% |
|
$ |
(35) |
|
|
(2.0) |
% |
| Payments: |
|
|
|
|
|
|
|
|
|
|
|
|
|
|
|
|
|
| Invoice Volume |
6,062,779 |
|
|
5,717,016 |
|
|
5,703,740 |
|
|
5,037,841 |
|
|
4,526,629 |
|
|
345,763 |
|
|
6.0 |
% |
|
1,536,150 |
|
|
33.9 |
% |
| Payment Volume |
$ |
6,687,587,000 |
|
|
$ |
6,379,680,000 |
|
|
$ |
6,217,323,000 |
|
|
$ |
5,329,580,000 |
|
|
$ |
4,940,317,000 |
|
|
$ |
307,907,000 |
|
|
4.8 |
% |
|
$ |
1,747,270,000 |
|
|
35.4 |
% |
| Network Invoice Volume |
701,768 |
|
|
621,209 |
|
|
442,353 |
|
|
303,300 |
|
|
181,904 |
|
|
80,559 |
|
|
13.0 |
% |
|
519,864 |
|
|
285.8 |
% |
| Network Payment Volume |
$ |
1,133,118,000 |
|
|
$ |
1,035,099,000 |
|
|
$ |
740,048,000 |
|
|
$ |
510,298,000 |
|
|
$ |
299,948,000 |
|
|
$ |
98,019,000 |
|
|
9.5 |
% |
|
$ |
833,170,000 |
|
|
277.8 |
% |
|
|
|
|
|
|
|
|
|
|
|
|
|
|
|
|
|
|
|
|
|
|
|
|
|
|
|
|
|
|
|
|
|
|
|
|
Payments
For our Payments segment discussion, we will cover the following topics:
1.Analysis of financial and operational performance for the quarter.
2.Progression towards 50% density target.
3.LoadPay update.
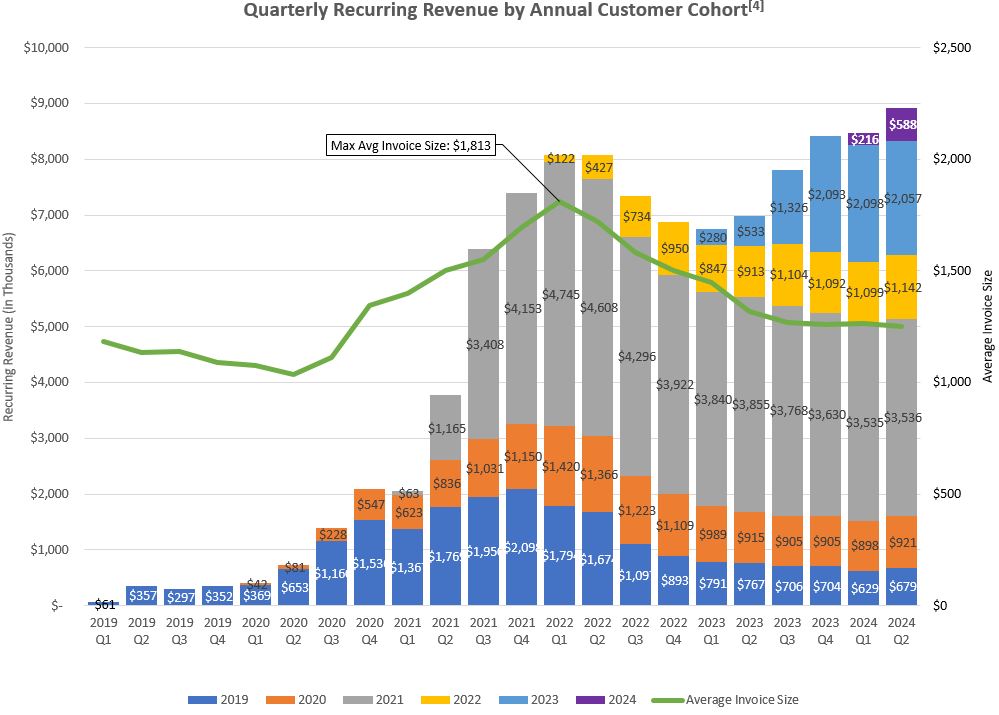
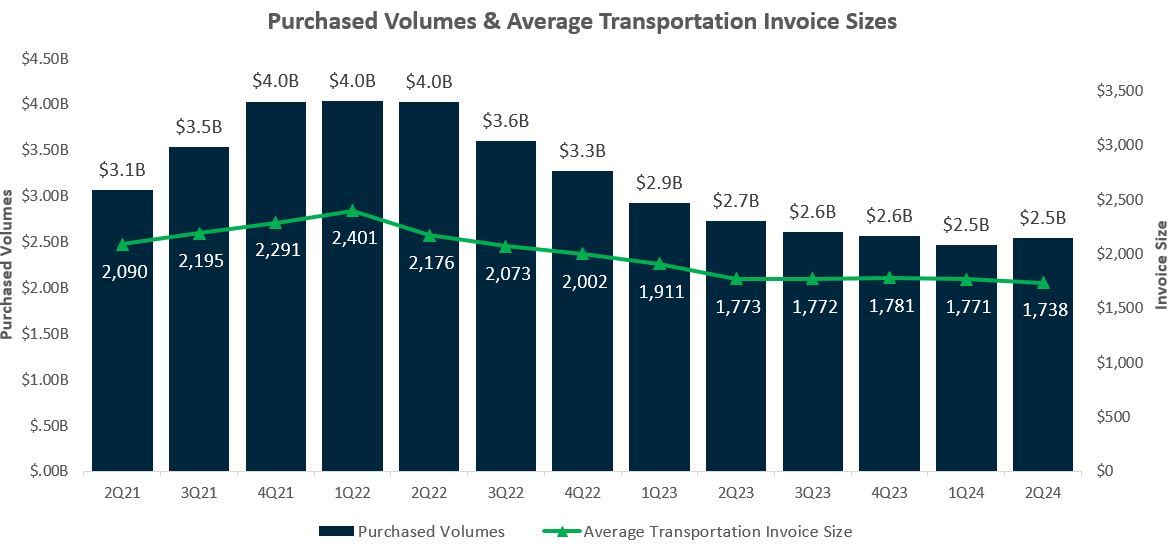
Analysis of financial and operational performance for the quarter. The chart below provides a visual demonstration of how we continue to grow revenue despite the freight recession. In the chart, the line represents invoice sizes[3], while the bars represent revenue. The revenue bars highlight quickpay and fee income that can be attributed to a specific customer in a specific year and excludes other supply chain finance income and float. Noninterest income in the Payments segment grew 5.6% last quarter and is up 39.8% versus Q2 2023. This includes the fees we generate from network transactions and other highly scalable network activities. As a reminder, a network transaction is a transaction where fully integrated network participants are on both sides.
On average, about 60% of a broker’s volume is paid to factors. So, assuming we had the entire factoring industry on the network, a broker who has 100% of their $1B in annualized volume network enabled would translate into $600 million of network transactions. If we had 30% of the factor market by volume, TriumphPay’s network volume would be $180 million for the same broker. We need critical mass of available network transactions to create an ecosystem that is attractive to brokers and factors. By attractive, we mean enough density to change their staffing models to realize the efficiencies the network creates. Monetization of networks always follows density, and this will be no exception. As you can see from the hypothetical, there is significant network transaction volume available from existing network brokers, simply by adding additional factors to the network. Currently, we think our network factors represent about 28% of the market and receive about 21% of payments from TriumphPay as network transactions.
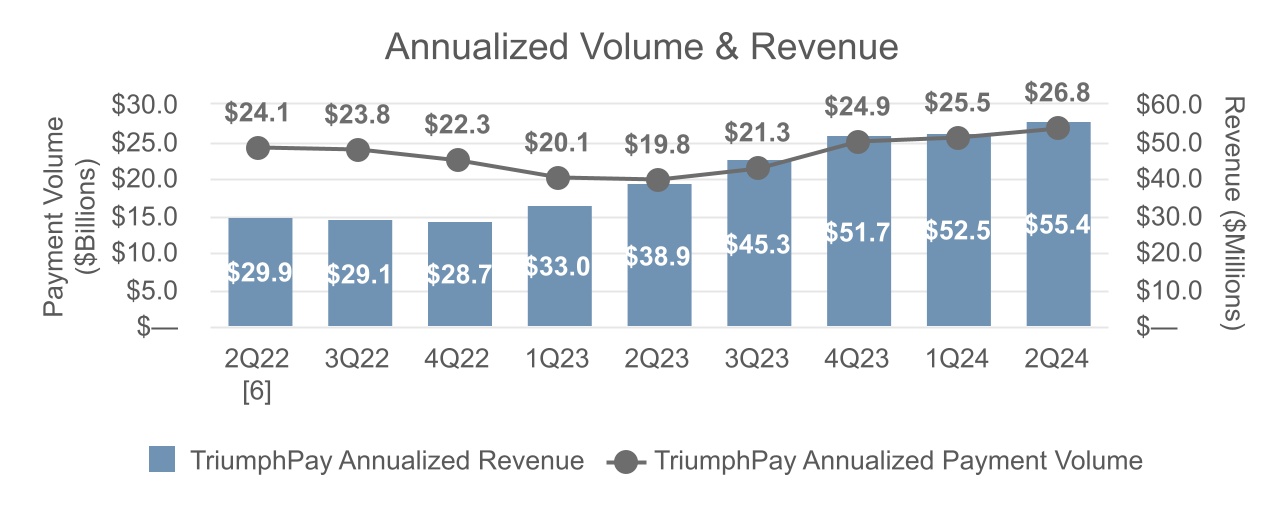
For the quarter, TriumphPay’s invoice volume increased 6.0%, and total payment volume increased by 4.8% to $26.8 billion, annualized. Our broker clients represent $23.7 billion of that figure, while the remaining $3.1 billion is related to shipper clients. The average invoice paid by TriumphPay decreased 1.2% in size. Our annualized unique broker audit dollar volume was down slightly at $15.7 billion, and our annualized unique factor audit volume increased to $11.9 billion. We measure our progress at TriumphPay by reviewing the percentage of unique brokered freight transactions touched as described above.
In the second quarter, our network engagement was about $51.3 billion in unique brokered freight transactions. That is just under 47% of the market, up about 3% from Q1 2024. This excludes the shipper volumes reported above.
On another positive note, network transactions increased 13.0% relative to last quarter. The first network transaction occurred in Q1 2022. During this quarter, total network volume reached $5 billion in all-time transactions. That is an impressive rate of growth for any business beginning with a cold start. Our broker quickpay penetration average was 6.2%, and we generated service revenue on approximately 22.4% of our payments invoices. We also earned revenue of $2.0 million[5] on the net float generated through payments made on behalf of our clients. TriumphPay's non-interest expenses this quarter were $17.8 million, up 3.4% compared to the prior quarter and 4.3% higher than the same quarter last year.
In the chart below, we highlight the continued revenue growth and its trend over the last eight quarters against the backdrop of our payment volumes. Our second quarter run rate was $55.4 million. We have generated a roughly 36.1% CAGR in revenue over the last two years.
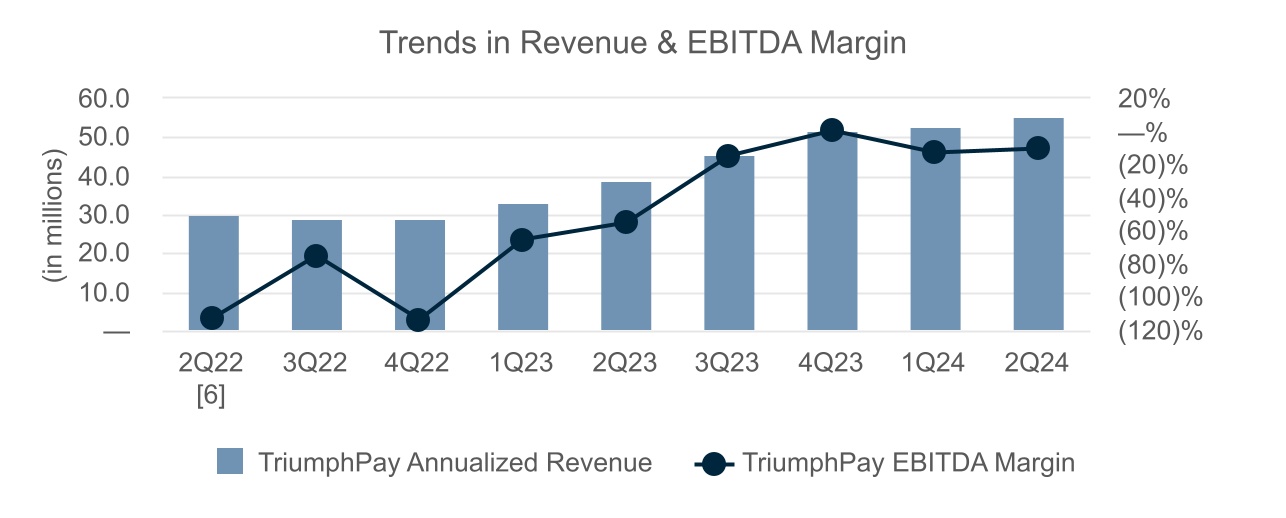
In the chart below, we highlight the trend lines in EBITDA margin relative to revenue. Though we are seeing some positive trends in recent weeks reminiscent of the first few weeks in January this year, we have planned to face a weak freight market for the remainder of 2024. On our Q4 2023 call, I predicted that the first quarter or two of 2024 would see our EBITDA margin +/- of 0% due to investments we were making in LoadPay. We saw that in the first quarter and EBITDA margin continued slightly below positive in Q2, but you can see progress in returning to positive EBITDA inclusive of our ongoing investments. EBITDA margin for Q2 was (10)%. We still expect positive EBITDA exiting Q4 of 2024, but I want to remind you that we are focused on product development and fit to create longer-term shareholder value over shorter-term earnings performance.
Progression towards 50% density target. As stated above, we are currently just under 47% network engagement in brokered freight. ArcBest joined the network during the quarter. We also announced C.H. Robinson ("CHRW") will join our network. Our usual practice is not to announce an addition until the client is live on the network, but given the size of CHRW, we wanted to inform investors. We expect the integration to take six to nine months and the majority of CHRW’s volume to be on the network by the 3rd quarter of 2025. Further of note this quarter, RXO has announced the acquisition of Coyote. Looking at the most recent Transport Topics size rankings, once completed, this merger will create a new number three broker by size. We expect this development to take two strong industry players and valued customers and make them even better. We now have 129 fully integrated network brokers and 346 overall providing either fully or partially conforming transactions to the network.
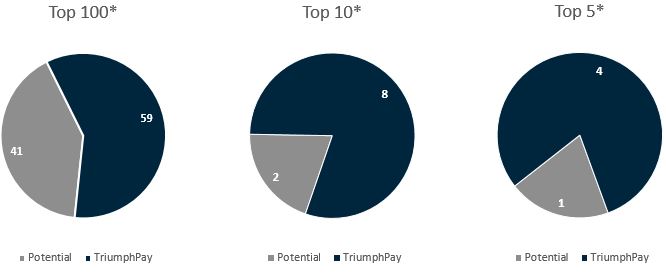
*TriumphPay values above shown inclusive of the CHRW announcement
From a factor client perspective, we added several new smaller factoring companies to the payments network, and expanded our services provided to an existing large transportation factoring customer, England Carrier Services, LLC. We now have 39 network factors on the payments network and 66 factor clients overall.
LoadPay Update. The promise of LoadPay is this – a carrier submits their invoice after delivering a load and has the money they are owed in their account before they leave the parking lot. This can happen any hour of the day, any day of the year. This account has a feature set that is intuitive and designed for truckers. It integrates with their various other financial products such as fuel cards and allows for offloading funds with ease. It will be the preferred method of making a payment by several large factors and brokers. As a result, it becomes the carrier’s preferred method of being paid. This is what we are building.
As a reminder, our projections call for a broad launch of LoadPay starting in Q1 2025 through our “power users” (factoring and brokerage customers of the network). We see a meaningful revenue opportunity for LoadPay at scale, but we are not yet far enough along to predict the specific timing of that revenue. The teams working on this new product have made significant progress bringing the vision to life. Our TriumphPay team has successfully built the initial version of the wallet application, while TBK Bank has successfully been implemented as the sponsor and issuing bank for the program with our technology partners.
For those familiar with fintech applications, it is common that the fintech has no relation to the sponsor and issuing bank other than that partner bank is somehow integrated into their technology stack. While this letter is not the place to discuss the challenges with this model playing out in the broader market, it is worth pointing out the benefits of having the fintech and the bank sharing common ownership, aligned objectives and similar regulatory oversight and controls. In the model we are employing, we are able to ensure that the product is compelling and tailored to the transportation industry, that we are ensuring customer accounts are legitimate, that funds are safeguarded, and that the economics largely remain with TFIN. The latter point is worth reiterating; the float generated on the deposits in LoadPay and the interchange generated on the TBK Bank-issued business debit cards are expected to create meaningful economics at scale.
More specifically, on our progress to-date, LoadPay has launched to a small group of carriers to ensure our teams and customers are confident in the product before scaling up to a broad launch planned early next year. We are very excited with the early feedback and results. Given that TriumphPay is the source of truth for remittance of invoices and is connected to LoadPay for paying those invoices instantly, we are able to monitor the entire invoice lifecycle very closely from initial load tendering, through approved payable, to completed payments. While just a portion of the value proposition to carriers, one of the more exciting aspects for this initial group of users is seeing these carriers being paid hours or days faster than they would have been leveraging the standard ACH and wire infrastructure. We have already paid carriers on weekends, at night and on holidays. Because the entire ecosystem lives on our balance sheet, Triumph Financial is capturing the value of the float even though the carriers have immediate access to their funds.
Our plan includes a robust roadmap for LoadPay to evolve it into an entire suite of banking and financial products for carriers of all sizes. This roadmap will require the ongoing investment that we have previously outlined. We believe that the features and functionality will drive the unit economics to increasingly attractive levels which will provide a high return on our investment. As one specific example, there is a desire from our broker and factor customers to help facilitate cash advances that have long plagued the industry due to the requisite manual processes and susceptibility for fraud. These cash advances are generally offset from the linehaul amount of a tendered load and are used for a number of immediate needs, such as to pay for the fuel required to haul a load. Using the data and integrations of the TriumphPay network, paired with the instant and 24x7x365 abilities of LoadPay, these advances will generate additional fee income (in addition to the float and interchange revenue mentioned earlier) while removing friction and fraud for everyone involved. There are transformational extensions of this functionality that the industry can expect from LoadPay where the breadth and depth of data within the TriumphPay network also allows for an ability to create monetization opportunities via lines of credit for carriers based on their history of payments versus traditional credit bureau decisioning.
There is more we are working on within LoadPay that I will refrain from outlining at this time due to competitive reasons, but I can sum up our view by saying the future prospects of LoadPay are bright.
Factoring
1.Analysis of financial and operational performance for the quarter.
2.Transportation market update.
3.Technology and FaaS update.
Analysis of financial and operational performance for the quarter. During the second quarter, our average transportation invoice price dropped to $1,738, down $35 from the same quarter in 2023 and decreased $33 from the first quarter of 2024. Purchased volume increased 2.9% relative to the first quarter. Through the date of the publishing of this letter, average transportation invoice sizes for July are $1,796. This feels encouraging and we very much hope it continues.
Factoring segment operating income was $4.6 million, or $2.5 million lower than the prior quarter. This was primarily due to expense increases related to (i) technology investment, (ii) an increase in legal expenses and (iii) moderate credit costs. Net interest income grew just over 5% as higher purchasing activity was offset by lower average invoice prices through most of the quarter. Yield on average receivables balances were up, rising 0.16% to 14.14%. Despite the increase in credit costs, charge-offs were only a few basis points higher than the prior quarter at 0.15% and this level of losses remains modest for the severity and length of the freight recession. We have always maintained that this business, when operating as designed, will generally experience greater revenue volatility during a freight recession (which you can see) than materially increased credit risk.
Transportation Market Update. The transportation industry seemed to level out in the second quarter for the factoring division. While capacity continued a slow contraction, it appears we have established a floor. Despite seasonal impacts and events, we generally saw a slight increase in invoice amounts, transactions, and dollars factored by client, all of which are signs of a more level market than we’ve seen in a couple years.
The average invoice baseline was low going in and maintained that level more than halfway through the quarter. We noticed an uptick going into the Memorial weekend holiday and again approaching July 4th. The pattern is very similar to what we saw at the tail-end of Q4 2023 when capacity came out for the holidays and weather disruptions created stress on the remaining capacity in the system.
The small carrier segment is still taking the brunt of the recession. We lost 2.5% of our small carrier clients QoQ, and the average invoice for this segment was flat. For those carriers locked into the spot market, the average invoice hit a low watermark of $1,296 mid-April and recovered to $1,399 by the end of June. In contrast, our carrier clients with a greater percentage of their freight in the contract space ranged from $1,998 in mid-April to $2,158 by the end of the quarter. A portion of the increase was due to the price of fuel. During the quarter, fuel rebounded up 4% starting mid-June after consecutive weeks of lower prices. Since the average invoice is tracking with fuel, the carriers are beginning to see some pricing power which hasn’t happened since late Q4 2023 and early Q1 2024.
Across all our carrier segments, we did see an increase in purchase volume by dollars of 2.9%, while purchases per client were up 10.4%, and total transactions increased by 4.7%. Since the improvement was late in the quarter and impacted by holidays and seasonality, we are not yet prepared to call an end to the freight recession as we saw similar patterns impact the space in early January of this year.
Carrier capacity continues to leave the market, and we are starting to see the pressures of the environment affect even solid and seasoned operators. However, capacity is still not exiting quickly enough and some sources I see assert current attrition rates won’t reach 2019 levels of capacity until late Q4 of this year. Translated, that means carriers continue to operate below breakeven. Raymond James published the chart below on July, 9th, 2024, and I think it demonstrates the issue facing carriers today.
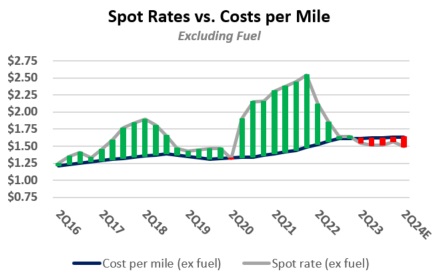
Source: American Transportation Research Institute, DAT Trendlines, Internet Truckstop, U.S. Energy Information Administration, Raymond James Estimates
Technology and FaaS Update. In Q3 2023, we mentioned our focus on investing in our proprietary factor management software (“FMS”) , known as Delta. The purpose behind upgrading our system was to make it better for us and for our clients. A second and related purpose was to make sure it seamlessly connected to the TriumphPay network. A third purpose was to equip it (and our team) to offer certain back-office factoring services to the industry. FaaS development work continues, and we expect a formal rollout early next year.
Consistent with that thinking, we have continued to update and enhance Delta. We benefit in that work from the subject matter expertise of our industry veterans to improve the internal user experience while increasing efficiency and reducing risk. Equally important, the technology team has completed necessary upgrades to achieve solid resiliency, improved security, and some innovative enhancements.
Those technology enhancements comprise investment in three additional areas. First, we are focused on our supply chain finance offering ("SCF"). Development and integration with various transportation management system (“TMS”) providers is underway to improve the broker-client experience.
Additionally, Delta enhancements have been completed improving the internal user experience and creating operational efficiencies for our clients. This work benefits existing broker clients while creating an even more compelling offering for future clients.
Second, we have upgraded the MyTriumph client portal providing our carrier clients additional tools and account visibility. These enhancements address various customer requests. In doing so, we completed the work so that the MyTriumph portal could be white-labeled in the name of other parties who desire to use our FaaS offering.
Last, but certainly not least, is the rollout of what we believe to be the best-in-class decisioning model to make autonomous invoice purchase decisions. We call this “instant purchase” because the machine can make purchasing decisions instantly. At the core of this technology is an AI-based machine learning model. This has been developed internally and thoroughly backtested using our historical performance data. When augmented with TriumphPay integrated data, the machines are able to make purchase decisions in seconds without human interaction. The model observes various behaviors and trends which are markers for fraud. We couple that with data from our proprietary risk management program developed over the last 15 years. The model is now running in a pilot phase with roughly 600 clients today. Once fully released, we will see improved efficiency in our daily operations, and in conjunction with LoadPay, the ability to fund our clients instantly around the clock, regardless of bank hours and ACH windows. We expect that this technology will also be available for FaaS clients in 2025. The implications for efficiency and scale are very exciting.
Banking
For discussion of our Banking segment, we will cover the following topics:
1.Analysis of financial and operational performance for the quarter.
2.Credit update.
Analysis of financial and operational performance for the quarter. Bank segment operating income rose $2.1 million, or 7.5% from the prior quarter due primarily to lower credit expense. Net interest income grew slightly as modestly higher lending balances and yields were largely offset by higher marginal funding costs. Our core deposit base was up slightly for the quarter as our cost of funds crept higher, rising 17 basis points to 1.62%. The increase in our cost of funds was driven by the marginal cost of additional wholesale deposits which were used to fund asset growth and add cash to our balance sheet. The cost of our core deposit base was flat to prior quarter.
Credit Update. Credit expense was lower than the prior two quarters but remained elevated relative to our long-term averages and expectations. Virtually all of our credit expense was driven by our transportation related exposure (i.e., factoring and equipment finance). In factoring, a variety of small unrelated events led to the increase in credit costs. In equipment finance, we had no large charge-offs or specific reserves, but we continued to build reserves in recognition of the stress that carriers are enduring as the freight recession lingers.
Beyond our transportation-related exposure, our credit performance and outlook remain steady. In CRE, there were no new material modifications, and borrowers continued to perform as expected. In liquid credit, we have made progress in de-risking the portfolio and did not incur any significant new credit costs this quarter. We have a few credits we continue to monitor closely, but overall, we feel that we have repositioned the portfolio away from the risks associated with its 2021-22 vintages.
Second quarter earnings were as expected in light of the now 30th month of a freight recession. However, it also included some significant wins for Triumph that will create future shareholder value. As I said in my opening remarks last quarter, unless and until seasonal patterns change, I do not see the outlook for earnings changing through year-end. We will continue to accrue capital and watch for opportunities to deploy it. Our pipeline remains full, and I remain excited about our long-term momentum and our ability to win.
With warm regards and our eyes fixed firmly on the horizon,
Aaron P. Graft Founder, Vice Chairman & CEO
[1] We define network engagement as the amount of freight touched through our payments, audit or full AP automation products. It is an indicator of our broker volume density in the market, the source for growing available network transactions, and a key value driver for factors on the network.
[2] This reference to brokered freight is specific to domestic truckload (“TL”) freight only. Thus, this calculation would exclude less than truckload ("LTL"), parcel, etc. It would also exclude shipper volumes. Admittedly, this is a difficult percentage to calculate with precision, and it will move from year to year. That being said, we can evaluate the number of payments received in our factoring segment as a proxy for the percentage of TL freight TriumphPay is touching and also use industry data points to make informed assumptions. In the end, this goal is not intended to be a precise measurement in the same way as we would measure earnings. It is a directional and blunt measurement of the reach of the Payments network.
[3] Average invoice sizes in our payments segment are generally smaller than average invoice sizes in our factoring segment as a transportation factor generally will only factor long-haul trucking invoices. Less than truckload ("LTL") and parcel typically are not regularly serviced by the transportation factoring industry due to their small ticket size. Our payments business pays all transportation invoices of a freight broker and as such includes some LTL, parcel and shorter hauls that a transportation factor normally will not service.
[4] Recurring cohort revenue is defined as quickpay revenue and fee revenue attributable to clients onboarded in the annual cohorts shown. It does not include nonrecurring fees or gains, float revenue, or other supply chain finance income aside from quickpays.
[5] Float revenue in TriumphPay is generated on the net remaining float after funding balance sheet exposure in the payments segment. Float balances in TriumphPay at 6/30/2024 were $328 million. Net float balances were $156 million.
[6] Annualized and annual TriumphPay revenue, noninterest income and EBITDA presentations, where footnoted, exclude a $7.0 million net gain on minority investment mark-to-market in the second quarter of 2022.
Conference Call Information
Aaron P. Graft, Vice Chairman and CEO, and Brad Voss, CFO, will review the financial results in a conference call with investors and analysts beginning at 9:30 a.m. central time on Thursday, July 18, 2024.
The live video conference option may be accessed directly through this link, https://triumph-financial-inc-earnings-q2fy24.open-exchange.net/ or via the Company's website at tfin.com through the News & Events, Events & Presentations links. Alternatively, a live conference call option is available by dialing 1-833-928-4610 (International: +1-800-456-1369) requesting to be joined to meeting ID 990 4360 5777 at the prompt. An archive of this conference call will subsequently be available at this same location, referenced above, on the Company’s website.
About Triumph Financial
Triumph Financial, Inc. (Nasdaq: TFIN) is a financial holding company focused on payments, factoring and banking. Headquartered in Dallas, Texas, its diversified portfolio of brands includes TriumphPay, Triumph and TBK Bank. www.tfin.com
Forward-Looking Statements
This letter to shareholders contains forward-looking statements. Any statements about our expectations, beliefs, plans, predictions, forecasts, objectives, assumptions or future events or performance are not historical facts and may be forward-looking. You can identify forward-looking statements by the use of forward-looking terminology such as “believes,” “expects,” “could,” “may,” “will,” “should,” “seeks,” “likely,” “intends,” “plans,” “pro forma,” “projects,” “estimates” or “anticipates” or the negative of these words and phrases or similar words or phrases that are predictions of or indicate future events or trends and that do not relate solely to historical matters. You can also identify forward-looking statements by discussions of strategy, plans or intentions. Forward-looking statements involve numerous risks and uncertainties and you should not rely on them as predictions of future events. Forward-looking statements depend on assumptions, data or methods that may be incorrect or imprecise and we may not be able to realize them. We do not guarantee that the transactions and events described will happen as described (or that they will happen at all). The following factors, among others, could cause actual results and future events to differ materially from those set forth or contemplated in the forward-looking statements: business and economic conditions generally and in the bank and non-bank financial services industries, nationally and within our local market areas; our ability to mitigate our risk exposures; our ability to maintain our historical earnings trends; changes in management personnel; interest rate risk; concentration of our products and services in the transportation industry; credit risk associated with our loan portfolio; lack of seasoning in our loan portfolio; deteriorating asset quality and higher loan charge-offs; time and effort necessary to resolve nonperforming assets; inaccuracy of the assumptions and estimates we make in establishing reserves for probable loan losses and other estimates; risks related to the integration of acquired businesses and any future acquisitions; our ability to successfully identify and address the risks associated with our possible future acquisitions, and the risks that our prior and possible future acquisitions make it more difficult for investors to evaluate our business, financial condition and results of operations, and impairs our ability to accurately forecast our future performance; lack of liquidity; fluctuations in the fair value and liquidity of the securities we hold for sale; impairment of investment securities, goodwill, other intangible assets or deferred tax assets; our risk management strategies; environmental liability associated with our lending activities; increased competition in the bank and non-bank financial services industries, nationally, regionally or locally, which may adversely affect pricing and terms; the accuracy of our financial statements and related disclosures; material weaknesses in our internal control over financial reporting; system failures or failures to prevent breaches of our network security; the institution and outcome of litigation and other legal proceedings against us or to which we become subject; changes in carry-forwards of net operating losses; changes in federal tax law or policy; the impact of recent and future legislative and regulatory changes, including changes in banking, securities and tax laws and regulations, such as the Dodd-Frank Act and their application by our regulators; governmental monetary and fiscal policies; changes in the scope and cost of FDIC, insurance and other coverages; failure to receive regulatory approval for future acquisitions and increases in our capital requirements.
While forward-looking statements reflect our good-faith beliefs, they are not guarantees of future performance. All forward-looking statements are necessarily only estimates of future results. Accordingly, actual results may differ materially from those expressed in or contemplated by the particular forward-looking statement, and, therefore, you are cautioned not to place undue reliance on such statements. Further, any forward-looking statement speaks only as of the date on which it is made, and we undertake no obligation to update any forward-looking statement to reflect events or circumstances after the date on which the statement is made or to reflect the occurrence of unanticipated events or circumstances, except as required by applicable law. For a discussion of such risks and uncertainties, which could cause actual results to differ from those contained in the forward-looking statements, see "Risk Factors" and the forward-looking statement disclosure contained in Triumph Financial’s Annual Report on Form 10-K, filed with the Securities and Exchange Commission on February 13, 2024.
Non-GAAP Financial Measures
This letter to shareholders includes certain non‐GAAP financial measures intended to supplement, not substitute for, comparable GAAP measures. Reconciliations of non‐GAAP financial measures to GAAP financial measures are provided at the end of this letter to shareholders.
The following table sets forth key metrics used by Triumph Financial to monitor our operations. Footnotes in this table can be found in our definitions of non-GAAP financial measures at the end of this document.
|
|
|
|
|
|
|
|
|
|
|
|
|
|
|
|
|
|
|
|
|
|
|
|
|
|
|
|
|
|
|
|
|
|
|
|
|
|
|
|
|
|
|
As of and for the Three Months Ended |
|
As of and for the Six Months Ended |
| (Dollars in thousands) |
June 30,
2024 |
|
March 31,
2024 |
|
December 31,
2023 |
|
September 30,
2023 |
|
June 30,
2023 |
|
June 30,
2024 |
|
June 30,
2023 |
| Financial Highlights: |
|
|
|
|
|
|
|
|
|
|
|
|
|
| Total assets |
$ |
5,783,334 |
|
|
$ |
5,575,493 |
|
|
$ |
5,347,334 |
|
|
$ |
5,599,794 |
|
|
$ |
5,652,721 |
|
|
$ |
5,783,334 |
|
|
$ |
5,652,721 |
|
| Loans held for investment |
$ |
4,288,417 |
|
|
$ |
4,195,120 |
|
|
$ |
4,163,100 |
|
|
$ |
4,371,528 |
|
|
$ |
4,324,758 |
|
|
$ |
4,288,417 |
|
|
$ |
4,324,758 |
|
| Deposits |
$ |
4,392,018 |
|
|
$ |
4,450,963 |
|
|
$ |
3,977,478 |
|
|
$ |
4,487,051 |
|
|
$ |
4,293,466 |
|
|
$ |
4,392,018 |
|
|
$ |
4,293,466 |
|
| Net income available to common stockholders |
$ |
1,945 |
|
|
$ |
3,357 |
|
|
$ |
8,825 |
|
|
$ |
11,993 |
|
|
$ |
6,848 |
|
|
$ |
5,302 |
|
|
$ |
17,057 |
|
|
|
|
|
|
|
|
|
|
|
|
|
|
|
| Performance Ratios - Annualized: |
|
|
|
|
|
|
|
|
|
|
|
|
|
| Return on average assets |
0.19 |
% |
|
0.31 |
% |
|
0.70 |
% |
|
0.93 |
% |
|
0.56 |
% |
|
0.25 |
% |
|
0.70 |
% |
| Return on average total equity |
1.26 |
% |
|
1.90 |
% |
|
4.40 |
% |
|
5.95 |
% |
|
3.64 |
% |
|
1.58 |
% |
|
4.43 |
% |
| Return on average common equity |
0.94 |
% |
|
1.62 |
% |
|
4.25 |
% |
|
5.89 |
% |
|
3.45 |
% |
|
1.28 |
% |
|
4.27 |
% |
Return on average tangible common equity (1) |
1.35 |
% |
|
2.33 |
% |
|
6.20 |
% |
|
8.70 |
% |
|
5.16 |
% |
|
1.84 |
% |
|
6.37 |
% |
Yield on loans(2) |
9.10 |
% |
|
9.09 |
% |
|
9.29 |
% |
|
9.16 |
% |
|
9.14 |
% |
|
9.10 |
% |
|
9.18 |
% |
| Cost of interest bearing deposits |
2.34 |
% |
|
1.99 |
% |
|
1.84 |
% |
|
1.83 |
% |
|
1.13 |
% |
|
2.17 |
% |
|
0.85 |
% |
| Cost of total deposits |
1.39 |
% |
|
1.17 |
% |
|
1.11 |
% |
|
1.15 |
% |
|
0.68 |
% |
|
1.28 |
% |
|
0.50 |
% |
| Cost of total funds |
1.62 |
% |
|
1.45 |
% |
|
1.47 |
% |
|
1.41 |
% |
|
1.23 |
% |
|
1.54 |
% |
|
0.97 |
% |
Net interest margin(2) |
7.07 |
% |
|
7.29 |
% |
|
7.55 |
% |
|
7.48 |
% |
|
7.57 |
% |
|
7.18 |
% |
|
7.82 |
% |
| Net noninterest expense to average assets |
5.67 |
% |
|
5.62 |
% |
|
5.29 |
% |
|
5.28 |
% |
|
5.79 |
% |
|
5.64 |
% |
|
5.88 |
% |
|
|
|
|
|
|
|
|
|
|
|
|
|
|
| Efficiency ratio |
92.64 |
% |
|
89.45 |
% |
|
82.24 |
% |
|
82.36 |
% |
|
87.80 |
% |
|
91.07 |
% |
|
86.65 |
% |
|
|
|
|
|
|
|
|
|
|
|
|
|
|
|
|
|
|
|
|
|
|
|
|
|
|
|
|
Asset Quality:(3) |
|
|
|
|
|
|
|
|
|
|
|
|
|
| Past due to total loans |
2.21 |
% |
|
1.90 |
% |
|
2.00 |
% |
|
1.94 |
% |
|
1.55 |
% |
|
2.21 |
% |
|
1.55 |
% |
| Non-performing loans to total loans |
1.94 |
% |
|
1.98 |
% |
|
1.65 |
% |
|
1.22 |
% |
|
0.74 |
% |
|
1.94 |
% |
|
0.74 |
% |
| Non-performing assets to total assets |
1.60 |
% |
|
1.61 |
% |
|
1.42 |
% |
|
1.07 |
% |
|
0.68 |
% |
|
1.60 |
% |
|
0.68 |
% |
| ACL to non-performing loans |
47.48 |
% |
|
45.93 |
% |
|
51.15 |
% |
|
65.33 |
% |
|
109.41 |
% |
|
47.48 |
% |
|
109.41 |
% |
| ACL to total loans |
0.92 |
% |
|
0.91 |
% |
|
0.85 |
% |
|
0.80 |
% |
|
0.81 |
% |
|
0.92 |
% |
|
0.81 |
% |
| Net charge-offs to average loans |
0.06 |
% |
|
0.05 |
% |
|
0.13 |
% |
|
0.03 |
% |
|
0.25 |
% |
|
0.11 |
% |
|
0.31 |
% |
|
|
|
|
|
|
|
|
|
|
|
|
|
|
| Capital: |
|
|
|
|
|
|
|
|
|
|
|
|
|
Tier 1 capital to average assets(4) |
12.38 |
% |
|
12.99 |
% |
|
12.64 |
% |
|
12.36 |
% |
|
12.01 |
% |
|
12.38 |
% |
|
12.01 |
% |
Tier 1 capital to risk-weighted assets(4) |
13.45 |
% |
|
13.62 |
% |
|
13.74 |
% |
|
12.90 |
% |
|
12.68 |
% |
|
13.45 |
% |
|
12.68 |
% |
Common equity tier 1 capital to risk-weighted assets(4) |
11.71 |
% |
|
11.85 |
% |
|
11.94 |
% |
|
11.18 |
% |
|
10.93 |
% |
|
11.71 |
% |
|
10.93 |
% |
| Total capital to risk-weighted assets |
16.51 |
% |
|
16.69 |
% |
|
16.75 |
% |
|
15.77 |
% |
|
15.59 |
% |
|
16.51 |
% |
|
15.59 |
% |
| Total equity to total assets |
15.12 |
% |
|
15.65 |
% |
|
16.17 |
% |
|
15.19 |
% |
|
14.74 |
% |
|
15.12 |
% |
|
14.74 |
% |
Tangible common stockholders' equity to tangible assets(1) |
10.39 |
% |
|
10.71 |
% |
|
11.04 |
% |
|
10.21 |
% |
|
9.75 |
% |
|
10.39 |
% |
|
9.75 |
% |
|
|
|
|
|
|
|
|
|
|
|
|
|
|
| Per Share Amounts: |
|
|
|
|
|
|
|
|
|
|
|
|
|
| Book value per share |
$ |
35.51 |
|
|
$ |
35.45 |
|
|
$ |
35.16 |
|
|
$ |
34.58 |
|
|
$ |
33.88 |
|
|
$ |
35.51 |
|
|
$ |
33.88 |
|
Tangible book value per share (1) |
$ |
24.60 |
|
|
$ |
24.42 |
|
|
$ |
24.12 |
|
|
$ |
23.41 |
|
|
$ |
22.58 |
|
|
$ |
24.60 |
|
|
$ |
22.58 |
|
| Basic earnings per common share |
$ |
0.08 |
|
|
$ |
0.14 |
|
|
$ |
0.38 |
|
|
$ |
0.52 |
|
|
$ |
0.30 |
|
|
$ |
0.23 |
|
|
$ |
0.73 |
|
| Diluted earnings per common share |
$ |
0.08 |
|
|
$ |
0.14 |
|
|
$ |
0.37 |
|
|
$ |
0.51 |
|
|
$ |
0.29 |
|
|
$ |
0.22 |
|
|
$ |
0.72 |
|
|
|
|
|
|
|
|
|
|
|
|
|
|
|
| Shares outstanding end of period |
23,353,519 |
|
|
23,334,997 |
|
|
23,302,414 |
|
|
23,291,693 |
|
|
23,269,885 |
|
|
23,353,519 |
|
|
23,269,885 |
|
Unaudited consolidated balance sheet as of:
|
|
|
|
|
|
|
|
|
|
|
|
|
|
|
|
|
|
|
|
|
|
|
|
|
|
|
|
|
|
| (Dollars in thousands) |
June 30,
2024 |
|
March 31,
2024 |
|
December 31,
2023 |
|
September 30,
2023 |
|
June 30,
2023 |
| ASSETS |
|
|
|
|
|
|
|
|
|
| Total cash and cash equivalents |
$ |
500,663 |
|
|
$ |
417,033 |
|
|
$ |
286,635 |
|
|
$ |
337,583 |
|
|
$ |
417,375 |
|
| Securities - available for sale |
339,661 |
|
|
320,101 |
|
|
299,644 |
|
|
292,324 |
|
|
303,779 |
|
| Securities - held to maturity, net |
2,787 |
|
|
3,010 |
|
|
2,977 |
|
|
3,311 |
|
|
3,380 |
|
| Equity securities with readily determinable fair value |
4,422 |
|
|
4,441 |
|
|
4,488 |
|
|
4,289 |
|
|
4,426 |
|
| Loans held for sale |
1,051 |
|
|
3,712 |
|
|
1,236 |
|
|
6,416 |
|
|
95 |
|
| Loans held for investment |
4,288,417 |
|
|
4,195,120 |
|
|
4,163,100 |
|
|
4,371,528 |
|
|
4,324,758 |
|
| Allowance for credit losses |
(39,591) |
|
|
(38,232) |
|
|
(35,219) |
|
|
(34,815) |
|
|
(34,970) |
|
| Loans, net |
4,248,826 |
|
|
4,156,888 |
|
|
4,127,881 |
|
|
4,336,713 |
|
|
4,289,788 |
|
| FHLB and other restricted stock |
14,040 |
|
|
4,764 |
|
|
14,278 |
|
|
10,101 |
|
|
20,099 |
|
| Premises and equipment, net |
159,588 |
|
|
162,544 |
|
|
113,457 |
|
|
113,062 |
|
|
114,673 |
|
| Capitalized software, net |
30,582 |
|
|
26,435 |
|
|
22,365 |
|
|
19,451 |
|
|
15,826 |
|
| Goodwill |
233,709 |
|
|
233,709 |
|
|
233,709 |
|
|
233,709 |
|
|
233,709 |
|
| Intangible assets, net |
20,943 |
|
|
23,842 |
|
|
23,646 |
|
|
26,400 |
|
|
29,249 |
|
| Bank-owned life insurance |
42,225 |
|
|
42,077 |
|
|
41,946 |
|
|
41,822 |
|
|
41,702 |
|
| Deferred tax asset, net |
6,641 |
|
|
7,946 |
|
|
8,800 |
|
|
9,594 |
|
|
7,306 |
|
| Other assets |
178,196 |
|
|
168,991 |
|
|
166,272 |
|
|
165,019 |
|
|
171,314 |
|
| Total assets |
$ |
5,783,334 |
|
|
$ |
5,575,493 |
|
|
$ |
5,347,334 |
|
|
$ |
5,599,794 |
|
|
$ |
5,652,721 |
|
| LIABILITIES |
|
|
|
|
|
|
|
|
|
| Noninterest bearing deposits |
$ |
1,689,531 |
|
|
$ |
1,747,544 |
|
|
$ |
1,632,022 |
|
|
$ |
1,632,559 |
|
|
$ |
1,608,411 |
|
| Interest bearing deposits |
2,702,487 |
|
|
2,703,419 |
|
|
2,345,456 |
|
|
2,854,492 |
|
|
2,685,055 |
|
| Total deposits |
4,392,018 |
|
|
4,450,963 |
|
|
3,977,478 |
|
|
4,487,051 |
|
|
4,293,466 |
|
|
|
|
|
|
|
|
|
|
|
| Federal Home Loan Bank advances |
280,000 |
|
|
30,000 |
|
|
255,000 |
|
|
30,000 |
|
|
280,000 |
|
| Subordinated notes |
108,939 |
|
|
108,807 |
|
|
108,678 |
|
|
108,454 |
|
|
108,234 |
|
| Junior subordinated debentures |
42,042 |
|
|
41,889 |
|
|
41,740 |
|
|
41,592 |
|
|
41,444 |
|
| Other liabilities |
86,086 |
|
|
71,495 |
|
|
100,038 |
|
|
82,315 |
|
|
96,111 |
|
| Total liabilities |
4,909,085 |
|
|
4,703,154 |
|
|
4,482,934 |
|
|
4,749,412 |
|
|
4,819,255 |
|
| EQUITY |
|
|
|
|
|
|
|
|
|
| Preferred Stock |
45,000 |
|
|
45,000 |
|
|
45,000 |
|
|
45,000 |
|
|
45,000 |
|
| Common stock |
291 |
|
|
290 |
|
|
290 |
|
|
290 |
|
|
289 |
|
| Additional paid-in-capital |
559,072 |
|
|
555,613 |
|
|
550,743 |
|
|
547,212 |
|
|
542,565 |
|
| Treasury stock, at cost |
(268,352) |
|
|
(265,119) |
|
|
(265,038) |
|
|
(265,016) |
|
|
(264,916) |
|
| Retained earnings |
541,633 |
|
|
539,688 |
|
|
536,331 |
|
|
527,506 |
|
|
515,513 |
|
| Accumulated other comprehensive income (loss) |
(3,395) |
|
|
(3,133) |
|
|
(2,926) |
|
|
(4,610) |
|
|
(4,985) |
|
| Total stockholders' equity |
874,249 |
|
|
872,339 |
|
|
864,400 |
|
|
850,382 |
|
|
833,466 |
|
| Total liabilities and equity |
$ |
5,783,334 |
|
|
$ |
5,575,493 |
|
|
$ |
5,347,334 |
|
|
$ |
5,599,794 |
|
|
$ |
5,652,721 |
|
Unaudited consolidated statement of income:
|
|
|
|
|
|
|
|
|
|
|
|
|
|
|
|
|
|
|
|
|
|
|
|
|
|
|
|
|
|
|
|
|
|
|
|
|
|
|
|
|
|
|
For the Three Months Ended |
|
For the Six Months Ended |
| (Dollars in thousands) |
June 30,
2024 |
|
March 31,
2024 |
|
December 31,
2023 |
|
September 30,
2023 |
|
June 30,
2023 |
|
June 30,
2024 |
|
June 30,
2023 |
| Interest income: |
|
|
|
|
|
|
|
|
|
|
|
|
|
| Loans, including fees |
$ |
54,900 |
|
|
$ |
53,552 |
|
|
$ |
58,963 |
|
|
$ |
59,669 |
|
|
$ |
57,258 |
|
|
$ |
108,452 |
|
|
$ |
109,796 |
|
| Factored receivables, including fees |
40,028 |
|
|
37,909 |
|
|
40,723 |
|
|
39,161 |
|
|
39,819 |
|
|
77,937 |
|
|
80,723 |
|
| Securities |
5,523 |
|
|
5,351 |
|
|
5,243 |
|
|
5,205 |
|
|
5,234 |
|
|
10,874 |
|
|
9,347 |
|
| FHLB and other restricted stock |
234 |
|
|
232 |
|
|
289 |
|
|
397 |
|
|
219 |
|
|
466 |
|
|
344 |
|
| Cash deposits |
6,330 |
|
|
4,903 |
|
|
3,510 |
|
|
3,101 |
|
|
2,956 |
|
|
11,233 |
|
|
5,950 |
|
| Total interest income |
107,015 |
|
|
101,947 |
|
|
108,728 |
|
|
107,533 |
|
|
105,486 |
|
|
208,962 |
|
|
206,160 |
|
| Interest expense: |
|
|
|
|
|
|
|
|
|
|
|
|
|
| Deposits |
15,520 |
|
|
12,152 |
|
|
11,765 |
|
|
12,474 |
|
|
6,877 |
|
|
27,672 |
|
|
10,079 |
|
| Subordinated notes |
1,225 |
|
|
1,224 |
|
|
1,317 |
|
|
1,315 |
|
|
1,312 |
|
|
2,449 |
|
|
2,621 |
|
| Junior subordinated debentures |
1,162 |
|
|
1,184 |
|
|
1,156 |
|
|
1,169 |
|
|
1,090 |
|
|
2,346 |
|
|
2,124 |
|
| Other borrowings |
1,193 |
|
|
1,352 |
|
|
2,571 |
|
|
1,248 |
|
|
4,756 |
|
|
2,545 |
|
|
6,503 |
|
| Total interest expense |
19,100 |
|
|
15,912 |
|
|
16,809 |
|
|
16,206 |
|
|
14,035 |
|
|
35,012 |
|
|
21,327 |
|
| Net interest income |
87,915 |
|
|
86,035 |
|
|
91,919 |
|
|
91,327 |
|
|
91,451 |
|
|
173,950 |
|
|
184,833 |
|
| Credit loss expense (benefit) |
4,155 |
|
|
5,896 |
|
|
6,135 |
|
|
812 |
|
|
2,643 |
|
|
10,051 |
|
|
5,256 |
|
| Net interest income after credit loss expense (benefit) |
83,760 |
|
|
80,139 |
|
|
85,784 |
|
|
90,515 |
|
|
88,808 |
|
|
163,899 |
|
|
179,577 |
|
| Noninterest income: |
|
|
|
|
|
|
|
|
|
|
|
|
|
| Service charges on deposits |
1,810 |
|
|
1,727 |
|
|
1,791 |
|
|
1,728 |
|
|
1,769 |
|
|
3,537 |
|
|
3,482 |
|
| Card income |
2,085 |
|
|
1,868 |
|
|
2,029 |
|
|
2,065 |
|
|
2,119 |
|
|
3,953 |
|
|
4,087 |
|
| Net gains (losses) on sale of securities |
— |
|
|
— |
|
|
97 |
|
|
5 |
|
|
— |
|
|
— |
|
|
— |
|
| Net gains (losses) on sale of loans |
123 |
|
|
(192) |
|
|
(87) |
|
|
203 |
|
|
87 |
|
|
(69) |
|
|
3 |
|
| Fee income |
8,517 |
|
|
8,683 |
|
|
8,525 |
|
|
8,108 |
|
|
7,462 |
|
|
17,200 |
|
|
13,612 |
|
| Insurance commissions |
1,505 |
|
|
1,568 |
|
|
1,058 |
|
|
1,074 |
|
|
1,303 |
|
|
3,073 |
|
|
2,896 |
|
| Other |
3,127 |
|
|
1,345 |
|
|
817 |
|
|
227 |
|
|
(1,229) |
|
|
4,472 |
|
|
(1,547) |
|
| Total noninterest income |
17,167 |
|
|
14,999 |
|
|
14,230 |
|
|
13,410 |
|
|
11,511 |
|
|
32,166 |
|
|
22,533 |
|
| Noninterest expense: |
|
|
|
|
|
|
|
|
|
|
|
|
|
| Salaries and employee benefits |
56,005 |
|
|
54,185 |
|
|
50,818 |
|
|
50,884 |
|
|
54,219 |
|
|
110,190 |
|
|
108,905 |
|
| Occupancy, furniture and equipment |
8,565 |
|
|
7,636 |
|
|
7,348 |
|
|
7,542 |
|
|
7,292 |
|
|
16,201 |
|
|
13,995 |
|
| FDIC insurance and other regulatory assessments |
641 |
|
|
653 |
|
|
656 |
|
|
682 |
|
|
868 |
|
|
1,294 |
|
|
1,286 |
|
| Professional fees |
4,558 |
|
|
3,541 |
|
|
3,116 |
|
|
3,941 |
|
|
3,035 |
|
|
8,099 |
|
|
6,120 |
|
| Amortization of intangible assets |
2,869 |
|
|
2,724 |
|
|
2,754 |
|
|
2,849 |
|
|
3,001 |
|
|
5,593 |
|
|
5,851 |
|
| Advertising and promotion |
2,008 |
|
|
1,214 |
|
|
1,901 |
|
|
1,839 |
|
|
1,629 |
|
|
3,222 |
|
|
3,001 |
|
| Communications and technology |
14,307 |
|
|
11,894 |
|
|
11,645 |
|
|
10,784 |
|
|
11,904 |
|
|
26,201 |
|
|
23,250 |
|
| Software amortization |
1,357 |
|
|
1,174 |
|
|
1,398 |
|
|
1,024 |
|
|
1,043 |
|
|
2,531 |
|
|
2,030 |
|
| Other |
7,033 |
|
|
7,350 |
|
|
7,662 |
|
|
6,714 |
|
|
7,405 |
|
|
14,383 |
|
|
15,239 |
|
| Total noninterest expense |
97,343 |
|
|
90,371 |
|
|
87,298 |
|
|
86,259 |
|
|
90,396 |
|
|
187,714 |
|
|
179,677 |
|
| Net income before income tax |
3,584 |
|
|
4,767 |
|
|
12,716 |
|
|
17,666 |
|
|
9,923 |
|
|
8,351 |
|
|
22,433 |
|
| Income tax expense |
837 |
|
|
609 |
|
|
3,089 |
|
|
4,872 |
|
|
2,273 |
|
|
1,446 |
|
|
3,773 |
|
| Net income |
$ |
2,747 |
|
|
$ |
4,158 |
|
|
$ |
9,627 |
|
|
$ |
12,794 |
|
|
$ |
7,650 |
|
|
$ |
6,905 |
|
|
$ |
18,660 |
|
| Dividends on preferred stock |
(802) |
|
|
(801) |
|
|
(802) |
|
|
(801) |
|
|
(802) |
|
|
(1,603) |
|
|
(1,603) |
|
| Net income available to common stockholders |
$ |
1,945 |
|
|
$ |
3,357 |
|
|
$ |
8,825 |
|
|
$ |
11,993 |
|
|
$ |
6,848 |
|
|
$ |
5,302 |
|
|
$ |
17,057 |
|
Earnings per share:
|
|
|
|
|
|
|
|
|
|
|
|
|
|
|
|
|
|
|
|
|
|
|
|
|
|
|
|
|
|
|
|
|
|
|
|
|
|
|
|
|
|
|
For the Three Months Ended |
|
Six Months Ended |
| (Dollars in thousands) |
June 30,
2024 |
|
March 31,
2024 |
|
December 31,
2023 |
|
September 30,
2023 |
|
June 30,
2023 |
|
June 30,
2024 |
|
June 30,
2023 |
| Basic |
|
|
|
|
|
|
|
|
|
|
|
|
|
| Net income to common stockholders |
$ |
1,945 |
|
|
$ |
3,357 |
|
|
$ |
8,825 |
|
|
$ |
11,993 |
|
|
$ |
6,848 |
|
|
$ |
5,302 |
|
|
$ |
17,057 |
|
| Weighted average common shares outstanding |
23,274,089 |
|
|
23,201,259 |
|
|
23,171,751 |
|
|
23,162,614 |
|
|
23,138,835 |
|
|
23,237,674 |
|
|
23,249,668 |
|
| Basic earnings per common share |
$ |
0.08 |
|
|
$ |
0.14 |
|
|
$ |
0.38 |
|
|
$ |
0.52 |
|
|
$ |
0.30 |
|
|
$ |
0.23 |
|
|
$ |
0.73 |
|
|
|
|
|
|
|
|
|
|
|
|
|
|
|
| Diluted |
|
|
|
|
|
|
|
|
|
|
|
|
|
| Net income to common stockholders - diluted |
$ |
1,945 |
|
|
$ |
3,357 |
|
|
$ |
8,825 |
|
|
$ |
11,993 |
|
|
$ |
6,848 |
|
|
$ |
5,302 |
|
|
$ |
17,057 |
|
| Weighted average common shares outstanding |
23,274,089 |
|
|
23,201,259 |
|
|
23,171,751 |
|
|
23,162,614 |
|
|
23,138,835 |
|
|
23,237,674 |
|
|
23,249,668 |
|
| Dilutive effects of: |
|
|
|
|
|
|
|
|
|
|
|
|
|
| Assumed exercises of stock options |
86,645 |
|
|
87,567 |
|
|
82,463 |
|
|
82,909 |
|
|
71,658 |
|
|
86,905 |
|
|
73,884 |
|
| Restricted stock awards |
60,614 |
|
|
102,417 |
|
|
90,912 |
|
|
80,841 |
|
|
90,645 |
|
|
81,499 |
|
|
113,930 |
|
| Restricted stock units |
118,919 |
|
|
137,321 |
|
|
107,933 |
|
|
84,137 |
|
|
65,909 |
|
|
128,243 |
|
|
91,878 |
|
| Performance stock units - market based |
121,907 |
|
|
119,777 |
|
|
83,821 |
|
|
47,248 |
|
|
87,360 |
|
|
120,176 |
|
|
104,203 |
|
| Employee stock purchase plan |
2,931 |
|
|
1,921 |
|
|
798 |
|
|
1,165 |
|
|
1,064 |
|
|
2,426 |
|
|
780 |
|
| Weighted average shares outstanding - diluted |
23,665,105 |
|
|
23,650,262 |
|
|
23,537,678 |
|
|
23,458,914 |
|
|
23,455,471 |
|
|
23,656,923 |
|
|
23,634,343 |
|
| Diluted earnings per common share |
$ |
0.08 |
|
|
$ |
0.14 |
|
|
$ |
0.37 |
|
|
$ |
0.51 |
|
|
$ |
0.29 |
|
|
$ |
0.22 |
|
|
$ |
0.72 |
|
Shares that were not considered in computing diluted earnings per common share because they were antidilutive or have not met the thresholds to be considered in the dilutive calculation are as follows:
|
|
|
|
|
|
|
|
|
|
|
|
|
|
|
|
|
|
|
|
|
|
|
|
|
|
|
|
|
|
|
|
|
|
|
|
|
|
|
|
|
|
|
For the Three Months Ended |
|
Six Months Ended |
|
June 30,
2024 |
|
March 31,
2024 |
|
December 31,
2023 |
|
September 30,
2023 |
|
June 30,
2023 |
|
June 30,
2024 |
|
June 30,
2023 |
| Stock options |
77,520 |
|
|
45,764 |
|
|
100,818 |
|
|
101,138 |
|
|
107,309 |
|
|
61,644 |
|
|
107,309 |
|
| Restricted stock awards |
— |
|
|
— |
|
|
— |
|
|
— |
|
|
4,232 |
|
|
— |
|
|
4,232 |
|
| Restricted stock units |
7,500 |
|
|
7,500 |
|
|
7,500 |
|
|
11,250 |
|
|
11,250 |
|
|
7,500 |
|
|
11,250 |
|
| Performance stock units - market based |
55,677 |
|
|
— |
|
|
12,020 |
|
|
14,424 |
|
|
42,056 |
|
|
27,836 |
|
|
42,056 |
|
| Employee stock purchase plan |
— |
|
|
— |
|
|
— |
|
|
— |
|
|
— |
|
|
— |
|
|
— |
|
|
|
|
|
|
|
|
|
|
|
|
|
|
|
Loans held for investment summarized as of:
|
|
|
|
|
|
|
|
|
|
|
|
|
|
|
|
|
|
|
|
|
|
|
|
|
|
|
|
|
|
| (Dollars in thousands) |
June 30,
2024 |
|
March 31,
2024 |
|
December 31,
2023 |
|
September 30,
2023 |
|
June 30,
2023 |
| Commercial real estate |
$ |
842,342 |
|
|
$ |
819,721 |
|
|
$ |
812,704 |
|
|
$ |
817,064 |
|
|
$ |
768,711 |
|
| Construction, land development, land |
216,531 |
|
|
222,859 |
|
|
136,720 |
|
|
131,862 |
|
|
110,071 |
|
| 1-4 family residential properties |
128,508 |
|
|
130,200 |
|
|
125,916 |
|
|
129,588 |
|
|
130,628 |
|
| Farmland |
58,495 |
|
|
58,431 |
|
|
63,568 |
|
|
62,698 |
|
|
67,913 |
|
| Commercial |
1,092,280 |
|
|
1,160,870 |
|
|
1,170,365 |
|
|
1,251,939 |
|
|
1,218,892 |
|
| Factored receivables |
1,207,480 |
|
|
1,154,047 |
|
|
1,116,654 |
|
|
1,213,702 |
|
|
1,173,794 |
|
| Consumer |
7,596 |
|
|
7,176 |
|
|
8,326 |
|
|
8,166 |
|
|
8,409 |
|
| Mortgage warehouse |
735,185 |
|
|
641,816 |
|
|
728,847 |
|
|
756,509 |
|
|
846,340 |
|
| Total loans |
$ |
4,288,417 |
|
|
$ |
4,195,120 |
|
|
$ |
4,163,100 |
|
|
$ |
4,371,528 |
|
|
$ |
4,324,758 |
|
Our banking loan portfolio consists of traditional community bank loans as well as commercial finance product lines focused on businesses that require specialized financial solutions and national lending product lines that further diversify our lending operations.
Banking loans held for investment are further summarized below:
|
|
|
|
|
|
|
|
|
|
|
|
|
|
|
|
|
|
|
|
|
|
|
|
|
|
|
|
|
|
| (Dollars in thousands) |
June 30,
2024 |
|
March 31,
2024 |
|
December 31,
2023 |
|
September 30,
2023 |
|
June 30,
2023 |
| Commercial real estate |
$ |
842,342 |
|
|
$ |
819,721 |
|
|
$ |
812,704 |
|
|
$ |
817,064 |
|
|
$ |
768,711 |
|
| Construction, land development, land |
216,531 |
|
|
222,859 |
|
|
136,720 |
|
|
131,862 |
|
|
110,071 |
|
| 1-4 family residential |
128,508 |
|
|
130,200 |
|
|
125,916 |
|
|
129,588 |
|
|
130,628 |
|
| Farmland |
58,495 |
|
|
58,431 |
|
|
63,568 |
|
|
62,698 |
|
|
67,913 |
|
| Commercial - General |
294,670 |
|
|
308,145 |
|
|
303,332 |
|
|
306,430 |
|
|
295,204 |
|
| Commercial - Agriculture |
50,604 |
|
|
46,986 |
|
|
47,059 |
|
|
49,479 |
|
|
46,839 |
|
| Commercial - Equipment |
468,661 |
|
|
440,458 |
|
|
460,008 |
|
|
486,110 |
|
|
493,763 |
|
| Commercial - Asset-based lending |
203,634 |
|
|
260,043 |
|
|
246,065 |
|
|
271,623 |
|
|
231,265 |
|
| Commercial - Liquid Credit |
74,711 |
|
|
105,238 |
|
|
113,901 |
|
|
138,297 |
|
|
151,821 |
|
| Consumer |
7,596 |
|
|
7,176 |
|
|
8,326 |
|
|
8,166 |
|
|
8,409 |
|
| Mortgage Warehouse |
735,185 |
|
|
641,816 |
|
|
728,847 |
|
|
756,509 |
|
|
846,340 |
|
| Total banking loans held for investment |
$ |
3,080,937 |
|
|
$ |
3,041,073 |
|
|
$ |
3,046,446 |
|
|
$ |
3,157,826 |
|
|
$ |
3,150,964 |
|
The following table presents the Company’s operating segments:
|
|
|
|
|
|
|
|
|
|
|
|
|
|
|
|
|
|
|
|
|
|
|
|
|
|
|
|
|
|
|
|
|
| (Dollars in thousands) |
|
|
|
|
|
|
|
|
|
|
| Three months ended June 30, 2024 |
|
Banking |
|
Factoring |
|
Payments |
|
Corporate |
|
Consolidated |
| Total interest income |
|
$ |
66,900 |
|
|
$ |
34,307 |
|
|
$ |
5,721 |
|
|
$ |
87 |
|
|
$ |
107,015 |
|
| Intersegment interest allocations |
|
7,188 |
|
|
(9,198) |
|
|
2,010 |
|
|
— |
|
|
— |
|
| Total interest expense |
|
16,713 |
|
|
— |
|
|
— |
|
|
2,387 |
|
|
19,100 |
|
| Net interest income (expense) |
|
57,375 |
|
|
25,109 |
|
|
7,731 |
|
|
(2,300) |
|
|
87,915 |
|
| Credit loss expense (benefit) |
|
1,961 |
|
|
2,176 |
|
|
(9) |
|
|
27 |
|
|
4,155 |
|
| Net interest income after credit loss expense |
|
55,414 |
|
|
22,933 |
|
|
7,740 |
|
|
(2,327) |
|
|
83,760 |
|
| Noninterest income |
|
7,599 |
|
|
2,016 |
|
|
5,867 |
|
|
1,685 |
|
|
17,167 |
|
| Noninterest expense |
|
32,865 |
|
|
20,695 |
|
|
17,070 |
|
|
26,713 |
|
|
97,343 |
|
Net intersegment noninterest income (expense)(1) |
|
137 |
|
|
373 |
|
|
(510) |
|
|
— |
|
|
— |
|
| Operating income (loss) |
|
$ |
30,285 |
|
|
$ |
4,627 |
|
|
$ |
(3,973) |
|
|
$ |
(27,355) |
|
|
$ |
3,584 |
|
|
|
|
|
|
|
|
|
|
|
|
|
|
|
|
|
|
|
|
|
|
|
|
|
|
|
|
|
|
|
|
|
|
| (Dollars in thousands) |
|
|
|
|
|
|
|
|
|
|
| Three months ended March 31, 2024 |
|
Banking |
|
Factoring |
|
Payments |
|
Corporate |
|
Consolidated |
| Total interest income |
|
$ |
63,994 |
|
|
$ |
32,752 |
|
|
$ |
5,157 |
|
|
$ |
44 |
|
|
$ |
101,947 |
|
| Intersegment interest allocations |
|
6,744 |
|
|
(8,905) |
|
|
2,161 |
|
|
— |
|
|
— |
|
| Total interest expense |
|
13,504 |
|
|
— |
|
|
— |
|
|
2,408 |
|
|
15,912 |
|
| Net interest income (expense) |
|
57,234 |
|
|
23,847 |
|
|
7,318 |
|
|
(2,364) |
|
|
86,035 |
|
| Credit loss expense (benefit) |
|
4,527 |
|
|
1,355 |
|
|
69 |
|
|
(55) |
|
|
5,896 |
|
| Net interest income after credit loss expense |
|
52,707 |
|
|
22,492 |
|
|
7,249 |
|
|
(2,309) |
|
|
80,139 |
|
| Noninterest income |
|
6,476 |
|
|
2,903 |
|
|
5,543 |
|
|
77 |
|
|
14,999 |
|
| Noninterest expense |
|
31,129 |
|
|
18,693 |
|
|
16,485 |
|
|
24,064 |
|
|
90,371 |
|
Intersegment noninterest income (expense)(1) |
|
121 |
|
|
389 |
|
|
(510) |
|
|
— |
|
|
— |
|
| Operating income (loss) |
|
$ |
28,175 |
|
|
$ |
7,091 |
|
|
$ |
(4,203) |
|
|
$ |
(26,296) |
|
|
$ |
4,767 |
|
(1) Intersegment noninterest income (expense) includes:
|
|
|
|
|
|
|
|
|
|
|
|
|
|
|
|
|
|
|
|
|
| (Dollars in thousands) |
|
Banking |
|
Factoring |
|
Payments |
| Three Months Ended June 30, 2024 |
|
|
|
|
|
|
| Factoring revenue received from Payments |
|
$ |
— |
|
|
$ |
750 |
|
|
$ |
(750) |
|
| Payments revenue received from Factoring |
|
— |
|
|
(264) |
|
|
264 |
|
| Banking revenue received from Payments and Factoring |
|
137 |
|
|
(113) |
|
|
(24) |
|
| Intersegment noninterest income (expense) |
|
$ |
137 |
|
|
$ |
373 |
|
|
$ |
(510) |
|
|
|
|
|
|
|
|
| Three Months Ended March 31, 2024 |
|
|
|
|
|
|
| Factoring revenue received from Payments |
|
$ |
— |
|
|
$ |
750 |
|
|
$ |
(750) |
|
| Payments revenue received from Factoring |
|
— |
|
|
(265) |
|
|
265 |
|
| Banking revenue received from Payments and Factoring |
|
121 |
|
|
(96) |
|
|
(25) |
|
| Intersegment noninterest income (expense) |
|
$ |
121 |
|
|
$ |
389 |
|
|
$ |
(510) |
|
Information pertaining to our factoring segment, which includes only factoring originated by our Triumph Financial Services, LLC subsidiary, summarized as of and for the quarters ended:
|
|
|
|
|
|
|
|
|
|
|
|
|
|
|
|
|
|
|
|
|
|
|
|
|
|
|
|
|
|
|
|
|
| Factoring |
|
June 30,
2024 |
|
March 31,
2024 |
|
December 31,
2023 |
|
September 30,
2023 |
|
June 30,
2023 |
| Factored receivable period end balance |
|
$ |
1,035,159,000 |
|
|
$ |
976,761,000 |
|
|
$ |
941,926,000 |
|
|
$ |
1,041,448,000 |
|
|
$ |
997,842,000 |
|
| Yield on average receivable balance |
|
14.14 |
% |
|
13.98 |
% |
|
13.71 |
% |
|
13.59 |
% |
|
14.07 |
% |
Current quarter charge-off rate(1) |
|
0.15 |
% |
|
0.13 |
% |
|
0.12 |
% |
|
0.12 |
% |
|
0.54 |
% |
| Factored receivables - transportation concentration |
|
97 |
% |
|
97 |
% |
|
96 |
% |
|
96 |
% |
|
95 |
% |
|
|
|
|
|
|
|
|
|
|
|
| Interest income, including fees |
|
$ |
34,307,000 |
|
|
$ |
32,752,000 |
|
|
$ |
35,448,000 |
|
|
$ |
34,244,000 |
|
|
$ |
36,368,000 |
|
| Noninterest income |
|
2,016,000 |
|
|
2,903,000 |
|
|
2,725,000 |
|
|
2,546,000 |
|
|
980,000 |
|
| Intersegment noninterest income |
|
750,000 |
|
|
750,000 |
|
|
510,000 |
|
|
510,000 |
|
|
170,000 |
|
| Factored receivable total revenue |
|
37,073,000 |
|
|
36,405,000 |
|
|
38,683,000 |
|
|
37,300,000 |
|
|
37,518,000 |
|
| Average net funds employed |
|
873,355,000 |
|
|
839,136,000 |
|
|
927,996,000 |
|
|
898,989,000 |
|
|
918,439,000 |
|
| Yield on average net funds employed |
|
17.07 |
% |
|
17.45 |
% |
|
16.54 |
% |
|
16.46 |
% |
|
16.38 |
% |
|
|
|
|
|
|
|
|
|
|
|
| Accounts receivable purchased |
|
$ |
2,542,327,000 |
|
|
$ |
2,469,797,000 |
|
|
$ |
2,570,442,000 |
|
|
$ |
2,606,323,000 |
|
|
$ |
2,732,976,000 |
|
| Number of invoices purchased |
|
1,432,366 |
|
|
1,367,625 |
|
|
1,404,861 |
|
|
1,428,463 |
|
|
1,494,963 |
|
| Average invoice size |
|
$ |
1,775 |
|
|
$ |
1,806 |
|
|
$ |
1,830 |
|
|
$ |
1,825 |
|
|
$ |
1,828 |
|
| Average invoice size - transportation |
|
$ |
1,738 |
|
|
$ |
1,771 |
|
|
$ |
1,781 |
|
|
$ |
1,772 |
|
|
$ |
1,773 |
|
| Average invoice size - non-transportation |
|
$ |
4,561 |
|
|
$ |
4,099 |
|
|
$ |
5,858 |
|
|
$ |
5,631 |
|
|
$ |
5,790 |
|
Metrics above include assets and deposits held for sale.
(1)June 30, 2023 includes a $3.3 million charge-off of an over-formula advance balance, which contributed approximately 0.32% to the net charge-off rate for the quarter. In accordance with the agreement reached with Covenant, Covenant has reimbursed us for $1.7 million of this charge-off.
Information pertaining to our Payments segment, which includes only our TriumphPay division, summarized as of and for the quarters ended:
|
|
|
|
|
|
|
|
|
|
|
|
|
|
|
|
|
|
|
|
|
|
|
|
|
|
|
|
|
|
|
|
|
| Payments |
|
June 30,
2024 |
|
March 31,
2024 |
|
December 31,
2023 |
|
September 30,
2023 |
|
June 30,
2023 |
| Supply chain financing factored receivables |
|
$ |
95,163,000 |
|
|
$ |
98,593,000 |
|
|
$ |
100,829,000 |
|
|
$ |
87,590,000 |
|
|
$ |
93,751,000 |
|
| Quickpay and other factored receivables |
|
77,158,000 |
|
|
78,693,000 |
|
|
73,899,000 |
|
|
84,664,000 |
|
|
82,201,000 |
|
| Total factored receivable period end balance |
|
$ |
172,321,000 |
|
|
$ |
177,286,000 |
|
|
$ |
174,728,000 |
|
|
$ |
172,254,000 |
|
|
$ |
175,952,000 |
|
|
|
|
|
|
|
|
|
|
|
|
| Total revenue |
|
|
|
|
|
|
|
|
|
|
| Supply chain finance interest income |
|
$ |
2,649,000 |
|
|
$ |
2,553,000 |
|
|
$ |
2,476,000 |
|
|
$ |
2,316,000 |
|
|
$ |
820,000 |
|
| Quickpay interest income |
|
3,072,000 |
|
|
2,604,000 |
|
|
2,799,000 |
|
|
2,601,000 |
|
|
2,631,000 |
|
| Intersegment interest income allocation |
|
2,010,000 |
|
|
2,161,000 |
|
|
1,951,000 |
|
|
1,334,000 |
|
|
1,880,000 |
|
| Total interest income |
|
7,731,000 |
|
|
7,318,000 |
|
|
7,226,000 |
|
|
6,251,000 |
|
|
5,331,000 |
|
| Broker noninterest income |
|
4,392,000 |
|
|
4,115,000 |
|
|
3,880,000 |
|
|
3,372,000 |
|
|
2,607,000 |
|
| Factor noninterest income |
|
1,296,000 |
|
|
1,295,000 |
|
|
1,301,000 |
|
|
1,312,000 |
|
|
1,367,000 |
|
| Other noninterest income |
|
179,000 |
|
|
133,000 |
|
|
263,000 |
|
|
133,000 |
|
|
145,000 |
|
| Intersegment noninterest income |
|
264,000 |
|
|
265,000 |
|
|
267,000 |
|
|
268,000 |
|
|
267,000 |
|
| Total noninterest income |
|
6,131,000 |
|
|
5,808,000 |
|
|
5,711,000 |
|
|
5,085,000 |
|
|
4,386,000 |
|
|
|
$ |
13,862,000 |
|
|
$ |
13,126,000 |
|
|
$ |
12,937,000 |
|
|
$ |
11,336,000 |
|
|
$ |
9,717,000 |
|
|
|
|
|
|
|
|
|
|
|
|
| Total expense |
|
|
|
|
|
|
|
|
|
|
|
|
|
|
|
|
|
|
|
|
|
| Credit loss expense (benefit) |
|
$ |
(9,000) |
|
|
$ |
69,000 |
|
|
$ |
5,000 |
|
|
$ |
14,000 |
|
|
$ |
41,000 |
|
| Noninterest expense |
|
17,070,000 |
|
|
16,485,000 |
|
|
14,783,000 |
|
|
14,556,000 |
|
|
16,939,000 |
|
| Intersegment noninterest expense |
|
774,000 |
|
|
775,000 |
|
|
510,000 |
|
|
510,000 |
|
|
170,000 |
|
|
|
$ |
17,835,000 |
|
|
$ |
17,329,000 |
|
|
$ |
15,298,000 |
|
|
$ |
15,080,000 |
|
|
$ |
17,150,000 |
|
|
|
|
|
|
|
|
|
|
|
|
| Pre-tax operating income (loss) |
|
$ |
(3,973,000) |
|
|
$ |
(4,203,000) |
|
|
$ |
(2,361,000) |
|
|
$ |
(3,744,000) |
|
|
$ |
(7,433,000) |
|
|
|
|
|
|
|
|
|
|
|
|
| Depreciation expense |
|
263,000 |
|
|
244,000 |
|
|
261,000 |
|
|
181,000 |
|
|
191,000 |
|
| Software amortization expense |
|
580,000 |
|
|
527,000 |
|
|
433,000 |
|
|
177,000 |
|
|
177,000 |
|
| Intangible amortization expense |
|
1,687,000 |
|
|
1,702,000 |
|
|
1,703,000 |
|
|
1,703,000 |
|
|
1,729,000 |
|
Earnings (losses) before interest, taxes, depreciation, and amortization(1) |
|
$ |
(1,443,000) |
|
|
$ |
(1,730,000) |
|
|
$ |
36,000 |
|
|
$ |
(1,683,000) |
|
|
$ |
(5,336,000) |
|
|
|
|
|
|
|
|
|
|
|
|
|
|
|
|
|
|
|
|
|
|
|
|
|
|
|
|
|
|
|
|
|
|
| EBITDA Margin |
|
(10) |
% |
|
(13) |
% |
|
— |
% |
|
(15) |
% |
|
(55) |
% |
|
|
|
|
|
|
|
|
|
|
|
| Number of invoices processed |
|
6,062,779 |
|
5,717,016 |
|
5,703,740 |
|
5,037,841 |
|
4,526,629 |
| Amount of payments processed |
|
$6,687,587,000 |
|
$6,379,680,000 |
|
$6,217,323,000 |
|
$5,329,580,000 |
|
$4,940,317,000 |
| Network invoice volume |
|
701,768 |
|
621,209 |
|
442,353 |
|
303,300 |
|
181,904 |
| Network payment volume |
|
$1,133,118,000 |
|
$1,035,099,000 |
|
$740,048,000 |
|
$510,298,000 |
|
$299,948,000 |
(1)Earnings (losses) before interest, taxes, depreciation, and amortization ("EBITDA") is a non-GAAP financial measure used as a supplemental measure to evaluate the performance of our Payments segment.
Deposits summarized as of:
|
|
|
|
|
|
|
|
|
|
|
|
|
|
|
|
|
|
|
|
|
|
|
|
|
|
|
|
|
|
| (Dollars in thousands) |
June 30,
2024 |
|
March 31,
2024 |
|
December 31,
2023 |
|
September 30,
2023 |
|
June 30,
2023 |
| Non-interest bearing demand |
$ |
1,689,531 |
|
|
$ |
1,747,544 |
|
|
$ |
1,632,022 |
|
|
$ |
1,632,559 |
|
|
$ |
1,608,411 |
|
| Interest bearing demand |
847,387 |
|
|
744,208 |
|
|
757,455 |
|
|
795,246 |
|
|
778,972 |
|
| Individual retirement accounts |
48,991 |
|
|
50,730 |
|
|
52,195 |
|
|
55,296 |
|
|
57,575 |
|
| Money market |
592,667 |
|
|
601,685 |
|
|
568,772 |
|
|
540,235 |
|
|
569,318 |
|
| Savings |
545,807 |
|
|
547,471 |
|
|
555,047 |
|
|
542,985 |
|
|
524,210 |
|
| Certificates of deposit |
252,641 |
|
|
261,614 |
|
|
265,525 |
|
|
269,416 |
|
|
270,273 |
|
| Brokered time deposits |
414,987 |
|
|
397,645 |
|
|
146,458 |
|
|
451,273 |
|
|
484,666 |
|
| Other brokered deposits |
7 |
|
|
100,066 |
|
|
4 |
|
|
200,041 |
|
|
41 |
|
| Total deposits |
$ |
4,392,018 |
|
|
$ |
4,450,963 |
|
|
$ |
3,977,478 |
|
|
$ |
4,487,051 |
|
|
$ |
4,293,466 |
|
Net interest margin summarized for the three months ended:
|
|
|
|
|
|
|
|
|
|
|
|
|
|
|
|
|
|
|
|
|
|
|
|
|
|
|
|
|
|
|
|
|
|
|
|
|
June 30, 2024 |
|
March 31, 2024 |
| (Dollars in thousands) |
Average
Balance |
|
Interest |
|
Average
Rate(4)
|
|
Average
Balance |
|
Interest |
|
Average
Rate(4)
|
| Interest earning assets: |
|
|
|
|
|
|
|
|
|
|
|
| Interest earning cash balances |
$ |
463,759 |
|
|
$ |
6,330 |
|
|
5.49 |
% |
|
$ |
360,694 |
|
|
$ |
4,903 |
|
|
5.47 |
% |
| Taxable securities |
328,987 |
|
|
5,501 |
|
|
6.73 |
% |
|
321,344 |
|
|
5,326 |
|
|
6.67 |
% |
| Tax-exempt securities |
3,153 |
|
|
22 |
|
|
2.81 |
% |
|
3,508 |
|
|
25 |
|
|
2.87 |
% |
| FHLB and other restricted stock |
7,598 |
|
|
234 |
|
|
12.39 |
% |
|
13,649 |
|
|
232 |
|
|
6.84 |
% |
Loans(1) |
4,195,669 |
|
|
94,928 |
|
|
9.10 |
% |
|
4,045,366 |
|
|
91,461 |
|
|
9.09 |
% |
| Total interest earning assets |
$ |
4,999,166 |
|
|
$ |
107,015 |
|
|
8.61 |
% |
|
$ |
4,744,561 |
|
|
$ |
101,947 |
|
|
8.64 |
% |
| Non-interest earning assets: |
|
|
|
|
|
|
|
|
|
|
|
| Other assets |
691,601 |
|
|
|
|
|
|
646,959 |
|
|
|
|
|
| Total assets |
$ |
5,690,767 |
|
|
|
|
|
|
$ |
5,391,520 |
|
|
|
|
|
| Interest bearing liabilities: |
|
|
|
|
|
|
|
|
|
|
|
| Deposits: |
|
|
|
|
|
|
|
|
|
|
|
| Interest bearing demand |
$ |
748,699 |
|
|
$ |
1,164 |
|
|
0.63 |
% |
|
$ |
731,747 |
|
|
$ |
851 |
|
|
0.47 |
% |
| Individual retirement accounts |
49,917 |
|
|
175 |
|
|
1.41 |
% |
|
51,433 |
|
|
163 |
|
|
1.27 |
% |
| Money market |
565,612 |
|
|
4,097 |
|
|
2.91 |
% |
|
569,596 |
|
|
3,970 |
|
|
2.80 |
% |
| Savings |
541,408 |
|
|
1,480 |
|
|
1.10 |
% |
|
533,695 |
|
|
1,322 |
|
|
1.00 |
% |
| Certificates of deposit |
257,292 |
|
|
1,945 |
|
|
3.04 |
% |
|
263,561 |
|
|
1,864 |
|
|
2.84 |
% |
| Brokered time deposits |
433,096 |
|
|
5,698 |
|
|
5.29 |
% |
|
284,518 |
|
|
3,742 |
|
|
5.29 |
% |
| Other brokered deposits |
71,196 |
|
|
961 |
|
|
5.43 |
% |
|
17,860 |
|
|
240 |
|
|
5.40 |
% |
| Total interest bearing deposits |
2,667,220 |
|
|
15,520 |
|
|
2.34 |
% |
|
2,452,410 |
|
|
12,152 |
|
|
1.99 |
% |
| Federal Home Loan Bank advances |
85,769 |
|
|
1,193 |
|
|
5.59 |
% |
|
98,407 |
|
|
1,352 |
|
|
5.53 |
% |
| Subordinated notes |
108,868 |
|
|
1,225 |
|
|
4.53 |
% |
|
108,739 |
|
|
1,224 |
|
|
4.53 |
% |
| Junior subordinated debentures |
41,951 |
|
|
1,162 |
|
|
11.14 |
% |
|
41,799 |
|
|
1,184 |
|
|
11.39 |
% |
|
|
|
|
|
|
|
|
|
|
|
|
| Total interest bearing liabilities |
$ |
2,903,808 |
|
|
$ |
19,100 |
|
|
2.65 |
% |
|
$ |
2,701,355 |
|
|
$ |
15,912 |
|
|
2.37 |
% |
| Noninterest bearing liabilities and equity: |
|
|
|
|
|
|
|
|
|
|
|
| Non-interest bearing demand deposits |
1,832,154 |
|
|
|
|
|
|
1,724,532 |
|
|
|
|
|
| Other liabilities |
74,578 |
|
|
|
|
|
|
85,808 |
|
|
|
|
|
| Total equity |
880,227 |
|
|
|
|
|
|
879,825 |
|
|
|
|
|
| Total liabilities and equity |
$ |
5,690,767 |
|
|
|
|
|
|
$ |
5,391,520 |
|
|
|
|
|
| Net interest income |
|
|
$ |
87,915 |
|
|
|
|
|
|
$ |
86,035 |
|
|
|
Interest spread(2) |
|
|
|
|
5.96 |
% |
|
|
|
|
|
6.27 |
% |
Net interest margin(3) |
|
|
|
|
7.07 |
% |
|
|
|
|
|
7.29 |
% |
(1) Loan balance totals include respective nonaccrual assets.
(2) Net interest spread is the yield on average interest earning assets less the rate on interest bearing liabilities.
(3) Net interest margin is the ratio of net interest income to average interest earning assets.
(4) Average rates have been annualized.
Additional information pertaining to our loan portfolio, including loans held for investment and loans held for sale, summarized for the quarters ended:
|
|
|
|
|
|
|
|
|
|
|
|
|
|
|
|
|
|
|
|
|
|
|
|
|
|
|
|
|
|
| (Dollars in thousands) |
June 30,
2024 |
|
March 31,
2024 |
|
December 31,
2023 |
|
September 30,
2023 |
|
June 30,
2023 |
| Average Banking loans |
$ |
3,035,612 |
|
|
$ |
2,932,646 |
|
|
$ |
3,053,526 |
|
|
$ |
3,109,630 |
|
|
$ |
3,120,594 |
|
| Average Factoring receivables |
976,087 |
|
|
942,414 |
|
|
1,025,978 |
|
|
999,345 |
|
|
1,036,922 |
|
| Average Payments receivables |
183,970 |
|
|
170,306 |
|
|
176,852 |
|
|
173,847 |
|
|
104,654 |
|
| Average total loans |
$ |
4,195,669 |
|
|
$ |
4,045,366 |
|
|
$ |
4,256,356 |
|
|
$ |
4,282,822 |
|
|
$ |
4,262,170 |
|
| Banking yield |
7.27 |
% |
|
7.34 |
% |
|
7.66 |
% |
|
7.61 |
% |
|
7.36 |
% |
| Factoring yield |
14.14 |
% |
|
13.98 |
% |
|
13.71 |
% |
|
13.59 |
% |
|
14.07 |
% |
| Payments yield |
12.51 |
% |
|
12.18 |
% |
|
11.83 |
% |
|
11.22 |
% |
|
13.23 |
% |
| Total loan yield |
9.10 |
% |
|
9.09 |
% |
|
9.29 |
% |
|
9.16 |
% |
|
9.14 |
% |
Metrics and non-GAAP financial:
|
|
|
|
|
|
|
|
|
|
|
|
|
|
|
|
|
|
|
|
|
|
|
|
|
|
|
|
|
|
|
|
|
|
|
|
|
|
|
|
|
|
|
|
|
|
|
As of and for the Three Months Ended |
|
As of and for the Six Months Ended |
(Dollars in thousands,
except per share amounts) |
|
June 30,
2024 |
|
March 31,
2024 |
|
December 31,
2023 |
|
September 30,
2023 |
|
June 30,
2023 |
|
June 30,
2024 |
|
June 30,
2023 |
|
|
|
|
|
|
|
|
|
|
|
|
|
|
|
|
|
|
|
|
|
|
|
|
|
|
|
|
|
|
|
|
|
|
|
|
|
|
|
|
|
|
|
|
|
|
|
|
|
|
|
|
|
|
|
|
|
|
|
|
|
|
|
|
|
|
|
|
|
|
|
|
|
|
|
|
|
|
|
|
|
|
|
|
|
|
|
|
|
|
|
|
|
|
|
|
|
|
|
|
|
|
|
|
|
|
|
|
|
|
|
|
|
|
|
|
|
|
|
|
|
|
|
|
|
|
|
|
|
|
|
|
|
|
|
| Average total stockholders' equity |
|
$ |
880,227 |
|
|
$ |
879,825 |
|
|
$ |
868,396 |
|
|
$ |
853,375 |
|
|
$ |
841,979 |
|
|
$ |
880,025 |
|
|
$ |
850,002 |
|
| Average preferred stock liquidation preference |
|
(45,000) |
|
|
(45,000) |
|
|
(45,000) |
|
|
(45,000) |
|
|
(45,000) |
|
|
(45,000) |
|
|
(45,000) |
|
| Average total common stockholders' equity |
|
835,227 |
|
|
834,825 |
|
|
823,396 |
|
|
808,375 |
|
|
796,979 |
|
|
835,025 |
|
|
805,002 |
|
| Average goodwill and other intangibles |
|
(256,552) |
|
|
(256,070) |
|
|
(258,807) |
|
|
(261,619) |
|
|
(264,544) |
|
|
(256,327) |
|
|
(264,930) |
|
| Average tangible common stockholders' equity |
|
$ |
578,675 |
|
|
$ |
578,755 |
|
|
$ |
564,589 |
|
|
$ |
546,756 |
|
|
$ |
532,435 |
|
|
$ |
578,698 |
|
|
$ |
540,072 |
|
|
|
|
|
|
|
|
|
|
|
|
|
|
|
|
| Net income available to common stockholders |
|
$ |
1,945 |
|
|
$ |
3,357 |
|
|
$ |
8,825 |
|
|
$ |
11,993 |
|
|
$ |
6,848 |
|
|
$ |
5,302 |
|
|
$ |
17,057 |
|
| Average tangible common equity |
|
578,675 |
|
|
578,755 |
|
|
564,589 |
|
|
546,756 |
|
|
532,435 |
|
|
578,698 |
|
|
540,072 |
|
| Return on average tangible common equity |
|
1.35 |
% |
|
2.33 |
% |
|
6.20 |
% |
|
8.70 |
% |
|
5.16 |
% |
|
1.84 |
% |
|
6.37 |
% |
|
|
|
|
|
|
|
|
|
|
|
|
|
|
|
|
|
|
|
|
|
|
|
|
|
|
|
|
|
|
|
|
|
|
|
|
|
|
|
|
|
|
|
|
|
|
|
|
|
|
|
|
|
|
|
|
|
|
|
|
|
|
|
|
|
|
|
|
|
|
|
|
|
|
|
|
|
|
|
|
|
|
|
|
|
|
|
|
|
|
|
|
|
|
|
|
|
|
|
|
|
|
|
|
|
|
|
|
|
|
|
|
|
|
|
|
|
|
|
|
|
|
|
|
|
|
|
|
|
|
|
|
|
|
|
|
|
|
|
|
|
|
|
|
|
|
|
|
|
|
|
|
|
|
|
|
|
|
|
|
|
|
|
|
|
| Net interest income |
|
$ |
87,915 |
|
|
$ |
86,035 |
|
|
$ |
91,919 |
|
|
$ |
91,327 |
|
|
$ |
91,451 |
|
|
$ |
173,950 |
|
|
$ |
184,833 |
|
| Noninterest income |
|
17,167 |
|
|
14,999 |
|
|
14,230 |
|
|
13,410 |
|
|
11,511 |
|
|
32,166 |
|
|
22,533 |
|
| Operating revenue |
|
$ |
105,082 |
|
|
$ |
101,034 |
|
|
$ |
106,149 |
|
|
$ |
104,737 |
|
|
$ |
102,962 |
|
|
$ |
206,116 |
|
|
$ |
207,366 |
|
| Noninterest expenses |
|
$ |
97,343 |
|
|
$ |
90,371 |
|
|
$ |
87,298 |
|
|
$ |
86,259 |
|
|
$ |
90,396 |
|
|
$ |
187,714 |
|
|
$ |
179,677 |
|
| Efficiency ratio |
|
92.64 |
% |
|
89.45 |
% |
|
82.24 |
% |
|
82.36 |
% |
|
87.80 |
% |
|
91.07 |
% |
|
86.65 |
% |
|
|
|
|
|
|
|
|
|
|
|
|
|
|
|
|
|
|
|
|
|
|
|
|
|
|
|
|
|
|
|
|
|
|
|
|
|
|
|
|
|
|
|
|
|
|
|
|
|
|
|
|
|
|
|
|
|
|
|
|
|
|
|
|
|
|
|
|
|
|
|
|
|
|
|
|
|
|
|
|
|
|
|
|
|
|
|
|
|
|
|
|
|
|
|
|
|
|
|
|
|
|
|
|
|
|
|
|
|
|
|
|
|
|
|
|
|
|
|
|
|
|
|
|
|
|
|
|
|
|
|
|
|
|
|
|
|
|
|
|
|
|
|
|
|
|
|
|
|
|
|
|
|
|
|
|
|
|
|
|
|
|
|
|
|
|
|
|
|
|
|
|
|
|
|
|
|
|
|
|
| Net non-interest expense to average assets ratio: |
|
|
|
|
|
|
|
|
|
|
|
|
|
|
| Noninterest expenses |
|
$ |
97,343 |
|
|
$ |
90,371 |
|
|
$ |
87,298 |
|
|
$ |
86,259 |
|
|
$ |
90,396 |
|
|
$ |
187,714 |
|
|
$ |
179,677 |
|
| Noninterest income |
|
$ |
17,167 |
|
|
$ |
14,999 |
|
|
$ |
14,230 |
|
|
$ |
13,410 |
|
|
$ |
11,511 |
|
|
$ |
32,166 |
|
|
$ |
22,533 |
|
| Net noninterest expenses |
|
$ |
80,176 |
|
|
$ |
75,372 |
|
|
$ |
73,068 |
|
|
$ |
72,849 |
|
|
$ |
78,885 |
|
|
$ |
155,548 |
|
|
$ |
157,144 |
|
| Average total assets |
|
$ |
5,690,767 |
|
|
$ |
5,391,520 |
|
|
$ |
5,478,707 |
|
|
$ |
5,472,000 |
|
|
$ |
5,461,946 |
|
|
$ |
5,545,063 |
|
|
$ |
5,386,429 |
|
| Net noninterest expense to average assets ratio |
|
5.67 |
% |
|
5.62 |
% |
|
5.29 |
% |
|
5.28 |
% |
|
5.79 |
% |
|
5.64 |
% |
|
5.88 |
% |
|
|
|
|
|
|
|
|
|
|
|
|
|
|
|
| Total stockholders' equity |
|
$ |
874,249 |
|
|
$ |
872,339 |
|
|
$ |
864,400 |
|
|
$ |
850,382 |
|
|
$ |
833,466 |
|
|
$ |
874,249 |
|
|
$ |
833,466 |
|
| Preferred stock liquidation preference |
|
(45,000) |
|
|
(45,000) |
|
|
(45,000) |
|
|
(45,000) |
|
|
(45,000) |
|
|
(45,000) |
|
|
(45,000) |
|
| Total common stockholders' equity |
|
829,249 |
|
|
827,339 |
|
|
819,400 |
|
|
805,382 |
|
|
788,466 |
|
|
829,249 |
|
|
788,466 |
|
| Goodwill and other intangibles |
|
(254,652) |
|
|
(257,551) |
|
|
(257,355) |
|
|
(260,109) |
|
|
(262,958) |
|
|
(254,652) |
|
|
(262,958) |
|
| Tangible common stockholders' equity |
|
$ |
574,597 |
|
|
$ |
569,788 |
|
|
$ |
562,045 |
|
|
$ |
545,273 |
|
|
$ |
525,508 |
|
|
$ |
574,597 |
|
|
$ |
525,508 |
|
| Common shares outstanding |
|
23,353,519 |
|
|
23,334,997 |
|
|
23,302,414 |
|
|
23,291,693 |
|
|
23,269,885 |
|
|
23,353,519 |
|
|
23,269,885 |
|
| Tangible book value per share |
|
$ |
24.60 |
|
|
$ |
24.42 |
|
|
$ |
24.12 |
|
|
$ |
23.41 |
|
|
$ |
22.58 |
|
|
$ |
24.60 |
|
|
$ |
22.58 |
|
|
|
|
|
|
|
|
|
|
|
|
|
|
|
|
| Total assets at end of period |
|
$ |
5,783,334 |
|
|
$ |
5,575,493 |
|
|
$ |
5,347,334 |
|
|
$ |
5,599,794 |
|
|
$ |
5,652,721 |
|
|
$ |
5,783,334 |
|
|
$ |
5,652,721 |
|
| Goodwill and other intangibles |
|
(254,652) |
|
|
(257,551) |
|
|
(257,355) |
|
|
(260,109) |
|
|
(262,958) |
|
|
(254,652) |
|
|
(262,958) |
|
| Tangible assets at period end |
|
$ |
5,528,682 |
|
|
$ |
5,317,942 |
|
|
$ |
5,089,979 |
|
|
$ |
5,339,685 |
|
|
$ |
5,389,763 |
|
|
$ |
5,528,682 |
|
|
$ |
5,389,763 |
|
| Tangible common stockholders' equity ratio |
|
10.39 |
% |
|
10.71 |
% |
|
11.04 |
% |
|
10.21 |
% |
|
9.75 |
% |
|
10.39 |
% |
|
9.75 |
% |
1)Triumph Financial uses certain non-GAAP financial measures to provide meaningful supplemental information regarding Triumph Financial's operational performance and to enhance investors' overall understanding of such financial performance. The non-GAAP measures used by Triumph Financial include the following:
•"Tangible common stockholders' equity" is defined as common stockholders' equity less goodwill and other intangible assets.
•"Total tangible assets" is defined as total assets less goodwill and other intangible assets.
•"Tangible book value per share" is defined as tangible common stockholders' equity divided by total common shares outstanding. This measure is important to investors interested in changes from period-to-period in book value per share exclusive of changes in intangible assets.
•"Tangible common stockholders' equity ratio" is defined as the ratio of tangible common stockholders' equity divided by total tangible assets. We believe that this measure is important to many investors in the marketplace who are interested in relative changes from period-to period in common equity and total assets, each exclusive of changes in intangible assets.
•"Return on Average Tangible Common Equity" is defined as net income available to common stockholders divided by average tangible common stockholders' equity.
2)Performance ratios include discount accretion on purchased loans for the periods presented as follows:
|
|
|
|
|
|
|
|
|
|
|
|
|
|
|
|
|
|
|
|
|
|
|
|
|
|
|
|
|
|
|
|
|
|
|
|
|
|
|
|
|
|
|
For the Three Months Ended |
|
For the Six Months Ended |
| (Dollars in thousands) |
June 30,
2024 |
|
March 31,
2024 |
|
December 31,
2023 |
|
September 30,
2023 |
|
June 30,
2023 |
|
June 30,
2024 |
|
June 30,
2023 |
| Loan discount accretion |
$ |
1,127 |
|
|
$ |
471 |
|
|
$ |
1,039 |
|
|
$ |
1,403 |
|
|
$ |
990 |
|
|
$ |
1,598 |
|
|
$ |
2,800 |
|
3)Asset quality ratios exclude loans held for sale, except for non-performing assets to total assets.
4)Current quarter ratios are preliminary.
Source: Triumph Financial, Inc.
###
Investor Relations:
Luke Wyse
Senior Vice President, Head of Investor Relations
lwyse@tfin.com
214-365-6936
Media Contact:
Amanda Tavackoli
Senior Vice President, Director of Corporate Communication
atavackoli@tfin.com
214-365-6930