株探米国株
日本語 英語
エドガーで原本を確認する
000104300012/31FALSEDallasTexas00010430002024-03-262024-03-26

UNITED STATES
SECURITIES AND EXCHANGE COMMISSION
WASHINGTON, DC 20549
FORM 8-K
CURRENT REPORT
PURSUANT TO SECTION 13 OR 15(d)
OF THE SECURITIES EXCHANGE ACT OF 1934
Date of Report (Date of earliest event reported) March 26, 2024
_________________________________
Sonida Senior Living, Inc.
(Exact name of registrant as specified in its charter)
_________________________________
Delaware
(State or other jurisdiction of incorporation) 
1-13445 75-2678809
(Commission File Number) (IRS Employer Identification No.)
14755 Preston Road
Suite 810
Dallas, Texas
75001
(Address of principal executive offices) (Zip Code)
(972) 770-5600
(Registrant’s telephone number, including area code)
Not applicable
(Former name or former address, if changed since last report)
_________________________________
Check the appropriate box below if the Form 8-K filing is intended to simultaneously satisfy the filing obligation of the registrant under any of the following provisions (see General Instruction A.2. below):
o Written communications pursuant to Rule 425 under the Securities Act (17 CFR 230.425)
o Soliciting material pursuant to Rule 14a-12 under the Exchange Act (17 CFR 240.14a-12)
o Pre-commencement communications pursuant to Rule 14d-2(b) under the Exchange Act (17 CFR 240.14d-2(b))
o Pre-commencement communications pursuant to Rule 13e-4(c) under the Exchange Act (17 CFR 240.13e-4(c))
Indicate by check mark whether the registrant is an emerging growth company as defined in Rule 405 of the Securities Act of 1933 (§230.405 of this chapter) or Rule 12b-2 of the Securities Exchange Act of 1934 (§240.12b-2 of this chapter).
Emerging growth company  ☐
If an emerging growth company, indicate by check mark if the registrant has elected not to use the extended transition period for complying with any new or revised financial accounting standards provided pursuant to Section 13(a) of the Exchange Act. ☐
Securities registered pursuant to Section 12(b) of the Act: 
Title of each class
Trading
symbol(s)
Name of each exchange
on which registered
Common Stock, par value $0.01 per share SNDA New York Stock Exchange


Item 2.02    Results of Operations and Financial Condition.
On March 27, 2024, Sonida Senior Living Inc. (the “Company”), announced its financial results for the fourth quarter and fiscal year ended December 31, 2023, by issuing a press release. The full text of the press release issued in connection with the announcement is attached hereto as Exhibit 99.1.

The information being furnished under Item 2.02, Item 7.01, Exhibit 99.1 and Exhibit 99.2 shall not be deemed “filed” for purposes of the Securities Exchange Act of 1934, as amended (the “Exchange Act”), or incorporated by reference in any filing under the Securities Act of 1933, as amended, or the Exchange Act, except as may be expressly set forth by specific reference in such a filing. The press release and the presentation referenced below contain, and may implicate, forward-looking statements regarding the Company and include cautionary statements identifying important factors that could cause actual results to differ materially from those anticipated.

Item 5.03    Amendments to Articles of Incorporation or Bylaws; Change in Fiscal Year.

On March 26, 2024, the Board of Directors of the Company approved and adopted the Second Amendment to the Second Amended and Restated Bylaws of the Company (the “Second Amendment”), which became effective immediately. The Second Amendment designates the federal district court for the District of Delaware (or, if the federal district court for the District of Delaware does not have jurisdiction, the Court of Chancery of the State of Delaware) as the sole and exclusive forum for bringing certain legal actions against the Company or its directors, officers, or other employees or agents. The foregoing summary of the Second Amendment is qualified in all respects by reference to the text of the Second Amendment, a copy of which is filed as Exhibit 3.1 to this Current Report on Form 8-K and incorporated herein by reference.

Item 7.01    Regulation FD Disclosure.
Attached hereto as Exhibit 99.2 is an updated presentation of the Company.
By filing this Current Report on Form 8-K, the Company does not acknowledge that disclosure of this information is required by Regulation FD or that the information was material or non-public before the disclosure. The Company assumes no obligation to update or supplement forward-looking statements in this presentation that become untrue because of new information, subsequent events or otherwise.

Item 9.01    Financial Statements and Exhibits.
(d) Exhibits.
3.1
*99.1
*99.2
104 Cover Page Interactive Date File-formatted as Inline XBRL.
*These exhibits to this Current Report on Form 8-K are not being filed but are being furnished pursuant to Item 9.01.


SIGNATURES
Pursuant to the requirements of the Securities Exchange Act of 1934, the registrant has duly caused this report to be signed on its behalf by the undersigned hereunto duly authorized.
Date: March 27, 2024
Sonida Senior Living Inc.
By: /s/ KEVIN J. DETZ
Name: Kevin J. Detz
Title: Executive Vice President and Chief Financial Officer

EX-3.1 2 exhibit31.htm EX-3.1 Document


Exhibit 3.1

SECOND AMENDMENT TO THE
SECOND AMENDED AND RESTATED BYLAWS
OF
SONIDA SENIOR LIVING, INC.

(Effective as of March 26, 2024)

The Second Amended and Restated Bylaws, as amended (the “Bylaws”), of Sonida Senior Living, Inc., a Delaware corporation, are hereby amended to add the following new Section 9.11:

9.11. Exclusive Forum. Unless the Corporation consents in writing to the selection of an alternative forum, the sole and exclusive forum for (a) any derivative action or proceeding brought on behalf of the Corporation, (b) any action asserting a claim of breach of fiduciary duty owed by any director or officer or other employee or agent of the Corporation to the Corporation or the Corporation’s stockholders, (c) any action asserting a claim against the Corporation or any director or officer or other employee or agent of the Corporation arising pursuant to any provision of the Delaware General Corporation Law or the Corporation’s certificate of incorporation or these bylaws, or (d) any action asserting a claim against the Corporation or any director or officer or other employee or agent of the Corporation governed by the internal affairs doctrine shall be the federal district court for the District of Delaware (or, if the federal district court for the District of Delaware does not have jurisdiction, the Court of Chancery of the State of Delaware).


IN WITNESS WHEREOF, the undersigned Secretary of Sonida Senior Living, Inc. certifies that the foregoing amendment to the Bylaws was duly adopted by the Board of Directors of Sonida Senior Living, Inc.


SONIDA SENIOR LIVING, INC.


By: /s/ David R. Brickman
Name: David R. Brickman
Title: Senior Vice President, Secretary and             
General Counsel


EX-99.1 3 snda-20231231xex991.htm EX-99.1 Document
Exhibit 99.1

Sonida Senior Living, Inc. Announces Fourth Quarter and Full Year 2023 Results


DALLAS, Texas – March 27, 2024 – Sonida Senior Living, Inc. (the “Company,” “we,” “our,” or “us”) (NYSE: SNDA) announced results for the fourth quarter and for the full year ended December 31, 2023.

“2023 was a transformational year for Sonida. We achieved significant performance milestones while accomplishing key strategic objectives and delivering industry-leading care and services to our residents. These achievements included balance sheet optimization through the comprehensive restructuring of our debt culminating in the $47.8 million equity private placement that closed in the first quarter of 2024. The operational developments and greatly strengthened balance sheet establish Sonida as a differentiated operator, owner, and investor in Senior Living and position the Company to capitalize on near-term dislocation, which will drive the next chapter of value creation for our shareholders.” said Brandon Ribar, President and CEO.
Fourth Quarter and Full Year Highlights

•Liquidity significantly improved, resolving any uncertainty around continuing as a going concern. This was facilitated by our private placement executed in February 2024 resulting in cash proceeds of $47.8 million and concurrent Protective Life debt purchase.
•Weighted average occupancy for the Company’s consolidated portfolio increased 200 basis points to 85.9%, comparing Q4 2023 to Q4 2022.
•Resident revenue increased $6.0 million, or 11.2%, comparing Q4 2023 to Q4 2022.
•Net loss for the fourth quarter was $14.6 million.
•Fourth quarter Adjusted EBITDA, a non-GAAP measure, was $9.3 million representing an increase of 103.5% year-over-year and 0.3% in sequential quarters, driven primarily by continued improvement in operations.
•Net cash provided by operating activities was $10.7 million year-to-date as compared to a net use of $2.6 million for the year ended 2022.
•Results for the Company’s consolidated portfolio of communities:
◦Q4 2023 vs. Q4 2022:
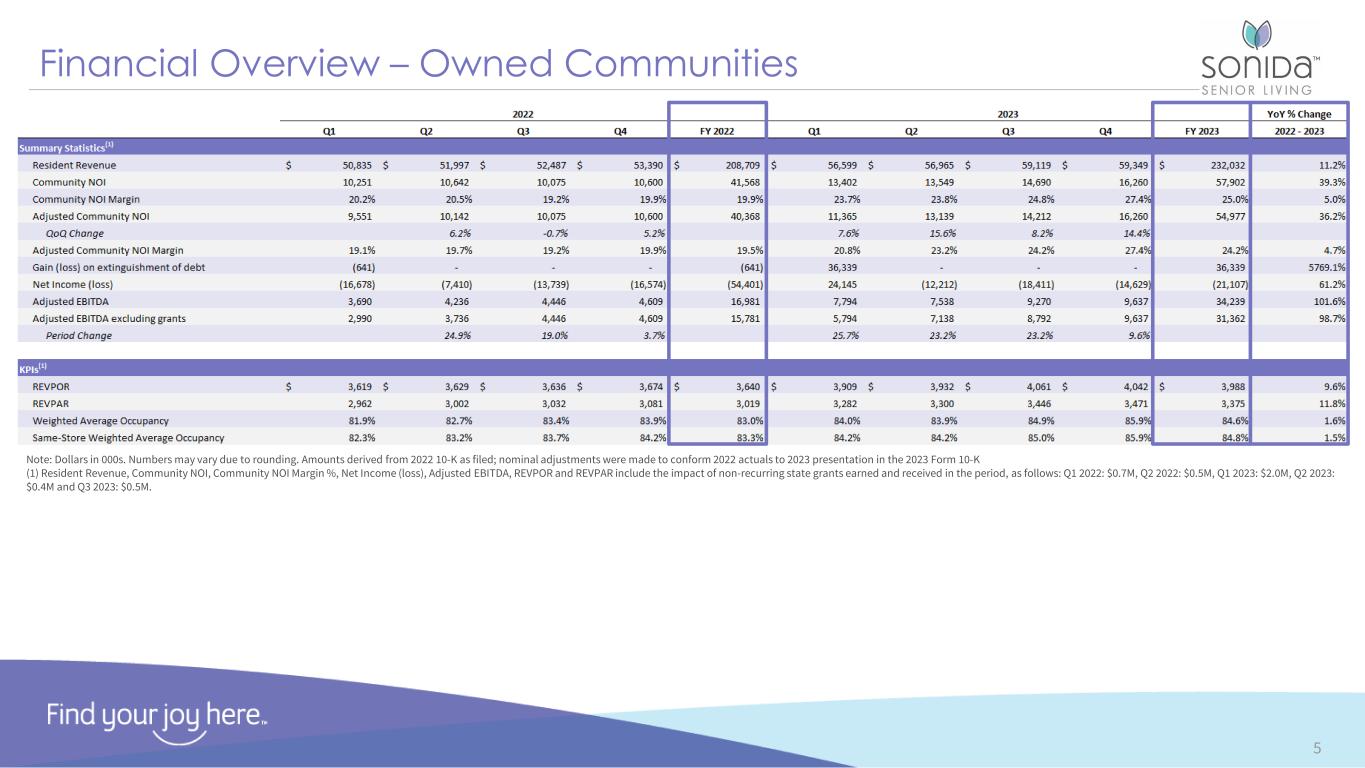
▪Revenue Per Available Unit (“RevPAR”) increased 12.6% to $3,470.
▪Revenue Per Occupied Unit (“RevPOR”) increased 10.0% to $4,042.
▪Community Net Operating Income, a non-GAAP measure, was $16.3 million and $10.3 million for Q4 2023 and Q4 2022, respectively, representing an increase of $6.0 million. There were no state grants received during these periods.
▪Community Net Operating Income Margin, a non-GAAP measure, was 27.4% and 19.3%, for Q4 2023 and Q4 2022, respectively.
◦Q4 2023 vs. Q3 2023:
▪RevPAR increased 70 basis points to $3,470.
▪RevPOR decreased 50 basis points to $4,042.
▪Community Net Operating Income increased $1.6 million to $16.3 million. Adjusted Community Net Operating Income, excluding $0.5 million of state grant revenue received in Q3 2023 (none recognized in Q4 2023), was $16.3 million and $14.2 million for Q4 2023 and Q3 2023, respectively.
▪Community Net Operating Income Margin was 27.4% and 24.8% for Q4 2023 and Q3 2023, respectively, representing an increase of 10.7%.


SONIDA SENIOR LIVING, INC.
SUMMARY OF CONSOLIDATED FINANCIAL RESULTS
THREE MONTHS ENDED AND YEARS ENDED DECEMBER 31, 2023 AND 2022
Three Months Ended December 31, Three Months ended September 30, Years Ended December 31,
2023 2022 2023 2023 2022
Consolidated results
Resident revenue (1)
$ 59,349  $ 53,388  $ 59,117  $ 232,032  $ 208,703 
Management fees 586  523  569  2,191  2,359 
Operating expense 44,367  45,073  44,486  177,323  171,635 
General and administrative expense 9,946  6,723  8,615  32,198  30,286 
Gain (loss) on extinguishment of debt, net —  —  —  36,339  (641)
Long-lived asset impairment —  1,588  5,965  5,965  1,588 
Other income (expense), net (2)
(480) 1,348  —  (532) 10,011 
Loss before provision for income taxes (1) (2)
(14,581) (16,742) (18,328) (20,854) (54,315)
Net loss (1) (2)
(14,629) (16,574) (18,411) (21,107) (54,401)
Adjusted EBITDA (1) (3)
9,302  4,572  9,270  33,904  16,981 
Community net operating income (NOI) (3)
$ 16,260  $ 10,324  $ 14,690  $ 57,899  $ 41,418 
Community net operating income margin (3)
27.4  % 19.3  % 24.8  % 25.0  % 19.8  %
Weighted average occupancy
85.9  % 83.9  % 84.9  % 84.6  % 83.0  %
(1) Includes $0.0 million, $0.0 million, $0.5 million, $2.9 million and $1.2 million of state grant revenue received in Q4 2023, Q4 2022, Q3 2023, Full Year 2023 and Full Year 2022, respectively.
(2) Includes $9.1 million for Federal provider relief funds for Full Year 2022.
(3) Adjusted EBITDA, Community Net Operating Income and Community Net Operating Income Margin are financial measures that are not calculated in accordance with U.S. Generally Accepted Accounting Principles (“GAAP”). See “Reconciliations of Non-GAAP Financial Measures” for the Company's definition of such measures, reconciliations to the most comparable GAAP financial measures, and other information regarding the use of the Company's non-GAAP financial measures.

Results of Operations
Three months ended December 31, 2023 as compared to three months ended December 31, 2022
Revenues
Resident revenue for the three months ended December 31, 2023 was $59.3 million as compared to $53.4 million for the three months ended December 31, 2022, an increase of $5.9 million, or 11.2%. The increase in revenue was primarily due to increased occupancy and increased average rent rates.
Expenses
Operating expenses for the three months ended December 31, 2023 were $44.4 million as compared to $45.1 million for the three months ended December 31, 2022, a decrease of $0.7 million. The decrease is primarily due to a $1.0 million decrease in real estate taxes, a $0.5 million decrease in utility costs, and a $0.6 million decrease in other expenses, partially offset by a $1.4 million increase in labor and employee-related expenses.
General and administrative expenses for the three months ended December 31, 2023 were $9.9 million as compared to $6.7 million for the three months ended December 31, 2022, representing an increase of $3.2 million. This increase is primarily due to $2.0 million in transaction costs related to our 2023 loan modifications and other transaction related expenses and $0.3 million in information technology related expenses. The remaining variance of $0.9 million represents the inflationary impact from the remaining recurring general and administrative expenses.


The Company reported a net loss of $14.6 million for the three months ended December 31, 2023, compared to a net loss of $16.6 million for the three months ended December 31, 2022. Significant factors impacting the comparison of net loss for these periods include long-lived asset impairment of $1.6 million in the three months ended December 31, 2022, offset by improved operational performance.
Adjusted EBITDA for the three months ended December 31, 2023 was $9.3 million compared to $4.6 million for the three months ended December 31, 2022. See “Reconciliation of Non-GAAP Financial Measures” below.

Year ended December 31, 2023 as compared to year ended December 31, 2022
Revenues
Resident revenue for the year ended December 31, 2023 was $232.0 million as compared to $208.7 million for the year ended December 31, 2022, an increase of $23.3 million, or 11.2%. The increase in revenue was primarily due to increased occupancy and increased average rent rates.
Expenses
Operating expenses for the year ended December 31, 2023 were $177.3 million as compared to $171.6 million for the year ended December 31, 2022, representing an increase of $5.7 million. The increase is primarily due to increases of $7.2 million in labor and employee-related expenses, including premium labor, $1.0 million in information technology related expenses, partially offset by decreases in real estate taxes of $1.2 million, $0.9 million of saving in programming expenses, and a $0.4 million decrease in other expenses. The $1.0 million increase in information technology costs primarily relates to the Company’s upgrade of it’s Wi-Fi capabilities at its communities.
General and administrative expenses for the year ended December 31, 2023 were $32.2 million as compared to $30.3 million for year ended December 31, 2022, an increase of $1.9 million. The increase is partially due to $4.0 million in transaction costs related to our 2023 loan modifications and other transaction related expenses, partially offset by a $1.6 million decrease in stock-based compensation expense as a result of prior year forfeiture credits in connection with executive personnel changes and a $1.0 million decrease in insurance costs in connection with the Company's transition to a new broker. The remaining variance of $0.5 million represents the inflationary impact from the remaining recurring general and administrative expenses.
Gain on extinguishment of debt for the year ended December 31, 2023 was $36.3 million as compared to a loss on extinguishment of debt of $0.6 million for the year ended December 31, 2022. The 2023 gain was related to the derecognition of notes payable and liabilities as a result of the transition of legal ownership of two communities to the Federal National Mortgage Association (“Fannie Mae”).
During the year ended December 31, 2023, the Company recorded a non-cash impairment charge of $6.0 million related to one owned community, compared to a $1.6 million non-cash impairment charge on one community during the year ended December 31, 2022.
Other expense for the year ended December 31, 2023 was $0.5 million as compared to other income of $10.0 million for the year ended December 31, 2022, which included $9.1 million of CARES Act funding for healthcare-related expenses and lost revenues attributable to COVID-19.
As a result of the foregoing factors, the Company reported net loss of $21.1 million and $54.4 million for the years ended December 31, 2023 and December 31, 2022, respectively.
Adjusted EBITDA for the year ended December 31, 2023 was $33.9 million compared to $17.0 million for the year ended December 31, 2022. See “Reconciliation of Non-GAAP Financial Measures” below.


Liquidity, Capital Resources, and Subsequent Events
Liquidity
At the beginning of 2023, the Company's liquidity conditions, including operating losses and net working capital deficits, raised substantial doubt about the Company's ability to continue as a going concern. As a result of increases in occupancy and rates occurring throughout 2023 and into the first quarter of 2024, annually scheduled rental rate increases in March 2024 and in connection with the 2024 private placement transaction and Protective Life loan purchase, the Company has substantially improved its liquidity position. Please see details below of the transactions which have increased cash on hand significantly. Based on these events, the Company concluded it has adequate cash to meet its obligations as they become due for the 12-month period following the date the December 31, 2023 financial statements are issued.
Securities Purchase Agreement
On February 1, 2024, the Company entered into a securities purchase agreement (the “Securities Purchase Agreement”) with affiliates of Conversant Capital and shareholders (together, the “Purchasers”), pursuant to which the Purchasers agreed to purchase from the Company, and the Company agreed to sell to the Purchasers, in a private placement transaction (the “Private Placement”) pursuant to Section 4(a)(2) of the Securities Act of 1933, as amended, an aggregate of 5,026,318 shares (the “Shares”) of the Company’s Common Stock, par value $0.01 per share, at a price of $9.50 per share.
The Private Placement occurred in two closings. At the first closing, which was completed on February 1, 2024, the Company issued and sold an aggregate of 3,350,878 Shares to the Purchasers and received gross cash proceeds of $31.8 million. At the second closing, which occurred on March 22, 2024, the Company issued the remaining 1,675,440 Shares to the Purchasers and received additional gross cash proceeds of $15.9 million.
The Company intends to use this new capital for working capital, continued investments in community improvements, acquisitions of new communities, broader community programming and other general corporate purposes.
Protective Life Loans
On February 2, 2024, the Company completed the Protective Life loan purchase of the total outstanding principal balance of $74.4 million from Protective Life Insurance Company (“Protective Life”) that was secured by seven of the Company’s senior living communities for a purchase price of $40.2 million. In addition to its aggregate deposits of $1.5 million made in December 2023 and January 2024, the Company funded the remaining cash portion of the purchase price (including one-time closing costs) with $15.4 million of net proceeds from the sale of the Shares at the first closing of the Private Placement. The Company obtained additional debt proceeds through its existing loan facility with Ally Bank for the remaining portion of the purchase price, as described below. The Company terminated these loans after completion of the purchase from Protective Life.


Ally Term Loan Expansion
On February 2, 2024, in connection with the Protective Life loan purchase, the Company expanded its outstanding loan obligation with Ally Bank in the amount of $24.8 million that was secured by six of the the Company’s senior living communities. As part of the agreement with Ally, the Company expanded its current interest rate cap to include the additional loan obligation at a cost of $0.6 million.
Cash flows
The table below presents a summary of the Company’s net cash provided by (used in) operating, investing, and financing activities (in thousands):
Years ended December 31,
2023 2022
Net cash provided by (used in) operating activities $ 10,683  $ (2,578)
Net cash used in investing activities (16,562) (36,904)
Net cash used in financing activities (7,113) (22,652)
Decrease in cash and cash equivalents $ (12,992) $ (62,134)

In addition to $4.1 million of unrestricted cash balances on hand at December 31, 2023, our future liquidity will depend in part upon our operating performance, which will be affected by prevailing economic conditions, and financial, business and other factors, some of which are beyond our control. Principal sources of liquidity are expected to be cash flows from operations, proceeds from equity financings, and proceeds from debt refinancings or loan modifications. During 2023, we entered into loan modifications with Fannie Mae, a loan amendment with Ally Bank, including a revised limited payment guaranty, and a $13.5 million equity commitment with Conversant. As of December 31, 2023, $3.5 million remains in the equity commitment.
The Company, from time to time, considers and evaluates financial and capital raising transactions related to its portfolio, including debt refinancings, purchases and sales of assets and other transactions. There can be no assurance that the Company will continue to generate cash flows at or above current levels, or that the Company will be able to obtain the capital necessary to meet the Company’s short and long-term capital requirements.
Recent changes in the current economic environment, and other future changes, could result in decreases in the fair value of assets, slowing of transactions, and the tightening of liquidity and credit markets. These impacts could make securing debt or refinancings for the Company or buyers of the Company’s properties more difficult or on terms not acceptable to the Company. The Company’s actual liquidity and capital funding requirements depend on numerous factors, including its operating results, its capital expenditures for community investment, and general economic conditions, as well as other factors described in the Company’s SEC filings.
Conference Call Information
The Company will host a conference call with senior management to discuss the Company’s financial results for the fourth quarter and full year 2023, on Wednesday March 27, 2024, at 12:30 p.m. Eastern Time. To participate, dial 877-407-0989 (no passcode required). A link to the simultaneous webcast of the teleconference will be available at: https://www.webcast-eqs.com/register/sonidaseniorliving_q42023_en/en
For the convenience of the Company’s shareholders and the public, the conference call will be recorded and available for replay starting March 28, 2024 through April 11, 2024. To access the conference call replay, call 877-660-6853, passcode 13743706. A transcript of the call will be posted in the Investor Relations section of the Company’s website.


About the Company
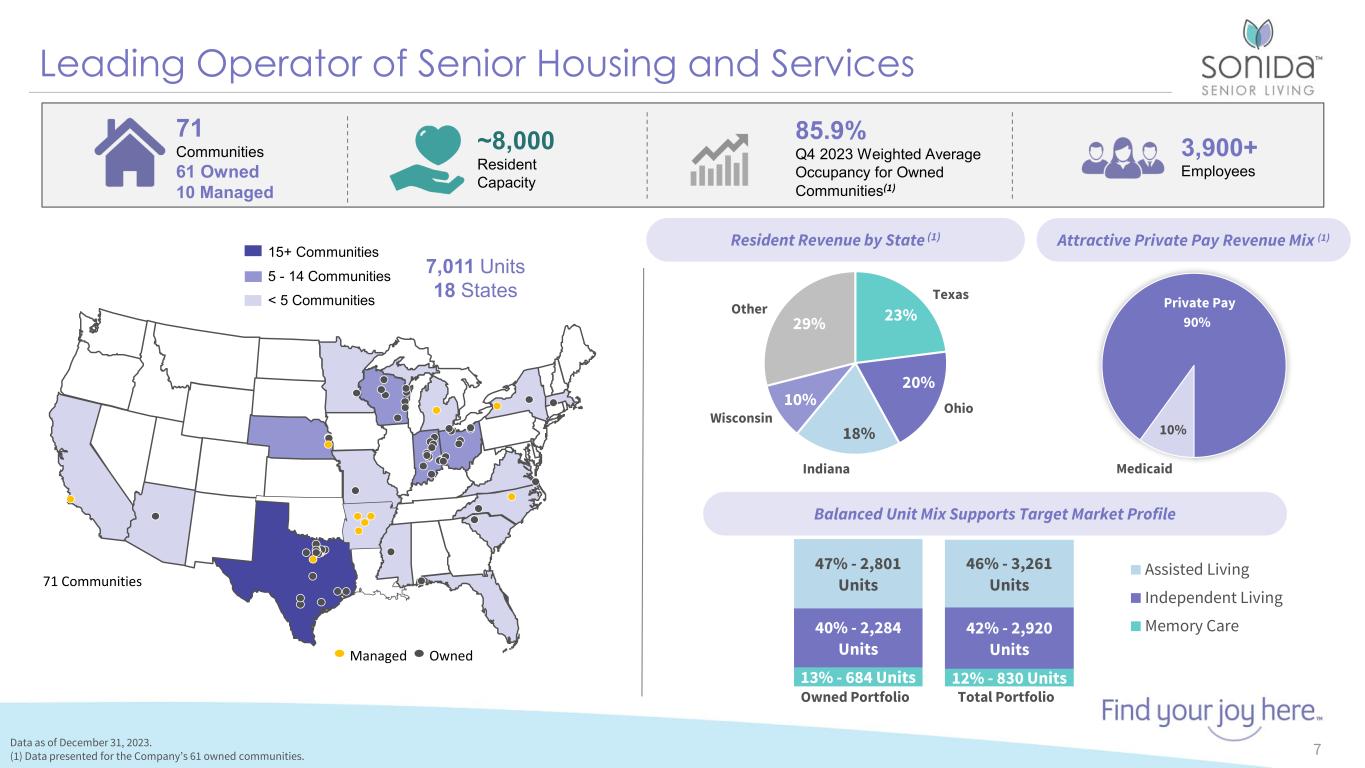
Dallas-based Sonida Senior Living, Inc. is a leading owner-operator of independent living, assisted living and memory care communities and services for senior adults. The Company provides compassionate, resident-centric services and care as well as engaging programming operating 71 senior housing communities in 18 states with an aggregate capacity of approximately 8,000 residents, including 61 communities which the Company owns and 10 communities that the Company third-party manages. For more information, visit www.sonidaseniorliving.com or connect with the Company on Facebook, Twitter or LinkedIn. 
Definitions of RevPAR and RevPOR
RevPAR, or average monthly revenue per available unit, is defined by the Company as resident revenue for the period, divided by the weighted average number of available units in the corresponding portfolio for the period, divided by the number of months in the period.

RevPOR, or average monthly revenue per occupied unit, is defined by the Company as resident revenue for the period, divided by the weighted average number of occupied units in the corresponding portfolio for the period, divided by the number of months in the period.

Safe Harbor

This release contains forward-looking statements which are subject to certain risks and uncertainties that could cause our actual results and financial condition of Sonida Senior Living, Inc. (the “Company,” “we,” “our” or “us”) to differ materially from those indicated in the forward-looking statements, including, among others, the risks, uncertainties and factors set forth under “Item. 1A. Risk Factors” in our Annual Report on Form 10-K for the fiscal year ended December 31, 2023, filed with the Securities and Exchange Commission (the “SEC”) on March 27, 2024, and also include the following: the Company’s ability to generate sufficient cash flows from operations, proceeds from equity issuances and debt financings, and proceeds from the sale of assets to satisfy its short and long-term debt obligations and to fund the Company’s acquisitions and capital improvement projects to expand, redevelop, and/or reposition its senior living communities; increases in market interest rates that increase the cost of certain of our debt obligations; increased competition for, or a shortage of, skilled workers, including due to general labor market conditions, along with wage pressures resulting from such increased competition, low unemployment levels, use of contract labor, minimum wage increases and/or changes in overtime laws; the Company’s ability to obtain additional capital on terms acceptable to it; the Company’s ability to extend or refinance its existing debt as such debt matures; the Company’s compliance with its debt agreements, including certain financial covenants and the risk of cross-default in the event such non-compliance occurs; the Company’s ability to complete acquisitions and dispositions upon favorable terms or at all; the risk of oversupply and increased competition in the markets which the Company operates; the Company’s ability to improve and maintain controls over financial reporting and remediate the identified material weakness discussed in Item 9 of our Annual Report on Form 10-K; the cost and difficulty of complying with applicable licensure, legislative oversight, or regulatory changes; risks associated with current global economic conditions and general economic factors such as inflation, the consumer price index, commodity costs, fuel and other energy costs, competition in the labor market, costs of salaries, wages, benefits, and insurance, interest rates, and tax rates; the impact from or the potential emergence and effects of a future epidemic, pandemic, outbreak of infectious disease or other health crisis; and changes in accounting principles and interpretations.


For information about Sonida Senior Living, visit www.sonidaseniorliving.com
Investor Contact: Kevin J. Detz, Chief Financial Officer, at 972-308-8343
Press Contact: media@sonidaliving.com.


SONIDA SENIOR LIVING, INC.
CONSOLIDATED STATEMENT OF OPERATIONS AND COMPREHENSIVE LOSS
(in thousands, except per share data)

Quarters Ended December 31, Years Ended December 31,
2023 2022 2023 2022
Revenues:
Resident revenue $ 59,349  $ 53,388  $ 232,032  $ 208,703 
Management fees 586  523  2,191  2,359 
Managed community reimbursement revenue 5,785  5,614  21,099  27,371 
Total revenues $ 65,720  $ 59,525  $ 255,322  $ 238,433 
Expenses:
Operating expense 44,367  45,073  177,323  171,635 
General and administrative expense 9,946  6,723  32,198  30,286 
Depreciation and amortization expense 10,137  9,508  39,888  38,448 
Long-lived asset impairment —  1,588  5,965  1,588 
Managed community reimbursement revenue 5,785  5,614  21,099  27,371 
Total expenses 70,235  68,506  276,473  269,328 
Other income (expense):
Interest income 87  188  608  235 
Interest expense (9,673) (9,297) (36,118) (33,025)
Gain (loss) on extinguishment of debt, net —  —  36,339  (641)
Other income (expense), net (480) 1,348  (532) 10,011 
Income (loss) before provision for income taxes (14,581) (16,742) (20,854) (54,315)
(Provision) benefit for income taxes (48) 168  (253) (86)
Net loss $ (14,629) $ (16,574) $ (21,107) $ (54,401)
Dividends on Series A convertible preferred stock —  —  —  (2,269)
Undeclared dividends on Series A convertible preferred stock (1,299) (1,168) (4,992) (2,300)
Net loss attributable to common stockholders $ (15,928) $ (17,742) $ (26,099) $ (58,970)
Per share data:
Basic net loss per share $ (2.17) $ (2.79) $ (3.85) $ (9.27)
Diluted net loss per share $ (2.17) $ (2.79) $ (3.85) $ (9.27)
Weighted average shares outstanding — basic 7,331  6,365  6,786  6,359 
Weighted average shares outstanding — diluted 7,331  6,365  6,786  6,359 
Comprehensive loss $ (14,629) $ (16,574) $ (21,107) $ (54,401)


SONIDA SENIOR LIVING, INC.
CONSOLIDATED BALANCE SHEET
(in thousands)
December 31, 2023 December 31, 2022
ASSETS
Current assets:
Cash and cash equivalents $ 4,082  $ 16,913 
Restricted cash 13,668  13,829 
Accounts receivable, net 8,017  6,114 
Federal and state income taxes receivable — 
Prepaid expenses and other 4,475  4,097 
Derivative assets, current 2,103  2,611 
Total current assets 32,345  43,566 
Property and equipment, net 588,179  615,754 
Derivative assets, non-current —  111 
Other assets, net 936  1,837 
Total assets $ 621,460  $ 661,268 
LIABILITIES AND SHAREHOLDERS’ DEFICIT
Current liabilities:
Accounts payable $ 11,375  $ 7,272 
Accrued expenses 42,388  36,944 
Current portion of notes payable, net of deferred loan costs 42,323  46,029 
Current portion of deferred income 4,041  3,419 
Federal and state income taxes payable 215  — 
Customer deposits 519  653 
Total current liabilities 100,861  95,187  94,317 
Other long-term liabilities 49  113 
Notes payable, net of deferred loan costs and current portion 587,099  625,002 
Total liabilities 688,009  719,432 
Commitments and contingencies
Redeemable preferred stock:
Series A convertible preferred stock, $0.01 par value; 41 shares authorized, 41 shares issued and outstanding as of December 31, 2023 and 2022 48,542  43,550 
Shareholders’ deficit:
Preferred stock, $0.01 par value:
Authorized shares — 15,000 as of December 31, 2023 and 2022; none issued or outstanding, except Series A convertible preferred stock as noted above —  — 
Common stock, $0.01 par value:
Authorized shares — 15,000 as of December 31, 2023 and 2022; 8,178 and 6,670 shares issued and outstanding as of December 31, 2023 and 2022, respectively 82  67 
Additional paid-in capital 302,992  295,277 
Retained deficit (418,165) (397,058)
Total shareholders’ deficit (115,091) (101,714)
Total liabilities, redeemable preferred stock and shareholders’ deficit $ 621,460  $ 661,268 


Sonida Senior Living, Inc.
Consolidated Statements of Cash Flows
(in thousands)
Years Ended December 31,
(In thousands) 2023 2022
Operating Activities
Net loss $ (21,107) $ (54,401)
Adjustments to reconcile net loss to net cash provided by (used in) operating activities:
Depreciation and amortization 39,888  38,448 
Amortization of deferred loan costs 1,552  1,281 
(Gain) loss on derivative instruments, net 2,981  (19)
Write-off of other assets —  535 
Loss on sale of assets, net 118  43 
Long-lived asset impairment 5,965  1,588 
Casualty impairments —  1,100 
(Gain) loss on extinguishment of debt (36,339) 641 
Provision for bad debt 1,151  1,159 
Non-cash stock-based compensation expense 2,749  4,327 
Other non-cash items (53) (498)
Changes in operating assets and liabilities:
Accounts receivable, net (3,249) (2,354)
Prepaid expenses and other assets 2,918  8,303 
Other assets, net 276  (141)
Accounts payable and accrued expenses 13,013  (2,245)
Federal and state income taxes receivable/payable 217  (601)
Deferred income 622  257 
Customer deposits (19) (1)
Net cash provided by (used in) operating activities 10,683  (2,578)
Investing Activities
Acquisition of new communities —  (12,342)
Capital expenditures (17,938) (24,562)
Proceeds from sale of assets 1,376  — 
Net cash used in investing activities (16,562) (36,904)
Financing Activities
Proceeds from notes payable —  88,125 
Repayments of notes payable (13,802) (102,351)
Deferred loan costs paid (825) (2,361)
Purchase of derivative assets (2,362) (2,703)
Proceeds from issuance of common stock 10,000  — 
Shares withheld for taxes —  (261)
Dividends paid on Series A convertible preferred stock —  (2,987)
Other financing costs (124) (114)
Net cash used in financing activities (7,113) (22,652)
Decrease in cash and cash equivalents (12,992) (62,134)
Cash and cash equivalents and restricted cash at beginning of year 30,742  92,876 
Cash and cash equivalents and restricted cash at end of year $ 17,750  $ 30,742 


RECONCILIATION OF NON-GAAP FINANCIAL MEASURES

This earnings release contains the financial measures (1) Community Net Operating Income and Adjusted Community Net Operating Income, (2) Community Net Operating Income Margin and Adjusted Community Net Operating Income Margin, (3) Adjusted EBITDA, (4) Revenue per Occupied Unit (RevPOR) and (5) Revenue per Available Unit (RevPAR), all of which are not calculated in accordance with U.S. GAAP. Presentations of these non-GAAP financial measures are intended to aid investors in better understanding the factors and trends affecting the Company’s performance and liquidity. However, investors should not consider these non-GAAP financial measures as a substitute for financial measures determined in accordance with GAAP, including net income (loss), income (loss) from operations, net cash provided by (used in) operating activities, or revenue. Investors are cautioned that amounts presented in accordance with the Company’s definitions of these non-GAAP financial measures may not be comparable to similar measures disclosed by other companies because not all companies calculate non-GAAP measures in the same manner. Investors are urged to review the following reconciliations of these non-GAAP financial measures from the most comparable financial measures determined in accordance with GAAP.

Community Net Operating Income and Consolidated Community Net Operating Income Margin are non-GAAP performance measures for the Company’s consolidated owned portfolio of communities that the Company defines as net income (loss) excluding: general and administrative expenses (inclusive of stock-based compensation expense), interest income, interest expense, other income/expense, provision for income taxes, settlement fees and expenses, depreciation and amortization expense, revenue and operating expenses from the Company’s disposed properties; and further adjusted to exclude income/expense associated with non-cash, non-operational, transactional, or organizational restructuring items that management does not consider as part of the Company’s underlying core operating performance and impacts the comparability of performance between periods. For the periods presented herein, such other items include depreciation and amortization expense, gain(loss) on extinguishment of debt, gain(loss) on disposition of assets, long-lived asset impairment, and loss on non-recurring settlements with third parties. The Community Net Operating Income Margin is calculated by dividing Community Net Operating Income by community resident revenue. Adjusted Community Net Operating Income and Adjusted Community Net Operating Income Margin are further adjusted to exclude the impact from non-recurring state grant funds received.

The Company believes that presentation of Community Net Operating Income, Community Net Operating Income Margin, Adjusted Community Net Operating Income, and Adjusted Community Net Operating Income Margin as performance measures are useful to investors because (i) they are one of the metrics used by the Company’s management to evaluate the performance of our core consolidated owed portfolio of communities, to review the Company’s comparable historic and prospective core operating performance of the consolidated owned communities, and to make day-to-day operating decisions; (ii) they provide an assessment of operational factors that management can impact in the short-term, namely revenues and the controllable cost structure of the organization, by eliminating items related to the Company’s financing and capital structure and other items that management does not consider as part of the Company’s underlying core operating performance, and impacts the comparability of performance between periods.

Community Net Operating Income, Net Community Operating Income Margin, Adjusted Community Net Operating Income, and Adjusted Community Net Operating Income Margin have material limitations as a performance measure, including: (i) excluded general and administrative expenses are necessary to operate the Company and oversee its communities; (ii) excluded interest is necessary to operate the Company’s business under its current financing and capital structure; (iii) excluded depreciation, amortization, and impairment charges may represent the wear and tear and/or reduction in value of the Company’s communities, and other assets and may be indicative of future needs for capital expenditures; and (iv) the Company may incur income/expense similar to those for which adjustments are made, such as gain (loss) on debt extinguishment, gain(loss) on disposition of assets, loss on settlements, non-cash stock-based compensation expense, and transaction and other costs, and such income/expense may significantly affect the Company’s operating results.


(in thousands) Three Months Ended
December 31,
Quarter ended September 30, Years Ended
December 31,
2023 2022 2023 2023 2022
Consolidated Community Net Operating Income
Net loss $ (14,629) $ (16,574) $ (18,411) $ (21,107) $ (54,401)
General and administrative expense 9,946 6,723 8,615 32,198 30,286
Depreciation and amortization expense 10,137 9,508 9,943 39,888 38,448
Long-lived asset impairment 1,588 5,965 5,965 1,588
Interest income (87) (188) (139) (608) (235)
Interest expense 9,673 9,297 9,020 36,118 33,025
(Gain) loss on extinguishment of debt, net (36,339) 641
Other (income) expense, net 480 (1,348) 124 532 (10,011)
Provision (benefit) for income taxes 48 (168) 83 253 86
Settlement (income) fees and expense, net (1)
692 1,486 (510) 999 1,991
Consolidated community net operating income 16,260 10,324 14,690 57,899 41,418
Resident revenue $ 59,349 $ 53,388 $ 59,117 $ 232,032 $ 208,703 
Consolidated community net operating income margin 27.4% 19.3% 24.8% 25.0% 19.8%
COVID-19 state relief grants (2)
478 2,926 1,213
Adjusted resident revenue 59,349 53,388 58,639 229,106 207,490
Adjusted community net operating income $ 16,260 $ 10,324 $ 14,212 $ 54,973 $ 40,205
Adjusted community net operating income margin 27.4  % 19.3  % 24.2  % 24.0  % 19.4  %
(1) Settlement fees and expenses relate to non-recurring settlements with third parties for contract terminations, insurance claims, and related fees.
(2) COVID-19 relief revenue are grants and other funding received from third parties to aid in the COVID-19 response and includes state relief funds received.


ADJUSTED EBITDA (UNAUDITED)

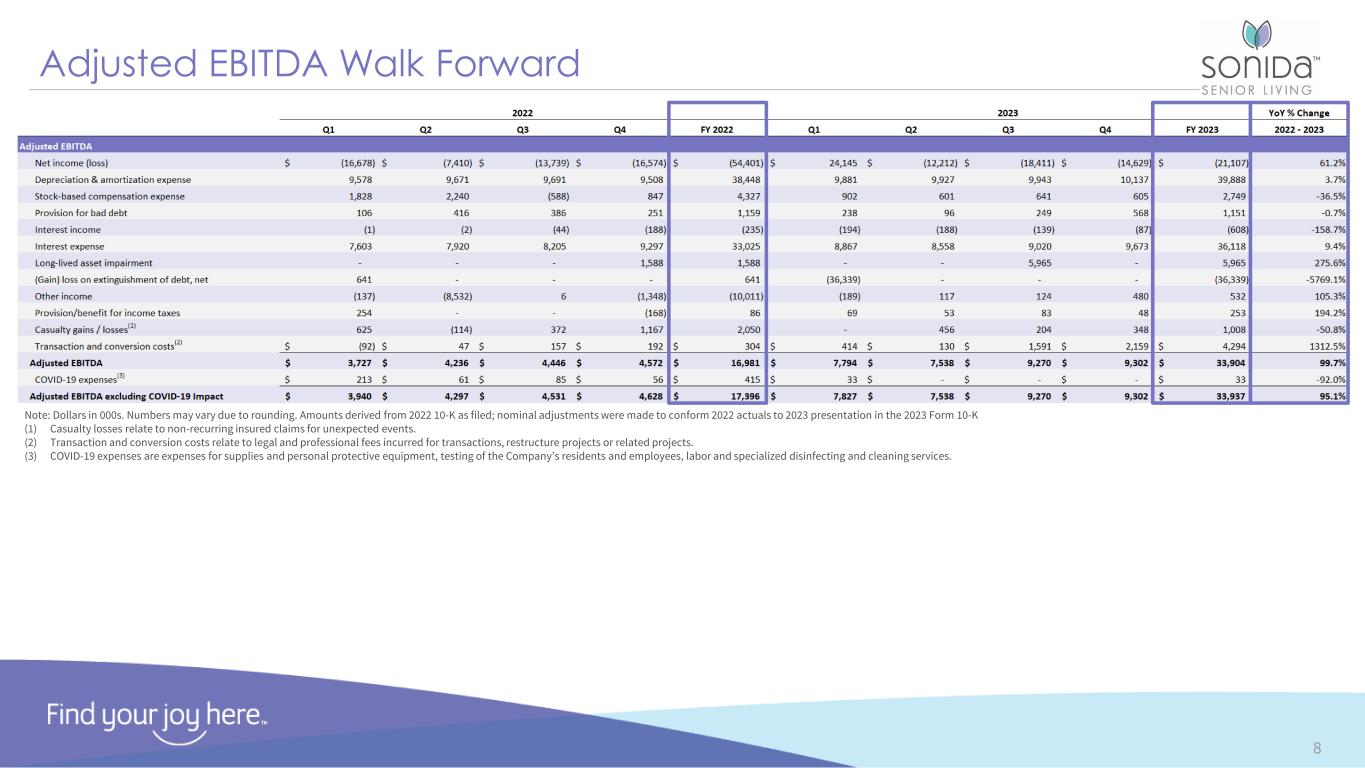
Adjusted EBITDA is a non-GAAP performance measure that the Company defines as net income (loss) excluding: depreciation and amortization expense, interest income, interest expense, other expense/income, provision for income taxes; and further adjusted to exclude income/expense associated with non-cash, non-operational, transactional, or organizational restructuring items that management does not consider as part of the Company’s underlying core operating performance and impacts the comparability of performance between periods. For the periods presented herein, such other items include stock-based compensation expense, provision for bad debts, gain (loss) on extinguishment of debt, long-lived asset impairment, casualty losses, and transaction and conversion costs.

The Company believes that presentation of Adjusted EBITDA as a performance measure is useful to investors because it provides an assessment of operational factors that management can impact in the short-term, namely revenues and the controllable cost structure of the organization, by eliminating items related to the Company’s financing and capital structure and other items that management does not consider as part of the Company’s underlying core operating performance and that management believes impact the comparability of performance between periods.

Adjusted EBITDA has material limitations as a performance measure, including: (i) excluded interest is necessary to operate the Company’s business under its current financing and capital structure; (ii) excluded depreciation, amortization and impairment charges may represent the wear and tear and/or reduction in value of the Company’s communities and other assets and may be indicative of future needs for capital expenditures; and (iii) the Company may incur income/expense similar to those for which adjustments are made, such as bad debts, gain(loss) on sale of assets, or gain(loss) on debt extinguishment, non-cash stock-based compensation expense and transaction and other costs, and such income/expense may significantly affect the Company’s operating results.
(In thousands) Three Months Ended
December 31,
Three months ended September 30, Years Ended
December 31,
2023 2022 2023 2023 2022
Adjusted EBITDA
Net loss $ (14,629) $ (16,574) $ (18,411) $ (21,107) $ (54,401)
Depreciation and amortization expense 10,137  9,508  9,943  39,888  38,448 
Stock-based compensation expense 605  847  641  2,749  4,327 
Provision for bad debt 568  251  249  1,151  1,159 
Interest income (87) (188) (139) (608) (235)
Interest expense 9,673  9,297  9,020  36,118  33,025 
Long-lived asset impairment —  1,588  5,965  5,965  1,588 
(Gain) loss on extinguishment of debt, net —  —  —  (36,339) 641 
Other (income) expense, net 480  (1,348) 124  532  (10,011)
Provision for income taxes 48  (168) 83  253  86 
Casualty losses (1)
348  1,167  204  1,008  2,050 
Transaction and conversion costs (2)
2,159  192  1,591  4,294  304 
Adjusted EBITDA $ 9,302  $ 4,572  $ 9,270  $ 33,904  $ 16,981 
(1) Casualty losses relate to non-recurring insured claims for unexpected events.
(2) Transaction and conversion costs relate to legal and professional fees incurred for transactions, restructuring projects, or related projects.


SUPPLEMENTAL INFORMATION
Fourth Quarter
(Dollars in thousands) 2023 2022 Increase (decrease) Third Quarter 2023 Sequential increase (decrease)
Selected Operating Results
I. Consolidated community portfolio
Number of communities 61 62 (1) 61
Unit capacity 5,700 5,776 (76) 5,718 (18)
Weighted average occupancy (1)
85.9% 83.9% 2.0% 84.9% 1.0%
RevPAR $3,470 $3,081 $389 $3,446 $24
RevPOR $4,042 $3,674 $368 $4,061 $(19)
Consolidated community net operating income $16,260 $10,324 $5,936 $14,690 $1,570
Consolidated community net operating income margin 27.4% 19.3% 8.1% 24.8% 2.6%
Consolidated community net operating income, net of general and administrative expenses (2)
$6,314 $3,601 $2,713 $6,075 $239
Consolidated community net operating income margin, net of general and administrative expenses (2)
10.6% 6.7% 3.9% 10.3% 0.3%
II. Consolidated Debt Information
(Excludes insurance premium financing)
Total variable rate mortgage debt (4)
$137,320 $137,652 N/A $137,320 N/A
Total fixed rate debt 492,998 535,303 N/A 493,436 N/A
(1) Weighted average occupancy represents actual days occupied divided by total number of available days during the quarter.
(2) General and administrative expenses exclude stock-based compensation expense in order to remove the fluctuation in fair value due to market volatility.
(3) Includes $0.0 million, $0.0 million, and $0.5 million of state grant revenue received in Q4 2023, Q4 2022, and Q3 2023, respectively. Excluding the grant revenue, Q3 2023 consolidated community NOI margin was 24.2%.
(4) As of December 31, 2023, the entire balance of our outstanding variable-rate debt obligations were covered by interest rate cap agreements.

EX-99.2 4 q42023-investordeckandsu.htm EX-99.2 q42023-investordeckandsu
A Leading Operator, Owner and Investor in Senior Living Investor Presentation – March 27, 2024


Forward-Looking Statements 2 This presentation contains forward-looking statements which are subject to certain risks and uncertainties that could cause our actual results and financial condition of Sonida Senior Living, Inc. (the “Company,” “we,” “our” or “us”) to differ materially from those indicated in the forward-looking statements, including, among others, the risks, uncertainties and factors set forth under “Item. 1A. Risk Factors” in our Annual Report on Form 10-K for the fiscal year ended December 31, 2023, filed with the Securities and Exchange Commission (the “SEC”) on March 27, 2024, and also include the following: The Company’s ability to generate sufficient cash flows from operations, proceeds from equity issuances and debt financings and proceeds from the sale of assets to satisfy its short and long-term debt obligations and to fund the Company’s acquisitions and capital improvement projects to expand, redevelop and/or reposition its senior living communities; increases in market interest rates that increase the cost of certain of our debt obligations; increased competition for, or a shortage of, skilled workers, including due to general labor market conditions, along with wage pressures resulting from such increased competition, low unemployment levels, use of contract labor, minimum wage increases and/or changes in overtime laws; the Company’s ability to obtain additional capital on terms acceptable to it; the Company’s ability to extend or refinance its existing debt as such debt matures; the Company’s compliance with its debt agreements, including certain financial covenants, and the risk of cross-default in the event such non-compliance occurs; the Company’s ability to complete acquisitions and dispositions upon favorable terms or at all; the risk of oversupply and increased competition in the markets which the Company operates; the Company’s ability to improve and maintain controls over financial reporting and remediate the identified material weakness discussed in Item 9 of our Annual Report on Form 10-K; the cost and difficulty of complying with applicable licensure, legislative oversight or regulatory changes; risks associated with current global economic conditions and general economic factors such as inflation, the consumer price index, commodity costs, fuel and other energy costs, competition in the labor market, costs of salaries, wages, benefits and insurance, interest rates and tax rates; the impact from the potential emergence and effects of a future epidemic, pandemic, outbreak of infectious disease or other health crisis; and changes in accounting principles and interpretations. We caution you that the risks, uncertainties and other factors referenced above may not contain all of the risks, uncertainties and other factors that are important to you. In addition, we cannot assure you that we will realize the results, benefits or outcomes that we expect or anticipate or, even if substantially realized, that they will result in the consequences or affect us or our business in the way expected. For information about the Company, visit www.sonidaseniorliving.com.


Non-GAAP Financial Measures 3 This presentation contains financial measures: (1) Adjusted Operating Expenses, (2) Community Net Operating Income, (3) Community Net Operating Income Margin, (4) Adjusted Community Net Operating Income, (5) Adjusted Community Net Operating Income Margin, (6) Adjusted G&A Expense, (7) Revenue per Occupied Unit (RevPOR), (8) Revenue per Available Unit (RevPAR) and (9) Adjusted EBITDA, which are not calculated in accordance with U.S. Generally Accepted Accounting Principles ("GAAP"). Presentations of these non-GAAP financial measures are intended to aid investors in better understanding the factors and trends affecting the Company’s performance and liquidity. However, investors should not consider these non-GAAP financial measures as a substitute for financial measures determined in accordance with GAAP, including net income (loss), income (loss) from operations or net cash provided by (used in) operating activities. Investors are cautioned that amounts presented in accordance with the Company’s definitions of these non-GAAP financial measures may not be comparable to similar measures disclosed by other companies because not all companies calculate non-GAAP measures in the same manner. Investors are urged to review the reconciliations of these non-GAAP financial measures contained in the Company’s most recent earnings release from the most comparable financial measures determined in accordance with GAAP. Adjusted Operating Expenses, Community Net Operating Income, Community Net Operating Income Margin, Adjusted Community Net Operating Income and Adjusted Community Net Operating Income Margin or Operating Margin are non- GAAP performance measures for the Company’s consolidated owned portfolio of communities that the Company defines as net income (loss) excluding: general and administrative expenses, interest income, interest expense, other income/expense, provision for income taxes, settlement fees and expenses, revenue and operating expenses from the Company’s disposed properties; and further adjusted to exclude income/expense associated with non-cash, non- operational, transactional or organizational restructuring items that management does not consider as part of the Company’s underlying core operating performance and that management believes impact the comparability of performance between periods. For the periods presented herein, such other items include depreciation and amortization expense, gain(loss) on extinguishment of debt, gain(loss) on disposition of assets, long-lived asset impairment and loss on non- recurring settlements with third parties. Both Adjusted Community Net Operating Income and Adjusted Community Net Operating Income Margin exclude the impact from non-recurring state grant funds received. Adjusted G&A Expense excludes non-recurring expenses including: stock compensation expense, sold properties expense, transaction costs, conversion costs and other non-recurring costs. RevPAR, or average monthly revenue per available unit, is defined by the Company as resident revenue for the period, divided by the weighted average number of available units in the corresponding portfolio for the period, divided by the number of months in the period. RevPOR, or average monthly revenue per occupied unit, is defined by the Company as resident revenue for the period, divided by the weighted average number of occupied units in the corresponding portfolio for the period, divided by the number of months in the period. Same-store Weighted Average Occupancy and Same-store End of Period Spot Occupancy excludes occupancy from non-same-store communities acquired and divested in the presented periods. The Company believes that presentation of Adjusted Operating Expenses, Community Net Operating Income, Community Net Operating Income Margin, Adjusted Community Net Operating Income, Adjusted Community Net Operating Income Margin or Operating Margin and Adjusted G&A Expense as performance measures are useful to investors because (i) they are some of the metrics used by the Company’s management to evaluate the performance of our core portfolio of communities, to review the Company’s comparable historic and prospective core operating performance of the consolidated owned communities and to make day-to-day operating decisions; (ii) they provide an assessment of operational factors that management can impact in the short-term, namely revenues and the controllable cost structure of the organization, by eliminating items related to the Company’s financing and capital structure and other items that management does not consider as part of the Company’s underlying core operating performance and that management believes impact the comparability of performance between periods. Adjusted Operating Expenses, Net Operating Income, Community Net Operating Income Margin, Adjusted Community Net Operating Income, Adjusted Community Net Operating Income Margin or Operating Margin and Adjusted G&A Expense have material limitations as a performance measure, including: (i) excluded interest is necessary to operate the Company’s business under its current financing and capital structure; (ii) excluded depreciation, amortization and impairment charges may represent the wear and tear and/or reduction in value of the Company’s communities, and other assets and may be indicative of future needs for capital expenditures; and (iii) the Company may incur income/expense similar to those for which adjustments are made, such as gain/loss on sale of assets, facility lease termination, or debt extinguishment, non-cash stock-based compensation expense and transaction and other costs, and such income/expense may significantly affect the Company’s operating results. Adjusted EBITDA is a non-GAAP performance measure that the Company defines as net income (loss) excluding: depreciation and amortization expense, interest income, interest expense, other expense/income, provision for income taxes; and further adjusted to exclude income/expense associated with non-cash, non-operational, transactional or organizational restructuring items that management does not consider as part of the Company’s underlying core operating performance and impacts the comparability of performance between periods. For the periods presented herein, such other items include stock-based compensation expense, provision for bad debts, gain (loss) on extinguishment of debt, gain on sale of assets, long-lived asset impairment, casualty losses and transaction and conversion costs.


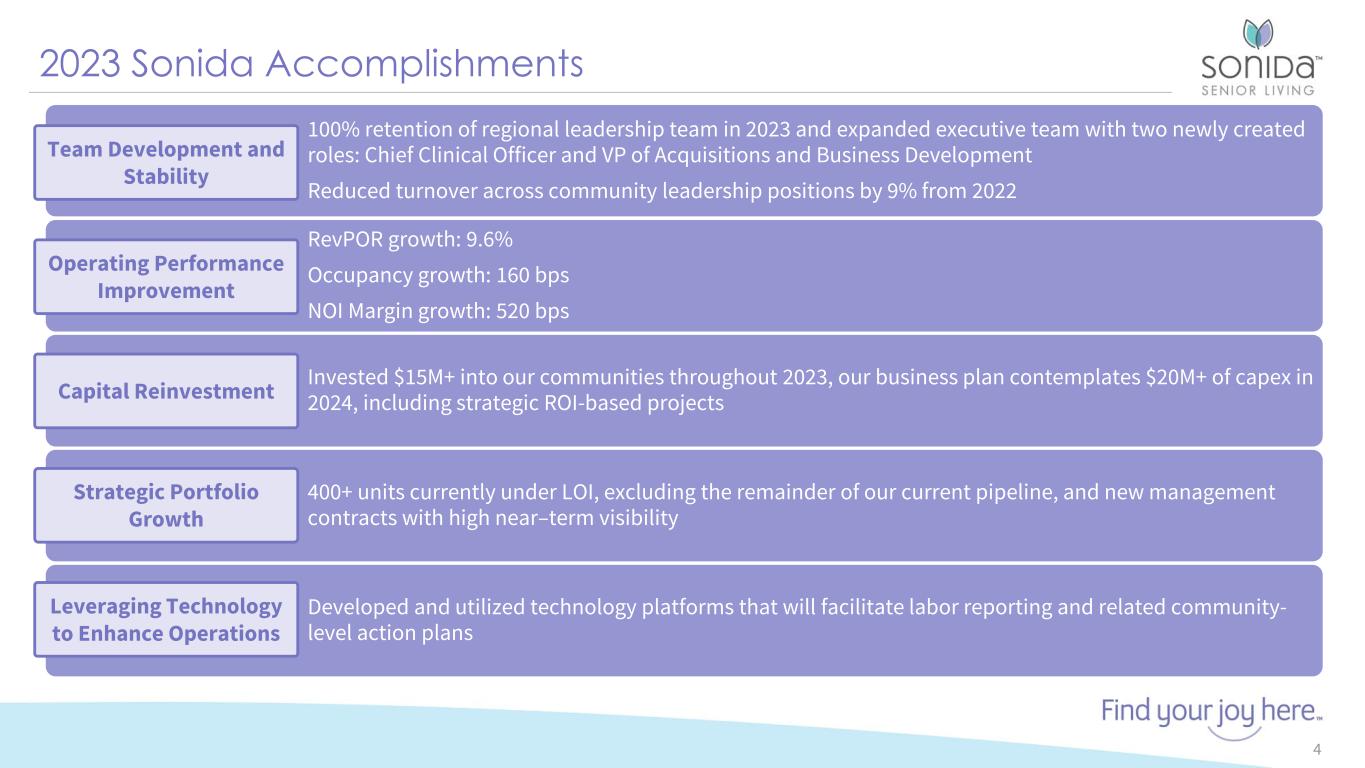
2023 Sonida Accomplishments 4 100% retention of regional leadership team in 2023 and expanded executive team with two newly created roles: Chief Clinical Officer and VP of Acquisitions and Business Development Reduced turnover across community leadership positions by 9% from 2022 RevPOR growth: 9.6% Occupancy growth: 160 bps NOI Margin growth: 520 bps Invested $15M+ into our communities throughout 2023, our business plan contemplates $20M+ of capex in 2024, including strategic ROI-based projects 400+ units currently under LOI, excluding the remainder of our current pipeline, and new management contracts with high near–term visibility Developed and utilized technology platforms that will facilitate labor reporting and related community- level action plans Operating Performance Improvement Capital Reinvestment Strategic Portfolio Growth Team Development and Stability Leveraging Technology to Enhance Operations


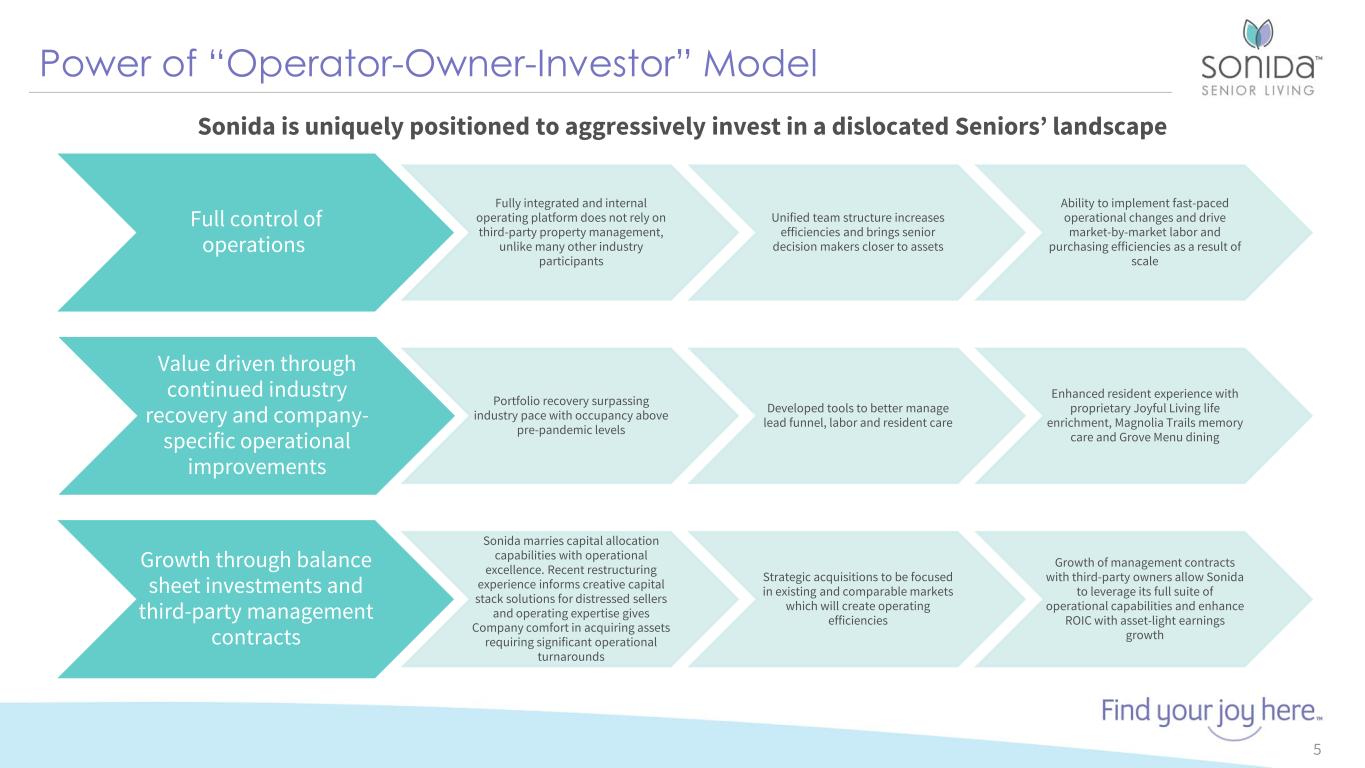
Power of “Operator-Owner-Investor” Model 5 Full control of operations Fully integrated and internal operating platform does not rely on third-party property management, unlike many other industry participants Unified team structure increases efficiencies and brings senior decision makers closer to assets Ability to implement fast-paced operational changes and drive market-by-market labor and purchasing efficiencies as a result of scale Value driven through continued industry recovery and company- specific operational improvements Portfolio recovery surpassing industry pace with occupancy above pre-pandemic levels Developed tools to better manage lead funnel, labor and resident care Enhanced resident experience with proprietary Joyful Living life enrichment, Magnolia Trails memory care and Grove Menu dining Growth through balance sheet investments and third-party management contracts Sonida marries capital allocation capabilities with operational excellence. Recent restructuring experience informs creative capital stack solutions for distressed sellers and operating expertise gives Company comfort in acquiring assets requiring significant operational turnarounds Strategic acquisitions to be focused in existing and comparable markets which will create operating efficiencies Growth of management contracts with third-party owners allow Sonida to leverage its full suite of operational capabilities and enhance ROIC with asset-light earnings growth Sonida is uniquely positioned to aggressively invest in a dislocated Seniors’ landscape


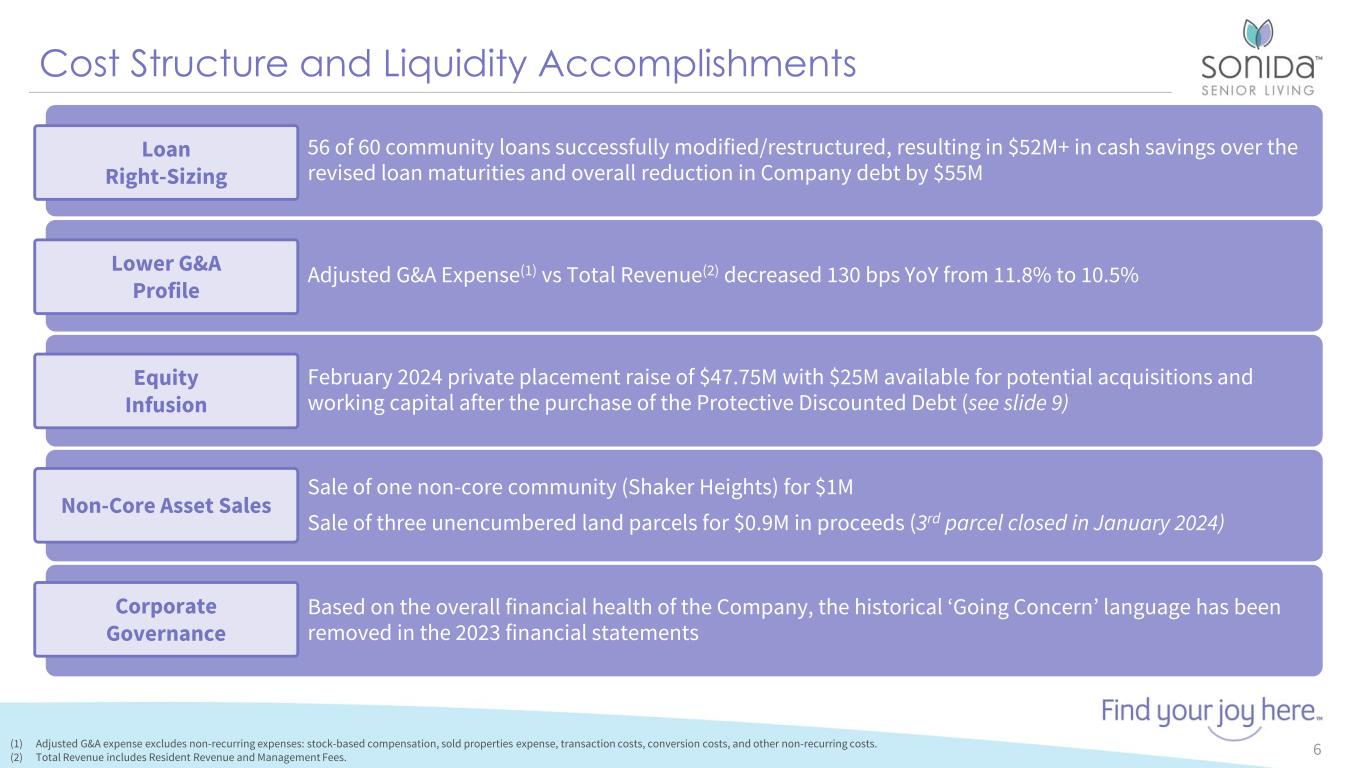
Cost Structure and Liquidity Accomplishments 6(1) Adjusted G&A expense excludes non-recurring expenses: stock-based compensation, sold properties expense, transaction costs, conversion costs, and other non-recurring costs. (2) Total Revenue includes Resident Revenue and Management Fees. 56 of 60 community loans successfully modified/restructured, resulting in $52M+ in cash savings over the revised loan maturities and overall reduction in Company debt by $55M Adjusted G&A Expense(1) vs Total Revenue(2) decreased 130 bps YoY from 11.8% to 10.5% February 2024 private placement raise of $47.75M with $25M available for potential acquisitions and working capital after the purchase of the Protective Discounted Debt (see slide 9) Sale of one non-core community (Shaker Heights) for $1M Sale of three unencumbered land parcels for $0.9M in proceeds (3rd parcel closed in January 2024) Based on the overall financial health of the Company, the historical ‘Going Concern’ language has been removed in the 2023 financial statements Lower G&A Profile Equity Infusion Non-Core Asset Sales Loan Right-Sizing Corporate Governance


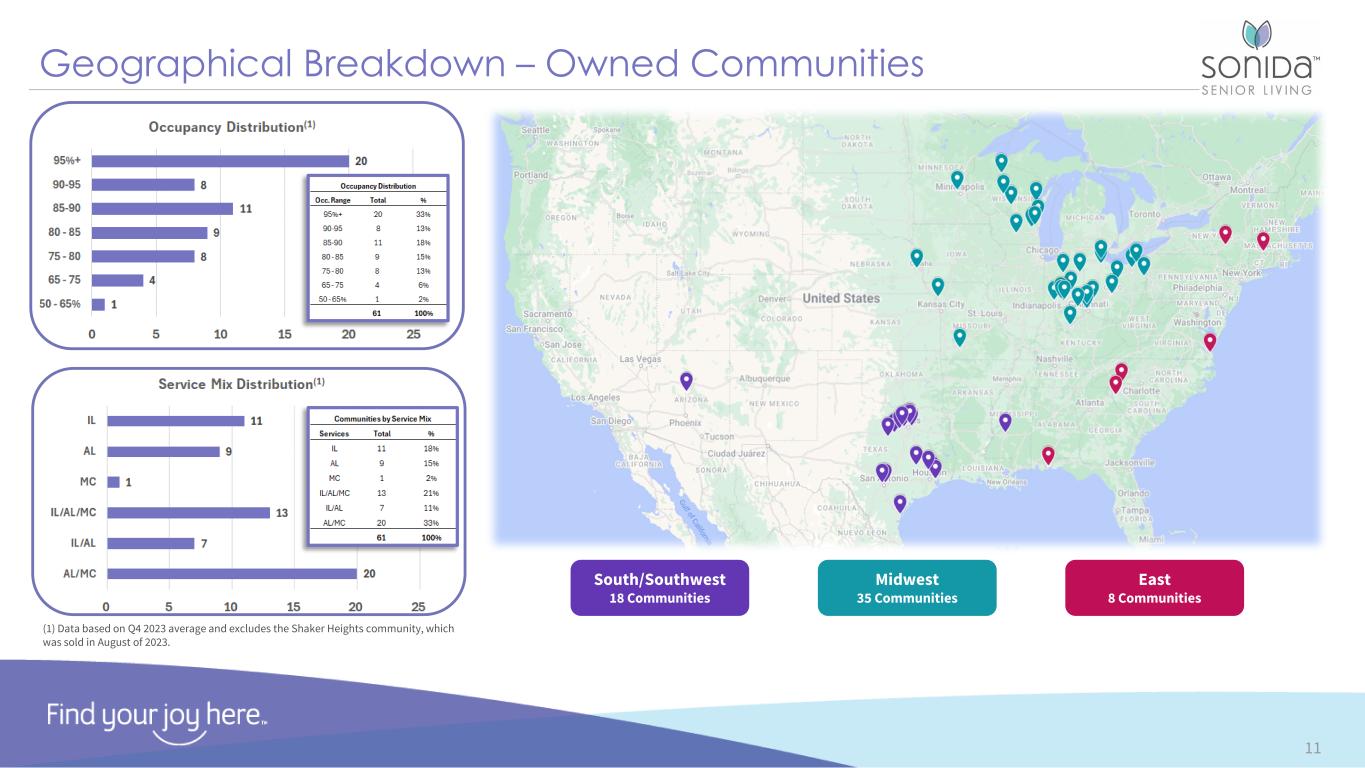
23% 20% 18% 10% 29% Texas Ohio Wisconsin Indiana Other 10% 90% Medicaid Private Pay 71 Communities 61 Owned 10 Managed ~8,000 Resident Capacity 3,900+ Employees 85.9% Q4 2023 Weighted Average Occupancy for Owned Communities(1) Leading Operator of Senior Housing and Services 7 71 Communities Resident Revenue by State (1) Balanced Unit Mix Supports Target Market Profile Attractive Private Pay Revenue Mix (1) 15+ Communities 5 - 14 Communities < 5 Communities 7,011 Units 18 States OwnedManaged Data as of December 31, 2023. (1) Data presented for the Company’s 61 owned communities. 13% - 684 Units 40% - 2,284 Units 47% - 2,801 Units Assisted Living Independent Living Memory Care 12% - 830 Units 42% - 2,920 Units 46% - 3,261 Units Assisted Living Independent Living Memory Care Owned Portfolio Total Portfolio


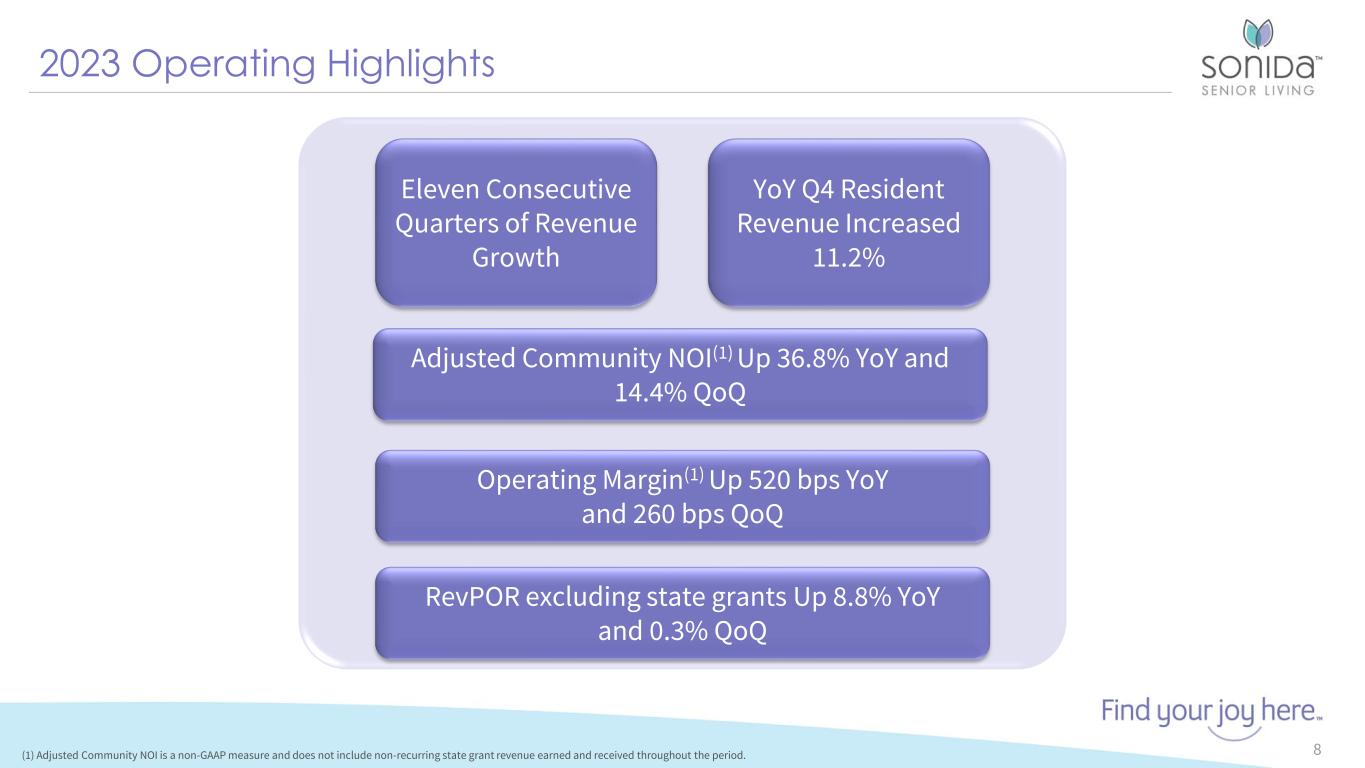
2023 Operating Highlights 8 RevPOR excluding state grants Up 8.8% YoY and 0.3% QoQ YoY Q4 Resident Revenue Increased 11.2% Adjusted Community NOI(1) Up 36.8% YoY and 14.4% QoQ (1) Adjusted Community NOI is a non-GAAP measure and does not include non-recurring state grant revenue earned and received throughout the period. Eleven Consecutive Quarters of Revenue Growth Operating Margin(1) Up 520 bps YoY and 260 bps QoQ


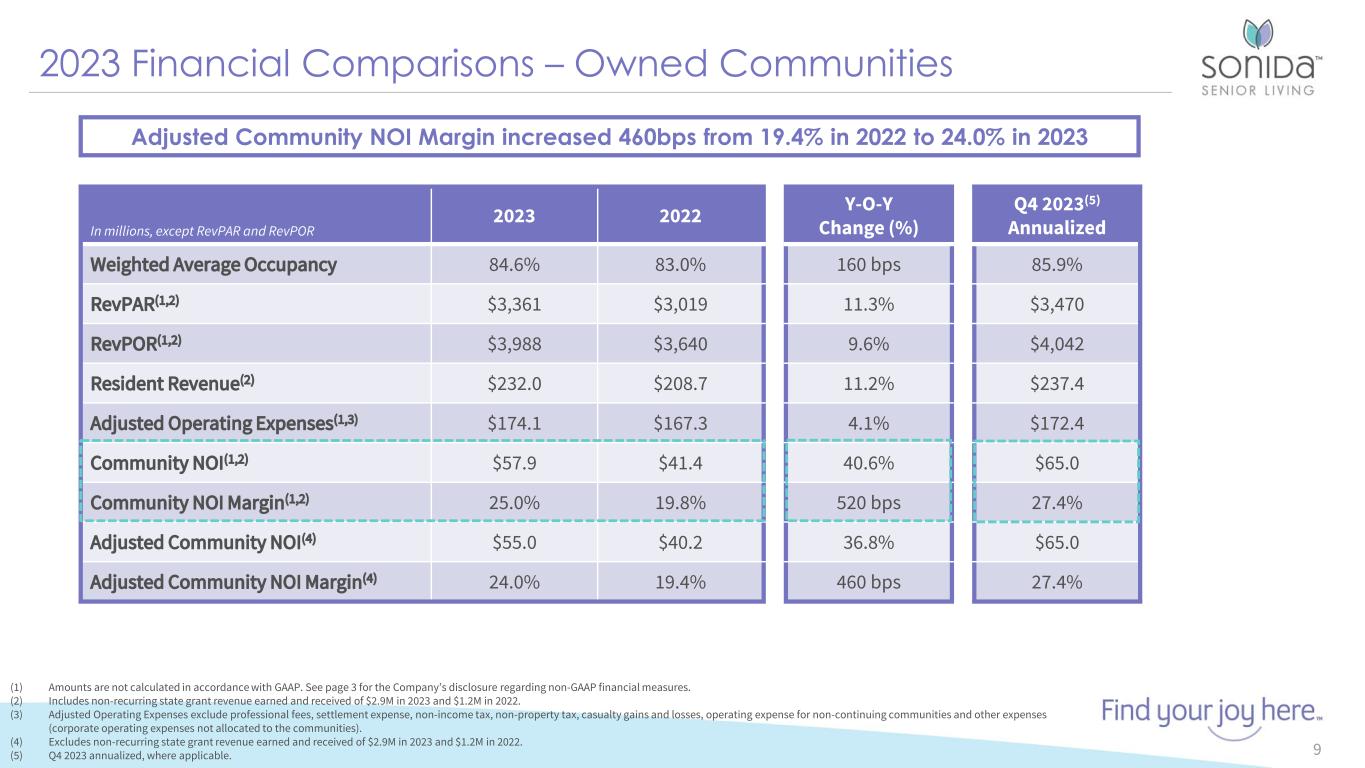
2023 Financial Comparisons – Owned Communities 9 In millions, except RevPAR and RevPOR 2023 2022 Y-O-Y Change (%) Q4 2023(5) Annualized 84.6% 83.0% 160 bps 85.9% $3,361 $3,019 11.3% $3,470 $3,988 $3,640 9.6% $4,042 $232.0 $208.7 11.2% $237.4 $174.1 $167.3 4.1% $172.4 $57.9 $41.4 40.6% $65.0 25.0% 19.8% 520 bps 27.4% $55.0 $40.2 36.8% $65.0 24.0% 19.4% 460 bps 27.4% (1) Amounts are not calculated in accordance with GAAP. See page 3 for the Company’s disclosure regarding non-GAAP financial measures. (2) Includes non-recurring state grant revenue earned and received of $2.9M in 2023 and $1.2M in 2022. (3) Adjusted Operating Expenses exclude professional fees, settlement expense, non-income tax, non-property tax, casualty gains and losses, operating expense for non-continuing communities and other expenses (corporate operating expenses not allocated to the communities). (4) Excludes non-recurring state grant revenue earned and received of $2.9M in 2023 and $1.2M in 2022. (5) Q4 2023 annualized, where applicable. Adjusted Community NOI Margin increased 460bps from 19.4% in 2022 to 24.0% in 2023


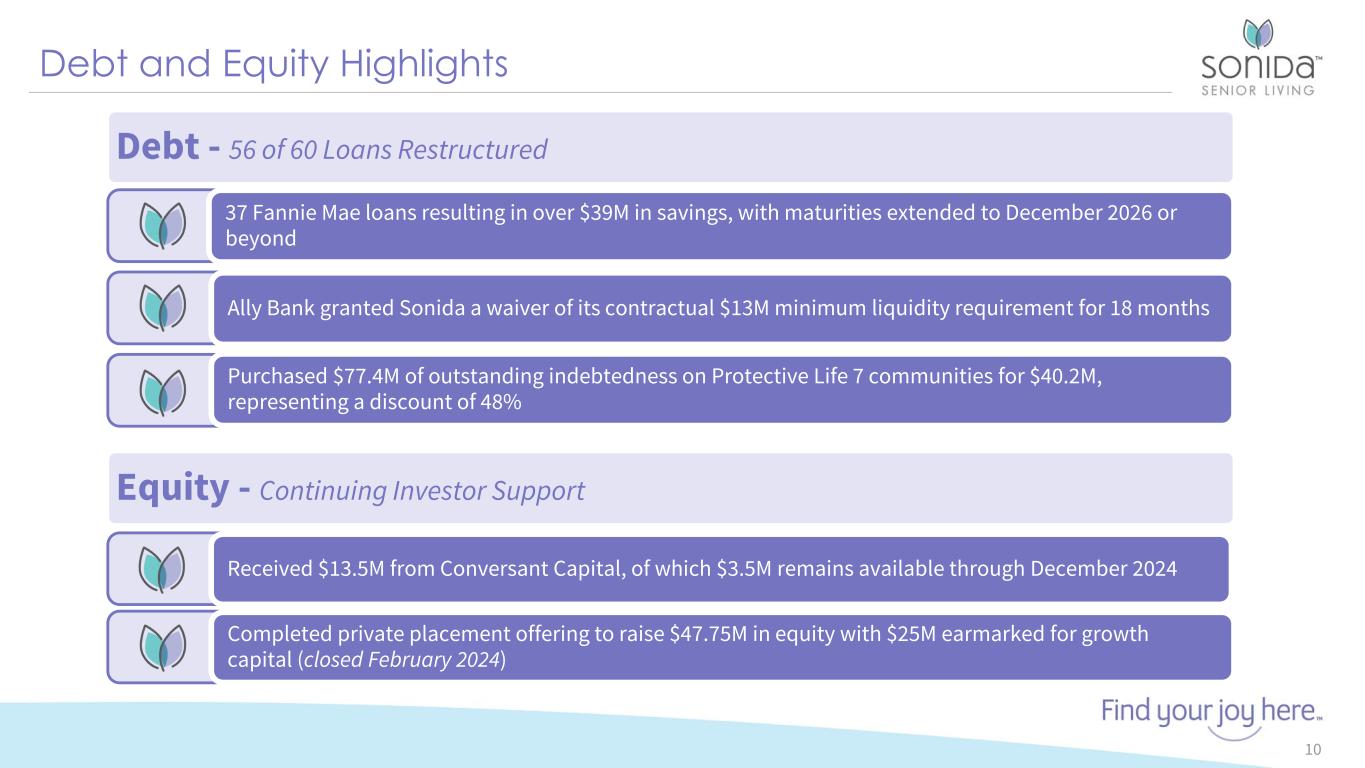
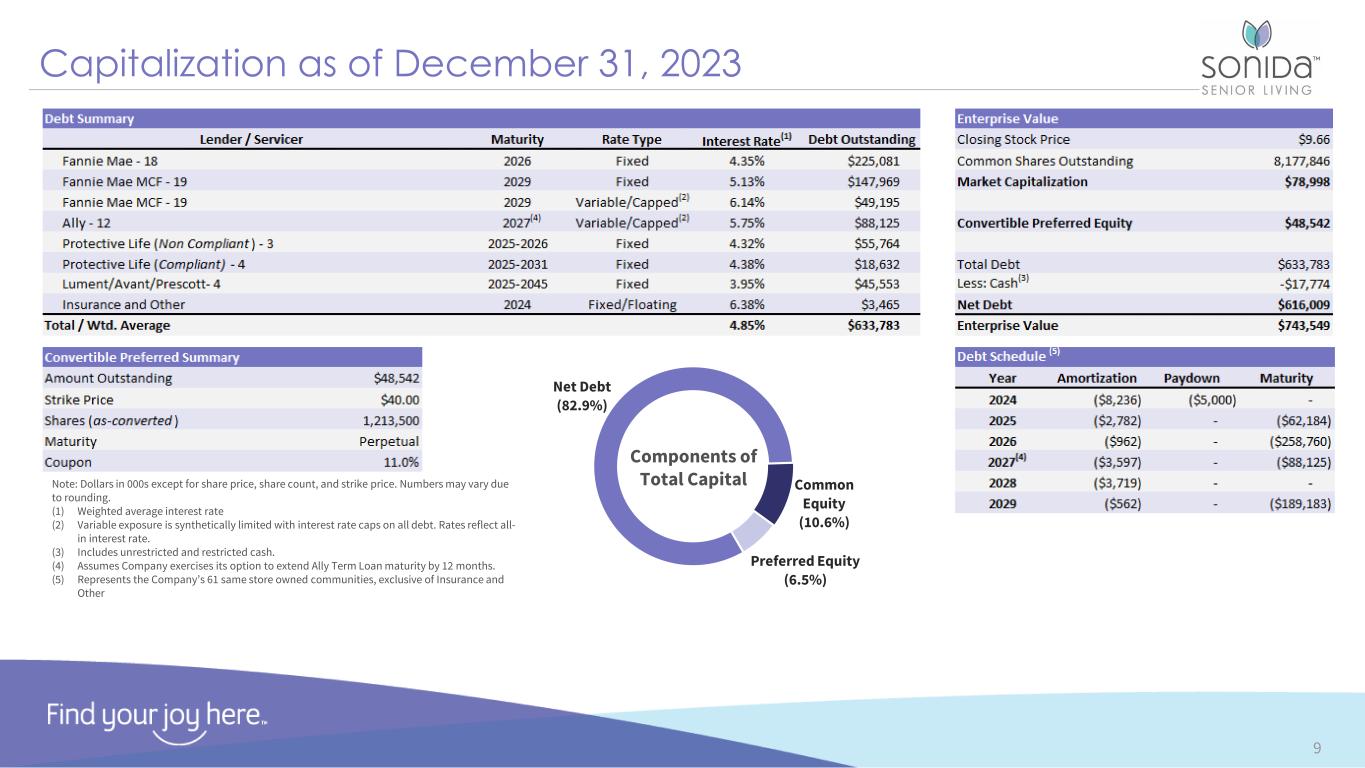
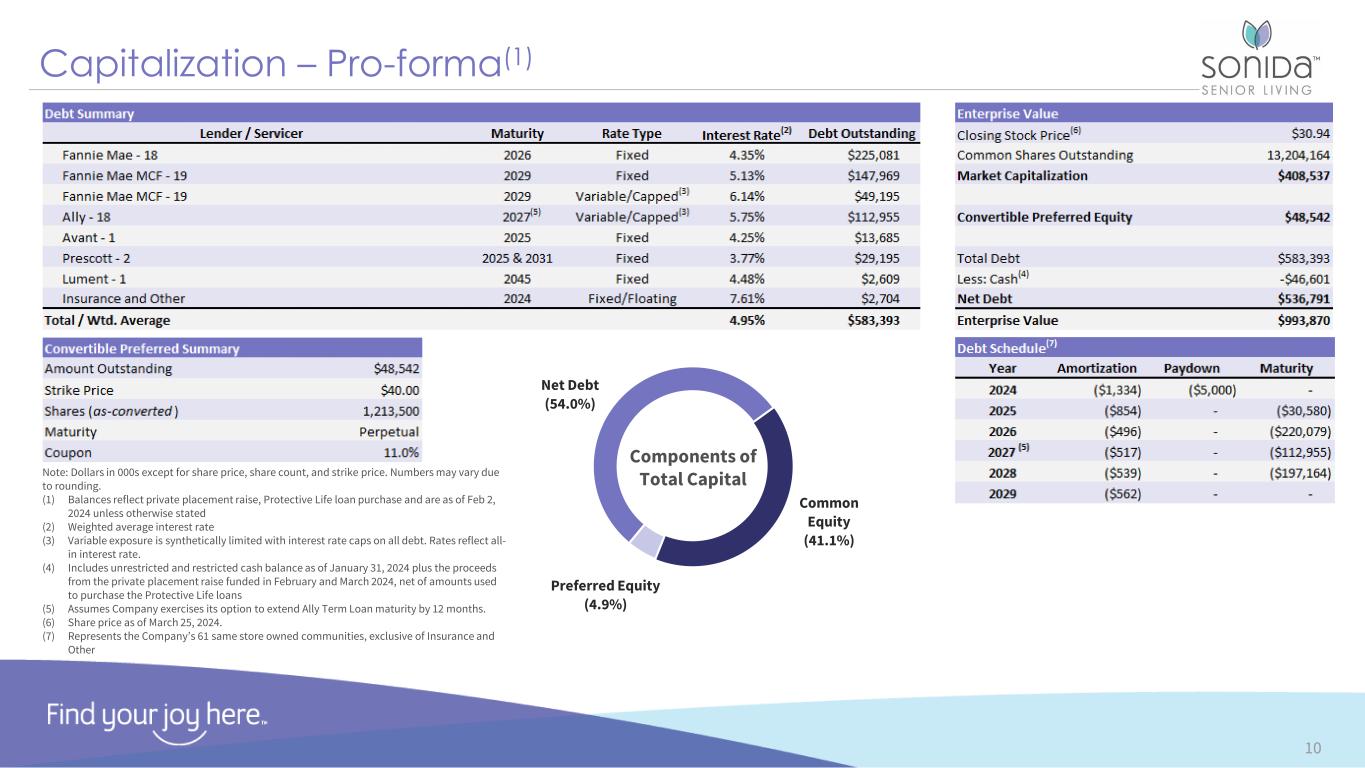
Debt and Equity Highlights 10 Debt - 56 of 60 Loans Restructured 37 Fannie Mae loans resulting in over $39M in savings, with maturities extended to December 2026 or beyond Ally Bank granted Sonida a waiver of its contractual $13M minimum liquidity requirement for 18 months Purchased $77.4M of outstanding indebtedness on Protective Life 7 communities for $40.2M, representing a discount of 48% Equity - Continuing Investor Support Received $13.5M from Conversant Capital, of which $3.5M remains available through December 2024 Completed private placement offering to raise $47.75M in equity with $25M earmarked for growth capital (closed February 2024)


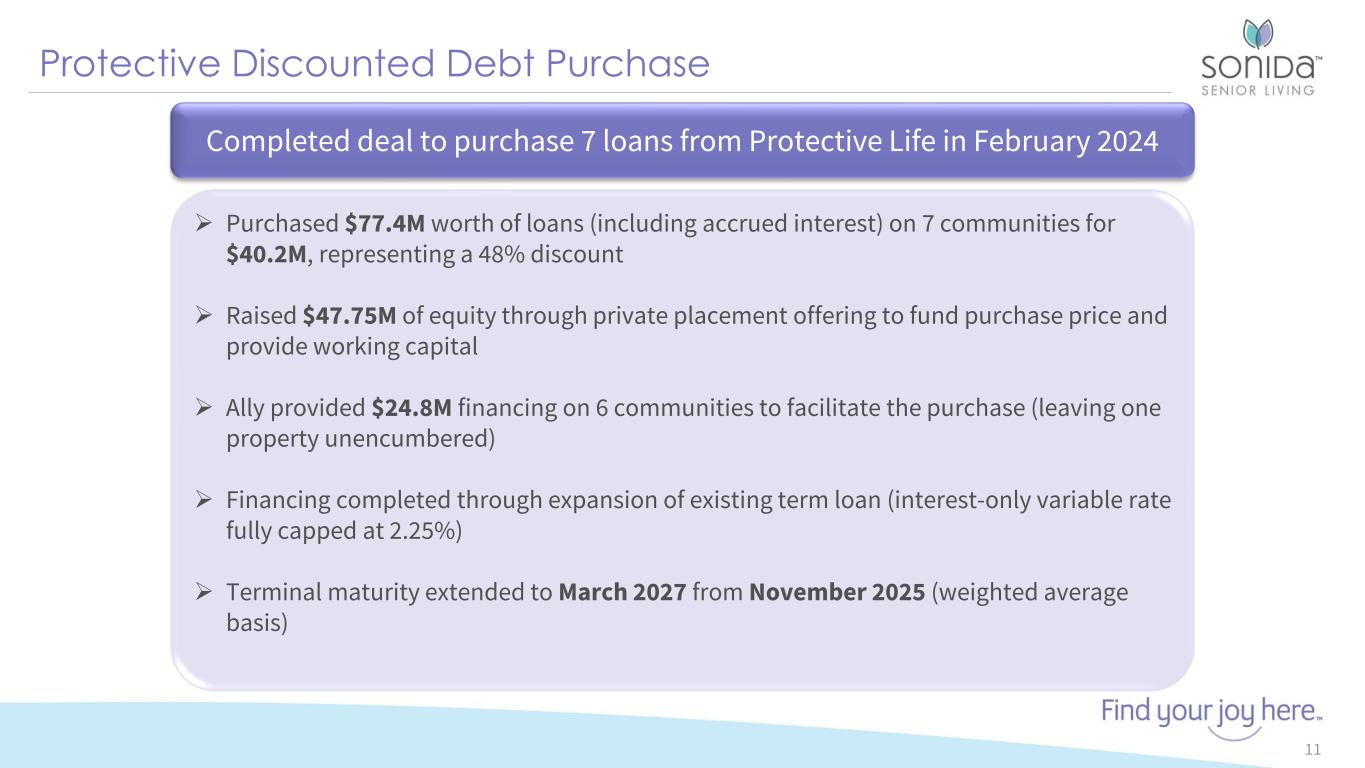
Protective Discounted Debt Purchase 11 Completed deal to purchase 7 loans from Protective Life in February 2024  Purchased $77.4M worth of loans (including accrued interest) on 7 communities for $40.2M, representing a 48% discount  Raised $47.75M of equity through private placement offering to fund purchase price and provide working capital  Ally provided $24.8M financing on 6 communities to facilitate the purchase (leaving one property unencumbered)  Financing completed through expansion of existing term loan (interest-only variable rate fully capped at 2.25%)  Terminal maturity extended to March 2027 from November 2025 (weighted average basis)


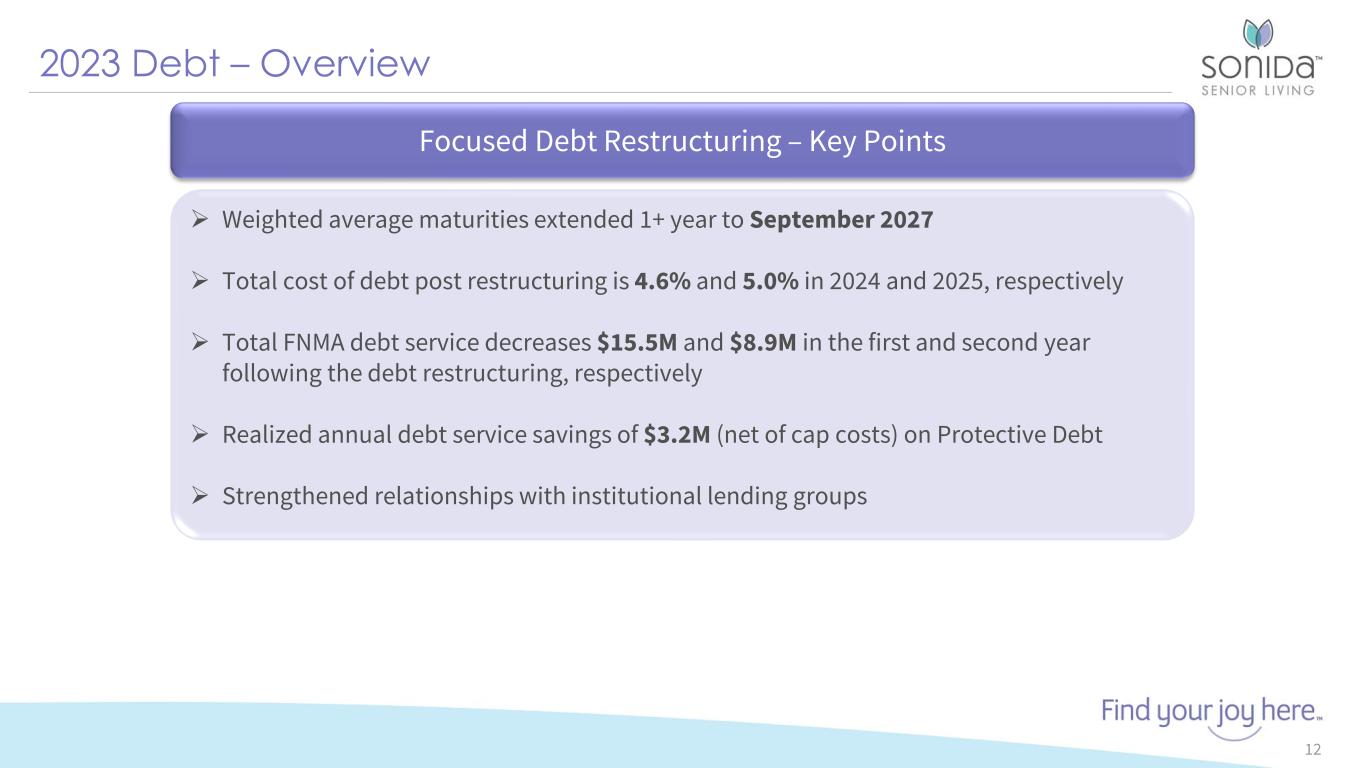
2023 Debt – Overview 12  Weighted average maturities extended 1+ year to September 2027  Total cost of debt post restructuring is 4.6% and 5.0% in 2024 and 2025, respectively  Total FNMA debt service decreases $15.5M and $8.9M in the first and second year following the debt restructuring, respectively  Realized annual debt service savings of $3.2M (net of cap costs) on Protective Debt  Strengthened relationships with institutional lending groups Focused Debt Restructuring – Key Points


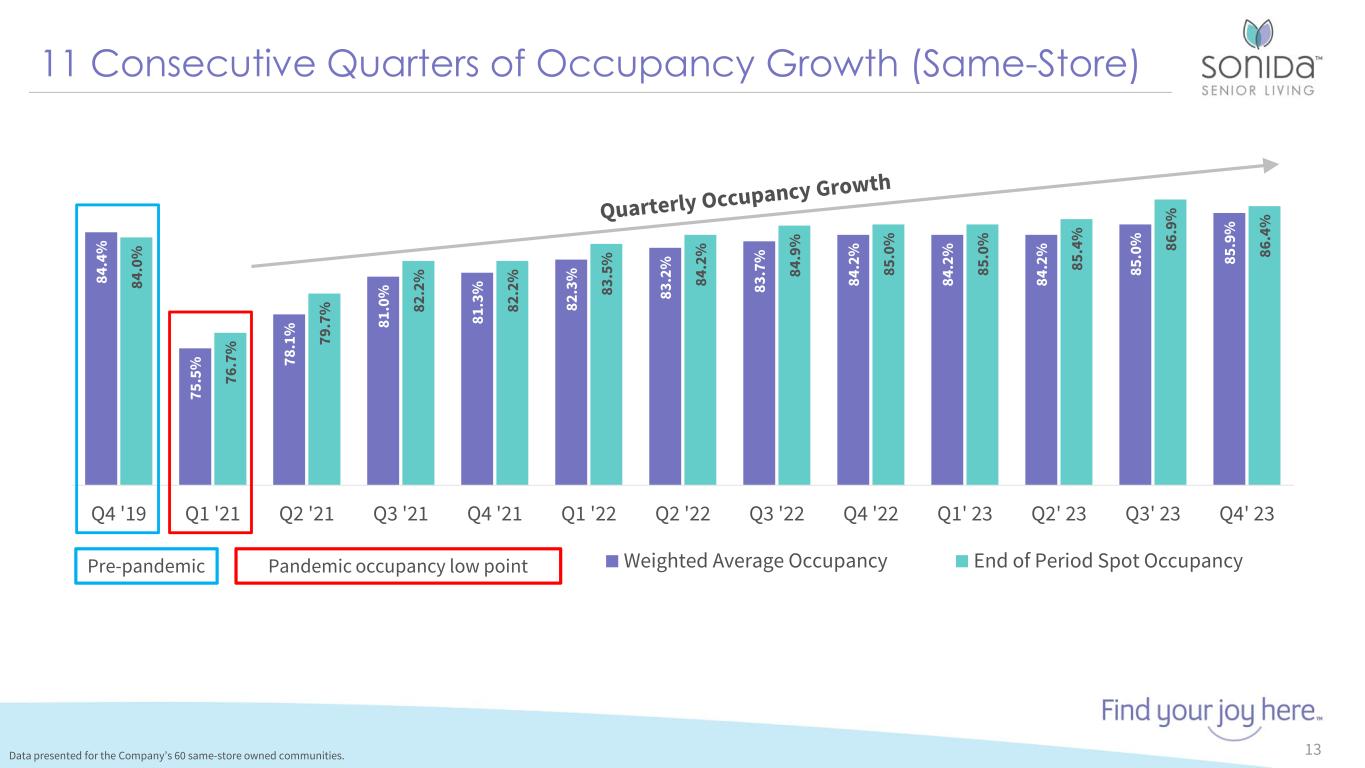
84 .4 % 75 .5 % 78 .1 % 81 .0 % 81 .3 % 82 .3 % 83 .2 % 83 .7 % 84 .2 % 84 .2 % 84 .2 % 85 .0 % 85 .9 % 84 .0 % 76 .7 % 79 .7 % 82 .2 % 82 .2 % 83 .5 % 84 .2 % 84 .9 % 85 .0 % 85 .0 % 85 .4 % 86 .9 % 86 .4 % Q4 '19 Q1 '21 Q2 '21 Q3 '21 Q4 '21 Q1 '22 Q2 '22 Q3 '22 Q4 '22 Q1' 23 Q2' 23 Q3' 23 Q4' 23 Weighted Average Occupancy End of Period Spot Occupancy 11 Consecutive Quarters of Occupancy Growth (Same-Store) 13 Pandemic occupancy low pointPre-pandemic Data presented for the Company’s 60 same-store owned communities.


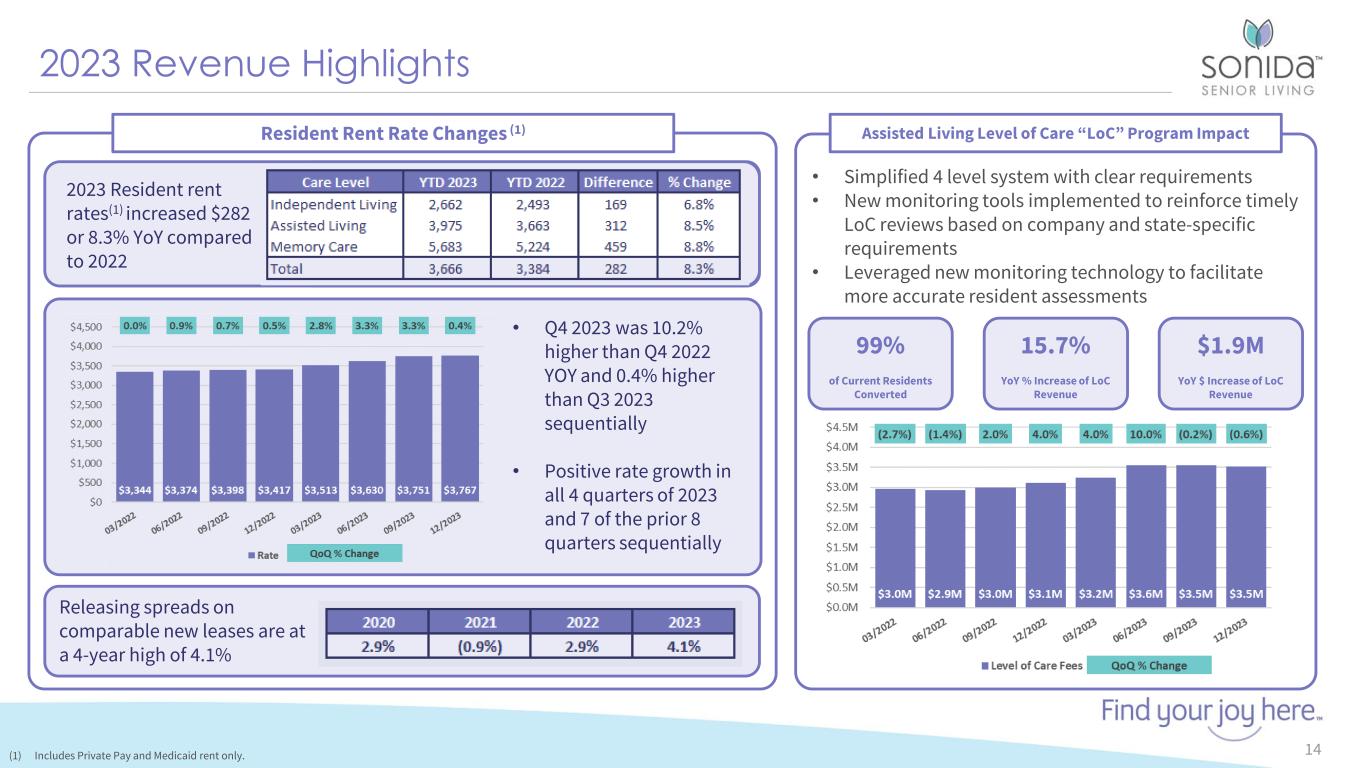
2023 Revenue Highlights 14 Assisted Living Level of Care “LoC” Program Impact • Simplified 4 level system with clear requirements • New monitoring tools implemented to reinforce timely LoC reviews based on company and state-specific requirements • Leveraged new monitoring technology to facilitate more accurate resident assessments Resident Rent Rate Changes (1) • Q4 2023 was 10.2% higher than Q4 2022 YOY and 0.4% higher than Q3 2023 sequentially • Positive rate growth in all 4 quarters of 2023 and 7 of the prior 8 quarters sequentially (1) Includes Private Pay and Medicaid rent only. 2023 Resident rent rates(1) increased $282 or 8.3% YoY compared to 2022 Releasing spreads on comparable new leases are at a 4-year high of 4.1% 99% of Current Residents Converted 15.7% YoY % Increase of LoC Revenue $1.9M YoY $ Increase of LoC Revenue


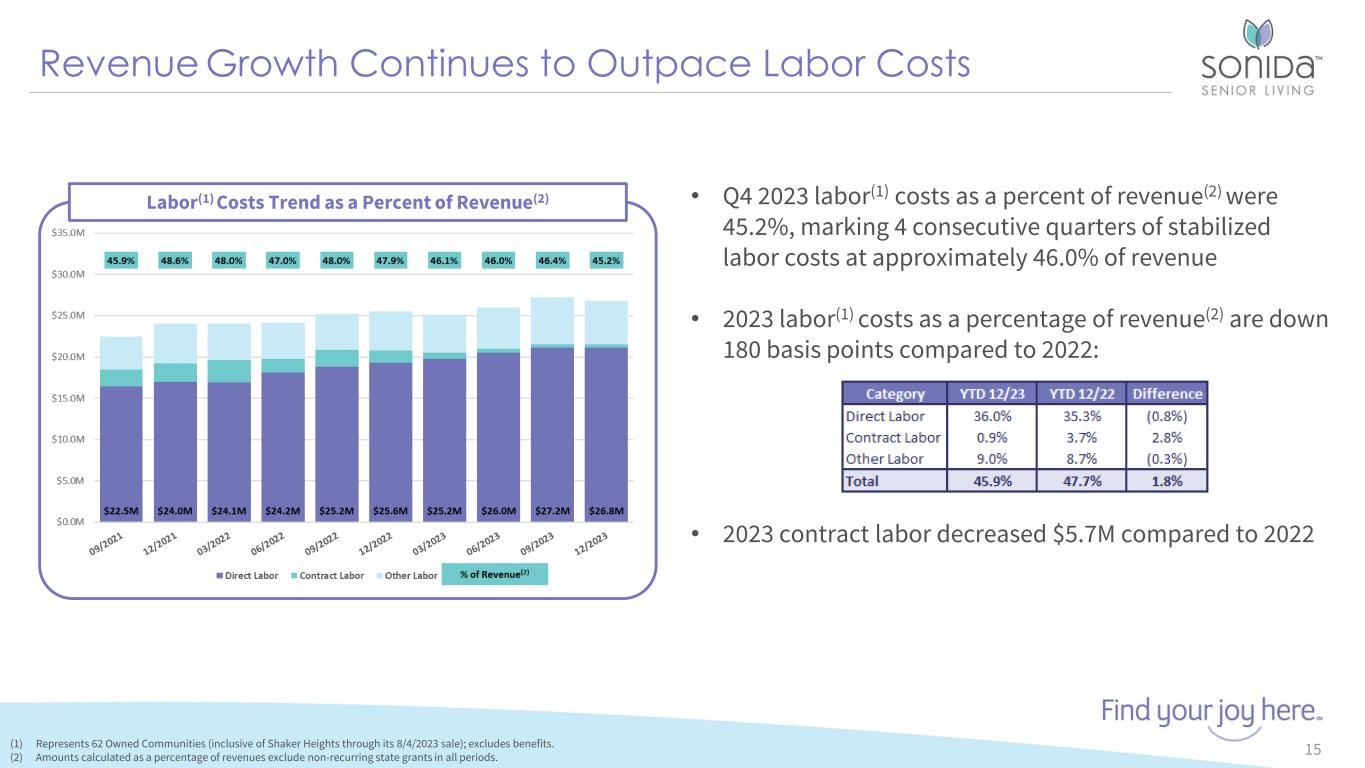
Revenue Growth Continues to Outpace Labor Costs 15 Labor(1) Costs Trend as a Percent of Revenue(2) (1) Represents 62 Owned Communities (inclusive of Shaker Heights through its 8/4/2023 sale); excludes benefits. (2) Amounts calculated as a percentage of revenues exclude non-recurring state grants in all periods. • Q4 2023 labor(1) costs as a percent of revenue(2) were 45.2%, marking 4 consecutive quarters of stabilized labor costs at approximately 46.0% of revenue • 2023 labor(1) costs as a percentage of revenue(2) are down 180 basis points compared to 2022: • 2023 contract labor decreased $5.7M compared to 2022


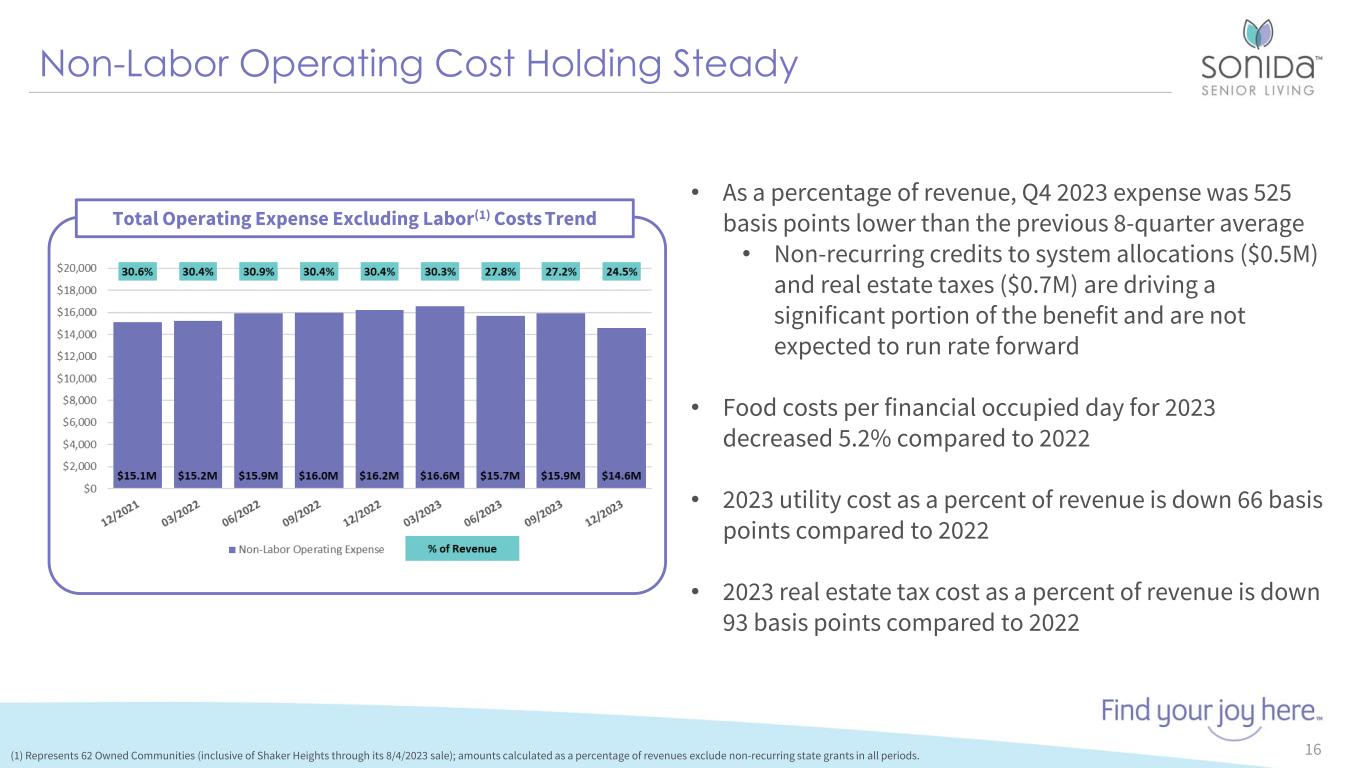
Non-Labor Operating Cost Holding Steady 16 Total Operating Expense Excluding Labor(1) Costs Trend (1) Represents 62 Owned Communities (inclusive of Shaker Heights through its 8/4/2023 sale); amounts calculated as a percentage of revenues exclude non-recurring state grants in all periods. • As a percentage of revenue, Q4 2023 expense was 525 basis points lower than the previous 8-quarter average • Non-recurring credits to system allocations ($0.5M) and real estate taxes ($0.7M) are driving a significant portion of the benefit and are not expected to run rate forward • Food costs per financial occupied day for 2023 decreased 5.2% compared to 2022 • 2023 utility cost as a percent of revenue is down 66 basis points compared to 2022 • 2023 real estate tax cost as a percent of revenue is down 93 basis points compared to 2022


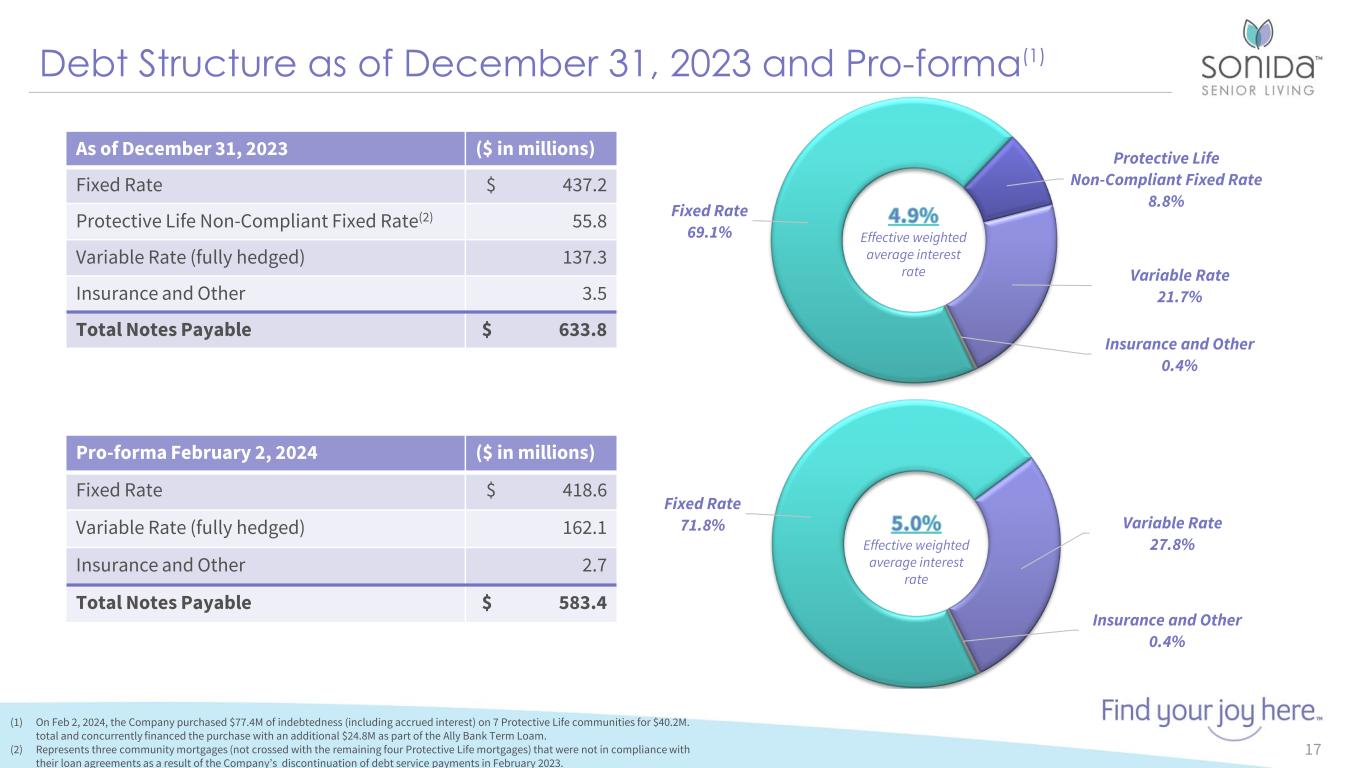
Debt Structure as of December 31, 2023 and Pro-forma(1) 17 Fixed Rate 69.1% Protective Life Non-Compliant Fixed Rate 8.8% Variable Rate 21.7% Insurance and Other 0.4% Effective weighted average interest rate As of December 31, 2023 ($ in millions) Fixed Rate $ 437.2 Protective Life Non-Compliant Fixed Rate(2) 55.8 Variable Rate (fully hedged) 137.3 Insurance and Other 3.5 Total Notes Payable $ 633.8 Pro-forma February 2, 2024 ($ in millions) Fixed Rate $ 418.6 Variable Rate (fully hedged) 162.1 Insurance and Other 2.7 Total Notes Payable $ 583.4 Fixed Rate 71.8% Variable Rate 27.8% Insurance and Other 0.4% Effective weighted average interest rate (1) On Feb 2, 2024, the Company purchased $77.4M of indebtedness (including accrued interest) on 7 Protective Life communities for $40.2M. total and concurrently financed the purchase with an additional $24.8M as part of the Ally Bank Term Loam. (2) Represents three community mortgages (not crossed with the remaining four Protective Life mortgages) that were not in compliance with their loan agreements as a result of the Company’s discontinuation of debt service payments in February 2023.


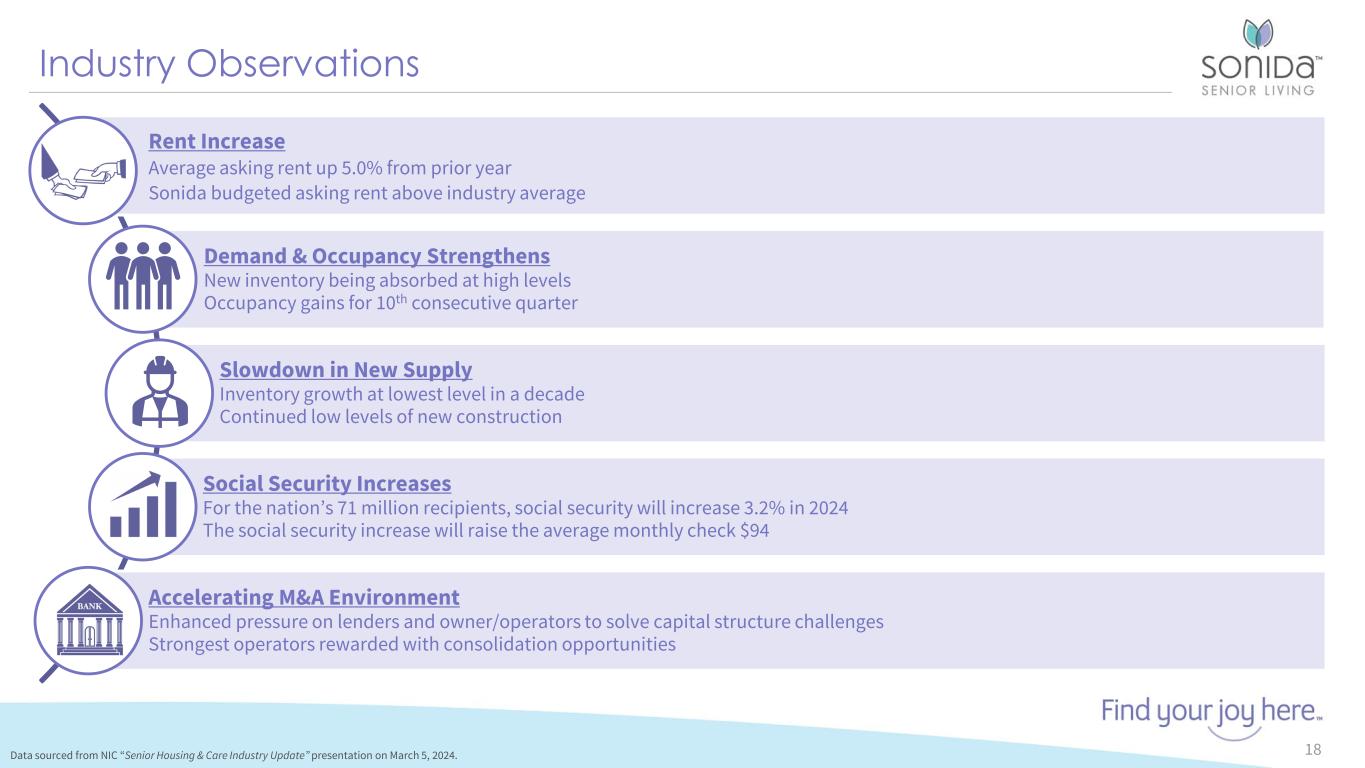
Industry Observations 18Data sourced from NIC “Senior Housing & Care Industry Update” presentation on March 5, 2024. Rent Increase Average asking rent up 5.0% from prior year Sonida budgeted asking rent above industry average Demand & Occupancy Strengthens New inventory being absorbed at high levels Occupancy gains for 10th consecutive quarter Slowdown in New Supply Inventory growth at lowest level in a decade Continued low levels of new construction Social Security Increases For the nation’s 71 million recipients, social security will increase 3.2% in 2024 The social security increase will raise the average monthly check $94 Accelerating M&A Environment Enhanced pressure on lenders and owner/operators to solve capital structure challenges Strongest operators rewarded with consolidation opportunities


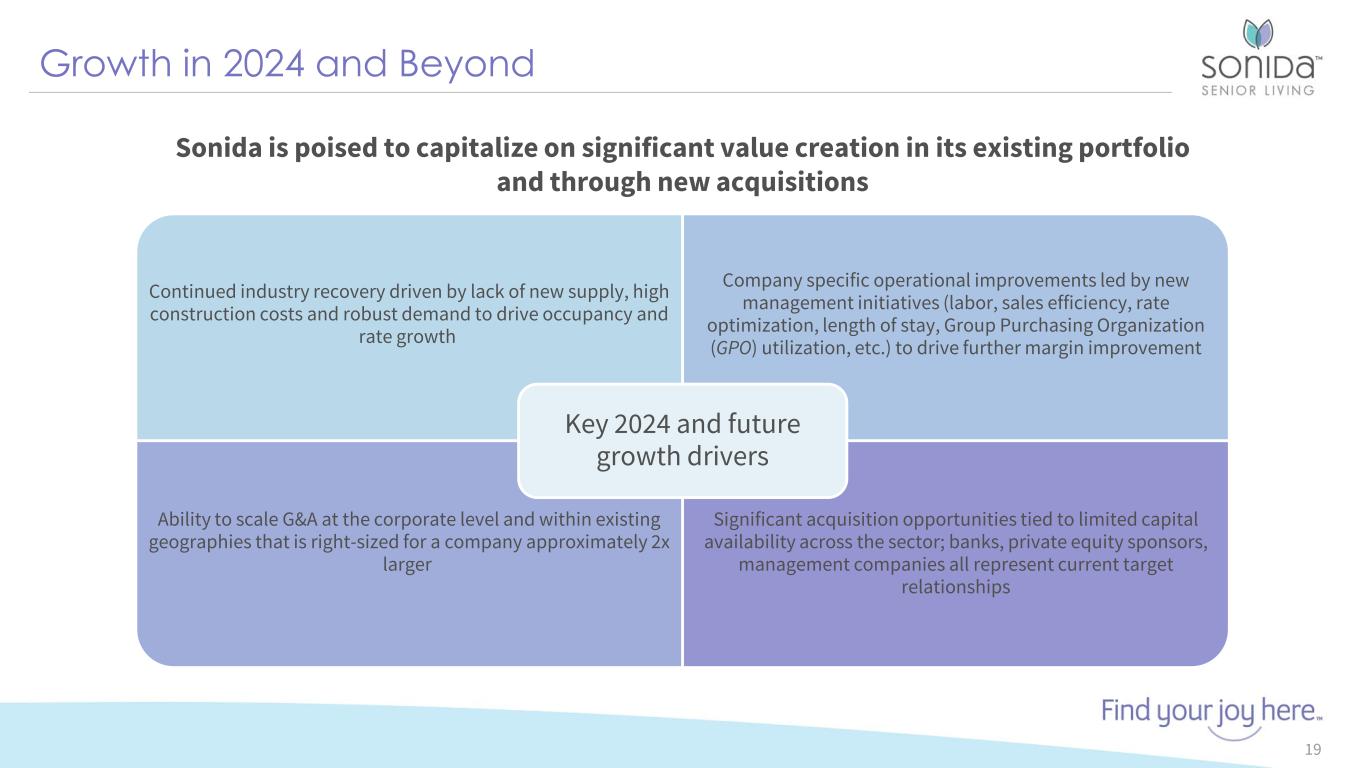
Growth in 2024 and Beyond Continued industry recovery driven by lack of new supply, high construction costs and robust demand to drive occupancy and rate growth Company specific operational improvements led by new management initiatives (labor, sales efficiency, rate optimization, length of stay, Group Purchasing Organization (GPO) utilization, etc.) to drive further margin improvement Ability to scale G&A at the corporate level and within existing geographies that is right-sized for a company approximately 2x larger Significant acquisition opportunities tied to limited capital availability across the sector; banks, private equity sponsors, management companies all represent current target relationships Key 2024 and future growth drivers 19 Sonida is poised to capitalize on significant value creation in its existing portfolio and through new acquisitions


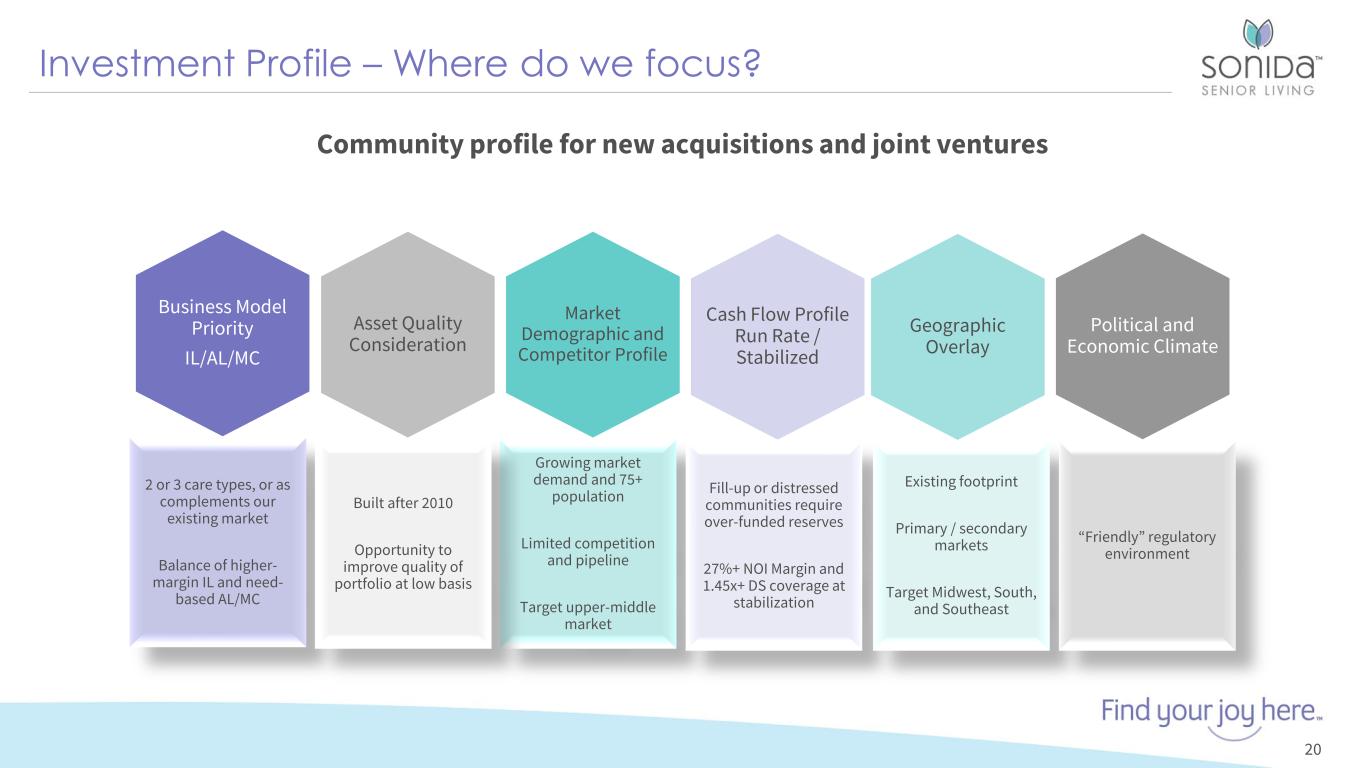
Investment Profile – Where do we focus? 20 Business Model Priority IL/AL/MC Market Demographic and Competitor Profile Cash Flow Profile Run Rate / Stabilized Geographic Overlay Political and Economic Climate Asset Quality Consideration Community profile for new acquisitions and joint ventures 2 or 3 care types, or as complements our existing market Balance of higher- margin IL and need- based AL/MC Growing market demand and 75+ population Limited competition and pipeline Target upper-middle market Fill-up or distressed communities require over-funded reserves 27%+ NOI Margin and 1.45x+ DS coverage at stabilization Existing footprint Primary / secondary markets Target Midwest, South, and Southeast “Friendly” regulatory environment Built after 2010 Opportunity to improve quality of portfolio at low basis


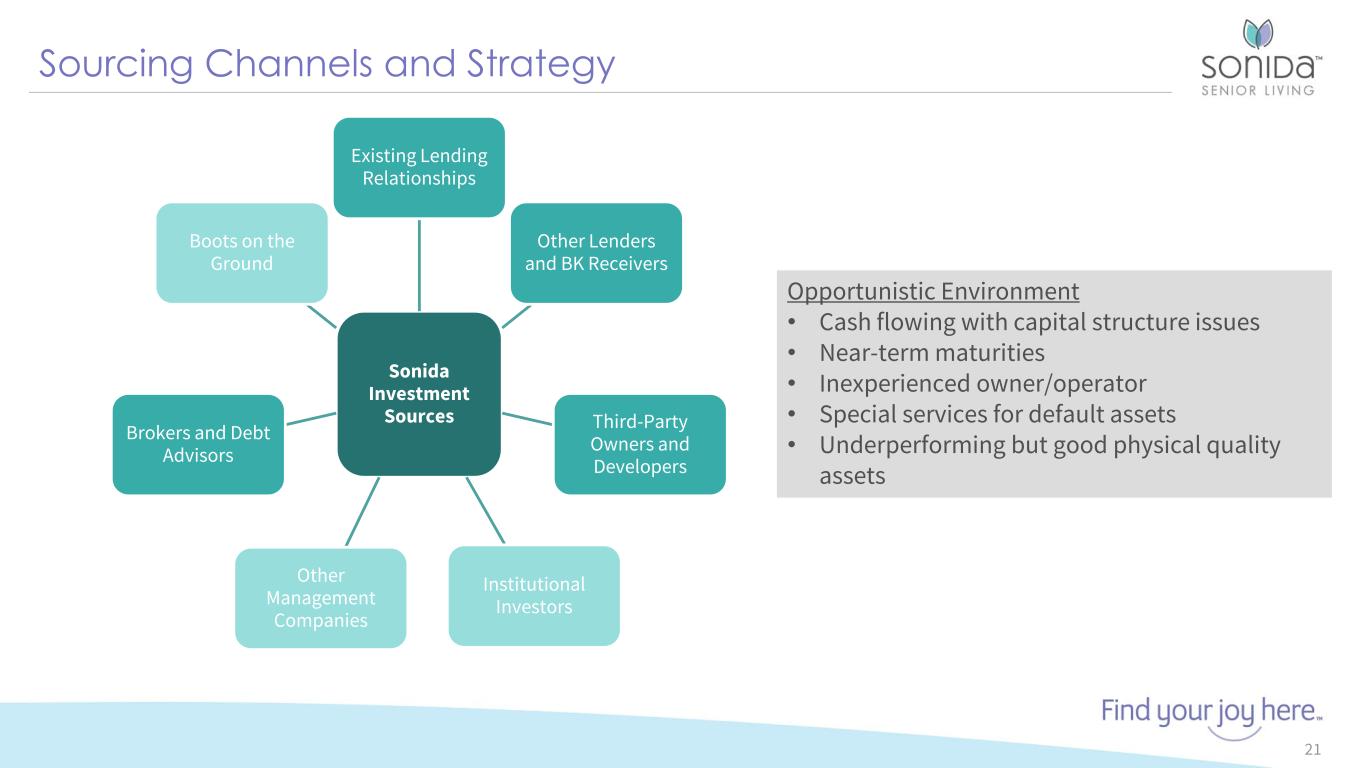
Sourcing Channels and Strategy 21 Sonida Investment Sources Existing Lending Relationships Other Lenders and BK Receivers Third-Party Owners and Developers Institutional Investors Other Management Companies Brokers and Debt Advisors Boots on the Ground Opportunistic Environment • Cash flowing with capital structure issues • Near-term maturities • Inexperienced owner/operator • Special services for default assets • Underperforming but good physical quality assets


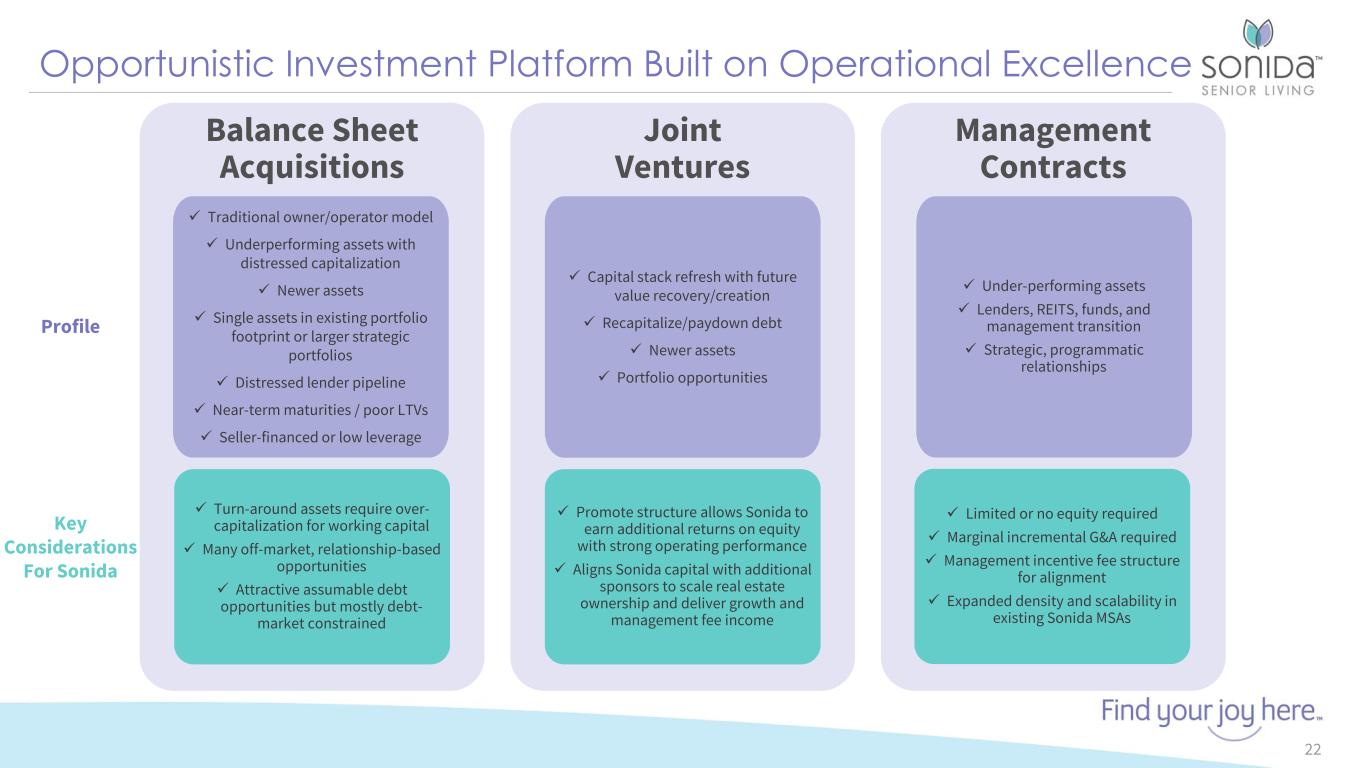
Opportunistic Investment Platform Built on Operational Excellence 22 Balance Sheet Acquisitions  Traditional owner/operator model  Underperforming assets with distressed capitalization  Newer assets  Single assets in existing portfolio footprint or larger strategic portfolios  Distressed lender pipeline  Near-term maturities / poor LTVs  Seller-financed or low leverage  Turn-around assets require over- capitalization for working capital  Many off-market, relationship-based opportunities  Attractive assumable debt opportunities but mostly debt- market constrained Joint Ventures  Capital stack refresh with future value recovery/creation  Recapitalize/paydown debt  Newer assets  Portfolio opportunities  Promote structure allows Sonida to earn additional returns on equity with strong operating performance  Aligns Sonida capital with additional sponsors to scale real estate ownership and deliver growth and management fee income Management Contracts  Under-performing assets  Lenders, REITS, funds, and management transition  Strategic, programmatic relationships  Limited or no equity required  Marginal incremental G&A required  Management incentive fee structure for alignment  Expanded density and scalability in existing Sonida MSAs Key Considerations For Sonida Profile


Supplemental Investor Information Q4 2023


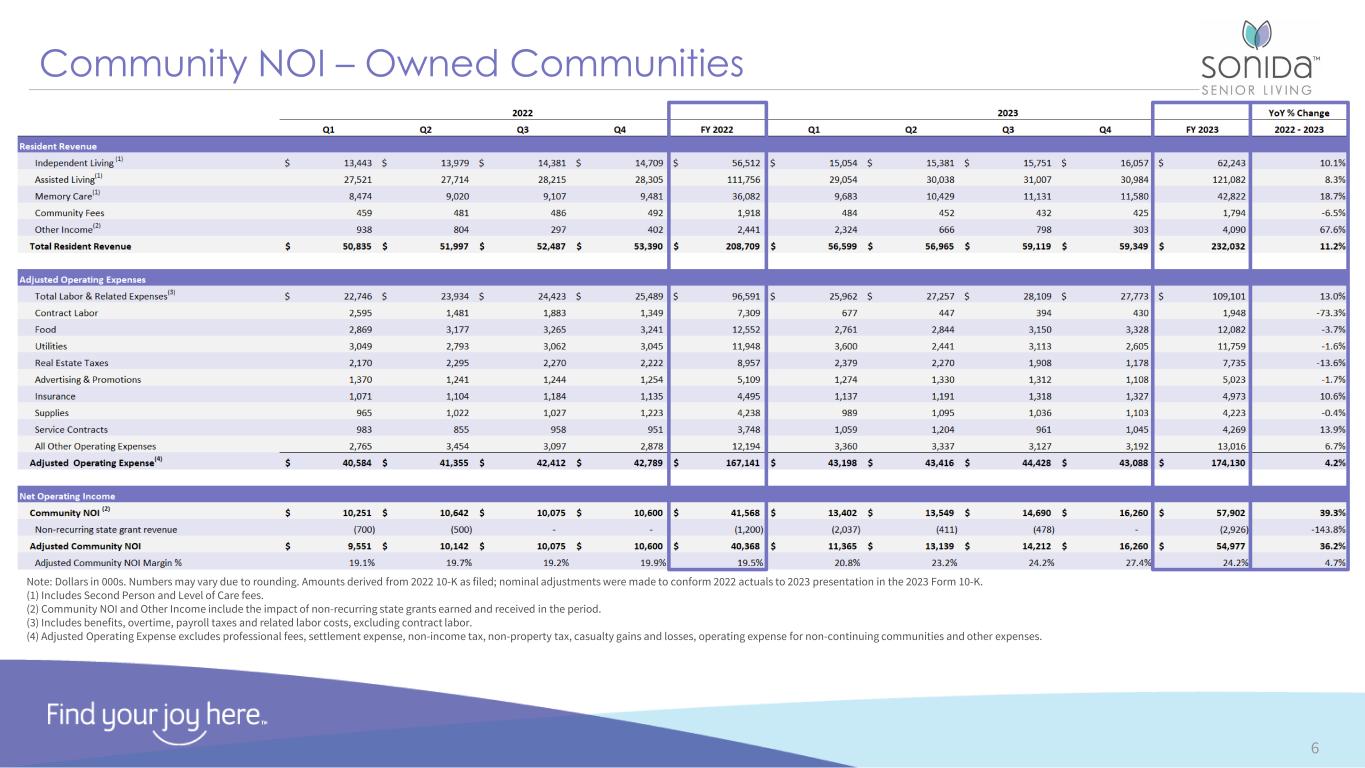
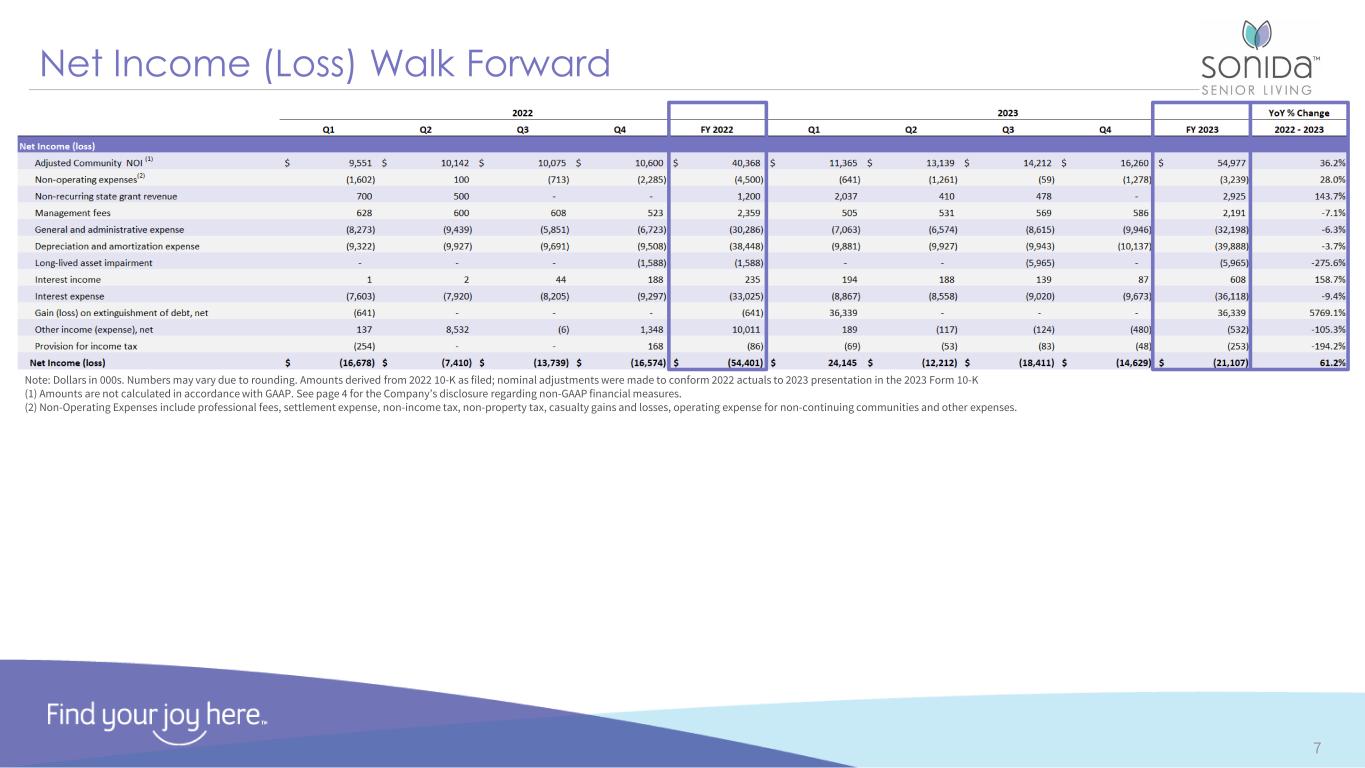
2 Table of Contents Forward Looking Statements Disclosure3 Non-GAAP Financial Measures4 Financial Overview5 Community NOI6 Net Income (Loss) Walk Forward7 Adjusted EBITDA Walk Forward8 Capitalization – YE 20249 Capitalization – Pro-forma10 Geographical Breakdown11 Financial and Key Metrics12 Market Fundamentals13


Forward-Looking Statements 3 This presentation contains forward-looking statements which are subject to certain risks and uncertainties that could cause our actual results and financial condition of Sonida Senior Living, Inc. (the “Company,” “we,” “our” or “us”) to differ materially from those indicated in the forward-looking statements, including, among others, the risks, uncertainties and factors set forth under “Item. 1A. Risk Factors” in our Annual Report on Form 10-K for the fiscal year ended December 31, 2023, filed with the Securities and Exchange Commission (the “SEC”) on March 27, 2024, and also include the following: The Company’s ability to generate sufficient cash flows from operations, proceeds from equity issuances and debt financings, and proceeds from the sale of assets to satisfy its short and long-term debt obligations and to fund the Company’s acquisitions and capital improvement projects to expand, redevelop, and/or reposition its senior living communities; increases in market interest rates that increase the cost of certain of our debt obligations; increased competition for, or a shortage of, skilled workers, including due to general labor market conditions, along with wage pressures resulting from such increased competition, low unemployment levels, use of contract labor, minimum wage increases and/or changes in overtime laws; the Company’s ability to obtain additional capital on terms acceptable to it; the Company’s ability to extend or refinance its existing debt as such debt matures; the Company’s compliance with its debt agreements, including certain financial covenants, and the risk of cross-default in the event such non-compliance occurs; the Company’s ability to complete acquisitions and dispositions upon favorable terms or at all; the risk of oversupply and increased competition in the markets which the Company operates; the Company’s ability to improve and maintain controls over financial reporting and remediate the identified material weakness discussed in Item 9 of our Annual Report on Form 10-K; the cost and difficulty of complying with applicable licensure, legislative oversight, or regulatory changes; risks associated with current global economic conditions and general economic factors such as inflation, the consumer price index, commodity costs, fuel and other energy costs, competition in the labor market, costs of salaries, wages, benefits, and insurance, interest rates, and tax rates; the impact from the potential emergence and effects of a future epidemic, pandemic, outbreak of infectious disease or other health crisis; and changes in accounting principles and interpretations. We caution you that the risks, uncertainties and other factors referenced above may not contain all of the risks, uncertainties and other factors that are important to you. In addition, we cannot assure you that we will realize the results, benefits or outcomes that we expect or anticipate or, even if substantially realized, that they will result in the consequences or affect us or our business in the way expected. For information about the Company, visit www.sonidaseniorliving.com.


Non-GAAP Financial Measures 4 This presentation contains financial measures: (1) Adjusted Operating Expenses, (2) Community Net Operating Income, (3) Community Net Operating Income Margin, (4) Adjusted Community Net Operating Income, (5) Adjusted Community Net Operating Income Margin, (6) Adjusted G&A Expense, (7) Revenue per Occupied Unit (RevPOR), (8) Revenue per Available Unit (RevPAR) and (9) Adjusted EBITDA, which are not calculated in accordance with U.S. Generally Accepted Accounting Principles ("GAAP"). Presentations of these non-GAAP financial measures are intended to aid investors in better understanding the factors and trends affecting the Company’s performance and liquidity. However, investors should not consider these non-GAAP financial measures as a substitute for financial measures determined in accordance with GAAP, including net income (loss), income (loss) from operations or net cash provided by (used in) operating activities. Investors are cautioned that amounts presented in accordance with the Company’s definitions of these non-GAAP financial measures may not be comparable to similar measures disclosed by other companies because not all companies calculate non-GAAP measures in the same manner. Investors are urged to review the reconciliations of these non-GAAP financial measures contained in the Company’s most recent earnings release from the most comparable financial measures determined in accordance with GAAP. Adjusted Operating Expenses, Community Net Operating Income, Community Net Operating Income Margin, Adjusted Community Net Operating Income and Adjusted Community Net Operating Income Margin or Operating Margin are non- GAAP performance measures for the Company’s consolidated owned portfolio of communities that the Company defines as net income (loss) excluding: general and administrative expenses, interest income, interest expense, other income/expense, provision for income taxes, settlement fees and expenses, revenue and operating expenses from the Company’s disposed properties; and further adjusted to exclude income/expense associated with non-cash, non- operational, transactional or organizational restructuring items that management does not consider as part of the Company’s underlying core operating performance and that management believes impact the comparability of performance between periods. For the periods presented herein, such other items include depreciation and amortization expense, gain(loss) on extinguishment of debt, gain(loss) on disposition of assets, long-lived asset impairment and loss on non- recurring settlements with third parties. Both Adjusted Community Net Operating Income and Adjusted Community Net Operating Income Margin exclude the impact from non-recurring state grant funds received. Adjusted G&A Expense excludes non-recurring expenses including: stock compensation expense, sold properties expense, transaction costs, conversion costs and other non-recurring costs. RevPAR, or average monthly revenue per available unit, is defined by the Company as resident revenue for the period, divided by the weighted average number of available units in the corresponding portfolio for the period, divided by the number of months in the period. RevPOR, or average monthly revenue per occupied unit, is defined by the Company as resident revenue for the period, divided by the weighted average number of occupied units in the corresponding portfolio for the period, divided by the number of months in the period. Same-store Weighted Average Occupancy and Same-store End of Period Spot Occupancy excludes occupancy from non-same-store communities acquired and divested in the presented periods. The Company believes that presentation of Adjusted Operating Expenses, Community Net Operating Income, Community Net Operating Income Margin, Adjusted Community Net Operating Income, Adjusted Community Net Operating Income Margin or Operating Margin and Adjusted G&A Expense as performance measures are useful to investors because (i) they are some of the metrics used by the Company’s management to evaluate the performance of our core portfolio of communities, to review the Company’s comparable historic and prospective core operating performance of the consolidated owned communities and to make day-to-day operating decisions; (ii) they provide an assessment of operational factors that management can impact in the short-term, namely revenues and the controllable cost structure of the organization, by eliminating items related to the Company’s financing and capital structure and other items that management does not consider as part of the Company’s underlying core operating performance and that management believes impact the comparability of performance between periods. Adjusted Operating Expenses, Net Operating Income, Community Net Operating Income Margin, Adjusted Community Net Operating Income, Adjusted Community Net Operating Income Margin or Operating Margin and Adjusted G&A Expense have material limitations as a performance measure, including: (i) excluded interest is necessary to operate the Company’s business under its current financing and capital structure; (ii) excluded depreciation, amortization and impairment charges may represent the wear and tear and/or reduction in value of the Company’s communities, and other assets and may be indicative of future needs for capital expenditures; and (iii) the Company may incur income/expense similar to those for which adjustments are made, such as gain/loss on sale of assets, facility lease termination, or debt extinguishment, non-cash stock-based compensation expense and transaction and other costs, and such income/expense may significantly affect the Company’s operating results. Adjusted EBITDA is a non-GAAP performance measure that the Company defines as net income (loss) excluding: depreciation and amortization expense, interest income, interest expense, other expense/income, provision for income taxes; and further adjusted to exclude income/expense associated with non-cash, non-operational, transactional or organizational restructuring items that management does not consider as part of the Company’s underlying core operating performance and impacts the comparability of performance between periods. For the periods presented herein, such other items include stock-based compensation expense, provision for bad debts, gain (loss) on extinguishment of debt, gain on sale of assets, long-lived asset impairment, casualty losses and transaction and conversion costs.


Financial Overview – Owned Communities 5 Note: Dollars in 000s. Numbers may vary due to rounding. Amounts derived from 2022 10-K as filed; nominal adjustments were made to conform 2022 actuals to 2023 presentation in the 2023 Form 10-K (1) Resident Revenue, Community NOI, Community NOI Margin %, Net Income (loss), Adjusted EBITDA, REVPOR and REVPAR include the impact of non-recurring state grants earned and received in the period, as follows: Q1 2022: $0.7M, Q2 2022: $0.5M, Q1 2023: $2.0M, Q2 2023: $0.4M and Q3 2023: $0.5M.


6 Note: Dollars in 000s. Numbers may vary due to rounding. Amounts derived from 2022 10-K as filed; nominal adjustments were made to conform 2022 actuals to 2023 presentation in the 2023 Form 10-K. (1) Includes Second Person and Level of Care fees. (2) Community NOI and Other Income include the impact of non-recurring state grants earned and received in the period. (3) Includes benefits, overtime, payroll taxes and related labor costs, excluding contract labor. (4) Adjusted Operating Expense excludes professional fees, settlement expense, non-income tax, non-property tax, casualty gains and losses, operating expense for non-continuing communities and other expenses. Community NOI – Owned Communities


Net Income (Loss) Walk Forward 7 Note: Dollars in 000s. Numbers may vary due to rounding. Amounts derived from 2022 10-K as filed; nominal adjustments were made to conform 2022 actuals to 2023 presentation in the 2023 Form 10-K (1) Amounts are not calculated in accordance with GAAP. See page 4 for the Company’s disclosure regarding non-GAAP financial measures. (2) Non-Operating Expenses include professional fees, settlement expense, non-income tax, non-property tax, casualty gains and losses, operating expense for non-continuing communities and other expenses.


Adjusted EBITDA Walk Forward 8 Note: Dollars in 000s. Numbers may vary due to rounding. Amounts derived from 2022 10-K as filed; nominal adjustments were made to conform 2022 actuals to 2023 presentation in the 2023 Form 10-K (1) Casualty losses relate to non-recurring insured claims for unexpected events. (2) Transaction and conversion costs relate to legal and professional fees incurred for transactions, restructure projects or related projects. (3) COVID-19 expenses are expenses for supplies and personal protective equipment, testing of the Company’s residents and employees, labor and specialized disinfecting and cleaning services.
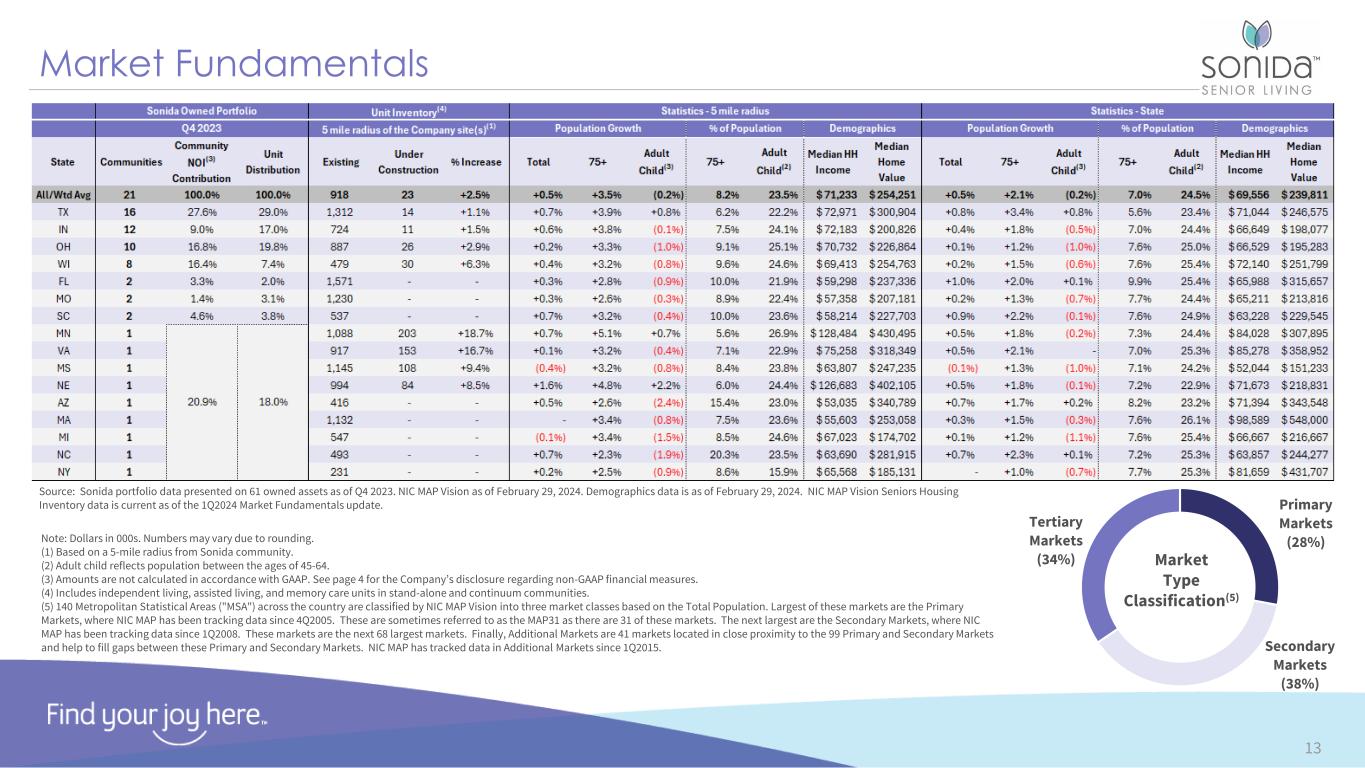

 
Capitalization as of December 31, 2023 9 Note: Dollars in 000s except for share price, share count, and strike price. Numbers may vary due to rounding. (1) Weighted average interest rate (2) Variable exposure is synthetically limited with interest rate caps on all debt. Rates reflect all- in interest rate. (3) Includes unrestricted and restricted cash. (4) Assumes Company exercises its option to extend Ally Term Loan maturity by 12 months. (5) Represents the Company’s 61 same store owned communities, exclusive of Insurance and Other Common Equity (10.6%) Preferred Equity (6.5%) Net Debt (82.9%) Components of Total Capital


Capitalization – Pro-forma(1) 10 Note: Dollars in 000s except for share price, share count, and strike price. Numbers may vary due to rounding. (1) Balances reflect private placement raise, Protective Life loan purchase and are as of Feb 2, 2024 unless otherwise stated (2) Weighted average interest rate (3) Variable exposure is synthetically limited with interest rate caps on all debt. Rates reflect all- in interest rate. (4) Includes unrestricted and restricted cash balance as of January 31, 2024 plus the proceeds from the private placement raise funded in February and March 2024, net of amounts used to purchase the Protective Life loans (5) Assumes Company exercises its option to extend Ally Term Loan maturity by 12 months. (6) Share price as of March 25, 2024. (7) Represents the Company’s 61 same store owned communities, exclusive of Insurance and Other Common Equity (41.1%) Preferred Equity (4.9%) Net Debt (54.0%) Components of Total Capital


Geographical Breakdown – Owned Communities 11 South/Southwest 18 Communities Midwest 35 Communities East 8 Communities (1) Data based on Q4 2023 average and excludes the Shaker Heights community, which was sold in August of 2023.


T3M: Financial and Key Metrics – Owned Communities 12 Note: Dollars in 000s. Numbers may vary due to rounding. Financial data presented is December 2023 trailing 3-month results. (1) Includes Second Person Fees and Level of care fees. (2) Revenue includes non-recurring state grant revenue. (3) Adjusted Operating Expense excludes professional fees, settlement expense, non-income tax, non-property tax, casualty gains and losses, operating expense for non-continuing communities and other expenses. (4) Includes benefits, overtime, payroll taxes and related labor costs, excluding contract labor.


Market Fundamentals 13 Note: Dollars in 000s. Numbers may vary due to rounding. (1) Based on a 5-mile radius from Sonida community. (2) Adult child reflects population between the ages of 45-64. (3) Amounts are not calculated in accordance with GAAP. See page 4 for the Company’s disclosure regarding non-GAAP financial measures. (4) Includes independent living, assisted living, and memory care units in stand-alone and continuum communities. (5) 140 Metropolitan Statistical Areas ("MSA") across the country are classified by NIC MAP Vision into three market classes based on the Total Population. Largest of these markets are the Primary Markets, where NIC MAP has been tracking data since 4Q2005. These are sometimes referred to as the MAP31 as there are 31 of these markets. The next largest are the Secondary Markets, where NIC MAP has been tracking data since 1Q2008. These markets are the next 68 largest markets. Finally, Additional Markets are 41 markets located in close proximity to the 99 Primary and Secondary Markets and help to fill gaps between these Primary and Secondary Markets. NIC MAP has tracked data in Additional Markets since 1Q2015. Primary Markets (28%) Secondary Markets (38%) Tertiary Markets (34%) Market Type Classification(5) Source: Sonida portfolio data presented on 61 owned assets as of Q4 2023. NIC MAP Vision as of February 29, 2024. Demographics data is as of February 29, 2024. NIC MAP Vision Seniors Housing Inventory data is current as of the 1Q2024 Market Fundamentals update.