Maryland |
001-34723 |
93-0295215 |
||||||
|
(State or other jurisdiction
of incorporation)
|
(Commission File Number) |
(IRS Employer
Identification No.)
|
||||||
| 10 Glenlake Parkway, | South Tower, Suite 600 | ||||||||||
| Atlanta, | Georgia | 30328 | |||||||||
(Address of principal executive offices) |
(Zip Code) |
||||||||||
| ☐ | Written communications pursuant to Rule 425 under the Securities Act (17 CFR 230.425) | |||||||
| ☐ | Soliciting material pursuant to Rule 14a-12 under the Exchange Act (17 CFR 240.14a-12) | |||||||
| ☐ | Pre-commencement communications pursuant to Rule 14d-2(b) under the Exchange Act (17 CFR 240.14d-2(b)) | |||||||
| ☐ | Pre-commencement communications pursuant to Rule 13e-4(c) under the Exchange Act (17 CFR 240.13e-4(c)) | |||||||
Title of each class |
Trading
Symbol(s)
|
Name of each exchange
on which registered
|
||||||||||||
| Common Stock, $0.01 par value per share | COLD | New York Stock Exchange | ||||||||||||
| Exhibit No. | Description | |||||||
Press Release dated February 22, 2024 for the fourth quarter and year ended December 31, 2023. |
||||||||
Supplemental Information Package for the fourth quarter and year ended December 31, 2023. |
||||||||
| 104 | Cover Page Interactive Data File (embedded within the Inline XBRL document) | |||||||
| AMERICOLD REALTY TRUST, INC. | ||||||||
| By: | /s/ Jay Wells |
|||||||
| Name: Jay Wells | ||||||||
| Title: Chief Financial Officer and Executive Vice President | ||||||||
| Three Months Ended December 31, | Change | ||||||||||||||||||||||||||||
| Dollars and units in thousands, except per pallet data | 2023 Actual | 2023 Constant Currency(1) |
2022 Actual | Actual | Constant Currency | ||||||||||||||||||||||||
| TOTAL WAREHOUSE SEGMENT | |||||||||||||||||||||||||||||
| Number of total warehouses | 240 | 240 | n/a | n/a | |||||||||||||||||||||||||
| Rent and storage | $ | 276,641 | $ | 278,493 | $ | 267,031 | 3.6 | % | 4.3 | % | |||||||||||||||||||
| Warehouse services | 335,621 | 336,331 | 331,659 | 1.2 | % | 1.4 | % | ||||||||||||||||||||||
| Total revenue | $ | 612,262 | $ | 614,824 | $ | 598,690 | 2.3 | % | 2.7 | % | |||||||||||||||||||
| Global Warehouse contribution (NOI) | $ | 197,102 | $ | 197,967 | $ | 172,327 | 14.4 | % | 14.9 | % | |||||||||||||||||||
| Global Warehouse margin | 32.2 | % | 32.2 | % | 28.8 | % | 341 bps | 341 bps | |||||||||||||||||||||
| Global Warehouse rent and storage metrics: | |||||||||||||||||||||||||||||
| Average economic occupied pallets | 4,541 | n/a | 4,537 | 0.1 | % | n/a | |||||||||||||||||||||||
| Average physical occupied pallets | 4,041 | n/a | 4,229 | (4.4) | % | n/a | |||||||||||||||||||||||
| Average physical pallet positions | 5,493 | n/a | 5,415 | 1.4 | % | n/a | |||||||||||||||||||||||
| Economic occupancy percentage | 82.7 | % | n/a | 83.8 | % | -112 bps | n/a | ||||||||||||||||||||||
| Physical occupancy percentage | 73.6 | % | n/a | 78.1 | % | -453 bps | n/a | ||||||||||||||||||||||
| Total rent and storage revenue per average economic occupied pallet | $ | 60.92 | $ | 61.33 | $ | 58.86 | 3.5 | % | 4.2 | % | |||||||||||||||||||
| Total rent and storage revenue per average physical occupied pallet | $ | 68.46 | $ | 68.92 | $ | 63.14 | 8.4 | % | 9.1 | % | |||||||||||||||||||
| Global Warehouse services metrics: | |||||||||||||||||||||||||||||
| Throughput pallets | 9,384 | n/a | 9,963 | (5.8) | % | n/a | |||||||||||||||||||||||
| Total warehouse services revenue per throughput pallet | $ | 35.77 | $ | 35.84 | $ | 33.29 | 7.4 | % | 7.7 | % | |||||||||||||||||||
| SAME STORE WAREHOUSE | |||||||||||||||||||||||||||||
| Number of same store warehouses | 219 | 219 | n/a | n/a | |||||||||||||||||||||||||
| Global Warehouse same store revenue: | |||||||||||||||||||||||||||||
| Rent and storage | $ | 254,642 | $ | 256,614 | $ | 252,984 | 0.7 | % | 1.4 | % | |||||||||||||||||||
| Warehouse services | 319,511 | 320,399 | 317,648 | 0.6 | % | 0.9 | % | ||||||||||||||||||||||
| Total same store revenue | $ | 574,153 | $ | 577,013 | $ | 570,632 | 0.6 | % | 1.1 | % | |||||||||||||||||||
| Global Warehouse same store contribution (NOI) | $ | 185,124 | $ | 186,061 | $ | 172,503 | 7.3 | % | 7.9 | % | |||||||||||||||||||
| Global Warehouse same store margin | 32.2 | % | 32.2 | % | 30.2 | % | 201 bps | 202 bps | |||||||||||||||||||||
| Global Warehouse same store rent and storage metrics: | |||||||||||||||||||||||||||||
| Average economic occupied pallets | 4,216 | n/a | 4,299 | (1.9) | % | n/a | |||||||||||||||||||||||
| Average physical occupied pallets | 3,752 | n/a | 4,015 | (6.6) | % | n/a | |||||||||||||||||||||||
| Average physical pallet positions | 5,037 | n/a | 5,104 | (1.3) | % | n/a | |||||||||||||||||||||||
| Economic occupancy percentage | 83.7 | % | n/a | 84.2 | % | -53 bps | n/a | ||||||||||||||||||||||
| Physical occupancy percentage | 74.5 | % | n/a | 78.7 | % | -418 bps | n/a | ||||||||||||||||||||||
| Same store rent and storage revenue per average economic occupied pallet | $ | 60.40 | $ | 60.87 | $ | 58.85 | 2.6 | % | 3.4 | % | |||||||||||||||||||
| Same store rent and storage revenue per average physical occupied pallet | $ | 67.87 | $ | 68.39 | $ | 63.01 | 7.7 | % | 8.5 | % | |||||||||||||||||||
| Global Warehouse same store services metrics: | |||||||||||||||||||||||||||||
| Throughput pallets | 8,684 | n/a | 9,396 | (7.6) | % | n/a | |||||||||||||||||||||||
| Same store warehouse services revenue per throughput pallet | $ | 36.79 | $ | 36.90 | $ | 33.81 | 8.8 | % | 9.1 | % | |||||||||||||||||||
| Three Months Ended December 31, | Change | ||||||||||||||||||||||||||||
| Dollars and units in thousands, except per pallet data | 2023 Actual | 2023 Constant Currency(1) |
2022 Actual | Actual | Constant Currency | ||||||||||||||||||||||||
| NON-SAME STORE WAREHOUSE | |||||||||||||||||||||||||||||
Number of non-same store warehouses(2) |
21 | 21 | n/a | n/a | |||||||||||||||||||||||||
| Global Warehouse non-same store revenue: | |||||||||||||||||||||||||||||
| Rent and storage | $ | 21,999 | $ | 21,879 | $ | 14,047 | n/r | n/r | |||||||||||||||||||||
| Warehouse services | 16,110 | 15,932 | 14,011 | n/r | n/r | ||||||||||||||||||||||||
| Total non-same store revenue | $ | 38,109 | $ | 37,811 | $ | 28,058 | n/r | n/r | |||||||||||||||||||||
| Global Warehouse non-same store contribution (NOI) | $ | 11,978 | $ | 11,906 | $ | (176) | n/r | n/r | |||||||||||||||||||||
| Global Warehouse non-same store margin | 31.4 | % | 31.5 | % | (0.6) | % | n/r | n/r | |||||||||||||||||||||
| Global Warehouse non-same store rent and storage metrics: | |||||||||||||||||||||||||||||
| Average economic occupied pallets | 325 | n/a | 238 | n/r | n/a | ||||||||||||||||||||||||
| Average physical occupied pallets | 289 | n/a | 214 | n/r | n/a | ||||||||||||||||||||||||
| Average physical pallet positions | 456 | n/a | 311 | n/r | n/a | ||||||||||||||||||||||||
| Economic occupancy percentage | 71.3 | % | n/a | 76.5 | % | n/r | n/a | ||||||||||||||||||||||
| Physical occupancy percentage | 63.4 | % | n/a | 68.8 | % | n/r | n/a | ||||||||||||||||||||||
| Non-same store rent and storage revenue per average economic occupied pallet | $ | 67.69 | $ | 67.32 | $ | 59.02 | n/r | n/r | |||||||||||||||||||||
| Non-same store rent and storage revenue per average physical occupied pallet | $ | 76.12 | $ | 75.71 | $ | 65.64 | n/r | n/r | |||||||||||||||||||||
| Global Warehouse non-same store services metrics: | |||||||||||||||||||||||||||||
| Throughput pallets | 700 | n/a | 567 | n/r | n/a | ||||||||||||||||||||||||
| Non-same store warehouse services revenue per throughput pallet | $ | 23.01 | $ | 22.76 | $ | 24.71 | n/r | n/r | |||||||||||||||||||||
| Year Ended December 31, | Change | ||||||||||||||||||||||||||||
| Dollars in thousands | 2023 Actual | 2023 Constant Currency(1) | 2022 Actual | Actual | Constant currency | ||||||||||||||||||||||||
| TOTAL WAREHOUSE SEGMENT | |||||||||||||||||||||||||||||
| Number of total warehouses | 240 | 240 | n/a | n/a | |||||||||||||||||||||||||
| Global Warehouse revenue: | |||||||||||||||||||||||||||||
| Rent and storage | $ | 1,101,741 | $ | 1,113,052 | $ | 999,388 | 10.2 | % | 11.4 | % | |||||||||||||||||||
| Warehouse services | 1,289,348 | 1,299,295 | 1,303,583 | (1.1) | % | (0.3) | % | ||||||||||||||||||||||
| Total revenue | $ | 2,391,089 | $ | 2,412,347 | $ | 2,302,971 | 3.8 | % | 4.7 | % | |||||||||||||||||||
| Global Warehouse contribution (NOI) | $ | 722,603 | $ | 728,579 | $ | 636,232 | 13.6 | % | 14.5 | % | |||||||||||||||||||
| Global Warehouse margin | 30.2 | % | 30.2 | % | 27.6 | % | 259 bps | 258 bps | |||||||||||||||||||||
| Units in thousands except per pallet data | |||||||||||||||||||||||||||||
| Global Warehouse rent and storage metrics: | |||||||||||||||||||||||||||||
| Average economic occupied pallets | 4,546 | n/a | 4,318 | 5.3 | % | n/a | |||||||||||||||||||||||
| Average physical occupied pallets | 4,120 | n/a | 3,991 | 3.2 | % | n/a | |||||||||||||||||||||||
| Average physical pallet positions | 5,442 | n/a | 5,431 | 0.2 | % | n/a | |||||||||||||||||||||||
| Economic occupancy percentage | 83.5 | % | n/a | 79.5 | % | 403 bps | n/a | ||||||||||||||||||||||
| Physical occupancy percentage | 75.7 | % | n/a | 73.5 | % | 222 bps | n/a | ||||||||||||||||||||||
| Total rent and storage revenue per average economic occupied pallet | $ | 242.35 | $ | 244.84 | $ | 231.44 | 4.7 | % | 5.8 | % | |||||||||||||||||||
| Total rent and storage revenue per average physical occupied pallet | $ | 267.41 | $ | 270.16 | $ | 250.40 | 6.8 | % | 7.9 | % | |||||||||||||||||||
| Global Warehouse services metrics: | |||||||||||||||||||||||||||||
| Throughput pallets | 37,524 | n/a | 40,093 | (6.4) | % | n/a | |||||||||||||||||||||||
| Total warehouse services revenue per throughput pallet | $ | 34.36 | $ | 34.63 | $ | 32.51 | 5.7 | % | 6.5 | % | |||||||||||||||||||
| SAME STORE WAREHOUSE | |||||||||||||||||||||||||||||
| Number of same store warehouses | 219 | 219 | n/a | n/a | |||||||||||||||||||||||||
| Global Warehouse same store revenue: | |||||||||||||||||||||||||||||
| Rent and storage | $ | 1,024,515 | $ | 1,035,596 | $ | 944,102 | 8.5 | % | 9.7 | % | |||||||||||||||||||
| Warehouse services | 1,233,344 | 1,243,103 | 1,240,378 | (0.6) | % | 0.2 | % | ||||||||||||||||||||||
| Total same store revenue | $ | 2,257,859 | $ | 2,278,699 | $ | 2,184,480 | 3.4 | % | 4.3 | % | |||||||||||||||||||
| Global Warehouse same store contribution (NOI) | $ | 708,521 | $ | 714,581 | $ | 633,714 | 11.8 | % | 12.8 | % | |||||||||||||||||||
| Global Warehouse same store margin | 31.4 | % | 31.4 | % | 29.0 | % | 237 bps | 235 bps | |||||||||||||||||||||
| Units in thousands except per pallet data | |||||||||||||||||||||||||||||
| Global Warehouse same store rent and storage metrics: | |||||||||||||||||||||||||||||
| Average economic occupied pallets | 4,268 | n/a | 4,099 | 4.1 | % | n/a | |||||||||||||||||||||||
| Average physical occupied pallets | 3,877 | n/a | 3,788 | 2.3 | % | n/a | |||||||||||||||||||||||
| Average physical pallet positions | 5,065 | n/a | 5,128 | (1.2) | % | n/a | |||||||||||||||||||||||
| Economic occupancy percentage | 84.3 | % | n/a | 79.9 | % | 433 bps | n/a | ||||||||||||||||||||||
| Physical occupancy percentage | 76.5 | % | n/a | 73.9 | % | 268 bps | n/a | ||||||||||||||||||||||
| Same store rent and storage revenue per average economic occupied pallet | $ | 240.05 | $ | 242.64 | $ | 230.32 | 4.2 | % | 5.3 | % | |||||||||||||||||||
| Same store rent and storage revenue per average physical occupied pallet | $ | 264.25 | $ | 267.11 | $ | 249.23 | 6.0 | % | 7.2 | % | |||||||||||||||||||
| Global Warehouse same store services metrics: | |||||||||||||||||||||||||||||
| Throughput pallets | 35,227 | n/a | 37,841 | (6.9) | % | n/a | |||||||||||||||||||||||
| Same store warehouse services revenue per throughput pallet | $ | 35.01 | $ | 35.29 | $ | 32.78 | 6.8 | % | 7.7 | % | |||||||||||||||||||
| Year Ended December 31, | Change | ||||||||||||||||||||||||||||
| Dollars in thousands | 2023 Actual | 2023 Constant Currency(1) | 2022 Actual | Actual | Constant currency | ||||||||||||||||||||||||
| NON-SAME STORE WAREHOUSE | |||||||||||||||||||||||||||||
Number of non-same store warehouses(2) |
21 | 21 | n/a | n/a | |||||||||||||||||||||||||
| Global Warehouse non-same store revenue: | |||||||||||||||||||||||||||||
| Rent and storage | $ | 77,226 | $ | 77,456 | $ | 55,286 | n/r | n/r | |||||||||||||||||||||
| Warehouse services | 56,004 | 56,192 | 63,205 | n/r | n/r | ||||||||||||||||||||||||
| Total non-same store revenue | $ | 133,230 | $ | 133,648 | $ | 118,491 | n/r | n/r | |||||||||||||||||||||
| Global Warehouse non-same store contribution (NOI) | $ | 14,082 | $ | 13,998 | $ | 2,518 | n/r | n/r | |||||||||||||||||||||
| Global Warehouse non-same store margin | 10.6 | % | 10.5 | % | 2.1 | % | n/r | n/r | |||||||||||||||||||||
| Units in thousands except per pallet data | |||||||||||||||||||||||||||||
| Global Warehouse non-same store rent and storage metrics: | |||||||||||||||||||||||||||||
| Average economic occupied pallets | 278 | n/a | 219 | n/r | n/a | ||||||||||||||||||||||||
| Average physical occupied pallets | 243 | n/a | 203 | n/r | n/a | ||||||||||||||||||||||||
| Average physical pallet positions | 377 | n/a | 303 | n/r | n/a | ||||||||||||||||||||||||
| Economic occupancy percentage | 73.7 | % | n/a | 72.3 | % | n/r | n/a | ||||||||||||||||||||||
| Physical occupancy percentage | 64.5 | % | n/a | 67.0 | % | n/r | n/a | ||||||||||||||||||||||
| Non-same store rent and storage revenue per average economic occupied pallet | $ | 277.79 | $ | 278.62 | $ | 252.45 | n/r | n/r | |||||||||||||||||||||
| Non-same store rent and storage revenue per average physical occupied pallet | $ | 317.80 | $ | 318.75 | $ | 272.34 | n/r | n/r | |||||||||||||||||||||
| Global Warehouse non-same store services metrics: | |||||||||||||||||||||||||||||
| Throughput pallets | 2,297 | n/a | 2,250 | n/r | n/a | ||||||||||||||||||||||||
| Non-same store warehouse services revenue per throughput pallet | $ | 24.38 | $ | 24.46 | $ | 28.09 | n/r | n/r | |||||||||||||||||||||
| Americold Realty Trust, Inc. and Subsidiaries | |||||||||||
| Condensed Consolidated Balance Sheets (Unaudited) | |||||||||||
| (In thousands, except shares and per share amounts) | |||||||||||
| December 31, 2023 | December 31, 2022 | ||||||||||
| Assets | |||||||||||
| Property, buildings, and equipment: | |||||||||||
| Land | $ | 820,831 | $ | 786,975 | |||||||
| Buildings and improvements | 4,464,359 | 4,245,607 | |||||||||
| Machinery and equipment | 1,565,431 | 1,407,874 | |||||||||
| Assets under construction | 452,312 | 526,811 | |||||||||
| 7,302,933 | 6,967,267 | ||||||||||
| Accumulated depreciation | (2,196,196) | (1,901,450) | |||||||||
| Property, buildings, and equipment – net | 5,106,737 | 5,065,817 | |||||||||
| Operating lease right-of-use assets | 343,532 | 352,553 | |||||||||
| Accumulated amortization-operating leases | (96,230) | (76,334) | |||||||||
| Operating leases-net | 247,302 | 276,219 | |||||||||
| Financing Leases: | |||||||||||
| Buildings and improvements | 13,542 | 13,546 | |||||||||
| Machinery and equipment | 161,446 | 127,009 | |||||||||
| 174,988 | 140,555 | ||||||||||
| Accumulated depreciation | (69,824) | (57,626) | |||||||||
| Financing leases – net | 105,164 | 82,929 | |||||||||
| Cash, cash equivalents, and restricted cash | 60,392 | 53,063 | |||||||||
| Accounts receivable, net of allowance of $21,647 and $15,951 at December 31, 2023 and 2022, respectively | 426,048 | 430,042 | |||||||||
| Identifiable intangible assets – net | 897,414 | 925,223 | |||||||||
| Goodwill | 794,004 | 1,033,637 | |||||||||
| Investments in and advances to partially owned entities and other | 38,113 | 78,926 | |||||||||
| Other assets | 194,078 | 158,705 | |||||||||
| Total assets | $ | 7,869,252 | $ | 8,104,561 | |||||||
| Liabilities and equity | |||||||||||
| Liabilities: | |||||||||||
| Borrowings under revolving line of credit | $ | 392,156 | $ | 500,052 | |||||||
| Accounts payable and accrued expenses | 568,764 | 557,540 | |||||||||
| Senior unsecured notes and term loans - net of deferred financing cost of $10,578 and $13,044 at December 31, 2023 and 2022, respectively | 2,601,122 | 2,569,281 | |||||||||
| Sale-leaseback financing obligations | 161,937 | 171,089 | |||||||||
| Financing lease obligations | 97,177 | 77,561 | |||||||||
| Operating lease obligations | 240,251 | 264,634 | |||||||||
| Unearned revenue | 28,379 | 32,046 | |||||||||
| Pension and postretirement benefits | 1,624 | 1,531 | |||||||||
| Deferred tax liability - net | 135,797 | 135,098 | |||||||||
| Multiemployer pension plan withdrawal liability | 7,458 | 7,851 | |||||||||
| Total liabilities | 4,234,665 | 4,316,683 | |||||||||
| Equity | |||||||||||
| Stockholders' equity | |||||||||||
| Common stock, $0.01 par value per share – 500,000,000 authorized shares; 283,699,120 and 269,814,956 issued and outstanding at December 31, 2023 and 2022, respectively | 2,837 | 2,698 | |||||||||
| Paid-in capital | 5,625,907 | 5,191,969 | |||||||||
| Accumulated deficit and distributions in excess of net earnings | (1,995,975) | (1,415,198) | |||||||||
| Accumulated other comprehensive loss | (16,640) | (6,050) | |||||||||
| Total stockholders’ equity | 3,616,129 | 3,773,419 | |||||||||
| Noncontrolling interests: | |||||||||||
| Noncontrolling interests in operating partnership | 18,458 | 14,459 | |||||||||
| Total equity | 3,634,587 | 3,787,878 | |||||||||
| Total liabilities and equity | $ | 7,869,252 | $ | 8,104,561 | |||||||
| Americold Realty Trust, Inc. and Subsidiaries | |||||||||||||||||||||||
| Condensed Consolidated Statements of Operations (Unaudited) | |||||||||||||||||||||||
| (In thousands, except per share amounts) | |||||||||||||||||||||||
| Three Months Ended December 31, | Year Ended December 31, | ||||||||||||||||||||||
| 2023 | 2022 | 2023 | 2022 | ||||||||||||||||||||
| Revenues: | |||||||||||||||||||||||
| Rent, storage, and warehouse services | $ | 612,262 | $ | 598,690 | $ | 2,391,089 | $ | 2,302,971 | |||||||||||||||
| Transportation services | 57,878 | 76,190 | 239,670 | 313,358 | |||||||||||||||||||
| Third-party managed services | 9,151 | 46,624 | 42,570 | 298,406 | |||||||||||||||||||
| Total revenues | 679,291 | 721,504 | 2,673,329 | 2,914,735 | |||||||||||||||||||
| Operating expenses: | |||||||||||||||||||||||
| Rent, storage, and warehouse services cost of operations | 415,160 | 426,363 | 1,668,486 | 1,666,739 | |||||||||||||||||||
| Transportation services cost of operations | 46,966 | 61,738 | 197,630 | 265,956 | |||||||||||||||||||
| Third-party managed services cost of operations | 7,330 | 45,177 | 36,641 | 286,077 | |||||||||||||||||||
| Depreciation and amortization | 94,099 | 82,467 | 353,743 | 331,446 | |||||||||||||||||||
| Selling, general, and administrative | 57,763 | 60,073 | 226,786 | 231,067 | |||||||||||||||||||
| Acquisition, cyber incident, and other, net | 15,774 | 11,899 | 64,087 | 32,511 | |||||||||||||||||||
| Impairment of indefinite and long-lived assets | 236,515 | 764 | 236,515 | 7,380 | |||||||||||||||||||
| Loss (gain) on sale of real estate | 5 | (21) | (2,254) | 5,689 | |||||||||||||||||||
| Total operating expenses | 873,612 | 688,460 | 2,781,634 | 2,826,865 | |||||||||||||||||||
| Operating (loss) income | (194,321) | 33,044 | (108,305) | 87,870 | |||||||||||||||||||
| Other income (expense) | |||||||||||||||||||||||
| Interest expense | (33,681) | (33,407) | (140,107) | (116,127) | |||||||||||||||||||
| Loss on debt extinguishment, modifications and termination of derivative instruments | (627) | (933) | (2,482) | (3,217) | |||||||||||||||||||
| Gain (loss) from partially owned entities | 174 | (139) | (1,442) | (918) | |||||||||||||||||||
| Impairment of related party loan receivable | — | — | (21,972) | — | |||||||||||||||||||
| Loss on put option | — | — | (56,576) | — | |||||||||||||||||||
| Other, net | 1,054 | 3,661 | 2,795 | 2,464 | |||||||||||||||||||
| (Loss) income from continuing operations before income taxes | (227,401) | 2,226 | (328,089) | (29,928) | |||||||||||||||||||
| Income tax benefit (expense) | |||||||||||||||||||||||
| Current | (2,627) | (721) | (8,508) | (3,725) | |||||||||||||||||||
| Deferred | 3,228 | 3,412 | 10,781 | 22,561 | |||||||||||||||||||
| Income tax benefit | 601 | 2,691 | 2,273 | 18,836 | |||||||||||||||||||
| Net (loss) income | |||||||||||||||||||||||
| Net (loss) income from continuing operations | (226,800) | 4,917 | (325,816) | (11,092) | |||||||||||||||||||
| Net loss from discontinued operations | — | (1,962) | (10,453) | (8,382) | |||||||||||||||||||
| Net (loss) income | $ | (226,800) | $ | 2,955 | $ | (336,269) | $ | (19,474) | |||||||||||||||
| Net loss attributable to noncontrolling interests | 41 | 11 | (54) | (34) | |||||||||||||||||||
| Net (loss) income attributable to Americold Realty Trust, Inc. | $ | (226,841) | $ | 2,944 | $ | (336,215) | $ | (19,440) | |||||||||||||||
| Weighted average common stock outstanding – basic | 284,263 | 269,826 | 275,773 | 269,565 | |||||||||||||||||||
| Weighted average common stock outstanding – diluted | 284,263 | 270,770 | 275,773 | 269,565 | |||||||||||||||||||
| Net (loss) income per common share - basic | $ | (0.80) | $ | 0.02 | $ | (1.18) | $ | (0.04) | |||||||||||||||
| Net loss per common share from discontinued operations - basic | $ | — | $ | (0.01) | $ | (0.04) | $ | (0.03) | |||||||||||||||
| Basic (loss) income per share | $ | (0.80) | $ | 0.01 | $ | (1.22) | $ | (0.07) | |||||||||||||||
| Net (loss) income per common share - diluted | $ | (0.80) | $ | 0.02 | $ | (1.18) | $ | (0.04) | |||||||||||||||
| Net loss per common share from discontinued operations - diluted | $ | — | $ | (0.01) | $ | (0.04) | $ | (0.03) | |||||||||||||||
| Diluted (loss) income per share | $ | (0.80) | $ | 0.01 | $ | (1.22) | $ | (0.07) | |||||||||||||||
| Reconciliation of Net (Loss) Income to NAREIT FFO, Core FFO, and AFFO | ||||||||||||||||||||||||||
| (In thousands, except per share amounts) | ||||||||||||||||||||||||||
| Three Months Ended | YTD | |||||||||||||||||||||||||
| Q4 23 | Q3 23 | Q2 23 | Q1 23 | Q4 22 | 2023 | 2022 | ||||||||||||||||||||
| Net (loss) income | $ | (226,800) | $ | (2,096) | $ | (104,802) | $ | (2,571) | $ | 2,955 | $ | (336,269) | $ | (19,474) | ||||||||||||
| Adjustments: | ||||||||||||||||||||||||||
| Real estate related depreciation | 57,183 | 56,373 | 54,740 | 54,541 | 53,094 | 222,837 | 210,171 | |||||||||||||||||||
| Loss (gain) on sale of real estate | 5 | 78 | (2,528) | 191 | (21) | (2,254) | 5,689 | |||||||||||||||||||
| Net loss (gain) on asset disposals | 260 | (25) | — | — | 175 | 235 | 1,135 | |||||||||||||||||||
| Impairment charges on real estate assets | — | — | — | — | — | — | 3,407 | |||||||||||||||||||
| Our share of reconciling items related to partially owned entities | 280 | 290 | 232 | 903 | 1,209 | 1,705 | 4,410 | |||||||||||||||||||
| NAREIT Funds from operations | $ | (169,072) | $ | 54,620 | $ | (52,358) | $ | 53,064 | $ | 57,412 | $ | (113,746) | $ | 205,338 | ||||||||||||
| Adjustments: | ||||||||||||||||||||||||||
| Net loss (gain) on sale of non-real estate assets | 3,312 | (296) | 289 | 420 | 2,274 | 3,725 | 2,421 | |||||||||||||||||||
| Acquisition, cyber incident and other, net | 15,774 | 13,931 | 27,235 | 7,147 | 11,899 | 64,087 | 32,511 | |||||||||||||||||||
| Goodwill impairment | 236,515 | — | — | — | — | 236,515 | 3,209 | |||||||||||||||||||
| Loss on debt extinguishment, modifications and termination of derivative instruments | 627 | 683 | 627 | 545 | 933 | 2,482 | 3,217 | |||||||||||||||||||
| Foreign currency exchange (gain) loss | (28) | 705 | 212 | (458) | (2,477) | 431 | 975 | |||||||||||||||||||
| Gain on legal settlement related to prior period operations | (2,180) | — | — | — | — | (2,180) | — | |||||||||||||||||||
| Gain on extinguishment of New Market Tax Credit Structure | — | — | — | — | — | — | (3,410) | |||||||||||||||||||
| Loss on deconsolidation of subsidiary contributed to LATAM joint venture | — | — | — | — | — | — | 4,148 | |||||||||||||||||||
| Our share of reconciling items related to partially owned entities | (184) | 147 | (27) | 128 | 127 | 64 | 574 | |||||||||||||||||||
| (Gain) loss from discontinued operations, net of tax | — | (203) | 8,275 | — | — | 8,072 | — | |||||||||||||||||||
| Impairment of related party receivable | — | — | 21,972 | — | — | 21,972 | — | |||||||||||||||||||
| Loss on put option | — | — | 56,576 | — | — | 56,576 | — | |||||||||||||||||||
| Gain on sale of LATAM JV | — | — | (304) | — | — | (304) | — | |||||||||||||||||||
Core FFO(b) |
$ | 84,764 | $ | 69,587 | $ | 62,497 | $ | 60,846 | $ | 70,168 | $ | 277,694 | $ | 248,983 | ||||||||||||
| Adjustments: | ||||||||||||||||||||||||||
| Amortization of deferred financing costs and pension withdrawal liability | 1,290 | 1,286 | 1,279 | 1,240 | 1,305 | 5,095 | 4,833 | |||||||||||||||||||
| Amortization of below/above market leases | 360 | 369 | 375 | 402 | 534 | 1,506 | 2,131 | |||||||||||||||||||
| Non-real estate asset impairment | — | — | — | — | 764 | — | 764 | |||||||||||||||||||
| Straight-line net rent | 597 | 544 | 361 | (491) | 333 | 1,011 | 747 | |||||||||||||||||||
| Deferred income tax benefit | (3,228) | (2,473) | (1,459) | (3,621) | (3,412) | (10,781) | (22,561) | |||||||||||||||||||
| Stock-based compensation expense | 5,780 | 6,203 | 4,639 | 6,970 | 5,036 | 23,592 | 27,137 | |||||||||||||||||||
| Non-real estate depreciation and amortization | 36,916 | 33,355 | 30,152 | 30,483 | 29,373 | 130,906 | 121,275 | |||||||||||||||||||
| Maintenance capital expenditures | (18,670) | (20,907) | (22,590) | (16,244) | (26,701) | (78,411) | (85,511) | |||||||||||||||||||
| Our share of reconciling items related to partially owned entities | 208 | 198 | 303 | 304 | 819 | 1,013 | 2,482 | |||||||||||||||||||
Adjusted FFO(b) |
$ | 108,017 | $ | 88,162 | $ | 75,557 | $ | 79,889 | $ | 78,219 | 351,625 | $ | 300,280 | |||||||||||||
| Reconciliation of Net (Loss) Income to NAREIT FFO, Core FFO, and AFFO (continued) | ||||||||||||||||||||||||||
| (In thousands except per share amounts) | ||||||||||||||||||||||||||
| Three Months Ended | YTD | |||||||||||||||||||||||||
| Q4 23 | Q3 23 | Q2 23 | Q1 23 | Q4 22 | 2023 | 2022 | ||||||||||||||||||||
NAREIT Funds from operations(b) |
$ | (169,072) | $ | 54,620 | $ | (52,358) | $ | 53,064 | $ | 57,412 | $ | (113,746) | $ | 205,338 | ||||||||||||
Core FFO(b) |
$ | 84,764 | $ | 69,587 | $ | 62,497 | $ | 60,846 | $ | 70,168 | $ | 277,694 | $ | 248,984 | ||||||||||||
Adjusted FFO(b) |
$ | 108,017 | $ | 88,162 | $ | 75,557 | $ | 79,889 | $ | 78,219 | $ | 351,625 | $ | 300,281 | ||||||||||||
| Reconciliation of weighted average shares: | ||||||||||||||||||||||||||
| Weighted average basic shares for net income calculation | 284,263 | 278,137 | 270,462 | 270,230 | 269,826 | 275,773 | 269,565 | |||||||||||||||||||
| Dilutive stock options and unvested restricted stock units | 502 | 519 | 695 | 778 | 944 | 624 | 1,041 | |||||||||||||||||||
| Weighted average dilutive shares | 284,765 | 278,656 | 271,157 | 271,008 | 270,770 | 276,397 | 270,606 | |||||||||||||||||||
NAREIT FFO - basic per share(b) |
$ | (0.59) | $ | 0.20 | $ | (0.19) | $ | 0.20 | $ | 0.21 | $ | (0.41) | $ | 0.76 | ||||||||||||
NAREIT FFO - diluted per share(b) |
$ | (0.59) | $ | 0.20 | $ | (0.19) | $ | 0.20 | $ | 0.21 | $ | (0.41) | $ | 0.76 | ||||||||||||
Core FFO - basic per share (b) |
$ | 0.30 | $ | 0.25 | $ | 0.23 | $ | 0.23 | $ | 0.26 | $ | 1.01 | $ | 0.92 | ||||||||||||
Core FFO - diluted per share(b) |
$ | 0.30 | $ | 0.25 | $ | 0.23 | $ | 0.22 | $ | 0.26 | $ | 1.00 | $ | 0.92 | ||||||||||||
Adjusted FFO - basic per share (b) |
$ | 0.38 | $ | 0.32 | $ | 0.28 | $ | 0.30 | $ | 0.29 | $ | 1.28 | $ | 1.11 | ||||||||||||
Adjusted FFO - diluted per share(b) |
$ | 0.38 | $ | 0.32 | $ | 0.28 | $ | 0.29 | $ | 0.29 | $ | 1.27 | $ | 1.11 | ||||||||||||
| Three Months Ended-Recasted | YTD Recasted | ||||||||||||||||
| (In thousands except per share amounts) | Q1 23 | Q4 22 | 2023 | 2022 | |||||||||||||
| NAREIT FFO | $ | 52,432 | $ | 56,457 | $ | (114,378) | $ | 202,088 | |||||||||
| Core FFO | $ | 62,547 | $ | 71,157 | $ | 279,395 | $ | 254,078 | |||||||||
| Adjusted FFO applicable to common shareholders | $ | 81,506 | $ | 78,717 | $ | 353,242 | $ | 303,007 | |||||||||
| NAREIT FFO - basic per share | $ | 0.19 | $ | 0.21 | $ | (0.41) | $ | 0.75 | |||||||||
| NAREIT FFO - diluted per share | $ | 0.19 | $ | 0.21 | $ | (0.41) | $ | 0.75 | |||||||||
| Core FFO - basic per share | $ | 0.23 | $ | 0.26 | $ | 1.01 | $ | 0.94 | |||||||||
| Core FFO - diluted per share | $ | 0.23 | $ | 0.26 | $ | 1.01 | $ | 0.94 | |||||||||
| Adjusted FFO - basic per share | $ | 0.30 | $ | 0.29 | $ | 1.28 | $ | 1.12 | |||||||||
| Adjusted FFO - diluted per share | $ | 0.30 | $ | 0.29 | $ | 1.28 | $ | 1.12 | |||||||||
| Reconciliation of Net (Loss) Income to EBITDA, NAREIT EBITDAre, and Core EBITDA | ||||||||||||||||||||||||||
| (In thousands) | ||||||||||||||||||||||||||
| Three Months Ended | Year End | |||||||||||||||||||||||||
| Q4 23 | Q3 23 | Q2 23 | Q1 23 | Q4 22 | 2023 | 2022 | ||||||||||||||||||||
| Net (loss) income | $ | (226,800) | $ | (2,096) | $ | (104,802) | $ | (2,571) | $ | 2,955 | $ | (336,269) | $ | (19,474) | ||||||||||||
| Adjustments: | ||||||||||||||||||||||||||
| Depreciation and amortization | 94,099 | 89,728 | 84,892 | 85,024 | 82,467 | 353,743 | 331,446 | |||||||||||||||||||
| Interest expense | 33,681 | 35,572 | 36,431 | 34,423 | 33,407 | 140,107 | 116,127 | |||||||||||||||||||
| Income tax (benefit) expense | (601) | (492) | 464 | (1,644) | (2,691) | (2,273) | (18,836) | |||||||||||||||||||
| EBITDA | $ | (99,621) | $ | 122,712 | $ | 16,985 | $ | 115,232 | $ | 116,138 | $ | 155,308 | $ | 409,263 | ||||||||||||
| Adjustments: | ||||||||||||||||||||||||||
| Loss (gain) on sale of real estate | 5 | 78 | (2,528) | 191 | (21) | (2,254) | 5,689 | |||||||||||||||||||
| Adjustment to reflect share of EBITDAre of partially owned entities | 1,533 | 1,495 | 3,085 | 2,883 | 5,019 | 8,996 | 17,815 | |||||||||||||||||||
NAREIT EBITDAre(a) |
$ | (98,083) | $ | 124,285 | $ | 17,542 | $ | 118,306 | $ | 121,136 | $ | 162,050 | $ | 432,767 | ||||||||||||
| Adjustments: | ||||||||||||||||||||||||||
| Acquisition, cyber incident and other, net | 15,774 | 13,931 | 27,235 | 7,147 | 11,899 | 64,087 | 32,511 | |||||||||||||||||||
| (Gain) loss from investments in partially owned entities | (174) | 259 | 709 | 3,029 | 2,101 | 3,823 | 9,300 | |||||||||||||||||||
| Impairment of indefinite and long-lived assets | 236,515 | — | — | — | 764 | 236,515 | 7,380 | |||||||||||||||||||
| Foreign currency exchange (gain) loss | (28) | 705 | 212 | (458) | (2,477) | 431 | 975 | |||||||||||||||||||
| Stock-based compensation expense | 5,780 | 6,203 | 4,639 | 6,970 | 5,036 | 23,592 | 27,137 | |||||||||||||||||||
| Loss on debt extinguishment, modifications and termination of derivative instruments | 627 | 683 | 627 | 545 | 933 | 2,482 | 3,217 | |||||||||||||||||||
| Gain (loss) on real estate and other asset disposals | 3,572 | (321) | 289 | 420 | 2,449 | 3,960 | 3,556 | |||||||||||||||||||
| Loss on deconsolidation of subsidiary contributed to LATAM joint venture | — | — | — | — | — | — | 4,148 | |||||||||||||||||||
| Reduction in EBITDAre from partially owned entities | (1,533) | (1,495) | (3,085) | (2,883) | (5,019) | (8,996) | (17,815) | |||||||||||||||||||
| Gain from sale of partially owned entities | — | — | (304) | — | — | (304) | — | |||||||||||||||||||
| (Gain) loss from discontinued operations, net of tax | — | (203) | 8,275 | — | — | 8,072 | — | |||||||||||||||||||
| Impairment of related party receivable | — | — | 21,972 | — | — | 21,972 | — | |||||||||||||||||||
| Loss on put option | — | — | 56,576 | — | — | 56,576 | — | |||||||||||||||||||
| Core EBITDA | $ | 160,270 | $ | 144,047 | $ | 134,687 | $ | 133,076 | $ | 136,822 | 572,080 | 499,766 | ||||||||||||||
| Three Months Ended-Recasted | Year End Recasted | ||||||||||||||||
| (In thousands) | Q1 23 | Q4 22 | 2023 | 2022 | |||||||||||||
| NAREIT EBITDAre | $116,872 | $117,602 | $160,616 | $419,791 | |||||||||||||
| Three Months Ended December 31, | Year Ended December 31, | ||||||||||||||||||||||
| 2023 | 2022 | 2023 | 2022 | ||||||||||||||||||||
| Segment revenues: | |||||||||||||||||||||||
| Warehouse | 612,262 | 598,690 | $ | 2,391,089 | $ | 2,302,971 | |||||||||||||||||
| Transportation | 57,878 | 76,190 | 239,670 | 313,358 | |||||||||||||||||||
| Third-party managed | 9,151 | 46,624 | 42,570 | 298,406 | |||||||||||||||||||
| Total revenues | 679,291 | 721,504 | 2,673,329 | 2,914,735 | |||||||||||||||||||
| Segment contribution: | |||||||||||||||||||||||
| Warehouse | 197,102 | 172,327 | $ | 722,603 | $ | 636,232 | |||||||||||||||||
| Transportation | 10,912 | 14,452 | 42,040 | 47,402 | |||||||||||||||||||
| Third-party managed | 1,821 | 1,447 | 5,929 | 12,329 | |||||||||||||||||||
| Total segment contribution | 209,835 | 188,226 | 770,572 | 695,963 | |||||||||||||||||||
| Reconciling items: | |||||||||||||||||||||||
| Depreciation and amortization | (94,099) | (82,467) | (353,743) | (331,446) | |||||||||||||||||||
| Selling, general, and administrative | (57,763) | (60,073) | (226,786) | (231,067) | |||||||||||||||||||
| Acquisition, cyber incident, and other, net | (15,774) | (11,899) | (64,087) | (32,511) | |||||||||||||||||||
| Impairment of indefinite and long-lived assets | (236,515) | (764) | (236,515) | (7,380) | |||||||||||||||||||
| (Loss) gain on sale of real estate | (5) | 21 | 2,254 | (5,689) | |||||||||||||||||||
| Interest expense | (33,681) | (33,407) | (140,107) | (116,127) | |||||||||||||||||||
| Other, net | 1,054 | 3,661 | 2,795 | 2,464 | |||||||||||||||||||
| Loss on debt extinguishment, modifications and termination of derivative instruments | (627) | (933) | (2,482) | (3,217) | |||||||||||||||||||
| Gain (loss) from partially owned entities | 174 | (139) | (1,442) | (918) | |||||||||||||||||||
| Impairment of related party loan receivable | — | — | (21,972) | — | |||||||||||||||||||
| Loss on put option | — | — | (56,576) | — | |||||||||||||||||||
| (Loss) income from continuing operations before income taxes | $ | (227,401) | $ | 2,226 | $ | (328,089) | $ | (29,928) | |||||||||||||||
| Notes and Definitions | ||
| We use the following non-GAAP financial measures as supplemental performance measures of our business: NAREIT FFO, Core FFO, Adjusted FFO, EBITDAre, Core EBITDA, net debt to pro-forma Core EBITDA and segment contribution (‘NOI”). | ||
| We calculate funds from operations, or FFO, in accordance with the standards established by the Board of Governors of the National Association of Real Estate Investment Trusts, or NAREIT. NAREIT defines FFO as net income or loss determined in accordance with U.S. GAAP, excluding extraordinary items as defined under U.S. GAAP and gains or losses from sales of previously depreciated operating real estate and other assets, plus specified non-cash items, such as real estate asset depreciation and amortization impairment charge on real estate related assets and our share of reconciling items for partially owned entities. We believe that FFO is helpful to investors as a supplemental performance measure because it excludes the effect of depreciation, amortization and gains or losses from sales of real estate, all of which are based on historical costs, which implicitly assumes that the value of real estate diminishes predictably over time. Since real estate values instead have historically risen or fallen with market conditions, FFO can facilitate comparisons of operating performance between periods and among other equity REITs. | ||
| We calculate core funds from operations, or Core FFO, as NAREIT FFO adjusted for the effects of gain or loss on the sale of non-real estate assets, acquisition, cyber incident and other, net, goodwill impairment (when applicable), loss on debt extinguishment, modifications and termination of derivative instruments, foreign currency exchange (gain) loss, gain on legal settlement related to prior period operations, gain or loss from discontinued operations net of tax, impairment of related party receivable, loss on fair put option, gain on extinguishment of New Market Tax Credit structure, loss on deconsolidation of subsidiary contributed to LATAM joint venture, and gain from sale of LATAM joint venture. We also adjust for the impact of Core FFO on our share of reconciling items for partially owned entities, and gain from disposition of partially owned entities. We believe that Core FFO is helpful to investors as a supplemental performance measure because it excludes the effects of certain items which can create significant earnings volatility, but which do not directly relate to our core business operations. We believe Core FFO can facilitate comparisons of operating performance between periods, while also providing a more meaningful predictor of future earnings potential. | ||
| However, because NAREIT FFO and Core FFO add back real estate depreciation and amortization and do not capture the level of maintenance capital expenditures necessary to maintain the operating performance of our properties, both of which have material economic impacts on our results from operations, we believe the utility of NAREIT FFO and Core FFO as a measure of our performance may be limited. | ||
| We calculate adjusted funds from operations, or Adjusted FFO, as Core FFO adjusted for the effects of amortization of deferred financing costs and pension withdrawal liability, amortization of above or below market leases, non-real estate asset impairment, straight-line net rent, benefit from deferred income taxes, stock-based compensation expense, non-real estate depreciation and amortization and maintenance capital expenditures. We also adjust for AFFO attributable to our share of reconciling items of partially owned entities and discontinued operations. We believe that Adjusted FFO is helpful to investors as a meaningful supplemental comparative performance measure of our ability to make incremental capital investments in our business and to assess our ability to fund distribution requirements from our operating activities. | ||
| FFO, Core FFO and Adjusted FFO are used by management, investors and industry analysts as supplemental measures of operating performance of equity REITs. FFO, Core FFO and Adjusted FFO should be evaluated along with U.S. GAAP net income and net income per diluted share (the most directly comparable U.S. GAAP measures) in evaluating our operating performance. FFO, Core FFO and Adjusted FFO do not represent net income or cash flows from operating activities in accordance with U.S. GAAP and are not indicative of our results of operations or cash flows from operating activities as disclosed in our consolidated statements of operations included in our quarterly and annual reports. FFO, Core FFO and Adjusted FFO should be considered as supplements, but not alternatives, to our net income or cash flows from operating activities as indicators of our operating performance. Moreover, other REITs may not calculate FFO in accordance with the NAREIT definition or may interpret the NAREIT definition differently than we do. Accordingly, our FFO may not be comparable to FFO as calculated by other REITs. In addition, there is no industry definition of Core FFO or Adjusted FFO and, as a result, other REITs may also calculate Core FFO or Adjusted FFO, or other similarly-captioned metrics, in a manner different than we do. The table above reconciles FFO, Core FFO and Adjusted FFO to net (loss) income, which is the most directly comparable financial measure calculated in accordance with U.S. GAAP. | ||
| We calculate EBITDA for Real Estate, or EBITDAre, in accordance with the standards established by the Board of Governors of NAREIT, defined as, earnings before interest expense, taxes, depreciation and amortization, net gain on sale of real estate, net of withholding taxes, and adjustment to reflect share of EBITDAre of partially owned entities. EBITDAre is a measure commonly used in our industry, and we present EBITDAre to enhance investor understanding of our operating performance. We believe that EBITDAre provides investors and analysts with a measure of operating results unaffected by differences in capital structures, capital investment cycles and useful life of related assets among otherwise comparable companies. | ||
We also calculate our Core EBITDA as EBITDAre further adjusted for acquisition, cyber and other, net, loss from investments in partially owned entities, impairment of indefinite and long-lived assets (when applicable), foreign currency exchange loss or gain, stock-based compensation expense, loss on debt extinguishment, modifications and termination of derivative instruments, net gain on other asset disposals, reduction in EBITDAre from partially owned entities, discontinued operations, impairment of related party loan receivable, loss on fair value of put, gain on extinguishment of new market tax credit structure, and loss on deconsolidation of subsidiary contributed to LATAM joint venture.. We believe that the presentation of Core EBITDA provides a measurement of our operations that is meaningful to investors because it excludes the effects of certain items that are otherwise included in EBITDAre but which we do not believe are indicative of our core business operations. EBITDAre and Core EBITDA are not measurements of financial performance under U.S. GAAP, and our EBITDAre and Core EBITDA may not be comparable to similarly titled measures of other companies. You should not consider our EBITDAre and Core EBITDA as alternatives to net income or cash flows from operating activities determined in accordance with U.S. GAAP. Our calculations of EBITDAre and Core EBITDA have limitations as analytical tools, including: | ||
NOI is calculated as earnings before interest expense, taxes, depreciation and amortization, and excluding corporate Selling, general, and administrative expense; Acquisition, cyber incident, and other, net; Impairment of indefinite and long-lived assets; gain or loss on sale of real estate and all components of non-operating other income and expense. Management believes that this is a helpful metric to measure period to period operating performance of the business. | ||
| We use Core EBITDA and EBITDAre as measures of our operating performance and not as measures of liquidity. The table on page 21 of our financial supplement reconciles EBITDA, EBITDAre and Core EBITDA to net income, which is the most directly comparable financial measure calculated in accordance with U.S. GAAP. | ||
| Net debt to proforma Core EBITDA is calculated using total debt, plus capital lease obligations, less cash and cash equivalents, divided by pro-forma Core EBITDA. We calculate pro-forma Core EBITDA as Core EBITDA further adjusted for acquisitions, dispositions and for rent expense associated with lease buy-outs and lease exits. The pro-forma adjustment for acquisitions reflects the Core EBITDA for the period of time prior to acquisition. The pro-forma adjustment for leased facilities exited or purchased reflects the add-back for the related lease expense from the last year. The pro-forma adjustment for dispositions reduces Core EBITDA for the earnings of facilities disposed of or exited during the year, including the strategic exit of certain third-party managed business. | ||
We define our “same store” population once annually at the beginning of the current calendar year. Our population includes properties owned or leased for the entirety of two comparable periods with at least twelve consecutive months of normalized operations prior to January 1 of the current calendar year. We define “normalized operations” as properties that have been open for operation or lease, after development or significant modification (e.g., expansion or rehabilitation subsequent to a natural disaster). Acquired properties are included in the “same store” population if owned by us as of the first business day of the prior calendar year (e.g. January 1, 2022) and are still owned by us as of the end of the current reporting period, unless the property is under development. The “same store” pool is also adjusted to remove properties that were sold or entered development subsequent to the beginning of the current calendar year. Beginning January of 2024, changes in ownership structure (e.g., purchase of a previously leased warehouse) will no longer result in a facility being excluded from the same store population, as management believes that actively managing its real estate is normal course of operations. Additionally, management will begin to classify new developments (both conventional and automated facilities) as a component of the same store pool once the facility is considered fully operational and both inbounding and outbounding product for at least twelve consecutive months prior to January 1 of the current calendar year. | ||
| We calculate “same store revenue” as revenues for the same store population. We calculate “same store contribution (NOI)” as revenues for the same store population less its cost of operations (excluding any depreciation and amortization, impairment charges, corporate-level selling, general and administrative expenses, corporate-level acquisition, cyber incident and other, net and gain or loss on sale of real estate). In order to derive an appropriate measure of period-to-period operating performance, we also calculate our same store contribution (NOI) on a constant currency basis to remove the effects of foreign currency exchange rate movements by using the comparable prior period exchange rate to translate from local currency into U.S. dollars for both periods. We evaluate the performance of the warehouses we own or lease using a “same store” analysis, and we believe that same store contribution (NOI) is helpful to investors as a supplemental performance measure because it includes the operating performance from the population of properties that is consistent from period to period and also on a constant currency basis, thereby eliminating the effects of changes in the composition of our warehouse portfolio and currency fluctuations on performance measures. Same store contribution (NOI) is not a measurement of financial performance under U.S. GAAP. In addition, other companies providing temperature-controlled warehouse storage and handling and other warehouse services may not define same store or calculate same store contribution (NOI) in a manner consistent with our definition or calculation. Same store contribution (NOI) should be considered as a supplement, but not as an alternative, to our results calculated in accordance with U.S. GAAP. The tables beginning on page 33 of our financial supplement provide reconciliations for same store revenues and same store contribution (NOI). | ||
| We define “maintenance capital expenditures” as capital expenditures made to extend the life of, and provide future economic benefit from, our existing temperature-controlled warehouse network and its existing supporting personal property and information technology. Maintenance capital expenditures include capital expenditures made to extend the life of, and provide future economic benefit from, our existing temperature-controlled warehouse network and its existing supporting personal property and information technology. Maintenance capital expenditures do not include acquisition costs contemplated when underwriting the purchase of a building or costs which are incurred to bring a building up to Americold’s operating standards. See the tables on page 30 of our financial supplement for additional information regarding our maintenance capital expenditures. | ||
| We define “total real estate debt” as the aggregate of the following: mortgage notes, senior unsecured notes, term loans and borrowings under our revolving line of credit. We define “total debt outstanding” as the aggregate of the following: total real estate debt, sale-leaseback financing obligations and financing lease obligations. See the tables on page 23 of our financial supplement for additional information regarding our indebtedness. | ||
| All quarterly amounts and non-GAAP disclosures within this filing shall be deemed unaudited. | ||

 |
||||||||
| Financial Supplement | Fourth Quarter 2023 |
|||||||
| Table of Contents | |||||
| Overview | PAGE | ||||
| Corporate Profile | |||||
| Earnings Release | |||||
| Selected Quarterly Financial Data | |||||
| Financial Information | |||||
| Consolidated Balance Sheets | |||||
| Consolidated Statements of Operations | |||||
| Reconciliation of Net (Loss) Income to NAREIT FFO, Core FFO and AFFO | |||||
| Reconciliation of Net (Loss) Income to EBITDA, NAREIT EBITDAre, and Core EBITDA | |||||
| Acquisition, Cyber Incident and Other, net | |||||
| Debt Detail and Maturities | |||||
| Operations Overview | |||||
| Revenue and Contribution (NOI) by Segment | |||||
| Global Warehouse Economic and Physical Occupancy Trend | |||||
| Global Warehouse Portfolio | |||||
| Fixed Commitment and Lease Maturity Schedules | |||||
| Maintenance Capital Expenditures, Repair and Maintenance Expenses and External Growth, Expansion and Development Capital Expenditures | |||||
| Total Global Warehouse Segment Financial and Operating Performance | |||||
| Global Warehouse Segment Financial Performance | |||||
| Same-store Financial Performance | |||||
| Same-store Key Operating Metrics | |||||
| Same-store Historical Performance Trend | |||||
| External Growth and Capital Deployment | |||||
| Unconsolidated Joint Ventures (Investments in Partially Owned Entities) | |||||
| 2024 Guidance | |||||
| Notes and Definitions | |||||
|
||||||||
| Financial Supplement | Fourth Quarter 2023 |
|||||||
|
||||||||
| Financial Supplement | Fourth Quarter 2023 |
|||||||
| Analyst Coverage | ||||||||||||||
| Firm | Analyst Name | Contact | ||||||||||||
| Baird Equity Research | Nicholas Thillman | 414-298-5053 | nthillman@rwbaird.com | |||||||||||
| Bank of America Merrill Lynch | Joshua Dennerlein | 646-855-1681 | joshua.dennerlein@bofa.com | |||||||||||
| Barclays | Brendan Lynch | 212-526-9428 | brendan.lynch@barclays.com | |||||||||||
| BNP Paribas Exane Research | Nate Crossett | 646-725-3716 | nate.crossett@exanebnpparibas.com | |||||||||||
| Citi | Craig Mailman |
212-816-4471 | craig.mailman@citi.com |
|||||||||||
| Evercore ISI | Samir Khanal / Steve Sakwa |
212-888-3796 / 212-446-9462 | samir.khanal@evercoreisi.com / steve.sakwa@evercoreisi.com | |||||||||||
| Green Street Advisors | Vince Tibone | 949-640-8780 | vtibone@greenstreet.com | |||||||||||
| J.P. Morgan | Michael W. Mueller | 212-622-6689 | michael.w.mueller@jpmorgan.com | |||||||||||
| KeyBanc | Todd Thomas | 917-368-2286 | tthomas@key.com | |||||||||||
| MorningStar Research Services | Suryansh Sharma | 314-585-6793 | suryansh.sharma@morningstar.com | |||||||||||
| Raymond James | William A. Crow | 727-567-2594 | bill.crow@raymondjames.com | |||||||||||
| RBC | Michael Carroll | 440-715-2649 | michael.carroll@rbccm.com | |||||||||||
| Truist | Ki Bin Kim | 212-303-4124 | kibin.kim@truist.com | |||||||||||
| Wolfe Research | Andrew Rosivach | 646-582-9250 | arosivach@wolferesearch.com | |||||||||||
| DBRS Morningstar | ||||||||
| Credit Rating: | BBB | (Stable Trend) | ||||||
| Fitch | ||||||||
| Issuer Default Rating: | BBB | (Stable Outlook) | ||||||
| Moody’s | ||||||||
| Issuer Rating: | Baa3 | (Stable Outlook) | ||||||
|
||||||||
| Financial Supplement | Fourth Quarter 2023 |
|||||||
|
||||||||
| Financial Supplement | Fourth Quarter 2023 |
|||||||
|
||||||||
| Financial Supplement | Fourth Quarter 2023 |
|||||||
|
||||||||
| Financial Supplement | Fourth Quarter 2023 |
|||||||
| Three Months Ended December 31, | Change | ||||||||||||||||||||||||||||
| Dollars and units in thousands, except per pallet data | 2023 Actual | 2023 Constant Currency(1) |
2022 Actual | Actual | Constant Currency | ||||||||||||||||||||||||
| TOTAL WAREHOUSE SEGMENT | |||||||||||||||||||||||||||||
| Number of total warehouses | 240 | 240 | n/a | n/a | |||||||||||||||||||||||||
| Rent and storage | $ | 276,641 | $ | 278,493 | $ | 267,031 | 3.6 | % | 4.3 | % | |||||||||||||||||||
| Warehouse services | 335,621 | 336,331 | 331,659 | 1.2 | % | 1.4 | % | ||||||||||||||||||||||
| Total revenue | $ | 612,262 | $ | 614,824 | $ | 598,690 | 2.3 | % | 2.7 | % | |||||||||||||||||||
| Global Warehouse contribution (NOI) | $ | 197,102 | $ | 197,967 | $ | 172,327 | 14.4 | % | 14.9 | % | |||||||||||||||||||
| Global Warehouse margin | 32.2 | % | 32.2 | % | 28.8 | % | 341 bps | 341 bps | |||||||||||||||||||||
| Global Warehouse rent and storage metrics: | |||||||||||||||||||||||||||||
| Average economic occupied pallets | 4,541 | n/a | 4,537 | 0.1 | % | n/a | |||||||||||||||||||||||
| Average physical occupied pallets | 4,041 | n/a | 4,229 | (4.4) | % | n/a | |||||||||||||||||||||||
| Average physical pallet positions | 5,493 | n/a | 5,415 | 1.4 | % | n/a | |||||||||||||||||||||||
| Economic occupancy percentage | 82.7 | % | n/a | 83.8 | % | -112 bps | n/a | ||||||||||||||||||||||
| Physical occupancy percentage | 73.6 | % | n/a | 78.1 | % | -453 bps | n/a | ||||||||||||||||||||||
| Total rent and storage revenue per average economic occupied pallet | $ | 60.92 | $ | 61.33 | $ | 58.86 | 3.5 | % | 4.2 | % | |||||||||||||||||||
| Total rent and storage revenue per average physical occupied pallet | $ | 68.46 | $ | 68.92 | $ | 63.14 | 8.4 | % | 9.1 | % | |||||||||||||||||||
| Global Warehouse services metrics: | |||||||||||||||||||||||||||||
| Throughput pallets | 9,384 | n/a | 9,963 | (5.8) | % | n/a | |||||||||||||||||||||||
| Total warehouse services revenue per throughput pallet | $ | 35.77 | $ | 35.84 | $ | 33.29 | 7.4 | % | 7.7 | % | |||||||||||||||||||
| SAME STORE WAREHOUSE | |||||||||||||||||||||||||||||
| Number of same store warehouses | 219 | 219 | n/a | n/a | |||||||||||||||||||||||||
| Global Warehouse same store revenue: | |||||||||||||||||||||||||||||
| Rent and storage | $ | 254,642 | $ | 256,614 | $ | 252,984 | 0.7 | % | 1.4 | % | |||||||||||||||||||
| Warehouse services | 319,511 | 320,399 | 317,648 | 0.6 | % | 0.9 | % | ||||||||||||||||||||||
| Total same store revenue | $ | 574,153 | $ | 577,013 | $ | 570,632 | 0.6 | % | 1.1 | % | |||||||||||||||||||
| Global Warehouse same store contribution (NOI) | $ | 185,124 | $ | 186,061 | $ | 172,503 | 7.3 | % | 7.9 | % | |||||||||||||||||||
| Global Warehouse same store margin | 32.2 | % | 32.2 | % | 30.2 | % | 201 bps | 202 bps | |||||||||||||||||||||
| Global Warehouse same store rent and storage metrics: | |||||||||||||||||||||||||||||
| Average economic occupied pallets | 4,216 | n/a | 4,299 | (1.9) | % | n/a | |||||||||||||||||||||||
| Average physical occupied pallets | 3,752 | n/a | 4,015 | (6.6) | % | n/a | |||||||||||||||||||||||
| Average physical pallet positions | 5,037 | n/a | 5,104 | (1.3) | % | n/a | |||||||||||||||||||||||
| Economic occupancy percentage | 83.7 | % | n/a | 84.2 | % | -53 bps | n/a | ||||||||||||||||||||||
| Physical occupancy percentage | 74.5 | % | n/a | 78.7 | % | -418 bps | n/a | ||||||||||||||||||||||
| Same store rent and storage revenue per average economic occupied pallet | $ | 60.40 | $ | 60.87 | $ | 58.85 | 2.6 | % | 3.4 | % | |||||||||||||||||||
| Same store rent and storage revenue per average physical occupied pallet | $ | 67.87 | $ | 68.39 | $ | 63.01 | 7.7 | % | 8.5 | % | |||||||||||||||||||
| Global Warehouse same store services metrics: | |||||||||||||||||||||||||||||
| Throughput pallets | 8,684 | n/a | 9,396 | (7.6) | % | n/a | |||||||||||||||||||||||
| Same store warehouse services revenue per throughput pallet | $ | 36.79 | $ | 36.90 | $ | 33.81 | 8.8 | % | 9.1 | % | |||||||||||||||||||
|
||||||||
| Financial Supplement | Fourth Quarter 2023 |
|||||||
| Three Months Ended December 31, | Change | ||||||||||||||||||||||||||||
| Dollars and units in thousands, except per pallet data | 2023 Actual | 2023 Constant Currency(1) |
2022 Actual | Actual | Constant Currency | ||||||||||||||||||||||||
| NON-SAME STORE WAREHOUSE | |||||||||||||||||||||||||||||
Number of non-same store warehouses(2) |
21 | 21 | n/a | n/a | |||||||||||||||||||||||||
| Global Warehouse non-same store revenue: | |||||||||||||||||||||||||||||
| Rent and storage | $ | 21,999 | $ | 21,879 | $ | 14,047 | n/r | n/r | |||||||||||||||||||||
| Warehouse services | 16,110 | 15,932 | 14,011 | n/r | n/r | ||||||||||||||||||||||||
| Total non-same store revenue | $ | 38,109 | $ | 37,811 | $ | 28,058 | n/r | n/r | |||||||||||||||||||||
| Global Warehouse non-same store contribution (NOI) | $ | 11,978 | $ | 11,906 | $ | (176) | n/r | n/r | |||||||||||||||||||||
| Global Warehouse non-same store margin | 31.4 | % | 31.5 | % | (0.6) | % | n/r | n/r | |||||||||||||||||||||
| Global Warehouse non-same store rent and storage metrics: | |||||||||||||||||||||||||||||
| Average economic occupied pallets | 325 | n/a | 238 | n/r | n/a | ||||||||||||||||||||||||
| Average physical occupied pallets | 289 | n/a | 214 | n/r | n/a | ||||||||||||||||||||||||
| Average physical pallet positions | 456 | n/a | 311 | n/r | n/a | ||||||||||||||||||||||||
| Economic occupancy percentage | 71.3 | % | n/a | 76.5 | % | n/r | n/a | ||||||||||||||||||||||
| Physical occupancy percentage | 63.4 | % | n/a | 68.8 | % | n/r | n/a | ||||||||||||||||||||||
| Non-same store rent and storage revenue per average economic occupied pallet | $ | 67.69 | $ | 67.32 | $ | 59.02 | n/r | n/r | |||||||||||||||||||||
| Non-same store rent and storage revenue per average physical occupied pallet | $ | 76.12 | $ | 75.71 | $ | 65.64 | n/r | n/r | |||||||||||||||||||||
| Global Warehouse non-same store services metrics: | |||||||||||||||||||||||||||||
| Throughput pallets | 700 | n/a | 567 | n/r | n/a | ||||||||||||||||||||||||
| Non-same store warehouse services revenue per throughput pallet | $ | 23.01 | $ | 22.76 | $ | 24.71 | n/r | n/r | |||||||||||||||||||||
|
||||||||
| Financial Supplement | Fourth Quarter 2023 |
|||||||
| Year Ended December 31, | Change | ||||||||||||||||||||||||||||
| Dollars in thousands | 2023 Actual | 2023 Constant Currency(1) | 2022 Actual | Actual | Constant currency | ||||||||||||||||||||||||
| TOTAL WAREHOUSE SEGMENT | |||||||||||||||||||||||||||||
| Number of total warehouses | 240 | 240 | n/a | n/a | |||||||||||||||||||||||||
| Global Warehouse revenue: | |||||||||||||||||||||||||||||
| Rent and storage | $ | 1,101,741 | $ | 1,113,052 | $ | 999,388 | 10.2 | % | 11.4 | % | |||||||||||||||||||
| Warehouse services | 1,289,348 | 1,299,295 | 1,303,583 | (1.1) | % | (0.3) | % | ||||||||||||||||||||||
| Total revenue | $ | 2,391,089 | $ | 2,412,347 | $ | 2,302,971 | 3.8 | % | 4.7 | % | |||||||||||||||||||
| Global Warehouse contribution (NOI) | $ | 722,603 | $ | 728,579 | $ | 636,232 | 13.6 | % | 14.5 | % | |||||||||||||||||||
| Global Warehouse margin | 30.2 | % | 30.2 | % | 27.6 | % | 259 bps | 258 bps | |||||||||||||||||||||
| Units in thousands except per pallet data | |||||||||||||||||||||||||||||
| Global Warehouse rent and storage metrics: | |||||||||||||||||||||||||||||
| Average economic occupied pallets | 4,546 | n/a | 4,318 | 5.3 | % | n/a | |||||||||||||||||||||||
| Average physical occupied pallets | 4,120 | n/a | 3,991 | 3.2 | % | n/a | |||||||||||||||||||||||
| Average physical pallet positions | 5,442 | n/a | 5,431 | 0.2 | % | n/a | |||||||||||||||||||||||
| Economic occupancy percentage | 83.5 | % | n/a | 79.5 | % | 403 bps | n/a | ||||||||||||||||||||||
| Physical occupancy percentage | 75.7 | % | n/a | 73.5 | % | 222 bps | n/a | ||||||||||||||||||||||
| Total rent and storage revenue per average economic occupied pallet | $ | 242.35 | $ | 244.84 | $ | 231.44 | 4.7 | % | 5.8 | % | |||||||||||||||||||
| Total rent and storage revenue per average physical occupied pallet | $ | 267.41 | $ | 270.16 | $ | 250.40 | 6.8 | % | 7.9 | % | |||||||||||||||||||
| Global Warehouse services metrics: | |||||||||||||||||||||||||||||
| Throughput pallets | 37,524 | n/a | 40,093 | (6.4) | % | n/a | |||||||||||||||||||||||
| Total warehouse services revenue per throughput pallet | $ | 34.36 | $ | 34.63 | $ | 32.51 | 5.7 | % | 6.5 | % | |||||||||||||||||||
| SAME STORE WAREHOUSE | |||||||||||||||||||||||||||||
| Number of same store warehouses | 219 | 219 | n/a | n/a | |||||||||||||||||||||||||
| Global Warehouse same store revenue: | |||||||||||||||||||||||||||||
| Rent and storage | $ | 1,024,515 | $ | 1,035,596 | $ | 944,102 | 8.5 | % | 9.7 | % | |||||||||||||||||||
| Warehouse services | 1,233,344 | 1,243,103 | 1,240,378 | (0.6) | % | 0.2 | % | ||||||||||||||||||||||
| Total same store revenue | $ | 2,257,859 | $ | 2,278,699 | $ | 2,184,480 | 3.4 | % | 4.3 | % | |||||||||||||||||||
| Global Warehouse same store contribution (NOI) | $ | 708,521 | $ | 714,581 | $ | 633,714 | 11.8 | % | 12.8 | % | |||||||||||||||||||
| Global Warehouse same store margin | 31.4 | % | 31.4 | % | 29.0 | % | 237 bps | 235 bps | |||||||||||||||||||||
| Units in thousands except per pallet data | |||||||||||||||||||||||||||||
| Global Warehouse same store rent and storage metrics: | |||||||||||||||||||||||||||||
| Average economic occupied pallets | 4,268 | n/a | 4,099 | 4.1 | % | n/a | |||||||||||||||||||||||
| Average physical occupied pallets | 3,877 | n/a | 3,788 | 2.3 | % | n/a | |||||||||||||||||||||||
| Average physical pallet positions | 5,065 | n/a | 5,128 | (1.2) | % | n/a | |||||||||||||||||||||||
| Economic occupancy percentage | 84.3 | % | n/a | 79.9 | % | 433 bps | n/a | ||||||||||||||||||||||
| Physical occupancy percentage | 76.5 | % | n/a | 73.9 | % | 268 bps | n/a | ||||||||||||||||||||||
| Same store rent and storage revenue per average economic occupied pallet | $ | 240.05 | $ | 242.64 | $ | 230.32 | 4.2 | % | 5.3 | % | |||||||||||||||||||
| Same store rent and storage revenue per average physical occupied pallet | $ | 264.25 | $ | 267.11 | $ | 249.23 | 6.0 | % | 7.2 | % | |||||||||||||||||||
| Global Warehouse same store services metrics: | |||||||||||||||||||||||||||||
| Throughput pallets | 35,227 | n/a | 37,841 | (6.9) | % | n/a | |||||||||||||||||||||||
| Same store warehouse services revenue per throughput pallet | $ | 35.01 | $ | 35.29 | $ | 32.78 | 6.8 | % | 7.7 | % | |||||||||||||||||||
|
||||||||
| Financial Supplement | Fourth Quarter 2023 |
|||||||
| Year Ended December 31, | Change | ||||||||||||||||||||||||||||
| Dollars in thousands | 2023 Actual | 2023 Constant Currency(1) | 2022 Actual | Actual | Constant currency | ||||||||||||||||||||||||
| NON-SAME STORE WAREHOUSE | |||||||||||||||||||||||||||||
Number of non-same store warehouses(2) |
21 | 21 | n/a | n/a | |||||||||||||||||||||||||
| Global Warehouse non-same store revenue: | |||||||||||||||||||||||||||||
| Rent and storage | $ | 77,226 | $ | 77,456 | $ | 55,286 | n/r | n/r | |||||||||||||||||||||
| Warehouse services | 56,004 | 56,192 | 63,205 | n/r | n/r | ||||||||||||||||||||||||
| Total non-same store revenue | $ | 133,230 | $ | 133,648 | $ | 118,491 | n/r | n/r | |||||||||||||||||||||
| Global Warehouse non-same store contribution (NOI) | $ | 14,082 | $ | 13,998 | $ | 2,518 | n/r | n/r | |||||||||||||||||||||
| Global Warehouse non-same store margin | 10.6 | % | 10.5 | % | 2.1 | % | n/r | n/r | |||||||||||||||||||||
| Units in thousands except per pallet data | |||||||||||||||||||||||||||||
| Global Warehouse non-same store rent and storage metrics: | |||||||||||||||||||||||||||||
| Average economic occupied pallets | 278 | n/a | 219 | n/r | n/a | ||||||||||||||||||||||||
| Average physical occupied pallets | 243 | n/a | 203 | n/r | n/a | ||||||||||||||||||||||||
| Average physical pallet positions | 377 | n/a | 303 | n/r | n/a | ||||||||||||||||||||||||
| Economic occupancy percentage | 73.7 | % | n/a | 72.3 | % | n/r | n/a | ||||||||||||||||||||||
| Physical occupancy percentage | 64.5 | % | n/a | 67.0 | % | n/r | n/a | ||||||||||||||||||||||
| Non-same store rent and storage revenue per average economic occupied pallet | $ | 277.79 | $ | 278.62 | $ | 252.45 | n/r | n/r | |||||||||||||||||||||
| Non-same store rent and storage revenue per average physical occupied pallet | $ | 317.80 | $ | 318.75 | $ | 272.34 | n/r | n/r | |||||||||||||||||||||
| Global Warehouse non-same store services metrics: | |||||||||||||||||||||||||||||
| Throughput pallets | 2,297 | n/a | 2,250 | n/r | n/a | ||||||||||||||||||||||||
| Non-same store warehouse services revenue per throughput pallet | $ | 24.38 | $ | 24.46 | $ | 28.09 | n/r | n/r | |||||||||||||||||||||
|
||||||||
| Financial Supplement | Fourth Quarter 2023 |
|||||||
|
||||||||
| Financial Supplement | Fourth Quarter 2023 |
|||||||
|
||||||||
| Financial Supplement | Fourth Quarter 2023 |
|||||||
|
||||||||
| Financial Supplement | Fourth Quarter 2023 |
|||||||
| In thousands, except per share amounts | As of | ||||||||||||||||
| Capitalization: | Q4 23 | Q3 23 | Q2 23 | Q1 23 | Q4 22 | ||||||||||||
Fully diluted common stock outstanding at quarter end(1) |
285,771 | 285,869 | 272,479 | 272,522 | 271,702 | ||||||||||||
| Common stock share price at quarter end | $30.27 | $30.41 | $32.30 | $28.45 | $28.31 | ||||||||||||
| Market value of common equity | $8,650,288 | $8,693,276 | $8,801,072 | $7,753,251 | $7,691,884 | ||||||||||||
Gross debt (2) |
$3,262,970 | $3,165,843 | $3,568,567 | $3,450,715 | $3,331,027 | ||||||||||||
| Less: cash and cash equivalents | 60,392 | 53,831 | 48,873 | 47,222 | 53,063 | ||||||||||||
| Net debt | $3,202,578 | $3,112,012 | $3,519,694 | $3,403,493 | $3,277,964 | ||||||||||||
| Total enterprise value | $11,852,866 | $11,805,288 | $12,320,766 | $11,156,744 | $10,969,848 | ||||||||||||
| Net debt / total enterprise value | 27.0 | % | 26.4 | % | 28.6 | % | 30.5 | % | 29.9 | % | |||||||
Net debt to pro forma Core EBITDA(2) |
5.58x | 5.68x | 6.59x | 6.54x | 6.61x | ||||||||||||
| Three Months Ended | |||||||||||||||||
| Selected Operational Data: | Q4 23 | Q3 23 | Q2 23 | Q1 23 | Q4 22 | ||||||||||||
| Warehouse segment revenue | $612,262 | $602,605 | $581,170 | $595,052 | $598,690 | ||||||||||||
| Total revenue | 679,291 | 667,939 | 649,610 | 676,489 | 721,504 | ||||||||||||
| Operating (loss) income | (194,321) | 33,000 | 20,667 | 32,349 | 33,044 | ||||||||||||
| Net (loss) income from continuing operations | (226,800) | (2,299) | (96,527) | (190) | 4,917 | ||||||||||||
| Net (loss) income | (226,800) | (2,096) | (104,802) | (2,571) | 2,955 | ||||||||||||
Total warehouse segment contribution (NOI) (3) |
197,102 | 177,832 | 172,842 | 174,827 | 172,327 | ||||||||||||
Total segment contribution (NOI) (3) |
209,835 | 189,120 | 184,051 | 187,566 | 188,226 | ||||||||||||
| Selected Other Data: | |||||||||||||||||
Core EBITDA (4) |
$160,270 | $144,047 | $134,687 | $133,076 | $136,822 | ||||||||||||
Core funds from operations (FFO) (1)(4) |
84,764 | 69,587 | 62,497 | 60,846 | 70,168 | ||||||||||||
Adjusted funds from operations (AFFO) (1)(4) |
108,017 | 88,162 | 75,557 | 79,889 | 78,219 | ||||||||||||
| Net (loss) income per share - basic | $(0.80) | $(0.01) | $(0.39) | $(0.01) | $0.01 | ||||||||||||
| Net (loss) income per share - diluted | $(0.80) | $(0.01) | $(0.39) | $(0.01) | $0.01 | ||||||||||||
Core FFO per diluted share (4) |
$0.30 | $0.25 | $0.23 | $0.22 | $0.26 | ||||||||||||
AFFO per diluted share (4) |
$0.38 | $0.32 | $0.28 | $0.29 | $0.29 | ||||||||||||
Dividend distributions declared per common share (5) |
$0.22 | $0.22 | $0.22 | $0.22 | $0.22 | ||||||||||||
Diluted AFFO payout ratio (6) |
57.9 | % | 68.8 | % | 78.6 | % | 75.9 | % | 75.9 | % | |||||||
| Portfolio Statistics: | |||||||||||||||||
| Total global warehouses | 245 | 243 | 242 | 243 | 242 | ||||||||||||
| Average economic occupancy | 82.7 | % | 83.0 | % | 84.4 | % | 84.0 | % | 83.8 | % | |||||||
| Average physical occupancy | 73.6 | % | 74.7 | % | 77.2 | % | 77.3 | % | 78.1 | % | |||||||
| Total global same-store warehouses | 219 | 219 | 220 | 221 | 208 | ||||||||||||
|
||||||||
| Financial Supplement | Fourth Quarter 2023 |
|||||||
(1) Assumes the exercise of all outstanding stock options using the treasury stock method, conversion of all outstanding restricted stock and OP units, and incorporates forward contracts using the treasury stock method |
|||||||||||||||||
| As of | |||||||||||||||||
| (2) Net Debt to Core EBITDA Computation | 12/31/2023 | 12/31/2022 | |||||||||||||||
| Total debt | $ | 3,252,392 | $ | 3,317,983 | |||||||||||||
| Deferred financing costs | 10,578 | 13,044 | |||||||||||||||
| Gross debt | $3,262,970 | $3,331,027 | |||||||||||||||
| Adjustments: | |||||||||||||||||
| Less: cash, cash equivalents and restricted cash | 60,392 | 53,063 | |||||||||||||||
| Net debt | $ | 3,202,578 | $ | 3,277,964 | |||||||||||||
| Core EBITDA - last twelve months | $572,080 | $499,766 | |||||||||||||||
| Net Core EBITDA from acquisitions, dispositions and lease exits (a) | 2,069 | (3,588) | |||||||||||||||
| Pro forma Core EBITDA - last twelve months | $574,149 | $496,178 | |||||||||||||||
| Net debt to pro forma Core EBITDA | 5.58x | 6.61x | |||||||||||||||
(a) As of December 31, 2023, amount includes nine months of Core EBITDA from the Safeway acquisition prior to Americold’s ownership as well as the facility lease expense for sites that it previously incurred operating lease expense for but was subsequently purchased. |
|||||||||||||||||
| (3) Reconciliation of segment contribution (NOI) | |||||||||||||||||
| Three Months Ended | |||||||||||||||||
| Q4 23 | Q3 23 | Q2 23 | Q1 23 | Q4 22 | |||||||||||||
| Warehouse segment contribution (NOI) | $197,102 | $177,832 | $172,842 | $174,827 | $172,327 | ||||||||||||
| Transportation segment contribution (NOI) | 10,912 | 9,659 | 9,809 | 11,660 | 14,452 | ||||||||||||
| Third-party managed segment contribution (NOI) | 1,821 | 1,629 | 1,400 | 1,079 | 1,447 | ||||||||||||
| Total segment contribution (NOI) | $209,835 | $189,120 | $184,051 | $187,566 | $188,226 | ||||||||||||
| Depreciation and amortization | (94,099) | (89,728) | (84,892) | (85,024) | (82,467) | ||||||||||||
| Selling, general and administrative | (57,763) | (52,383) | (53,785) | (62,855) | (60,073) | ||||||||||||
| Acquisition, cyber incident and other, net | (15,774) | (13,931) | (27,235) | (7,147) | (11,899) | ||||||||||||
| (Loss) gain from sale of real estate | (5) | (78) | 2,528 | (191) | 21 | ||||||||||||
| Impairment of indefinite and long-lived assets | (236,515) | — | — | — | (764) | ||||||||||||
| U.S. GAAP operating (loss) income | ($194,321) | $33,000 | $20,667 | $32,349 | $33,044 | ||||||||||||
| (4) See “Reconciliation of Net (Loss) Income to NAREIT FFO, Core FFO, and AFFO” and “Reconciliation of Net (Loss) Income to EBITDA, EBITDAre, and Core EBITDA” pages 19-21 | |||||||||||||||||
| (5) Distributions per common share | Three Months Ended | ||||||||||||||||
| Q4 23 | Q3 23 | Q2 23 | Q1 23 | Q4 22 | |||||||||||||
| Distributions declared on common stock during the quarter | $62,645 | $62,868 | $59,921 | $59,932 | $59,751 | ||||||||||||
| Common stock outstanding at quarter end | 283,699 | 283,517 | 270,186 | 270,096 | 269,815 | ||||||||||||
| Distributions declared per common share | $0.22 | $0.22 | $0.22 | $0.22 | $0.22 | ||||||||||||
| (6) Calculated as distributions declared on common stock divided by AFFO per weighted average diluted share | |||||||||||||||||
|
||||||||
| Financial Supplement | Fourth Quarter 2023 |
|||||||
| Americold Realty Trust, Inc. and Subsidiaries | |||||||||||
| Condensed Consolidated Balance Sheets (Unaudited) | |||||||||||
| (In thousands, except shares and per share amounts) | |||||||||||
| December 31, 2023 | December 31, 2022 | ||||||||||
| Assets | |||||||||||
| Property, buildings, and equipment: | |||||||||||
| Land | $ | 820,831 | $ | 786,975 | |||||||
| Buildings and improvements | 4,464,359 | 4,245,607 | |||||||||
| Machinery and equipment | 1,565,431 | 1,407,874 | |||||||||
| Assets under construction | 452,312 | 526,811 | |||||||||
| 7,302,933 | 6,967,267 | ||||||||||
| Accumulated depreciation | (2,196,196) | (1,901,450) | |||||||||
| Property, buildings, and equipment – net | 5,106,737 | 5,065,817 | |||||||||
| Operating lease right-of-use assets | 343,532 | 352,553 | |||||||||
| Accumulated amortization-operating leases | (96,230) | (76,334) | |||||||||
| Operating leases-net | 247,302 | 276,219 | |||||||||
| Financing Leases: | |||||||||||
| Buildings and improvements | 13,542 | 13,546 | |||||||||
| Machinery and equipment | 161,446 | 127,009 | |||||||||
| 174,988 | 140,555 | ||||||||||
| Accumulated depreciation | (69,824) | (57,626) | |||||||||
| Financing leases – net | 105,164 | 82,929 | |||||||||
| Cash, cash equivalents, and restricted cash | 60,392 | 53,063 | |||||||||
| Accounts receivable, net of allowance of $21,647 and $15,951 at December 31, 2023 and 2022, respectively | 426,048 | 430,042 | |||||||||
| Identifiable intangible assets – net | 897,414 | 925,223 | |||||||||
| Goodwill | 794,004 | 1,033,637 | |||||||||
| Investments in and advances to partially owned entities and other | 38,113 | 78,926 | |||||||||
| Other assets | 194,078 | 158,705 | |||||||||
| Total assets | $ | 7,869,252 | $ | 8,104,561 | |||||||
| Liabilities and equity | |||||||||||
| Liabilities: | |||||||||||
| Borrowings under revolving line of credit | $ | 392,156 | $ | 500,052 | |||||||
| Accounts payable and accrued expenses | 568,764 | 557,540 | |||||||||
| Senior unsecured notes and term loans - net of deferred financing cost of $10,578 and $13,044 at December 31, 2023 and 2022, respectively | 2,601,122 | 2,569,281 | |||||||||
| Sale-leaseback financing obligations | 161,937 | 171,089 | |||||||||
| Financing lease obligations | 97,177 | 77,561 | |||||||||
| Operating lease obligations | 240,251 | 264,634 | |||||||||
| Unearned revenue | 28,379 | 32,046 | |||||||||
| Pension and postretirement benefits | 1,624 | 1,531 | |||||||||
| Deferred tax liability - net | 135,797 | 135,098 | |||||||||
| Multiemployer pension plan withdrawal liability | 7,458 | 7,851 | |||||||||
| Total liabilities | 4,234,665 | 4,316,683 | |||||||||
| Equity | |||||||||||
| Stockholders' equity | |||||||||||
| Common stock, $0.01 par value per share – 500,000,000 authorized shares; 283,699,120 and 269,814,956 issued and outstanding at December 31, 2023 and 2022, respectively | 2,837 | 2,698 | |||||||||
| Paid-in capital | 5,625,907 | 5,191,969 | |||||||||
| Accumulated deficit and distributions in excess of net earnings | (1,995,975) | (1,415,198) | |||||||||
| Accumulated other comprehensive loss | (16,640) | (6,050) | |||||||||
| Total stockholders’ equity | 3,616,129 | 3,773,419 | |||||||||
| Noncontrolling interests: | |||||||||||
| Noncontrolling interests in operating partnership | 18,458 | 14,459 | |||||||||
| Total equity | 3,634,587 | 3,787,878 | |||||||||
| Total liabilities and equity | $ | 7,869,252 | $ | 8,104,561 | |||||||
|
||||||||
| Financial Supplement | Fourth Quarter 2023 |
|||||||
| Americold Realty Trust, Inc. and Subsidiaries | |||||||||||||||||||||||
| Condensed Consolidated Statements of Operations (Unaudited) | |||||||||||||||||||||||
| (In thousands, except per share amounts) | |||||||||||||||||||||||
| Three Months Ended December 31, | Year Ended December 31, | ||||||||||||||||||||||
| 2023 | 2022 | 2023 | 2022 | ||||||||||||||||||||
| Revenues: | |||||||||||||||||||||||
| Rent, storage, and warehouse services | $ | 612,262 | $ | 598,690 | $ | 2,391,089 | $ | 2,302,971 | |||||||||||||||
| Transportation services | 57,878 | 76,190 | 239,670 | 313,358 | |||||||||||||||||||
| Third-party managed services | 9,151 | 46,624 | 42,570 | 298,406 | |||||||||||||||||||
| Total revenues | 679,291 | 721,504 | 2,673,329 | 2,914,735 | |||||||||||||||||||
| Operating expenses: | |||||||||||||||||||||||
| Rent, storage, and warehouse services cost of operations | 415,160 | 426,363 | 1,668,486 | 1,666,739 | |||||||||||||||||||
| Transportation services cost of operations | 46,966 | 61,738 | 197,630 | 265,956 | |||||||||||||||||||
| Third-party managed services cost of operations | 7,330 | 45,177 | 36,641 | 286,077 | |||||||||||||||||||
| Depreciation and amortization | 94,099 | 82,467 | 353,743 | 331,446 | |||||||||||||||||||
| Selling, general, and administrative | 57,763 | 60,073 | 226,786 | 231,067 | |||||||||||||||||||
| Acquisition, cyber incident, and other, net | 15,774 | 11,899 | 64,087 | 32,511 | |||||||||||||||||||
| Impairment of indefinite and long-lived assets | 236,515 | 764 | 236,515 | 7,380 | |||||||||||||||||||
| Loss (gain) on sale of real estate | 5 | (21) | (2,254) | 5,689 | |||||||||||||||||||
| Total operating expenses | 873,612 | 688,460 | 2,781,634 | 2,826,865 | |||||||||||||||||||
| Operating (loss) income | (194,321) | 33,044 | (108,305) | 87,870 | |||||||||||||||||||
| Other income (expense) | |||||||||||||||||||||||
| Interest expense | (33,681) | (33,407) | (140,107) | (116,127) | |||||||||||||||||||
| Loss on debt extinguishment, modifications and termination of derivative instruments | (627) | (933) | (2,482) | (3,217) | |||||||||||||||||||
| Gain (loss) from partially owned entities | 174 | (139) | (1,442) | (918) | |||||||||||||||||||
| Impairment of related party loan receivable | — | — | (21,972) | — | |||||||||||||||||||
| Loss on put option | — | — | (56,576) | — | |||||||||||||||||||
| Other, net | 1,054 | 3,661 | 2,795 | 2,464 | |||||||||||||||||||
| (Loss) income from continuing operations before income taxes | (227,401) | 2,226 | (328,089) | (29,928) | |||||||||||||||||||
| Income tax benefit (expense) | |||||||||||||||||||||||
| Current | (2,627) | (721) | (8,508) | (3,725) | |||||||||||||||||||
| Deferred | 3,228 | 3,412 | 10,781 | 22,561 | |||||||||||||||||||
| Income tax benefit | 601 | 2,691 | 2,273 | 18,836 | |||||||||||||||||||
| Net (loss) income | |||||||||||||||||||||||
| Net (loss) income from continuing operations | (226,800) | 4,917 | (325,816) | (11,092) | |||||||||||||||||||
| Net loss from discontinued operations | — | (1,962) | (10,453) | (8,382) | |||||||||||||||||||
| Net (loss) income | $ | (226,800) | $ | 2,955 | $ | (336,269) | $ | (19,474) | |||||||||||||||
| Net loss attributable to noncontrolling interests | 41 | 11 | (54) | (34) | |||||||||||||||||||
| Net (loss) income attributable to Americold Realty Trust, Inc. | $ | (226,841) | $ | 2,944 | $ | (336,215) | $ | (19,440) | |||||||||||||||
| Weighted average common stock outstanding – basic | 284,263 | 269,826 | 275,773 | 269,565 | |||||||||||||||||||
| Weighted average common stock outstanding – diluted | 284,263 | 270,770 | 275,773 | 269,565 | |||||||||||||||||||
| Net (loss) income per common share - basic | $ | (0.80) | $ | 0.02 | $ | (1.18) | $ | (0.04) | |||||||||||||||
| Net loss per common share from discontinued operations - basic | $ | — | $ | (0.01) | $ | (0.04) | $ | (0.03) | |||||||||||||||
| Basic (loss) income per share | $ | (0.80) | $ | 0.01 | $ | (1.22) | $ | (0.07) | |||||||||||||||
| Net (loss) income per common share - diluted | $ | (0.80) | $ | 0.02 | $ | (1.18) | $ | (0.04) | |||||||||||||||
| Net loss per common share from discontinued operations - diluted | $ | — | $ | (0.01) | $ | (0.04) | $ | (0.03) | |||||||||||||||
| Diluted (loss) income per share | $ | (0.80) | $ | 0.01 | $ | (1.22) | $ | (0.07) | |||||||||||||||
|
||||||||
| Financial Supplement | Fourth Quarter 2023 |
|||||||
| Reconciliation of Net (Loss) Income to NAREIT FFO, Core FFO, and AFFO | ||||||||||||||||||||||||||
| (In thousands, except per share amounts) | ||||||||||||||||||||||||||
| Three Months Ended | YTD | |||||||||||||||||||||||||
| Q4 23 | Q3 23 | Q2 23 | Q1 23 | Q4 22 | 2023 | 2022 | ||||||||||||||||||||
| Net (loss) income | $ | (226,800) | $ | (2,096) | $ | (104,802) | $ | (2,571) | $ | 2,955 | $ | (336,269) | $ | (19,474) | ||||||||||||
| Adjustments: | ||||||||||||||||||||||||||
| Real estate related depreciation | 57,183 | 56,373 | 54,740 | 54,541 | 53,094 | 222,837 | 210,171 | |||||||||||||||||||
| Loss (gain) on sale of real estate | 5 | 78 | (2,528) | 191 | (21) | (2,254) | 5,689 | |||||||||||||||||||
| Net loss (gain) on asset disposals | 260 | (25) | — | — | 175 | 235 | 1,135 | |||||||||||||||||||
| Impairment charges on real estate assets | — | — | — | — | — | — | 3,407 | |||||||||||||||||||
| Our share of reconciling items related to partially owned entities | 280 | 290 | 232 | 903 | 1,209 | 1,705 | 4,410 | |||||||||||||||||||
| NAREIT Funds from operations | $ | (169,072) | $ | 54,620 | $ | (52,358) | $ | 53,064 | $ | 57,412 | $ | (113,746) | $ | 205,338 | ||||||||||||
| Adjustments: | ||||||||||||||||||||||||||
| Net loss (gain) on sale of non-real estate assets | 3,312 | (296) | 289 | 420 | 2,274 | 3,725 | 2,421 | |||||||||||||||||||
| Acquisition, cyber incident and other, net | 15,774 | 13,931 | 27,235 | 7,147 | 11,899 | 64,087 | 32,511 | |||||||||||||||||||
| Goodwill impairment | 236,515 | — | — | — | — | 236,515 | 3,209 | |||||||||||||||||||
| Loss on debt extinguishment, modifications and termination of derivative instruments | 627 | 683 | 627 | 545 | 933 | 2,482 | 3,217 | |||||||||||||||||||
| Foreign currency exchange (gain) loss | (28) | 705 | 212 | (458) | (2,477) | 431 | 975 | |||||||||||||||||||
| Gain on legal settlement related to prior period operations | (2,180) | — | — | — | — | (2,180) | — | |||||||||||||||||||
| Gain on extinguishment of New Market Tax Credit Structure | — | — | — | — | — | — | (3,410) | |||||||||||||||||||
| Loss on deconsolidation of subsidiary contributed to LATAM joint venture | — | — | — | — | — | — | 4,148 | |||||||||||||||||||
| Our share of reconciling items related to partially owned entities | (184) | 147 | (27) | 128 | 127 | 64 | 574 | |||||||||||||||||||
| (Gain) loss from discontinued operations, net of tax | — | (203) | 8,275 | — | — | 8,072 | — | |||||||||||||||||||
| Impairment of related party receivable | — | — | 21,972 | — | — | 21,972 | — | |||||||||||||||||||
| Loss on put option | — | — | 56,576 | — | — | 56,576 | — | |||||||||||||||||||
| Gain on sale of LATAM JV | — | — | (304) | — | — | (304) | — | |||||||||||||||||||
Core FFO(b) |
$ | 84,764 | $ | 69,587 | $ | 62,497 | $ | 60,846 | $ | 70,168 | $ | 277,694 | $ | 248,983 | ||||||||||||
| Adjustments: | ||||||||||||||||||||||||||
| Amortization of deferred financing costs and pension withdrawal liability | 1,290 | 1,286 | 1,279 | 1,240 | 1,305 | 5,095 | 4,833 | |||||||||||||||||||
| Amortization of below/above market leases | 360 | 369 | 375 | 402 | 534 | 1,506 | 2,131 | |||||||||||||||||||
| Non-real estate asset impairment | — | — | — | — | 764 | — | 764 | |||||||||||||||||||
| Straight-line net rent | 597 | 544 | 361 | (491) | 333 | 1,011 | 747 | |||||||||||||||||||
| Deferred income tax benefit | (3,228) | (2,473) | (1,459) | (3,621) | (3,412) | (10,781) | (22,561) | |||||||||||||||||||
| Stock-based compensation expense | 5,780 | 6,203 | 4,639 | 6,970 | 5,036 | 23,592 | 27,137 | |||||||||||||||||||
| Non-real estate depreciation and amortization | 36,916 | 33,355 | 30,152 | 30,483 | 29,373 | 130,906 | 121,275 | |||||||||||||||||||
| Maintenance capital expenditures | (18,670) | (20,907) | (22,590) | (16,244) | (26,701) | (78,411) | (85,511) | |||||||||||||||||||
| Our share of reconciling items related to partially owned entities | 208 | 198 | 303 | 304 | 819 | 1,013 | 2,482 | |||||||||||||||||||
Adjusted FFO(b) |
$ | 108,017 | $ | 88,162 | $ | 75,557 | $ | 79,889 | $ | 78,219 | 351,625 | $ | 300,280 | |||||||||||||
|
||||||||
| Financial Supplement | Fourth Quarter 2023 |
|||||||
| Reconciliation of Net (Loss) Income to NAREIT FFO, Core FFO, and AFFO (continued) | ||||||||||||||||||||||||||
| (In thousands except per share amounts) | ||||||||||||||||||||||||||
| Three Months Ended | YTD | |||||||||||||||||||||||||
| Q4 23 | Q3 23 | Q2 23 | Q1 23 | Q4 22 | 2023 | 2022 | ||||||||||||||||||||
NAREIT Funds from operations(b) |
$ | (169,072) | $ | 54,620 | $ | (52,358) | $ | 53,064 | $ | 57,412 | $ | (113,746) | $ | 205,338 | ||||||||||||
Core FFO(b) |
$ | 84,764 | $ | 69,587 | $ | 62,497 | $ | 60,846 | $ | 70,168 | $ | 277,694 | $ | 248,984 | ||||||||||||
Adjusted FFO(b) |
$ | 108,017 | $ | 88,162 | $ | 75,557 | $ | 79,889 | $ | 78,219 | $ | 351,625 | $ | 300,281 | ||||||||||||
| Reconciliation of weighted average shares: | ||||||||||||||||||||||||||
| Weighted average basic shares for net income calculation | 284,263 | 278,137 | 270,462 | 270,230 | 269,826 | 275,773 | 269,565 | |||||||||||||||||||
| Dilutive stock options and unvested restricted stock units | 502 | 519 | 695 | 778 | 944 | 624 | 1,041 | |||||||||||||||||||
| Weighted average dilutive shares | 284,765 | 278,656 | 271,157 | 271,008 | 270,770 | 276,397 | 270,606 | |||||||||||||||||||
NAREIT FFO - basic per share(b) |
$ | (0.59) | $ | 0.20 | $ | (0.19) | $ | 0.20 | $ | 0.21 | $ | (0.41) | $ | 0.76 | ||||||||||||
NAREIT FFO - diluted per share(b) |
$ | (0.59) | $ | 0.20 | $ | (0.19) | $ | 0.20 | $ | 0.21 | $ | (0.41) | $ | 0.76 | ||||||||||||
Core FFO - basic per share (b) |
$ | 0.30 | $ | 0.25 | $ | 0.23 | $ | 0.23 | $ | 0.26 | $ | 1.01 | $ | 0.92 | ||||||||||||
Core FFO - diluted per share(b) |
$ | 0.30 | $ | 0.25 | $ | 0.23 | $ | 0.22 | $ | 0.26 | $ | 1.00 | $ | 0.92 | ||||||||||||
Adjusted FFO - basic per share (b) |
$ | 0.38 | $ | 0.32 | $ | 0.28 | $ | 0.30 | $ | 0.29 | $ | 1.28 | $ | 1.11 | ||||||||||||
Adjusted FFO - diluted per share(b) |
$ | 0.38 | $ | 0.32 | $ | 0.28 | $ | 0.29 | $ | 0.29 | $ | 1.27 | $ | 1.11 | ||||||||||||
| Three Months Ended-Recasted | YTD Recasted | ||||||||||||||||
(In thousands except per share amounts) |
Q1 23 | Q4 22 | 2023 | 2022 | |||||||||||||
| NAREIT FFO | $ | 52,432 | $ | 56,457 | $ | (114,378) | $ | 202,088 | |||||||||
| Core FFO | $ | 62,547 | $ | 71,157 | $ | 279,395 | $ | 254,078 | |||||||||
| Adjusted FFO applicable to common shareholders | $ | 81,506 | $ | 78,717 | $ | 353,242 | $ | 303,007 | |||||||||
| NAREIT FFO - basic per share | $ | 0.19 | $ | 0.21 | $ | (0.41) | $ | 0.75 | |||||||||
| NAREIT FFO - diluted per share | $ | 0.19 | $ | 0.21 | $ | (0.41) | $ | 0.75 | |||||||||
| Core FFO - basic per share | $ | 0.23 | $ | 0.26 | $ | 1.01 | $ | 0.94 | |||||||||
| Core FFO - diluted per share | $ | 0.23 | $ | 0.26 | $ | 1.01 | $ | 0.94 | |||||||||
| Adjusted FFO - basic per share | $ | 0.30 | $ | 0.29 | $ | 1.28 | $ | 1.12 | |||||||||
| Adjusted FFO - diluted per share | $ | 0.30 | $ | 0.29 | $ | 1.28 | $ | 1.12 | |||||||||
|
||||||||
| Financial Supplement | Fourth Quarter 2023 |
|||||||
| Reconciliation of Net (Loss) Income to EBITDA, NAREIT EBITDAre, and Core EBITDA | ||||||||||||||||||||||||||
| (In thousands) | ||||||||||||||||||||||||||
| Three Months Ended | Year End | |||||||||||||||||||||||||
| Q4 23 | Q3 23 | Q2 23 | Q1 23 | Q4 22 | 2023 | 2022 | ||||||||||||||||||||
| Net (loss) income | $ | (226,800) | $ | (2,096) | $ | (104,802) | $ | (2,571) | $ | 2,955 | $ | (336,269) | $ | (19,474) | ||||||||||||
| Adjustments: | ||||||||||||||||||||||||||
| Depreciation and amortization | 94,099 | 89,728 | 84,892 | 85,024 | 82,467 | 353,743 | 331,446 | |||||||||||||||||||
| Interest expense | 33,681 | 35,572 | 36,431 | 34,423 | 33,407 | 140,107 | 116,127 | |||||||||||||||||||
| Income tax (benefit) expense | (601) | (492) | 464 | (1,644) | (2,691) | (2,273) | (18,836) | |||||||||||||||||||
| EBITDA | $ | (99,621) | $ | 122,712 | $ | 16,985 | $ | 115,232 | $ | 116,138 | $ | 155,308 | $ | 409,263 | ||||||||||||
| Adjustments: | ||||||||||||||||||||||||||
| Loss (gain) on sale of real estate | 5 | 78 | (2,528) | 191 | (21) | (2,254) | 5,689 | |||||||||||||||||||
| Adjustment to reflect share of EBITDAre of partially owned entities | 1,533 | 1,495 | 3,085 | 2,883 | 5,019 | 8,996 | 17,815 | |||||||||||||||||||
NAREIT EBITDAre(a) |
$ | (98,083) | $ | 124,285 | $ | 17,542 | $ | 118,306 | $ | 121,136 | $ | 162,050 | $ | 432,767 | ||||||||||||
| Adjustments: | ||||||||||||||||||||||||||
| Acquisition, cyber incident and other, net | 15,774 | 13,931 | 27,235 | 7,147 | 11,899 | 64,087 | 32,511 | |||||||||||||||||||
| (Gain) loss from investments in partially owned entities | (174) | 259 | 709 | 3,029 | 2,101 | 3,823 | 9,300 | |||||||||||||||||||
| Impairment of indefinite and long-lived assets | 236,515 | — | — | — | 764 | 236,515 | 7,380 | |||||||||||||||||||
| Foreign currency exchange (gain) loss | (28) | 705 | 212 | (458) | (2,477) | 431 | 975 | |||||||||||||||||||
| Stock-based compensation expense | 5,780 | 6,203 | 4,639 | 6,970 | 5,036 | 23,592 | 27,137 | |||||||||||||||||||
| Loss on debt extinguishment, modifications and termination of derivative instruments | 627 | 683 | 627 | 545 | 933 | 2,482 | 3,217 | |||||||||||||||||||
| Gain (loss) on real estate and other asset disposals | 3,572 | (321) | 289 | 420 | 2,449 | 3,960 | 3,556 | |||||||||||||||||||
| Gain on legal settlement related to prior period operations | (2,180) | — | — | — | — | (2,180) | — | |||||||||||||||||||
| Gain on extinguishment of New Market Tax Credit Structure | — | — | — | — | — | — | (3,410) | |||||||||||||||||||
| Loss on deconsolidation of subsidiary contributed to LATAM joint venture | — | — | — | — | — | — | 4,148 | |||||||||||||||||||
| Reduction in EBITDAre from partially owned entities | (1,533) | (1,495) | (3,085) | (2,883) | (5,019) | (8,996) | (17,815) | |||||||||||||||||||
| Gain from sale of partially owned entities | — | — | (304) | — | — | (304) | — | |||||||||||||||||||
| (Gain) loss from discontinued operations, net of tax | — | (203) | 8,275 | — | — | 8,072 | — | |||||||||||||||||||
| Impairment of related party receivable | — | — | 21,972 | — | — | 21,972 | — | |||||||||||||||||||
| Loss on put option | — | — | 56,576 | — | — | 56,576 | — | |||||||||||||||||||
| Core EBITDA | $ | 160,270 | $ | 144,047 | $ | 134,687 | $ | 133,076 | $ | 136,822 | 572,080 | 499,766 | ||||||||||||||
| Three Months Ended-Recasted | Year End Recasted | ||||||||||||||||
| (In thousands) | Q1 23 | Q4 22 | 2023 | 2022 | |||||||||||||
| NAREIT EBITDAre | $116,872 | $117,602 | $160,616 | $419,791 | |||||||||||||
|
||||||||
| Financial Supplement | Fourth Quarter 2023 |
|||||||
| Three Months Ended December 31, | Year Ended December 31, | ||||||||||||||||||||||
| Acquisition, cyber incident and other, net | 2023 | 2022 | 2023 | 2022 | |||||||||||||||||||
| Project Orion expenses | 6,226 | 3,945 | 13,929 | 3,945 | |||||||||||||||||||
| Cyber incident related costs, net of insurance recoveries | 4,474 | (1,425) | 28,877 | (2,210) | |||||||||||||||||||
| Pension plan termination charges | 2,461 | — | 2,461 | — | |||||||||||||||||||
| Severance costs | 2,197 | 1,470 | 11,668 | 6,530 | |||||||||||||||||||
| Acquisition and integration related costs | 257 | 4,194 | 5,094 | 20,073 | |||||||||||||||||||
| Litigation | 159 | — | 558 | 179 | |||||||||||||||||||
| Other, net | — | — | 1,500 | (160) | |||||||||||||||||||
| Terminated site operations costs | — | 3,715 | — | 4,154 | |||||||||||||||||||
| Total Acquisition, cyber incident and other, net | $ | 15,774 | $ | 11,899 | $ | 64,087 | $ | 32,511 | |||||||||||||||
|
||||||||
| Financial Supplement | Fourth Quarter 2023 |
|||||||
Debt Detail and Maturities | |||||||||||||||||||||||
(In thousands) | |||||||||||||||||||||||
As of December 31, 2023 |
|||||||||||||||||||||||
Indebtedness: |
Carrying Value | Contractual Interest Rate(1) |
Effective Interest Rate(2) |
Stated
Maturity Date(3)
|
|||||||||||||||||||
Unsecured Debt(4) |
|||||||||||||||||||||||
Senior Unsecured Revolving Credit Facility - C$35M(5) |
26,429 | CDOR + 0.84% | 6.88% | 08/2027 | |||||||||||||||||||
Senior Unsecured Revolving Credit Facility - £78M(5) |
99,302 | SONIA + 0.84% | 6.67% | 08/2027 | |||||||||||||||||||
Senior Unsecured Revolving Credit Facility - USD(5) |
34,000 | SOFR + 0.84% | 6.86% | 08/2027 | |||||||||||||||||||
Senior Unsecured Revolving Credit Facility - A$191M(5) |
130,108 | BBSW + 0.84% | 5.81% | 08/2027 | |||||||||||||||||||
Senior Unsecured Revolving Credit Facility - €68M(5) |
74,513 | EURIBOR + 0.84% | 5.29% | 08/2027 | |||||||||||||||||||
Senior Unsecured Revolving Credit Facility - NZD44M(5) |
27,804 | BKBM + 0.84% | 7.08% | 08/2027 | |||||||||||||||||||
Senior Unsecured Term Loan A Facility Tranche A-1 - USD |
375,000 | SOFR + 0.94% | 4.90% | 08/2027 | |||||||||||||||||||
Senior Unsecured Term Loan A Facility Tranche A-2 - C$250M |
188,775 | CDOR + 0.94% | 4.77% | 01/2028 | |||||||||||||||||||
| Senior Unsecured Term Loan A Facility Tranche A-3 - USD | 270,000 | SOFR + 0.94% | 4.26% | 01/2028 | |||||||||||||||||||
Series A notes - USD |
200,000 | 4.68% | 4.76% | 01/2026 | |||||||||||||||||||
| Series B notes - USD | 400,000 | 4.86% | 4.92% | 01/2029 | |||||||||||||||||||
Series C notes - USD |
350,000 | 4.10% | 4.15% | 01/2030 | |||||||||||||||||||
Series D notes - €400M |
441,560 | 1.62% | 1.67% | 01/2031 | |||||||||||||||||||
Series E notes - €350M |
386,365 | 1.65% | 1.70% | 01/2033 | |||||||||||||||||||
Total Unsecured Real Estate Debt |
$ | 3,003,856 | 3.84% | 4.02% | 5.3 years |
||||||||||||||||||
Sale-leaseback financing obligations |
161,937 | 10.99% | |||||||||||||||||||||
Financing lease obligations |
97,177 | 3.90% | |||||||||||||||||||||
Total Debt Outstanding |
$ | 3,262,970 | 4.20% | ||||||||||||||||||||
Less: unamortized deferred financing costs |
(10,578) | ||||||||||||||||||||||
Total Book Value of Debt |
$ | 3,252,392 | |||||||||||||||||||||
Rate Type |
% of Total | ||||||||||||||||||||||
Fixed |
$ | 2,870,814 | 88% | ||||||||||||||||||||
Variable-unhedged |
392,156 | 12% | |||||||||||||||||||||
Total Debt Outstanding |
$ | 3,262,970 | 100% | ||||||||||||||||||||
Debt Type |
% of Total | ||||||||||||||||||||||
Unsecured |
$ | 3,003,856 | 92% | ||||||||||||||||||||
Secured |
259,114 | 8% | |||||||||||||||||||||
Total Debt Outstanding |
$ | 3,262,970 | 100% | ||||||||||||||||||||
|
||||||||
| Financial Supplement | Fourth Quarter 2023 |
|||||||
| Three Months Ended December 31, | Year Ended December 31, | ||||||||||||||||||||||
| 2023 | 2022 | 2023 | 2022 | ||||||||||||||||||||
| Segment revenues: | |||||||||||||||||||||||
| Warehouse | 612,262 | 598,690 | $ | 2,391,089 | $ | 2,302,971 | |||||||||||||||||
| Transportation | 57,878 | 76,190 | 239,670 | 313,358 | |||||||||||||||||||
| Third-party managed | 9,151 | 46,624 | 42,570 | 298,406 | |||||||||||||||||||
| Total revenues | 679,291 | 721,504 | 2,673,329 | 2,914,735 | |||||||||||||||||||
| Segment contribution: | |||||||||||||||||||||||
| Warehouse | 197,102 | 172,327 | $ | 722,603 | $ | 636,232 | |||||||||||||||||
| Transportation | 10,912 | 14,452 | 42,040 | 47,402 | |||||||||||||||||||
| Third-party managed | 1,821 | 1,447 | 5,929 | 12,329 | |||||||||||||||||||
| Total segment contribution | 209,835 | 188,226 | 770,572 | 695,963 | |||||||||||||||||||
| Reconciling items: | |||||||||||||||||||||||
| Depreciation and amortization | (94,099) | (82,467) | (353,743) | (331,446) | |||||||||||||||||||
| Selling, general, and administrative | (57,763) | (60,073) | (226,786) | (231,067) | |||||||||||||||||||
| Acquisition, cyber incident, and other, net | (15,774) | (11,899) | (64,087) | (32,511) | |||||||||||||||||||
| Impairment of indefinite and long-lived assets | (236,515) | (764) | (236,515) | (7,380) | |||||||||||||||||||
| (Loss) gain on sale of real estate | (5) | 21 | 2,254 | (5,689) | |||||||||||||||||||
| Interest expense | (33,681) | (33,407) | (140,107) | (116,127) | |||||||||||||||||||
| Other, net | 1,054 | 3,661 | 2,795 | 2,464 | |||||||||||||||||||
| Loss on debt extinguishment, modifications and termination of derivative instruments | (627) | (933) | (2,482) | (3,217) | |||||||||||||||||||
| Gain (loss) from partially owned entities | 174 | (139) | (1,442) | (918) | |||||||||||||||||||
| Impairment of related party loan receivable | — | — | (21,972) | — | |||||||||||||||||||
| Loss on put option | — | — | (56,576) | — | |||||||||||||||||||
| (Loss) income from continuing operations before income taxes | $ | (227,401) | $ | 2,226 | $ | (328,089) | $ | (29,928) | |||||||||||||||
|
||||||||
| Financial Supplement | Fourth Quarter 2023 |
|||||||
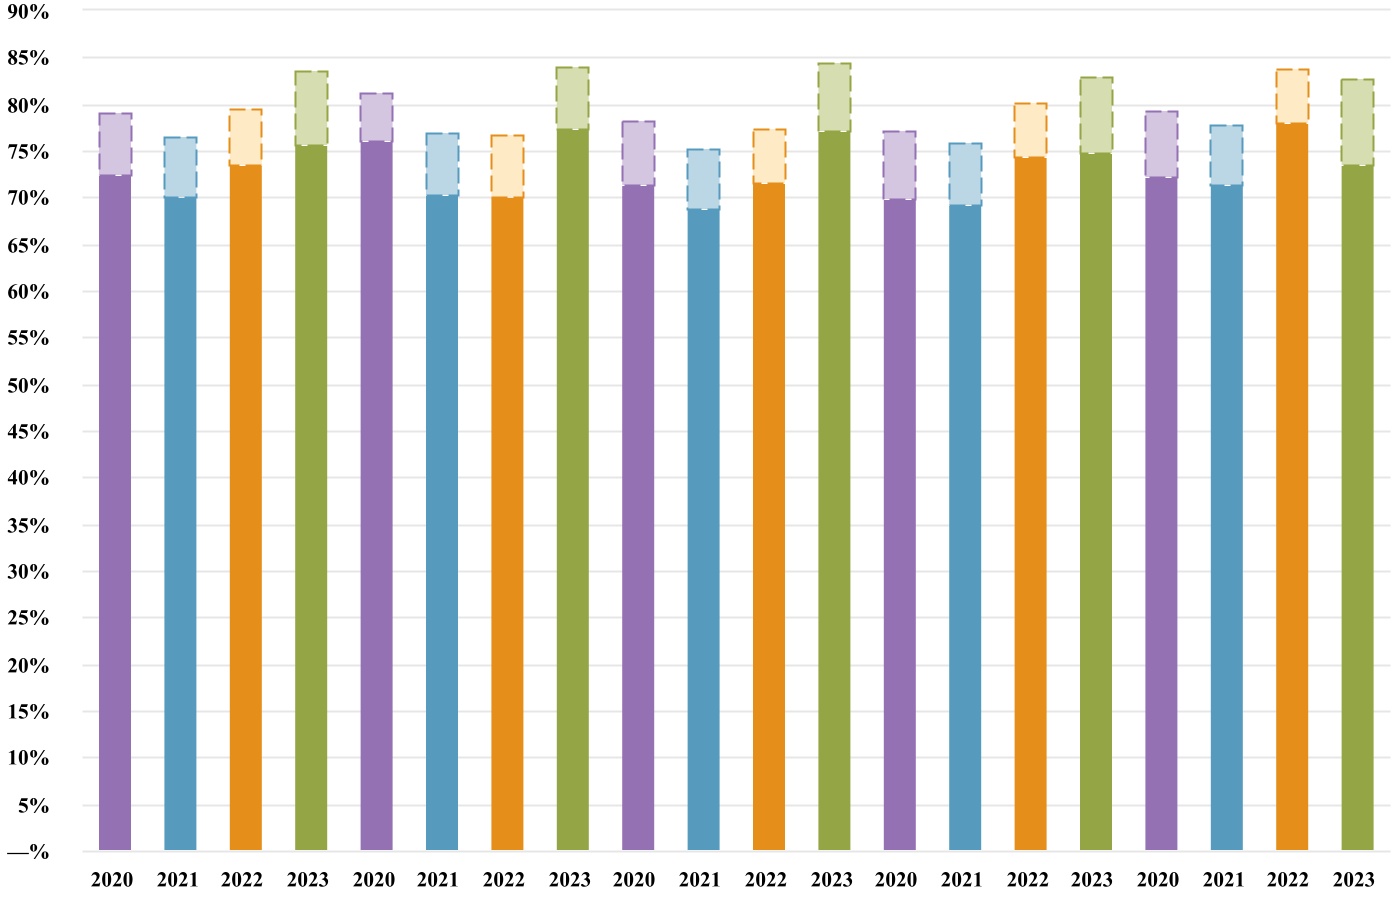
| FY | Q1 | Q2 | Q3 | Q4 | ||||||||||
|
||||||||
| Financial Supplement | Fourth Quarter 2023 |
|||||||
| Country / Region |
# of
warehouses
|
Cubic feet
(in millions)
|
% of total cubic feet |
Pallet positions (in thousands) |
Average economic occupancy (1) |
Average
physical
occupancy (1)
|
Revenues (2)
(in millions)
|
Segment
contribution
(NOI) (2)(3)
(in millions)
|
Total
customers (4)
|
|||||||||||||||||||||||||||||||||||||||||||||||
Warehouse Segment Portfolio (5) |
||||||||||||||||||||||||||||||||||||||||||||||||||||||||
| United States | ||||||||||||||||||||||||||||||||||||||||||||||||||||||||
| East | 53 | 376.8 | 25 | % | 1,176 | 85 | % | 72 | % | $ | 635.6 | $ | 195.3 | 1,105 | ||||||||||||||||||||||||||||||||||||||||||
| Southeast | 49 | 317.4 | 21 | % | 980 | 83 | % | 75 | % | 458.0 | 103.9 | 697 | ||||||||||||||||||||||||||||||||||||||||||||
| Central | 41 | 268.2 | 18 | % | 1,085 | 84 | % | 77 | % | 439.3 | 155.6 | 731 | ||||||||||||||||||||||||||||||||||||||||||||
| West | 45 | 273.7 | 18 | % | 1,158 | 80 | % | 74 | % | 401.5 | 140.6 | 624 | ||||||||||||||||||||||||||||||||||||||||||||
| Canada | 5 | 32.6 | 2 | % | 121 | 92 | % | 89 | % | 45.5 | 16.5 | 85 | ||||||||||||||||||||||||||||||||||||||||||||
| North America Total | 193 | 1,268.7 | 86 | % | 4,520 | 83 | % | 75 | % | $ | 1,979.9 | $ | 611.9 | 2,373 | ||||||||||||||||||||||||||||||||||||||||||
| Netherlands | 7 | 36.7 | 2 | % | 112 | 82 | % | 82 | % | 51.2 | 10.2 | 141 | ||||||||||||||||||||||||||||||||||||||||||||
| United Kingdom | 6 | 40.1 | 3 | % | 244 | 89 | % | 84 | % | 53.8 | 22.6 | 187 | ||||||||||||||||||||||||||||||||||||||||||||
| Spain | 4 | 15.2 | 1 | % | 77 | 61 | % | 61 | % | 21.5 | 5.3 | 275 | ||||||||||||||||||||||||||||||||||||||||||||
| Portugal | 4 | 11.5 | 1 | % | 58 | 64 | % | 64 | % | 11.6 | 2.7 | 175 | ||||||||||||||||||||||||||||||||||||||||||||
| Ireland | 3 | 9.5 | 1 | % | 59 | 79 | % | 70 | % | 20.4 | 4.9 | 144 | ||||||||||||||||||||||||||||||||||||||||||||
| Austria | 1 | 4.2 | — | % | 44 | 75 | % | 75 | % | 23.2 | 6.9 | 141 | ||||||||||||||||||||||||||||||||||||||||||||
| Poland | 2 | 3.5 | — | % | 14 | 95 | % | 95 | % | 6.3 | 1.4 | 62 | ||||||||||||||||||||||||||||||||||||||||||||
| Europe Total | 27 | 120.7 | 8 | % | 608 | 80 | % | 77 | % | $ | 188.0 | $ | 54.0 | 1,235 | ||||||||||||||||||||||||||||||||||||||||||
| Australia | 11 | 60.0 | 4 | % | 206 | 92 | % | 84 | % | 171.6 | 39.0 | 128 | ||||||||||||||||||||||||||||||||||||||||||||
| New Zealand | 7 | 20.4 | 1 | % | 86 | 97 | % | 88 | % | 38.9 | 13.9 | 62 | ||||||||||||||||||||||||||||||||||||||||||||
| Asia-Pacific Total | 18 | 80.4 | 5 | % | 292 | 94 | % | 85 | % | $ | 210.5 | $ | 52.9 | 186 | ||||||||||||||||||||||||||||||||||||||||||
| Argentina | 2 | 9.7 | 1 | % | 23 | 81 | % | 81 | % | 12.7 | 3.8 | 51 | ||||||||||||||||||||||||||||||||||||||||||||
| South America Total | 2 | 9.7 | 1 | % | 23 | 81 | % | 81 | % | $ | 12.7 | $ | 3.8 | 51 | ||||||||||||||||||||||||||||||||||||||||||
| Warehouse Segment Total / Average | 240 | 1,479.5 | 100 | % | 5,443 | 84 | % | 76 | % | $ | 2,391.1 | $ | 722.6 | 3,826 | ||||||||||||||||||||||||||||||||||||||||||
| Third-Party Managed Portfolio | ||||||||||||||||||||||||||||||||||||||||||||||||||||||||
| North America | 4 | 20.2 | 100 | % | — | — | — | $ | 19.8 | $ | 1.4 | 4 | ||||||||||||||||||||||||||||||||||||||||||||
| Asia-Pacific | 1 | — | — | % | — | — | — | 22.8 | 4.5 | 1 | ||||||||||||||||||||||||||||||||||||||||||||||
| Third-Party Managed Total / Average | 5 | 20.2 | 100 | % | — | — | — | $ | 42.6 | $ | 5.9 | 5 | ||||||||||||||||||||||||||||||||||||||||||||
| Portfolio Total / Average | 245 | 1,499.7 | 100 | % | 5,443 | 83 | % | 76 | % | $ | 2,433.7 | $ | 728.5 | 3,826 | ||||||||||||||||||||||||||||||||||||||||||
|
||||||||
| Financial Supplement | Fourth Quarter 2023 |
|||||||
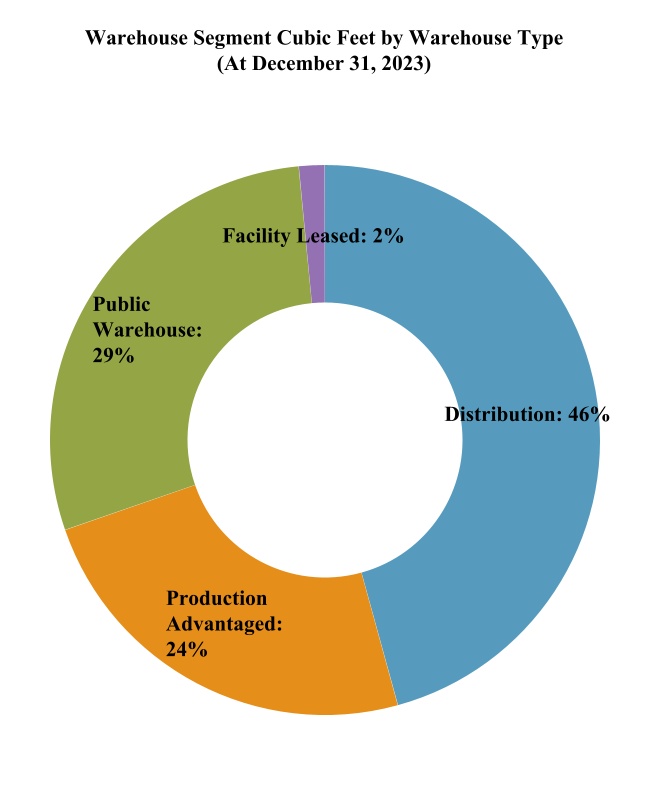
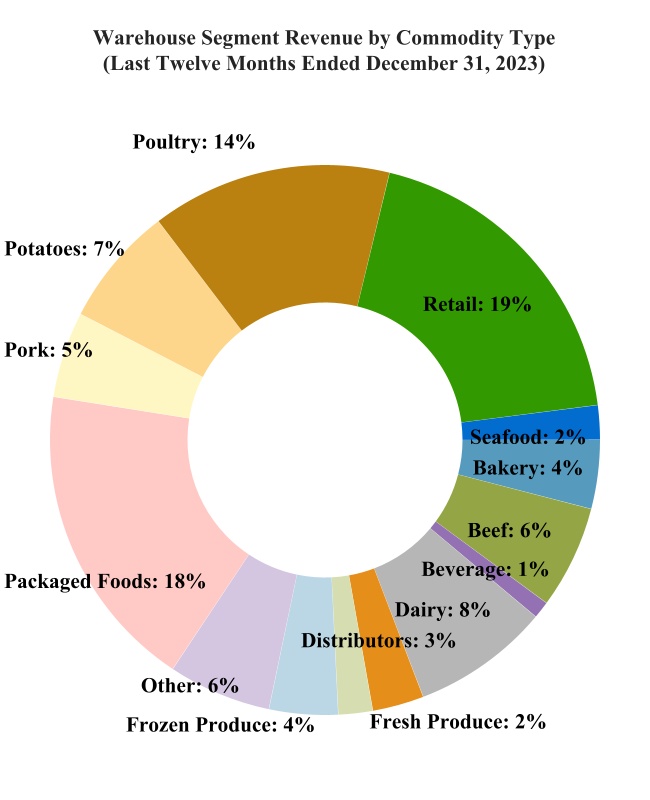
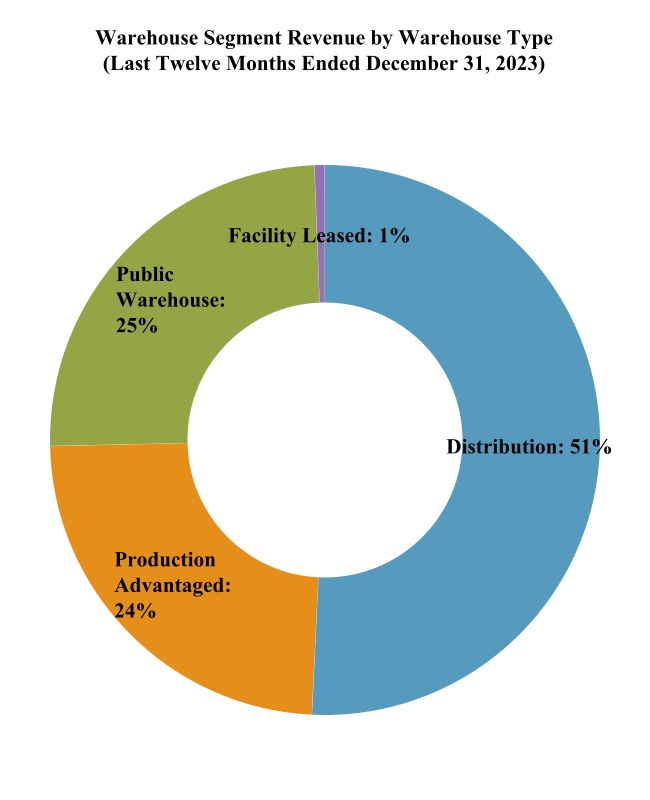
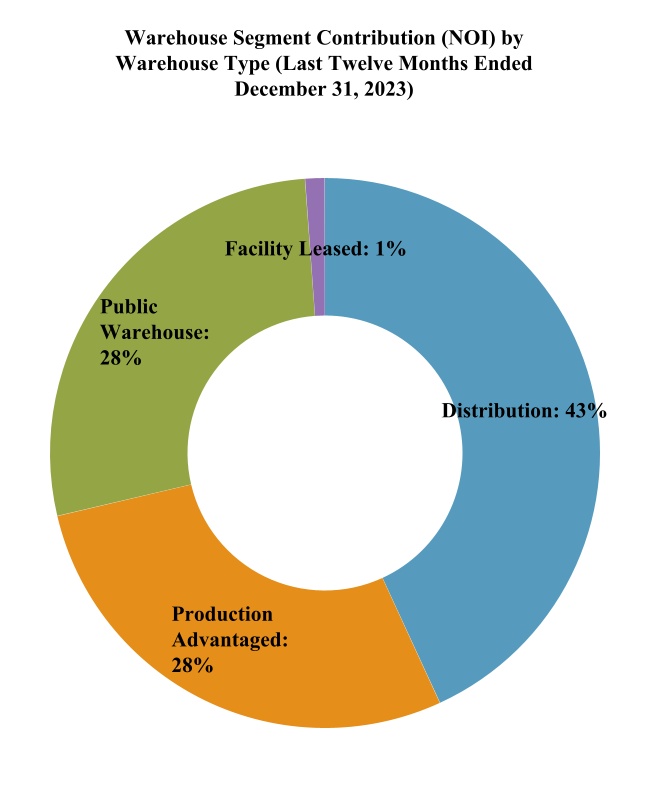
|
||||||||
| Financial Supplement | Fourth Quarter 2023 |
|||||||
| Contract Expiration Year | Number of Contracts |
Annualized Committed Rent & Storage Revenue (in thousands) |
% of Total
Warehouse
Rent & Storage
Segment
Revenue for the
Years ended
December 31, 2023
|
Total Warehouse Segment Revenue Generated by Contracts with Fixed Commitments & Leases for the Years ended December 31, 2023(1) (in thousands) |
Annualized Committed Rent & Storage Revenue at Expiration(2) (in thousands) |
|||||||||||||||||||||||||||
| Month-to-Month | 174 | $ | 112,575 | 10.2 | % | $ | 244,436 | $ | 112,576 | |||||||||||||||||||||||
| 2024 | 187 | 141,310 | 12.8 | % | 322,828 | 140,435 | ||||||||||||||||||||||||||
| 2025 | 68 | 87,041 | 7.9 | % | 158,953 | 89,785 | ||||||||||||||||||||||||||
| 2026 | 50 | 99,144 | 9.0 | % | 182,497 | 104,497 | ||||||||||||||||||||||||||
| 2027 | 22 | 16,805 | 1.5 | % | 31,429 | 18,168 | ||||||||||||||||||||||||||
| 2028 | 16 | 13,575 | 1.2 | % | 24,325 | 14,720 | ||||||||||||||||||||||||||
| 2029+ | 23 | 106,390 | 9.6 | % | 302,191 | 121,887 | ||||||||||||||||||||||||||
| Total | 540 | $ | 576,840 | 52.2 | % | $ | 1,266,659 | $ | 602,068 | |||||||||||||||||||||||
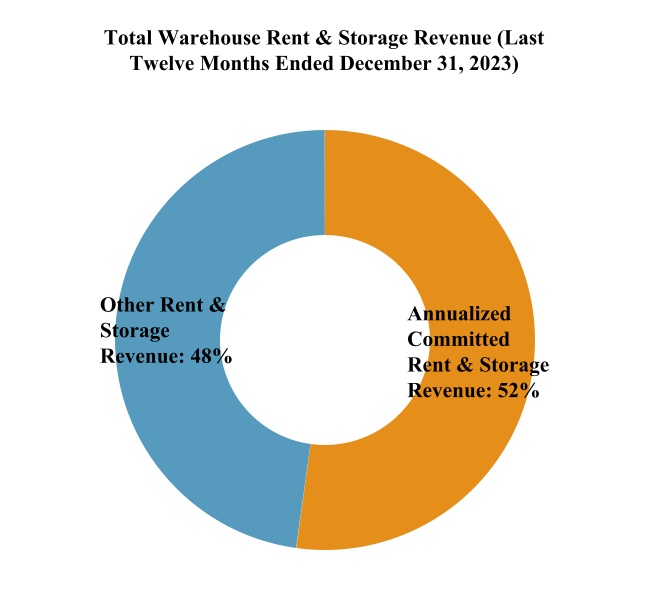
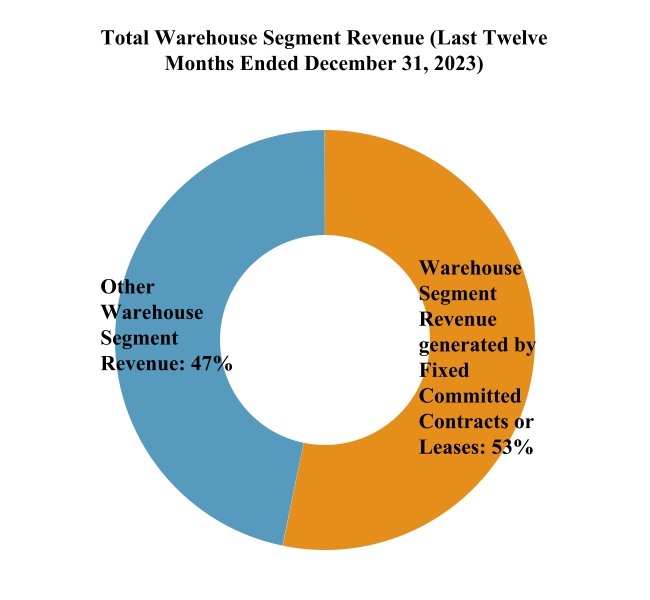
|
||||||||
| Financial Supplement | Fourth Quarter 2023 |
|||||||
| Lease Expiration Year | No. of Leases Expiring |
Annualized
Rent(1)
(in thousands)
|
% of Total
Warehouse Rent &
Storage Segment
Revenue for the
Years ended
December 31, 2023
|
Leased Square Footage (in thousands) |
% Leased Square Footage |
Annualized
Rent at
Expiration(2)
(in thousands)
|
||||||||||||||||||||||||||||||||
| Month-to-Month | 11 | $ | 1,690 | 0.2 | % | 99 | 2.9 | % | $ | 1,691 | ||||||||||||||||||||||||||||
| 2024 | 34 | 9,042 | 0.8 | % | 897 | 26.2 | % | 9,155 | ||||||||||||||||||||||||||||||
| 2025 | 16 | 8,355 | 0.8 | % | 511 | 14.9 | % | 8,501 | ||||||||||||||||||||||||||||||
| 2026 | 11 | 5,856 | 0.5 | % | 477 | 13.9 | % | 6,171 | ||||||||||||||||||||||||||||||
| 2027 | 6 | 3,039 | 0.3 | % | 172 | 5.0 | % | 3,340 | ||||||||||||||||||||||||||||||
| 2028 | 9 | 6,136 | 0.6 | % | 617 | 18.0 | % | 6,640 | ||||||||||||||||||||||||||||||
| 2029+ | 7 | 12,919 | 1.2 | % | 656 | 19.1 | % | 17,521 | ||||||||||||||||||||||||||||||
| Total | 94 | 47,037 | 4.3 | % | — | 3,429 | 100 | % | 53,019 | |||||||||||||||||||||||||||||
|
||||||||
| Financial Supplement | Fourth Quarter 2023 |
|||||||
| Three Months Ended December 31, | Year Ended December 31, | ||||||||||||||||||||||
| 2023 | 2022 | 2023 | 2022 | ||||||||||||||||||||
| (In thousands, except per cubic foot amounts) | |||||||||||||||||||||||
| Real estate | $ | 17,402 | $ | 24,737 | $ | 70,772 | $ | 74,852 | |||||||||||||||
| Personal property | 740 | 444 | 3,124 | 4,232 | |||||||||||||||||||
| Information technology | 528 | 1,520 | 4,515 | 6,427 | |||||||||||||||||||
Maintenance capital expenditures(1) |
$ | 18,670 | $ | 26,701 | $ | 78,411 | $ | 85,511 | |||||||||||||||
| Maintenance capital expenditures per cubic foot | $ | 0.012 | $ | 0.018 | $ | 0.052 | $ | 0.059 | |||||||||||||||
| Three Months Ended December 31, | Year Ended December 31, | ||||||||||||||||||||||
| 2023 | 2022 | 2023 | 2022 | ||||||||||||||||||||
| (In thousands, except per cubic foot amounts) | |||||||||||||||||||||||
| Real estate | $ | 22,652 | $ | 11,632 | $ | 56,210 | $ | 41,086 | |||||||||||||||
| Personal property | 7,437 | 19,303 | 62,485 | 61,822 | |||||||||||||||||||
| Repair and maintenance expenses | $ | 30,089 | $ | 30,935 | $ | 118,695 | $ | 102,908 | |||||||||||||||
| Repair and maintenance expenses per cubic foot | $ | 0.020 | $ | 0.021 | $ | 0.079 | $ | 0.071 | |||||||||||||||
| Three Months Ended December 31, | Year Ended December 31, | ||||||||||||||||||||||
| 2023 | 2022 | 2023 | 2022 | ||||||||||||||||||||
| (In thousands) | |||||||||||||||||||||||
| Business combinations | $ | 5,910 | $ | 601 | $ | 46,653 | $ | 15,829 | |||||||||||||||
| Asset acquisitions | 22,194 | — | 65,771 | 14,581 | |||||||||||||||||||
Expansion and development initiatives(2) |
46,432 | 46,251 | 126,160 | 190,718 | |||||||||||||||||||
| Information technology | 3,856 | 3,512 | 10,208 | 6,910 | |||||||||||||||||||
| Growth and expansion capital expenditures | $ | 78,392 | $ | 50,364 | $ | 248,792 | $ | 228,038 | |||||||||||||||
|
||||||||
| Financial Supplement | Fourth Quarter 2023 |
|||||||
| Three Months Ended December 31, | Change | ||||||||||||||||||||||||||||
2023 Actual |
2023 Constant Currency(1) |
2022 Actual |
Actual | Constant Currency | |||||||||||||||||||||||||
| (Dollars in thousands) | |||||||||||||||||||||||||||||
| Rent and storage | $ | 276,641 | $ | 278,493 | $ | 267,031 | 3.6 | % | 4.3 | % | |||||||||||||||||||
| Warehouse services | 335,621 | 336,331 | 331,659 | 1.2 | % | 1.4 | % | ||||||||||||||||||||||
| Total warehouse segment revenue | $ | 612,262 | $ | 614,824 | $ | 598,690 | 2.3 | % | 2.7 | % | |||||||||||||||||||
| Power | 33,999 | 34,125 | 37,963 | (10.4) | % | (10.1) | % | ||||||||||||||||||||||
Other facilities costs (2) |
64,168 | 64,715 | 58,906 | 8.9 | % | 9.9 | % | ||||||||||||||||||||||
| Labor | 252,853 | 253,801 | 255,181 | (0.9) | % | (0.5) | % | ||||||||||||||||||||||
Other services costs (3) |
64,140 | 64,216 | 74,313 | (13.7) | % | (13.6) | % | ||||||||||||||||||||||
| Total warehouse segment cost of operations | $ | 415,160 | $ | 416,857 | $ | 426,363 | (2.6) | % | (2.2) | % | |||||||||||||||||||
| Warehouse segment contribution (NOI) | $ | 197,102 | $ | 197,967 | $ | 172,327 | 14.4 | % | 14.9 | % | |||||||||||||||||||
Warehouse rent and storage contribution (NOI) (4) |
$ | 178,474 | $ | 179,653 | $ | 170,162 | 4.9 | % | 5.6 | % | |||||||||||||||||||
Warehouse services contribution (NOI) (5) |
$ | 18,628 | $ | 18,314 | $ | 2,165 | 760.4 | % | 745.9 | % | |||||||||||||||||||
| Total warehouse segment margin | 32.2 | % | 32.2 | % | 28.8 | % | 341 bps | 341 bps | |||||||||||||||||||||
Rent and storage margin(6) |
64.5 | % | 64.5 | % | 63.7 | % | 79 bps | 79 bps | |||||||||||||||||||||
Warehouse services margin(7) |
5.6 | % | 5.4 | % | 0.7 | % | 490 bps | 479 bps | |||||||||||||||||||||
|
||||||||
| Financial Supplement | Fourth Quarter 2023 |
|||||||
| Year Ended December 31, | Change | ||||||||||||||||||||||||||||
| 2023 Actual | 2023 Constant Currency(1) |
2022 Actual | Actual | Constant Currency | |||||||||||||||||||||||||
| (Dollars in thousands) | |||||||||||||||||||||||||||||
| Rent and storage | $ | 1,101,741 | $ | 1,113,052 | $ | 999,388 | 10.2 | % | 11.4 | % | |||||||||||||||||||
| Warehouse services | 1,289,348 | 1,299,295 | 1,303,583 | (1.1) | % | (0.3) | % | ||||||||||||||||||||||
| Total warehouse segment revenues | 2,391,089 | 2,412,347 | 2,302,971 | 3.8 | % | 4.7 | % | ||||||||||||||||||||||
| Power | 147,750 | 149,572 | 155,661 | (5.1) | % | (3.9) | % | ||||||||||||||||||||||
Other facilities costs (2) |
247,743 | 250,302 | 231,944 | 6.8 | % | 7.9 | % | ||||||||||||||||||||||
| Labor | 1,023,806 | 1,033,200 | 1,006,862 | 1.7 | % | 2.6 | % | ||||||||||||||||||||||
Other services costs (3) |
249,187 | 250,694 | 272,272 | (8.5) | % | (7.9) | % | ||||||||||||||||||||||
| Total warehouse segment cost of operations | $ | 1,668,486 | $ | 1,683,768 | $ | 1,666,739 | 0.1 | % | 1.0 | % | |||||||||||||||||||
| Warehouse segment contribution (NOI) | $ | 722,603 | $ | 728,579 | $ | 636,232 | 13.6 | % | 14.5 | % | |||||||||||||||||||
Warehouse rent and storage contribution (NOI) (4) |
$ | 706,248 | $ | 713,178 | $ | 611,783 | 15.4 | % | 16.6 | % | |||||||||||||||||||
Warehouse services contribution (NOI) (5) |
$ | 16,355 | $ | 15,401 | $ | 24,449 | (33.1) | % | (37.0) | % | |||||||||||||||||||
| Total warehouse segment margin | 30.2 | % | 30.2 | % | 27.6 | % | 259 bps | 258 bps | |||||||||||||||||||||
Rent and storage margin(6) |
64.1 | % | 64.1 | % | 61.2 | % | 289 bps | 286 bps | |||||||||||||||||||||
Warehouse services margin(7) |
1.3 | % | 1.2 | % | 1.9 | % | -61 bps | -69 bps | |||||||||||||||||||||
|
||||||||
| Financial Supplement | Fourth Quarter 2023 |
|||||||
| Three Months Ended December 31, | Change | ||||||||||||||||||||||||||||
2023 Actual |
2023 Constant Currency(1) |
2022 Actual |
Actual | Constant Currency | |||||||||||||||||||||||||
| Number of same store warehouses | 219 | 219 | n/a | n/a | |||||||||||||||||||||||||
| Same store revenues: | (Dollars in thousands) | ||||||||||||||||||||||||||||
| Rent and storage | $ | 254,642 | $ | 256,614 | $ | 252,984 | 0.7 | % | 1.4 | % | |||||||||||||||||||
| Warehouse services | 319,511 | 320,399 | 317,648 | 0.6 | % | 0.9 | % | ||||||||||||||||||||||
| Total same store revenues | $ | 574,153 | $ | 577,013 | $ | 570,632 | 0.6 | % | 1.1 | % | |||||||||||||||||||
| Same store cost of operations: | |||||||||||||||||||||||||||||
| Power | 29,993 | 30,173 | 34,952 | (14.2) | % | (13.7) | % | ||||||||||||||||||||||
| Other facilities costs | 59,125 | 59,699 | 53,777 | 9.9 | % | 11.0 | % | ||||||||||||||||||||||
| Labor | 238,662 | 239,686 | 239,194 | (0.2) | % | 0.2 | % | ||||||||||||||||||||||
| Other services costs | 61,249 | 61,394 | 70,206 | (12.8) | % | (12.6) | % | ||||||||||||||||||||||
| Total same store cost of operations | $ | 389,029 | $ | 390,952 | $ | 398,129 | (2.3) | % | (1.8) | % | |||||||||||||||||||
| Same store contribution (NOI) | $ | 185,124 | $ | 186,061 | $ | 172,503 | 7.3 | % | 7.9 | % | |||||||||||||||||||
Same store rent and storage contribution (NOI)(2) |
$ | 165,524 | $ | 166,742 | $ | 164,255 | 0.8 | % | 1.5 | % | |||||||||||||||||||
Same store services contribution (NOI)(3) |
$ | 19,600 | $ | 19,319 | $ | 8,248 | 137.6 | % | 134.2 | % | |||||||||||||||||||
| Total same store margin | 32.2 | % | 32.2 | % | 30.2 | % | 201 bps | 202 bps | |||||||||||||||||||||
Same store rent and storage margin(4) |
65.0 | % | 65.0 | % | 64.9 | % | 8 bps | 5 bps | |||||||||||||||||||||
Same store services margin(5) |
6.1 | % | 6.0 | % | 2.6 | % | 354 bps | 343 bps | |||||||||||||||||||||
Number of non-same store warehouses(6) |
21 | 21 | n/a | n/a | |||||||||||||||||||||||||
| Non-same store revenues: | |||||||||||||||||||||||||||||
| Rent and storage | $ | 21,999 | $ | 21,879 | $ | 14,047 | n/r | n/r | |||||||||||||||||||||
| Warehouse services | 16,110 | 15,932 | 14,011 | n/r | n/r | ||||||||||||||||||||||||
| Total non-same store revenues | $ | 38,109 | $ | 37,811 | $ | 28,058 | n/r | n/r | |||||||||||||||||||||
| Non-same store cost of operations: | |||||||||||||||||||||||||||||
| Power | 4,006 | 3,952 | 3,011 | n/r | n/r | ||||||||||||||||||||||||
| Other facilities costs | 5,043 | 5,016 | 5,129 | n/r | n/r | ||||||||||||||||||||||||
| Labor | 14,191 | 14,115 | 15,987 | n/r | n/r | ||||||||||||||||||||||||
| Other services costs | 2,891 | 2,822 | 4,107 | n/r | n/r | ||||||||||||||||||||||||
| Total non-same store cost of operations | $ | 26,131 | $ | 25,905 | $ | 28,234 | n/r | n/r | |||||||||||||||||||||
| Non-same store contribution (NOI) | $ | 11,978 | $ | 11,906 | $ | (176) | n/r | n/r | |||||||||||||||||||||
Non-same store rent and storage contribution (NOI)(2) |
$ | 12,950 | $ | 12,911 | $ | 5,907 | n/r | n/r | |||||||||||||||||||||
Non-same store services contribution (NOI)(3) |
$ | (972) | $ | (1,005) | $ | (6,083) | n/r | n/r | |||||||||||||||||||||
| Total warehouse segment revenues | $ | 612,262 | $ | 614,824 | $ | 598,690 | 2.3 | % | 2.7 | % | |||||||||||||||||||
| Total warehouse cost of operations | $ | 415,160 | $ | 416,857 | $ | 426,363 | (2.6) | % | (2.2) | % | |||||||||||||||||||
| Total warehouse segment contribution (NOI) | $ | 197,102 | $ | 197,967 | $ | 172,327 | 14.4 | % | 14.9 | % | |||||||||||||||||||
| (1) | The adjustments from our U.S. GAAP operating results to calculate our operating results on a constant currency basis is the effect of changes in foreign currency exchange rates relative to the comparable prior period. | ||||
| (2) | Calculated as rent and storage revenues less power and other facilities costs. | ||||
| (3) | Calculated as warehouse services revenues less labor and other services costs. | ||||
| (4) | Calculated as same store rent and storage contribution (NOI) divided by same store rent and storage revenues. | ||||
| (5) | Calculated as same store warehouse services contribution (NOI) divided by same store warehouse services revenues. | ||||
| (6) | The non-same store facility count of 21 consists of: three sites acquired through acquisition, 12 sites in the expansion and development phase, three leased sites that we purchased, one temporarily leased facility in Australia, one leased facility we ceased operations during fourth quarter of 2022 in anticipation of the upcoming lease maturity, and one leased site we exited in preparation to lease to a third party. |
||||
|
||||||||
| Financial Supplement | Fourth Quarter 2023 |
|||||||
| Year Ended December 31, | Change | ||||||||||||||||||||||||||||
| 2023 Actual | 2023 Constant Currency(1) |
2022 Actual | Actual | Constant Currency | |||||||||||||||||||||||||
| Number of same store warehouses | 219 | 219 | n/a | n/a | |||||||||||||||||||||||||
| Same store revenues: | (Dollars in thousands) | ||||||||||||||||||||||||||||
| Rent and storage | $ | 1,024,515 | $ | 1,035,596 | $ | 944,102 | 8.5 | % | 9.7 | % | |||||||||||||||||||
| Warehouse services | 1,233,344 | 1,243,103 | 1,240,378 | (0.6) | % | 0.2 | % | ||||||||||||||||||||||
| Total same store revenues | 2,257,859 | 2,278,699 | 2,184,480 | 3.4 | % | 4.3 | % | ||||||||||||||||||||||
| Same store cost of operations: | |||||||||||||||||||||||||||||
| Power | 132,889 | 134,790 | 141,559 | (6.1) | % | (4.8) | % | ||||||||||||||||||||||
| Other facilities costs | 226,709 | 229,185 | 209,515 | 8.2 | % | 9.4 | % | ||||||||||||||||||||||
| Labor | 960,260 | 969,187 | 945,201 | 1.6 | % | 2.5 | % | ||||||||||||||||||||||
| Other services costs | 229,480 | 230,956 | 254,491 | (9.8) | % | (9.2) | % | ||||||||||||||||||||||
| Total same store cost of operations | $ | 1,549,338 | $ | 1,564,118 | $ | 1,550,766 | (0.1) | % | 0.9 | % | |||||||||||||||||||
| Same store contribution (NOI) | $ | 708,521 | $ | 714,581 | $ | 633,714 | 11.8 | % | 12.8 | % | |||||||||||||||||||
Same store rent and storage contribution (NOI)(2) |
$ | 664,917 | $ | 671,621 | $ | 593,028 | 12.1 | % | 13.3 | % | |||||||||||||||||||
Same store services contribution (NOI)(3) |
$ | 43,604 | $ | 42,960 | $ | 40,686 | 7.2 | % | 5.6 | % | |||||||||||||||||||
| Total same store margin | 31.4 | % | 31.4 | % | 29.0 | % | 237 bps | 235 bps | |||||||||||||||||||||
Same store rent and storage margin(4) |
64.9 | % | 64.9 | % | 62.8 | % | 209 bps | 204 bps | |||||||||||||||||||||
Same store services margin(5) |
3.5 | % | 3.5 | % | 3.3 | % | 26 bps | 18 bps | |||||||||||||||||||||
Number of non-same store warehouses(6) |
21 | 21 | n/a | n/a | |||||||||||||||||||||||||
| Non-same store revenues: | |||||||||||||||||||||||||||||
| Rent and storage | $ | 77,226 | $ | 77,456 | $ | 55,286 | n/r | n/r | |||||||||||||||||||||
| Warehouse services | 56,004 | 56,192 | 63,205 | n/r | n/r | ||||||||||||||||||||||||
| Total non-same store revenues | 133,230 | 133,648 | 118,491 | n/r | n/r | ||||||||||||||||||||||||
| Non-same store cost of operations: | |||||||||||||||||||||||||||||
| Power | 14,861 | 14,782 | 14,102 | n/r | n/r | ||||||||||||||||||||||||
| Other facilities costs | 21,034 | 21,117 | 22,429 | n/r | n/r | ||||||||||||||||||||||||
| Labor | 63,546 | 64,013 | 61,661 | n/r | n/r | ||||||||||||||||||||||||
| Other services costs | 19,707 | 19,738 | 17,781 | n/r | n/r | ||||||||||||||||||||||||
| Total non-same store cost of operations | $ | 119,148 | $ | 119,650 | $ | 115,973 | n/r | n/r | |||||||||||||||||||||
| Non-same store contribution (NOI) | $ | 14,082 | $ | 13,998 | $ | 2,518 | n/r | n/r | |||||||||||||||||||||
Non-same store rent and storage contribution (NOI)(2) |
$ | 41,331 | $ | 41,557 | $ | 18,755 | n/r | n/r | |||||||||||||||||||||
Non-same store services contribution (NOI)(3) |
$ | (27,249) | $ | (27,559) | $ | (16,237) | n/r | n/r | |||||||||||||||||||||
| Total warehouse segment revenues | $ | 2,391,089 | $ | 2,412,347 | $ | 2,302,971 | 3.8 | % | 4.7 | % | |||||||||||||||||||
| Total warehouse cost of operations | $ | 1,668,486 | $ | 1,683,768 | $ | 1,666,739 | 0.1 | % | 1.0 | % | |||||||||||||||||||
| Total warehouse segment contribution (NOI) | $ | 722,603 | $ | 728,579 | $ | 636,232 | 13.6 | % | 14.5 | % | |||||||||||||||||||
| (1) | The adjustments from our U.S. GAAP operating results to calculate our operating results on a constant currency basis is the effect of changes in foreign currency exchange rates relative to the comparable prior period. | ||||
| (2) | Calculated as rent and storage revenues less power and other facilities costs. | ||||
| (3) | Calculated as warehouse services revenues less labor and other services costs. | ||||
| (4) | Calculated as same store rent and storage contribution (NOI) divided by same store rent and storage revenues. | ||||
| (5) | Calculated as same store warehouse services contribution (NOI) divided by same store warehouse services revenues. | ||||
| (6) | The non-same store facility count of 21 consists of: three sites acquired through acquisition, 12 sites in the expansion and development phase, three leased sites that we purchased, one temporarily leased facility in Australia, one leased facility we ceased operations during fourth quarter of 2022 in anticipation of the upcoming lease maturity, and one leased site we exited in preparation to lease to a third party. |
||||
|
||||||||
| Financial Supplement | Fourth Quarter 2023 |
|||||||
| Three Months Ended December 31, | Change | ||||||||||||||||
| Units in thousands except per pallet and site data | 2023 | 2022 | |||||||||||||||
| Number of same store warehouses | 219 | 219 | n/a | ||||||||||||||
| Same store rent and storage: | |||||||||||||||||
Economic occupancy(1) |
|||||||||||||||||
| Average economic occupied pallets | 4,216 | 4,299 | (1.9) | % | |||||||||||||
| Economic occupancy percentage | 83.7 | % | 84.2 | % | -53 bps | ||||||||||||
| Same store rent and storage revenues per average economic occupied pallet | $ | 60.40 | $ | 58.85 | 2.6 | % | |||||||||||
| Constant currency same store rent and storage revenue per average economic occupied pallet | $ | 60.87 | $ | 58.85 | 3.4 | % | |||||||||||
Physical occupancy(2) |
|||||||||||||||||
| Average physical occupied pallets | 3,752 | 4,015 | (6.6) | % | |||||||||||||
| Average physical pallet positions | 5,037 | 5,104 | (1.3) | % | |||||||||||||
| Physical occupancy percentage | 74.5 | % | 78.7 | % | -418 bps | ||||||||||||
| Same store rent and storage revenues per average physical occupied pallet | $ | 67.87 | $ | 63.01 | 7.7 | % | |||||||||||
| Constant currency same store rent and storage revenues per average physical occupied pallet | $ | 68.39 | $ | 63.01 | 8.5 | % | |||||||||||
| Same store warehouse services: | |||||||||||||||||
| Throughput pallets | 8,684 | 9,396 | (7.6) | % | |||||||||||||
| Same store warehouse services revenues per throughput pallet | $ | 36.79 | $ | 33.81 | 8.8 | % | |||||||||||
| Constant currency same store warehouse services revenues per throughput pallet | $ | 36.90 | $ | 33.81 | 9.1 | % | |||||||||||
Number of non-same store warehouses(3) |
21 | 21 | n/a | ||||||||||||||
| Non-same store rent and storage: | |||||||||||||||||
Economic occupancy(1) |
|||||||||||||||||
| Average economic occupied pallets | 325 | 238 | n/r | ||||||||||||||
| Economic occupancy percentage | 71.3 | % | 76.5 | % | n/r | ||||||||||||
Physical occupancy(2) |
|||||||||||||||||
| Average physical occupied pallets | 289 | 214 | n/r | ||||||||||||||
| Average physical pallet positions | 456 | 311 | n/r | ||||||||||||||
| Physical occupancy percentage | 63.4 | % | 68.8 | % | n/r | ||||||||||||
| Non-same store warehouse services: | |||||||||||||||||
| Throughput pallets | 700 | 567 | n/r | ||||||||||||||
|
||||||||
| Financial Supplement | Fourth Quarter 2023 |
|||||||
| Year Ended December 31, | |||||||||||||||||
| Units in thousands except per pallet and site number data | 2023 | 2022 | Change | ||||||||||||||
| Number of same store sites | 219 | 219 | n/a | ||||||||||||||
| Same store rent and storage: | |||||||||||||||||
Economic occupancy(1) |
|||||||||||||||||
| Average occupied economic pallets | 4,268 | 4,099 | 4.1 | % | |||||||||||||
| Economic occupancy percentage | 84.3 | % | 79.9 | % | 433 bps | ||||||||||||
| Same store rent and storage revenues per average economic occupied pallet | $ | 240.05 | $ | 230.32 | 4.2 | % | |||||||||||
| Constant currency same store rent and storage revenues per average economic occupied pallet | $ | 242.64 | $ | 230.32 | 5.3 | % | |||||||||||
Physical occupancy(2) |
|||||||||||||||||
| Average physical occupied pallets | 3,877 | 3,788 | 2.3 | % | |||||||||||||
| Average physical pallet positions | 5,065 | 5,128 | (1.2) | % | |||||||||||||
| Physical occupancy percentage | 76.5 | % | 73.9 | % | 268 bps | ||||||||||||
| Same store rent and storage revenues per average physical occupied pallet | $ | 264.25 | $ | 249.23 | 6.0 | % | |||||||||||
| Constant currency same store rent and storage revenues per average physical occupied pallet | $ | 267.11 | $ | 249.23 | 7.2 | % | |||||||||||
| Same store warehouse services: | |||||||||||||||||
| Throughput pallets (in thousands) | 35,227 | 37,841 | (6.9) | % | |||||||||||||
| Same store warehouse services revenues per throughput pallet | $ | 35.01 | $ | 32.78 | 6.8 | % | |||||||||||
| Constant currency same store warehouse services revenues per throughput pallet | $ | 35.29 | $ | 32.78 | 7.7 | % | |||||||||||
Number of non-same store sites(3) |
21 | 21 | n/a | ||||||||||||||
| Non-same store rent and storage: | |||||||||||||||||
Economic occupancy(1) |
|||||||||||||||||
| Average economic occupied pallets | 278 | 219 | n/r | ||||||||||||||
| Economic occupancy percentage | 73.7 | % | 72.3 | % | n/r | ||||||||||||
Physical occupancy(2) |
|||||||||||||||||
| Average physical occupied pallets | 243 | 203 | n/r | ||||||||||||||
| Average physical pallet positions | 377 | 303 | n/r | ||||||||||||||
| Physical occupancy percentage | 64.5 | % | 67.0 | % | n/r | ||||||||||||
| Non-same store warehouse services: | |||||||||||||||||
| Throughput pallets (in thousands) | 2,297 | 2,250 | n/r | ||||||||||||||
|
||||||||
| Financial Supplement | Fourth Quarter 2023 |
|||||||
| Q4 23 | Q3 23 | Q2 23 | Q1 23 | Q4 22 | Q3 22 | Q2 22 | Q1 22 | ||||||||||||||||||||||||||||||||||||||||
| Number of same store warehouses | 219 | 219 | 219 | 219 | 219 | 219 | 219 | 219 | |||||||||||||||||||||||||||||||||||||||
| Same store revenues: | |||||||||||||||||||||||||||||||||||||||||||||||
| Rent and storage | $254,642 | $257,914 | $255,693 | $256,266 | $252,984 | $245,608 | $228,550 | $216,960 | |||||||||||||||||||||||||||||||||||||||
| Warehouse services | 319,511 | 308,740 | 293,687 | 311,406 | 317,648 | 321,220 | 306,056 | 295,454 | |||||||||||||||||||||||||||||||||||||||
| Total same store revenues | $574,153 | $566,654 | $549,380 | $567,672 | $570,632 | $566,828 | $534,606 | $512,414 | |||||||||||||||||||||||||||||||||||||||
| Same store cost of operations: | |||||||||||||||||||||||||||||||||||||||||||||||
| Power | 29,993 | 37,340 | 32,653 | 32,903 | 34,952 | 44,153 | 32,561 | 29,893 | |||||||||||||||||||||||||||||||||||||||
| Other facilities costs | 59,125 | 56,066 | 55,907 | 55,611 | 53,777 | 53,177 | 51,591 | 50,970 | |||||||||||||||||||||||||||||||||||||||
| Labor | 238,662 | 242,791 | 236,330 | 242,477 | 239,194 | 240,656 | 235,273 | 230,078 | |||||||||||||||||||||||||||||||||||||||
| Other services costs | 61,249 | 57,358 | 53,917 | 56,956 | 70,206 | 63,269 | 63,601 | 57,415 | |||||||||||||||||||||||||||||||||||||||
| Total same store cost of operations | $389,029 | $393,555 | $378,807 | $387,947 | $398,129 | $401,255 | $383,026 | $368,356 | |||||||||||||||||||||||||||||||||||||||
| Same store contribution (NOI) | $185,124 | $173,099 | $170,573 | $179,725 | $172,503 | $165,573 | $151,580 | $144,058 | |||||||||||||||||||||||||||||||||||||||
Same store rent and storage contribution (NOI)(1) |
$165,524 | $164,508 | $167,133 | $167,752 | $164,255 | $148,278 | $144,398 | $136,097 | |||||||||||||||||||||||||||||||||||||||
Same store services contribution (NOI)(2) |
$19,600 | $8,591 | $3,440 | $11,973 | $8,248 | $17,295 | $7,182 | $7,961 | |||||||||||||||||||||||||||||||||||||||
| Total same store margin | 32.2 | % | 30.5 | % | 31.0 | % | 31.7 | % | 30.2 | % | 29.2 | % | 28.4 | % | 28.1 | % | |||||||||||||||||||||||||||||||
Same store rent and storage margin(3) |
65.0 | % | 63.8 | % | 65.4 | % | 65.5 | % | 64.9 | % | 60.4 | % | 63.2 | % | 62.7 | % | |||||||||||||||||||||||||||||||
Same store services margin(4) |
6.1 | % | 2.8 | % | 1.2 | % | 3.8 | % | 2.6 | % | 5.4 | % | 2.3 | % | 2.7 | % | |||||||||||||||||||||||||||||||
| Same store rent and storage: | |||||||||||||||||||||||||||||||||||||||||||||||
| Economic occupancy | |||||||||||||||||||||||||||||||||||||||||||||||
| Average economic occupied pallets | 4,216 | 4,230 | 4,319 | 4,310 | 4,299 | 4,131 | 4,002 | 3,963 | |||||||||||||||||||||||||||||||||||||||
| Economic occupancy percentage | 83.7 | % | 84.0 | % | 84.8 | % | 84.6 | % | 84.2 | % | 80.5 | % | 77.9 | % | 77.0 | % | |||||||||||||||||||||||||||||||
| Same store rent and storage revenues per economic occupied pallet | $60.40 | $60.98 | $59.21 | $59.45 | $58.85 | $59.45 | $57.11 | $54.74 | |||||||||||||||||||||||||||||||||||||||
| Physical occupancy | |||||||||||||||||||||||||||||||||||||||||||||||
| Average physical occupied pallets | 3,752 | 3,816 | 3,968 | 3,971 | 4,015 | 3,839 | 3,692 | 3,607 | |||||||||||||||||||||||||||||||||||||||
| Average physical pallet positions | 5,037 | 5,036 | 5,094 | 5,094 | 5,104 | 5,130 | 5,135 | 5,144 | |||||||||||||||||||||||||||||||||||||||
| Physical occupancy percentage | 74.5 | % | 75.8 | % | 77.9 | % | 78.0 | % | 78.7 | % | 74.8 | % | 71.9 | % | 70.1 | % | |||||||||||||||||||||||||||||||
| Same store rent and storage revenues per physical occupied pallet | $67.87 | $67.58 | $64.44 | $64.53 | $63.01 | $63.98 | $61.90 | $60.15 | |||||||||||||||||||||||||||||||||||||||
| Same store warehouse services: | |||||||||||||||||||||||||||||||||||||||||||||||
| Throughput pallets | 8,684 | 8,798 | 8,617 | 9,128 | 9,396 | 9,665 | 9,508 | 9,272 | |||||||||||||||||||||||||||||||||||||||
| Same store warehouse services revenues per throughput pallet | $36.79 | $35.09 | $34.08 | $34.12 | $33.81 | $33.24 | $32.19 | $31.87 | |||||||||||||||||||||||||||||||||||||||
| Total non-same store results: | |||||||||||||||||||||||||||||||||||||||||||||||
| Non-same store warehouse revenue | 38,109 | 35,950 | 31,971 | 27,380 | 28,058 | 32,147 | 29,775 | 28,511 | |||||||||||||||||||||||||||||||||||||||
| Non-same store warehouse cost of operations | 26,131 | 31,219 | 29,522 | 32,276 | 28,234 | 31,060 | 30,368 | 26,311 | |||||||||||||||||||||||||||||||||||||||
| Non-same store warehouse NOI | 11,978 | 4,731 | 2,449 | (4,896) | (176) | 1,087 | (593) | 2,200 | |||||||||||||||||||||||||||||||||||||||
| Actual FX rates for the period | Q4 23 | Q3 23 | Q2 23 | Q1 23 | Q4 22 | Q3 22 | Q2 22 | Q1 22 | |||||||||||||||||||||||||||||||||||||||
| 1 ARS = | 0.003 | 0.003 | 0.004 | 0.005 | 0.006 | 0.007 | 0.008 | 0.009 | |||||||||||||||||||||||||||||||||||||||
| 1 AUS = | 0.652 | 0.654 | 0.672 | 0.684 | 0.658 | 0.683 | 0.715 | 0.724 | |||||||||||||||||||||||||||||||||||||||
| 1 BRL = | 0.202 | 0.205 | 0.206 | 0.193 | 0.190 | 0.191 | 0.204 | 0.192 | |||||||||||||||||||||||||||||||||||||||
| 1 CAD = | 0.735 | 0.745 | 0.753 | 0.740 | 0.737 | 0.766 | 0.784 | 0.789 | |||||||||||||||||||||||||||||||||||||||
| 1 CLP = | 0.001 | 0.001 | 0.001 | 0.001 | 0.001 | 0.001 | 0.001 | 0.001 | |||||||||||||||||||||||||||||||||||||||
| 1 EUR = | 1.076 | 1.088 | 1.084 | 1.073 | 1.022 | 1.007 | 1.065 | 1.122 | |||||||||||||||||||||||||||||||||||||||
| 1 GBP = | 1.242 | 1.266 | 1.264 | 1.215 | 1.175 | 1.177 | 1.257 | 1.342 | |||||||||||||||||||||||||||||||||||||||
| 1 NZD = | 0.604 | 0.605 | 0.614 | 0.630 | 0.604 | 0.613 | 0.651 | 0.676 | |||||||||||||||||||||||||||||||||||||||
| 1 PLN = | 0.244 | 0.242 | 0.243 | 0.228 | 0.216 | 0.213 | 0.229 | 0.243 | |||||||||||||||||||||||||||||||||||||||
|
||||||||
| Financial Supplement | Fourth Quarter 2023 |
|||||||
| Three Months Ended | Year Ended | ||||||||||||||||||||||||||||
| Q4 23 | Q3 23 | Q2 23 | Q1 23 | 2023 | |||||||||||||||||||||||||
| Number of same store warehouses | 227 | 227 | 227 | 227 | 227 | ||||||||||||||||||||||||
| Same store revenues: | |||||||||||||||||||||||||||||
| Rent and storage | $263,932 | $266,947 | $264,134 | $264,049 | $1,059,062 | ||||||||||||||||||||||||
| Warehouse services | 327,606 | 316,769 | 299,417 | 316,978 | 1,260,770 | ||||||||||||||||||||||||
| Total same store revenues | $591,538 | $583,716 | $563,551 | $581,027 | $2,319,832 | ||||||||||||||||||||||||
| Same store cost of operations: | |||||||||||||||||||||||||||||
| Power | 31,529 | 39,396 | 34,167 | 34,810 | 139,902 | ||||||||||||||||||||||||
Other facilities costs(5) |
60,569 | 57,367 | 57,190 | 57,270 | 232,396 | ||||||||||||||||||||||||
| Labor | 244,348 | 247,648 | 240,574 | 246,463 | 979,033 | ||||||||||||||||||||||||
| Other services costs | 62,731 | 57,895 | 55,415 | 57,768 | 233,809 | ||||||||||||||||||||||||
| Total same store cost of operations | $399,177 | $402,306 | $387,346 | $396,311 | $1,585,140 | ||||||||||||||||||||||||
| Same store contribution (NOI) | $192,361 | $181,410 | $176,205 | $184,716 | $734,692 | ||||||||||||||||||||||||
Same store rent and storage contribution (NOI)(1) |
$171,834 | $170,184 | $172,777 | $171,969 | $686,764 | ||||||||||||||||||||||||
Same store services contribution (NOI)(2) |
$20,527 | $11,226 | $3,428 | $12,747 | $47,928 | ||||||||||||||||||||||||
| Total same store margin | 32.5 | % | 31.1 | % | 31.3 | % | 31.8 | % | 31.7 | % | |||||||||||||||||||
Same store rent and storage margin(3) |
65.1 | % | 63.8 | % | 65.4 | % | 65.1 | % | 64.8 | % | |||||||||||||||||||
Same store services margin(4) |
6.3 | % | 3.5 | % | 1.1 | % | 4.0 | % | 3.8 | % | |||||||||||||||||||
| Same store rent and storage: | |||||||||||||||||||||||||||||
| Economic occupancy | |||||||||||||||||||||||||||||
| Average economic occupied pallets | 4,397 | 4,390 | 4,468 | 4,453 | 4,427 | ||||||||||||||||||||||||
| Economic occupancy percentage | 84.0 | % | 83.9 | % | 84.7 | % | 84.4 | % | 84.2 | % | |||||||||||||||||||
| Same store rent and storage revenues per economic occupied pallet | $60.03 | $60.81 | $59.12 | $59.30 | $239.24 | ||||||||||||||||||||||||
| Physical occupancy | |||||||||||||||||||||||||||||
| Average physical occupied pallets | 3,919 | 3,966 | 4,099 | 4,107 | 4,023 | ||||||||||||||||||||||||
| Average physical pallet positions | 5,235 | 5,235 | 5,277 | 5,277 | 5,256 | ||||||||||||||||||||||||
| Physical occupancy percentage | 74.9 | % | 75.8 | % | 77.7 | % | 77.8 | % | 76.5 | % | |||||||||||||||||||
| Same store rent and storage revenues per physical occupied pallet | $67.34 | $67.30 | $64.43 | $64.30 | $263.26 | ||||||||||||||||||||||||
| Same store warehouse services: | |||||||||||||||||||||||||||||
| Throughput pallets | 9,043 | 9,106 | 8,873 | 9,396 | 36,418 | ||||||||||||||||||||||||
| Same store warehouse services revenues per throughput pallet | $36.23 | $34.79 | $33.74 | $33.74 | $34.62 | ||||||||||||||||||||||||
| Total non-same store results: | |||||||||||||||||||||||||||||
| Non-same store warehouse revenue | $20,724 | $18,889 | $17,619 | $14,025 | $71,257 | ||||||||||||||||||||||||
| Non-same store warehouse cost of operations | $15,983 | $22,467 | $20,982 | $23,914 | $83,346 | ||||||||||||||||||||||||
| Non-same store warehouse NOI | $4,741 | $(3,578) | $(3,363) | $(9,889) | $(12,089) | ||||||||||||||||||||||||
|
||||||||
| Financial Supplement | Fourth Quarter 2023 |
|||||||
| Recently Completed Expansion and Development Projects | ||||||||||||||||||||||||||||||||||||||||||||||||||||||||
| Facility | Opportunity Type | Facility Type (A = Automated) (C = Conventional) |
Tenant Opportunity | Cubic Feet (in millions) |
Pallet Positions (in thousands) |
Estimated Total Cost
(in millions)(1)
|
Expected Stabilized NOI ROIC |
Completion Date | Expected Full Stabilized Quarter | |||||||||||||||||||||||||||||||||||||||||||||||
| Auckland, New Zealand | Expansion | Distribution (C) | Multi-tenant | 4.6 | 27 | NZ$64 | 12-14% | Q2 2021 | Q3 2022 | |||||||||||||||||||||||||||||||||||||||||||||||
| Lurgan, Northern Ireland | Expansion | Distribution (C) | Multi-tenant | 0.7 | 4 | £7 | 10-12% | Q2 2021 | Q3 2022 | |||||||||||||||||||||||||||||||||||||||||||||||
| Calgary, Canada | Expansion | Distribution (C) | Multi-tenant | 2.0 | 7 | C$13 | 10-12% | Q3 2021 | Q1 2023 | |||||||||||||||||||||||||||||||||||||||||||||||
| Dunkirk, NY | Development | Production Advantaged (C) | Build-to-suit | 7.0 | 25 | $38 | 10-12% | Q2 2022 | Q3 2023 | |||||||||||||||||||||||||||||||||||||||||||||||
| Dublin, Ireland | Development | Distribution (C) | Multi-tenant | 6.3 | 20 | €34 | 10-12% | Q3 2022 | Q1 2024 | |||||||||||||||||||||||||||||||||||||||||||||||
| Barcelona | Expansion | Distribution (C) | Multi-tenant | 3.3 | 12 | €13 | 10-12% | Q4 2022 | Q3 2024 | |||||||||||||||||||||||||||||||||||||||||||||||
| Lancaster, PA | Development | Distribution (A) | Build-to-suit | 11.4 | 28 | $164 | 10-12% | Q1 2023 | Q3 2025 | |||||||||||||||||||||||||||||||||||||||||||||||
| Gateway, GA Phase 2 | Expansion | Distribution (A) | Multi-tenant | 6.3 | 24 | $39 | 10-12% | Q2 2023 | Q1 2025 | |||||||||||||||||||||||||||||||||||||||||||||||
| Russellville, AR | Expansion | Production Advantaged (A) | Build-to-suit | 13.0 | 42 | $90 | 10-12% | Q3 2023 | Q4 2024 | |||||||||||||||||||||||||||||||||||||||||||||||
| Spearwood, Australia | Expansion | Distribution (A) | Multi-tenant | 3.3 | 20 | A$64 |
10-12% | Q3 2023 | Q1 2025 | |||||||||||||||||||||||||||||||||||||||||||||||
| Plainville, CT | Development | Distribution (A) | Build-to-suit | 12.1 | 31 | $161 | 10-12% | Q4 2023 | Q4 2025 | |||||||||||||||||||||||||||||||||||||||||||||||
| Expansion and Development Projects In Process and Announced | ||||||||||||||||||||||||||||||||||||||||||||||||||||||||||||||||||||
| Facility Type (A = Automated) (C = Conventional) |
Under Construction |
Investment in Expansion / Development (in millions) |
Expected Stabilized NOI ROIC |
Target Complete Date |
Expected Full Stabilized Quarter | |||||||||||||||||||||||||||||||||||||||||||||||||||||||||||||||
| Facility | Opportunity Type | Tenant Opportunity |
Cubic Feet
(millions) (1)
|
Pallet
Positions
(thousands) (1)
|
Cost (2) |
Estimate to Complete |
Total Estimated Cost |
|||||||||||||||||||||||||||||||||||||||||||||||||||||||||||||
| Allentown, PA | Expansion | Conventional (C) | Multi-tenant | 14.6 | 37 | $5 | $80-$85 |
$85-$90 |
10-12% | Q2 2025 | Q1 2027 | |||||||||||||||||||||||||||||||||||||||||||||||||||||||||
| Kansas City, MO | Development | Conventional (C) | Multi-tenant | 13.5 | 22 | $— | $128 - $134 |
$128 - $134 |
10-12% | Q2 2025 | Q1 2026 | |||||||||||||||||||||||||||||||||||||||||||||||||||||||||
|
||||||||
| Financial Supplement | Fourth Quarter 2023 |
|||||||
Recent Acquisitions | ||||||||||||||||||||||||||||||||||||||||||||||||||||||||
| Facility | Metropolitan Area | No. of Facilities | Cubic Feet (in millions) |
Pallet Positions (in thousands) |
Acquisition Price (in millions) (1) |
Net Entry NOI Yield (1) |
Expected Three Year Stabilized NOI ROIC |
Date Purchased | Expected Full Stabilized Quarter | |||||||||||||||||||||||||||||||||||||||||||||||
| De Bruyn Cold Storage | Australia | 1 | 2.0 | 21 | A$24.9 | 8.2 | % | 9-10% | 7/1/2022 | Q4 2025 | ||||||||||||||||||||||||||||||||||||||||||||||
| Ormeau | Australia | 1 | 2.1 | 10 | A$36.1 | — | 9-10% | 7/7/2023 | Q2 2026 | |||||||||||||||||||||||||||||||||||||||||||||||
| Safeway | New Jersey | 1 | 6.0 | 17 | $37.0 | 8.9 | % | 9-10% | 10/5/2023 | Q3 2026 | ||||||||||||||||||||||||||||||||||||||||||||||
|
||||||||
| Financial Supplement | Fourth Quarter 2023 |
|||||||
| SuperFrio | |||||||||||||||||
| As of | |||||||||||||||||
| Summary Balance Sheet - at the JV’s 100% share in BRLs | Q4 23 | Q3 23 | Q2 23 | Q1 23 | Q4 22 | ||||||||||||
| ($’s in thousands) | |||||||||||||||||
| Net book value of property, buildings and equipment | R$ | 1,116,560 | R$ | 1,107,455 | R$ | 1,119,533 | R$ | 1,112,850 | R$ | 1,099,418 | |||||||
| Other assets | 490,036 | 463,194 | 476,615 | 466,146 | 512,948 | ||||||||||||
| Total assets | 1,606,596 | 1,570,649 | 1,596,148 | 1,578,996 | 1,612,366 | ||||||||||||
| Debt | 686,298 | 646,243 | 666,362 | 659,675 | 679,304 | ||||||||||||
| Other liabilities | 496,756 | 500,639 | 492,444 | 464,967 | 461,286 | ||||||||||||
| Equity | 423,542 | 423,767 | 437,342 | 454,354 | 471,776 | ||||||||||||
| Total liabilities and equity | R$ | 1,606,596 | R$ | 1,570,649 | R$ | 1,596,148 | R$ | 1,578,996 | R$ | 1,612,366 | |||||||
| Americold’s ownership percentage | 15 | % | 15 | % | 15 | % | 15 | % | 15 | % | |||||||
| BRL/USD quarter-end rate | 0.2061 | 0.1987 | 0.2089 | 0.1975 | 0.1892 | ||||||||||||
| Americold’s pro rata share of debt at BRL/USD rate | $ | 21,217 | $ | 19,261 | $ | 20,880 | $ | 19,543 | $ | 19,279 | |||||||
| Three Months Ended | |||||||||||||||||
| Summary Statement of Operations - at the JV’s 100% share in BRLs | Q4 23 | Q3 23 | Q2 23 | Q1 23 | Q4 22 | ||||||||||||
| ($’s in thousands) | |||||||||||||||||
| Revenues | R$ | 169,006 | R$ | 161,229 | R$ | 158,418 | R$ | 156,234 | R$ | 163,109 | |||||||
| Cost of operations | 110,295 | 110,741 | 113,467 | 110,947 | 103,302 | ||||||||||||
| Selling, general and administrative expense | 7,523 | 7,464 | 8,111 | 8,658 | 13,732 | ||||||||||||
| M&A expense | (5,677) | 4,896 | (919) | 2,751 | 3,940 | ||||||||||||
| Depreciation & amortization | 20,315 | 19,658 | 19,846 | 20,070 | 20,672 | ||||||||||||
| Total operating expenses | 132,456 | 142,759 | 140,505 | 142,426 | 141,646 | ||||||||||||
| Operating income | 36,550 | 18,470 | 17,913 | 13,808 | 21,463 | ||||||||||||
| Interest expense | 31,831 | 31,292 | 32,977 | 32,488 | 28,588 | ||||||||||||
| Other expense (income) | (981) | (906) | (1,532) | (1,799) | (631) | ||||||||||||
| Current income tax expense | (347) | 1,012 | 890 | 1,567 | 1,519 | ||||||||||||
| Deferred income tax benefit | 124 | (732) | (78) | (245) | (216) | ||||||||||||
| Non-operating expenses | 30,627 | 30,666 | 32,257 | 32,011 | 29,260 | ||||||||||||
| Net gain (loss) | R$ | 5,923 | R$ | (12,196) | R$ | (14,344) | R$ | (18,203) | R$ | (7,797) | |||||||
| Americold’s ownership percentage | 15 | % | 15 | % | 15 | % | 15 | % | 15 | % | |||||||
| BRL/USD average rate | 0.2019 | 0.2047 | 0.2022 | 0.1927 | 0.1901 | ||||||||||||
| Americold’s pro rata share of NOI | $ | 1,778 | $ | 1,550 | $ | 1,363 | $ | 1,309 | $ | 1,705 | |||||||
| Americold’s pro rata share of Net gain (loss) | $ | 179 | $ | (374) | $ | (435) | $ | (526) | $ | (222) | |||||||
| Americold’s pro rata share of Core FFO | $ | 309 | $ | 73 | $ | (225) | $ | (177) | $ | 163 | |||||||
| Americold’s pro rata share of AFFO | $ | 526 | $ | 275 | $ | 85 | $ | 42 | $ | 378 | |||||||
|
||||||||
| Financial Supplement | Fourth Quarter 2023 |
|||||||
| As of | |||||
| February 22, 2024 | |||||
| Warehouse segment same store revenue growth (constant currency) | 2.5% - 5.5% |
||||
| Warehouse segment same store NOI growth (constant currency) | 400 - 450 bps higher than associated revenue |
||||
| Warehouse segment non-same store NOI | $(3)M - $9M |
||||
| Transportation and Managed segment NOI | $45M - $50M |
||||
Total selling, general and administrative expense (inclusive of share-based compensation expense of $23M - $25M and $5M - $7M of Orion amortization) |
$247M - $261M |
||||
| Interest expense | $141M - $149M |
||||
| Current income tax expense | $9M - $12M |
||||
| Deferred income tax benefit | $6M - $8M |
||||
| Non real estate depreciation and amortization expense | $112M - $118M |
||||
| Total maintenance capital expenditures | $80M - $90M |
||||
Development starts (1) |
$200M - $300M |
||||
| AFFO per share | $1.32 - $1.42 |
||||
| Assumed FX rates |
1 ARS = 0.0012 USD
1 AUS = 0.6615 USD
1 BRL = 0.2016 USD
1 CAD = 0.7438 USD
1 EUR = 1.0914 USD
1 GBP = 1.2662 USD
1 NZD = 0.6168 USD
1 PLN = 0.2520 USD
|
||||
|
||||||||
| Financial Supplement | Fourth Quarter 2023 |
|||||||
| Notes and Definitions | ||
| We use the following non-GAAP financial measures as supplemental performance measures of our business: NAREIT FFO, Core FFO, Adjusted FFO, EBITDAre, Core EBITDA, net debt to pro-forma Core EBITDA and segment contribution (‘NOI”). | ||
| We calculate funds from operations, or FFO, in accordance with the standards established by the Board of Governors of the National Association of Real Estate Investment Trusts, or NAREIT. NAREIT defines FFO as net income or loss determined in accordance with U.S. GAAP, excluding extraordinary items as defined under U.S. GAAP and gains or losses from sales of previously depreciated operating real estate and other assets, plus specified non-cash items, such as real estate asset depreciation and amortization impairment charge on real estate related assets and our share of reconciling items for partially owned entities. We believe that FFO is helpful to investors as a supplemental performance measure because it excludes the effect of depreciation, amortization and gains or losses from sales of real estate, all of which are based on historical costs, which implicitly assumes that the value of real estate diminishes predictably over time. Since real estate values instead have historically risen or fallen with market conditions, FFO can facilitate comparisons of operating performance between periods and among other equity REITs. | ||
| We calculate core funds from operations, or Core FFO, as NAREIT FFO adjusted for the effects of gain or loss on the sale of non-real estate assets, acquisition, cyber incident and other, net, goodwill impairment (when applicable), loss on debt extinguishment, modifications and termination of derivative instruments, foreign currency exchange (gain) loss, gain on legal settlement related to prior period operations, gain or loss from discontinued operations net of tax, impairment of related party receivable, loss on fair put option, gain on extinguishment of New Market Tax Credit structure, loss on deconsolidation of subsidiary contributed to LATAM joint venture, and gain from sale of LATAM joint venture. We also adjust for the impact of Core FFO on our share of reconciling items for partially owned entities, and gain from disposition of partially owned entities. We believe that Core FFO is helpful to investors as a supplemental performance measure because it excludes the effects of certain items which can create significant earnings volatility, but which do not directly relate to our core business operations. We believe Core FFO can facilitate comparisons of operating performance between periods, while also providing a more meaningful predictor of future earnings potential. | ||
| However, because NAREIT FFO and Core FFO add back real estate depreciation and amortization and do not capture the level of maintenance capital expenditures necessary to maintain the operating performance of our properties, both of which have material economic impacts on our results from operations, we believe the utility of NAREIT FFO and Core FFO as a measure of our performance may be limited. | ||
| We calculate adjusted funds from operations, or Adjusted FFO, as Core FFO adjusted for the effects of amortization of deferred financing costs and pension withdrawal liability, amortization of above or below market leases, non-real estate asset impairment, straight-line net rent, benefit from deferred income taxes, stock-based compensation expense, non-real estate depreciation and amortization and maintenance capital expenditures. We also adjust for AFFO attributable to our share of reconciling items of partially owned entities and discontinued operations. We believe that Adjusted FFO is helpful to investors as a meaningful supplemental comparative performance measure of our ability to make incremental capital investments in our business and to assess our ability to fund distribution requirements from our operating activities. | ||
| FFO, Core FFO and Adjusted FFO are used by management, investors and industry analysts as supplemental measures of operating performance of equity REITs. FFO, Core FFO and Adjusted FFO should be evaluated along with U.S. GAAP net income and net income per diluted share (the most directly comparable U.S. GAAP measures) in evaluating our operating performance. FFO, Core FFO and Adjusted FFO do not represent net income or cash flows from operating activities in accordance with U.S. GAAP and are not indicative of our results of operations or cash flows from operating activities as disclosed in our consolidated statements of operations included in our quarterly and annual reports. FFO, Core FFO and Adjusted FFO should be considered as supplements, but not alternatives, to our net income or cash flows from operating activities as indicators of our operating performance. Moreover, other REITs may not calculate FFO in accordance with the NAREIT definition or may interpret the NAREIT definition differently than we do. Accordingly, our FFO may not be comparable to FFO as calculated by other REITs. In addition, there is no industry definition of Core FFO or Adjusted FFO and, as a result, other REITs may also calculate Core FFO or Adjusted FFO, or other similarly-captioned metrics, in a manner different than we do. The table above reconciles FFO, Core FFO and Adjusted FFO to net (loss) income, which is the most directly comparable financial measure calculated in accordance with U.S. GAAP. | ||
| We calculate EBITDA for Real Estate, or EBITDAre, in accordance with the standards established by the Board of Governors of NAREIT, defined as, earnings before interest expense, taxes, depreciation and amortization, net gain on sale of real estate, net of withholding taxes, and adjustment to reflect share of EBITDAre of partially owned entities. EBITDAre is a measure commonly used in our industry, and we present EBITDAre to enhance investor understanding of our operating performance. We believe that EBITDAre provides investors and analysts with a measure of operating results unaffected by differences in capital structures, capital investment cycles and useful life of related assets among otherwise comparable companies. | ||
We also calculate our Core EBITDA as EBITDAre further adjusted for acquisition, cyber and other, net, loss from investments in partially owned entities, impairment of indefinite and long-lived assets (when applicable), foreign currency exchange loss or gain, stock-based compensation expense, loss on debt extinguishment, modifications and termination of derivative instruments, net gain on other asset disposals, reduction in EBITDAre from partially owned entities, discontinued operations, impairment of related party loan receivable, loss on fair value of put, gain on extinguishment of new market tax credit structure, and loss on deconsolidation of subsidiary contributed to LATAM joint venture.. We believe that the presentation of Core EBITDA provides a measurement of our operations that is meaningful to investors because it excludes the effects of certain items that are otherwise included in EBITDAre but which we do not believe are indicative of our core business operations. EBITDAre and Core EBITDA are not measurements of financial performance under U.S. GAAP, and our EBITDAre and Core EBITDA may not be comparable to similarly titled measures of other companies. You should not consider our EBITDAre and Core EBITDA as alternatives to net income or cash flows from operating activities determined in accordance with U.S. GAAP. Our calculations of EBITDAre and Core EBITDA have limitations as analytical tools, including: | ||
NOI is calculated as earnings before interest expense, taxes, depreciation and amortization, and excluding corporate Selling, general, and administrative expense; Acquisition, cyber incident, and other, net; Impairment of indefinite and long-lived assets; gain or loss on sale of real estate and all components of non-operating other income and expense. Management believes that this is a helpful metric to measure period to period operating performance of the business. | ||
|
||||||||
| Financial Supplement | Fourth Quarter 2023 |
|||||||
| We use Core EBITDA and EBITDAre as measures of our operating performance and not as measures of liquidity. The table on page 21 reconciles EBITDA, EBITDAre and Core EBITDA to net income, which is the most directly comparable financial measure calculated in accordance with U.S. GAAP. | ||
| Net debt to proforma Core EBITDA is calculated using total debt, plus capital lease obligations, less cash and cash equivalents, divided by pro-forma Core EBITDA. We calculate pro-forma Core EBITDA as Core EBITDA further adjusted for acquisitions, dispositions and for rent expense associated with lease buy-outs and lease exits. The pro-forma adjustment for acquisitions reflects the Core EBITDA for the period of time prior to acquisition. The pro-forma adjustment for leased facilities exited or purchased reflects the add-back for the related lease expense from the last year. The pro-forma adjustment for dispositions reduces Core EBITDA for the earnings of facilities disposed of or exited during the year, including the strategic exit of certain third-party managed business. | ||
We define our “same store” population once annually at the beginning of the current calendar year. Our population includes properties owned or leased for the entirety of two comparable periods with at least twelve consecutive months of normalized operations prior to January 1 of the current calendar year. We define “normalized operations” as properties that have been open for operation or lease, after development or significant modification (e.g., expansion or rehabilitation subsequent to a natural disaster). Acquired properties are included in the “same store” population if owned by us as of the first business day of the prior calendar year (e.g. January 1, 2022) and are still owned by us as of the end of the current reporting period, unless the property is under development. The “same store” pool is also adjusted to remove properties that were sold or entered development subsequent to the beginning of the current calendar year. Beginning January of 2024, changes in ownership structure (e.g., purchase of a previously leased warehouse) will no longer result in a facility being excluded from the same store population, as management believes that actively managing its real estate is normal course of operations. Additionally, management will begin to classify new developments (both conventional and automated facilities) as a component of the same store pool once the facility is considered fully operational and both inbounding and outbounding product for at least twelve consecutive months prior to January 1 of the current calendar year. | ||
| We calculate “same store revenue” as revenues for the same store population. We calculate “same store contribution (NOI)” as revenues for the same store population less its cost of operations (excluding any depreciation and amortization, impairment charges, corporate-level selling, general and administrative expenses, corporate-level acquisition, cyber incident and other, net and gain or loss on sale of real estate). In order to derive an appropriate measure of period-to-period operating performance, we also calculate our same store contribution (NOI) on a constant currency basis to remove the effects of foreign currency exchange rate movements by using the comparable prior period exchange rate to translate from local currency into U.S. dollars for both periods. We evaluate the performance of the warehouses we own or lease using a “same store” analysis, and we believe that same store contribution (NOI) is helpful to investors as a supplemental performance measure because it includes the operating performance from the population of properties that is consistent from period to period and also on a constant currency basis, thereby eliminating the effects of changes in the composition of our warehouse portfolio and currency fluctuations on performance measures. Same store contribution (NOI) is not a measurement of financial performance under U.S. GAAP. In addition, other companies providing temperature-controlled warehouse storage and handling and other warehouse services may not define same store or calculate same store contribution (NOI) in a manner consistent with our definition or calculation. Same store contribution (NOI) should be considered as a supplement, but not as an alternative, to our results calculated in accordance with U.S. GAAP. The tables beginning on page 33 provide reconciliations for same store revenues and same store contribution (NOI). | ||
| We define “maintenance capital expenditures” as capital expenditures made to extend the life of, and provide future economic benefit from, our existing temperature-controlled warehouse network and its existing supporting personal property and information technology. Maintenance capital expenditures include capital expenditures made to extend the life of, and provide future economic benefit from, our existing temperature-controlled warehouse network and its existing supporting personal property and information technology. Maintenance capital expenditures do not include acquisition costs contemplated when underwriting the purchase of a building or costs which are incurred to bring a building up to Americold’s operating standards. See the tables on page 30 for additional information regarding our maintenance capital expenditures. | ||
| We define “total real estate debt” as the aggregate of the following: mortgage notes, senior unsecured notes, term loans and borrowings under our revolving line of credit. We define “total debt outstanding” as the aggregate of the following: total real estate debt, sale-leaseback financing obligations and financing lease obligations. See the tables on page 23 for additional information regarding our indebtedness. | ||
| All quarterly amounts and non-GAAP disclosures within this filing shall be deemed unaudited. | ||