Document
Exhibit 99.1
January 23, 2024
Fellow Shareholders,
For the fourth quarter, we earned net income to common stockholders of $8.8 million, or $0.37 per diluted share.
Discussion of the Quarter
Continuing with the practice I started a few quarters ago, here are a few things I believe investors should note. Consider this the TL;DR for investors who don’t want to read to the end of the letter.
•TriumphPay achieved its EBITDA margin goal one year ahead of schedule despite a freight recession.
▪After an extended period of investment, TriumphPay became EBITDA-positive for the first time this quarter. In the Payments section, I go into a deeper discussion on the drivers that pushed us over the hurdle a year ahead of schedule.
•Introducing LoadPay – a wallet application developed for truckers.
▪We have been working on this project behind the scenes for some time. We expect it to launch in mid-2024. As a wallet, LoadPay is a digital presentation layer that provides a user experience and financial products tailored to the financial needs of small trucking companies. We believe LoadPay represents a meaningful expansion of our addressable market and leverages the capabilities of all three of our primary business units, while solving important problems for the trucking companies we pay every day. There are more details in the Payments section.
•There was more noise in our credit book than we prefer to see.
▪Chargeoffs for the quarter were 13 basis points. While this is not an alarming number compared to industry averages, it is unusual for us, so I wanted to call it out. We have not grown our loan portfolio materially since we announced the strategic pivot in the third quarter of 2019. This has been helpful in maintaining credit discipline. No one gets every decision right, and we had a few things pop up this quarter that impacted our earnings and credit metrics. A freight recession plus a 500 basis point move in Fed Fund rates over the last 21 months contributed to relatively high loan modification activity.
•Our near-term earnings face the potential of triple headwinds.
▪The ongoing freight recession continues to pressure earnings in our transportation businesses. If short-term interest rates decline throughout 2024 as the market projects, our net interest income and float revenue would decline relative to the current rate environment. Finally, new initiatives like LoadPay will require investments in people and technology well before they start producing earnings. As I alluded to in the last letter, what causes earnings pain in the short term has the potential to create value for the long term. That is our focus. The plan is to stick to the plan.
The tables on the following page outline some of our key operating metrics.
|
|
|
|
|
|
|
|
|
|
|
|
|
|
|
|
|
|
|
|
|
|
|
|
|
|
|
|
|
|
|
|
|
|
|
As of and for the Three Months Ended |
|
|
| (Dollars in thousands) |
December 31,
2023 |
|
September 30,
2023 |
|
June 30,
2023 |
|
March 31,
2023 |
|
December 31,
2022 |
|
|
|
|
| Financial Highlights: |
|
|
|
|
|
|
|
|
|
|
|
|
|
| Loans held for investment |
$ |
4,163,100 |
|
|
$ |
4,371,528 |
|
|
$ |
4,324,758 |
|
|
$ |
4,310,006 |
|
|
$ |
4,120,291 |
|
|
|
|
|
| Deposits |
$ |
3,977,478 |
|
|
$ |
4,487,051 |
|
|
$ |
4,293,466 |
|
|
$ |
4,038,994 |
|
|
$ |
4,171,336 |
|
|
|
|
|
| Net income available to common stockholders |
$ |
8,825 |
|
|
$ |
11,993 |
|
|
$ |
6,848 |
|
|
$ |
10,209 |
|
|
$ |
16,759 |
|
|
|
|
|
| Diluted earnings per common share |
$ |
0.37 |
|
|
$ |
0.51 |
|
|
$ |
0.29 |
|
|
$ |
0.43 |
|
|
$ |
0.67 |
|
|
|
|
|
Return on average assets(1) |
0.70 |
% |
|
0.93 |
% |
|
0.56 |
% |
|
0.84 |
% |
|
1.27 |
% |
|
|
|
|
Yield on loans(1) |
9.29 |
% |
|
9.16 |
% |
|
9.14 |
% |
|
9.22 |
% |
|
9.23 |
% |
|
|
|
|
Cost of total funds(1) |
1.47 |
% |
|
1.41 |
% |
|
1.23 |
% |
|
0.68 |
% |
|
0.49 |
% |
|
|
|
|
| Non-performing assets to total assets |
1.42 |
% |
|
1.07 |
% |
|
0.68 |
% |
|
0.88 |
% |
|
1.02 |
% |
|
|
|
|
| ACL to total loans |
0.85 |
% |
|
0.80 |
% |
|
0.81 |
% |
|
0.98 |
% |
|
1.04 |
% |
|
|
|
|
Total capital to risk-weighted assets(2) |
16.75 |
% |
|
15.77 |
% |
|
15.59 |
% |
|
15.51 |
% |
|
17.66 |
% |
|
|
|
|
Common equity tier 1 capital to risk-weighted assets(2) |
11.94 |
% |
|
11.18 |
% |
|
10.93 |
% |
|
10.77 |
% |
|
12.73 |
% |
|
|
|
|
(1) Current quarter ratios are annualized
(2) Current period ratios are preliminary
|
|
|
|
|
|
|
|
|
|
|
|
|
|
|
|
|
|
|
|
|
|
|
|
|
|
|
|
|
|
|
|
|
|
|
|
|
|
|
|
|
|
|
|
|
|
|
|
|
|
|
|
|
|
|
December 31,
2023 |
|
September 30,
2023 |
|
June 30,
2023 |
|
March 31,
2023 |
|
December 31,
2022 |
|
Current Quarter Q/Q |
|
Current Year Y/Y |
| For the Qtr Ending |
|
|
|
|
|
Change |
|
% Change |
|
Change |
|
% Change |
| Factoring: |
|
|
|
|
|
|
|
|
|
|
|
|
|
|
|
|
|
| Invoice Volume |
1,404,861 |
|
|
1,428,463 |
|
|
1,494,963 |
|
|
1,491,763 |
|
|
1,596,843 |
|
|
(23,602) |
|
|
(1.7) |
% |
|
(191,982) |
|
|
(12.0) |
% |
| Purchased Volume |
$ |
2,570,442,000 |
|
|
$ |
2,606,323,000 |
|
|
$ |
2,732,976,000 |
|
|
$ |
2,927,104,000 |
|
|
$ |
3,277,986,000 |
|
|
$ |
(35,881,000) |
|
|
(1.4) |
% |
|
$ |
(707,544,000) |
|
|
(21.6) |
% |
| Average Transportation Invoice Size |
$ |
1,781 |
|
|
$ |
1,772 |
|
|
$ |
1,773 |
|
|
$ |
1,911 |
|
|
$ |
2,002 |
|
|
$ |
9 |
|
|
0.5 |
% |
|
$ |
(221) |
|
|
(11.0) |
% |
| Payments: |
|
|
|
|
|
|
|
|
|
|
|
|
|
|
|
|
|
| Invoice Volume |
5,703,740 |
|
|
5,037,841 |
|
|
4,526,629 |
|
|
4,260,654 |
|
|
4,605,020 |
|
|
665,899 |
|
|
13.2 |
% |
|
1,098,720 |
|
|
23.9 |
% |
| Payment Volume |
$ |
6,217,323,000 |
|
|
$ |
5,329,580,000 |
|
|
$ |
4,940,317,000 |
|
|
$ |
5,030,548,000 |
|
|
$ |
5,577,014,000 |
|
|
$ |
887,743,000 |
|
|
16.7 |
% |
|
$ |
640,309,000 |
|
|
11.5 |
% |
| Network Invoice Volume |
442,353 |
|
|
303,300 |
|
|
181,904 |
|
|
159,353 |
|
|
157,004 |
|
|
139,053 |
|
|
45.8 |
% |
|
285,349 |
|
|
181.7 |
% |
| Network Payment Volume |
$ |
740,048,000 |
|
|
$ |
510,298,000 |
|
|
$ |
299,948,000 |
|
|
$ |
289,667,000 |
|
|
$ |
301,366,000 |
|
|
$ |
229,750,000 |
|
|
45.0 |
% |
|
$ |
438,682,000 |
|
|
145.6 |
% |
|
|
|
|
|
|
|
|
|
|
|
|
|
|
|
|
|
|
|
|
|
|
|
|
|
|
|
|
|
|
|
|
|
|
|
|
Payments
For our Payments segment discussion, we will cover the following topics:
1.Analysis of financial and operational performance for the quarter.
2.Update on market penetration for freight brokers and factors.
3.Introduction of LoadPay.
Analysis of financial and operational performance for the quarter. TriumphPay crossed into positive EBITDA this quarter. There are two things I want to point out about this. First, the interest rate environment helped offset what the freight market took. By that, I mean that our float revenue has grown materially due not only to the growth in float balances, but also due to the move in interest rates. We acknowledge that and take no credit for it beyond being ready to react to the market opportunity. There are; however, many other metrics that have no direct correlation to the interest rate environment that increased on an absolute basis despite the freight recession. This is the key takeaway for me and is highlighted further below.
The chart on the following page is a visual demonstration of this point. The line chart represents declining invoice sizes, while the bars represent growing revenue. The revenue bars highlight quickpay and fee income that can be attributed to a specific customer in a specific year and excludes other supply chain finance income and float. We show it this way for a purpose: prior to 2022, the only material source of revenue in TriumphPay was quickpay, which was subject to the same dynamics around invoice pricing as our factoring business.[1] Peak invoice pricing in late 2021 and early 2022 coincided with peak revenue across almost all annual client cohorts onboarded prior to 2022. Since the first quarter of 2022, invoice prices have fallen by 30%; however, TriumphPay revenue began expanding rapidly in 2023. That same invoice price dynamic in our Factoring segment led to a double-digit decline in revenue even after adjusting for the supply chain finance realignment to our Payments segment.
Notice the revenue growth in TriumphPay was particularly strong in the back half of 2023, as new clients came on board and new sources of revenue were implemented. As a result, excluding a one-time write-up on an investment in 2022, fee income in the Payments segment grew 40.6%[2] for the full year 2023. In addition to that, when comparing the fourth quarter of 2023 vs the fourth quarter of 2022, fee income grew 60.8%. This includes the fees we generate from network transactions and other highly scalable network activities. To put a point on this discussion, we expanded revenue, added relationships, improved the network during the worst freight recession since the Great Financial Crisis and we achieved positive EBITDA. This was an impressive year for TriumphPay.

For the quarter, TriumphPay’s invoice volume increased 13.2%, and total payment volume increased by 16.7% to $24.9 billion, annualized. Our broker clients represent $21.3 billion of that figure while the remaining $3.6 billion is related to shipper clients. The average invoice paid by TriumphPay increased 3.0% in size. Our annualized unique broker audit dollar volume was flat at $16 billion, and our annualized unique factor audit volume stands at $10.8 billion. TriumphPay touches about $51.7 billion in unique brokered freight transactions, which is a significant percentage of the market. Our goal for the next step in our progression is to drive that number above 50% of all transactions in brokered freight.[4]
For the quarter, network transactions increased 45.8% relative to last quarter. Network transactions and the fees we generate for those are most similar to fees investors see in a Visa/Mastercard payments network.
Our broker quickpay penetration average was 6.5%, and we generated service revenue on approximately 15.5% of our payments invoices. We also earned revenue of $2.0 million[5] on the net float generated through payments made on behalf of our clients.
I alluded to this in the opening – float is always valuable, but it is especially so in the current interest rate environment.
TriumphPay non-interest expenses this quarter were $15.3 million, up 1.5% compared to the prior quarter. Overall, I am very pleased with the management of our expense growth as we continue to scale. The long-term goal is to drive the variable costs associated with new business to almost zero so that our gross margins level out in the very high double digits.
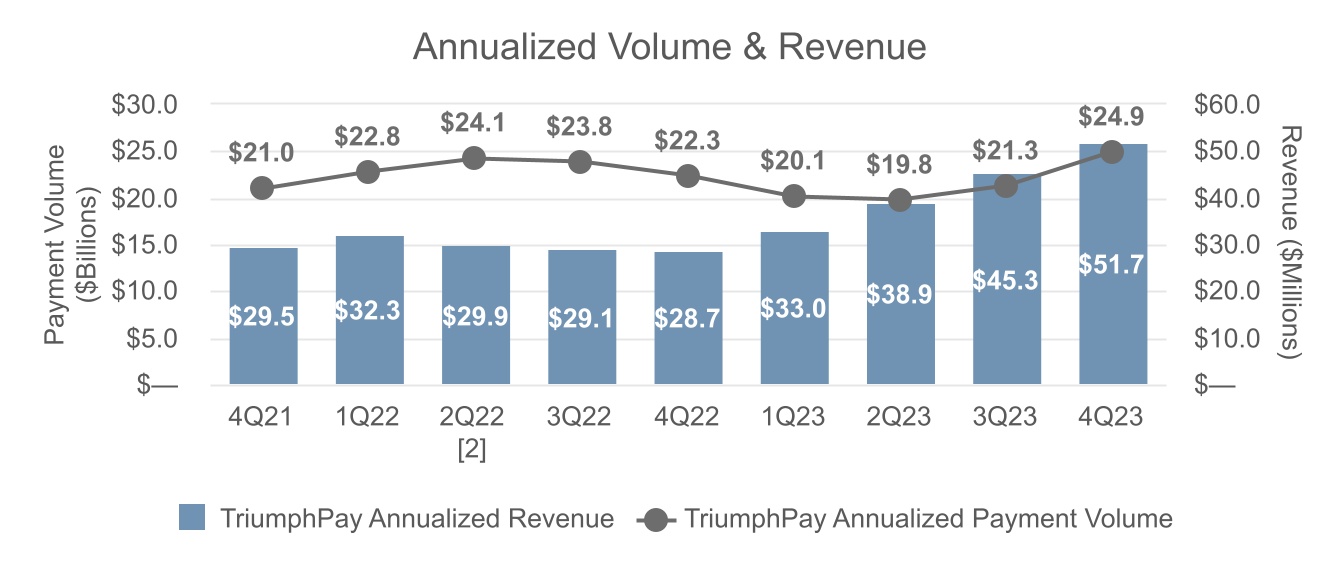
In the chart below, we highlight the continued revenue growth and its trend over the last eight quarters against the backdrop of our payment volumes. Our fourth quarter run rate was $51.7 million. We have generated a roughly 32.6% CAGR in revenue over the last two years. If you look back at the third quarter of 2021 investor presentation targets of $100 million in revenue on $75 billion in payments, you will see that we are monetizing TriumphPay at a higher rate than our original projections. We are over halfway to our revenue goal even though we are only roughly 30% of the way to our volume goal.
The chart below shows the trend lines in EBITDA margin relative to revenue. I want to refer to my fourth opening point as investors consider this chart – we expect to face a weak freight market for most if not all of 2024. In addition, the broader market expects interest rates to fall. I don’t share the market expectation for the rate at which those cuts will come, but we are not making a material bet either way. The point is if rates do fall and freight stays weak and we invest in initiatives to widen the gap between TriumphPay and any potential competitor, it will put pressure on earnings for this segment and the enterprise as a whole. Nothing real goes up and to the right every quarter. It is even possible we might fall back below EBITDA breakeven during 2024. Nevertheless, we believe in the long-term value of what we are building and we will continue to execute our plan.
Update on market penetration for the top-100 freight brokers. Last quarter, I detailed how Triumph Financial defines our TAM for full truckload brokered freight. We continued to build on our momentum, which brings us closer to our next goal of processing more than 50% of all transactions in this segment of the market. During the quarter, Coyote Logistics, ranked #3 in Transport Topics 100 list, went live on our network. The addition of Coyote brings us to 3 of the top 5, 6 of the top 10, and 55 of the top 100 freight brokers. In addition to Coyote Logistics, we added 10 new brokers, onboarded 15 additional divisions to existing clients, and expect to integrate additional network brokers during the first half of 2024.

From a factor client perspective, we added four new factoring companies to the payments network. We now have 34 network factors on the payments network and have successfully renewed our existing contracts. Our ability to continue to drive value for our factoring clients is evidenced in the addition of new clients, renewals, and our increased network transaction growth discussed above.
Introducing LoadPay. As mentioned in the opening, LoadPay is a wallet application that is initially tailored to the needs of small trucking companies. As I have alluded to in recent shareholder letters, there are investments which we will make opportunistically within our domain of expertise. This is one of them.
Before diving deeper, sharp-eyed investors might notice that they have seen a reference to LoadPay before. In the first quarter of 2023 letter, we announced that we acquired the assets of Truckstop Pay, which was formerly known as LoadPay. Truckstop Pay was a platform that nominally competed with TriumphPay. We purchased it to pick up the portfolio of customers they were servicing, and with that, we acquired the rights to the LoadPay name.
As we have developed our wallet we made the intentional decision to brand it independently from TriumphPay for various reasons, and the LoadPay name proved a natural fit. We are excited to share the new branding and logo with you now.
When building any new product, you want to solve a meaningful customer problem in a way that provides value to your customer(s) and economics to your business. Ideally, you have a unique set of capabilities and a distribution mechanism that allows you to deliver this value defensibly and at scale. With LoadPay, we believe we are uniquely positioned to deliver a ubiquitous wallet solution for the freight industry.
LoadPay’s initial target audience is small trucking companies. These make up an overwhelming majority of the operating authorities with whom our freight broker and factor clients work. These small trucking companies operate 24/7, are thinly capitalized, and generally have immediate needs for cash to pay for expenses like fuel, insurance, maintenance, etc. The ability to fund these trucking companies has historically been constrained by Fed mandated cutoffs for ACH and wires, which do not clear at night or on the weekends or holidays.
Fintechs have solved this problem by developing products that allow money to be made accessible instantly and around-the-clock. These products like this are generally built by a fintech as a presentation layer, requiring a partner to provide the banking technology layer and a chartered bank to custody funds, issue cards, and maintain regulatory compliance. As a Triumph Financial offering, LoadPay can leverage TBK Bank as the sponsor bank, retain a significant share of the economics of float and interchange, and tailor the underlying accounts and product offerings to the transportation industry.
While there are a couple of freight-focused digital wallets and cash flow management systems that have entered the market, we believe that one of LoadPay’s unique advantages is its distribution. In the venture capital world, it is said that first time founders focus on technology, and second time founders focus on distribution. While Triumph Financial has never been a VC backed company, I feel like we have lived this journey with TriumphPay, and our maturing thinking on distribution guided our timing of bringing LoadPay to market. Now is the time for our take on the Fresno Drop (if you understand this reference, you are likely a student of the payments industry...if not, just Google it.)[6]
For competitive reasons, I am not willing to go into our full go-to-market strategy. Here is what I will say – if you have observed how Triumph Financial thinks about network effects, you should expect us to use the same playbook. We want power users to be incentivized to sell LoadPay the same way issuing banks are incentivized to sell Visa or Mastercard. This is why we have separated the branding from TriumphPay.
Who are the power users in our industry? They are the freight brokers who purchase transportation from independent truckers and the factoring companies that serve those truckers. Incentivizing power users makes us a network of networks as every freight broker and factor has a network of carriers with whom they regularly communicate. Involving them in the distribution of LoadPay gives it the highest chance of success.
So, I refer once again to the importance of focusing on technology and distribution. The technology is hard, but doable. There is a roadmap laid down by many fintechs before us. We are following that roadmap and adding trucking-specific features. The distribution of the product is the mountain most fintechs cannot climb. Since we (i) pay more truckers than anyone in the world, (ii) are a bank and therefore have the immediate ability to transfer funds internally to LoadPay wallets, and (iii) have relationships with the power users in the market, we expect to climb this mountain.
If we get the technology and the distribution right, what do we win? We believe there are potentially very large revenue opportunities for LoadPay consisting of some combination of float and transfer fees generated from funds in the wallet and revenue share on various fuel, debit and other payment options linked to the wallet.
Factoring
For discussion of our Factoring segment, we will cover the following topics:
1.Analysis of financial and operational performance for the quarter.
2.Expectations for the freight market in 2024.
Analysis of financial and operational performance for the quarter. Our average transportation invoice price dropped to $1,781, down $221 from the same quarter in 2022 and increased $9 from the third quarter of 2023. Purchased volume declined 1.4% relative to the third quarter. Throughout the fourth quarter, diesel fuel continued to drop and ended the quarter down 15%. As of year-end, current diesel prices were $3.91 per gallon vs the prior 90-day average of $4.59 per gallon. This decrease improved margins for our carriers. It is unlikely this trend will continue in the first quarter due to normal seasonal contraction. Through the date of the publishing of this letter, average transportation invoice sizes for January are $1,839. It remains to be seen whether these rates will hold. The discount rate and yield in our factoring segment increased during the fourth quarter. Utilization increased slightly this quarter, following a similar trend last quarter, as both our invoice count per client and dollars per client increased. Carrier capacity continues to leave the market, albeit at a slower pace than expected.
Our teams continue to improve processes and enhance our technology using artificial intelligence and machine learning tools during this cycle. This positions Triumph for the freight rebound whenever that occurs — for our own account and as a future service provider to the factoring industry. We use artificial intelligence and machine learning in part as the engine for instant purchasing decisions, which gives us the ability to fund without time constraints if the carrier has a funding source integrated with us. As you might expect, we are looking forward to the additional value LoadPay will bring to this business. We also leverage these tools to create and improve operational efficiency for our existing business by reducing the amount of human intervention required in processes and procedures.

Expectations for the freight market in 2024. My outlook on the 2024 freight market is unchanged from what I wrote in the previous letter. I think it is going to be a tough year. Further, 2024 is a presidential election year, and the global supply chain is being disrupted by global conflict. Everyone in the industry is looking for green shoots, but they are hard to find. It is possible they are emerging, and I am not seeing them. Regardless, the plan is to stick to the plan.
Banking
For discussion of our Banking segment, we will cover the following topics:
1.Analysis of credit trends and the overall lending environment.
2.Analysis of core deposit balance and rate trends.
3.Discussion of expense levels and outlook.
Analysis of credit trends and the overall lending environment. As I noted at the beginning of this letter, our bank segment experienced elevated credit noise in the fourth quarter, which weighed on earnings relative to prior quarters. Bank segment credit costs were driven primarily by a $3.8MM loss on a specific loan in our liquid credit portfolio. Our liquid credit business has done very well for us over the last 4+ years. We considerably reduced the size of the portfolio over the last year as we judged the risk/reward proposition to be less attractive, but we missed on this specific credit. We are using the lessons learned from this loss to sharpen our liquid credit approach and strategy going forward. These lessons include reducing the maximum size of our liquid credit positions and refining our views on when and where to utilize our liquid credit trading capabilities.
The other driver of the Bank segment credit costs was the ongoing freight recession and its impact on our equipment finance clients. In equipment finance, sustained cash flow shortfalls at some carriers resulted in an uptick in NPAs. As reported previously, we are proactively making accommodations and modifications to address carriers’ near-term cash flow needs while also improving our collateral position. With the pressures facing carriers and no end to the freight recession in sight, we increased the general reserve on our equipment finance loans. This, in combination with new specific reserves on a few equipment loans, contributed about $2.3 million to credit costs in the fourth quarter.
In CRE, we are preparing for the possibility that interest rates remain higher for longer which, on balance, would be a positive for our earnings. We made a significant modification to a $23 million variable-rate multifamily borrower this quarter, and additional modifications may be required in future quarters. Due to our relatively low concentration in CRE exposure, the magnitude of additional modifications is limited.
Analysis of core deposit balance and rate trends. Our core community bank deposit base again remained stable in the quarter. The growth in our cost of funds continued to slow this quarter, rising 6 basis points to 1.47%. This was due to lower funding requirements combined with continued discipline in managing deposit rates. We anticipate continued gradual upward pressure on rates in the near term, but we are shortening the duration of rate exceptions in anticipation of the Fed rate cuts.
Discussion of expense levels and outlook. We continued to exert expense discipline in our core banking operations, but we began to experience higher expenses to support the development and maintenance of LoadPay in the fourth quarter. LoadPay requires the same support from the bank segment that other fintechs obtain from Banking as a Service (BaaS) providers, including account opening support, access to bank products/services, ongoing operational support for wallet activity, compliance support and fraud mitigation services. We can leverage the existing bank infrastructure to provide these services, but additional staff and resources will also be required.
Expense Outlook
In our previous shareholder letter, I pointed to roughly 5% expense growth in 2024 with the caveat that a few new initiatives may require additional investment. We have begun actively investing in the development of LoadPay, and as it and other initiatives are ramped up, our expenses will likely tick higher as well. For the first quarter specifically, depending on the timing of a few items, we expect total non-interest expenses in the range of $90 to $92 million.
The year 2023 was quite a ride. We survived a mini-banking crisis and a freight recession. We did more than just survive, we thrived. I am grateful for that and I am grateful for those of you who continue to invest with us. It is our primary mission to create long-term value for all our stakeholders. Cheers to 2024!
With warm regards,
Aaron P. Graft Founder, Vice Chairman & CEO [1] Average invoice sizes in our payments segment are generally smaller than average invoice sizes in our factoring segment as a transportation factor generally will only factor long-haul trucking invoices.
Less than truckload (LTL) and parcel typically are not regularly serviced by the transportation factoring industry due to their small ticket size. Our payments business pays all transportation invoices of a freight broker and as such includes some LTL, parcel and shorter hauls that a transportation factor normally will not service.
[2] Annualized and annual TriumphPay revenue, noninterest income and EBITDA presentations, where footnoted, exclude a $7.0 million net gain on minority investment mark-to-market in the second quarter of 2022.
[3] Recurring cohort revenue is defined as quickpay revenue and fee revenue attributable to clients onboarded in the annual cohorts shown. It does not include one-off fees or gains, float revenue, or other supply chain finance income aside from quickpays.
[4]This reference to brokered freight is specific to domestic truckload (“TL”) freight only. Thus, this calculation would exclude LTL, parcel, etc. It would also exclude shipper volumes. Admittedly, this is a difficult percentage to calculate with precision and it will move from year to year. That being said, we can evaluate the number of payments received in our factoring segment as a proxy for the percentage of TL freight TriumphPay is touching and also use industry data points to make informed assumptions. In the end, this goal is not intended to be a precise measurement in the same way as we would measure earnings. It is a directional and blunt measurement of the reach of the Payments network.
[5] Float revenue in TriumphPay is generated on the net remaining float after funding balance sheet exposure in the payments segment. Float balances in TriumphPay at 12/31/2023 were $340 million. Net float balances were $163 million.
[6] We are cognizant of history’s lessons surrounding that event. Our rollout of LoadPay will obviously be different in substance and structure than a consumer card issuance in 1958. I mention it only due to the significance of that event in forming what has become the payments industry today.
Conference Call Information
Aaron P. Graft, Vice Chairman and CEO, and Brad Voss, CFO, will review the financial results in a conference call with investors and analysts beginning at 9:30 a.m. central time on Wednesday, January 24, 2024.
The live video conference option may be accessed directly through this link, https://triumph-financial-inc-earnings-q4fy23.open-exchange.net or via the Company's website at tfin.com through the News & Events, Events & Presentations links. Alternatively, a live conference call option is available by dialing 1-888-788-0099 (International: +1-800-260-5801) requesting to be joined to meeting ID 974 3066 5951 at the prompt. An archive of this conference call will subsequently be available at this same location, referenced above, on the Company’s website.
About Triumph Financial
Triumph Financial, Inc. (Nasdaq: TFIN) is a financial holding company focused on payments, factoring and banking. Headquartered in Dallas, Texas, its diversified portfolio of brands includes TriumphPay, Triumph and TBK Bank. www.tfin.com
Forward-Looking Statements
This letter to shareholders contains forward-looking statements. Any statements about our expectations, beliefs, plans, predictions, forecasts, objectives, assumptions or future events or performance are not historical facts and may be forward-looking. You can identify forward-looking statements by the use of forward-looking terminology such as “believes,” “expects,” “could,” “may,” “will,” “should,” “seeks,” “likely,” “intends,” “plans,” “pro forma,” “projects,” “estimates” or “anticipates” or the negative of these words and phrases or similar words or phrases that are predictions of or indicate future events or trends and that do not relate solely to historical matters. You can also identify forward-looking statements by discussions of strategy, plans or intentions. Forward-looking statements involve numerous risks and uncertainties and you should not rely on them as predictions of future events. Forward-looking statements depend on assumptions, data or methods that may be incorrect or imprecise and we may not be able to realize them. We do not guarantee that the transactions and events described will happen as described (or that they will happen at all). The following factors, among others, could cause actual results and future events to differ materially from those set forth or contemplated in the forward-looking statements: business and economic conditions generally and in the bank and non-bank financial services industries, nationally and within our local market areas; our ability to mitigate our risk exposures; our ability to maintain our historical earnings trends; changes in management personnel; interest rate risk; concentration of our products and services in the transportation industry; credit risk associated with our loan portfolio; lack of seasoning in our loan portfolio; deteriorating asset quality and higher loan charge-offs; time and effort necessary to resolve nonperforming assets; inaccuracy of the assumptions and estimates we make in establishing reserves for probable loan losses and other estimates; risks related to the integration of acquired businesses and any future acquisitions; our ability to successfully identify and address the risks associated with our possible future acquisitions, and the risks that our prior and possible future acquisitions make it more difficult for investors to evaluate our business, financial condition and results of operations, and impairs our ability to accurately forecast our future performance; lack of liquidity; fluctuations in the fair value and liquidity of the securities we hold for sale; impairment of investment securities, goodwill, other intangible assets or deferred tax assets; our risk management strategies; environmental liability associated with our lending activities; increased competition in the bank and non-bank financial services industries, nationally, regionally or locally, which may adversely affect pricing and terms; the accuracy of our financial statements and related disclosures; material weaknesses in our internal control over financial reporting; system failures or failures to prevent breaches of our network security; the institution and outcome of litigation and other legal proceedings against us or to which we become subject; changes in carry-forwards of net operating losses; changes in federal tax law or policy; the impact of recent and future legislative and regulatory changes, including changes in banking, securities and tax laws and regulations, such as the Dodd-Frank Act and their application by our regulators; governmental monetary and fiscal policies; changes in the scope and cost of FDIC, insurance and other coverages; failure to receive regulatory approval for future acquisitions; increases in our capital requirements and the impact of COVID-19 on our business.
While forward-looking statements reflect our good-faith beliefs, they are not guarantees of future performance. All forward-looking statements are necessarily only estimates of future results. Accordingly, actual results may differ materially from those expressed in or contemplated by the particular forward-looking statement, and, therefore, you are cautioned not to place undue reliance on such statements. Further, any forward-looking statement speaks only as of the date on which it is made, and we undertake no obligation to update any forward-looking statement to reflect events or circumstances after the date on which the statement is made or to reflect the occurrence of unanticipated events or circumstances, except as required by applicable law. For a discussion of such risks and uncertainties, which could cause actual results to differ from those contained in the forward-looking statements, see "Risk Factors" and the forward-looking statement disclosure contained in Triumph Financial’s Annual Report on Form 10-K, filed with the Securities and Exchange Commission on February 15, 2023.
Non-GAAP Financial Measures
This letter to shareholders includes certain non‐GAAP financial measures intended to supplement, not substitute for, comparable GAAP measures. Reconciliations of non‐GAAP financial measures to GAAP financial measures are provided at the end of this letter to shareholders.
The following table sets forth key metrics used by Triumph Financial to monitor our operations. Footnotes in this table can be found in our definitions of non-GAAP financial measures at the end of this document.
|
|
|
|
|
|
|
|
|
|
|
|
|
|
|
|
|
|
|
|
|
|
|
|
|
|
|
|
|
|
|
|
|
|
|
|
|
|
|
|
|
|
|
As of and for the Three Months Ended |
|
As of and for the Year Ended |
| (Dollars in thousands) |
December 31,
2023 |
|
September 30,
2023 |
|
June 30,
2023 |
|
March 31,
2023 |
|
December 31,
2022 |
|
December 31,
2023 |
|
December 31,
2022 |
| Financial Highlights: |
|
|
|
|
|
|
|
|
|
|
|
|
|
| Total assets |
$ |
5,347,334 |
|
|
$ |
5,599,794 |
|
|
$ |
5,652,721 |
|
|
$ |
5,628,185 |
|
|
$ |
5,333,783 |
|
|
$ |
5,347,334 |
|
|
$ |
5,333,783 |
|
| Loans held for investment |
$ |
4,163,100 |
|
|
$ |
4,371,528 |
|
|
$ |
4,324,758 |
|
|
$ |
4,310,006 |
|
|
$ |
4,120,291 |
|
|
$ |
4,163,100 |
|
|
$ |
4,120,291 |
|
| Deposits |
$ |
3,977,478 |
|
|
$ |
4,487,051 |
|
|
$ |
4,293,466 |
|
|
$ |
4,038,994 |
|
|
$ |
4,171,336 |
|
|
$ |
3,977,478 |
|
|
$ |
4,171,336 |
|
| Net income available to common stockholders |
$ |
8,825 |
|
|
$ |
11,993 |
|
|
$ |
6,848 |
|
|
$ |
10,209 |
|
|
$ |
16,759 |
|
|
$ |
37,875 |
|
|
$ |
99,105 |
|
|
|
|
|
|
|
|
|
|
|
|
|
|
|
| Performance Ratios - Annualized: |
|
|
|
|
|
|
|
|
|
|
|
|
|
| Return on average assets |
0.70 |
% |
|
0.93 |
% |
|
0.56 |
% |
|
0.84 |
% |
|
1.27 |
% |
|
0.76 |
% |
|
1.79 |
% |
| Return on average total equity |
4.40 |
% |
|
5.95 |
% |
|
3.64 |
% |
|
5.20 |
% |
|
7.66 |
% |
|
4.80 |
% |
|
11.46 |
% |
| Return on average common equity |
4.25 |
% |
|
5.89 |
% |
|
3.45 |
% |
|
5.09 |
% |
|
7.69 |
% |
|
4.67 |
% |
|
11.69 |
% |
Return on average tangible common equity (1) |
6.20 |
% |
|
8.70 |
% |
|
5.16 |
% |
|
7.56 |
% |
|
11.14 |
% |
|
6.91 |
% |
|
17.16 |
% |
Yield on loans(2) |
9.29 |
% |
|
9.16 |
% |
|
9.14 |
% |
|
9.22 |
% |
|
9.23 |
% |
|
9.20 |
% |
|
8.88 |
% |
| Cost of interest bearing deposits |
1.84 |
% |
|
1.83 |
% |
|
1.13 |
% |
|
0.55 |
% |
|
0.48 |
% |
|
1.37 |
% |
|
0.38 |
% |
| Cost of total deposits |
1.11 |
% |
|
1.15 |
% |
|
0.68 |
% |
|
0.32 |
% |
|
0.28 |
% |
|
0.83 |
% |
|
0.22 |
% |
| Cost of total funds |
1.47 |
% |
|
1.41 |
% |
|
1.23 |
% |
|
0.68 |
% |
|
0.49 |
% |
|
1.21 |
% |
|
0.39 |
% |
Net interest margin(2) |
7.55 |
% |
|
7.48 |
% |
|
7.57 |
% |
|
8.08 |
% |
|
8.22 |
% |
|
7.67 |
% |
|
7.82 |
% |
| Net noninterest expense to average assets |
5.29 |
% |
|
5.28 |
% |
|
5.79 |
% |
|
5.98 |
% |
|
5.38 |
% |
|
5.58 |
% |
|
4.48 |
% |
|
|
|
|
|
|
|
|
|
|
|
|
|
|
| Efficiency ratio |
82.24 |
% |
|
82.36 |
% |
|
87.80 |
% |
|
85.52 |
% |
|
76.90 |
% |
|
84.45 |
% |
|
70.30 |
% |
|
|
|
|
|
|
|
|
|
|
|
|
|
|
|
|
|
|
|
|
|
|
|
|
|
|
|
|
Asset Quality:(3) |
|
|
|
|
|
|
|
|
|
|
|
|
|
| Past due to total loans |
2.00 |
% |
|
1.94 |
% |
|
1.55 |
% |
|
1.67 |
% |
|
2.53 |
% |
|
2.00 |
% |
|
2.53 |
% |
| Non-performing loans to total loans |
1.65 |
% |
|
1.22 |
% |
|
0.74 |
% |
|
1.01 |
% |
|
1.17 |
% |
|
1.65 |
% |
|
1.17 |
% |
| Non-performing assets to total assets |
1.42 |
% |
|
1.07 |
% |
|
0.68 |
% |
|
0.88 |
% |
|
1.02 |
% |
|
1.42 |
% |
|
1.02 |
% |
| ACL to non-performing loans |
51.15 |
% |
|
65.33 |
% |
|
109.41 |
% |
|
97.12 |
% |
|
88.76 |
% |
|
51.15 |
% |
|
88.76 |
% |
| ACL to total loans |
0.85 |
% |
|
0.80 |
% |
|
0.81 |
% |
|
0.98 |
% |
|
1.04 |
% |
|
0.85 |
% |
|
1.04 |
% |
| Net charge-offs to average loans |
0.13 |
% |
|
0.03 |
% |
|
0.25 |
% |
|
0.05 |
% |
|
0.05 |
% |
|
0.47 |
% |
|
0.14 |
% |
|
|
|
|
|
|
|
|
|
|
|
|
|
|
| Capital: |
|
|
|
|
|
|
|
|
|
|
|
|
|
Tier 1 capital to average assets(4) |
12.64 |
% |
|
12.36 |
% |
|
12.01 |
% |
|
12.19 |
% |
|
13.00 |
% |
|
12.64 |
% |
|
13.00 |
% |
Tier 1 capital to risk-weighted assets(4) |
13.74 |
% |
|
12.90 |
% |
|
12.68 |
% |
|
12.52 |
% |
|
14.57 |
% |
|
13.74 |
% |
|
14.57 |
% |
Common equity tier 1 capital to risk-weighted assets(4) |
11.94 |
% |
|
11.18 |
% |
|
10.93 |
% |
|
10.77 |
% |
|
12.73 |
% |
|
11.94 |
% |
|
12.73 |
% |
| Total capital to risk-weighted assets |
16.75 |
% |
|
15.77 |
% |
|
15.59 |
% |
|
15.51 |
% |
|
17.66 |
% |
|
16.75 |
% |
|
17.66 |
% |
| Total equity to total assets |
16.17 |
% |
|
15.19 |
% |
|
14.74 |
% |
|
14.70 |
% |
|
16.67 |
% |
|
16.17 |
% |
|
16.67 |
% |
Tangible common stockholders' equity to tangible assets(1) |
11.04 |
% |
|
10.21 |
% |
|
9.75 |
% |
|
9.63 |
% |
|
11.41 |
% |
|
11.04 |
% |
|
11.41 |
% |
|
|
|
|
|
|
|
|
|
|
|
|
|
|
| Per Share Amounts: |
|
|
|
|
|
|
|
|
|
|
|
|
|
| Book value per share |
$ |
35.16 |
|
|
$ |
34.58 |
|
|
$ |
33.88 |
|
|
$ |
33.47 |
|
|
$ |
35.09 |
|
|
$ |
35.16 |
|
|
$ |
35.09 |
|
Tangible book value per share (1) |
$ |
24.12 |
|
|
$ |
23.41 |
|
|
$ |
22.58 |
|
|
$ |
22.09 |
|
|
$ |
24.04 |
|
|
$ |
24.12 |
|
|
$ |
24.04 |
|
| Basic earnings per common share |
$ |
0.38 |
|
|
$ |
0.52 |
|
|
$ |
0.30 |
|
|
$ |
0.44 |
|
|
$ |
0.69 |
|
|
$ |
1.63 |
|
|
$ |
4.06 |
|
| Diluted earnings per common share |
$ |
0.37 |
|
|
$ |
0.51 |
|
|
$ |
0.29 |
|
|
$ |
0.43 |
|
|
$ |
0.67 |
|
|
$ |
1.61 |
|
|
$ |
3.96 |
|
|
|
|
|
|
|
|
|
|
|
|
|
|
|
| Shares outstanding end of period |
23,302,414 |
|
|
23,291,693 |
|
|
23,269,885 |
|
|
23,370,515 |
|
|
24,053,585 |
|
|
23,302,414 |
|
|
24,053,585 |
|
Unaudited consolidated balance sheet as of:
|
|
|
|
|
|
|
|
|
|
|
|
|
|
|
|
|
|
|
|
|
|
|
|
|
|
|
|
|
|
| (Dollars in thousands) |
December 31,
2023 |
|
September 30,
2023 |
|
June 30,
2023 |
|
March 31,
2023 |
|
December 31,
2022 |
| ASSETS |
|
|
|
|
|
|
|
|
|
| Total cash and cash equivalents |
$ |
286,635 |
|
|
$ |
337,583 |
|
|
$ |
417,375 |
|
|
$ |
417,715 |
|
|
$ |
408,182 |
|
| Securities - available for sale |
299,644 |
|
|
292,324 |
|
|
303,779 |
|
|
317,097 |
|
|
254,504 |
|
| Securities - held to maturity, net |
2,977 |
|
|
3,311 |
|
|
3,380 |
|
|
3,868 |
|
|
4,077 |
|
| Equity securities with readily determinable fair value |
4,488 |
|
|
4,289 |
|
|
4,426 |
|
|
4,498 |
|
|
5,191 |
|
| Loans held for sale |
1,236 |
|
|
6,416 |
|
|
95 |
|
|
3,954 |
|
|
5,641 |
|
| Loans held for investment |
4,163,100 |
|
|
4,371,528 |
|
|
4,324,758 |
|
|
4,310,006 |
|
|
4,120,291 |
|
| Allowance for credit losses |
(35,219) |
|
|
(34,815) |
|
|
(34,970) |
|
|
(42,245) |
|
|
(42,807) |
|
| Loans, net |
4,127,881 |
|
|
4,336,713 |
|
|
4,289,788 |
|
|
4,267,761 |
|
|
4,077,484 |
|
|
|
|
|
|
|
|
|
|
|
| FHLB and other restricted stock |
14,278 |
|
|
10,101 |
|
|
20,099 |
|
|
24,506 |
|
|
6,252 |
|
| Premises and equipment, net |
113,457 |
|
|
113,062 |
|
|
114,673 |
|
|
115,639 |
|
|
103,339 |
|
| Other real estate owned ("OREO"), net |
37 |
|
|
— |
|
|
— |
|
|
— |
|
|
— |
|
| Goodwill and intangible assets, net |
257,355 |
|
|
260,109 |
|
|
262,958 |
|
|
265,959 |
|
|
265,767 |
|
| Bank-owned life insurance |
41,946 |
|
|
41,822 |
|
|
41,702 |
|
|
41,594 |
|
|
41,493 |
|
| Deferred tax asset, net |
8,800 |
|
|
9,594 |
|
|
7,306 |
|
|
11,562 |
|
|
16,473 |
|
| Other assets |
188,600 |
|
|
184,470 |
|
|
187,140 |
|
|
154,032 |
|
|
145,380 |
|
| Total assets |
$ |
5,347,334 |
|
|
$ |
5,599,794 |
|
|
$ |
5,652,721 |
|
|
$ |
5,628,185 |
|
|
$ |
5,333,783 |
|
| LIABILITIES |
|
|
|
|
|
|
|
|
|
| Noninterest bearing deposits |
$ |
1,632,022 |
|
|
$ |
1,632,559 |
|
|
$ |
1,608,411 |
|
|
$ |
1,727,749 |
|
|
$ |
1,756,680 |
|
| Interest bearing deposits |
2,345,456 |
|
|
2,854,492 |
|
|
2,685,055 |
|
|
2,311,245 |
|
|
2,414,656 |
|
| Total deposits |
3,977,478 |
|
|
4,487,051 |
|
|
4,293,466 |
|
|
4,038,994 |
|
|
4,171,336 |
|
|
|
|
|
|
|
|
|
|
|
| Customer repurchase agreements |
— |
|
|
— |
|
|
— |
|
|
3,208 |
|
|
340 |
|
| Federal Home Loan Bank advances |
255,000 |
|
|
30,000 |
|
|
280,000 |
|
|
530,000 |
|
|
30,000 |
|
| Subordinated notes |
108,678 |
|
|
108,454 |
|
|
108,234 |
|
|
108,016 |
|
|
107,800 |
|
| Junior subordinated debentures |
41,740 |
|
|
41,592 |
|
|
41,444 |
|
|
41,299 |
|
|
41,158 |
|
| Other liabilities |
100,038 |
|
|
82,315 |
|
|
96,111 |
|
|
79,452 |
|
|
94,178 |
|
| Total liabilities |
4,482,934 |
|
|
4,749,412 |
|
|
4,819,255 |
|
|
4,800,969 |
|
|
4,444,812 |
|
| EQUITY |
|
|
|
|
|
|
|
|
|
| Preferred Stock |
45,000 |
|
|
45,000 |
|
|
45,000 |
|
|
45,000 |
|
|
45,000 |
|
| Common stock |
290 |
|
|
290 |
|
|
289 |
|
|
287 |
|
|
283 |
|
| Additional paid-in-capital |
550,743 |
|
|
547,212 |
|
|
542,565 |
|
|
539,241 |
|
|
534,790 |
|
| Treasury stock, at cost |
(265,038) |
|
|
(265,016) |
|
|
(264,916) |
|
|
(260,453) |
|
|
(182,658) |
|
| Retained earnings |
536,331 |
|
|
527,506 |
|
|
515,513 |
|
|
508,665 |
|
|
498,456 |
|
| Accumulated other comprehensive income (loss) |
(2,926) |
|
|
(4,610) |
|
|
(4,985) |
|
|
(5,524) |
|
|
(6,900) |
|
| Total stockholders' equity |
864,400 |
|
|
850,382 |
|
|
833,466 |
|
|
827,216 |
|
|
888,971 |
|
| Total liabilities and equity |
$ |
5,347,334 |
|
|
$ |
5,599,794 |
|
|
$ |
5,652,721 |
|
|
$ |
5,628,185 |
|
|
$ |
5,333,783 |
|
Unaudited consolidated statement of income:
|
|
|
|
|
|
|
|
|
|
|
|
|
|
|
|
|
|
|
|
|
|
|
|
|
|
|
|
|
|
|
|
|
|
|
|
|
|
|
|
|
|
|
For the Three Months Ended |
|
For the Year Ended |
| (Dollars in thousands) |
December 31,
2023 |
|
September 30,
2023 |
|
June 30,
2023 |
|
March 31,
2023 |
|
December 31,
2022 |
|
December 31,
2023 |
|
December 31,
2022 |
| Interest income: |
|
|
|
|
|
|
|
|
|
|
|
|
|
| Loans, including fees |
$ |
58,963 |
|
|
$ |
59,669 |
|
|
$ |
57,258 |
|
|
$ |
52,538 |
|
|
$ |
51,282 |
|
|
$ |
228,428 |
|
|
$ |
181,188 |
|
| Factored receivables, including fees |
40,723 |
|
|
39,161 |
|
|
39,819 |
|
|
40,904 |
|
|
48,644 |
|
|
160,607 |
|
|
223,193 |
|
| Securities |
5,243 |
|
|
5,205 |
|
|
5,234 |
|
|
4,113 |
|
|
3,372 |
|
|
19,795 |
|
|
8,187 |
|
| FHLB and other restricted stock |
289 |
|
|
397 |
|
|
219 |
|
|
125 |
|
|
83 |
|
|
1,030 |
|
|
258 |
|
| Cash deposits |
3,510 |
|
|
3,101 |
|
|
2,956 |
|
|
2,994 |
|
|
2,891 |
|
|
12,561 |
|
|
6,413 |
|
| Total interest income |
108,728 |
|
|
107,533 |
|
|
105,486 |
|
|
100,674 |
|
|
106,272 |
|
|
422,421 |
|
|
419,239 |
|
| Interest expense: |
|
|
|
|
|
|
|
|
|
|
|
|
|
| Deposits |
11,765 |
|
|
12,474 |
|
|
6,877 |
|
|
3,202 |
|
|
3,028 |
|
|
34,318 |
|
|
10,038 |
|
| Subordinated notes |
1,317 |
|
|
1,315 |
|
|
1,312 |
|
|
1,309 |
|
|
1,307 |
|
|
5,253 |
|
|
5,212 |
|
| Junior subordinated debentures |
1,156 |
|
|
1,169 |
|
|
1,090 |
|
|
1,034 |
|
|
926 |
|
|
4,449 |
|
|
2,662 |
|
| Other borrowings |
2,571 |
|
|
1,248 |
|
|
4,756 |
|
|
1,747 |
|
|
296 |
|
|
10,322 |
|
|
835 |
|
| Total interest expense |
16,809 |
|
|
16,206 |
|
|
14,035 |
|
|
7,292 |
|
|
5,557 |
|
|
54,342 |
|
|
18,747 |
|
| Net interest income |
91,919 |
|
|
91,327 |
|
|
91,451 |
|
|
93,382 |
|
|
100,715 |
|
|
368,079 |
|
|
400,492 |
|
| Credit loss expense (benefit) |
6,135 |
|
|
812 |
|
|
2,643 |
|
|
2,613 |
|
|
877 |
|
|
12,203 |
|
|
6,925 |
|
| Net interest income after credit loss expense (benefit) |
85,784 |
|
|
90,515 |
|
|
88,808 |
|
|
90,769 |
|
|
99,838 |
|
|
355,876 |
|
|
393,567 |
|
| Noninterest income: |
|
|
|
|
|
|
|
|
|
|
|
|
|
| Service charges on deposits |
1,791 |
|
|
1,728 |
|
|
1,769 |
|
|
1,713 |
|
|
1,659 |
|
|
7,001 |
|
|
6,844 |
|
| Card income |
2,029 |
|
|
2,065 |
|
|
2,119 |
|
|
1,968 |
|
|
2,025 |
|
|
8,181 |
|
|
8,150 |
|
| Net OREO gains (losses) and valuation adjustments |
— |
|
|
— |
|
|
— |
|
|
— |
|
|
— |
|
|
— |
|
|
(133) |
|
| Net gains (losses) on sale of securities |
97 |
|
|
5 |
|
|
— |
|
|
— |
|
|
(2) |
|
|
102 |
|
|
2,512 |
|
| Net gains (losses) on sale of loans |
(87) |
|
|
203 |
|
|
87 |
|
|
(84) |
|
|
(82) |
|
|
119 |
|
|
18,228 |
|
| Fee income |
8,525 |
|
|
8,108 |
|
|
7,462 |
|
|
6,150 |
|
|
6,126 |
|
|
30,245 |
|
|
24,222 |
|
| Insurance commissions |
1,058 |
|
|
1,074 |
|
|
1,303 |
|
|
1,593 |
|
|
936 |
|
|
5,028 |
|
|
5,145 |
|
|
|
|
|
|
|
|
|
|
|
|
|
|
|
| Other |
817 |
|
|
227 |
|
|
(1,229) |
|
|
(318) |
|
|
1,457 |
|
|
(503) |
|
|
19,100 |
|
| Total noninterest income |
14,230 |
|
|
13,410 |
|
|
11,511 |
|
|
11,022 |
|
|
12,119 |
|
|
50,173 |
|
|
84,068 |
|
| Noninterest expense: |
|
|
|
|
|
|
|
|
|
|
|
|
|
| Salaries and employee benefits |
50,818 |
|
|
50,884 |
|
|
54,219 |
|
|
54,686 |
|
|
51,639 |
|
|
210,607 |
|
|
201,487 |
|
| Occupancy, furniture and equipment |
7,348 |
|
|
7,542 |
|
|
7,292 |
|
|
6,703 |
|
|
7,005 |
|
|
28,885 |
|
|
26,774 |
|
| FDIC insurance and other regulatory assessments |
656 |
|
|
682 |
|
|
868 |
|
|
418 |
|
|
439 |
|
|
2,624 |
|
|
1,815 |
|
| Professional fees |
3,116 |
|
|
3,941 |
|
|
3,035 |
|
|
3,085 |
|
|
4,115 |
|
|
13,177 |
|
|
15,644 |
|
| Amortization of intangible assets |
2,754 |
|
|
2,849 |
|
|
3,001 |
|
|
2,850 |
|
|
2,837 |
|
|
11,454 |
|
|
11,922 |
|
| Advertising and promotion |
1,901 |
|
|
1,839 |
|
|
1,629 |
|
|
1,371 |
|
|
2,730 |
|
|
6,740 |
|
|
7,760 |
|
| Communications and technology |
11,645 |
|
|
10,784 |
|
|
11,904 |
|
|
11,346 |
|
|
9,886 |
|
|
45,679 |
|
|
42,083 |
|
| Other |
9,060 |
|
|
7,738 |
|
|
8,448 |
|
|
8,822 |
|
|
8,120 |
|
|
34,068 |
|
|
33,146 |
|
| Total noninterest expense |
87,298 |
|
|
86,259 |
|
|
90,396 |
|
|
89,281 |
|
|
86,771 |
|
|
353,234 |
|
|
340,631 |
|
| Net income before income tax |
12,716 |
|
|
17,666 |
|
|
9,923 |
|
|
12,510 |
|
|
25,186 |
|
|
52,815 |
|
|
137,004 |
|
| Income tax expense |
3,089 |
|
|
4,872 |
|
|
2,273 |
|
|
1,500 |
|
|
7,625 |
|
|
11,734 |
|
|
34,693 |
|
| Net income |
$ |
9,627 |
|
|
$ |
12,794 |
|
|
$ |
7,650 |
|
|
$ |
11,010 |
|
|
$ |
17,561 |
|
|
$ |
41,081 |
|
|
$ |
102,311 |
|
| Dividends on preferred stock |
(802) |
|
|
(801) |
|
|
(802) |
|
|
(801) |
|
|
(802) |
|
|
(3,206) |
|
|
(3,206) |
|
| Net income available to common stockholders |
$ |
8,825 |
|
|
$ |
11,993 |
|
|
$ |
6,848 |
|
|
$ |
10,209 |
|
|
$ |
16,759 |
|
|
$ |
37,875 |
|
|
$ |
99,105 |
|
Earnings per share:
|
|
|
|
|
|
|
|
|
|
|
|
|
|
|
|
|
|
|
|
|
|
|
|
|
|
|
|
|
|
|
|
|
|
|
|
|
|
|
|
|
|
|
For the Three Months Ended |
|
Year Ended |
| (Dollars in thousands) |
December 31,
2023 |
|
September 30,
2023 |
|
June 30,
2023 |
|
March 31,
2023 |
|
December 31,
2022 |
|
December 31,
2023 |
|
December 31,
2022 |
| Basic |
|
|
|
|
|
|
|
|
|
|
|
|
|
| Net income to common stockholders |
$ |
8,825 |
|
|
$ |
11,993 |
|
|
$ |
6,848 |
|
|
$ |
10,209 |
|
|
$ |
16,759 |
|
|
$ |
37,875 |
|
|
$ |
99,105 |
|
| Weighted average common shares outstanding |
23,171,751 |
|
|
23,162,614 |
|
|
23,138,835 |
|
|
23,361,732 |
|
|
24,129,560 |
|
|
23,208,086 |
|
|
24,393,954 |
|
| Basic earnings per common share |
$ |
0.38 |
|
|
$ |
0.52 |
|
|
$ |
0.30 |
|
|
$ |
0.44 |
|
|
$ |
0.69 |
|
|
$ |
1.63 |
|
|
$ |
4.06 |
|
|
|
|
|
|
|
|
|
|
|
|
|
|
|
| Diluted |
|
|
|
|
|
|
|
|
|
|
|
|
|
| Net income to common stockholders - diluted |
$ |
8,825 |
|
|
$ |
11,993 |
|
|
$ |
6,848 |
|
|
$ |
10,209 |
|
|
$ |
16,759 |
|
|
$ |
37,875 |
|
|
$ |
99,105 |
|
| Weighted average common shares outstanding |
23,171,751 |
|
|
23,162,614 |
|
|
23,138,835 |
|
|
23,361,732 |
|
|
24,129,560 |
|
|
23,208,086 |
|
|
24,393,954 |
|
| Dilutive effects of: |
|
|
|
|
|
|
|
|
|
|
|
|
|
| Assumed exercises of stock options |
82,463 |
|
|
82,909 |
|
|
71,658 |
|
|
76,129 |
|
|
72,183 |
|
|
78,679 |
|
|
90,841 |
|
| Restricted stock awards |
90,912 |
|
|
80,841 |
|
|
90,645 |
|
|
140,006 |
|
|
120,328 |
|
|
98,408 |
|
|
148,630 |
|
| Restricted stock units |
107,933 |
|
|
84,137 |
|
|
65,909 |
|
|
116,754 |
|
|
95,465 |
|
|
91,454 |
|
|
98,139 |
|
| Performance stock units - market based |
83,821 |
|
|
47,248 |
|
|
87,360 |
|
|
121,047 |
|
|
115,744 |
|
|
84,869 |
|
|
122,123 |
|
| Performance stock units - performance based |
— |
|
|
— |
|
|
— |
|
|
— |
|
|
341,732 |
|
|
— |
|
|
167,187 |
|
| Employee stock purchase plan |
798 |
|
|
1,165 |
|
|
1,064 |
|
|
496 |
|
|
4,042 |
|
|
881 |
|
|
2,694 |
|
| Weighted average shares outstanding - diluted |
23,537,678 |
|
|
23,458,914 |
|
|
23,455,471 |
|
|
23,816,164 |
|
|
24,879,054 |
|
|
23,562,377 |
|
|
25,023,568 |
|
| Diluted earnings per common share |
$ |
0.37 |
|
|
$ |
0.51 |
|
|
$ |
0.29 |
|
|
$ |
0.43 |
|
|
$ |
0.67 |
|
|
$ |
1.61 |
|
|
$ |
3.96 |
|
Shares that were not considered in computing diluted earnings per common share because they were antidilutive or have not met the thresholds to be considered in the dilutive calculation are as follows:
|
|
|
|
|
|
|
|
|
|
|
|
|
|
|
|
|
|
|
|
|
|
|
|
|
|
|
|
|
|
|
|
|
|
|
|
|
|
|
|
|
|
|
For the Three Months Ended |
|
Year Ended |
|
December 31,
2023 |
|
September 30,
2023 |
|
June 30,
2023 |
|
March 31,
2023 |
|
December 31,
2022 |
|
December 31,
2023 |
|
December 31,
2022 |
| Stock options |
100,818 |
|
|
101,138 |
|
|
107,309 |
|
|
49,379 |
|
|
49,379 |
|
|
100,818 |
|
|
49,379 |
|
| Restricted stock awards |
— |
|
|
— |
|
|
4,232 |
|
|
— |
|
|
6,348 |
|
|
— |
|
|
6,348 |
|
| Restricted stock units |
7,500 |
|
|
11,250 |
|
|
11,250 |
|
|
11,250 |
|
|
11,250 |
|
|
7,500 |
|
|
11,250 |
|
| Performance stock units - market based |
12,020 |
|
|
14,424 |
|
|
42,056 |
|
|
42,056 |
|
|
45,296 |
|
|
12,020 |
|
|
45,296 |
|
| Performance stock units - performance based |
— |
|
|
— |
|
|
— |
|
|
— |
|
|
— |
|
|
— |
|
|
— |
|
| Employee stock purchase plan |
— |
|
|
— |
|
|
— |
|
|
— |
|
|
— |
|
|
— |
|
|
— |
|
| Accelerated share repurchase |
— |
|
|
— |
|
|
— |
|
|
203,352 |
|
|
— |
|
|
— |
|
|
— |
|
Loans held for investment summarized as of:
|
|
|
|
|
|
|
|
|
|
|
|
|
|
|
|
|
|
|
|
|
|
|
|
|
|
|
|
|
|
| (Dollars in thousands) |
December 31,
2023 |
|
September 30,
2023 |
|
June 30,
2023 |
|
March 31,
2023 |
|
December 31,
2022 |
| Commercial real estate |
$ |
812,704 |
|
|
$ |
817,064 |
|
|
$ |
768,711 |
|
|
$ |
695,160 |
|
|
$ |
678,144 |
|
| Construction, land development, land |
136,720 |
|
|
131,862 |
|
|
110,071 |
|
|
98,311 |
|
|
90,976 |
|
| 1-4 family residential properties |
125,916 |
|
|
129,588 |
|
|
130,628 |
|
|
132,010 |
|
|
125,981 |
|
| Farmland |
63,568 |
|
|
62,698 |
|
|
67,913 |
|
|
67,596 |
|
|
68,934 |
|
| Commercial |
1,170,365 |
|
|
1,251,939 |
|
|
1,218,892 |
|
|
1,239,952 |
|
|
1,251,110 |
|
| Factored receivables |
1,116,654 |
|
|
1,213,702 |
|
|
1,173,794 |
|
|
1,178,104 |
|
|
1,237,449 |
|
| Consumer |
8,326 |
|
|
8,166 |
|
|
8,409 |
|
|
8,913 |
|
|
8,868 |
|
| Mortgage warehouse |
728,847 |
|
|
756,509 |
|
|
846,340 |
|
|
889,960 |
|
|
658,829 |
|
| Total loans |
$ |
4,163,100 |
|
|
$ |
4,371,528 |
|
|
$ |
4,324,758 |
|
|
$ |
4,310,006 |
|
|
$ |
4,120,291 |
|
Our banking loan portfolio consists of traditional community bank loans as well as commercial finance product lines focused on businesses that require specialized financial solutions and national lending product lines that further diversify our lending operations.
Banking loans held for investment are further summarized below:
|
|
|
|
|
|
|
|
|
|
|
|
|
|
|
|
|
|
|
|
|
|
|
|
|
|
|
|
|
|
| (Dollars in thousands) |
December 31,
2023 |
|
September 30,
2023 |
|
June 30,
2023 |
|
March 31,
2023 |
|
December 31,
2022 |
| Commercial real estate |
$ |
812,704 |
|
|
$ |
817,064 |
|
|
$ |
768,711 |
|
|
$ |
695,160 |
|
|
$ |
678,144 |
|
| Construction, land development, land |
136,720 |
|
|
131,862 |
|
|
110,071 |
|
|
98,311 |
|
|
90,976 |
|
| 1-4 family residential |
125,916 |
|
|
129,588 |
|
|
130,628 |
|
|
132,010 |
|
|
125,981 |
|
| Farmland |
63,568 |
|
|
62,698 |
|
|
67,913 |
|
|
67,596 |
|
|
68,934 |
|
| Commercial - General |
303,332 |
|
|
306,430 |
|
|
295,204 |
|
|
320,030 |
|
|
316,419 |
|
| Commercial - Agriculture |
47,059 |
|
|
49,479 |
|
|
46,839 |
|
|
38,637 |
|
|
48,494 |
|
| Commercial - Equipment |
460,008 |
|
|
486,110 |
|
|
493,763 |
|
|
483,911 |
|
|
454,117 |
|
| Commercial - Asset-based lending |
246,065 |
|
|
271,623 |
|
|
231,265 |
|
|
230,326 |
|
|
229,754 |
|
| Commercial - Liquid Credit |
113,901 |
|
|
138,297 |
|
|
151,821 |
|
|
167,048 |
|
|
202,326 |
|
| Consumer |
8,326 |
|
|
8,166 |
|
|
8,409 |
|
|
8,913 |
|
|
8,868 |
|
| Mortgage Warehouse |
728,847 |
|
|
756,509 |
|
|
846,340 |
|
|
889,960 |
|
|
658,829 |
|
| Total banking loans held for investment |
$ |
3,046,446 |
|
|
$ |
3,157,826 |
|
|
$ |
3,150,964 |
|
|
$ |
3,131,902 |
|
|
$ |
2,882,842 |
|
The following table presents the Company’s operating segments:
|
|
|
|
|
|
|
|
|
|
|
|
|
|
|
|
|
|
|
|
|
|
|
|
|
|
|
|
|
|
|
|
|
| (Dollars in thousands) |
|
|
|
|
|
|
|
|
|
|
| Three months ended December 31, 2023 |
|
Banking |
|
Factoring |
|
Payments |
|
Corporate |
|
Consolidated |
| Total interest income |
|
$ |
67,961 |
|
|
$ |
35,448 |
|
|
$ |
5,275 |
|
|
$ |
44 |
|
|
$ |
108,728 |
|
| Intersegment interest allocations |
|
8,030 |
|
|
(9,981) |
|
|
1,951 |
|
|
— |
|
|
— |
|
| Total interest expense |
|
14,335 |
|
|
— |
|
|
— |
|
|
2,474 |
|
|
16,809 |
|
| Net interest income (expense) |
|
61,656 |
|
|
25,467 |
|
|
7,226 |
|
|
(2,430) |
|
|
91,919 |
|
| Credit loss expense (benefit) |
|
5,334 |
|
|
495 |
|
|
5 |
|
|
301 |
|
|
6,135 |
|
| Net interest income after credit loss expense |
|
56,322 |
|
|
24,972 |
|
|
7,221 |
|
|
(2,731) |
|
|
85,784 |
|
| Noninterest income |
|
5,966 |
|
|
2,725 |
|
|
5,444 |
|
|
95 |
|
|
14,230 |
|
| Noninterest expense |
|
32,036 |
|
|
19,254 |
|
|
14,783 |
|
|
21,225 |
|
|
87,298 |
|
Net intersegment noninterest income (expense)(1) |
|
— |
|
|
243 |
|
|
(243) |
|
|
— |
|
|
— |
|
| Operating income (loss) |
|
$ |
30,252 |
|
|
$ |
8,686 |
|
|
$ |
(2,361) |
|
|
$ |
(23,861) |
|
|
$ |
12,716 |
|
|
|
|
|
|
|
|
|
|
|
|
|
|
|
|
|
|
|
|
|
|
|
|
|
|
|
|
|
|
|
|
|
|
| (Dollars in thousands) |
|
|
|
|
|
|
|
|
|
|
| Three months ended September 30, 2023 |
|
Banking |
|
Factoring |
|
Payments |
|
Corporate |
|
Consolidated |
| Total interest income |
|
$ |
68,328 |
|
|
$ |
34,244 |
|
|
$ |
4,917 |
|
|
$ |
44 |
|
|
$ |
107,533 |
|
| Intersegment interest allocations |
|
8,330 |
|
|
(9,664) |
|
|
1,334 |
|
|
— |
|
|
— |
|
| Total interest expense |
|
13,723 |
|
|
— |
|
|
— |
|
|
2,483 |
|
|
16,206 |
|
| Net interest income (expense) |
|
62,935 |
|
|
24,580 |
|
|
6,251 |
|
|
(2,439) |
|
|
91,327 |
|
| Credit loss expense (benefit) |
|
410 |
|
|
375 |
|
|
14 |
|
|
13 |
|
|
812 |
|
| Net interest income after credit loss expense |
|
62,525 |
|
|
24,205 |
|
|
6,237 |
|
|
(2,452) |
|
|
90,515 |
|
| Noninterest income |
|
5,978 |
|
|
2,546 |
|
|
4,817 |
|
|
69 |
|
|
13,410 |
|
| Noninterest expense |
|
31,503 |
|
|
18,371 |
|
|
14,556 |
|
|
21,829 |
|
|
86,259 |
|
Intersegment noninterest income (expense)(1) |
|
— |
|
|
242 |
|
|
(242) |
|
|
— |
|
|
— |
|
| Operating income (loss) |
|
$ |
37,000 |
|
|
$ |
8,622 |
|
|
$ |
(3,744) |
|
|
$ |
(24,212) |
|
|
$ |
17,666 |
|
(1) Intersegment noninterest income (expense) includes:
|
|
|
|
|
|
|
|
|
|
|
|
|
|
|
| (Dollars in thousands) |
|
Factoring |
|
Payments |
| Three Months Ended December 31, 2023 |
|
|
|
|
| Factoring revenue received from Payments |
|
$ |
510 |
|
|
$ |
(510) |
|
| Payments revenue received from Factoring |
|
(267) |
|
|
267 |
|
| Intersegment noninterest income (expense) |
|
$ |
243 |
|
|
$ |
(243) |
|
|
|
|
|
|
| Three Months Ended September 30, 2023 |
|
|
|
|
| Factoring revenue received from Payments |
|
$ |
510 |
|
|
$ |
(510) |
|
| Payments revenue received from Factoring |
|
(268) |
|
|
268 |
|
| Intersegment noninterest income (expense) |
|
$ |
242 |
|
|
$ |
(242) |
|
Information pertaining to our factoring segment, which includes only factoring originated by our Triumph Financial Services, LLC subsidiary, summarized as of and for the quarters ended:
|
|
|
|
|
|
|
|
|
|
|
|
|
|
|
|
|
|
|
|
|
|
|
|
|
|
|
|
|
|
|
|
|
| Factoring |
|
December 31,
2023 |
|
September 30,
2023 |
|
June 30,
2023 |
|
March 31,
2023 |
|
December 31,
2022 |
| Factored receivable period end balance |
|
$ |
941,926,000 |
|
|
$ |
1,041,448,000 |
|
|
$ |
997,842,000 |
|
|
$ |
1,096,071,000 |
|
|
$ |
1,151,727,000 |
|
| Yield on average receivable balance |
|
13.71 |
% |
|
13.59 |
% |
|
14.07 |
% |
|
13.94 |
% |
|
13.85 |
% |
Current quarter charge-off rate(1) |
|
0.12 |
% |
|
0.12 |
% |
|
0.54 |
% |
|
0.19 |
% |
|
0.14 |
% |
| Factored receivables - transportation concentration |
|
96 |
% |
|
96 |
% |
|
95 |
% |
|
95 |
% |
|
96 |
% |
|
|
|
|
|
|
|
|
|
|
|
| Interest income, including fees |
|
$ |
35,448,000 |
|
|
$ |
34,244,000 |
|
|
$ |
36,368,000 |
|
|
$ |
38,157,000 |
|
|
$ |
45,325,000 |
|
| Noninterest income |
|
2,725,000 |
|
|
2,546,000 |
|
|
980,000 |
|
|
1,578,000 |
|
|
1,939,000 |
|
| Intersegment noninterest income |
|
510,000 |
|
|
510,000 |
|
|
170,000 |
|
|
— |
|
|
— |
|
| Factored receivable total revenue |
|
38,683,000 |
|
|
37,300,000 |
|
|
37,518,000 |
|
|
39,735,000 |
|
|
47,264,000 |
|
| Average net funds employed |
|
927,996,000 |
|
|
898,989,000 |
|
|
918,439,000 |
|
|
976,216,000 |
|
|
1,148,595,000 |
|
| Yield on average net funds employed |
|
16.54 |
% |
|
16.46 |
% |
|
16.38 |
% |
|
16.51 |
% |
|
16.33 |
% |
|
|
|
|
|
|
|
|
|
|
|
| Accounts receivable purchased |
|
$ |
2,570,442,000 |
|
|
$ |
2,606,323,000 |
|
|
$ |
2,732,976,000 |
|
|
$ |
2,927,104,000 |
|
|
$ |
3,277,986,000 |
|
| Number of invoices purchased |
|
1,404,861 |
|
|
1,428,463 |
|
|
1,494,963 |
|
|
1,491,763 |
|
|
1,596,843 |
|
| Average invoice size |
|
$ |
1,830 |
|
|
$ |
1,825 |
|
|
$ |
1,828 |
|
|
$ |
1,962 |
|
|
$ |
2,053 |
|
| Average invoice size - transportation |
|
$ |
1,781 |
|
|
$ |
1,772 |
|
|
$ |
1,773 |
|
|
$ |
1,911 |
|
|
$ |
2,002 |
|
| Average invoice size - non-transportation |
|
$ |
5,858 |
|
|
$ |
5,631 |
|
|
$ |
5,790 |
|
|
$ |
5,205 |
|
|
$ |
6,083 |
|
Metrics above include assets and deposits held for sale.
(1)June 30, 2023 includes a $3.3 million charge-off of an over-formula advance balance, which contributed approximately 0.32% to the net charge-off rate for the quarter. In accordance with the agreement reached with Covenant, Covenant has reimbursed us for $1.7 million of this charge-off.
Information pertaining to our Payments segment, which includes only our TriumphPay division, summarized as of and for the quarters ended:
|
|
|
|
|
|
|
|
|
|
|
|
|
|
|
|
|
|
|
|
|
|
|
|
|
|
|
|
|
|
|
|
|
| Payments |
|
December 31,
2023 |
|
September 30,
2023 |
|
June 30,
2023 |
|
March 31,
2023 |
|
December 31,
2022 |
| Supply chain financing factored receivables |
|
$ |
100,382,000 |
|
|
$ |
87,590,000 |
|
|
$ |
93,751,000 |
|
|
$ |
132,000 |
|
|
$ |
118,000 |
|
| Quickpay and other factored receivables |
|
74,346,000 |
|
|
84,664,000 |
|
|
82,201,000 |
|
|
81,901,000 |
|
|
85,604,000 |
|
| Total factored receivable period end balance |
|
$ |
174,728,000 |
|
|
$ |
172,254,000 |
|
|
$ |
175,952,000 |
|
|
$ |
82,033,000 |
|
|
$ |
85,722,000 |
|
|
|
|
|
|
|
|
|
|
|
|
| Total revenue |
|
|
|
|
|
|
|
|
|
|
| Supply chain finance interest income |
|
$ |
2,476,000 |
|
|
$ |
2,316,000 |
|
|
$ |
820,000 |
|
|
$ |
1,000 |
|
|
$ |
246,000 |
|
| Quickpay interest income |
|
2,799,000 |
|
|
2,601,000 |
|
|
2,631,000 |
|
|
2,746,000 |
|
|
3,073,000 |
|
| Intersegment interest income allocation |
|
1,951,000 |
|
|
1,334,000 |
|
|
1,880,000 |
|
|
1,542,000 |
|
|
311,000 |
|
| Total interest income |
|
7,226,000 |
|
|
6,251,000 |
|
|
5,331,000 |
|
|
4,289,000 |
|
|
3,630,000 |
|
| Broker noninterest income |
|
3,880,000 |
|
|
3,372,000 |
|
|
2,607,000 |
|
|
2,356,000 |
|
|
2,297,000 |
|
| Factor noninterest income |
|
1,301,000 |
|
|
1,312,000 |
|
|
1,367,000 |
|
|
1,276,000 |
|
|
1,182,000 |
|
| Other noninterest income |
|
263,000 |
|
|
133,000 |
|
|
145,000 |
|
|
75,000 |
|
|
72,000 |
|
| Intersegment noninterest income |
|
267,000 |
|
|
268,000 |
|
|
267,000 |
|
|
265,000 |
|
|
— |
|
| Total noninterest income |
|
5,711,000 |
|
|
5,085,000 |
|
|
4,386,000 |
|
|
3,972,000 |
|
|
3,551,000 |
|
|
|
$ |
12,937,000 |
|
|
$ |
11,336,000 |
|
|
$ |
9,717,000 |
|
|
$ |
8,261,000 |
|
|
$ |
7,181,000 |
|
|
|
|
|
|
|
|
|
|
|
|
| Total expense |
|
|
|
|
|
|
|
|
|
|
|
|
|
|
|
|
|
|
|
|
|
| Credit loss expense (benefit) |
|
$ |
5,000 |
|
|
$ |
14,000 |
|
|
$ |
41,000 |
|
|
$ |
— |
|
|
$ |
(187,000) |
|
| Noninterest expense |
|
14,783,000 |
|
|
14,556,000 |
|
|
16,939,000 |
|
|
15,417,000 |
|
|
17,169,000 |
|
| Intersegment noninterest expense |
|
510,000 |
|
|
510,000 |
|
|
170,000 |
|
|
— |
|
|
— |
|
|
|
$ |
15,298,000 |
|
|
$ |
15,080,000 |
|
|
$ |
17,150,000 |
|
|
$ |
15,417,000 |
|
|
$ |
16,982,000 |
|
|
|
|
|
|
|
|
|
|
|
|
| Pre-tax operating income (loss) |
|
$ |
(2,361,000) |
|
|
$ |
(3,744,000) |
|
|
$ |
(7,433,000) |
|
|
$ |
(7,156,000) |
|
|
$ |
(9,801,000) |
|
|
|
|
|
|
|
|
|
|
|
|
| Depreciation and software amortization expense |
|
694,000 |
|
|
358,000 |
|
|
368,000 |
|
|
193,000 |
|
|
178,000 |
|
| Intangible amortization expense |
|
1,703,000 |
|
|
1,703,000 |
|
|
1,729,000 |
|
|
1,548,000 |
|
|
1,451,000 |
|
Earnings (losses) before interest, taxes, depreciation, and amortization(1) |
|
$ |
36,000 |
|
|
$ |
(1,683,000) |
|
|
$ |
(5,336,000) |
|
|
$ |
(5,415,000) |
|
|
$ |
(8,172,000) |
|
|
|
|
|
|
|
|
|
|
|
|
|
|
|
|
|
|
|
|
|
|
|
|
|
|
|
|
|
|
|
|
|
|
| EBITDA Margin |
|
— |
% |
|
(15) |
% |
|
(55) |
% |
|
(66) |
% |
|
(114) |
% |
|
|
|
|
|
|
|
|
|
|
|
| Number of invoices processed |
|
5,703,740 |
|
5,037,841 |
|
4,526,629 |
|
4,260,654 |
|
4,605,020 |
| Amount of payments processed |
|
$6,217,323,000 |
|
$5,329,580,000 |
|
$4,940,317,000 |
|
$5,030,548,000 |
|
$5,577,014,000 |
| Network invoice volume |
|
442,353 |
|
303,300 |
|
181,904 |
|
159,353 |
|
157,004 |
| Network payment volume |
|
$740,048,000 |
|
$510,298,000 |
|
$299,948,000 |
|
$289,667,000 |
|
$301,366,000 |
(1)Earnings (losses) before interest, taxes, depreciation, and amortization ("EBITDA") is a non-GAAP financial measure used as a supplemental measure to evaluate the performance of our Payments segment.
Deposits summarized as of:
|
|
|
|
|
|
|
|
|
|
|
|
|
|
|
|
|
|
|
|
|
|
|
|
|
|
|
|
|
|
| (Dollars in thousands) |
December 31,
2023 |
|
September 30,
2023 |
|
June 30,
2023 |
|
March 31,
2023 |
|
December 31,
2022 |
| Non-interest bearing demand |
$ |
1,632,022 |
|
|
$ |
1,632,559 |
|
|
$ |
1,608,411 |
|
|
$ |
1,727,749 |
|
|
$ |
1,756,680 |
|
| Interest bearing demand |
757,455 |
|
|
795,246 |
|
|
778,972 |
|
|
818,382 |
|
|
856,512 |
|
| Individual retirement accounts |
52,195 |
|
|
55,296 |
|
|
57,575 |
|
|
62,030 |
|
|
68,125 |
|
| Money market |
568,772 |
|
|
540,235 |
|
|
569,318 |
|
|
488,064 |
|
|
508,534 |
|
| Savings |
555,047 |
|
|
542,985 |
|
|
524,210 |
|
|
535,796 |
|
|
551,780 |
|
| Certificates of deposit |
265,525 |
|
|
269,416 |
|
|
270,273 |
|
|
286,153 |
|
|
319,150 |
|
| Brokered time deposits |
146,458 |
|
|
451,273 |
|
|
484,666 |
|
|
120,820 |
|
|
110,555 |
|
| Other brokered deposits |
4 |
|
|
200,041 |
|
|
41 |
|
|
— |
|
|
— |
|
| Total deposits |
$ |
3,977,478 |
|
|
$ |
4,487,051 |
|
|
$ |
4,293,466 |
|
|
$ |
4,038,994 |
|
|
$ |
4,171,336 |
|
Net interest margin summarized for the three months ended:
|
|
|
|
|
|
|
|
|
|
|
|
|
|
|
|
|
|
|
|
|
|
|
|
|
|
|
|
|
|
|
|
|
|
|
|
|
December 31, 2023 |
|
September 30, 2023 |
| (Dollars in thousands) |
Average
Balance |
|
Interest |
|
Average
Rate(4)
|
|
Average
Balance |
|
Interest |
|
Average
Rate(4)
|
| Interest earning assets: |
|
|
|
|
|
|
|
|
|
|
|
| Interest earning cash balances |
$ |
252,519 |
|
|
$ |
3,510 |
|
|
5.51 |
% |
|
$ |
228,019 |
|
|
$ |
3,101 |
|
|
5.40 |
% |
| Taxable securities |
302,828 |
|
|
5,213 |
|
|
6.83 |
% |
|
305,665 |
|
|
5,173 |
|
|
6.71 |
% |
| Tax-exempt securities |
4,601 |
|
|
30 |
|
|
2.59 |
% |
|
4,901 |
|
|
32 |
|
|
2.59 |
% |
| FHLB and other restricted stock |
10,872 |
|
|
289 |
|
|
10.55 |
% |
|
19,552 |
|
|
397 |
|
|
8.06 |
% |
Loans(1) |
4,256,356 |
|
|
99,686 |
|
|
9.29 |
% |
|
4,282,822 |
|
|
98,830 |
|
|
9.16 |
% |
| Total interest earning assets |
$ |
4,827,176 |
|
|
$ |
108,728 |
|
|
8.94 |
% |
|
$ |
4,840,959 |
|
|
$ |
107,533 |
|
|
8.81 |
% |
| Non-interest earning assets: |
|
|
|
|
|
|
|
|
|
|
|
| Other assets |
651,531 |
|
|
|
|
|
|
631,041 |
|
|
|
|
|
| Total assets |
$ |
5,478,707 |
|
|
|
|
|
|
$ |
5,472,000 |
|
|
|
|
|
| Interest bearing liabilities: |
|
|
|
|
|
|
|
|
|
|
|
| Deposits: |
|
|
|
|
|
|
|
|
|
|
|
| Interest bearing demand |
$ |
768,894 |
|
|
$ |
893 |
|
|
0.46 |
% |
|
$ |
776,812 |
|
|
$ |
769 |
|
|
0.39 |
% |
| Individual retirement accounts |
53,546 |
|
|
146 |
|
|
1.08 |
% |
|
56,265 |
|
|
134 |
|
|
0.94 |
% |
| Money market |
549,123 |
|
|
3,408 |
|
|
2.46 |
% |
|
542,243 |
|
|
2,706 |
|
|
1.98 |
% |
| Savings |
560,264 |
|
|
1,187 |
|
|
0.84 |
% |
|
537,980 |
|
|
723 |
|
|
0.53 |
% |
| Certificates of deposit |
266,573 |
|
|
1,596 |
|
|
2.38 |
% |
|
270,535 |
|
|
1,256 |
|
|
1.84 |
% |
| Brokered time deposits |
328,474 |
|
|
4,445 |
|
|
5.37 |
% |
|
501,221 |
|
|
6,717 |
|
|
5.32 |
% |
| Other brokered deposits |
6,523 |
|
|
90 |
|
|
5.47 |
% |
|
12,231 |
|
|
169 |
|
|
5.48 |
% |
| Total interest bearing deposits |
2,533,397 |
|
|
11,765 |
|
|
1.84 |
% |
|
2,697,287 |
|
|
12,474 |
|
|
1.83 |
% |
| Federal Home Loan Bank advances |
185,163 |
|
|
2,571 |
|
|
5.51 |
% |
|
91,957 |
|
|
1,248 |
|
|
5.38 |
% |
| Subordinated notes |
108,555 |
|
|
1,317 |
|
|
4.81 |
% |
|
108,336 |
|
|
1,315 |
|
|
4.82 |
% |
| Junior subordinated debentures |
41,666 |
|
|
1,156 |
|
|
11.01 |
% |
|
41,520 |
|
|
1,169 |
|
|
11.17 |
% |
| Other borrowings |
5 |
|
|
— |
|
|
— |
% |
|
— |
|
|
— |
|
|
— |
% |
| Total interest bearing liabilities |
$ |
2,868,786 |
|
|
$ |
16,809 |
|
|
2.32 |
% |
|
$ |
2,939,100 |
|
|
$ |
16,206 |
|
|
2.19 |
% |
| Noninterest bearing liabilities and equity: |
|
|
|
|
|
|
|
|
|
|
|
| Non-interest bearing demand deposits |
1,662,559 |
|
|
|
|
|
|
1,615,697 |
|
|
|
|
|
| Other liabilities |
78,966 |
|
|
|
|
|
|
63,828 |
|
|
|
|
|
| Total equity |
868,396 |
|
|
|
|
|
|
853,375 |
|
|
|
|
|
| Total liabilities and equity |
$ |
5,478,707 |
|
|
|
|
|
|
$ |
5,472,000 |
|
|
|
|
|
| Net interest income |
|
|
$ |
91,919 |
|
|
|
|
|
|
$ |
91,327 |
|
|
|
Interest spread(2) |
|
|
|
|
6.62 |
% |
|
|
|
|
|
6.62 |
% |
Net interest margin(3) |
|
|
|
|
7.55 |
% |
|
|
|
|
|
7.48 |
% |
(1) Loan balance totals include respective nonaccrual assets.
(2) Net interest spread is the yield on average interest earning assets less the rate on interest bearing liabilities.
(3) Net interest margin is the ratio of net interest income to average interest earning assets.
(4) Average rates have been annualized.
Additional information pertaining to our loan portfolio, including loans held for investment and loans held for sale, summarized for the quarters ended:
|
|
|
|
|
|
|
|
|
|
|
|
|
|
|
|
|
|
|
|
|
|
|
|
|
|
|
|
|
|
| (Dollars in thousands) |
December 31,
2023 |
|
September 30,
2023 |
|
June 30,
2023 |
|
March 31,
2023 |
|
December 31,
2022 |
| Average Banking loans |
$ |
3,053,526 |
|
|
$ |
3,109,630 |
|
|
$ |
3,120,594 |
|
|
$ |
2,916,614 |
|
|
$ |
2,891,412 |
|
| Average Factoring receivables |
1,025,978 |
|
|
999,345 |
|
|
1,036,922 |
|
|
1,110,203 |
|
|
1,298,286 |
|
| Average Payments receivables |
176,852 |
|
|
173,847 |
|
|
104,654 |
|
|
83,312 |
|
|
105,101 |
|
| Average total loans |
$ |
4,256,356 |
|
|
$ |
4,282,822 |
|
|
$ |
4,262,170 |
|
|
$ |
4,110,129 |
|
|
$ |
4,294,799 |
|
| Banking yield |
7.66 |
% |
|
7.61 |
% |
|
7.36 |
% |
|
7.31 |
% |
|
7.04 |
% |
| Factoring yield |
13.71 |
% |
|
13.59 |
% |
|
14.07 |
% |
|
13.94 |
% |
|
13.85 |
% |
| Payments yield |
11.83 |
% |
|
11.22 |
% |
|
13.23 |
% |
|
13.37 |
% |
|
12.53 |
% |
| Total loan yield |
9.29 |
% |
|
9.16 |
% |
|
9.14 |
% |
|
9.22 |
% |
|
9.23 |
% |
Metrics and non-GAAP financial:
|
|
|
|
|
|
|
|
|
|
|
|
|
|
|
|
|
|
|
|
|
|
|
|
|
|
|
|
|
|
|
|
|
|
|
|
|
|
|
|
|
|
|
|
|
|
|
As of and for the Three Months Ended |
|
As of and for the Year Ended |
(Dollars in thousands,
except per share amounts) |
|
December 31,
2023 |
|
September 30,
2023 |
|
June 30,
2023 |
|
March 31,
2023 |
|
December 31,
2022 |
|
December 31,
2023 |
|
December 31,
2022 |
|
|
|
|
|
|
|
|
|
|
|
|
|
|
|
|
|
|
|
|
|
|
|
|
|
|
|
|
|
|
|
|
|
|
|
|
|
|
|
|
|
|
|
|
|
|
|
|
|
|
|
|
|
|
|
|
|
|
|
|
|
|
|
|
|
|
|
|
|
|
|
|
|
|
|
|
|
|
|
|
|
|
|
|
|
|
|
|
|
|
|
|
|
|
|
|
|
|
|
|
|
|
|
|
|
|
|
|
|
|
|
|
|
|
|
|
|
|
|
|
|
|
|
|
|
|
|
|
|
|
|
|
|
|
|
| Average total stockholders' equity |
|
$ |
868,396 |
|
|
$ |
853,375 |
|
|
$ |
841,979 |
|
|
$ |
858,112 |
|
|
$ |
909,225 |
|
|
$ |
855,488 |
|
|
$ |
892,978 |
|
| Average preferred stock liquidation preference |
|
(45,000) |
|
|
(45,000) |
|
|
(45,000) |
|
|
(45,000) |
|
|
(45,000) |
|
|
(45,000) |
|
|
(45,000) |
|
| Average total common stockholders' equity |
|
823,396 |
|
|
808,375 |
|
|
796,979 |
|
|
813,112 |
|
|
864,225 |
|
|
810,488 |
|
|
847,978 |
|
| Average goodwill and other intangibles |
|
(258,807) |
|
|
(261,619) |
|
|
(264,544) |
|
|
(265,320) |
|
|
(267,206) |
|
|
(262,552) |
|
|
(270,306) |
|
| Average tangible common stockholders' equity |
|
$ |
564,589 |
|
|
$ |
546,756 |
|
|
$ |
532,435 |
|
|
$ |
547,792 |
|
|
$ |
597,019 |
|
|
$ |
547,936 |
|
|
$ |
577,672 |
|
|
|
|
|
|
|
|
|
|
|
|
|
|
|
|
| Net income available to common stockholders |
|
$ |
8,825 |
|
|
$ |
11,993 |
|
|
$ |
6,848 |
|
|
$ |
10,209 |
|
|
$ |
16,759 |
|
|
$ |
37,875 |
|
|
$ |
99,105 |
|
| Average tangible common equity |
|
564,589 |
|
|
546,756 |
|
|
532,435 |
|
|
547,792 |
|
|
597,019 |
|
|
547,936 |
|
|
577,672 |
|
| Return on average tangible common equity |
|
6.20 |
% |
|
8.70 |
% |
|
5.16 |
% |
|
7.56 |
% |
|
11.14 |
% |
|
6.91 |
% |
|
17.16 |
% |
|
|
|
|
|
|
|
|
|
|
|
|
|
|
|
|
|
|
|
|
|
|
|
|
|
|
|
|
|
|
|
|
|
|
|
|
|
|
|
|
|
|
|
|
|
|
|
|
|
|
|
|
|
|
|
|
|
|
|
|
|
|
|
|
|
|
|
|
|
|
|
|
|
|
|
|
|
|
|
|
|
|
|
|
|
|
|
|
|
|
|
|
|
|
|
|
|
|
|
|
|
|
|
|
|
|
|
|
|
|
|
|
|
|
|
|
|
|
|
|
|
|
|
|
|
|
|
|
|
|
|
|
|
|
|
|
|
|
|
|
|
|
|
|
|
|
|
|
|
|
|
|
|
|
|
|
|
|
|
|
|
|
|
|
|
| Net interest income |
|
$ |
91,919 |
|
|
$ |
91,327 |
|
|
$ |
91,451 |
|
|
$ |
93,382 |
|
|
$ |
100,715 |
|
|
$ |
368,079 |
|
|
$ |
400,492 |
|
| Noninterest income |
|
14,230 |
|
|
13,410 |
|
|
11,511 |
|
|
11,022 |
|
|
12,119 |
|
|
50,173 |
|
|
84,068 |
|
| Operating revenue |
|
$ |
106,149 |
|
|
$ |
104,737 |
|
|
$ |
102,962 |
|
|
$ |
104,404 |
|
|
$ |
112,834 |
|
|
$ |
418,252 |
|
|
$ |
484,560 |
|
| Noninterest expenses |
|
$ |
87,298 |
|
|
$ |
86,259 |
|
|
$ |
90,396 |
|
|
$ |
89,281 |
|
|
$ |
86,771 |
|
|
$ |
353,234 |
|
|
$ |
340,631 |
|
| Efficiency ratio |
|
82.24 |
% |
|
82.36 |
% |
|
87.80 |
% |
|
85.52 |
% |
|
76.90 |
% |
|
84.45 |
% |
|
70.30 |
% |
|
|
|
|
|
|
|
|
|
|
|
|
|
|
|
|
|
|
|
|
|
|
|
|
|
|
|
|
|
|
|
|
|
|
|
|
|
|
|
|
|
|
|
|
|
|
|
|
|
|
|
|
|
|
|
|
|
|
|
|
|
|
|
|
|
|
|
|
|
|
|
|
|
|
|
|
|
|
|
|
|
|
|
|
|
|
|
|
|
|
|
|
|
|
|
|
|
|
|
|
|
|
|
|
|
|
|
|
|
|
|
|
|
|
|
|
|
|
|
|
|
|
|
|
|
|
|
|
|
|
|
|
|
|
|
|
|
|
|
|
|
|
|
|
|
|
|
|
|
|
|
|
|
|
|
|
|
|
|
|
|
|
|
|
|
|
|
|
|
|
|
|
|
|
|
|
|
|
|
|
| Net non-interest expense to average assets ratio: |
|
|
|
|
|
|
|
|
|
|
|
|
|
|
| Noninterest expenses |
|
$ |
87,298 |
|
|
$ |
86,259 |
|
|
$ |
90,396 |
|
|
$ |
89,281 |
|
|
$ |
86,771 |
|
|
$ |
353,234 |
|
|
$ |
340,631 |
|
| Noninterest income |
|
$ |
14,230 |
|
|
$ |
13,410 |
|
|
$ |
11,511 |
|
|
$ |
11,022 |
|
|
$ |
12,119 |
|
|
$ |
50,173 |
|
|
$ |
84,068 |
|
| Net noninterest expenses |
|
$ |
73,068 |
|
|
$ |
72,849 |
|
|
$ |
78,885 |
|
|
$ |
78,259 |
|
|
$ |
74,652 |
|
|
$ |
303,061 |
|
|
$ |
256,563 |
|
| Average total assets |
|
$ |
5,478,707 |
|
|
$ |
5,472,000 |
|
|
$ |
5,461,946 |
|
|
$ |
5,310,024 |
|
|
$ |
5,504,093 |
|
|
$ |
5,431,276 |
|
|
$ |
5,730,592 |
|
| Net noninterest expense to average assets ratio |
|
5.29 |
% |
|
5.28 |
% |
|
5.79 |
% |
|
5.98 |
% |
|
5.38 |
% |
|
5.58 |
% |
|
4.48 |
% |
|
|
|
|
|
|
|
|
|
|
|
|
|
|
|
| Total stockholders' equity |
|
$ |
864,400 |
|
|
$ |
850,382 |
|
|
$ |
833,466 |
|
|
$ |
827,216 |
|
|
$ |
888,971 |
|
|
$ |
864,400 |
|
|
$ |
888,971 |
|
| Preferred stock liquidation preference |
|
(45,000) |
|
|
(45,000) |
|
|
(45,000) |
|
|
(45,000) |
|
|
(45,000) |
|
|
(45,000) |
|
|
(45,000) |
|
| Total common stockholders' equity |
|
819,400 |
|
|
805,382 |
|
|
788,466 |
|
|
782,216 |
|
|
843,971 |
|
|
819,400 |
|
|
843,971 |
|
| Goodwill and other intangibles |
|
(257,355) |
|
|
(260,109) |
|
|
(262,958) |
|
|
(265,959) |
|
|
(265,767) |
|
|
(257,355) |
|
|
(265,767) |
|
| Tangible common stockholders' equity |
|
$ |
562,045 |
|
|
$ |
545,273 |
|
|
$ |
525,508 |
|
|
$ |
516,257 |
|
|
$ |
578,204 |
|
|
$ |
562,045 |
|
|
$ |
578,204 |
|
| Common shares outstanding |
|
23,302,414 |
|
|
23,291,693 |
|
|
23,269,885 |
|
|
23,370,515 |
|
|
24,053,585 |
|
|
23,302,414 |
|
|
24,053,585 |
|
| Tangible book value per share |
|
$ |
24.12 |
|
|
$ |
23.41 |
|
|
$ |
22.58 |
|
|
$ |
22.09 |
|
|
$ |
24.04 |
|
|
$ |
24.12 |
|
|
$ |
24.04 |
|
|
|
|
|
|
|
|
|
|
|
|
|
|
|
|
| Total assets at end of period |
|
$ |
5,347,334 |
|
|
$ |
5,599,794 |
|
|
$ |
5,652,721 |
|
|
$ |
5,628,185 |
|
|
$ |
5,333,783 |
|
|
$ |
5,347,334 |
|
|
$ |
5,333,783 |
|
| Goodwill and other intangibles |
|
(257,355) |
|
|
(260,109) |
|
|
(262,958) |
|
|
(265,959) |
|
|
(265,767) |
|
|
(257,355) |
|
|
(265,767) |
|
| Tangible assets at period end |
|
$ |
5,089,979 |
|
|
$ |
5,339,685 |
|
|
$ |
5,389,763 |
|
|
$ |
5,362,226 |
|
|
$ |
5,068,016 |
|
|
$ |
5,089,979 |
|
|
$ |
5,068,016 |
|
| Tangible common stockholders' equity ratio |
|
11.04 |
% |
|
10.21 |
% |
|
9.75 |
% |
|
9.63 |
% |
|
11.41 |
% |
|
11.04 |
% |
|
11.41 |
% |
1)Triumph Financial uses certain non-GAAP financial measures to provide meaningful supplemental information regarding Triumph Financial's operational performance and to enhance investors' overall understanding of such financial performance. The non-GAAP measures used by Triumph Financial include the following:
•"Tangible common stockholders' equity" is defined as common stockholders' equity less goodwill and other intangible assets.
•"Total tangible assets" is defined as total assets less goodwill and other intangible assets.
•"Tangible book value per share" is defined as tangible common stockholders' equity divided by total common shares outstanding. This measure is important to investors interested in changes from period-to-period in book value per share exclusive of changes in intangible assets.
•"Tangible common stockholders' equity ratio" is defined as the ratio of tangible common stockholders' equity divided by total tangible assets. We believe that this measure is important to many investors in the marketplace who are interested in relative changes from period-to period in common equity and total assets, each exclusive of changes in intangible assets.
•"Return on Average Tangible Common Equity" is defined as net income available to common stockholders divided by average tangible common stockholders' equity.
2)Performance ratios include discount accretion on purchased loans for the periods presented as follows:
|
|
|
|
|
|
|
|
|
|
|
|
|
|
|
|
|
|
|
|
|
|
|
|
|
|
|
|
|
|
|
|
|
|
|
|
|
|
|
|
|
|
|
For the Three Months Ended |
|
For the Year Ended |
| (Dollars in thousands) |
December 31,
2023 |
|
September 30,
2023 |
|
June 30,
2023 |
|
March 31,
2023 |
|
December 31,
2022 |
|
December 31,
2023 |
|
December 31,
2022 |
| Loan discount accretion |
$ |
1,039 |
|
|
$ |
1,403 |
|
|
$ |
990 |
|
|
$ |
1,810 |
|
|
$ |
2,011 |
|
|
$ |
5,242 |
|
|
$ |
8,643 |
|
3)Asset quality ratios exclude loans held for sale, except for non-performing assets to total assets.
4)Current quarter ratios are preliminary.
Source: Triumph Financial, Inc.
###
Investor Relations:
Luke Wyse
Senior Vice President, Head of Investor Relations
lwyse@tfin.com
214-365-6936
Media Contact:
Amanda Tavackoli
Senior Vice President, Director of Corporate Communication
atavackoli@tfin.com
214-365-6930


