Document
Exhibit 99.1
July 20, 2023
Fellow Shareholders,
For the second quarter, we earned net income to common stockholders of $6.8 million, or $0.29 per diluted share.
Discussion of the Quarter
There are a few things I would like to highlight for the quarter:
1.The main drivers of our earnings decline were the ongoing freight recession and rising funding costs. The freight cycle always turns, but until it does, our earnings will be lower than prior periods.
2.Our funding costs rose during the quarter as we funded loan growth and moderated core deposit attrition with more expensive wholesale funding. Rates on wholesale funding also rose significantly while rates on core deposits grew modestly. More on this in the Banking section below.
3.Credit metrics remain solid and we remain vigilant in a cloudy economic environment. Our credit costs remain in line with our expectations.
4.TriumphPay has a tremendous amount of momentum. It’s not just new logos and improved EBITDA margins in a recessionary environment; it is the impact of the network effect as more participants join.
The tables below outline some of our key metrics.
|
|
|
|
|
|
|
|
|
|
|
|
|
|
|
|
|
|
|
|
|
|
|
|
|
|
|
|
|
|
|
|
|
|
|
As of and for the Three Months Ended |
|
|
| (Dollars in thousands) |
June 30,
2023 |
|
March 31,
2023 |
|
December 31,
2022 |
|
September 30,
2022 |
|
June 30,
2022 |
|
|
|
|
| Financial Highlights: |
|
|
|
|
|
|
|
|
|
|
|
|
|
| Loans held for investment |
$ |
4,324,758 |
|
|
$ |
4,310,006 |
|
|
$ |
4,120,291 |
|
|
$ |
4,433,304 |
|
|
$ |
4,435,366 |
|
|
|
|
|
| Deposits |
$ |
4,293,466 |
|
|
$ |
4,038,994 |
|
|
$ |
4,171,336 |
|
|
$ |
4,441,354 |
|
|
$ |
4,780,924 |
|
|
|
|
|
| Net income available to common stockholders |
$ |
6,848 |
|
|
$ |
10,209 |
|
|
$ |
16,759 |
|
|
$ |
15,428 |
|
|
$ |
43,390 |
|
|
|
|
|
| Diluted earnings per common share |
$ |
0.29 |
|
|
$ |
0.43 |
|
|
$ |
0.67 |
|
|
$ |
0.62 |
|
|
$ |
1.74 |
|
|
|
|
|
Return on average assets(1) |
0.56 |
% |
|
0.84 |
% |
|
1.27 |
% |
|
1.13 |
% |
|
3.02 |
% |
|
|
|
|
Yield on loans(1) |
9.14 |
% |
|
9.22 |
% |
|
9.23 |
% |
|
8.95 |
% |
|
8.79 |
% |
|
|
|
|
Cost of total deposits(1) |
0.68 |
% |
|
0.32 |
% |
|
0.28 |
% |
|
0.24 |
% |
|
0.23 |
% |
|
|
|
|
| Non-performing assets to total assets |
0.68 |
% |
|
0.88 |
% |
|
1.02 |
% |
|
1.11 |
% |
|
0.83 |
% |
|
|
|
|
| ACL to total loans |
0.81 |
% |
|
0.98 |
% |
|
1.04 |
% |
|
0.99 |
% |
|
0.98 |
% |
|
|
|
|
Total capital to risk-weighted assets(2) |
15.59 |
% |
|
15.51 |
% |
|
17.66 |
% |
|
16.56 |
% |
|
15.91 |
% |
|
|
|
|
Common equity tier 1 capital to risk-weighted assets(2) |
10.93 |
% |
|
10.77 |
% |
|
12.73 |
% |
|
11.93 |
% |
|
11.35 |
% |
|
|
|
|
(1) Current quarter ratios are annualized
(2) Current period ratios are preliminary
|
|
|
|
|
|
|
|
|
|
|
|
|
|
|
|
|
|
|
|
|
|
|
|
|
|
|
|
|
|
|
|
|
|
|
|
|
|
|
|
|
|
|
|
|
|
|
|
|
|
|
|
|
|
|
June 30,
2023 |
|
March 31,
2023 |
|
December 31,
2022 |
|
September 30,
2022 |
|
June 30,
2022 |
|
Current Quarter Q/Q |
|
Current Year Y/Y |
| For the Qtr Ending |
|
|
|
|
|
Change |
|
% Change |
|
Change |
|
% Change |
| Factoring: |
|
|
|
|
|
|
|
|
|
|
|
|
|
|
|
|
|
| Invoice Volume |
1,494,963 |
|
|
1,491,763 |
|
|
1,596,843 |
|
|
1,681,489 |
|
|
1,725,721 |
|
|
3,200 |
|
|
0.2 |
% |
|
(230,758) |
|
|
(13.4) |
% |
| Purchased Volume |
$ |
2,732,976,000 |
|
|
$ |
2,927,104,000 |
|
|
$ |
3,277,986,000 |
|
|
$ |
3,599,771,000 |
|
|
$ |
4,023,569,000 |
|
|
$ |
(194,128,000) |
|
|
(6.6) |
% |
|
$ |
(1,290,593,000) |
|
|
(32.1) |
% |
| Average Transportation Invoice Size |
$ |
1,773 |
|
|
$ |
1,911 |
|
|
$ |
2,002 |
|
|
$ |
2,073 |
|
|
$ |
2,176 |
|
|
$ |
(138) |
|
|
(7.2) |
% |
|
$ |
(403) |
|
|
(18.5) |
% |
| Payments: |
|
|
|
|
|
|
|
|
|
|
|
|
|
|
|
|
|
| Invoice Volume |
4,526,629 |
|
|
4,260,654 |
|
|
4,605,020 |
|
|
4,676,249 |
|
|
4,394,351 |
|
|
265,975 |
|
|
6.2 |
% |
|
132,278 |
|
|
3.0 |
% |
| Payment Volume |
$ |
4,940,317,000 |
|
|
$ |
5,030,548,000 |
|
|
$ |
5,577,014,000 |
|
|
$ |
5,951,706,000 |
|
|
$ |
6,033,898,000 |
|
|
$ |
(90,231,000) |
|
|
(1.8) |
% |
|
$ |
(1,093,581,000) |
|
|
(18.1) |
% |
| Network Invoice Volume |
181,904 |
|
|
159,353 |
|
|
157,004 |
|
|
144,253 |
|
|
118,580 |
|
|
22,551 |
|
|
14.2 |
% |
|
63,324 |
|
|
53.4 |
% |
| Network Payment Volume |
$ |
299,948,000 |
|
|
$ |
289,667,000 |
|
|
$ |
301,366,000 |
|
|
$ |
288,410,000 |
|
|
$ |
253,312,000 |
|
|
$ |
10,281,000 |
|
|
3.5 |
% |
|
$ |
46,636,000 |
|
|
18.4 |
% |
| Number of Freight Brokers |
584 |
|
|
589 |
|
|
580 |
|
|
584 |
|
|
566 |
|
|
(5) |
|
|
(0.8) |
% |
|
18 |
|
|
3.2 |
% |
| Number of Factors |
70 |
|
|
70 |
|
|
70 |
|
|
70 |
|
|
69 |
|
|
— |
|
|
— |
% |
|
1 |
|
|
1.4 |
% |
Freight Market & Strategy: Stick to the Plan
Four years ago, we established a strategic plan to achieve our long-term goals. We have previously laid those out in five strategic pillars.
Related to the fifth point, financing revenues have grown dramatically since 2019, which has marginalized fee income growth as a percent of the total, but the long term plan is still the same. Overall, the freight market has been a tailwind for much of the journey, and now it is a headwind. This is the nature of a cyclical business - we knew a recessionary environment would eventually come, but we didn’t know when. Now that it is here, our plan is to stick to the plan.
The trucking market is currently imbalanced with too much hauling capacity and insufficient customer demand. Inevitably, the market will rebalance the other way. In the meantime, many carriers will struggle to operate with rates at current levels. It always takes time, but capacity eventually leaves the system in a market like this. For example, the active client count in our Factoring segment is down 21.3% year-over-year. The majority of that decrease is smaller truckers succumbing to market pressure, which we have seen before.
The one thing that could affect our strategic plan would be material credit losses related to the freight market. While one-off losses are possible (and expected), we do not have concerns about systemic problems because of the way we structure credit in our transportation businesses. Our largest credit exposure is factored receivables, an asset class that has performed exceptionally well for us in strong as well as weak freight markets. Further, our factoring portfolio has turned over many times since this freight recession began. A slow freight market doesn’t typically impact credit in factoring, but it does impact revenue. As a reminder, the counterparty to these receivables are not the truckers, but rather the companies for whom they are hauling.
Our second largest credit exposure in transportation is related to equipment finance. We have been disciplined in our growth the last few years, which has positioned us well for these times. Our equipment finance book grew 7% from the end of 2019 to present, a period which included the hottest freight market in a generation. We could have scaled our book dramatically in that environment, but that kind of growth was not consistent with the strategic plan. As it relates to new production, any equipment loan made in the last three quarters has been made considering all the knowledge we have related to the freight recession and the interest rate environment, and earlier vintage loans have amortized down. In light of those factors and our longstanding customer relationships, I believe this portfolio will perform better than peers through the cycle.
A third form of credit exposure to freight is in our supply chain financing (“SCF”(1)) business at TriumphPay. This is highly correlated to our Factoring segment, but has some unique characteristics. Freight brokers are fighting the same headwinds to profitability that Triumph Financial is fighting, so we have to remain vigilant in structuring this exposure. I go into greater detail on this in the Payments section below.
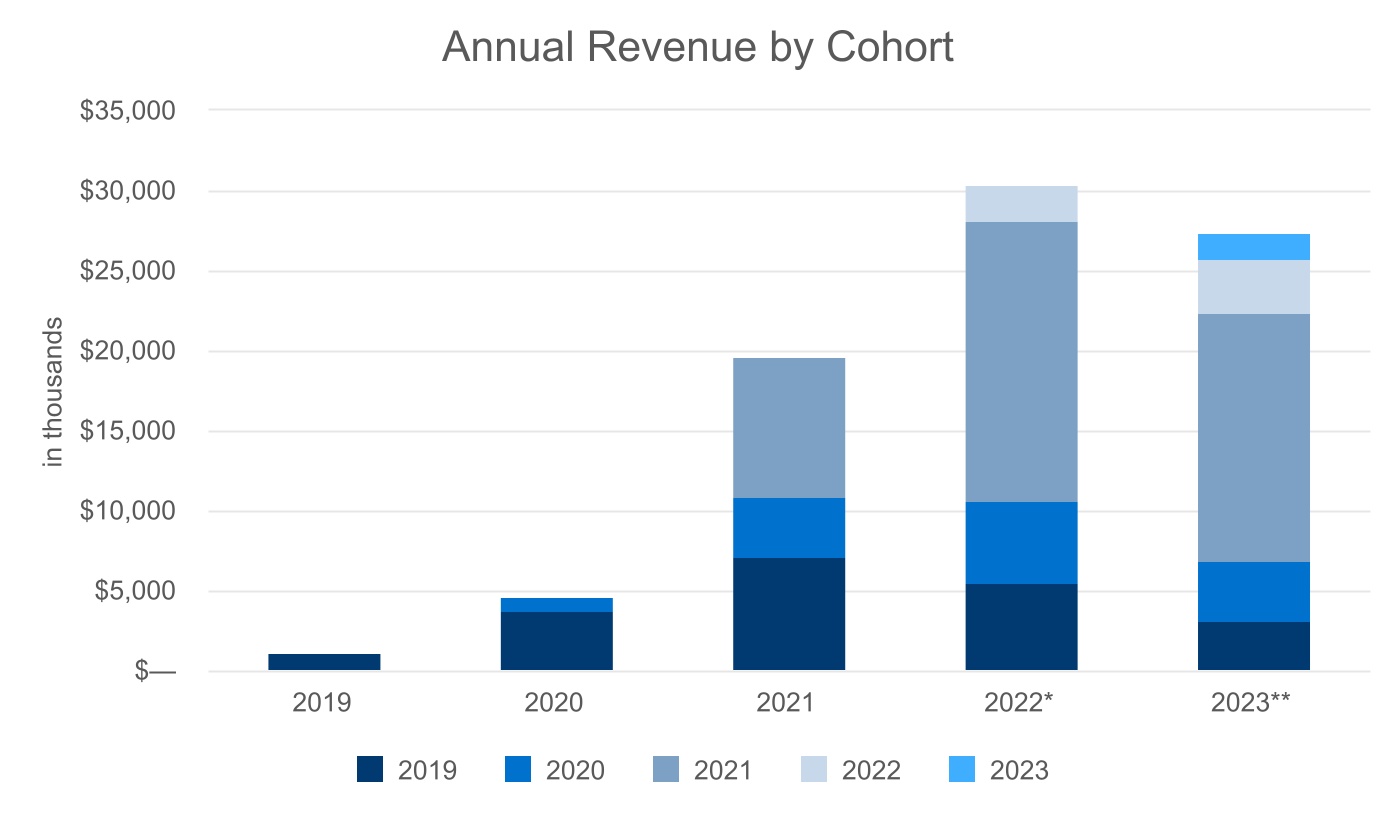
As a result of the revenue volatility of our business, we have not historically (and will not in the foreseeable future) given earnings guidance. For investors wanting to take a long-term look, pick the last “normal” freight market and assume that TriumphPay is a contributor to earnings rather than a drag. In 2022, our exit run rate, pre-tax loss for TriumphPay was just under $40 million, annually. The impact of that on EPS is well over $1 per share. Getting that to break even will materially change our results. Although we don’t give earnings guidance for the company as a whole, we have previously given EBITDA margin guidance for TriumphPay (i) exiting 2023 [-40% to -60%] and (ii) exiting 2024 at EBITDA breakeven. We achieved the first target two quarters ahead of schedule, and we continue to expect EBITDA breakeven by the end of 2024 – possibly sooner.
I have a sign that sits on my desk (a gift from an investor) that reads: “Time adjudicates all: the friend of great businesses, enemy of the mediocre.” Based on our belief that our credit position is on solid footing and that the freight market will inevitably trend higher, we see no need to change course. Stick to the plan.
Payments
There are three things I would like to highlight in our Payments segment:
1.As of the date of this writing, five of the ten largest brokers in the U.S. (including two of the top five) are now live on TriumphPay or are under contract to go live later this year.
2.Revenue grew 17.6% Q/Q and EBITDA margin improved.
3.We are experiencing momentum that could propel us to EBITDA break-even ahead of schedule.
I believe we are reaching the inflection point in the curve as it relates to the question of whether the market wants TriumphPay as an audit and payment solution and whether we can deliver it at scale. In addition to Worldwide Express and RXO (two of the top ten mentioned above), we had several other wins. Outside of the Tier 1 segment, we added an additional $2 billion in annualized payment volume to the network during Q2 from brokers such as Flock Freight, Trident Transportation, and Visible Supply Chain Management (a division of Maersk).
It’s not just about volume growth. A payments network is not a linear business like a traditional loan book. The larger a network grows, the more benefits it offers to its constituents and the more compelling it becomes for others to join. Over time, the network becomes more efficient and more effective at verifying and transmitting the necessary data to make near touchless payments while mitigating fraud.
Moving to profitability, we continue to demonstrate EBITDA margin improvement with an 11% lift over 1Q23 and a 59% improvement over 4Q22. Our current EBITDA margin of (55)% has already met our year-end target. To be clear, those numbers include the transferred contribution of factoring assets related to our SCF product from Factoring to Payments, but that effect was de minimis in this quarter, adding about $128 thousand net to EBITDA. The EBITDA lift was muted due to the fact that we took the full amount of the ACL expense against one month of earnings.
*Annualized Revenue excludes $7.0 million net gain on minority investment mark-to-market
It is also worth noting that our improvement in revenue and EBITDA has been generated, for the most part, without material contribution from the new network clients mentioned above. The full financial impact of these clients will come over the next several quarters.
I want to pause here and pick up the SCF theme from the freight and strategy section. I want investors to understand how we think about it in the short term and how we think about it for the long term. A pure open-loop network (i.e., Visa or Mastercard) does not provide a balance sheet support to its constituents. Instead, it connects consumers, merchants and capital providers (issuing banks) with a digital integration. A closed loop network (i.e., Amex or Discover) provides a balance sheet in addition to connecting the consumer and merchant digitally. As it exists today, TriumphPay is a hybrid, open-loop network. We fulfill multiple roles. The TriumphPay network provides the opportunity for capital providers (similar to issuing banks in a card network) to join. Many factoring companies have done just that. TriumphPay also uses our balance sheet to inject liquidity to the network. This is SCF and it is more closely related to a closed-loop network. It’s not just carriers that need balance sheet assistance – so do many freight brokers. That is why we created the SCF offering inside of TriumphPay and moved most freight brokers out of our Factoring segment. Just as carriers want to get paid faster, freight brokers want to (i) collect A/R from their shipper clients faster and/or (ii) pay their A/P slower to improve working capital. Remember, in the TriumphPay network, the carrier is the merchant and the broker (or shipper) is the customer.
If all of this sounds academic, please stay with me. We said several quarters ago that it was our desire to grow non-interest income faster than interest income. In other words, we want to be more like Visa, less like Amex. This makes sense because no company has a big enough balance sheet to bank the entire freight market. On the other hand, using SCF alongside other capital providers on the network is highly efficient for us – we are financing a transaction that we are already being paid a fee to handle. In the end, TriumphPay’s goal is to be an invisible and ubiquitous tollway that allows merchants, customers and capital providers to reduce friction, mitigate fraud and harvest data and analytics to improve their business. While we progress along this journey, SCF revenues are valuable to our margins, but they also introduce some level of credit risk.
The value of a network largely lives in its data. One meaningful example of this was an enhancement to our payments network during the quarter to increase the amount of structured data network factors receive. In addition to the 98 fully-integrated network brokers, there is another subset of brokers who use our audit product but are not yet utilizing TriumphPay for payments. For this subset of brokers, the data that exists from our integration and from our audit product contain a majority of the key data points factoring companies are utilizing from a network transaction. Based on feedback from our customers, we determined that this additional data would make a meaningful difference in a factoring company’s ability to adjust their verifications and collections operations and realize efficiencies and cost savings. During the course of the quarter, we integrated this subset of 143 brokers to a beta group of factors and will ramp-up to all network factors in the coming weeks.
Another example is the partnership that we built and launched with Highway to help freight brokers combat double brokering. By combining the breadth and scale of TriumphPay’s audit and payment data with Highway’s data on carrier identity and assets, brokers and shippers are able to identify carriers who appear to be over-utilized (hauling more freight than their equipment would physically allow). Our data conservatively suggests that the brokerage industry could remove $500-700 million of double brokering from its spend annually. Because of the breadth of double brokering schemes occurring, the problem is more likely a multi-billion dollar problem for the industry. We are excited to help brokers begin weeding this capacity out of their networks, avoiding fraud and preserving their critical shipper relationships.
With all of the above commentary for context, here are some additional data points for the quarter. As you can see in the chart below, revenue grew despite the pressure on volume, which is a material positive.
*Annualized Revenue excludes $7.0 million net gain on minority investment mark-to-market
Going deeper into the numbers shows just how much TriumphPay has been outrunning the headwinds the freight recession has created. For the quarter, TriumphPay’s invoice volume increased 6.2%, and total payment volume decreased by 1.8% to $19.8 billion, annualized. The average invoice paid by TriumphPay decreased 7.6% in size, and audit dollar volume decreased 7.3% due to invoice sizes. Most of those are absolute negative numbers, but on a relative basis, they are strong positives. There is no perfect measure of the overall freight market, but we view Freightwaves’ Outbound Tender Volume Index as a good proxy for our business. As you can see in the chart below, TriumphPay is outperforming this index by approximately 33%. We are outrunning the treadmill of a recessionary market, and when the trend reverses, our numbers should improve materially.

Finally, the most encouraging thing from my perspective is that some of the most important numbers went up on absolute basis despite the freight recession - (i) network transaction volume increased 14.2%, (ii) organic revenue (excluding intersegment SCF transfer) was up 7.5%, and (iii) EBITDA improved. All of these are material positives.
*Excludes $7.0 million net gain on minority investment mark-to-market **Annualized.
All years exclude intersegment interest allocations and estimates of deferred fees
Factoring
As stated above, we continue to witness a decrease in active clients as capacity continues to leave the industry. The pace has slowed, but it is still trending downward. Pricing pressures remain and utilization trends are still below long-term averages. As such, our factoring business remains profitable, but with margin compression. While invoice prices have been lower in the past on an absolute basis, this market is as challenging for truckers as it’s been since 2009. The cost structure of the industry has changed dramatically over the last 14 years. As a result, many truckers cannot make a profit hauling loads right now, especially in the spot market. It will not last forever – challenging times create better businesses for those that survive and they will benefit when the pendulum swings the other way.
On paper, factoring is a great business from an interest rate risk perspective. But the business does not live on paper and I want investors to have a full understanding of the risks and opportunities. Trucking clients generally enter into a contract with their factor of typically one or two years in length. That contract specifies the terms and rates of the relationship and is the basis of an all-assets filing under the Uniform Commercial Code ("UCC"). The contract also specifies the discount rate that the factor will charge to the client, which is a primary driver of yield. In the past, the discount rate was usually fixed. In recent periods, we have begun to see bids pricing off levels of net funds employed (“NFE”) and additional fees designed to offset funding costs. This gives more flexibility to factors to adjust pricing in a market where interest rates are rising. That being said, if rates can be raised under the contractual language, one must keep in mind what the market can bear. This is something we regularly evaluate.
So what do we do in light of those facts? We stick to the plan. Experience tells me that in the 40+ years since the deregulation of trucking (which gave birth to the factoring industry in transportation), factoring has been a very profitable line of business in the vast majority of those years. The market will eventually adjust its pricing model to reflect higher borrowing costs. I know most of the players in the transportation factoring industry and they are smart and entrepreneurial. For those that adopt TriumphPay, it will allow them to improve their efficiency, which is going to be essential for anyone who wants to be competitive for the long term. When a material amount of payments received by a factor is available from TriumphPay as an automated, fraud risk reduced, instant-purchase-decision transaction, those who adopt the network will have a material and measurable competitive advantage from that automation. As that network transaction volume grows, the value proposition only increases.
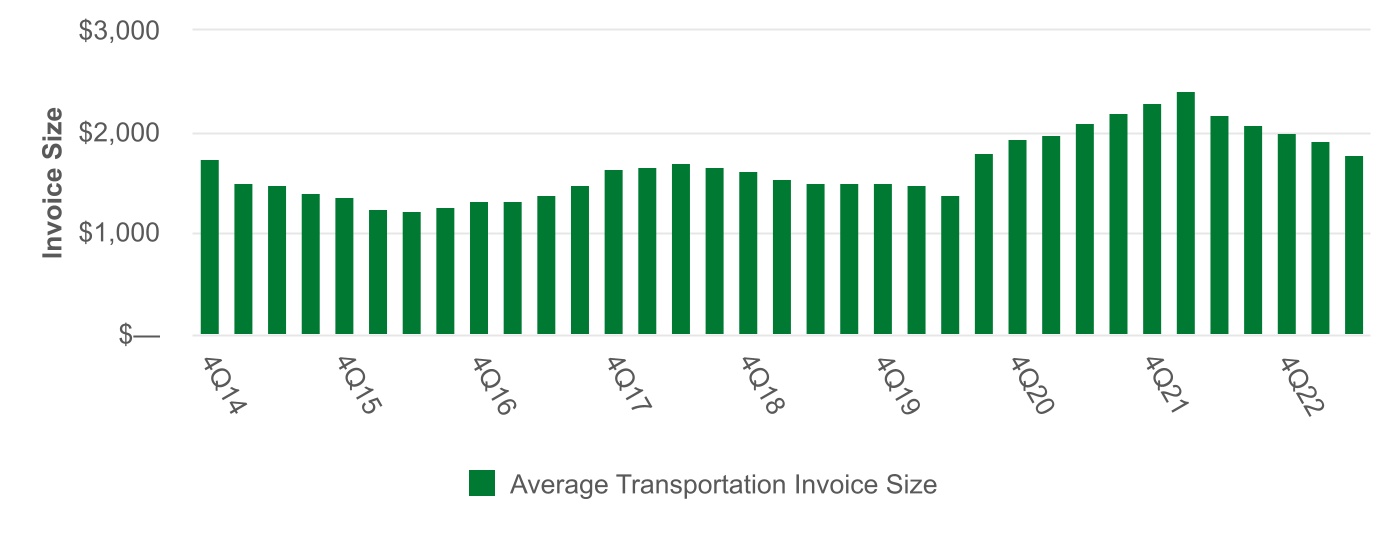
With that commentary as context, here are the numbers for factoring for the quarter. Our average transportation invoice price dropped to $1,773, down $403 from the same quarter in 2022 and down $138 from 1Q23. This, coupled with lower utilization among our customer fleets due to a softening market, contributed to a 6.6% decrease in purchased volumes.
Banking
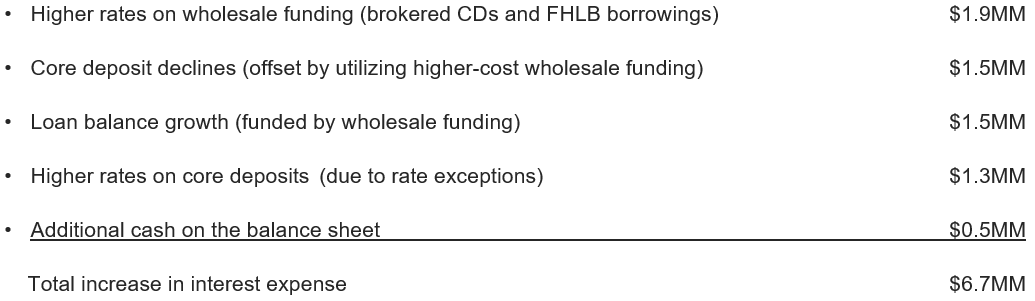
Banking segment income grew 3% over prior quarter, but we began to experience margin compression due to rising deposit costs. Our total deposit balances for the quarter were up $254 million, driven entirely by the issuance of brokered CDs, which were up about $364 million in the quarter and allowed us to reduce FHLB borrowings and maximize available liquidity. The rates on wholesale funding rose much faster than our core deposits, which we still reprice solely on an exception basis and had a blended rate of only 43 bps in 2Q. Core deposits were down about $100 million driven entirely by non-interest bearing deposits, with about half of that decrease in our mortgage warehouse business. While it is very difficult to predict depositor behavior in the near-term, we are encouraged that attrition in our core deposit base has slowed. Here is a chart that shows the contributing factors to the increase in our cost of funds.
We continue to think opportunistically about our lending approach in this market, and while we are seeing good opportunities with attractive risk adjusted returns, the level of those opportunities we’re seeing is less than what we anticipated at the beginning of the year. As a result, I would expect our Banking segment loan balances to be flat from here through year-end while we seek to improve margins through rotation from lower to higher yielding loan products.
Investors (especially bank investors) should not misunderstand our emphasis on transportation as neglecting our community bank franchise. First, our credit quality is strong in the Banking segment. Second, the spreads we generate in our community bank (excluding Factoring and Payments) are among the best in the U.S. The chart below compares Triumph Financial’s Banking segment to other banks that have reported this quarter. Our cost of funds and our yield on interest earnings assets is better than almost any peer. This has been the case for a long time. For the TFIN bar in the charts below, the darker portion of the bar demonstrates the Banking segment results whereas the lighter portion of the bar demonstrates the added yield and spread attributable to the Factoring and Payments segments.
Strategic Investment
On June 22, 2023, TriumphPay made a $9.7 million minority investment in Trax, a leader in transportation spend management solutions. This investment demonstrates our go-to-market strategy in the shipper space. As opposed to building our own freight, audit and pay product ("FAP") for shippers, we have chosen to partner with FAPs that are already successfully serving this large market. Factors do not only buy freight broker invoices. As an example, our factoring subsidiary purchases approximately 25% of its invoices with the ultimate payor as a shipper, instead of a freight broker. Investments such as these, with Trax and Intelligent Audit will allow us to bring the efficiencies of the network to our factor clients with shipper payors as well. There is a significant amount of room for TriumphPay to grow in the shipper market.
Notable Items Impacting Q2 Financial Results
•TriumphPay had approximately $1.3 million in elevated onboarding expenses in the second quarter related to the large client go-lives referenced in the Payments section of this letter.
•Triumph factoring saw a downward adjustment to revenue of $1.2 million related to a revaluation of a revenue share asset related to the 2022 sale of our general factoring portfolio due to client attrition at the acquiring company.
•Our net charge-off ratio this quarter was unusually elevated and this warrants some explanation, especially as there is not a corresponding P&L impact this quarter. Of the $10.8 million in net charge-offs, $8.1 million was previously identified and reserved, with about half of that related to a client from our TFS acquisition partially covered by our indemnification agreement with Covenant Logistics.
Capital Planning & Share Repurchases
At quarter-end we held about $145 million of capital in excess of our internal targets and considerably more than regulatory thresholds. We continue to stick to the plan regarding our use of excess capital. On February 1, 2023, we entered into an accelerated share repurchase (“ASR”) program. That program was completed on April 28, 2023. Through the accelerated share repurchase agreement we repurchased 1,209,327 shares of our common stock for a total cost of $70 million. On May 4, 2023, our board of directors authorized a new share repurchase program whereby the Company may repurchase up to an additional $50 million of its outstanding common stock. We have yet to be active with the most recent share repurchase authorization.
Expense Outlook
Our expenses this quarter were in line with guidance last quarter. Since announcing the strategic pivot in 2019, we have grown expenses 73% annualized. This increase in expenses was necessary to build the technology and team required to deliver the payments network at scale. The bulk of that increase in spend is behind us. We have several initiatives that will further expand the value and scope of the payments network, but in light of earnings pressure, we are pushing certain projects out into the future. We expect expenses to be roughly flat for the remainder of 2023. As long as the freight market remains under pressure you should expect this discipline to continue. There will be a few resiliency-related projects that could add $1 - $2 million to our quarterly run rate beginning in Q3. But beyond that, investors should expect any additional expense growth to be the result of supporting new clients and increased volumes.
We remain focused on helping clients navigate this difficult operating environment. We have a plan that we believe in, and we are executing on it with success.
With warm regards,
Aaron P. Graft Founder, Vice Chairman, and CEO
(1) Our use of the term Supply Chain Finance, or SCF, includes a number of different products and services offered to freight broker and other TriumphPay clients to manage their liquidity, including (i) offering such freight brokers and other clients extended terms to settle their invoice payments with us following our payment to their carriers and (ii) factoring products where we purchase the receivables payable to freight brokers from their shipper clients.
Conference Call Information
Aaron P. Graft, Vice Chairman and CEO, and Brad Voss, CFO, will review the financial results in a conference call with investors and analysts beginning at 9:30 a.m. central time on Friday, July 21, 2023.
The live video conference option may be accessed directly through this link, https://triumph-financial-inc-earnings-q2fy23.open-exchange.net/ or via the Company's website at tfin.com through the News & Events, Events & Presentations links. Alternatively, a live conference call option is available by dialing 1-800-590-8290 (International: +1-240-690-8800) requesting to be joined to conference ID “Triumph” at the operator prompt. An archive of this conference call will subsequently be available at this same location, referenced above, on the Company’s website.
About Triumph Financial
Triumph Financial, Inc. (Nasdaq: TFIN) is a financial holding company focused on payments, factoring and banking. Headquartered in Dallas, Texas, its diversified portfolio of brands includes TriumphPay, Triumph and TBK Bank. www.tfin.com
Forward-Looking Statements
This letter to shareholders contains forward-looking statements. Any statements about our expectations, beliefs, plans, predictions, forecasts, objectives, assumptions or future events or performance are not historical facts and may be forward-looking. You can identify forward-looking statements by the use of forward-looking terminology such as “believes,” “expects,” “could,” “may,” “will,” “should,” “seeks,” “likely,” “intends,” “plans,” “pro forma,” “projects,” “estimates” or “anticipates” or the negative of these words and phrases or similar words or phrases that are predictions of or indicate future events or trends and that do not relate solely to historical matters. You can also identify forward-looking statements by discussions of strategy, plans or intentions. Forward-looking statements involve numerous risks and uncertainties and you should not rely on them as predictions of future events. Forward-looking statements depend on assumptions, data or methods that may be incorrect or imprecise and we may not be able to realize them. We do not guarantee that the transactions and events described will happen as described (or that they will happen at all). The following factors, among others, could cause actual results and future events to differ materially from those set forth or contemplated in the forward-looking statements: business and economic conditions generally and in the bank and non-bank financial services industries, nationally and within our local market areas; our ability to mitigate our risk exposures; our ability to maintain our historical earnings trends; changes in management personnel; interest rate risk; concentration of our products and services in the transportation industry; credit risk associated with our loan portfolio; lack of seasoning in our loan portfolio; deteriorating asset quality and higher loan charge-offs; time and effort necessary to resolve nonperforming assets; inaccuracy of the assumptions and estimates we make in establishing reserves for probable loan losses and other estimates; risks related to the integration of acquired businesses and any future acquisitions; our ability to successfully identify and address the risks associated with our possible future acquisitions, and the risks that our prior and possible future acquisitions make it more difficult for investors to evaluate our business, financial condition and results of operations, and impairs our ability to accurately forecast our future performance; lack of liquidity; fluctuations in the fair value and liquidity of the securities we hold for sale; impairment of investment securities, goodwill, other intangible assets or deferred tax assets; our risk management strategies; environmental liability associated with our lending activities; increased competition in the bank and non-bank financial services industries, nationally, regionally or locally, which may adversely affect pricing and terms; the accuracy of our financial statements and related disclosures; material weaknesses in our internal control over financial reporting; system failures or failures to prevent breaches of our network security; the institution and outcome of litigation and other legal proceedings against us or to which we become subject; changes in carry-forwards of net operating losses; changes in federal tax law or policy; the impact of recent and future legislative and regulatory changes, including changes in banking, securities and tax laws and regulations, such as the Dodd-Frank Act and their application by our regulators; governmental monetary and fiscal policies; changes in the scope and cost of FDIC, insurance and other coverages; failure to receive regulatory approval for future acquisitions; increases in our capital requirements and the impact of COVID-19 on our business.
While forward-looking statements reflect our good-faith beliefs, they are not guarantees of future performance. All forward-looking statements are necessarily only estimates of future results. Accordingly, actual results may differ materially from those expressed in or contemplated by the particular forward-looking statement, and, therefore, you are cautioned not to place undue reliance on such statements. Further, any forward-looking statement speaks only as of the date on which it is made, and we undertake no obligation to update any forward-looking statement to reflect events or circumstances after the date on which the statement is made or to reflect the occurrence of unanticipated events or circumstances, except as required by applicable law. For a discussion of such risks and uncertainties, which could cause actual results to differ from those contained in the forward-looking statements, see "Risk Factors" and the forward-looking statement disclosure contained in Triumph’s Annual Report on Form 10-K, filed with the Securities and Exchange Commission on February 15, 2023.
Non-GAAP Financial Measures
This letter to shareholders includes certain non‐GAAP financial measures intended to supplement, not substitute for, comparable GAAP measures. Reconciliations of non‐GAAP financial measures to GAAP financial measures are provided at the end of this letter to shareholders.
The following table sets forth key metrics used by Triumph Financial to monitor our operations. Footnotes in this table can be found in our definitions of non-GAAP financial measures at the end of this document.
|
|
|
|
|
|
|
|
|
|
|
|
|
|
|
|
|
|
|
|
|
|
|
|
|
|
|
|
|
|
|
|
|
|
|
|
|
|
|
|
|
|
|
As of and for the Three Months Ended |
|
As of and for the Six Months Ended |
| (Dollars in thousands) |
June 30,
2023 |
|
March 31,
2023 |
|
December 31,
2022 |
|
September 30,
2022 |
|
June 30,
2022 |
|
June 30,
2023 |
|
June 30,
2022 |
| Financial Highlights: |
|
|
|
|
|
|
|
|
|
|
|
|
|
| Total assets |
$ |
5,652,721 |
|
|
$ |
5,628,185 |
|
|
$ |
5,333,783 |
|
|
$ |
5,642,450 |
|
|
$ |
5,955,507 |
|
|
$ |
5,652,721 |
|
|
$ |
5,955,507 |
|
| Loans held for investment |
$ |
4,324,758 |
|
|
$ |
4,310,006 |
|
|
$ |
4,120,291 |
|
|
$ |
4,433,304 |
|
|
$ |
4,435,366 |
|
|
$ |
4,324,758 |
|
|
$ |
4,435,366 |
|
| Deposits |
$ |
4,293,466 |
|
|
$ |
4,038,994 |
|
|
$ |
4,171,336 |
|
|
$ |
4,441,354 |
|
|
$ |
4,780,924 |
|
|
$ |
4,293,466 |
|
|
$ |
4,780,924 |
|
| Net income available to common stockholders |
$ |
6,848 |
|
|
$ |
10,209 |
|
|
$ |
16,759 |
|
|
$ |
15,428 |
|
|
$ |
43,390 |
|
|
$ |
17,057 |
|
|
$ |
66,918 |
|
|
|
|
|
|
|
|
|
|
|
|
|
|
|
| Performance Ratios - Annualized: |
|
|
|
|
|
|
|
|
|
|
|
|
|
| Return on average assets |
0.56 |
% |
|
0.84 |
% |
|
1.27 |
% |
|
1.13 |
% |
|
3.02 |
% |
|
0.70 |
% |
|
2.36 |
% |
| Return on average total equity |
3.64 |
% |
|
5.20 |
% |
|
7.66 |
% |
|
7.16 |
% |
|
20.08 |
% |
|
4.43 |
% |
|
15.67 |
% |
| Return on average common equity |
3.45 |
% |
|
5.09 |
% |
|
7.69 |
% |
|
7.17 |
% |
|
20.78 |
% |
|
4.27 |
% |
|
16.13 |
% |
Return on average tangible common equity (1) |
5.16 |
% |
|
7.56 |
% |
|
11.14 |
% |
|
10.47 |
% |
|
30.63 |
% |
|
6.37 |
% |
|
23.91 |
% |
Yield on loans(2) |
9.14 |
% |
|
9.22 |
% |
|
9.23 |
% |
|
8.95 |
% |
|
8.79 |
% |
|
9.18 |
% |
|
8.69 |
% |
| Cost of interest bearing deposits |
1.13 |
% |
|
0.55 |
% |
|
0.48 |
% |
|
0.41 |
% |
|
0.41 |
% |
|
0.85 |
% |
|
0.32 |
% |
| Cost of total deposits |
0.68 |
% |
|
0.32 |
% |
|
0.28 |
% |
|
0.24 |
% |
|
0.23 |
% |
|
0.50 |
% |
|
0.19 |
% |
| Cost of total funds |
1.23 |
% |
|
0.68 |
% |
|
0.49 |
% |
|
0.42 |
% |
|
0.40 |
% |
|
0.97 |
% |
|
0.34 |
% |
Net interest margin(2) |
7.57 |
% |
|
8.08 |
% |
|
8.22 |
% |
|
7.71 |
% |
|
7.68 |
% |
|
7.82 |
% |
|
7.68 |
% |
| Net noninterest expense to average assets |
5.79 |
% |
|
5.98 |
% |
|
5.38 |
% |
|
5.15 |
% |
|
2.76 |
% |
|
5.88 |
% |
|
3.71 |
% |
|
|
|
|
|
|
|
|
|
|
|
|
|
|
| Efficiency ratio |
87.80 |
% |
|
85.52 |
% |
|
76.90 |
% |
|
78.14 |
% |
|
59.23 |
% |
|
86.65 |
% |
|
64.10 |
% |
|
|
|
|
|
|
|
|
|
|
|
|
|
|
|
|
|
|
|
|
|
|
|
|
|
|
|
|
Asset Quality:(3) |
|
|
|
|
|
|
|
|
|
|
|
|
|
| Past due to total loans |
1.55 |
% |
|
1.67 |
% |
|
2.53 |
% |
|
2.33 |
% |
|
2.47 |
% |
|
1.55 |
% |
|
2.47 |
% |
| Non-performing loans to total loans |
0.74 |
% |
|
1.01 |
% |
|
1.17 |
% |
|
1.26 |
% |
|
0.95 |
% |
|
0.74 |
% |
|
0.95 |
% |
| Non-performing assets to total assets |
0.68 |
% |
|
0.88 |
% |
|
1.02 |
% |
|
1.11 |
% |
|
0.83 |
% |
|
0.68 |
% |
|
0.83 |
% |
| ACL to non-performing loans |
109.41 |
% |
|
97.12 |
% |
|
88.76 |
% |
|
78.88 |
% |
|
103.51 |
% |
|
109.41 |
% |
|
103.51 |
% |
| ACL to total loans |
0.81 |
% |
|
0.98 |
% |
|
1.04 |
% |
|
0.99 |
% |
|
0.98 |
% |
|
0.81 |
% |
|
0.98 |
% |
| Net charge-offs to average loans |
0.25 |
% |
|
0.05 |
% |
|
0.05 |
% |
|
0.06 |
% |
|
— |
% |
|
0.31 |
% |
|
0.04 |
% |
|
|
|
|
|
|
|
|
|
|
|
|
|
|
| Capital: |
|
|
|
|
|
|
|
|
|
|
|
|
|
Tier 1 capital to average assets(4) |
12.01 |
% |
|
12.19 |
% |
|
13.00 |
% |
|
12.57 |
% |
|
11.76 |
% |
|
12.01 |
% |
|
11.76 |
% |
Tier 1 capital to risk-weighted assets(4) |
12.68 |
% |
|
12.52 |
% |
|
14.57 |
% |
|
13.64 |
% |
|
13.04 |
% |
|
12.68 |
% |
|
13.04 |
% |
Common equity tier 1 capital to risk-weighted assets(4) |
10.93 |
% |
|
10.77 |
% |
|
12.73 |
% |
|
11.93 |
% |
|
11.35 |
% |
|
10.93 |
% |
|
11.35 |
% |
| Total capital to risk-weighted assets |
15.59 |
% |
|
15.51 |
% |
|
17.66 |
% |
|
16.56 |
% |
|
15.91 |
% |
|
15.59 |
% |
|
15.91 |
% |
| Total equity to total assets |
14.74 |
% |
|
14.70 |
% |
|
16.67 |
% |
|
15.79 |
% |
|
14.68 |
% |
|
14.74 |
% |
|
14.68 |
% |
Tangible common stockholders' equity to tangible assets(1) |
9.75 |
% |
|
9.63 |
% |
|
11.41 |
% |
|
10.75 |
% |
|
9.83 |
% |
|
9.75 |
% |
|
9.83 |
% |
|
|
|
|
|
|
|
|
|
|
|
|
|
|
| Per Share Amounts: |
|
|
|
|
|
|
|
|
|
|
|
|
|
| Book value per share |
$ |
33.88 |
|
|
$ |
33.47 |
|
|
$ |
35.09 |
|
|
$ |
34.57 |
|
|
$ |
33.91 |
|
|
$ |
33.88 |
|
|
$ |
33.91 |
|
Tangible book value per share (1) |
$ |
22.58 |
|
|
$ |
22.09 |
|
|
$ |
24.04 |
|
|
$ |
23.60 |
|
|
$ |
22.84 |
|
|
$ |
22.58 |
|
|
$ |
22.84 |
|
| Basic earnings per common share |
$ |
0.30 |
|
|
$ |
0.44 |
|
|
$ |
0.69 |
|
|
$ |
0.64 |
|
|
$ |
1.78 |
|
|
$ |
0.73 |
|
|
$ |
2.72 |
|
| Diluted earnings per common share |
$ |
0.29 |
|
|
$ |
0.43 |
|
|
$ |
0.67 |
|
|
$ |
0.62 |
|
|
$ |
1.74 |
|
|
$ |
0.72 |
|
|
$ |
2.66 |
|
|
|
|
|
|
|
|
|
|
|
|
|
|
|
| Shares outstanding end of period |
23,269,885 |
|
|
23,370,515 |
|
|
24,053,585 |
|
|
24,478,288 |
|
|
24,457,777 |
|
|
23,269,885 |
|
|
24,457,777 |
|
Unaudited consolidated balance sheet as of:
|
|
|
|
|
|
|
|
|
|
|
|
|
|
|
|
|
|
|
|
|
|
|
|
|
|
|
|
|
|
| (Dollars in thousands) |
June 30,
2023 |
|
March 31,
2023 |
|
December 31,
2022 |
|
September 30,
2022 |
|
June 30,
2022 |
| ASSETS |
|
|
|
|
|
|
|
|
|
| Total cash and cash equivalents |
$ |
417,375 |
|
|
$ |
417,715 |
|
|
$ |
408,182 |
|
|
$ |
421,729 |
|
|
$ |
724,237 |
|
| Securities - available for sale |
303,779 |
|
|
317,097 |
|
|
254,504 |
|
|
238,434 |
|
|
215,909 |
|
| Securities - held to maturity, net |
3,380 |
|
|
3,868 |
|
|
4,077 |
|
|
4,149 |
|
|
4,335 |
|
| Equity securities |
4,426 |
|
|
4,498 |
|
|
5,191 |
|
|
4,916 |
|
|
5,050 |
|
| Loans held for sale |
95 |
|
|
3,954 |
|
|
5,641 |
|
|
78 |
|
|
6 |
|
| Loans held for investment |
4,324,758 |
|
|
4,310,006 |
|
|
4,120,291 |
|
|
4,433,304 |
|
|
4,435,366 |
|
| Allowance for credit losses |
(34,970) |
|
|
(42,245) |
|
|
(42,807) |
|
|
(44,111) |
|
|
(43,407) |
|
| Loans, net |
4,289,788 |
|
|
4,267,761 |
|
|
4,077,484 |
|
|
4,389,193 |
|
|
4,391,959 |
|
| Assets held for sale |
— |
|
|
— |
|
|
— |
|
|
— |
|
|
24,405 |
|
| FHLB and other restricted stock |
20,099 |
|
|
24,506 |
|
|
6,252 |
|
|
6,213 |
|
|
6,169 |
|
| Premises and equipment, net |
114,673 |
|
|
115,639 |
|
|
103,339 |
|
|
104,272 |
|
|
105,293 |
|
| Other real estate owned ("OREO"), net |
— |
|
|
— |
|
|
— |
|
|
— |
|
|
168 |
|
| Goodwill and intangible assets, net |
262,958 |
|
|
265,959 |
|
|
265,767 |
|
|
268,604 |
|
|
270,666 |
|
| Bank-owned life insurance |
41,702 |
|
|
41,594 |
|
|
41,493 |
|
|
41,390 |
|
|
41,278 |
|
| Deferred tax asset, net |
7,306 |
|
|
11,562 |
|
|
16,473 |
|
|
14,663 |
|
|
13,117 |
|
| Other assets |
187,140 |
|
|
154,032 |
|
|
145,380 |
|
|
148,809 |
|
|
152,915 |
|
| Total assets |
$ |
5,652,721 |
|
|
$ |
5,628,185 |
|
|
$ |
5,333,783 |
|
|
$ |
5,642,450 |
|
|
$ |
5,955,507 |
|
| LIABILITIES |
|
|
|
|
|
|
|
|
|
| Noninterest bearing deposits |
$ |
1,608,411 |
|
|
$ |
1,727,749 |
|
|
$ |
1,756,680 |
|
|
$ |
1,897,309 |
|
|
$ |
2,085,249 |
|
| Interest bearing deposits |
2,685,055 |
|
|
2,311,245 |
|
|
2,414,656 |
|
|
2,544,045 |
|
|
2,695,675 |
|
| Total deposits |
4,293,466 |
|
|
4,038,994 |
|
|
4,171,336 |
|
|
4,441,354 |
|
|
4,780,924 |
|
| Deposits held for sale |
— |
|
|
— |
|
|
— |
|
|
— |
|
|
1,410 |
|
| Customer repurchase agreements |
— |
|
|
3,208 |
|
|
340 |
|
|
13,463 |
|
|
11,746 |
|
| Federal Home Loan Bank advances |
280,000 |
|
|
530,000 |
|
|
30,000 |
|
|
30,000 |
|
|
30,000 |
|
| Subordinated notes |
108,234 |
|
|
108,016 |
|
|
107,800 |
|
|
107,587 |
|
|
107,377 |
|
| Junior subordinated debentures |
41,444 |
|
|
41,299 |
|
|
41,158 |
|
|
41,016 |
|
|
40,876 |
|
| Other liabilities |
96,111 |
|
|
79,452 |
|
|
94,178 |
|
|
117,857 |
|
|
108,893 |
|
| Total liabilities |
4,819,255 |
|
|
4,800,969 |
|
|
4,444,812 |
|
|
4,751,277 |
|
|
5,081,226 |
|
| EQUITY |
|
|
|
|
|
|
|
|
|
| Preferred Stock |
45,000 |
|
|
45,000 |
|
|
45,000 |
|
|
45,000 |
|
|
45,000 |
|
| Common stock |
289 |
|
|
287 |
|
|
283 |
|
|
283 |
|
|
283 |
|
| Additional paid-in-capital |
542,565 |
|
|
539,241 |
|
|
534,790 |
|
|
529,804 |
|
|
524,636 |
|
| Treasury stock, at cost |
(264,916) |
|
|
(260,453) |
|
|
(182,658) |
|
|
(156,949) |
|
|
(156,924) |
|
| Retained earnings |
515,513 |
|
|
508,665 |
|
|
498,456 |
|
|
481,697 |
|
|
466,269 |
|
| Accumulated other comprehensive income (loss) |
(4,985) |
|
|
(5,524) |
|
|
(6,900) |
|
|
(8,662) |
|
|
(4,983) |
|
| Total stockholders' equity |
833,466 |
|
|
827,216 |
|
|
888,971 |
|
|
891,173 |
|
|
874,281 |
|
| Total liabilities and equity |
$ |
5,652,721 |
|
|
$ |
5,628,185 |
|
|
$ |
5,333,783 |
|
|
$ |
5,642,450 |
|
|
$ |
5,955,507 |
|
Unaudited consolidated statement of income:
|
|
|
|
|
|
|
|
|
|
|
|
|
|
|
|
|
|
|
|
|
|
|
|
|
|
|
|
|
|
|
|
|
|
|
|
|
|
|
|
|
|
|
For the Three Months Ended |
|
For the Six Months Ended |
| (Dollars in thousands) |
June 30,
2023 |
|
March 31,
2023 |
|
December 31,
2022 |
|
September 30,
2022 |
|
June 30,
2022 |
|
June 30,
2023 |
|
June 30,
2022 |
| Interest income: |
|
|
|
|
|
|
|
|
|
|
|
|
|
| Loans, including fees |
$ |
57,258 |
|
|
$ |
52,538 |
|
|
$ |
51,282 |
|
|
$ |
44,928 |
|
|
$ |
44,131 |
|
|
$ |
109,796 |
|
|
$ |
84,978 |
|
| Factored receivables, including fees |
39,819 |
|
|
40,904 |
|
|
48,644 |
|
|
53,317 |
|
|
60,026 |
|
|
80,723 |
|
|
121,232 |
|
| Securities |
5,234 |
|
|
4,113 |
|
|
3,372 |
|
|
2,308 |
|
|
1,329 |
|
|
9,347 |
|
|
2,507 |
|
| FHLB and other restricted stock |
219 |
|
|
125 |
|
|
83 |
|
|
65 |
|
|
34 |
|
|
344 |
|
|
110 |
|
| Cash deposits |
2,956 |
|
|
2,994 |
|
|
2,891 |
|
|
2,607 |
|
|
787 |
|
|
5,950 |
|
|
915 |
|
| Total interest income |
105,486 |
|
|
100,674 |
|
|
106,272 |
|
|
103,225 |
|
|
106,307 |
|
|
206,160 |
|
|
209,742 |
|
| Interest expense: |
|
|
|
|
|
|
|
|
|
|
|
|
|
| Deposits |
6,877 |
|
|
3,202 |
|
|
3,028 |
|
|
2,743 |
|
|
2,706 |
|
|
10,079 |
|
|
4,267 |
|
| Subordinated notes |
1,312 |
|
|
1,309 |
|
|
1,307 |
|
|
1,304 |
|
|
1,302 |
|
|
2,621 |
|
|
2,601 |
|
| Junior subordinated debentures |
1,090 |
|
|
1,034 |
|
|
926 |
|
|
726 |
|
|
556 |
|
|
2,124 |
|
|
1,010 |
|
| Other borrowings |
4,756 |
|
|
1,747 |
|
|
296 |
|
|
182 |
|
|
315 |
|
|
6,503 |
|
|
357 |
|
| Total interest expense |
14,035 |
|
|
7,292 |
|
|
5,557 |
|
|
4,955 |
|
|
4,879 |
|
|
21,327 |
|
|
8,235 |
|
| Net interest income |
91,451 |
|
|
93,382 |
|
|
100,715 |
|
|
98,270 |
|
|
101,428 |
|
|
184,833 |
|
|
201,507 |
|
| Credit loss expense (benefit) |
2,643 |
|
|
2,613 |
|
|
877 |
|
|
2,646 |
|
|
2,901 |
|
|
5,256 |
|
|
3,402 |
|
| Net interest income after credit loss expense (benefit) |
88,808 |
|
|
90,769 |
|
|
99,838 |
|
|
95,624 |
|
|
98,527 |
|
|
179,577 |
|
|
198,105 |
|
| Noninterest income: |
|
|
|
|
|
|
|
|
|
|
|
|
|
| Service charges on deposits |
1,769 |
|
|
1,713 |
|
|
1,659 |
|
|
1,558 |
|
|
1,664 |
|
|
3,482 |
|
|
3,627 |
|
| Card income |
2,119 |
|
|
1,968 |
|
|
2,025 |
|
|
2,034 |
|
|
2,080 |
|
|
4,087 |
|
|
4,091 |
|
| Net OREO gains (losses) and valuation adjustments |
— |
|
|
— |
|
|
— |
|
|
(19) |
|
|
18 |
|
|
— |
|
|
(114) |
|
| Net gains (losses) on sale of securities |
— |
|
|
— |
|
|
(2) |
|
|
— |
|
|
2,514 |
|
|
— |
|
|
2,514 |
|
| Net gains (losses) on sale of loans |
87 |
|
|
(84) |
|
|
(82) |
|
|
1,107 |
|
|
17,269 |
|
|
3 |
|
|
17,203 |
|
| Fee income |
7,462 |
|
|
6,150 |
|
|
6,126 |
|
|
6,120 |
|
|
6,273 |
|
|
13,612 |
|
|
11,976 |
|
| Insurance commissions |
1,303 |
|
|
1,593 |
|
|
936 |
|
|
1,191 |
|
|
1,346 |
|
|
2,896 |
|
|
3,018 |
|
|
|
|
|
|
|
|
|
|
|
|
|
|
|
| Other |
(1,229) |
|
|
(318) |
|
|
1,457 |
|
|
677 |
|
|
16,996 |
|
|
(1,547) |
|
|
16,966 |
|
| Total noninterest income |
11,511 |
|
|
11,022 |
|
|
12,119 |
|
|
12,668 |
|
|
48,160 |
|
|
22,533 |
|
|
59,281 |
|
| Noninterest expense: |
|
|
|
|
|
|
|
|
|
|
|
|
|
| Salaries and employee benefits |
54,219 |
|
|
54,686 |
|
|
51,639 |
|
|
49,307 |
|
|
54,257 |
|
|
108,905 |
|
|
100,541 |
|
| Occupancy, furniture and equipment |
7,292 |
|
|
6,703 |
|
|
7,005 |
|
|
6,826 |
|
|
6,507 |
|
|
13,995 |
|
|
12,943 |
|
| FDIC insurance and other regulatory assessments |
796 |
|
|
345 |
|
|
364 |
|
|
386 |
|
|
382 |
|
|
1,141 |
|
|
793 |
|
| Professional fees |
3,035 |
|
|
3,085 |
|
|
4,115 |
|
|
4,263 |
|
|
3,607 |
|
|
6,120 |
|
|
7,266 |
|
| Amortization of intangible assets |
3,001 |
|
|
2,850 |
|
|
2,837 |
|
|
2,913 |
|
|
3,064 |
|
|
5,851 |
|
|
6,172 |
|
| Advertising and promotion |
1,577 |
|
|
1,344 |
|
|
2,679 |
|
|
1,929 |
|
|
1,785 |
|
|
2,921 |
|
|
2,987 |
|
| Communications and technology |
11,397 |
|
|
10,852 |
|
|
9,398 |
|
|
11,935 |
|
|
9,820 |
|
|
22,249 |
|
|
18,932 |
|
| Other |
9,079 |
|
|
9,416 |
|
|
8,734 |
|
|
9,130 |
|
|
9,185 |
|
|
18,495 |
|
|
17,537 |
|
| Total noninterest expense |
90,396 |
|
|
89,281 |
|
|
86,771 |
|
|
86,689 |
|
|
88,607 |
|
|
179,677 |
|
|
167,171 |
|
| Net income before income tax |
9,923 |
|
|
12,510 |
|
|
25,186 |
|
|
21,603 |
|
|
58,080 |
|
|
22,433 |
|
|
90,215 |
|
| Income tax expense |
2,273 |
|
|
1,500 |
|
|
7,625 |
|
|
5,374 |
|
|
13,888 |
|
|
3,773 |
|
|
21,694 |
|
| Net income |
$ |
7,650 |
|
|
$ |
11,010 |
|
|
$ |
17,561 |
|
|
$ |
16,229 |
|
|
$ |
44,192 |
|
|
$ |
18,660 |
|
|
$ |
68,521 |
|
| Dividends on preferred stock |
(802) |
|
|
(801) |
|
|
(802) |
|
|
(801) |
|
|
(802) |
|
|
(1,603) |
|
|
(1,603) |
|
| Net income available to common stockholders |
$ |
6,848 |
|
|
$ |
10,209 |
|
|
$ |
16,759 |
|
|
$ |
15,428 |
|
|
$ |
43,390 |
|
|
$ |
17,057 |
|
|
$ |
66,918 |
|
Earnings per share:
|
|
|
|
|
|
|
|
|
|
|
|
|
|
|
|
|
|
|
|
|
|
|
|
|
|
|
|
|
|
|
|
|
|
|
|
|
|
|
|
|
|
|
For the Three Months Ended |
|
Six Months Ended |
| (Dollars in thousands) |
June 30,
2023 |
|
March 31,
2023 |
|
December 31,
2022 |
|
September 30,
2022 |
|
June 30,
2022 |
|
June 30,
2023 |
|
June 30,
2022 |
| Basic |
|
|
|
|
|
|
|
|
|
|
|
|
|
| Net income to common stockholders |
$ |
6,848 |
|
|
$ |
10,209 |
|
|
$ |
16,759 |
|
|
$ |
15,428 |
|
|
$ |
43,390 |
|
|
$ |
17,057 |
|
|
$ |
66,918 |
|
| Weighted average common shares outstanding |
23,138,835 |
|
|
23,361,732 |
|
|
24,129,560 |
|
|
24,227,020 |
|
|
24,427,270 |
|
|
23,249,668 |
|
|
24,612,988 |
|
| Basic earnings per common share |
$ |
0.30 |
|
|
$ |
0.44 |
|
|
$ |
0.69 |
|
|
$ |
0.64 |
|
|
$ |
1.78 |
|
|
$ |
0.73 |
|
|
$ |
2.72 |
|
|
|
|
|
|
|
|
|
|
|
|
|
|
|
| Diluted |
|
|
|
|
|
|
|
|
|
|
|
|
|
| Net income to common stockholders - diluted |
$ |
6,848 |
|
|
$ |
10,209 |
|
|
$ |
16,759 |
|
|
$ |
15,428 |
|
|
$ |
43,390 |
|
|
$ |
17,057 |
|
|
$ |
66,918 |
|
| Weighted average common shares outstanding |
23,138,835 |
|
|
23,361,732 |
|
|
24,129,560 |
|
|
24,227,020 |
|
|
24,427,270 |
|
|
23,249,668 |
|
|
24,612,988 |
|
| Dilutive effects of: |
|
|
|
|
|
|
|
|
|
|
|
|
|
| Assumed exercises of stock options |
71,658 |
|
|
76,129 |
|
|
72,183 |
|
|
85,239 |
|
|
89,443 |
|
|
73,884 |
|
|
99,402 |
|
| Restricted stock awards |
90,645 |
|
|
140,006 |
|
|
120,328 |
|
|
122,723 |
|
|
144,526 |
|
|
113,930 |
|
|
189,492 |
|
| Restricted stock units |
65,909 |
|
|
116,754 |
|
|
95,465 |
|
|
97,512 |
|
|
85,934 |
|
|
91,878 |
|
|
91,236 |
|
| Performance stock units - market based |
87,360 |
|
|
121,047 |
|
|
115,744 |
|
|
117,358 |
|
|
115,825 |
|
|
104,203 |
|
|
127,694 |
|
| Performance stock units - performance based |
— |
|
|
— |
|
|
341,732 |
|
|
327,016 |
|
|
— |
|
|
— |
|
|
— |
|
| Employee stock purchase plan |
1,064 |
|
|
496 |
|
|
4,042 |
|
|
2,389 |
|
|
3,575 |
|
|
780 |
|
|
2,173 |
|
| Weighted average shares outstanding - diluted |
23,455,471 |
|
|
23,816,164 |
|
|
24,879,054 |
|
|
24,979,257 |
|
|
24,866,573 |
|
|
23,634,343 |
|
|
25,122,985 |
|
| Diluted earnings per common share |
$ |
0.29 |
|
|
$ |
0.43 |
|
|
$ |
0.67 |
|
|
$ |
0.62 |
|
|
$ |
1.74 |
|
|
$ |
0.72 |
|
|
$ |
2.66 |
|
Shares that were not considered in computing diluted earnings per common share because they were antidilutive or have not met the thresholds to be considered in the dilutive calculation are as follows:
|
|
|
|
|
|
|
|
|
|
|
|
|
|
|
|
|
|
|
|
|
|
|
|
|
|
|
|
|
|
|
|
|
|
|
|
|
|
|
|
|
|
|
For the Three Months Ended |
|
Six Months Ended |
|
June 30,
2023 |
|
March 31,
2023 |
|
December 31,
2022 |
|
September 30,
2022 |
|
June 30,
2022 |
|
June 30,
2023 |
|
June 30,
2022 |
| Stock options |
107,309 |
|
|
49,379 |
|
|
49,379 |
|
|
52,878 |
|
|
52,878 |
|
|
107,309 |
|
|
52,878 |
|
| Restricted stock awards |
4,232 |
|
|
— |
|
|
6,348 |
|
|
6,348 |
|
|
6,348 |
|
|
4,232 |
|
|
6,348 |
|
| Restricted stock units |
11,250 |
|
|
11,250 |
|
|
11,250 |
|
|
15,000 |
|
|
15,000 |
|
|
11,250 |
|
|
15,000 |
|
| Performance stock units - market based |
42,056 |
|
|
42,056 |
|
|
45,296 |
|
|
45,296 |
|
|
45,296 |
|
|
42,056 |
|
|
45,296 |
|
| Performance stock units - performance based |
— |
|
|
— |
|
|
— |
|
|
— |
|
|
254,832 |
|
|
— |
|
|
254,832 |
|
| Employee stock purchase plan |
— |
|
|
— |
|
|
— |
|
|
— |
|
|
— |
|
|
— |
|
|
— |
|
| Accelerated share repurchase |
— |
|
|
203,352 |
|
|
— |
|
|
— |
|
|
— |
|
|
— |
|
|
— |
|
Loans held for investment summarized as of:
|
|
|
|
|
|
|
|
|
|
|
|
|
|
|
|
|
|
|
|
|
|
|
|
|
|
|
|
|
|
| (Dollars in thousands) |
June 30,
2023 |
|
March 31,
2023 |
|
December 31,
2022 |
|
September 30,
2022 |
|
June 30,
2022 |
| Commercial real estate |
$ |
768,711 |
|
|
$ |
695,160 |
|
|
$ |
678,144 |
|
|
$ |
669,742 |
|
|
$ |
649,280 |
|
| Construction, land development, land |
110,071 |
|
|
98,311 |
|
|
90,976 |
|
|
75,527 |
|
|
103,377 |
|
| 1-4 family residential properties |
130,628 |
|
|
132,010 |
|
|
125,981 |
|
|
122,594 |
|
|
126,362 |
|
| Farmland |
67,913 |
|
|
67,596 |
|
|
68,934 |
|
|
66,595 |
|
|
70,272 |
|
| Commercial |
1,218,892 |
|
|
1,239,952 |
|
|
1,251,110 |
|
|
1,282,199 |
|
|
1,225,479 |
|
| Factored receivables |
1,173,794 |
|
|
1,178,104 |
|
|
1,237,449 |
|
|
1,449,080 |
|
|
1,596,282 |
|
| Consumer |
8,409 |
|
|
8,913 |
|
|
8,868 |
|
|
9,506 |
|
|
9,709 |
|
| Mortgage warehouse |
846,340 |
|
|
889,960 |
|
|
658,829 |
|
|
758,061 |
|
|
654,605 |
|
| Total loans |
$ |
4,324,758 |
|
|
$ |
4,310,006 |
|
|
$ |
4,120,291 |
|
|
$ |
4,433,304 |
|
|
$ |
4,435,366 |
|
Our banking loan portfolio consists of traditional community bank loans as well as commercial finance product lines focused on businesses that require specialized financial solutions and national lending product lines that further diversify our lending operations.
Banking loans held for investment are further summarized below:
|
|
|
|
|
|
|
|
|
|
|
|
|
|
|
|
|
|
|
|
|
|
|
|
|
|
|
|
|
|
| (Dollars in thousands) |
June 30,
2023 |
|
March 31,
2023 |
|
December 31,
2022 |
|
September 30,
2022 |
|
June 30,
2022 |
| Commercial real estate |
$ |
768,711 |
|
|
$ |
695,160 |
|
|
$ |
678,144 |
|
|
$ |
669,742 |
|
|
$ |
649,280 |
|
| Construction, land development, land |
110,071 |
|
|
98,311 |
|
|
90,976 |
|
|
75,527 |
|
|
103,377 |
|
| 1-4 family residential |
130,628 |
|
|
132,010 |
|
|
125,981 |
|
|
122,594 |
|
|
126,362 |
|
| Farmland |
67,913 |
|
|
67,596 |
|
|
68,934 |
|
|
66,595 |
|
|
70,272 |
|
| Commercial - General |
295,159 |
|
|
319,978 |
|
|
316,364 |
|
|
319,016 |
|
|
319,660 |
|
| Commercial - Paycheck Protection Program |
45 |
|
|
52 |
|
|
55 |
|
|
60 |
|
|
4,538 |
|
| Commercial - Agriculture |
46,839 |
|
|
38,637 |
|
|
48,494 |
|
|
60,409 |
|
|
60,150 |
|
| Commercial - Equipment |
493,763 |
|
|
483,911 |
|
|
454,117 |
|
|
439,604 |
|
|
431,366 |
|
| Commercial - Asset-based lending |
231,265 |
|
|
230,326 |
|
|
229,754 |
|
|
238,119 |
|
|
239,505 |
|
| Commercial - Liquid Credit |
151,821 |
|
|
167,048 |
|
|
202,326 |
|
|
224,991 |
|
|
170,260 |
|
| Consumer |
8,409 |
|
|
8,913 |
|
|
8,868 |
|
|
9,506 |
|
|
9,709 |
|
| Mortgage Warehouse |
846,340 |
|
|
889,960 |
|
|
658,829 |
|
|
758,061 |
|
|
654,605 |
|
| Total banking loans held for investment |
$ |
3,150,964 |
|
|
$ |
3,131,902 |
|
|
$ |
2,882,842 |
|
|
$ |
2,984,224 |
|
|
$ |
2,839,084 |
|
The following table presents the Company’s operating segments:
|
|
|
|
|
|
|
|
|
|
|
|
|
|
|
|
|
|
|
|
|
|
|
|
|
|
|
|
|
|
|
|
|
| (Dollars in thousands) |
|
|
|
|
|
|
|
|
|
|
| Three months ended June 30, 2023 |
|
Banking |
|
Factoring |
|
Payments |
|
Corporate |
|
Consolidated |
| Total interest income |
|
$ |
65,624 |
|
|
$ |
36,367 |
|
|
$ |
3,451 |
|
|
$ |
44 |
|
|
$ |
105,486 |
|
| Intersegment interest allocations |
|
7,478 |
|
|
(9,358) |
|
|
1,880 |
|
|
— |
|
|
— |
|
| Total interest expense |
|
11,634 |
|
|
— |
|
|
— |
|
|
2,401 |
|
|
14,035 |
|
| Net interest income (expense) |
|
61,468 |
|
|
27,009 |
|
|
5,331 |
|
|
(2,357) |
|
|
91,451 |
|
| Credit loss expense (benefit) |
|
831 |
|
|
1,481 |
|
|
41 |
|
|
290 |
|
|
2,643 |
|
| Net interest income after credit loss expense |
|
60,637 |
|
|
25,528 |
|
|
5,290 |
|
|
(2,647) |
|
|
88,808 |
|
| Noninterest income |
|
6,347 |
|
|
980 |
|
|
4,119 |
|
|
65 |
|
|
11,511 |
|
Intersegment noninterest income (expense)(1) |
|
— |
|
|
(97) |
|
|
97 |
|
|
— |
|
|
— |
|
| Noninterest expense |
|
31,934 |
|
|
20,218 |
|
|
16,939 |
|
|
21,305 |
|
|
90,396 |
|
| Operating income (loss) |
|
$ |
35,050 |
|
|
$ |
6,193 |
|
|
$ |
(7,433) |
|
|
$ |
(23,887) |
|
|
$ |
9,923 |
|
|
|
|
|
|
|
|
|
|
|
|
|
|
|
|
|
|
|
|
|
|
|
|
|
|
|
|
|
|
|
|
|
|
| (Dollars in thousands) |
|
|
|
|
|
|
|
|
|
|
| Three months ended March 31, 2023 |
|
Banking |
|
Factoring |
|
Payments |
|
Corporate |
|
Consolidated |
| Total interest income |
|
$ |
59,726 |
|
|
$ |
38,157 |
|
|
$ |
2,747 |
|
|
$ |
44 |
|
|
$ |
100,674 |
|
| Intersegment interest allocations |
|
7,612 |
|
|
(9,154) |
|
|
1,542 |
|
|
— |
|
|
— |
|
| Total interest expense |
|
4,948 |
|
|
— |
|
|
— |
|
|
2,344 |
|
|
7,292 |
|
| Net interest income (expense) |
|
62,390 |
|
|
29,003 |
|
|
4,289 |
|
|
(2,300) |
|
|
93,382 |
|
| Credit loss expense (benefit) |
|
1,923 |
|
|
549 |
|
|
— |
|
|
141 |
|
|
2,613 |
|
| Net interest income after credit loss expense |
|
60,467 |
|
|
28,454 |
|
|
4,289 |
|
|
(2,441) |
|
|
90,769 |
|
| Noninterest income |
|
5,673 |
|
|
1,578 |
|
|
3,707 |
|
|
64 |
|
|
11,022 |
|
Intersegment noninterest income (expense)(1) |
|
— |
|
|
(265) |
|
|
265 |
|
|
— |
|
|
— |
|
| Noninterest expense |
|
32,240 |
|
|
21,769 |
|
|
15,417 |
|
|
19,855 |
|
|
89,281 |
|
| Operating income (loss) |
|
$ |
33,900 |
|
|
$ |
7,998 |
|
|
$ |
(7,156) |
|
|
$ |
(22,232) |
|
|
$ |
12,510 |
|
(1) Intersegment noninterest income (expense) includes:
|
|
|
|
|
|
|
|
|
|
|
|
|
|
|
| (Dollars in thousands) |
|
Factoring |
|
Payments |
| Three Months Ended June 30, 2023 |
|
|
|
|
| Factoring revenue received from Payments |
|
$ |
170 |
|
|
$ |
(170) |
|
| Payments revenue received from Factoring |
|
(267) |
|
|
267 |
|
| Intersegment noninterest income (expense) |
|
$ |
(97) |
|
|
$ |
97 |
|
|
|
|
|
|
| Three Months Ended March 31, 2023 |
|
|
|
|
| Factoring revenue received from Payments |
|
$ |
— |
|
|
$ |
— |
|
| Payments revenue received from Factoring |
|
(265) |
|
|
265 |
|
| Intersegment noninterest income (expense) |
|
$ |
(265) |
|
|
$ |
265 |
|
Information pertaining to our factoring segment, which includes only factoring originated by our Triumph Financial Services, LLC subsidiary, summarized as of and for the quarters ended:
|
|
|
|
|
|
|
|
|
|
|
|
|
|
|
|
|
|
|
|
|
|
|
|
|
|
|
|
|
|
|
|
|
| Factoring |
|
June 30,
2023 |
|
March 31,
2023 |
|
December 31,
2022 |
|
September 30,
2022 |
|
June 30,
2022 |
| Factored receivable period end balance |
|
$ |
997,842,000 |
|
|
$ |
1,096,071,000 |
|
|
$ |
1,151,727,000 |
|
|
$ |
1,330,122,000 |
|
|
$ |
1,474,852,000 |
|
| Yield on average receivable balance |
|
14.07 |
% |
|
13.94 |
% |
|
13.85 |
% |
|
14.11 |
% |
|
14.21 |
% |
Current quarter charge-off rate(1) |
|
0.54 |
% |
|
0.19 |
% |
|
0.14 |
% |
|
0.16 |
% |
|
— |
% |
| Factored receivables - transportation concentration |
|
95 |
% |
|
95 |
% |
|
96 |
% |
|
96 |
% |
|
94 |
% |
|
|
|
|
|
|
|
|
|
|
|
| Interest income, including fees |
|
$ |
36,367,000 |
|
|
$ |
38,157,000 |
|
|
$ |
45,325,000 |
|
|
$ |
49,561,000 |
|
|
$ |
55,854,000 |
|
Noninterest income(2) |
|
980,000 |
|
|
1,578,000 |
|
|
1,939,000 |
|
|
2,941,000 |
|
|
15,521,000 |
|
| Intersegment noninterest income |
|
170,000 |
|
|
— |
|
|
— |
|
|
— |
|
|
— |
|
| Factored receivable total revenue |
|
37,517,000 |
|
|
39,735,000 |
|
|
47,264,000 |
|
|
52,502,000 |
|
|
71,375,000 |
|
| Average net funds employed |
|
918,439,000 |
|
|
976,216,000 |
|
|
1,148,595,000 |
|
|
1,242,133,000 |
|
|
1,409,312,000 |
|
| Yield on average net funds employed |
|
16.38 |
% |
|
16.51 |
% |
|
16.33 |
% |
|
16.77 |
% |
|
20.31 |
% |
|
|
|
|
|
|
|
|
|
|
|
| Accounts receivable purchased |
|
$ |
2,732,976,000 |
|
|
$ |
2,927,104,000 |
|
|
$ |
3,277,986,000 |
|
|
$ |
3,599,771,000 |
|
|
$ |
4,023,569,000 |
|
| Number of invoices purchased |
|
1,494,963 |
|
|
1,491,763 |
|
|
1,596,843 |
|
|
1,681,489 |
|
|
1,725,721 |
|
| Average invoice size |
|
$ |
1,828 |
|
|
$ |
1,962 |
|
|
$ |
2,053 |
|
|
$ |
2,141 |
|
|
$ |
2,332 |
|
| Average invoice size - transportation |
|
$ |
1,773 |
|
|
$ |
1,911 |
|
|
$ |
2,002 |
|
|
$ |
2,073 |
|
|
$ |
2,176 |
|
| Average invoice size - non-transportation |
|
$ |
5,790 |
|
|
$ |
5,205 |
|
|
$ |
6,083 |
|
|
$ |
5,701 |
|
|
$ |
6,469 |
|
Metrics above include assets and deposits held for sale.
(1)June 30, 2023 includes a $3.3 million charge-off of an over-formula advance balance, which contributed approximately 0.32% to the net charge-off rate for the quarter. In accordance with the agreement reached with Covenant, Covenant will reimburse us for $1.7 million of this charge-off.
(2)September 30, 2022 non-interest income includes a $1.0 million gain on sale of a portfolio of factored receivables, which contributed 0.33% to the yield on average net funds employed for the quarter.
June 30, 2022 non-interest income includes a $13.2 million gain on sale of a portfolio of factored receivables, which contributed 3.76% to the yield on average net funds employed for the quarter.
Information pertaining to our Payments segment, which includes only our TriumphPay division, summarized as of and for the quarters ended:
|
|
|
|
|
|
|
|
|
|
|
|
|
|
|
|
|
|
|
|
|
|
|
|
|
|
|
|
|
|
|
|
|
| Payments |
|
June 30,
2023 |
|
March 31,
2023 |
|
December 31,
2022 |
|
September 30,
2022 |
|
June 30,
2022 |
| Supply chain financing factored receivables |
|
$ |
93,678,000 |
|
|
$ |
— |
|
|
$ |
— |
|
|
$ |
— |
|
|
$ |
— |
|
| Quickpay and other factored receivables |
|
82,274,000 |
|
|
82,033,000 |
|
|
85,722,000 |
|
|
118,958,000 |
|
|
145,835,000 |
|
| Total factored receivable period end balance |
|
$ |
175,952,000 |
|
|
$ |
82,033,000 |
|
|
$ |
85,722,000 |
|
|
$ |
118,958,000 |
|
|
$ |
145,835,000 |
|
|
|
|
|
|
|
|
|
|
|
|
| Total revenue |
|
|
|
|
|
|
|
|
|
|
| Interest income |
|
$ |
3,451,000 |
|
|
$ |
2,747,000 |
|
|
$ |
3,319,000 |
|
|
$ |
3,756,000 |
|
|
$ |
4,172,000 |
|
| Intersegment interest income allocation |
|
1,880,000 |
|
|
1,542,000 |
|
|
311,000 |
|
|
— |
|
|
— |
|
Noninterest income(1) |
|
4,119,000 |
|
|
3,707,000 |
|
|
3,551,000 |
|
|
3,518,000 |
|
|
10,309,000 |
|
| Intersegment noninterest income |
|
267,000 |
|
|
265,000 |
|
|
— |
|
|
— |
|
|
— |
|
|
|
$ |
9,717,000 |
|
|
$ |
8,261,000 |
|
|
$ |
7,181,000 |
|
|
$ |
7,274,000 |
|
|
$ |
14,481,000 |
|
|
|
|
|
|
|
|
|
|
|
|
| Total expense |
|
|
|
|
|
|
|
|
|
|
| Intersegment interest expense allocation |
|
$ |
— |
|
|
$ |
— |
|
|
$ |
— |
|
|
$ |
420,000 |
|
|
$ |
368,000 |
|
| Credit loss expense (benefit) |
|
41,000 |
|
|
— |
|
|
(187,000) |
|
|
235,000 |
|
|
(184,000) |
|
| Noninterest expense |
|
16,939,000 |
|
|
15,417,000 |
|
|
17,169,000 |
|
|
14,066,000 |
|
|
17,663,000 |
|
| Intersegment noninterest expense |
|
170,000 |
|
|
— |
|
|
— |
|
|
— |
|
|
— |
|
|
|
$ |
17,150,000 |
|
|
$ |
15,417,000 |
|
|
$ |
16,982,000 |
|
|
$ |
14,721,000 |
|
|
$ |
17,847,000 |
|
|
|
|
|
|
|
|
|
|
|
|
| Pre-tax operating income (loss) |
|
$ |
(7,433,000) |
|
|
$ |
(7,156,000) |
|
|
$ |
(9,801,000) |
|
|
$ |
(7,447,000) |
|
|
$ |
(3,366,000) |
|
| Intersegment interest expense allocation |
|
— |
|
|
— |
|
|
— |
|
|
420,000 |
|
|
368,000 |
|
| Depreciation and software amortization expense |
|
368,000 |
|
|
193,000 |
|
|
178,000 |
|
|
120,000 |
|
|
103,000 |
|
| Intangible amortization expense |
|
1,729,000 |
|
|
1,548,000 |
|
|
1,451,000 |
|
|
1,450,000 |
|
|
1,477,000 |
|
Earnings (losses) before interest, taxes, depreciation, and amortization(2) |
|
$ |
(5,336,000) |
|
|
$ |
(5,415,000) |
|
|
$ |
(8,172,000) |
|
|
$ |
(5,457,000) |
|
|
$ |
(1,418,000) |
|
|
|
|
|
|
|
|
|
|
|
|
|
|
|
|
|
|
|
|
|
|
|
|
|
|
|
|
|
|
|
|
|
|
| EBITDA Margin |
|
(55) |
% |
|
(66) |
% |
|
(114) |
% |
|
(75) |
% |
|
(10) |
% |
|
|
|
|
|
|
|
|
|
|
|
| Number of invoices processed |
|
4,526,629 |
|
4,260,654 |
|
4,605,020 |
|
4,676,249 |
|
4,394,351 |
| Amount of payments processed |
|
$4,940,317,000 |
|
$5,030,548,000 |
|
$5,577,014,000 |
|
$5,951,706,000 |
|
$6,033,898,000 |
| Network invoice volume |
|
181,904 |
|
159,353 |
|
157,004 |
|
144,253 |
|
118,580 |
| Network payment volume |
|
$299,948,000 |
|
$289,667,000 |
|
$301,366,000 |
|
$288,410,000 |
|
$253,312,000 |
(1)June 30, 2022 non-interest income includes a $10.2 million gain on an equity investment and a $3.2 million loss on impairment of warrants.
(2)Earnings (losses) before interest, taxes, depreciation, and amortization ("EBITDA") is a non-GAAP financial measure used as a supplemental measure to evaluate the performance of our Payments segment.
Deposits summarized as of:
|
|
|
|
|
|
|
|
|
|
|
|
|
|
|
|
|
|
|
|
|
|
|
|
|
|
|
|
|
|
| (Dollars in thousands) |
June 30,
2023 |
|
March 31,
2023 |
|
December 31,
2022 |
|
September 30,
2022 |
|
June 30,
2022 |
| Non-interest bearing demand |
$ |
1,608,411 |
|
|
$ |
1,727,749 |
|
|
$ |
1,756,680 |
|
|
$ |
1,897,309 |
|
|
$ |
2,085,249 |
|
| Interest bearing demand |
778,972 |
|
|
818,382 |
|
|
856,512 |
|
|
883,581 |
|
|
879,072 |
|
| Individual retirement accounts |
57,575 |
|
|
62,030 |
|
|
68,125 |
|
|
74,423 |
|
|
80,187 |
|
| Money market |
569,318 |
|
|
488,064 |
|
|
508,534 |
|
|
505,082 |
|
|
538,966 |
|
| Savings |
524,210 |
|
|
535,796 |
|
|
551,780 |
|
|
546,862 |
|
|
543,969 |
|
| Certificates of deposit |
270,273 |
|
|
286,153 |
|
|
319,150 |
|
|
373,734 |
|
|
437,766 |
|
| Brokered time deposits |
484,666 |
|
|
120,820 |
|
|
110,555 |
|
|
160,363 |
|
|
215,715 |
|
| Other brokered deposits |
41 |
|
|
— |
|
|
— |
|
|
— |
|
|
— |
|
| Total deposits |
$ |
4,293,466 |
|
|
$ |
4,038,994 |
|
|
$ |
4,171,336 |
|
|
$ |
4,441,354 |
|
|
$ |
4,780,924 |
|
Net interest margin summarized for the three months ended:
|
|
|
|
|
|
|
|
|
|
|
|
|
|
|
|
|
|
|
|
|
|
|
|
|
|
|
|
|
|
|
|
|
|
|
|
|
June 30, 2023 |
|
March 31, 2023 |
| (Dollars in thousands) |
Average
Balance |
|
Interest |
|
Average
Rate(4)
|
|
Average
Balance |
|
Interest |
|
Average
Rate(4)
|
| Interest earning assets: |
|
|
|
|
|
|
|
|
|
|
|
| Interest earning cash balances |
$ |
227,696 |
|
|
$ |
2,956 |
|
|
5.21 |
% |
|
$ |
260,508 |
|
|
$ |
2,994 |
|
|
4.66 |
% |
| Taxable securities |
318,285 |
|
|
5,167 |
|
|
6.51 |
% |
|
295,353 |
|
|
4,029 |
|
|
5.53 |
% |
| Tax-exempt securities |
10,399 |
|
|
67 |
|
|
2.58 |
% |
|
13,142 |
|
|
84 |
|
|
2.59 |
% |
| FHLB and other restricted stock |
27,071 |
|
|
219 |
|
|
3.24 |
% |
|
9,951 |
|
|
125 |
|
|
5.09 |
% |
Loans(1) |
4,262,170 |
|
|
97,077 |
|
|
9.14 |
% |
|
4,110,129 |
|
|
93,442 |
|
|
9.22 |
% |
| Total interest earning assets |
$ |
4,845,621 |
|
|
$ |
105,486 |
|
|
8.73 |
% |
|
$ |
4,689,083 |
|
|
$ |
100,674 |
|
|
8.71 |
% |
| Non-interest earning assets: |
|
|
|
|
|
|
|
|
|
|
|
| Other assets |
616,325 |
|
|
|
|
|
|
620,941 |
|
|
|
|
|
| Total assets |
$ |
5,461,946 |
|
|
|
|
|
|
$ |
5,310,024 |
|
|
|
|
|
| Interest bearing liabilities: |
|
|
|
|
|
|
|
|
|
|
|
| Deposits: |
|
|
|
|
|
|
|
|
|
|
|
| Interest bearing demand |
$ |
804,799 |
|
|
$ |
715 |
|
|
0.36 |
% |
|
$ |
836,309 |
|
|
$ |
570 |
|
|
0.28 |
% |
| Individual retirement accounts |
60,171 |
|
|
104 |
|
|
0.69 |
% |
|
65,182 |
|
|
85 |
|
|
0.53 |
% |
| Money market |
506,782 |
|
|
1,685 |
|
|
1.33 |
% |
|
498,083 |
|
|
1,130 |
|
|
0.92 |
% |
| Savings |
529,952 |
|
|
475 |
|
|
0.36 |
% |
|
544,939 |
|
|
309 |
|
|
0.23 |
% |
| Certificates of deposit |
286,253 |
|
|
902 |
|
|
1.26 |
% |
|
299,148 |
|
|
555 |
|
|
0.75 |
% |
| Brokered time deposits |
244,721 |
|
|
2,823 |
|
|
4.63 |
% |
|
99,182 |
|
|
550 |
|
|
2.25 |
% |
| Other brokered deposits |
13,188 |
|
|
173 |
|
|
5.26 |
% |
|
278 |
|
|
3 |
|
|
4.38 |
% |
| Total interest bearing deposits |
2,445,866 |
|
|
6,877 |
|
|
1.13 |
% |
|
2,343,121 |
|
|
3,202 |
|
|
0.55 |
% |
| Federal Home Loan Bank advances |
363,901 |
|
|
4,756 |
|
|
5.24 |
% |
|
138,778 |
|
|
1,747 |
|
|
5.11 |
% |
| Subordinated notes |
108,115 |
|
|
1,312 |
|
|
4.87 |
% |
|
107,901 |
|
|
1,309 |
|
|
4.92 |
% |
| Junior subordinated debentures |
41,378 |
|
|
1,090 |
|
|
10.57 |
% |
|
41,227 |
|
|
1,034 |
|
|
10.17 |
% |
| Other borrowings |
308 |
|
|
— |
|
|
— |
% |
|
2,620 |
|
|
— |
|
|
— |
% |
| Total interest bearing liabilities |
$ |
2,959,568 |
|
|
$ |
14,035 |
|
|
1.90 |
% |
|
$ |
2,633,647 |
|
|
$ |
7,292 |
|
|
1.12 |
% |
| Noninterest bearing liabilities and equity: |
|
|
|
|
|
|
|
|
|
|
|
| Non-interest bearing demand deposits |
1,598,733 |
|
|
|
|
|
|
1,704,778 |
|
|
|
|
|
| Other liabilities |
61,666 |
|
|
|
|
|
|
113,487 |
|
|
|
|
|
| Total equity |
841,979 |
|
|
|
|
|
|
858,112 |
|
|
|
|
|
| Total liabilities and equity |
$ |
5,461,946 |
|
|
|
|
|
|
$ |
5,310,024 |
|
|
|
|
|
| Net interest income |
|
|
$ |
91,451 |
|
|
|
|
|
|
$ |
93,382 |
|
|
|
Interest spread(2) |
|
|
|
|
6.83 |
% |
|
|
|
|
|
7.59 |
% |
Net interest margin(3) |
|
|
|
|
7.57 |
% |
|
|
|
|
|
8.08 |
% |
(1) Loan balance totals include respective nonaccrual assets.
(2) Net interest spread is the yield on average interest earning assets less the rate on interest bearing liabilities.
(3) Net interest margin is the ratio of net interest income to average interest earning assets.
(4) Average rates have been annualized.
Additional information pertaining to our loan portfolio, including loans held for investment and loans held for sale, summarized for the quarters ended:
|
|
|
|
|
|
|
|
|
|
|
|
|
|
|
|
|
|
|
|
|
|
|
|
|
|
|
|
|
|
| (Dollars in thousands) |
June 30,
2023 |
|
March 31,
2023 |
|
December 31,
2022 |
|
September 30,
2022 |
|
June 30,
2022 |
| Average Banking loans |
$ |
3,120,594 |
|
|
$ |
2,916,614 |
|
|
$ |
2,891,412 |
|
|
$ |
2,830,507 |
|
|
$ |
3,014,573 |
|
| Average Factoring receivables |
1,036,922 |
|
|
1,110,203 |
|
|
1,298,286 |
|
|
1,393,141 |
|
|
1,576,208 |
|
| Average Payments receivables |
104,654 |
|
|
83,312 |
|
|
105,101 |
|
|
131,484 |
|
|
163,112 |
|
| Average total loans |
$ |
4,262,170 |
|
|
$ |
4,110,129 |
|
|
$ |
4,294,799 |
|
|
$ |
4,355,132 |
|
|
$ |
4,753,893 |
|
| Banking yield |
7.36 |
% |
|
7.31 |
% |
|
7.04 |
% |
|
6.30 |
% |
|
5.87 |
% |
| Factoring yield |
14.07 |
% |
|
13.94 |
% |
|
13.85 |
% |
|
14.11 |
% |
|
14.21 |
% |
| Payments yield |
13.23 |
% |
|
13.37 |
% |
|
12.53 |
% |
|
11.33 |
% |
|
10.26 |
% |
| Total loan yield |
9.14 |
% |
|
9.22 |
% |
|
9.23 |
% |
|
8.95 |
% |
|
8.79 |
% |
Metrics and non-GAAP financial reconciliation:
|
|
|
|
|
|
|
|
|
|
|
|
|
|
|
|
|
|
|
|
|
|
|
|
|
|
|
|
|
|
|
|
|
|
|
|
|
|
|
|
|
|
|
|
|
|
|
As of and for the Three Months Ended |
|
As of and for the Six Months Ended |
(Dollars in thousands,
except per share amounts) |
|
June 30,
2023 |
|
March 31,
2023 |
|
December 31,
2022 |
|
September 30,
2022 |
|
June 30,
2022 |
|
June 30,
2023 |
|
June 30,
2022 |
|
|
|
|
|
|
|
|
|
|
|
|
|
|
|
|
|
|
|
|
|
|
|
|
|
|
|
|
|
|
|
|
|
|
|
|
|
|
|
|
|
|
|
|
|
|
|
|
|
|
|
|
|
|
|
|
|
|
|
|
|
|
|
|
|
|
|
|
|
|
|
|
|
|
|
|
|
|
|
|
|
|
|
|
|
|
|
|
|
|
|
|
|
|
|
|
|
|
|
|
|
|
|
|
|
|
|
|
|
|
|
|
|
|
|
|
|
|
|
|
|
|
|
|
|
|
|
|
|
|
|
|
|
|
|
| Average total stockholders' equity |
|
$ |
841,979 |
|
|
$ |
858,112 |
|
|
$ |
909,225 |
|
|
$ |
898,845 |
|
|
$ |
882,505 |
|
|
$ |
850,002 |
|
|
$ |
881,732 |
|
| Average preferred stock liquidation preference |
|
(45,000) |
|
|
(45,000) |
|
|
(45,000) |
|
|
(45,000) |
|
|
(45,000) |
|
|
(45,000) |
|
|
(45,000) |
|
| Average total common stockholders' equity |
|
796,979 |
|
|
813,112 |
|
|
864,225 |
|
|
853,845 |
|
|
837,505 |
|
|
805,002 |
|
|
836,732 |
|
| Average goodwill and other intangibles |
|
(264,544) |
|
|
(265,320) |
|
|
(267,206) |
|
|
(269,417) |
|
|
(269,319) |
|
|
(264,930) |
|
|
(272,332) |
|
| Average tangible common stockholders' equity |
|
$ |
532,435 |
|
|
$ |
547,792 |
|
|
$ |
597,019 |
|
|
$ |
584,428 |
|
|
$ |
568,186 |
|
|
$ |
540,072 |
|
|
$ |
564,400 |
|
|
|
|
|
|
|
|
|
|
|
|
|
|
|
|
| Net income available to common stockholders |
|
$ |
6,848 |
|
|
$ |
10,209 |
|
|
$ |
16,759 |
|
|
$ |
15,428 |
|
|
$ |
43,390 |
|
|
$ |
17,057 |
|
|
$ |
66,918 |
|
| Average tangible common equity |
|
532,435 |
|
|
547,792 |
|
|
597,019 |
|
|
584,428 |
|
|
568,186 |
|
|
540,072 |
|
|
564,400 |
|
| Return on average tangible common equity |
|
5.16 |
% |
|
7.56 |
% |
|
11.14 |
% |
|
10.47 |
% |
|
30.63 |
% |
|
6.37 |
% |
|
23.91 |
% |
|
|
|
|
|
|
|
|
|
|
|
|
|
|
|
|
|
|
|
|
|
|
|
|
|
|
|
|
|
|
|
|
|
|
|
|
|
|
|
|
|
|
|
|
|
|
|
|
|
|
|
|
|
|
|
|
|
|
|
|
|
|
|
|
|
|
|
|
|
|
|
|
|
|
|
|
|
|
|
|
|
|
|
|
|
|
|
|
|
|
|
|
|
|
|
|
|
|
|
|
|
|
|
|
|
|
|
|
|
|
|
|
|
|
|
|
|
|
|
|
|
|
|
|
|
|
|
|
|
|
|
|
|
|
|
|
|
|
|
|
|
|
|
|
|
|
|
|
|
|
|
|
|
|
|
|
|
|
|
|
|
|
|
|
|
| Net interest income |
|
$ |
91,451 |
|
|
$ |
93,382 |
|
|
$ |
100,715 |
|
|
$ |
98,270 |
|
|
$ |
101,428 |
|
|
$ |
184,833 |
|
|
$ |
201,507 |
|
| Noninterest income |
|
11,511 |
|
|
11,022 |
|
|
12,119 |
|
|
12,668 |
|
|
48,160 |
|
|
22,533 |
|
|
59,281 |
|
| Operating revenue |
|
$ |
102,962 |
|
|
$ |
104,404 |
|
|
$ |
112,834 |
|
|
$ |
110,938 |
|
|
$ |
149,588 |
|
|
$ |
207,366 |
|
|
$ |
260,788 |
|
| Noninterest expenses |
|
$ |
90,396 |
|
|
$ |
89,281 |
|
|
$ |
86,771 |
|
|
$ |
86,689 |
|
|
$ |
88,607 |
|
|
$ |
179,677 |
|
|
$ |
167,171 |
|
| Efficiency ratio |
|
87.80 |
% |
|
85.52 |
% |
|
76.90 |
% |
|
78.14 |
% |
|
59.23 |
% |
|
86.65 |
% |
|
64.10 |
% |
|
|
|
|
|
|
|
|
|
|
|
|
|
|
|
|
|
|
|
|
|
|
|
|
|
|
|
|
|
|
|
|
|
|
|
|
|
|
|
|
|
|
|
|
|
|
|
|
|
|
|
|
|
|
|
|
|
|
|
|
|
|
|
|
|
|
|
|
|
|
|
|
|
|
|
|
|
|
|
|
|
|
|
|
|
|
|
|
|
|
|
|
|
|
|
|
|
|
|
|
|
|
|
|
|
|
|
|
|
|
|
|
|
|
|
|
|
|
|
|
|
|
|
|
|
|
|
|
|
|
|
|
|
|
|
|
|
|
|
|
|
|
|
|
|
|
|
|
|
|
|
|
|
|
|
|
|
|
|
|
|
|
|
|
|
|
|
|
|
|
|
|
|
|
|
|
|
|
|
|
| Net non-interest expense to average assets ratio: |
|
|
|
|
|
|
|
|
|
|
|
|
|
|
| Noninterest expenses |
|
$ |
90,396 |
|
|
$ |
89,281 |
|
|
$ |
86,771 |
|
|
$ |
86,689 |
|
|
$ |
88,607 |
|
|
$ |
179,677 |
|
|
$ |
167,171 |
|
| Noninterest income |
|
$ |
11,511 |
|
|
$ |
11,022 |
|
|
$ |
12,119 |
|
|
$ |
12,668 |
|
|
$ |
48,160 |
|
|
$ |
22,533 |
|
|
$ |
59,281 |
|
| Net noninterest expenses |
|
$ |
78,885 |
|
|
$ |
78,259 |
|
|
$ |
74,652 |
|
|
$ |
74,021 |
|
|
$ |
40,447 |
|
|
$ |
157,144 |
|
|
$ |
107,890 |
|
| Average total assets |
|
$ |
5,461,946 |
|
|
$ |
5,310,024 |
|
|
$ |
5,504,093 |
|
|
$ |
5,700,547 |
|
|
$ |
5,878,320 |
|
|
$ |
5,386,429 |
|
|
$ |
5,860,916 |
|
| Net noninterest expense to average assets ratio |
|
5.79 |
% |
|
5.98 |
% |
|
5.38 |
% |
|
5.15 |
% |
|
2.76 |
% |
|
5.88 |
% |
|
3.71 |
% |
|
|
|
|
|
|
|
|
|
|
|
|
|
|
|
| Total stockholders' equity |
|
$ |
833,466 |
|
|
$ |
827,216 |
|
|
$ |
888,971 |
|
|
$ |
891,173 |
|
|
$ |
874,281 |
|
|
$ |
833,466 |
|
|
$ |
874,281 |
|
| Preferred stock liquidation preference |
|
(45,000) |
|
|
(45,000) |
|
|
(45,000) |
|
|
(45,000) |
|
|
(45,000) |
|
|
(45,000) |
|
|
(45,000) |
|
| Total common stockholders' equity |
|
788,466 |
|
|
782,216 |
|
|
843,971 |
|
|
846,173 |
|
|
829,281 |
|
|
788,466 |
|
|
829,281 |
|
| Goodwill and other intangibles |
|
(262,958) |
|
|
(265,959) |
|
|
(265,767) |
|
|
(268,604) |
|
|
(270,666) |
|
|
(262,958) |
|
|
(270,666) |
|
| Tangible common stockholders' equity |
|
$ |
525,508 |
|
|
$ |
516,257 |
|
|
$ |
578,204 |
|
|
$ |
577,569 |
|
|
$ |
558,615 |
|
|
$ |
525,508 |
|
|
$ |
558,615 |
|
| Common shares outstanding |
|
23,269,885 |
|
|
23,370,515 |
|
|
24,053,585 |
|
|
24,478,288 |
|
|
24,457,777 |
|
|
23,269,885 |
|
|
24,457,777 |
|
| Tangible book value per share |
|
$ |
22.58 |
|
|
$ |
22.09 |
|
|
$ |
24.04 |
|
|
$ |
23.60 |
|
|
$ |
22.84 |
|
|
$ |
22.58 |
|
|
$ |
22.84 |
|
|
|
|
|
|
|
|
|
|
|
|
|
|
|
|
| Total assets at end of period |
|
$ |
5,652,721 |
|
|
$ |
5,628,185 |
|
|
$ |
5,333,783 |
|
|
$ |
5,642,450 |
|
|
$ |
5,955,507 |
|
|
$ |
5,652,721 |
|
|
$ |
5,955,507 |
|
| Goodwill and other intangibles |
|
(262,958) |
|
|
(265,959) |
|
|
(265,767) |
|
|
(268,604) |
|
|
(270,666) |
|
|
(262,958) |
|
|
(270,666) |
|
| Tangible assets at period end |
|
$ |
5,389,763 |
|
|
$ |
5,362,226 |
|
|
$ |
5,068,016 |
|
|
$ |
5,373,846 |
|
|
$ |
5,684,841 |
|
|
$ |
5,389,763 |
|
|
$ |
5,684,841 |
|
| Tangible common stockholders' equity ratio |
|
9.75 |
% |
|
9.63 |
% |
|
11.41 |
% |
|
10.75 |
% |
|
9.83 |
% |
|
9.75 |
% |
|
9.83 |
% |
1)Triumph Financial uses certain non-GAAP financial measures to provide meaningful supplemental information regarding Triumph Financial's operational performance and to enhance investors' overall understanding of such financial performance. The non-GAAP measures used by Triumph Financial include the following:
•"Tangible common stockholders' equity" is defined as common stockholders' equity less goodwill and other intangible assets.
•"Total tangible assets" is defined as total assets less goodwill and other intangible assets.
•"Tangible book value per share" is defined as tangible common stockholders' equity divided by total common shares outstanding. This measure is important to investors interested in changes from period-to-period in book value per share exclusive of changes in intangible assets.
•"Tangible common stockholders' equity ratio" is defined as the ratio of tangible common stockholders' equity divided by total tangible assets. We believe that this measure is important to many investors in the marketplace who are interested in relative changes from period-to period in common equity and total assets, each exclusive of changes in intangible assets.
•"Return on Average Tangible Common Equity" is defined as net income available to common stockholders divided by average tangible common stockholders' equity.
2)Performance ratios include discount accretion on purchased loans for the periods presented as follows:
|
|
|
|
|
|
|
|
|
|
|
|
|
|
|
|
|
|
|
|
|
|
|
|
|
|
|
|
|
|
|
|
|
|
|
|
|
|
|
|
|
|
|
For the Three Months Ended |
|
For the Six Months Ended |
| (Dollars in thousands) |
June 30,
2023 |
|
March 31,
2023 |
|
December 31,
2022 |
|
September 30,
2022 |
|
June 30,
2022 |
|
June 30,
2023 |
|
June 30,
2022 |
| Loan discount accretion |
$ |
990 |
|
|
$ |
1,810 |
|
|
$ |
2,011 |
|
|
$ |
1,539 |
|
|
$ |
3,556 |
|
|
$ |
2,800 |
|
|
$ |
5,092 |
|
3)Asset quality ratios exclude loans held for sale, except for non-performing assets to total assets.
4)Current quarter ratios are preliminary.
Source: Triumph Financial, Inc.
###
Investor Relations:
Luke Wyse
Senior Vice President, Finance & Investor Relations
lwyse@tbkbank.com
214-365-6936
Media Contact:
Amanda Tavackoli
Senior Vice President, Director of Corporate Communication
atavackoli@tbkbank.com
214-365-6930