Document
Exhibit 99.1
April 25, 2023
Fellow Shareholders,
For the first quarter, we earned net income to common stockholders of $10.2 million, or $0.43 per diluted share. I will begin with our usual metrics overview and then address the recent events in banking and our response to the same. I will finish with information on our assessment of the freight market, some changes to our segment reporting, and some developments at TriumphPay.
Discussion of the Quarter
Before diving into the detail, I will address the obvious: our first quarter earnings were materially lower than recent periods. The bulk of this decline was driven by a $7.8 million decrease in revenue in our factoring business. Invoice prices declined sharply, and the seasonal weakness in volume that we normally see in the first quarter was worse than usual. Until this freight recession abates, our near-term earnings will remain under pressure. There is no other way to say it. There are, however, opportunities created by this market which I will discuss further below.
The tables below outline some of our key metrics.
|
|
|
|
|
|
|
|
|
|
|
|
|
|
|
|
|
|
|
|
|
|
|
|
|
|
|
|
|
|
|
|
|
|
|
As of and for the Three Months Ended |
|
|
| (Dollars in thousands) |
March 31,
2023 |
|
December 31,
2022 |
|
September 30,
2022 |
|
June 30,
2022 |
|
March 31,
2022 |
|
|
|
|
| Financial Highlights: |
|
|
|
|
|
|
|
|
|
|
|
|
|
| Loans held for investment |
$ |
4,310,006 |
|
|
$ |
4,120,291 |
|
|
$ |
4,433,304 |
|
|
$ |
4,435,366 |
|
|
$ |
4,724,078 |
|
|
|
|
|
| Deposits |
$ |
4,038,994 |
|
|
$ |
4,171,336 |
|
|
$ |
4,441,354 |
|
|
$ |
4,780,924 |
|
|
$ |
4,331,786 |
|
|
|
|
|
| Net income available to common stockholders |
$ |
10,209 |
|
|
$ |
16,759 |
|
|
$ |
15,428 |
|
|
$ |
43,390 |
|
|
$ |
23,528 |
|
|
|
|
|
| Diluted earnings per common share |
$ |
0.43 |
|
|
$ |
0.67 |
|
|
$ |
0.62 |
|
|
$ |
1.74 |
|
|
$ |
0.93 |
|
|
|
|
|
Return on average assets(1) |
0.84 |
% |
|
1.27 |
% |
|
1.13 |
% |
|
3.02 |
% |
|
1.69 |
% |
|
|
|
|
Yield on loans(1) |
9.22 |
% |
|
9.23 |
% |
|
8.95 |
% |
|
8.79 |
% |
|
8.60 |
% |
|
|
|
|
Cost of total deposits(1) |
0.32 |
% |
|
0.28 |
% |
|
0.24 |
% |
|
0.23 |
% |
|
0.14 |
% |
|
|
|
|
| Non-performing assets to total assets |
0.88 |
% |
|
1.02 |
% |
|
1.11 |
% |
|
0.83 |
% |
|
0.87 |
% |
|
|
|
|
| ACL to total loans |
0.98 |
% |
|
1.04 |
% |
|
0.99 |
% |
|
0.98 |
% |
|
0.88 |
% |
|
|
|
|
Total capital to risk-weighted assets(2) |
15.51 |
% |
|
17.66 |
% |
|
16.56 |
% |
|
15.91 |
% |
|
14.53 |
% |
|
|
|
|
Common equity tier 1 capital to risk-weighted assets(2) |
10.77 |
% |
|
12.73 |
% |
|
11.93 |
% |
|
11.35 |
% |
|
10.40 |
% |
|
|
|
|
(1) Current quarter ratios are annualized
(2) Current period ratios are preliminary
|
|
|
|
|
|
|
|
|
|
|
|
|
|
|
|
|
|
|
|
|
|
|
|
|
|
|
|
|
|
|
|
|
|
|
|
|
|
|
|
|
|
|
|
|
|
|
|
|
|
|
|
|
|
|
March 31,
2023 |
|
December 31,
2022 |
|
September 30,
2022 |
|
June 30,
2022 |
|
March 31,
2022 |
|
Current Quarter Q/Q |
|
Current Year Y/Y |
| For the Qtr Ending |
|
|
|
|
|
Change |
|
% Change |
|
Change |
|
% Change |
| Factoring: |
|
|
|
|
|
|
|
|
|
|
|
|
|
|
|
|
|
| Invoice Volume |
1,491,763 |
|
|
1,596,843 |
|
|
1,681,489 |
|
|
1,725,721 |
|
|
1,604,012 |
|
|
(105,080) |
|
|
(6.6) |
% |
|
(112,249) |
|
|
(7.0) |
% |
| Purchased Volume |
$ |
2,927,104,000 |
|
|
$ |
3,277,986,000 |
|
|
$ |
3,599,771,000 |
|
|
$ |
4,023,569,000 |
|
|
$ |
4,041,883,000 |
|
|
$ |
(350,882,000) |
|
|
(10.7) |
% |
|
$ |
(1,114,779,000) |
|
|
(27.6) |
% |
| Average Transportation Invoice Size |
$ |
1,911 |
|
|
$ |
2,002 |
|
|
$ |
2,073 |
|
|
$ |
2,176 |
|
|
$ |
2,401 |
|
|
$ |
(91) |
|
|
(4.5) |
% |
|
$ |
(490) |
|
|
(20.4) |
% |
| Payments: |
|
|
|
|
|
|
|
|
|
|
|
|
|
|
|
|
|
| Invoice Volume |
4,260,654 |
|
|
4,605,020 |
|
|
4,676,249 |
|
|
4,394,351 |
|
|
3,982,879 |
|
|
(344,366) |
|
|
(7.5) |
% |
|
277,775 |
|
|
7.0 |
% |
| Payment Volume |
$ |
5,030,548,000 |
|
|
$ |
5,577,014,000 |
|
|
$ |
5,951,706,000 |
|
|
$ |
6,033,898,000 |
|
|
$ |
5,700,759,000 |
|
|
$ |
(546,466,000) |
|
|
(9.8) |
% |
|
$ |
(670,211,000) |
|
|
(11.8) |
% |
| Network Invoice Volume |
159,353 |
|
|
157,004 |
|
|
144,253 |
|
|
118,580 |
|
|
52,182 |
|
|
2,349 |
|
|
1.5 |
% |
|
107,171 |
|
|
205.4 |
% |
| Network Payment Volume |
$ |
289,667,000 |
|
|
$ |
301,366,000 |
|
|
$ |
288,410,000 |
|
|
$ |
253,312,000 |
|
|
$ |
129,569,000 |
|
|
$ |
(11,699,000) |
|
|
(3.9) |
% |
|
$ |
160,098,000 |
|
|
123.6 |
% |
| Number of Freight Brokers |
589 |
|
|
580 |
|
|
584 |
|
|
566 |
|
|
558 |
|
|
9 |
|
|
1.6 |
% |
|
31 |
|
|
5.6 |
% |
| Number of Factors |
70 |
|
|
70 |
|
|
70 |
|
|
69 |
|
|
72 |
|
|
— |
|
|
— |
% |
|
(2) |
|
|
(2.8) |
% |
Payments
TriumphPay made steady progress throughout Q1 on its journey to be THE payments network for trucking. Despite the market headwinds, TriumphPay continued to sign and integrate new clients, while expanding its relationship with existing customers by offering additional features.
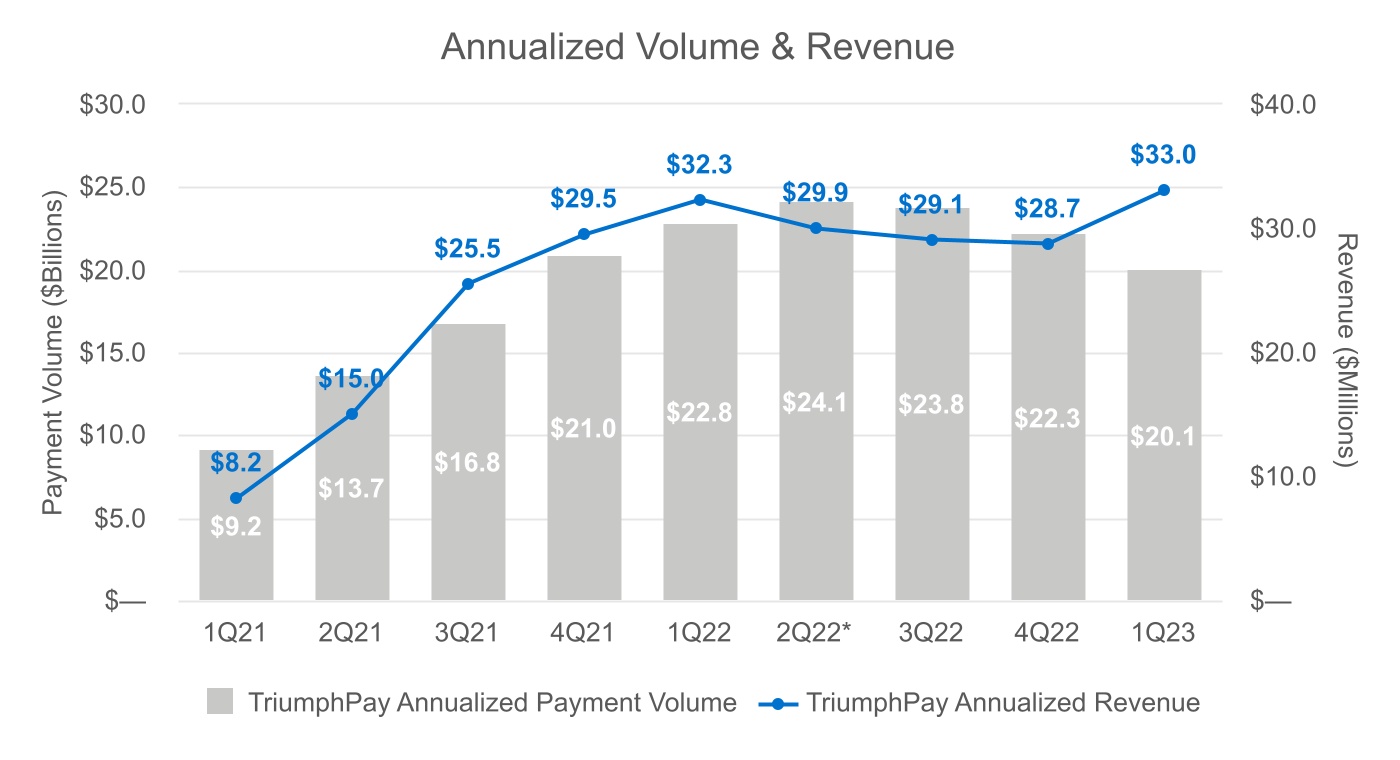
For the quarter, TriumphPay’s invoice volume decreased 7.5%, and total payment volume decreased by 9.8% to $20.1 billion, annualized. The average invoice paid by TriumphPay decreased 2.5% in size. In contrast, network transaction volume increased 1.5%. Network transaction volume increasing in a declining market is a material positive.
The numbers tell us that truckers drove less and were paid less per mile when they drove. This contributed to the decline in revenue in the Annual Revenue Cohort chart below. Most of the decrease quarter-over-quarter is related to lower quickpay revenue due to declines in invoice prices and volumes. Despite that revenue drop, TriumphPay’s EBITDA margin improved to –66% from –114% last quarter driven by increased intersegment interest income on float balances and reduced noninterest expense. This margin improvement without a material volume increase during the quarter demonstrates the earnings power of the network and sets us up well for achieving our profitably goals on or ahead of our projections.
*Annualized Revenue excludes $7.0 million net gain on minority investment mark-to-market
In the past, we have reported and talked about payment volume exclusively, but we touch far more freight than this reported metric. In addition to payment volume, TriumphPay Audit processed $17.0 billion (annualized) in invoices in Q1. This brings the combined annualized payment and audit volume of the platform to $37.1 billion. After excluding $3.4 billion in annualized payments made on behalf of our shipper customers, this total volume represents over 20% of the brokered freight market in the U.S. Over time, we expect to convert a significant amount of this audit volume to payment volume.
*Excludes $7.0 million net gain on minority investment mark-to-market **Annualized.
All years exclude intersegment interest allocations and estimates of deferred fees
Factoring
As mentioned in the opening, we felt the pressure of the spot rate environment in the first quarter of 2023 with our average transportation invoice price dropping to $1,911, down $490 from the same quarter in 2022 and down $91 from Q4. This, coupled with lower utilization among our customer fleets due to a softening market, contributed to a 10.7% decrease in purchased volumes. These are true headwinds to profitability. On the positive side of the equation, we have made considerable progress improving our operations around the collection of past-due invoices in our factoring segment. Last quarter, past-due factoring receivables dropped $32MM driving a material improvement in our enterprise past-due ratio from 2.53% to 1.67%. As mentioned, I will address our assessment of the freight market in general later in this letter.
Thoughts on Recent Events in Banking
The last 45 days have been interesting times in banking. Hindsight is 20/20 – litigation and regulation will likely increase as a result of improper risk-taking by a few institutions. I have many thoughts on this, but I will summarize by giving you an excerpt of the email I sent to our board and leadership team the morning of March 9, 2023 (edited in part for clarity):
Regardless of the institution, all of the recent turmoil in banking shares a common denominator (i) concentration of liquidity and (ii) interest rate risk. A few years ago, I started telling investors that banks took three types of risk: credit risk, interest rate risk and revenue volatility risk. I underemphasized something when I said that - a fourth risk is liquidity risk. If your deposits are highly correlated to a single industry, liquidity can disappear at just the wrong time. That wasn't an issue in a zero-interest rate environment; it is a very real issue today.
My purpose in this email is to raise a torch for the discipline of diversification and the willingness to accept revenue volatility. Diversification is obvious - we have diverse sources of liquidity on the right-hand side of our balance sheet and diverse sources of assets on the left. One could argue that we are in fact concentrated in transportation. That is true, but bear in mind that transportation is exposure to GDP as a whole. This generally insulates us from problems in any one sector.
If investors value stability of earnings, why am I a fan of revenue volatility? To be in banking, you must take risk. It's the nature of a balance sheet business. Credit risk can sink you (see 2008-2009). Interest rate risk can create negative net worth on a mark-to-market basis (see the current environment). Liquidity risk, which we all underestimated, can cause a bank run that makes you recognize any mark-to-market losses at the worst time. Revenue volatility, on the other hand, means that your earnings are not linear "up and to the right"... but if you remain profitable, you don't run the risk of losing the institution. Our Q1 earnings are going to be lower compared to prior quarters due to the slowdown in transportation, but we will be profitable nonetheless (and profitable even considering the investments we are making into our future). (Graft 3/9/23).
A lot has happened in even the short time since I sent that email to our board. At the time, we did not know how widespread the contagion of fear would be following these events, so we took on additional liquidity and proactively reached out to large customers. Ultimately, we did not see a meaningful impact on our deposit base or our liquidity position.
Deposit Portfolio and Liquidity
We know that questions of deposit stability and liquidity are top of mind with investors. We are fortunate that TBK Bank's deposit base is made up of about 78,000 customers, with over 110,000 accounts, spread across 63 locations in six states. Our deposit base is diverse in terms of both geography and industry, comprised largely of retail as well as small-to-medium sized business customers. Around 60% of our deposits are FDIC insured, and we did not see any material deposit withdrawal activity in the wake of the March bank failures. The modest runoff we did see in Q1 appears to be a continuation of the trend we have seen over the past several quarters: the normalizing of pandemic-era surge balances and the movement of rate-sensitive excess balances to other investments.
As the March bank failures and related speculation unfolded, we elected to add liquidity to our balance sheet out of an abundance of caution. We added an incremental $500 million of FHLB advances during the quarter, the majority of which were drawn in March. Maturities on these new advances are staggered through the second quarter. Note that we routinely utilize FHLB advances to support the fluctuating and sometimes unpredictable balances in our mortgage warehouse lending portfolio, and we will continue to do so. In addition to our on-balance liquidity that (as of March 31) includes about $418 million in cash and $250 million of unencumbered available-for-sale securities, we have (i) additional undrawn borrowing capacity at FHLB of about $310 million, (ii) $530 million of availability at the Federal Reserve discount window, and (iii) access to additional overnight funding through multiple other liquidity providers. In sum, we have over $1.5 billion of on- and off-balance sheet liquidity readily available on short notice should the need arise.
As the chart below shows, we have been able to achieve this stability without materially repricing our deposit base. The performance so far has been favorable compared to most peers, but investors should expect our funding costs to continue to rise. Rate pressure is real, and we will continue to deal with it on a case-by-case basis. As we have said in the past, a benefit of pursuing revenue growth over asset growth is that we do not stress our deposit base the same way high-growth banks do.
Interest Rate Risk Position
Another question investors are asking banks is related to interest rate risk positioning. We have never taken material interest rate risk as an enterprise. Our loan portfolio is short-dated, with about 48% of our book maturing within 36 days or less. As to our securities portfolio:
a.Our available-for-sale securities portfolio carries an effective duration of just over one year. 75% of the portfolio is comprised of high-quality floating rate CLO securities. We believe these securities pose very little credit risk, and a crisis much worse than the global financial crisis of 2008-2010 would be required to cause any loss to this portfolio.
b.The unrealized loss in this portfolio at March 31 was $7.3 million, representing a slight improvement from the $9 million unrealized loss at year-end.
c.Our held-to-maturity portfolio is less than $4 million.
Credit Risk
While the conversations around liquidity, deposit beta and interest rate risk are still very much in the spotlight, astute investors are talking about tomorrow’s potential problems. Much of that discussion is turning to commercial real estate (CRE) exposure given many borrowers face refinancing maturing debt in the current rate environment and remote work-driven office occupancy concerns. As a result of these clouds, it seems appropriate to discuss our CRE portfolio and exposure.
Just under half of our CRE portfolio, or $295 million, was originated by our National Commercial Real Estate group led by Ray Sperring. Ray has 24 years of CRE experience and has been with TBK Bank since its inception. His team considers traditional financing for all CRE assets while specializing in a floating-rate, low LTV structured bridge lending product. The remainder of our CRE portfolio is comprised of in-market CRE lending you would expect to see in any community bank.
Four years ago, we determined that risk-adjusted returns in CRE were generally unattractive, so we didn’t originate many loans in late 2021-2022 when CRE valuations were highest. Consequently, our book consists of a relatively low concentration of CRE loans, the bulk of which were originated at conservative LTVs before CRE prices spiked. CRE represents 16% of our total loans, and Office CRE lending represents less than 2% of total loans. The weighted average LTV at origination of our CRE and construction exposure was 45% at the end of the first quarter. CRE and construction non-performing and past-due ratios are 0.4% and 0.3% respectively. We have less than $50MM in fixed rate CRE and construction loans that will mature in the next 12 months. In sum, we are very well positioned related to our existing CRE and construction exposure and to play selective offense. The best (i.e., safe and profitable) loans are often made in the worst markets.
Demonstrating our Strategy
Having outlined the general environment, our securities, credit, and rates posture, interested parties would benefit from a word on our reinvestment decisions. Our model trades revenue volatility for credit and rate insulation. To earn our premium multiple, attract discerning investors, and to retain both, we must demonstrate our ability to protect shareholders’ boom-time profits. We leveraged the trucking boom of 2020-2022, to invest in and build the payments network freight brokers and factoring firms have needed but which no participant had the customer density and capacity to build.
It was neither hubris nor unbounded ambition that drove our decision to invest over $250 million in building TriumphPay. To the contrary, we calculated that shareholders, including an invested management team and board, would be better served developing such a network, over leveraging the newfound equity to put on $2 billion of CRE, equipment, or other loans at inflated asset valuations and all-time low rates. In fact, as previously mentioned, we pulled back on CRE lending and sold 30% of our equipment book in the first half of 2022. We further judged the investment in TriumphPay superior to purchasing $2 billion of mortgage-backed (or other) securities. As our stock was trading at substantially higher levels, a large share repurchase also appeared suboptimal at the time.
In place of the aforementioned alternatives, our shareholders now own a tri-party payments network that touches 20% of brokered freight transactions. This unit is now fully float-funding its balance sheet originations and, with the passage of time, is likely to continue gathering penetration. As guided, investors should expect that future investments in TriumphPay will come in step with profitable customer onboards.
The only predictable component of trucking cycles is that peaks follow each valley. When in the valley, our credit exposure is extremely well insulated, and we retain the wherewithal to stand by the industry. And when the inevitable boom-times return, our calculation of windfall profit reinvestment will be equally vigorous and analytical.
Freight Market Conditions
As this letter has made clear, the freight recession is upon us. It is a combination of falling volumes and excess capacity. The eventual cure for low freight prices will be, as the saying goes in many industries, low prices. For the quarter, average rates per mile dropped by $0.40 to $0.50 and returned spot rates to levels last seen in 2019. For the spot rate market, the drop was a little higher than the drop in diesel prices, which fell $0.41 per gallon over the same period. By the end of the quarter, spot rates had fallen below the cost per mile to operate for many carriers. As a result, we have seen a number of small and medium-sized trucking companies either leave the market by signing on with larger carriers or electing to sell their fleets or companies and move on to other endeavors. In this, the market is behaving much like it did during the last freight downturn we saw in 2019, where the market reset following the banner year of 2018.
We do not know where the bottom will be or how long it will last. It is definitely continuing into the second quarter. Our job is to be valuable to the market in up cycles and in down cycles. To do that, we must remain profitable in weak freight markets. We have done that this quarter and expect to continue to do so even if the freight market contracts further. The news is not all bad though: just like with traditional lending, the worst markets often present some of the best opportunities. We are having conversations with large prospects for TriumphPay that were difficult to schedule a year ago. We are seeing M&A opportunities that are accretive to TriumphPay that we didn’t see a year ago. We are being thoughtful about the opportunities that are presented to us. I’ll mention one of those ways in particular later in the TriumphPay section below.
Reporting Changes — Operating Segment Expense Methodology and Transfer Pricing
Investors will notice in this earnings release two significant changes to our operating segment results: (i) a reallocation of shared services expenses to our Corporate segment and (ii) a change to the way intersegment interest is calculated. Both changes are reflected in current quarter results, and we have adjusted prior period results to reflect what they would have been had the changes been in place during those periods.
We have made considerable investments in shared services such as executive leadership, technology, human resources, accounting, finance, and risk management to support our entire enterprise. To date, our Banking segment has borne nearly all these shared service costs. Those shared costs are now reflected in our Corporate segment. We made this change because it gives our leadership team and investors greater visibility into the true operating performance of each reportable segment. It is worth noting that the impact of these allocation changes on our Payments segment was negligible.
We have also changed the way we calculate intersegment interest charges between our Banking segment and our Factoring and Payments segments. Historically we have used a 24-month rolling average of two-year Federal Home Loan Bank advance rates, based on the idea that the expected life of a new factoring relationship would be two years. Over the last year, when interest rates rose rapidly, the rate our Factoring segment paid (and our Banking segment received) lagged behind, benefiting the Factoring segment at the expense of the Banking segment. Our new approach is simpler and perhaps more intuitive: the Factoring and Payments segments will pay the Banking segment a rate based on one-month term SOFR for any funds those segments require. Should TriumphPay be a net provider of funds, it will be paid the effective fed funds rate for any funding it supplies to the parent net of the funding consumed by its operations.
Reporting Change — Triumph Supply Chain Financing Alignment
Another change we will be making going forward, but which did not impact first quarter reporting, relates to better aligning our transportation activities within the company. Triumph Financial goes to market as a financial technology company focused on payments, factoring and banking. TriumphPay and Triumph's factoring division both leverage technology and innovation to reduce friction in cash flow management and increase the speed of payments for the trucking industry. As a result, there is often confusion around the distinction between which audiences TriumphPay and Triumph's factoring division serve.
As our business has evolved, TriumphPay has become the provider of supply chain financing solutions for intermediaries (freight brokers and factors) and is becoming THE payments network for the industry. Triumph's factoring division is a working capital provider to carriers (i.e., truckers). Under our legacy operating structure, Triumph's factoring division has approximately 200 small freight broker supply chain financing clients that are served by TriumphPay. The payment volume and broker counts have always been included in TriumphPay’s segment information in the past, but the associated revenue was booked with these client relationships in Triumph's factoring division. Going forward, TriumphPay will be the face of the company for all of our freight broker clients, including the supply chain finance offering, and we will reflect related revenue and expenses in our Payments segment. We think this gives us the best opportunity to serve and grow our small broker client base. This evolution was natural as TriumphPay was originally an idea created within our factoring business. As the businesses have grown distinct from each other, it is time to bring our organization and financial reporting in line with those realities.
There will be some additional revenue and expense to TriumphPay as a result of this change. Given the uncertainty in freight right now, the precise impact is difficult to project: my best estimate is that we will see approximately $10 million in EBITDA improvement annually in our Payments segment. Again, none of the revenue or expense was included in this quarter’s results. I wanted to highlight this adjustment, in the spirit of transparency, such that this future revenue and expense transfer from Triumph's factoring division to TriumphPay is not misinterpreted as organic revenue growth related to other initiatives.
TriumphPay Progress and Initiatives
In terms of network participants, the payments network continued its momentum by adding six brokers and three factors, including factors that use a Factor Management System (FMS) that had not been previously integrated with TriumphPay. This new integration will open the door for additional factors in the coming months that had not previously had the ability to join the network.
For the last two years, we purposefully offered the payments network at a discount to early adopters. This was necessary to gain momentum and warranted as we were still developing its capabilities. Starting in Q1, we began to monetize the network and have begun to earn fees on network transactions.
The pipeline remains strong and healthy. Select go-lives in the quarter included a large broker (Traffic Tech) and a midsized broker on TriumphPay Audit. The Payments product saw four midsized brokers go live in addition to several smaller clients. We do not disclose the names of prospects who have signed a contract but have not yet gone live. But, what I can say, is that the integration pipeline includes two large brokers for the payments network, including both Payments and Audit products, along with multiple midsized brokers who are net-new or are expanding their relationship with us by adding additional products.
The Network Effect on Carrier Identification and Fraud
In addition to a strong client pipeline, TriumphPay has launched a partnership and joint product offering with Highway, a leading carrier identity platform, to combat double brokering. By combining the breadth of TriumphPay’s visibility into freight spend across hundreds of freight brokers with Highway’s understanding of a carrier’s owned and insured equipment, the joint offering can identify which motor carriers are “hauling” more freight than their equipment could allow for; more often than not this is a strong indicator that a carrier is double brokering. It is our belief that this offering will provide a robust and much-needed tool which our freight broker clients can deploy to prevent these targeted schemes that are increasing in size, frequency and sophistication. This product enhances the value of the network for existing users and is a catalyst for adoption for future prospects.
M&A Update
In March, we entered an agreement to acquire most of the assets of Truckstop Pay, the freight broker payments platform also formerly known as LoadPay, from Truckstop.com. TriumphPay will assume all intellectual property and be the exclusive partner to migrate Truckstop Pay's client relationships to TriumphPay and our payments network. Additionally, Truckstop.com has entered a non-compete agreement with TriumphPay. As part of the agreement, Truckstop.com will continue to service and support the Truckstop Pay clients until they are converted over to the TriumphPay platform. This transaction deepens our connections to the freight brokerage community, and when fully converted will add 30 freight broker clients and just under $900 million of annualized payment volume to our payments network. The small increase in our intangible assets in the first quarter is attributable to this transaction, and there was no material impact to TriumphPay’s revenue or expense.
Expense Outlook
Our non-interest expense of $89.3 million in the first quarter was about $3 million higher than Q4 and overshot the guidance we gave you by $2 million. About half that overrun was related to employee severance, and the other half consisted of a variety of other items, most of which we do not expect to recur. We were very selective about adding headcount in the first quarter, and given continued softness in the freight market, we will continue to take a very measured approach to new additions. In light of current market conditions, we expect minimal expense growth from our Q1 expense base without offsetting revenue growth.
Share Repurchase Update
As we told you in our January shareholder letter and subsequent 8-K, on February 1 we entered into a $70 million accelerated share repurchase (“ASR”) program. Roughly 80% of the shares associated with this program were delivered to us upfront, which is the reason our diluted share count went down this quarter. The program will be completed in the second quarter.
Effective Tax Rate Note
Our effective tax rate was unusually low in the first quarter due to discrete items associated with the final distribution of shares earned with the 2020-2022 special equity grant to team members. We expect our tax rate to return to more normal levels in subsequent quarters.
With warm regards,
Aaron P. Graft Founder, Vice Chairman, and CEO Aaron P. Graft, Vice Chairman and CEO and Brad Voss, CFO, will review the financial results in a conference call for investors and analysts beginning at 9:30 a.m. central time on Wednesday, April 26, 2023.
Conference Call Information
The live video conference option may be accessed directly through this link, https://triumph-financial-inc-earnings-q1.open-exchange.net/, or via the Company's website at www.tfin.com through the News & Events, Events & Presentations links. Alternatively, a live conference call option is available by dialing 1-800-274-8461 (International: +1-203-518-9843) requesting to be joined to conference I.D. “Triumph” at the operator prompt. An archive of this conference call will subsequently be available at this same location, referenced above, on the Company’s website.
About Triumph Financial
Triumph Financial, Inc. (Nasdaq: TFIN) is a financial holding company focused on payments, factoring and banking. Headquartered in Dallas, Texas, its diversified portfolio of brands includes TriumphPay, Triumph and TBK Bank. www.tfin.com
Forward-Looking Statements
This letter to shareholders contains forward-looking statements. Any statements about our expectations, beliefs, plans, predictions, forecasts, objectives, assumptions or future events or performance are not historical facts and may be forward-looking. You can identify forward-looking statements by the use of forward-looking terminology such as “believes,” “expects,” “could,” “may,” “will,” “should,” “seeks,” “likely,” “intends,” “plans,” “pro forma,” “projects,” “estimates” or “anticipates” or the negative of these words and phrases or similar words or phrases that are predictions of or indicate future events or trends and that do not relate solely to historical matters. You can also identify forward-looking statements by discussions of strategy, plans or intentions. Forward-looking statements involve numerous risks and uncertainties and you should not rely on them as predictions of future events. Forward-looking statements depend on assumptions, data or methods that may be incorrect or imprecise and we may not be able to realize them. We do not guarantee that the transactions and events described will happen as described (or that they will happen at all). The following factors, among others, could cause actual results and future events to differ materially from those set forth or contemplated in the forward-looking statements: business and economic conditions generally and in the bank and non-bank financial services industries, nationally and within our local market areas; our ability to mitigate our risk exposures; our ability to maintain our historical earnings trends; changes in management personnel; interest rate risk; concentration of our products and services in the transportation industry; credit risk associated with our loan portfolio; lack of seasoning in our loan portfolio; deteriorating asset quality and higher loan charge-offs; time and effort necessary to resolve nonperforming assets; inaccuracy of the assumptions and estimates we make in establishing reserves for probable loan losses and other estimates; risks related to the integration of acquired businesses and any future acquisitions; our ability to successfully identify and address the risks associated with our possible future acquisitions, and the risks that our prior and possible future acquisitions make it more difficult for investors to evaluate our business, financial condition and results of operations, and impairs our ability to accurately forecast our future performance; lack of liquidity; fluctuations in the fair value and liquidity of the securities we hold for sale; impairment of investment securities, goodwill, other intangible assets or deferred tax assets; our risk management strategies; environmental liability associated with our lending activities; increased competition in the bank and non-bank financial services industries, nationally, regionally or locally, which may adversely affect pricing and terms; the accuracy of our financial statements and related disclosures; material weaknesses in our internal control over financial reporting; system failures or failures to prevent breaches of our network security; the institution and outcome of litigation and other legal proceedings against us or to which we become subject; changes in carry-forwards of net operating losses; changes in federal tax law or policy; the impact of recent and future legislative and regulatory changes, including changes in banking, securities and tax laws and regulations, such as the Dodd-Frank Act and their application by our regulators; governmental monetary and fiscal policies; changes in the scope and cost of FDIC, insurance and other coverages; failure to receive regulatory approval for future acquisitions; increases in our capital requirements and the impact of COVID-19 on our business.
While forward-looking statements reflect our good-faith beliefs, they are not guarantees of future performance. All forward-looking statements are necessarily only estimates of future results. Accordingly, actual results may differ materially from those expressed in or contemplated by the particular forward-looking statement, and, therefore, you are cautioned not to place undue reliance on such statements. Further, any forward-looking statement speaks only as of the date on which it is made, and we undertake no obligation to update any forward-looking statement to reflect events or circumstances after the date on which the statement is made or to reflect the occurrence of unanticipated events or circumstances, except as required by applicable law. For a discussion of such risks and uncertainties, which could cause actual results to differ from those contained in the forward-looking statements, see "Risk Factors" and the forward-looking statement disclosure contained in Triumph’s Annual Report on Form 10-K, filed with the Securities and Exchange Commission on February 15, 2023.
Non-GAAP Financial Measures
This letter to shareholders includes certain non‐GAAP financial measures intended to supplement, not substitute for, comparable GAAP measures. Reconciliations of non‐GAAP financial measures to GAAP financial measures are provided at the end of this letter to shareholders.
The following table sets forth key metrics used by Triumph Financial to monitor our operations. Footnotes in this table can be found in our definitions of non-GAAP financial measures at the end of this document.
|
|
|
|
|
|
|
|
|
|
|
|
|
|
|
|
|
|
|
|
|
|
|
|
|
|
|
|
|
|
|
|
|
|
|
As of and for the Three Months Ended |
|
|
| (Dollars in thousands) |
March 31,
2023 |
|
December 31,
2022 |
|
September 30,
2022 |
|
June 30,
2022 |
|
March 31,
2022 |
|
|
|
|
| Financial Highlights: |
|
|
|
|
|
|
|
|
|
|
|
|
|
| Total assets |
$ |
5,628,185 |
|
|
$ |
5,333,783 |
|
|
$ |
5,642,450 |
|
|
$ |
5,955,507 |
|
|
$ |
6,076,434 |
|
|
|
|
|
| Loans held for investment |
$ |
4,310,006 |
|
|
$ |
4,120,291 |
|
|
$ |
4,433,304 |
|
|
$ |
4,435,366 |
|
|
$ |
4,724,078 |
|
|
|
|
|
| Deposits |
$ |
4,038,994 |
|
|
$ |
4,171,336 |
|
|
$ |
4,441,354 |
|
|
$ |
4,780,924 |
|
|
$ |
4,331,786 |
|
|
|
|
|
| Net income available to common stockholders |
$ |
10,209 |
|
|
$ |
16,759 |
|
|
$ |
15,428 |
|
|
$ |
43,390 |
|
|
$ |
23,528 |
|
|
|
|
|
|
|
|
|
|
|
|
|
|
|
|
|
|
|
| Performance Ratios - Annualized: |
|
|
|
|
|
|
|
|
|
|
|
|
|
| Return on average assets |
0.84 |
% |
|
1.27 |
% |
|
1.13 |
% |
|
3.02 |
% |
|
1.69 |
% |
|
|
|
|
| Return on average total equity |
5.20 |
% |
|
7.66 |
% |
|
7.16 |
% |
|
20.08 |
% |
|
11.20 |
% |
|
|
|
|
| Return on average common equity |
5.09 |
% |
|
7.69 |
% |
|
7.17 |
% |
|
20.78 |
% |
|
11.41 |
% |
|
|
|
|
Return on average tangible common equity (1) |
7.56 |
% |
|
11.14 |
% |
|
10.47 |
% |
|
30.63 |
% |
|
17.02 |
% |
|
|
|
|
Yield on loans(2) |
9.22 |
% |
|
9.23 |
% |
|
8.95 |
% |
|
8.79 |
% |
|
8.60 |
% |
|
|
|
|
| Cost of interest bearing deposits |
0.55 |
% |
|
0.48 |
% |
|
0.41 |
% |
|
0.41 |
% |
|
0.23 |
% |
|
|
|
|
| Cost of total deposits |
0.32 |
% |
|
0.28 |
% |
|
0.24 |
% |
|
0.23 |
% |
|
0.14 |
% |
|
|
|
|
| Cost of total funds |
0.68 |
% |
|
0.49 |
% |
|
0.42 |
% |
|
0.40 |
% |
|
0.28 |
% |
|
|
|
|
Net interest margin(2) |
8.08 |
% |
|
8.22 |
% |
|
7.71 |
% |
|
7.68 |
% |
|
7.68 |
% |
|
|
|
|
| Net non-interest expense to average assets |
5.98 |
% |
|
5.38 |
% |
|
5.15 |
% |
|
2.76 |
% |
|
4.68 |
% |
|
|
|
|
|
|
|
|
|
|
|
|
|
|
|
|
|
|
| Efficiency ratio |
85.52 |
% |
|
76.90 |
% |
|
78.14 |
% |
|
59.23 |
% |
|
70.65 |
% |
|
|
|
|
|
|
|
|
|
|
|
|
|
|
|
|
|
|
|
|
|
|
|
|
|
|
|
|
|
|
|
|
Asset Quality:(3) |
|
|
|
|
|
|
|
|
|
|
|
|
|
| Past due to total loans |
1.67 |
% |
|
2.53 |
% |
|
2.33 |
% |
|
2.47 |
% |
|
2.73 |
% |
|
|
|
|
| Non-performing loans to total loans |
1.01 |
% |
|
1.17 |
% |
|
1.26 |
% |
|
0.95 |
% |
|
0.94 |
% |
|
|
|
|
| Non-performing assets to total assets |
0.88 |
% |
|
1.02 |
% |
|
1.11 |
% |
|
0.83 |
% |
|
0.87 |
% |
|
|
|
|
| ACL to non-performing loans |
97.12 |
% |
|
88.76 |
% |
|
78.88 |
% |
|
103.51 |
% |
|
93.62 |
% |
|
|
|
|
| ACL to total loans |
0.98 |
% |
|
1.04 |
% |
|
0.99 |
% |
|
0.98 |
% |
|
0.88 |
% |
|
|
|
|
| Net charge-offs to average loans |
0.05 |
% |
|
0.05 |
% |
|
0.06 |
% |
|
— |
% |
|
0.03 |
% |
|
|
|
|
|
|
|
|
|
|
|
|
|
|
|
|
|
|
| Capital: |
|
|
|
|
|
|
|
|
|
|
|
|
|
Tier 1 capital to average assets(4) |
12.19 |
% |
|
13.00 |
% |
|
12.57 |
% |
|
11.76 |
% |
|
11.82 |
% |
|
|
|
|
Tier 1 capital to risk-weighted assets(4) |
12.52 |
% |
|
14.57 |
% |
|
13.64 |
% |
|
13.04 |
% |
|
11.96 |
% |
|
|
|
|
Common equity tier 1 capital to risk-weighted assets(4) |
10.77 |
% |
|
12.73 |
% |
|
11.93 |
% |
|
11.35 |
% |
|
10.40 |
% |
|
|
|
|
| Total capital to risk-weighted assets |
15.51 |
% |
|
17.66 |
% |
|
16.56 |
% |
|
15.91 |
% |
|
14.53 |
% |
|
|
|
|
| Total equity to total assets |
14.70 |
% |
|
16.67 |
% |
|
15.79 |
% |
|
14.68 |
% |
|
14.59 |
% |
|
|
|
|
Tangible common stockholders' equity to tangible assets(1) |
9.63 |
% |
|
11.41 |
% |
|
10.75 |
% |
|
9.83 |
% |
|
9.86 |
% |
|
|
|
|
|
|
|
|
|
|
|
|
|
|
|
|
|
|
| Per Share Amounts: |
|
|
|
|
|
|
|
|
|
|
|
|
|
| Book value per share |
$ |
33.47 |
|
|
$ |
35.09 |
|
|
$ |
34.57 |
|
|
$ |
33.91 |
|
|
$ |
33.45 |
|
|
|
|
|
Tangible book value per share (1) |
$ |
22.09 |
|
|
$ |
24.04 |
|
|
$ |
23.60 |
|
|
$ |
22.84 |
|
|
$ |
22.75 |
|
|
|
|
|
| Basic earnings per common share |
$ |
0.44 |
|
|
$ |
0.69 |
|
|
$ |
0.64 |
|
|
$ |
1.78 |
|
|
$ |
0.95 |
|
|
|
|
|
| Diluted earnings per common share |
$ |
0.43 |
|
|
$ |
0.67 |
|
|
$ |
0.62 |
|
|
$ |
1.74 |
|
|
$ |
0.93 |
|
|
|
|
|
|
|
|
|
|
|
|
|
|
|
|
|
|
|
| Shares outstanding end of period |
23,370,515 |
|
|
24,053,585 |
|
|
24,478,288 |
|
|
24,457,777 |
|
|
25,161,690 |
|
|
|
|
|
Unaudited consolidated balance sheet as of:
|
|
|
|
|
|
|
|
|
|
|
|
|
|
|
|
|
|
|
|
|
|
|
|
|
|
|
|
|
|
| (Dollars in thousands) |
March 31,
2023 |
|
December 31,
2022 |
|
September 30,
2022 |
|
June 30,
2022 |
|
March 31,
2022 |
| ASSETS |
|
|
|
|
|
|
|
|
|
| Total cash and cash equivalents |
$ |
417,715 |
|
|
$ |
408,182 |
|
|
$ |
421,729 |
|
|
$ |
724,237 |
|
|
$ |
413,704 |
|
| Securities - available for sale |
317,097 |
|
|
254,504 |
|
|
238,434 |
|
|
215,909 |
|
|
191,440 |
|
| Securities - held to maturity, net |
3,868 |
|
|
4,077 |
|
|
4,149 |
|
|
4,335 |
|
|
4,404 |
|
| Equity securities |
4,498 |
|
|
5,191 |
|
|
4,916 |
|
|
5,050 |
|
|
5,085 |
|
| Loans held for sale |
3,954 |
|
|
5,641 |
|
|
78 |
|
|
6 |
|
|
607 |
|
| Loans held for investment |
4,310,006 |
|
|
4,120,291 |
|
|
4,433,304 |
|
|
4,435,366 |
|
|
4,724,078 |
|
| Allowance for credit losses |
(42,245) |
|
|
(42,807) |
|
|
(44,111) |
|
|
(43,407) |
|
|
(41,553) |
|
| Loans, net |
4,267,761 |
|
|
4,077,484 |
|
|
4,389,193 |
|
|
4,391,959 |
|
|
4,682,525 |
|
| Assets held for sale |
— |
|
|
— |
|
|
— |
|
|
24,405 |
|
|
260,085 |
|
| FHLB and other restricted stock |
24,506 |
|
|
6,252 |
|
|
6,213 |
|
|
6,169 |
|
|
12,196 |
|
| Premises and equipment, net |
115,639 |
|
|
103,339 |
|
|
104,272 |
|
|
105,293 |
|
|
91,725 |
|
| Other real estate owned ("OREO"), net |
— |
|
|
— |
|
|
— |
|
|
168 |
|
|
383 |
|
| Goodwill and intangible assets, net |
265,959 |
|
|
265,767 |
|
|
268,604 |
|
|
270,666 |
|
|
269,119 |
|
| Bank-owned life insurance |
41,594 |
|
|
41,493 |
|
|
41,390 |
|
|
41,278 |
|
|
41,141 |
|
| Deferred tax asset, net |
11,562 |
|
|
16,473 |
|
|
14,663 |
|
|
13,117 |
|
|
10,174 |
|
| Other assets |
154,032 |
|
|
145,380 |
|
|
148,809 |
|
|
152,915 |
|
|
93,846 |
|
| Total assets |
$ |
5,628,185 |
|
|
$ |
5,333,783 |
|
|
$ |
5,642,450 |
|
|
$ |
5,955,507 |
|
|
$ |
6,076,434 |
|
| LIABILITIES |
|
|
|
|
|
|
|
|
|
| Non-interest bearing deposits |
$ |
1,727,749 |
|
|
$ |
1,756,680 |
|
|
$ |
1,897,309 |
|
|
$ |
2,085,249 |
|
|
$ |
1,859,376 |
|
| Interest bearing deposits |
2,311,245 |
|
|
2,414,656 |
|
|
2,544,045 |
|
|
2,695,675 |
|
|
2,472,410 |
|
| Total deposits |
4,038,994 |
|
|
4,171,336 |
|
|
4,441,354 |
|
|
4,780,924 |
|
|
4,331,786 |
|
| Deposits held for sale |
— |
|
|
— |
|
|
— |
|
|
1,410 |
|
|
377,698 |
|
| Customer repurchase agreements |
3,208 |
|
|
340 |
|
|
13,463 |
|
|
11,746 |
|
|
2,868 |
|
| Federal Home Loan Bank advances |
530,000 |
|
|
30,000 |
|
|
30,000 |
|
|
30,000 |
|
|
230,000 |
|
| Subordinated notes |
108,016 |
|
|
107,800 |
|
|
107,587 |
|
|
107,377 |
|
|
107,169 |
|
| Junior subordinated debentures |
41,299 |
|
|
41,158 |
|
|
41,016 |
|
|
40,876 |
|
|
40,737 |
|
| Other liabilities |
79,452 |
|
|
94,178 |
|
|
117,857 |
|
|
108,893 |
|
|
99,511 |
|
| Total liabilities |
4,800,969 |
|
|
4,444,812 |
|
|
4,751,277 |
|
|
5,081,226 |
|
|
5,189,769 |
|
| EQUITY |
|
|
|
|
|
|
|
|
|
| Preferred Stock |
45,000 |
|
|
45,000 |
|
|
45,000 |
|
|
45,000 |
|
|
45,000 |
|
| Common stock |
287 |
|
|
283 |
|
|
283 |
|
|
283 |
|
|
283 |
|
| Additional paid-in-capital |
539,241 |
|
|
534,790 |
|
|
529,804 |
|
|
524,636 |
|
|
516,551 |
|
| Treasury stock, at cost |
(260,453) |
|
|
(182,658) |
|
|
(156,949) |
|
|
(156,924) |
|
|
(106,105) |
|
| Retained earnings |
508,665 |
|
|
498,456 |
|
|
481,697 |
|
|
466,269 |
|
|
422,879 |
|
| Accumulated other comprehensive income (loss) |
(5,524) |
|
|
(6,900) |
|
|
(8,662) |
|
|
(4,983) |
|
|
8,057 |
|
| Total stockholders' equity |
827,216 |
|
|
888,971 |
|
|
891,173 |
|
|
874,281 |
|
|
886,665 |
|
| Total liabilities and equity |
$ |
5,628,185 |
|
|
$ |
5,333,783 |
|
|
$ |
5,642,450 |
|
|
$ |
5,955,507 |
|
|
$ |
6,076,434 |
|
Unaudited consolidated statement of income:
|
|
|
|
|
|
|
|
|
|
|
|
|
|
|
|
|
|
|
|
|
|
|
|
|
|
|
|
|
|
|
|
|
|
|
For the Three Months Ended |
|
|
| (Dollars in thousands) |
March 31,
2023 |
|
December 31,
2022 |
|
September 30,
2022 |
|
June 30,
2022 |
|
March 31,
2022 |
|
|
|
|
| Interest income: |
|
|
|
|
|
|
|
|
|
|
|
|
|
| Loans, including fees |
$ |
52,538 |
|
|
$ |
51,282 |
|
|
$ |
44,928 |
|
|
$ |
44,131 |
|
|
$ |
40,847 |
|
|
|
|
|
| Factored receivables, including fees |
40,904 |
|
|
48,644 |
|
|
53,317 |
|
|
60,026 |
|
|
61,206 |
|
|
|
|
|
| Securities |
4,113 |
|
|
3,372 |
|
|
2,308 |
|
|
1,329 |
|
|
1,178 |
|
|
|
|
|
| FHLB and other restricted stock |
125 |
|
|
83 |
|
|
65 |
|
|
34 |
|
|
76 |
|
|
|
|
|
| Cash deposits |
2,994 |
|
|
2,891 |
|
|
2,607 |
|
|
787 |
|
|
128 |
|
|
|
|
|
| Total interest income |
100,674 |
|
|
106,272 |
|
|
103,225 |
|
|
106,307 |
|
|
103,435 |
|
|
|
|
|
| Interest expense: |
|
|
|
|
|
|
|
|
|
|
|
|
|
| Deposits |
3,202 |
|
|
3,028 |
|
|
2,743 |
|
|
2,706 |
|
|
1,561 |
|
|
|
|
|
| Subordinated notes |
1,309 |
|
|
1,307 |
|
|
1,304 |
|
|
1,302 |
|
|
1,299 |
|
|
|
|
|
| Junior subordinated debentures |
1,034 |
|
|
926 |
|
|
726 |
|
|
556 |
|
|
454 |
|
|
|
|
|
| Other borrowings |
1,747 |
|
|
296 |
|
|
182 |
|
|
315 |
|
|
42 |
|
|
|
|
|
| Total interest expense |
7,292 |
|
|
5,557 |
|
|
4,955 |
|
|
4,879 |
|
|
3,356 |
|
|
|
|
|
| Net interest income |
93,382 |
|
|
100,715 |
|
|
98,270 |
|
|
101,428 |
|
|
100,079 |
|
|
|
|
|
| Credit loss expense (benefit) |
2,613 |
|
|
877 |
|
|
2,646 |
|
|
2,901 |
|
|
501 |
|
|
|
|
|
| Net interest income after credit loss expense (benefit) |
90,769 |
|
|
99,838 |
|
|
95,624 |
|
|
98,527 |
|
|
99,578 |
|
|
|
|
|
| Non-interest income: |
|
|
|
|
|
|
|
|
|
|
|
|
|
| Service charges on deposits |
1,713 |
|
|
1,659 |
|
|
1,558 |
|
|
1,664 |
|
|
1,963 |
|
|
|
|
|
| Card income |
1,968 |
|
|
2,025 |
|
|
2,034 |
|
|
2,080 |
|
|
2,011 |
|
|
|
|
|
| Net OREO gains (losses) and valuation adjustments |
— |
|
|
— |
|
|
(19) |
|
|
18 |
|
|
(132) |
|
|
|
|
|
| Net gains (losses) on sale of securities |
— |
|
|
(2) |
|
|
— |
|
|
2,514 |
|
|
— |
|
|
|
|
|
| Net gains (losses) on sale of loans |
(84) |
|
|
(82) |
|
|
1,107 |
|
|
17,269 |
|
|
(66) |
|
|
|
|
|
| Fee income |
6,150 |
|
|
6,126 |
|
|
6,120 |
|
|
6,273 |
|
|
5,703 |
|
|
|
|
|
| Insurance commissions |
1,593 |
|
|
936 |
|
|
1,191 |
|
|
1,346 |
|
|
1,672 |
|
|
|
|
|
|
|
|
|
|
|
|
|
|
|
|
|
|
|
| Other |
(318) |
|
|
1,457 |
|
|
677 |
|
|
16,996 |
|
|
(30) |
|
|
|
|
|
| Total non-interest income |
11,022 |
|
|
12,119 |
|
|
12,668 |
|
|
48,160 |
|
|
11,121 |
|
|
|
|
|
| Non-interest expense: |
|
|
|
|
|
|
|
|
|
|
|
|
|
| Salaries and employee benefits |
54,686 |
|
|
51,639 |
|
|
49,307 |
|
|
54,257 |
|
|
46,284 |
|
|
|
|
|
| Occupancy, furniture and equipment |
6,703 |
|
|
7,005 |
|
|
6,826 |
|
|
6,507 |
|
|
6,436 |
|
|
|
|
|
| FDIC insurance and other regulatory assessments |
345 |
|
|
364 |
|
|
386 |
|
|
382 |
|
|
411 |
|
|
|
|
|
| Professional fees |
3,085 |
|
|
4,115 |
|
|
4,263 |
|
|
3,607 |
|
|
3,659 |
|
|
|
|
|
| Amortization of intangible assets |
2,850 |
|
|
2,837 |
|
|
2,913 |
|
|
3,064 |
|
|
3,108 |
|
|
|
|
|
| Advertising and promotion |
1,344 |
|
|
2,679 |
|
|
1,929 |
|
|
1,785 |
|
|
1,202 |
|
|
|
|
|
| Communications and technology |
10,852 |
|
|
9,398 |
|
|
11,935 |
|
|
9,820 |
|
|
9,112 |
|
|
|
|
|
| Other |
9,416 |
|
|
8,734 |
|
|
9,130 |
|
|
9,185 |
|
|
8,352 |
|
|
|
|
|
| Total non-interest expense |
89,281 |
|
|
86,771 |
|
|
86,689 |
|
|
88,607 |
|
|
78,564 |
|
|
|
|
|
| Net income before income tax |
12,510 |
|
|
25,186 |
|
|
21,603 |
|
|
58,080 |
|
|
32,135 |
|
|
|
|
|
| Income tax expense |
1,500 |
|
|
7,625 |
|
|
5,374 |
|
|
13,888 |
|
|
7,806 |
|
|
|
|
|
| Net income |
$ |
11,010 |
|
|
$ |
17,561 |
|
|
$ |
16,229 |
|
|
$ |
44,192 |
|
|
$ |
24,329 |
|
|
|
|
|
| Dividends on preferred stock |
(801) |
|
|
(802) |
|
|
(801) |
|
|
(802) |
|
|
(801) |
|
|
|
|
|
| Net income available to common stockholders |
$ |
10,209 |
|
|
$ |
16,759 |
|
|
$ |
15,428 |
|
|
$ |
43,390 |
|
|
$ |
23,528 |
|
|
|
|
|
Earnings per share:
|
|
|
|
|
|
|
|
|
|
|
|
|
|
|
|
|
|
|
|
|
|
|
|
|
|
|
|
|
|
|
|
|
|
|
For the Three Months Ended |
|
|
| (Dollars in thousands) |
March 31,
2023 |
|
December 31,
2022 |
|
September 30,
2022 |
|
June 30,
2022 |
|
March 31,
2022 |
|
|
|
|
| Basic |
|
|
|
|
|
|
|
|
|
|
|
|
|
| Net income to common stockholders |
$ |
10,209 |
|
|
$ |
16,759 |
|
|
$ |
15,428 |
|
|
$ |
43,390 |
|
|
$ |
23,528 |
|
|
|
|
|
| Weighted average common shares outstanding |
23,361,732 |
|
|
24,129,560 |
|
|
24,227,020 |
|
|
24,427,270 |
|
|
24,800,771 |
|
|
|
|
|
| Basic earnings per common share |
$ |
0.44 |
|
|
$ |
0.69 |
|
|
$ |
0.64 |
|
|
$ |
1.78 |
|
|
$ |
0.95 |
|
|
|
|
|
|
|
|
|
|
|
|
|
|
|
|
|
|
|
| Diluted |
|
|
|
|
|
|
|
|
|
|
|
|
|
| Net income to common stockholders - diluted |
$ |
10,209 |
|
|
$ |
16,759 |
|
|
$ |
15,428 |
|
|
$ |
43,390 |
|
|
$ |
23,528 |
|
|
|
|
|
| Weighted average common shares outstanding |
23,361,732 |
|
|
24,129,560 |
|
|
24,227,020 |
|
|
24,427,270 |
|
|
24,800,771 |
|
|
|
|
|
| Dilutive effects of: |
|
|
|
|
|
|
|
|
|
|
|
|
|
| Assumed exercises of stock options |
76,129 |
|
|
72,183 |
|
|
85,239 |
|
|
89,443 |
|
|
107,359 |
|
|
|
|
|
| Restricted stock awards |
140,006 |
|
|
120,328 |
|
|
122,723 |
|
|
144,526 |
|
|
237,305 |
|
|
|
|
|
| Restricted stock units |
116,754 |
|
|
95,465 |
|
|
97,512 |
|
|
85,934 |
|
|
86,099 |
|
|
|
|
|
| Performance stock units - market based |
121,047 |
|
|
115,744 |
|
|
117,358 |
|
|
115,825 |
|
|
139,563 |
|
|
|
|
|
| Performance stock units - performance based |
— |
|
|
341,732 |
|
|
327,016 |
|
|
— |
|
|
— |
|
|
|
|
|
| Employee stock purchase plan |
496 |
|
|
4,042 |
|
|
2,389 |
|
|
3,575 |
|
|
771 |
|
|
|
|
|
| Weighted average shares outstanding - diluted |
23,816,164 |
|
|
24,879,054 |
|
|
24,979,257 |
|
|
24,866,573 |
|
|
25,371,868 |
|
|
|
|
|
| Diluted earnings per common share |
$ |
0.43 |
|
|
$ |
0.67 |
|
|
$ |
0.62 |
|
|
$ |
1.74 |
|
|
$ |
0.93 |
|
|
|
|
|
Shares that were not considered in computing diluted earnings per common share because they were antidilutive or have not met the thresholds to be considered in the dilutive calculation are as follows:
|
|
|
|
|
|
|
|
|
|
|
|
|
|
|
|
|
|
|
|
|
|
|
|
|
|
|
|
|
|
|
|
|
|
|
For the Three Months Ended |
|
|
|
March 31,
2023 |
|
December 31,
2022 |
|
September 30,
2022 |
|
June 30,
2022 |
|
March 31,
2022 |
|
|
|
|
| Stock options |
49,379 |
|
|
49,379 |
|
|
52,878 |
|
|
52,878 |
|
|
12,911 |
|
|
|
|
|
| Restricted stock awards |
— |
|
|
6,348 |
|
|
6,348 |
|
|
6,348 |
|
|
8,463 |
|
|
|
|
|
| Restricted stock units |
11,250 |
|
|
11,250 |
|
|
15,000 |
|
|
15,000 |
|
|
15,000 |
|
|
|
|
|
| Performance stock units - market based |
42,056 |
|
|
45,296 |
|
|
45,296 |
|
|
45,296 |
|
|
— |
|
|
|
|
|
| Performance stock units - performance based |
— |
|
|
— |
|
|
— |
|
|
254,832 |
|
|
258,635 |
|
|
|
|
|
| Employee stock purchase plan |
— |
|
|
— |
|
|
— |
|
|
— |
|
|
— |
|
|
|
|
|
| Accelerated share repurchase |
203,352 |
|
|
— |
|
|
— |
|
|
— |
|
|
— |
|
|
|
|
|
Loans held for investment summarized as of:
|
|
|
|
|
|
|
|
|
|
|
|
|
|
|
|
|
|
|
|
|
|
|
|
|
|
|
|
|
|
| (Dollars in thousands) |
March 31,
2023 |
|
December 31,
2022 |
|
September 30,
2022 |
|
June 30,
2022 |
|
March 31,
2022 |
| Commercial real estate |
$ |
695,160 |
|
|
$ |
678,144 |
|
|
$ |
669,742 |
|
|
$ |
649,280 |
|
|
$ |
625,763 |
|
| Construction, land development, land |
98,311 |
|
|
90,976 |
|
|
75,527 |
|
|
103,377 |
|
|
119,560 |
|
| 1-4 family residential properties |
132,010 |
|
|
125,981 |
|
|
122,594 |
|
|
126,362 |
|
|
117,534 |
|
| Farmland |
67,596 |
|
|
68,934 |
|
|
66,595 |
|
|
70,272 |
|
|
17,910 |
|
| Commercial |
1,239,952 |
|
|
1,251,110 |
|
|
1,282,199 |
|
|
1,225,479 |
|
|
1,375,044 |
|
| Factored receivables |
1,178,104 |
|
|
1,237,449 |
|
|
1,449,080 |
|
|
1,596,282 |
|
|
1,764,590 |
|
| Consumer |
8,913 |
|
|
8,868 |
|
|
9,506 |
|
|
9,709 |
|
|
9,276 |
|
| Mortgage warehouse |
889,960 |
|
|
658,829 |
|
|
758,061 |
|
|
654,605 |
|
|
694,401 |
|
| Total loans |
$ |
4,310,006 |
|
|
$ |
4,120,291 |
|
|
$ |
4,433,304 |
|
|
$ |
4,435,366 |
|
|
$ |
4,724,078 |
|
Our banking loan portfolio consists of traditional community bank loans as well as commercial finance product lines focused on businesses that require specialized financial solutions and national lending product lines that further diversify our lending operations.
Banking loans held for investment are further summarized below:
|
|
|
|
|
|
|
|
|
|
|
|
|
|
|
|
|
|
|
|
|
|
|
|
|
|
|
|
|
|
| (Dollars in thousands) |
March 31,
2023 |
|
December 31,
2022 |
|
September 30,
2022 |
|
June 30,
2022 |
|
March 31,
2022 |
| Commercial real estate |
$ |
695,160 |
|
|
$ |
678,144 |
|
|
$ |
669,742 |
|
|
$ |
649,280 |
|
|
$ |
625,763 |
|
| Construction, land development, land |
98,311 |
|
|
90,976 |
|
|
75,527 |
|
|
103,377 |
|
|
119,560 |
|
| 1-4 family residential |
132,010 |
|
|
125,981 |
|
|
122,594 |
|
|
126,362 |
|
|
117,534 |
|
| Farmland |
67,596 |
|
|
68,934 |
|
|
66,595 |
|
|
70,272 |
|
|
17,910 |
|
| Commercial - General |
319,978 |
|
|
316,364 |
|
|
319,016 |
|
|
319,660 |
|
|
286,936 |
|
| Commercial - Paycheck Protection Program |
52 |
|
|
55 |
|
|
60 |
|
|
4,538 |
|
|
12,090 |
|
| Commercial - Agriculture |
38,637 |
|
|
48,494 |
|
|
60,409 |
|
|
60,150 |
|
|
15,887 |
|
| Commercial - Equipment |
483,911 |
|
|
454,117 |
|
|
439,604 |
|
|
431,366 |
|
|
612,277 |
|
| Commercial - Asset-based lending |
230,326 |
|
|
229,754 |
|
|
238,119 |
|
|
239,505 |
|
|
284,808 |
|
| Commercial - Liquid Credit |
167,048 |
|
|
202,326 |
|
|
224,991 |
|
|
170,260 |
|
|
163,046 |
|
| Consumer |
8,913 |
|
|
8,868 |
|
|
9,506 |
|
|
9,709 |
|
|
9,276 |
|
| Mortgage Warehouse |
889,960 |
|
|
658,829 |
|
|
758,061 |
|
|
654,605 |
|
|
694,401 |
|
| Total banking loans held for investment |
$ |
3,131,902 |
|
|
$ |
2,882,842 |
|
|
$ |
2,984,224 |
|
|
$ |
2,839,084 |
|
|
$ |
2,959,488 |
|
Banking loans held for investment and held for sale, including loans within an asset group held for sale, are summarized below:
|
|
|
|
|
|
|
|
|
|
|
|
|
|
|
|
|
|
|
|
|
|
|
|
|
|
|
|
|
|
| (Dollars in thousands) |
March 31,
2023 |
|
December 31,
2022 |
|
September 30,
2022 |
|
June 30,
2022 |
|
March 31,
2022 |
| Commercial real estate |
$ |
695,160 |
|
|
$ |
678,144 |
|
|
$ |
669,742 |
|
|
$ |
649,280 |
|
|
$ |
657,515 |
|
| Construction, land development, land |
98,311 |
|
|
90,976 |
|
|
75,527 |
|
|
103,377 |
|
|
120,672 |
|
| 1-4 family residential |
132,010 |
|
|
125,981 |
|
|
122,662 |
|
|
126,362 |
|
|
131,039 |
|
| Farmland |
67,596 |
|
|
68,934 |
|
|
66,595 |
|
|
70,272 |
|
|
74,230 |
|
| Commercial - General |
319,978 |
|
|
316,364 |
|
|
319,016 |
|
|
319,660 |
|
|
296,528 |
|
| Commercial - Paycheck Protection Program |
52 |
|
|
55 |
|
|
60 |
|
|
4,538 |
|
|
12,090 |
|
| Commercial - Agriculture |
38,637 |
|
|
48,494 |
|
|
60,409 |
|
|
60,150 |
|
|
62,540 |
|
| Commercial - Equipment |
483,911 |
|
|
454,117 |
|
|
439,604 |
|
|
431,366 |
|
|
612,277 |
|
| Commercial - Asset-based lending |
230,326 |
|
|
229,754 |
|
|
238,119 |
|
|
239,505 |
|
|
284,808 |
|
| Commercial - Liquid Credit |
171,002 |
|
|
207,967 |
|
|
225,001 |
|
|
170,266 |
|
|
163,056 |
|
| Consumer |
8,913 |
|
|
8,868 |
|
|
9,506 |
|
|
9,709 |
|
|
10,108 |
|
| Mortgage Warehouse |
889,960 |
|
|
658,829 |
|
|
758,061 |
|
|
654,605 |
|
|
694,401 |
|
| Total banking loans held for investment |
$ |
3,135,856 |
|
|
$ |
2,888,483 |
|
|
$ |
2,984,302 |
|
|
$ |
2,839,090 |
|
|
$ |
3,119,264 |
|
The following table presents the Company’s operating segments:
|
|
|
|
|
|
|
|
|
|
|
|
|
|
|
|
|
|
|
|
|
|
|
|
|
|
|
|
|
|
|
|
|
| (Dollars in thousands) |
|
|
|
|
|
|
|
|
|
|
| Three months ended March 31, 2023 |
|
Banking |
|
Factoring |
|
Payments |
|
Corporate |
|
Consolidated |
| Total interest income |
|
$ |
59,726 |
|
|
$ |
38,157 |
|
|
$ |
2,747 |
|
|
$ |
44 |
|
|
$ |
100,674 |
|
| Intersegment interest allocations |
|
7,612 |
|
|
(9,154) |
|
|
1,542 |
|
|
— |
|
|
— |
|
| Total interest expense |
|
4,948 |
|
|
— |
|
|
— |
|
|
2,344 |
|
|
7,292 |
|
| Net interest income (expense) |
|
62,390 |
|
|
29,003 |
|
|
4,289 |
|
|
(2,300) |
|
|
93,382 |
|
| Credit loss expense (benefit) |
|
1,923 |
|
|
549 |
|
|
— |
|
|
141 |
|
|
2,613 |
|
| Net interest income after credit loss expense |
|
60,467 |
|
|
28,454 |
|
|
4,289 |
|
|
(2,441) |
|
|
90,769 |
|
| Noninterest income |
|
5,673 |
|
|
1,313 |
|
|
3,972 |
|
|
64 |
|
|
11,022 |
|
| Noninterest expense |
|
32,240 |
|
|
21,769 |
|
|
15,417 |
|
|
19,855 |
|
|
89,281 |
|
| Operating income (loss) |
|
$ |
33,900 |
|
|
$ |
7,998 |
|
|
$ |
(7,156) |
|
|
$ |
(22,232) |
|
|
$ |
12,510 |
|
|
|
|
|
|
|
|
|
|
|
|
|
|
|
|
|
|
|
|
|
|
|
|
|
|
|
|
|
|
|
|
|
|
| (Dollars in thousands) |
|
|
|
|
|
|
|
|
|
|
| Three months ended December 31, 2022 |
|
Banking |
|
Factoring |
|
Payments |
|
Corporate |
|
Consolidated |
| Total interest income |
|
$ |
57,585 |
|
|
$ |
45,325 |
|
|
$ |
3,319 |
|
|
$ |
43 |
|
|
$ |
106,272 |
|
| Intersegment interest allocations |
|
9,171 |
|
|
(9,482) |
|
|
311 |
|
|
— |
|
|
— |
|
| Total interest expense |
|
3,325 |
|
|
— |
|
|
— |
|
|
2,232 |
|
|
5,557 |
|
| Net interest income (expense) |
|
63,431 |
|
|
35,843 |
|
|
3,630 |
|
|
(2,189) |
|
|
100,715 |
|
| Credit loss expense (benefit) |
|
115 |
|
|
934 |
|
|
(187) |
|
|
15 |
|
|
877 |
|
| Net interest income after credit loss expense |
|
63,316 |
|
|
34,909 |
|
|
3,817 |
|
|
(2,204) |
|
|
99,838 |
|
| Noninterest income |
|
6,565 |
|
|
1,939 |
|
|
3,551 |
|
|
64 |
|
|
12,119 |
|
| Noninterest expense |
|
30,603 |
|
|
21,219 |
|
|
17,169 |
|
|
17,780 |
|
|
86,771 |
|
| Operating income (loss) |
|
$ |
39,278 |
|
|
$ |
15,629 |
|
|
$ |
(9,801) |
|
|
$ |
(19,920) |
|
|
$ |
25,186 |
|
Information pertaining to our factoring segment, which includes only factoring originated by our Triumph Financial Services, LLC subsidiary, summarized as of and for the quarters ended:
|
|
|
|
|
|
|
|
|
|
|
|
|
|
|
|
|
|
|
|
|
|
|
|
|
|
|
|
|
|
|
|
|
| Factoring |
|
March 31,
2023 |
|
December 31,
2022 |
|
September 30,
2022 |
|
June 30,
2022 |
|
March 31,
2022 |
| Factored receivable period end balance |
|
$ |
1,096,071,000 |
|
|
$ |
1,151,727,000 |
|
|
$ |
1,330,122,000 |
|
|
$ |
1,474,852,000 |
|
|
$ |
1,666,530,000 |
|
| Yield on average receivable balance |
|
13.94 |
% |
|
13.85 |
% |
|
14.11 |
% |
|
14.21 |
% |
|
14.16 |
% |
| Current quarter charge-off rate |
|
0.19 |
% |
|
0.14 |
% |
|
0.16 |
% |
|
— |
% |
|
0.04 |
% |
| Factored receivables - transportation concentration |
|
95 |
% |
|
96 |
% |
|
96 |
% |
|
94 |
% |
|
90 |
% |
|
|
|
|
|
|
|
|
|
|
|
| Interest income, including fees |
|
$ |
38,157,000 |
|
|
$ |
45,325,000 |
|
|
$ |
49,561,000 |
|
|
$ |
55,854,000 |
|
|
$ |
56,374,000 |
|
Non-interest income(1) |
|
1,313,000 |
|
|
1,939,000 |
|
|
2,941,000 |
|
|
15,521,000 |
|
|
1,871,000 |
|
| Factored receivable total revenue |
|
39,470,000 |
|
|
47,264,000 |
|
|
52,502,000 |
|
|
71,375,000 |
|
|
58,245,000 |
|
| Average net funds employed |
|
976,216,000 |
|
|
1,148,595,000 |
|
|
1,242,133,000 |
|
|
1,409,312,000 |
|
|
1,451,984,000 |
|
| Yield on average net funds employed |
|
16.40 |
% |
|
16.33 |
% |
|
16.77 |
% |
|
20.31 |
% |
|
16.27 |
% |
|
|
|
|
|
|
|
|
|
|
|
| Accounts receivable purchased |
|
$ |
2,927,104,000 |
|
|
$ |
3,277,986,000 |
|
|
$ |
3,599,771,000 |
|
|
$ |
4,023,569,000 |
|
|
$ |
4,041,883,000 |
|
| Number of invoices purchased |
|
1,491,763 |
|
|
1,596,843 |
|
|
1,681,489 |
|
|
1,725,721 |
|
|
1,604,012 |
|
| Average invoice size |
|
$ |
1,962 |
|
|
$ |
2,053 |
|
|
$ |
2,141 |
|
|
$ |
2,332 |
|
|
$ |
2,520 |
|
| Average invoice size - transportation |
|
$ |
1,911 |
|
|
$ |
2,002 |
|
|
$ |
2,073 |
|
|
$ |
2,176 |
|
|
$ |
2,401 |
|
| Average invoice size - non-transportation |
|
$ |
5,205 |
|
|
$ |
6,083 |
|
|
$ |
5,701 |
|
|
$ |
6,469 |
|
|
$ |
5,495 |
|
Metrics above include assets and deposits held for sale.
(1)September 30, 2022 non-interest income includes a $1.0 million gain on sale of a portfolio of factored receivables, which contributed 0.33% to the yield on average net funds employed for the quarter.
June 30, 2022 non-interest income includes a $13.2 million gain on sale of a portfolio of factored receivables, which contributed 3.76% to the yield on average net funds employed for the quarter.
Information pertaining to our Payments segment, which includes only our TriumphPay division, summarized as of and for the quarters ended:
|
|
|
|
|
|
|
|
|
|
|
|
|
|
|
|
|
|
|
|
|
|
|
|
|
|
|
|
|
|
|
|
|
| Payments |
|
March 31,
2023 |
|
December 31,
2022 |
|
September 30,
2022 |
|
June 30,
2022 |
|
March 31,
2022 |
| Factored receivable period end balance |
|
$ |
82,033,000 |
|
|
$ |
85,722,000 |
|
|
$ |
118,958,000 |
|
|
$ |
145,835,000 |
|
|
$ |
178,879,000 |
|
|
|
|
|
|
|
|
|
|
|
|
| Total revenue |
|
|
|
|
|
|
|
|
|
|
| Interest income |
|
$ |
2,747,000 |
|
|
$ |
3,319,000 |
|
|
$ |
3,756,000 |
|
|
$ |
4,172,000 |
|
|
$ |
4,832,000 |
|
| Intersegment interest income allocation |
|
1,542,000 |
|
|
311,000 |
|
|
— |
|
|
— |
|
|
— |
|
Noninterest income(1) |
|
3,972,000 |
|
|
3,551,000 |
|
|
3,518,000 |
|
|
10,309,000 |
|
|
3,242,000 |
|
|
|
$ |
8,261,000 |
|
|
$ |
7,181,000 |
|
|
$ |
7,274,000 |
|
|
$ |
14,481,000 |
|
|
$ |
8,074,000 |
|
|
|
|
|
|
|
|
|
|
|
|
| Total expense |
|
|
|
|
|
|
|
|
|
|
| Intersegment interest expense allocation |
|
$ |
— |
|
|
$ |
— |
|
|
$ |
420,000 |
|
|
$ |
368,000 |
|
|
$ |
53,000 |
|
| Credit loss expense (benefit) |
|
— |
|
|
(187,000) |
|
|
235,000 |
|
|
(184,000) |
|
|
354,000 |
|
| Noninterest expense |
|
15,417,000 |
|
|
17,169,000 |
|
|
14,066,000 |
|
|
17,663,000 |
|
|
14,333,000 |
|
|
|
$ |
15,417,000 |
|
|
$ |
16,982,000 |
|
|
$ |
14,721,000 |
|
|
$ |
17,847,000 |
|
|
$ |
14,740,000 |
|
|
|
|
|
|
|
|
|
|
|
|
| Pre-tax operating income (loss) |
|
$ |
(7,156,000) |
|
|
$ |
(9,801,000) |
|
|
$ |
(7,447,000) |
|
|
$ |
(3,366,000) |
|
|
$ |
(6,666,000) |
|
| Intersegment interest expense allocation |
|
— |
|
|
— |
|
|
420,000 |
|
|
368,000 |
|
|
53,000 |
|
| Depreciation and software amortization expense |
|
193,000 |
|
|
178,000 |
|
|
120,000 |
|
|
103,000 |
|
|
108,000 |
|
| Intangible amortization expense |
|
1,548,000 |
|
|
1,451,000 |
|
|
1,450,000 |
|
|
1,477,000 |
|
|
1,490,000 |
|
Earnings (losses) before interest, taxes, depreciation, and amortization(2) |
|
$ |
(5,415,000) |
|
|
$ |
(8,172,000) |
|
|
$ |
(5,457,000) |
|
|
$ |
(1,418,000) |
|
|
$ |
(5,015,000) |
|
|
|
|
|
|
|
|
|
|
|
|
|
|
|
|
|
|
|
|
|
|
|
|
|
|
|
|
|
|
|
|
|
|
| EBITDA Margin |
|
(66) |
% |
|
(114) |
% |
|
(75) |
% |
|
(10) |
% |
|
(62) |
% |
|
|
|
|
|
|
|
|
|
|
|
| Number of invoices processed |
|
4,260,654 |
|
4,605,020 |
|
4,676,249 |
|
4,394,351 |
|
3,982,879 |
| Amount of payments processed |
|
$5,030,548,000 |
|
$5,577,014,000 |
|
$5,951,706,000 |
|
$6,033,898,000 |
|
$5,700,759,000 |
| Network invoice volume |
|
159,353 |
|
157,004 |
|
144,253 |
|
118,580 |
|
52,182 |
| Network payment volume |
|
$289,667,000 |
|
$301,366,000 |
|
$288,410,000 |
|
$253,312,000 |
|
$129,569,000 |
(1)June 30, 2022 non-interest income includes a $10.2 million gain on an equity investment and a $3.2 million loss on impairment of warrants.
(2)Earnings (losses) before interest, taxes, depreciation, and amortization ("EBITDA") is a non-GAAP financial measure used as a supplemental measure to evaluate the performance of our Payments segment.
Deposits summarized as of:
|
|
|
|
|
|
|
|
|
|
|
|
|
|
|
|
|
|
|
|
|
|
|
|
|
|
|
|
|
|
| (Dollars in thousands) |
March 31,
2023 |
|
December 31,
2022 |
|
September 30,
2022 |
|
June 30,
2022 |
|
March 31,
2022 |
| Non-interest bearing demand |
$ |
1,727,749 |
|
|
$ |
1,756,680 |
|
|
$ |
1,897,309 |
|
|
$ |
2,085,249 |
|
|
$ |
1,859,376 |
|
| Interest bearing demand |
818,382 |
|
|
856,512 |
|
|
883,581 |
|
|
879,072 |
|
|
782,859 |
|
| Individual retirement accounts |
62,030 |
|
|
68,125 |
|
|
74,423 |
|
|
80,187 |
|
|
70,311 |
|
| Money market |
488,064 |
|
|
508,534 |
|
|
505,082 |
|
|
538,966 |
|
|
526,324 |
|
| Savings |
535,796 |
|
|
551,780 |
|
|
546,862 |
|
|
543,969 |
|
|
448,878 |
|
| Certificates of deposit |
286,153 |
|
|
319,150 |
|
|
373,734 |
|
|
437,766 |
|
|
431,243 |
|
| Brokered time deposits |
120,820 |
|
|
110,555 |
|
|
160,363 |
|
|
215,715 |
|
|
2,752 |
|
| Other brokered deposits |
— |
|
|
— |
|
|
— |
|
|
— |
|
|
210,043 |
|
| Total deposits |
$ |
4,038,994 |
|
|
$ |
4,171,336 |
|
|
$ |
4,441,354 |
|
|
$ |
4,780,924 |
|
|
$ |
4,331,786 |
|
Deposits, including deposits held for sale, summarized as of:
|
|
|
|
|
|
|
|
|
|
|
|
|
|
|
|
|
|
|
|
|
|
|
|
|
|
|
|
|
|
| (Dollars in thousands) |
March 31,
2023 |
|
December 31,
2022 |
|
September 30,
2022 |
|
June 30,
2022 |
|
March 31,
2022 |
| Non-interest bearing demand |
$ |
1,727,749 |
|
|
$ |
1,756,680 |
|
|
$ |
1,897,309 |
|
|
$ |
2,086,659 |
|
|
$ |
1,972,760 |
|
| Interest bearing demand |
818,382 |
|
|
856,512 |
|
|
883,581 |
|
|
879,072 |
|
|
873,308 |
|
| Individual retirement accounts |
62,030 |
|
|
68,125 |
|
|
74,423 |
|
|
80,187 |
|
|
81,703 |
|
| Money market |
488,064 |
|
|
508,534 |
|
|
505,082 |
|
|
538,966 |
|
|
558,876 |
|
| Savings |
535,796 |
|
|
551,780 |
|
|
546,862 |
|
|
543,969 |
|
|
520,744 |
|
| Certificates of deposit |
286,153 |
|
|
319,150 |
|
|
373,734 |
|
|
437,766 |
|
|
489,298 |
|
| Brokered time deposits |
120,820 |
|
|
110,555 |
|
|
160,363 |
|
|
215,715 |
|
|
2,752 |
|
| Other brokered deposits |
— |
|
|
— |
|
|
— |
|
|
— |
|
|
210,043 |
|
| Total deposits |
$ |
4,038,994 |
|
|
$ |
4,171,336 |
|
|
$ |
4,441,354 |
|
|
$ |
4,782,334 |
|
|
$ |
4,709,484 |
|
Net interest margin summarized for the three months ended:
|
|
|
|
|
|
|
|
|
|
|
|
|
|
|
|
|
|
|
|
|
|
|
|
|
|
|
|
|
|
|
|
|
|
|
|
|
March 31, 2023 |
|
December 31, 2022 |
| (Dollars in thousands) |
Average
Balance |
|
Interest |
|
Average
Rate(4)
|
|
Average
Balance |
|
Interest |
|
Average
Rate(4)
|
| Interest earning assets: |
|
|
|
|
|
|
|
|
|
|
|
| Interest earning cash balances |
$ |
260,508 |
|
|
$ |
2,994 |
|
|
4.66 |
% |
|
$ |
295,192 |
|
|
$ |
2,891 |
|
|
3.89 |
% |
| Taxable securities |
295,353 |
|
|
4,029 |
|
|
5.53 |
% |
|
253,684 |
|
|
3,285 |
|
|
5.14 |
% |
| Tax-exempt securities |
13,142 |
|
|
84 |
|
|
2.59 |
% |
|
13,451 |
|
|
87 |
|
|
2.57 |
% |
| FHLB and other restricted stock |
9,951 |
|
|
125 |
|
|
5.09 |
% |
|
6,215 |
|
|
83 |
|
|
5.30 |
% |
Loans(1) |
4,110,129 |
|
|
93,442 |
|
|
9.22 |
% |
|
4,294,799 |
|
|
99,926 |
|
|
9.23 |
% |
| Total interest earning assets |
$ |
4,689,083 |
|
|
$ |
100,674 |
|
|
8.71 |
% |
|
$ |
4,863,341 |
|
|
$ |
106,272 |
|
|
8.67 |
% |
| Non-interest earning assets: |
|
|
|
|
|
|
|
|
|
|
|
| Other assets |
620,941 |
|
|
|
|
|
|
640,752 |
|
|
|
|
|
| Total assets |
$ |
5,310,024 |
|
|
|
|
|
|
$ |
5,504,093 |
|
|
|
|
|
| Interest bearing liabilities: |
|
|
|
|
|
|
|
|
|
|
|
| Deposits: |
|
|
|
|
|
|
|
|
|
|
|
| Interest bearing demand |
$ |
836,309 |
|
|
$ |
570 |
|
|
0.28 |
% |
|
$ |
852,651 |
|
|
$ |
541 |
|
|
0.25 |
% |
| Individual retirement accounts |
65,182 |
|
|
85 |
|
|
0.53 |
% |
|
71,409 |
|
|
93 |
|
|
0.52 |
% |
| Money market |
498,083 |
|
|
1,130 |
|
|
0.92 |
% |
|
508,899 |
|
|
639 |
|
|
0.50 |
% |
| Savings |
544,939 |
|
|
309 |
|
|
0.23 |
% |
|
526,659 |
|
|
281 |
|
|
0.21 |
% |
| Certificates of deposit |
299,148 |
|
|
555 |
|
|
0.75 |
% |
|
343,110 |
|
|
520 |
|
|
0.60 |
% |
| Brokered time deposits |
99,182 |
|
|
550 |
|
|
2.25 |
% |
|
176,610 |
|
|
954 |
|
|
2.14 |
% |
| Other brokered deposits |
278 |
|
|
3 |
|
|
4.38 |
% |
|
35,815 |
|
|
— |
|
|
— |
% |
| Total interest bearing deposits |
2,343,121 |
|
|
3,202 |
|
|
0.55 |
% |
|
2,515,153 |
|
|
3,028 |
|
|
0.48 |
% |
| Federal Home Loan Bank advances |
138,778 |
|
|
1,747 |
|
|
5.11 |
% |
|
30,000 |
|
|
296 |
|
|
3.91 |
% |
| Subordinated notes |
107,901 |
|
|
1,309 |
|
|
4.92 |
% |
|
107,690 |
|
|
1,307 |
|
|
4.82 |
% |
| Junior subordinated debentures |
41,227 |
|
|
1,034 |
|
|
10.17 |
% |
|
41,091 |
|
|
926 |
|
|
8.94 |
% |
| Other borrowings |
2,620 |
|
|
— |
|
|
— |
% |
|
5,317 |
|
|
— |
|
|
— |
% |
| Total interest bearing liabilities |
$ |
2,633,647 |
|
|
$ |
7,292 |
|
|
1.12 |
% |
|
$ |
2,699,251 |
|
|
$ |
5,557 |
|
|
0.82 |
% |
| Non-interest bearing liabilities and equity: |
|
|
|
|
|
|
|
|
|
|
|
| Non-interest bearing demand deposits |
1,704,778 |
|
|
|
|
|
|
1,807,298 |
|
|
|
|
|
| Other liabilities |
113,487 |
|
|
|
|
|
|
88,319 |
|
|
|
|
|
| Total equity |
858,112 |
|
|
|
|
|
|
909,225 |
|
|
|
|
|
| Total liabilities and equity |
$ |
5,310,024 |
|
|
|
|
|
|
$ |
5,504,093 |
|
|
|
|
|
| Net interest income |
|
|
$ |
93,382 |
|
|
|
|
|
|
$ |
100,715 |
|
|
|
Interest spread(2) |
|
|
|
|
7.59 |
% |
|
|
|
|
|
7.85 |
% |
Net interest margin(3) |
|
|
|
|
8.08 |
% |
|
|
|
|
|
8.22 |
% |
(1) Loan balance totals include respective nonaccrual assets.
(2) Net interest spread is the yield on average interest earning assets less the rate on interest bearing liabilities.
(3) Net interest margin is the ratio of net interest income to average interest earning assets.
(4) Average rates have been annualized.
Additional information pertaining to our loan portfolio, including loans held for investment and loans held for sale, summarized for the quarters ended:
|
|
|
|
|
|
|
|
|
|
|
|
|
|
|
|
|
|
|
|
|
|
|
|
|
|
|
|
|
|
| (Dollars in thousands) |
March 31,
2023 |
|
December 31,
2022 |
|
September 30,
2022 |
|
June 30,
2022 |
|
March 31,
2022 |
| Average Banking loans |
$ |
2,916,614 |
|
|
$ |
2,891,412 |
|
|
$ |
2,830,507 |
|
|
$ |
3,014,573 |
|
|
$ |
3,032,745 |
|
| Average Factoring receivables |
1,110,203 |
|
|
1,298,286 |
|
|
1,393,141 |
|
|
1,576,208 |
|
|
1,614,462 |
|
| Average Payments receivables |
83,312 |
|
|
105,101 |
|
|
131,484 |
|
|
163,112 |
|
|
166,650 |
|
| Average total loans |
$ |
4,110,129 |
|
|
$ |
4,294,799 |
|
|
$ |
4,355,132 |
|
|
$ |
4,753,893 |
|
|
$ |
4,813,857 |
|
| Banking yield |
7.31 |
% |
|
7.04 |
% |
|
6.30 |
% |
|
5.87 |
% |
|
5.46 |
% |
| Factoring yield |
13.94 |
% |
|
13.85 |
% |
|
14.11 |
% |
|
14.21 |
% |
|
14.16 |
% |
| Payments yield |
13.37 |
% |
|
12.53 |
% |
|
11.33 |
% |
|
10.26 |
% |
|
11.76 |
% |
| Total loan yield |
9.22 |
% |
|
9.23 |
% |
|
8.95 |
% |
|
8.79 |
% |
|
8.60 |
% |
Metrics and non-GAAP financial reconciliation:
|
|
|
|
|
|
|
|
|
|
|
|
|
|
|
|
|
|
|
|
|
|
|
|
|
|
|
|
|
|
|
|
|
|
|
|
|
|
|
As of and for the Three Months Ended |
|
|
(Dollars in thousands,
except per share amounts) |
|
March 31,
2023 |
|
December 31,
2022 |
|
September 30,
2022 |
|
June 30,
2022 |
|
March 31,
2022 |
|
|
|
|
|
|
|
|
|
|
|
|
|
|
|
|
|
|
|
|
|
|
|
|
|
|
|
|
|
|
|
|
|
|
|
|
|
|
|
|
|
|
|
|
|
|
|
|
|
|
|
|
|
|
|
|
|
|
|
|
|
|
|
|
|
|
|
|
|
|
|
|
|
|
|
|
|
|
|
|
|
|
|
|
|
|
|
|
|
|
|
|
|
|
|
|
|
|
|
|
|
|
|
|
|
|
|
|
|
|
|
|
|
|
|
|
|
|
|
|
|
|
|
|
|
|
|
|
|
|
|
|
|
|
|
|
|
|
|
| Average total stockholders' equity |
|
$ |
858,112 |
|
|
$ |
909,225 |
|
|
$ |
898,845 |
|
|
$ |
882,505 |
|
|
$ |
880,949 |
|
|
|
|
|
| Average preferred stock liquidation preference |
|
(45,000) |
|
|
(45,000) |
|
|
(45,000) |
|
|
(45,000) |
|
|
(45,000) |
|
|
|
|
|
| Average total common stockholders' equity |
|
813,112 |
|
|
864,225 |
|
|
853,845 |
|
|
837,505 |
|
|
835,949 |
|
|
|
|
|
| Average goodwill and other intangibles |
|
(265,320) |
|
|
(267,206) |
|
|
(269,417) |
|
|
(269,319) |
|
|
(275,378) |
|
|
|
|
|
| Average tangible common stockholders' equity |
|
$ |
547,792 |
|
|
$ |
597,019 |
|
|
$ |
584,428 |
|
|
$ |
568,186 |
|
|
$ |
560,571 |
|
|
|
|
|
|
|
|
|
|
|
|
|
|
|
|
|
|
|
|
| Net income available to common stockholders |
|
$ |
10,209 |
|
|
$ |
16,759 |
|
|
$ |
15,428 |
|
|
$ |
43,390 |
|
|
$ |
23,528 |
|
|
|
|
|
| Average tangible common equity |
|
547,792 |
|
|
597,019 |
|
|
584,428 |
|
|
568,186 |
|
|
560,571 |
|
|
|
|
|
| Return on average tangible common equity |
|
7.56 |
% |
|
11.14 |
% |
|
10.47 |
% |
|
30.63 |
% |
|
17.02 |
% |
|
|
|
|
|
|
|
|
|
|
|
|
|
|
|
|
|
|
|
|
|
|
|
|
|
|
|
|
|
|
|
|
|
|
|
|
|
|
|
|
|
|
|
|
|
|
|
|
|
|
|
|
|
|
|
|
|
|
|
|
|
|
|
|
|
|
|
|
|
|
|
|
|
|
|
|
|
|
|
|
|
|
|
|
|
|
|
|
|
|
|
|
|
|
|
|
|
|
|
|
|
|
|
|
|
|
|
|
|
|
|
|
|
|
|
|
|
|
|
|
|
|
|
|
|
|
|
|
|
|
|
|
|
|
|
|
|
|
|
|
|
|
|
|
|
|
|
|
|
|
|
|
|
|
|
|
|
|
|
|
|
|
|
|
|
|
|
|
|
| Net interest income |
|
$ |
93,382 |
|
|
$ |
100,715 |
|
|
$ |
98,270 |
|
|
$ |
101,428 |
|
|
$ |
100,079 |
|
|
|
|
|
| Non-interest income |
|
11,022 |
|
|
12,119 |
|
|
12,668 |
|
|
48,160 |
|
|
11,121 |
|
|
|
|
|
| Operating revenue |
|
$ |
104,404 |
|
|
$ |
112,834 |
|
|
$ |
110,938 |
|
|
$ |
149,588 |
|
|
$ |
111,200 |
|
|
|
|
|
| Non-interest expenses |
|
$ |
89,281 |
|
|
$ |
86,771 |
|
|
$ |
86,689 |
|
|
$ |
88,607 |
|
|
$ |
78,564 |
|
|
|
|
|
| Efficiency ratio |
|
85.52 |
% |
|
76.90 |
% |
|
78.14 |
% |
|
59.23 |
% |
|
70.65 |
% |
|
|
|
|
|
|
|
|
|
|
|
|
|
|
|
|
|
|
|
|
|
|
|
|
|
|
|
|
|
|
|
|
|
|
|
|
|
|
|
|
|
|
|
|
|
|
|
|
|
|
|
|
|
|
|
|
|
|
|
|
|
|
|
|
|
|
|
|
|
|
|
|
|
|
|
|
|
|
|
|
|
|
|
|
|
|
|
|
|
|
|
|
|
|
|
|
|
|
|
|
|
|
|
|
|
|
|
|
|
|
|
|
|
|
|
|
|
|
|
|
|
|
|
|
|
|
|
|
|
|
|
|
|
|
|
|
|
|
|
|
|
|
|
|
|
|
|
|
|
|
|
|
|
|
|
|
|
|
|
|
|
|
|
|
|
|
|
|
|
|
|
|
|
|
|
|
|
|
|
|
|
|
|
|
| Net non-interest expense to average assets ratio: |
|
|
|
|
|
|
|
|
|
|
|
|
|
|
| Non-interest expenses |
|
$ |
89,281 |
|
|
$ |
86,771 |
|
|
$ |
86,689 |
|
|
$ |
88,607 |
|
|
$ |
78,564 |
|
|
|
|
|
| Total non-interest income |
|
$ |
11,022 |
|
|
$ |
12,119 |
|
|
$ |
12,668 |
|
|
$ |
48,160 |
|
|
$ |
11,121 |
|
|
|
|
|
| Net non-interest expenses |
|
$ |
78,259 |
|
|
$ |
74,652 |
|
|
$ |
74,021 |
|
|
$ |
40,447 |
|
|
$ |
67,443 |
|
|
|
|
|
| Average total assets |
|
$ |
5,310,024 |
|
|
$ |
5,504,093 |
|
|
$ |
5,700,547 |
|
|
$ |
5,878,320 |
|
|
$ |
5,843,319 |
|
|
|
|
|
| Net non-interest expense to average assets ratio |
|
5.98 |
% |
|
5.38 |
% |
|
5.15 |
% |
|
2.76 |
% |
|
4.68 |
% |
|
|
|
|
|
|
|
|
|
|
|
|
|
|
|
|
|
|
|
| Total stockholders' equity |
|
$ |
827,216 |
|
|
$ |
888,971 |
|
|
$ |
891,173 |
|
|
$ |
874,281 |
|
|
$ |
886,665 |
|
|
|
|
|
| Preferred stock liquidation preference |
|
(45,000) |
|
|
(45,000) |
|
|
(45,000) |
|
|
(45,000) |
|
|
(45,000) |
|
|
|
|
|
| Total common stockholders' equity |
|
782,216 |
|
|
843,971 |
|
|
846,173 |
|
|
829,281 |
|
|
841,665 |
|
|
|
|
|
| Goodwill and other intangibles |
|
(265,959) |
|
|
(265,767) |
|
|
(268,604) |
|
|
(270,666) |
|
|
(269,119) |
|
|
|
|
|
| Tangible common stockholders' equity |
|
$ |
516,257 |
|
|
$ |
578,204 |
|
|
$ |
577,569 |
|
|
$ |
558,615 |
|
|
$ |
572,546 |
|
|
|
|
|
| Common shares outstanding |
|
23,370,515 |
|
|
24,053,585 |
|
|
24,478,288 |
|
|
24,457,777 |
|
|
25,161,690 |
|
|
|
|
|
| Tangible book value per share |
|
$ |
22.09 |
|
|
$ |
24.04 |
|
|
$ |
23.60 |
|
|
$ |
22.84 |
|
|
$ |
22.75 |
|
|
|
|
|
|
|
|
|
|
|
|
|
|
|
|
|
|
|
|
| Total assets at end of period |
|
$ |
5,628,185 |
|
|
$ |
5,333,783 |
|
|
$ |
5,642,450 |
|
|
$ |
5,955,507 |
|
|
$ |
6,076,434 |
|
|
|
|
|
| Goodwill and other intangibles |
|
(265,959) |
|
|
(265,767) |
|
|
(268,604) |
|
|
(270,666) |
|
|
(269,119) |
|
|
|
|
|
| Tangible assets at period end |
|
$ |
5,362,226 |
|
|
$ |
5,068,016 |
|
|
$ |
5,373,846 |
|
|
$ |
5,684,841 |
|
|
$ |
5,807,315 |
|
|
|
|
|
| Tangible common stockholders' equity ratio |
|
9.63 |
% |
|
11.41 |
% |
|
10.75 |
% |
|
9.83 |
% |
|
9.86 |
% |
|
|
|
|
1)Triumph Financial uses certain non-GAAP financial measures to provide meaningful supplemental information regarding Triumph Financial's operational performance and to enhance investors' overall understanding of such financial performance. The non-GAAP measures used by Triumph Financial include the following:
•"Tangible common stockholders' equity" is defined as common stockholders' equity less goodwill and other intangible assets.
•"Total tangible assets" is defined as total assets less goodwill and other intangible assets.
•"Tangible book value per share" is defined as tangible common stockholders' equity divided by total common shares outstanding. This measure is important to investors interested in changes from period-to-period in book value per share exclusive of changes in intangible assets.
•"Tangible common stockholders' equity ratio" is defined as the ratio of tangible common stockholders' equity divided by total tangible assets. We believe that this measure is important to many investors in the marketplace who are interested in relative changes from period-to period in common equity and total assets, each exclusive of changes in intangible assets.
•"Return on Average Tangible Common Equity" is defined as net income available to common stockholders divided by average tangible common stockholders' equity.
2)Performance ratios include discount accretion on purchased loans for the periods presented as follows:
|
|
|
|
|
|
|
|
|
|
|
|
|
|
|
|
|
|
|
|
|
|
|
|
|
|
|
|
|
|
|
|
|
|
|
For the Three Months Ended |
|
|
| (Dollars in thousands) |
March 31,
2023 |
|
December 31,
2022 |
|
September 30,
2022 |
|
June 30,
2022 |
|
March 31,
2022 |
|
|
|
|
| Loan discount accretion |
$ |
1,810 |
|
|
$ |
2,011 |
|
|
$ |
1,539 |
|
|
$ |
3,556 |
|
|
$ |
1,536 |
|
|
|
|
|
3)Asset quality ratios exclude loans held for sale, except for non-performing assets to total assets.
4)Current quarter ratios are preliminary.
Source: Triumph Financial, Inc.
###
Investor Relations:
Luke Wyse
Senior Vice President, Finance & Investor Relations
lwyse@tbkbank.com
214-365-6936
Media Contact:
Amanda Tavackoli
Senior Vice President, Director of Corporate Communication
atavackoli@tbkbank.com
214-365-6930