Document
Exhibit 99.1
January 25, 2023
Fellow Shareholders,
For the fourth quarter, we earned net income to common stockholders of $16.8 million, or $0.67 per diluted share. I will begin by addressing the quarter itself in this letter as you would expect. In addition to that, I will include a look back at what we have done over the last three years and a look forward at what we expect to do over the next three years.
Discussion of the Quarter
The tables below outline the metrics that matter most, both generally for the enterprise as a whole and specifically to our factoring and payments segments.
|
|
|
|
|
|
|
|
|
|
|
|
|
|
|
|
|
|
|
|
|
|
|
|
|
|
|
|
|
|
|
|
|
|
|
|
|
|
|
|
|
|
|
As of and for the Three Months Ended |
|
As of and for the Year Ended |
| (Dollars in thousands) |
December 31,
2022 |
|
September 30,
2022 |
|
June 30,
2022 |
|
March 31,
2022 |
|
December 31,
2021 |
|
December 31,
2022 |
|
December 31,
2021 |
| Financial Highlights: |
|
|
|
|
|
|
|
|
|
|
|
|
|
| Loans held for investment |
$ |
4,120,291 |
|
|
$ |
4,433,304 |
|
|
$ |
4,435,366 |
|
|
$ |
4,724,078 |
|
|
$ |
4,867,572 |
|
|
$ |
4,120,291 |
|
|
$ |
4,867,572 |
|
| Deposits |
$ |
4,171,336 |
|
|
$ |
4,441,354 |
|
|
$ |
4,780,924 |
|
|
$ |
4,331,786 |
|
|
$ |
4,646,679 |
|
|
$ |
4,171,336 |
|
|
$ |
4,646,679 |
|
| Net income available to common stockholders |
$ |
16,759 |
|
|
$ |
15,428 |
|
|
$ |
43,390 |
|
|
$ |
23,528 |
|
|
$ |
25,839 |
|
|
$ |
99,105 |
|
|
$ |
109,768 |
|
| Diluted earnings per common share |
$ |
0.67 |
|
|
$ |
0.62 |
|
|
$ |
1.74 |
|
|
$ |
0.93 |
|
|
$ |
1.02 |
|
|
$ |
3.96 |
|
|
$ |
4.35 |
|
Return on average assets(1) |
1.27 |
% |
|
1.13 |
% |
|
3.02 |
% |
|
1.69 |
% |
|
1.77 |
% |
|
1.79 |
% |
|
1.87 |
% |
Yield on loans(1) |
9.23 |
% |
|
8.95 |
% |
|
8.79 |
% |
|
8.60 |
% |
|
8.68 |
% |
|
8.88 |
% |
|
7.91 |
% |
Cost of total deposits(1) |
0.28 |
% |
|
0.24 |
% |
|
0.23 |
% |
|
0.14 |
% |
|
0.16 |
% |
|
0.22 |
% |
|
0.20 |
% |
| Non-performing assets to total assets |
1.02 |
% |
|
1.11 |
% |
|
0.83 |
% |
|
0.87 |
% |
|
0.92 |
% |
|
1.02 |
% |
|
0.92 |
% |
| ACL to total loans |
1.04 |
% |
|
0.99 |
% |
|
0.98 |
% |
|
0.88 |
% |
|
0.87 |
% |
|
1.04 |
% |
|
0.87 |
% |
Total capital to risk-weighted assets(2) |
17.68 |
% |
|
16.56 |
% |
|
15.91 |
% |
|
14.53 |
% |
|
14.10 |
% |
|
17.68 |
% |
|
14.10 |
% |
Common equity tier 1 capital to risk-weighted assets(2) |
12.74 |
% |
|
11.93 |
% |
|
11.35 |
% |
|
10.40 |
% |
|
9.94 |
% |
|
12.74 |
% |
|
9.94 |
% |
(1) Current quarter ratios are annualized
(2) Current period ratios are preliminary
|
|
|
|
|
|
|
|
|
|
|
|
|
|
|
|
|
|
|
|
|
|
|
|
|
|
|
|
|
|
|
|
|
|
|
|
|
|
|
|
|
|
|
|
|
|
|
|
|
|
|
|
|
|
|
December 31,
2022 |
|
September 30,
2022 |
|
June 30,
2022 |
|
March 31,
2022 |
|
December 31,
2021 |
|
Current Quarter Q/Q |
|
Current Year Y/Y |
| For the Qtr Ending |
|
|
|
|
|
Change |
|
% Change |
|
Change |
|
% Change |
| Factoring: |
|
|
|
|
|
|
|
|
|
|
|
|
|
|
|
|
|
| Invoice Volume |
1,596,843 |
|
|
1,681,489 |
|
|
1,725,721 |
|
|
1,604,012 |
|
|
1,669,387 |
|
|
(84,646) |
|
|
(5.0) |
% |
|
(72,544) |
|
|
(4.3) |
% |
| Purchased Volume |
$ |
3,277,986,000 |
|
|
$ |
3,599,771,000 |
|
|
$ |
4,023,569,000 |
|
|
$ |
4,041,883,000 |
|
|
$ |
4,032,585,000 |
|
|
$ |
(321,785,000) |
|
|
(8.9) |
% |
|
$ |
(754,599,000) |
|
|
(18.7) |
% |
| Average Transportation Invoice Size |
$ |
2,002 |
|
|
$ |
2,073 |
|
|
$ |
2,176 |
|
|
$ |
2,401 |
|
|
$ |
2,291 |
|
|
$ |
(71) |
|
|
(3.4) |
% |
|
$ |
(289) |
|
|
(12.6) |
% |
| Payments: |
|
|
|
|
|
|
|
|
|
|
|
|
|
|
|
|
|
| Invoice Volume |
4,605,020 |
|
|
4,676,249 |
|
|
4,394,351 |
|
|
3,982,879 |
|
|
4,027,680 |
|
|
(71,229) |
|
|
(1.5) |
% |
|
577,340 |
|
|
14.3 |
% |
| Payment Volume |
$ |
5,577,014,000 |
|
|
$ |
5,951,706,000 |
|
|
$ |
6,033,898,000 |
|
|
$ |
5,700,759,000 |
|
|
$ |
5,242,051,000 |
|
|
$ |
(374,692,000) |
|
|
(6.3) |
% |
|
$ |
334,963,000 |
|
|
6.4 |
% |
| Network Invoice Volume |
157,004 |
|
|
144,253 |
|
|
118,580 |
|
|
52,182 |
|
|
— |
|
|
12,751 |
|
|
8.8 |
% |
|
157,004 |
|
|
N/A |
| Network Payment Volume |
$ |
301,366,000 |
|
|
$ |
288,410,000 |
|
|
$ |
253,312,000 |
|
|
$ |
129,569,000 |
|
|
$ |
— |
|
|
$ |
12,956,000 |
|
|
4.5 |
% |
|
$ |
301,366,000 |
|
|
N/A |
| Number of Freight Brokers |
580 |
|
|
584 |
|
|
566 |
|
|
558 |
|
|
554 |
|
|
(4) |
|
|
(0.7) |
% |
|
26 |
|
|
4.7 |
% |
| Number of Factors |
70 |
|
|
70 |
|
|
69 |
|
|
72 |
|
|
69 |
|
|
— |
|
|
— |
% |
|
1 |
|
|
1.4 |
% |
Payments
TriumphPay’s invoice volume decreased 1.5% due to market conditions. On the positive side of the equation, network transaction volume increased 8.8% despite the slowing freight market. Total network payment volume increased from $288 million to $301 million quarter over quarter. In the fourth quarter, our payment volume decreased by 6.3% to $22.3 billion annualized, as average invoice prices fell by 4.8%. I remain pleased with the pipeline in front of us.
On January 11, 2022, we announced the first network transaction (then called conforming transactions). As a reminder, a network transaction is a transaction where both the payor and payee are integrated into the network such that structured data and remittance information may pass between parties digitally, which eliminates inefficiencies in the presentment, audit and payment of invoices. On January 10, 2023, one day before our one year anniversary of the first transaction, we completed enough network transactions to eclipse $1 billion in volume. I think we will all look back at this milestone and appreciate it more as successes continue to come – to go from zero to $1 billion in a year is no easy feat.
For a sense of scale, the $1 billion of network transactions occurred between 21 factors and 83 freight brokers encompassing 486,000 invoices. Across these 486,000 invoices, over 2.6 million exchanges of structured data and status updates have been communicated between systems of record at these freight brokers and factors. Historically, many of those 2.6 million exchanges would have been via a phone call or an email, which create inefficiencies for both the payor and the payee. To extrapolate this efficiency gain across a ubiquitous freight payments network is to understand the transformational nature of what TriumphPay is building. The business concept is proven, we are now on the journey to make the concept a valuable business.
Another noteworthy thing that happened inside of TriumphPay this quarter was that it was a self-funding segment for the quarter. The float we generated from managing payments on behalf of network constituents, exceeded the funding requirements for the business. This allowed TriumphPay to contribute excess non-interest bearing deposits back to the enterprise. This is an exciting development and consistent with our long term goals for the business.
*Excludes $7.0 million net gain on minority investment mark-to-market For the year ending 2022, our factoring segment's pretax contribution was over 20% higher than 2021.
Factoring
I am proud of the team's performance and continued operational excellence. For the fourth quarter, average transportation invoice size decreased 3.4%. This, coupled with lower utilization among our customer fleets due to a softening freight market, contributed to an 8.9% decrease in purchased volumes.
The volume of freight in the truckload sector did not experience the typical fourth quarter seasonal bounce. Diesel remained high, and spot rates continued to edge down. The year finished with blended spot rates ex-fuel around $2.00/mile, down from about $3.00/mile in the 1st quarter of 2022. A blended spot rate averages dry van, refrigerated and flatbed rates. The gap between spot rates and contract rates has narrowed, with contract rates falling below $2.25/mile ex-fuel. The narrowing of that gap is generally viewed as nearing a bottom. Most estimates have the cost per mile to operate a dry van as a small carrier, at about $1.80/mile, entering 2023. If spot rates were to return to $1.50/mile it would chase enough capacity from the market that rates would inevitably bounce back. Our larger carrier relationships estimate their dry van operating costs at $1.60/mile. Utilization problems (i.e. trucks sitting idle) are an issue with our mid-size and larger fleets reporting the trend. Based on our surveys, they expect this to continue through the first quarter of 2023, and perhaps the second quarter.
The transportation factoring industry continues to fight headwinds due to higher cost of capital, higher funding costs and lower average invoice sizes. Many factors are suffering from the high advance, fixed rate deal structures that were the standard over the last several years with their clients. Those deal structures offer little downside margin protection. As a result, we expect many factors to lower advances and/or raise discount rates in the coming months.
We expect our (i) access to capital, (ii) funding costs, and (iii) ability to supplement income through cross selling lending, depository, insurance and cash management services to be advantages for us. In addition, the investments we have made and are continuing to make at the enterprise level in technology will improve our efficiency. We are reassessing our go-to-market strategy in light of these industry dynamics, and plan to build in downside protection through specific products and packages that meet the needs of trucking companies. This pricing discipline and defined market strategy will be impactful in future quarters. Our plan is for managed growth in our factoring segment with a greater emphasis on enhancing efficiency and profitability.
Banking
In our banking segment, the loan yield was up about 74 bps, including the notable items below, while our consolidated cost of deposits increased 4 bps to 28 bps. High-quality transaction deposits in the community bank have been stable, and deposit betas overall remain well-behaved. While rate exception pricing has become more frequent, we do not yet feel the need to raise published rates due to the relative stability of our core deposit base, our current liquidity position and the competitive dynamics of our local markets. We anticipate modest spread widening in the first quarter as the Fed raises rates further, but we expect rate competition for deposits to lower spreads gradually when the Fed eventually pauses. We have seen some modest runoff as households and businesses spend down the excess cash they accumulated during the pandemic but this doesn’t appear to be rate driven. The rate-driven attrition we have seen was mostly attributable to a couple large mortgage warehouse clients and other commercial relationships.
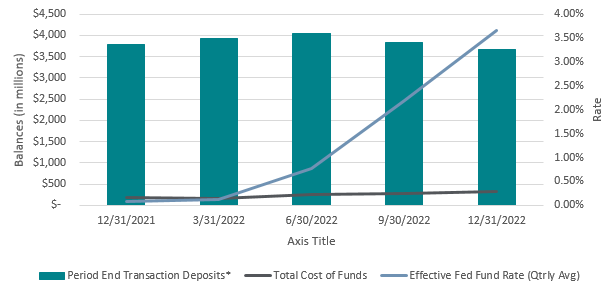
Effective Fed Funds Rate, not seasonally adjusted. Source FRED Economic data, St. Louis Fed - https://fred.stlouisfed.org/series/FEDFUNDS.
*Transaction deposits defined as noninterest and interest bearing checking, money market and savings deposits.
Liquid Credit at TFIN
We sometimes receive inquiries as to why I believe that expertise of the Liquid Credit team should live within the walls of Triumph Financial. We utilize our Liquid Credit team as an investment option to maximize risk-adjusted returns and provide balance sheet flexibility for the bank. They bring a capital markets perspective to our core businesses. The team’s mandate also includes management of the bank’s investment portfolio and short-term liquidity and funding strategies.
The Liquid Credit team’s approach to this lending is to extend credit to high-quality businesses at attractive prices rather than reach on credit risk. As a result, the attractiveness of this business line varies more over time than other things we do. Said simply, there are times we choose to sit out of the market when risk premiums are not appropriate. The team employs bottoms-up analysis, generating ideas internally through the team’s professional network, or through the team’s 60+ trading, research, and banking partners.
We like to identify and buy risk we believe is good quality and a natural fit for a bank balance sheet, but is under-analyzed by other market participants. A good example is buying high-quality revolvers in the secondary market. Often large banks will originate revolving lines of credit to their clients on relationship-driven economic terms. Periodically, the risk or credit departments of those banks will mandate risk reduction, leading to the sale of those revolving lines of credit at significant discounts to fair value. When these facilities are unfunded, the sellers of revolving lines of credit actually pay the buyers upfront, which can present compelling investment opportunities.
Over the last few years we have sought an “up-in-quality” bias in the bank’s investment portfolio. Given that goal, the investment portfolio includes numerous high-quality structured products, 100% of which are AA or AAA rated from a major ratings agency. These investments are extremely high credit quality and generally also bear very little interest rate risk. While the specifics vary by product and investment, to take losses on any of these investments, credit markets would need to experience default rates and investment losses multiples worse than we saw during the Global Financial Crisis, sustained for years. This portfolio is likely to continue to grow as we believe these assets represent the best risk-return opportunities available in today’s market.
Beyond the investing role, the Liquid Credit team also aims to serve as a capital markets consultant as is constructive across the company. Examples of projects vary from sourcing and structuring individual transactions, to stress testing portfolio exposure through COVID, to providing market data points to evaluate and price commercial loans, strategizing on capital deployment and helping us think through hedging concentrated exposure in our transportation portfolio as needed.
Notable items impacting Q4 results
•Prepayment fee – During the 4th quarter we received prepayment fees on two equipment finance loans totaling $1.8 million, impacting the banking segment yield by 25 bps. While these fees are not unusual for us, the size of the combined fees this quarter are worth noting.
•Loan recovery – During the 4th quarter we received a $950,000 recovery on a loan charged off by one of our acquired banks prior to our acquisition. Because we never recorded the initial corresponding charge-off, this amount was applied to noninterest income.
•Our corporate tax rate was unusually high in the 4th quarter due to (i) the pending issuance of shares pursuant to the completion of the Strategic Equity Grant, and (ii) apportionment of more of our full year 2022 income to states with higher tax rates. We would expect our all-in tax rate for 2023 to be roughly 25.5%, but that is difficult to project precisely.
•Update on USPS Litigation – We continue to pursue our litigation in the United States Court of Federal Claims against the United States Postal Service for the $19.4 million of misdirected payments committed during the fall of 2020. Based on our legal analysis and discussions with our counsel advising us on this matter, we continue to believe it is probable that we will prevail in such action and that the USPS will have the capacity to make payment on such receivable. Consequently, we have not reserved for such balance as of December 31, 2022. We have no other updates currently.
Review of the Prior Three Years
In preparation for this letter, I reviewed the transcript of our 2019 Q3 earnings call. That call was the public unveiling of our “strategic shift” towards transportation and financial technology (I did not have a fully formed view at the time to describe TriumphPay as a “payments network” – that came later). The call was a public statement that we were comfortable deviating from our community banking peers. The underlying thesis was that we had an opportunity to create value for our customers, investors and enterprise by focusing on what we do best. We said several things in that call, but I have distilled down five important things we said we would do.
1.The growth of our balance sheet would be limited. Banks need operating leverage to drive profitability, and they generally seek that through balance sheet growth. This is why almost all banks pursue growth in their existing markets and/or move into new markets. We view the world a bit differently. Our goal was (and still is) to materially grow profits without materially growing assets. There were many reasons for this, but primary among them were (i) most markets were not conducive to growing assets faster than the overall economy, and (ii) niche businesses can be more profitable than competing with the herd.
As of the second quarter of 2019, which we consider the true inflection point of our strategic pivot, our total assets were $4.78 billion. As of the end of 2022, our total assets were $5.33 billion. This represents an annualized growth rate of about 3.2%. During that same period, we generated total net income to shareholders of about $302 million.
Another benefit of restrained asset growth is the ability to efficiently return capital to shareholders. During the three year period, we repurchased just over 3.2 million shares, which is equal to 13% of the company. During the same period and inclusive of the SEG shares that will be distributed next month,(1) we granted equity compensation awards with a maximum potential issuance of 1.4 million shares to team members. Thus, our share buyback programs during the period exceeded equity compensation awards by 1.8 million shares. During this period, of the $302 million cumulative earnings generated by our franchise, we invested just under $150 million on share repurchases (at an average price of $45.98) and approximately $97 million on the HubTran acquisition, which helped build the foundation of our payments network. During that same period from June 30, 2019, to December 31, 2022, our GAAP equity increased $246 million. These figures do not take into account the significant franchise-enhancing investments in our technology platform, which flowed through the P&L and the results of which will become obvious in the years ahead.
2.The growth we would deliver would be in our transportation businesses. In order to grow profits, we had to grow something. We chose to focus on our transportation lines of business where we could grow with confidence. Below are some metrics illustrating the growth in those lines of business:
a.Our factoring segment, from 2Q 2019 to 4Q 2022, grew:
i.Clients from 6,455 to 10,842.
ii.The number of quarterly invoices purchased from 874,000 to 1.6 million.
iii.The dollar volume of invoices purchased quarterly from $1.4 billion to $3.3 billion.
b.Our payments segment, from 2Q 2019 to 4Q 2022 grew:
i.From a net user of funding to a net provider of funding.
ii.Total brokers from 146 to 580.
iii.Total factors from 0 to 70.
iv.Quarterly transaction volume from 150,000 invoices to 4.6 million.
v.Quarterly payment volume from $169 million to $5.6 billion.
vi.Quarterly number of distinct carriers paid from 28,126 to 135,994. For the year 2022, we paid 197,796 distinct carriers.
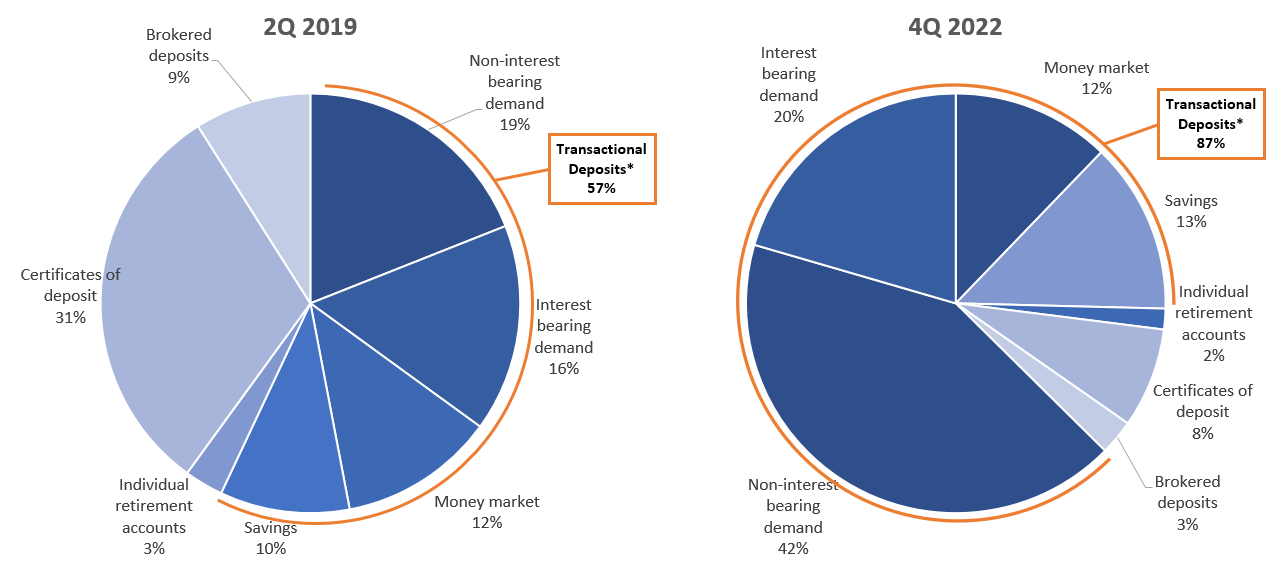
3.We intended to invest in deposit generating capabilities rather than continuing to pursue deposit-centric M&A. For the first five years following our public offering, we completed a series of community bank and branch acquisitions. These were respected community banks, operating in mostly rural markets. These acquisitions were not growth targets, but they had excess funding at a time when the market didn’t value core deposits.
(1) The Strategic Equity Grant, or “SEG”, was a retention tool announced in 2019 designed to retain key senior leaders with an equity grant tied to the performance of the organization as a whole. The program would only be in-the-money if cumulative EPS from 12/31/2019 through 12/31/2022 were greater than $10 per share, inclusive of the cost of the program.
The strategy worked as we funded high growth lending businesses with excess funding from lower growth markets. Without significant further investment and expansion; however, we would not be able to organically grow deposits, which could put us on a distracting M&A treadmill just as our strategy was becoming more focused.
As a result, alongside the decision to restrain balance sheet growth, we made the decision to invest in our capabilities to grow deposits without adding branches. Those investments included:
•revamping our deposit offerings to create products on par and competitive with regional banks,
•upgrading our treasury management services capabilities to appeal to larger commercial clients and attract customers in-market,
•reworking our incentive plans to reward our relationship bankers for bringing full banking relationships to Triumph Financial rather than just loans.
As a result of those efforts, our transactional deposits as a percentage of total deposits increased by 30% as you can see in the graphic below.
*Transactional deposits defined as noninterest and interest bearing checking, money market and savings deposits
4.TriumphPay would be a drag on earnings, but would achieve profitability by the end of the period. We did not achieve this forecast of profitability at TriumphPay during 2022. The primary reason was our decision to pivot from a closed-loop network to an open-loop network following our acquisition of HubTran in June 2021. Investors can do their own analysis about what we would have earned excluding the TriumphPay earnings drag during the period or if we had stayed the course on the original strategy if they find that valuable. I don’t look at it that way. We made our call on where we wanted to drive the business. That call must encompass all the changes – seen and unforeseen – along the way. I remain convinced the pivot to an open-loop was the right call for many reasons, but I also acknowledge it caused us to miss the timing of our profitability target.
5.Our enterprise goal for profitability was to achieve a consistent 2% ROA and 20% ROE. For the three year period 2020-2022, our average ROA was 1.59% and our average ROATCE was 17.42%. From a sum of the parts analysis for our income statement, as long as our factoring segment is an ever growing portion of our loan book, it will naturally pull our ROA and ROATCE higher. Our vision for our payments segment at the time of these projections was that it would do the same and that it would happen during the 3 year period. Once we announced the pivot to an open-loop, the journey to profitability became slower because it is a less balance sheet intensive business. Irrespective of that unanticipated earnings drag, our level of profitability for the period 2020 – 3Q2022 (the most recent available period for comparative data) would put us in the top decile for both ROA and ROATCE of all U.S. public banks.
The Next Three Years
I have written and spoken at length about what we want to achieve going forward. We have embraced what differentiates us. The bank is our gold standard, Triumph is the golden goose, and TriumphPay is the golden ticket. What I will attempt to do here is distill those observations into five things I expect to be true three years from now:
1.The growth of our balance sheet will be limited and our share count will be lower than it is today. Capital discipline has served us well over the last three years and we will continue that course throughout the next three. We do not intend to pay a dividend; we prefer to return capital to shareholders through share repurchases.
The caveat to our share reduction plan would be an M&A transaction. At this time, the opportunity set for us in that regard would only include an acquisition that materially accelerates TriumphPay’s journey toward becoming THE payments network for trucking. We regularly evaluate opportunities, but we think the most important thing for us at this stage is to focus on what our payment network members want and need versus what any competitor is doing.
2.Revenue growth will primarily come from our transportation businesses. This should not be a surprise to anyone. In current market conditions; however, I expect our community bank loan balances may grow as we are beginning to see attractive risk adjusted lending opportunities. These opportunities will serve to diversify our revenue during any potential slowdown a freight recession may bring. Even if that happens, I still expect most of our revenue growth to come from Triumph and TriumphPay.
3.Enterprise expense growth will be materially slower than in the last three years. We are a very different company today than we were three years ago. Our expense base grew 66.9% from 2019 to 2022 as we materially invested in our payments and factoring segments to position them for future growth. I do not expect the same pace of change over the next three years. Our transformation from a community bank with a commercial finance focus to a financial technology holding company and now to a payments network required significant up-front investments in people, processes and technology. That work is never done, but a large part of the infrastructure and team is in place. As a result, we expect expense growth to be materially slower from here.
4.TriumphPay will be accretive to earnings. We understand this is the question most investors have and it is largely how we will be judged. We set ambitious targets for TriumphPay and still plan to execute on them. There is a natural tension between giving long term forecasts for a business that doesn’t exist yet so that investors can understand and underwrite the value proposition and allowing for the fact that some things are not yet known. In light of that uncertainty and the opportunity, we are going to give shorter term forecasts so investors can better measure our performance in real time. Exiting 2022, our EBITDA margin in our payments segment was -117%. Our forecast is to improve that by approximately 50% in 2023. Therefore, we expect to exit 2023 with an EBITDA margin between -40% and -60%. The progress we achieve this year will be a roadmap for our team and our investors of how we achieve the long term goal of TriumphPay being accretive to earnings.
5.Non-interest revenue as a percentage of total revenue will increase. As of Q4 2022, 10.7% of our revenue was non-interest income. We look favorably at recurring fee revenue compared to spread revenue. This is especially true for a payments network. As TriumphPay grows, we expect an increasing share of our enterprise revenue to be fee driven.
Outlook for 2023 “You cannot predict, but you can prepare.”
I heard this quote years ago and it has always resonated with me. Before I got into banking, Triumph got its start buying distressed debt in the Great Financial Crisis. The volatility of those days allowed us to get into banking and grow into what we have become.
This view is germane to where we are now – very few people predicted how quickly and sharply interest rates would rise or transportation would slow. Where does that leave Triumph Financial? In the same place we were before either of these events happened – focused on our long term goals. Despite the most recent market volatility impacting the stock price, I believe we are in a better place now than ever before. Here are a few thoughts on why:
1.The slowdown in freight came sooner than we expected, but we were prepared for it. As a financial partner to our clients, we have to be wise enough to win when markets are hot and nimble enough to thrive when markets are not. For example, we pulled back in our equipment finance business when transportation assets started to disconnect from historical norms. It didn’t feel good to watch business go to competitors at the time, but we have done this long enough to know that the transportation market is cyclical. The worst loans are made in the best parts of the cycle and vice versa.
Our revenue and profitability will be adversely impacted in 2023 if the freight markets slow further. It is interesting to note that we have seen signs of strengthening in the market over the last several weeks despite the prevailing narrative that all of 2023 was going to be difficult for trucking. We don’t know if this trend will continue; what we do know is that we operate in a cyclical business and it’s our job to be profitable throughout. Net earnings may be muted for a time if transportation reverses course from the last few weeks and continues to weaken, but we will still be profitable in any reasonably foreseeable circumstance and we will not change our direction or divert our focus. We will continue to focus on our strategy and serve our clients and the industry. We will continue to use the underwriting disciplines that have worked for us for many years.
2.Money is worth something again. In our transportation businesses, almost all of our competition is from non-banks. They can benefit from being nimble and unconstrained by regulation. Ever since there has been a regulated banking system, a major advantage to being a bank has been access to insured deposits, but with that advantage comes heightened regulatory oversight (for the record, regulatory oversight brings many positive things with it).
For the last decade, our cost of funds advantage versus non-bank peers has been lower than normal. That is now changing, which is demonstrating the value of our deposit gathering efforts over the last three years. Due to that work and the rate environment, our cost of funds advantage has become much larger. Our total cost of deposits was 28 basis points in Q4. By contrast, non-bank factoring companies are renewing their lines of credit at SOFR + 200-300 bps. That all-in rate is higher than what has been the effective yield passed along to mid-size and large fleet customers for the last few years, and that is even before considering personnel costs, which are significant in factoring and also on the rise.
We want Triumph to thrive and we want the factoring industry to thrive. It is vital to trucking and supporting the entrepreneurs who want to start a new business. If we cared exclusively about short term gains, we could use our funding advantage to undercut the industry, but that would be a Pyrrhic victory. It would hurt the very companies that TriumphPay is designed to serve and it would overwhelm our balance sheet. As a result, we will be disciplined in our approach to growth.
3.Asset quality is easier to maintain when growth is moderate. As we move into a potential recession, I am particularly grateful for our discipline around asset growth over the last few years. As said above, the worst time to grow loans is in the best economic environment. When the tide goes out, marginal loans no longer look as attractive. To be clear, depending on whether or not we go into a recession and how deep it is, we may have to work through some credit issues. I can say, however, that I feel better about the composition of our credit book now than I have at any other time since I have been the CEO of Triumph Financial.
Our balance sheet growth will be limited to lending opportunities that exceed the risk adjusted returns our shareholders expect. There is a possibility that we will see much better lending opportunities in 2023 and we will preserve the flexibility to take advantage of those opportunities as they present themselves. Our efforts to raise low-beta deposits and maintain a core base of variable rate lending has helped to mitigate the effects of lower spreads in fixed-discount factoring.
4.It’s a good time to have abundant capital. Jamie Dimon is well known for preserving the “fortress-like” balance sheet of J.P. Morgan during the Great Financial Crisis. It goes along with the opening quote – you can’t predict the future, but you must prepare for outcomes that are not easily foreseeable. Our consolidated regulatory capital position is approximately $220 million above internal targets. That capital provides a safety net for any unforeseen, incidental losses, but more strategically, it is also available to repurchase our shares at very attractive prices and make strategic investments or acquisitions that strengthen TriumphPay’s position and to improve our digital offerings to all customers.
Share Repurchase Announcement
In 4Q2022 we tendered for $100 million worth of our common shares at a range of $51 - $58 per share. There were 408,615 shares tendered in that offering for an aggregate cost of approximately $23.7 million. Concurrent with this release of earnings, we are announcing our intent to enter into a $70 million accelerated share repurchase transaction.
Thoughts Regarding Insider Transactions
I think it is also a good time to touch on insider transactions as I know investors watch these for evidence of what management and the board believe regarding the financial prospects of the company. As it is said, there are many reasons insiders sell, but generally only one reason they buy.
Some of our original directors, including the chairman and myself and multiple of our outside directors, have been part of Triumph since the beginning. We invested into the private entity that became Triumph and subsequently invested in the IPO and in certain offerings since that time. For me personally, investors may see share sales, in this and future periods, to achieve my personal goal of eliminating any debt for which certain of my shares are pledged, which is equal to roughly 20% of my holdings at current prices. My intent remains to keep the majority of my net worth in Triumph as it has been since the beginning.
Expense Guidance
For the 1st quarter of 2023, we expect our noninterest expense to be $87.5 million. We expect 4th quarter 2023 expenses to be approximately 10-12% higher than 4th quarter 2022, representing the impacts of wage inflation and continued technological investment in systems, security and products.
With warm regards-
Aaron P. Graft Founder, Vice Chairman, and CEO Aaron P. Graft, Vice Chairman and CEO and Brad Voss, CFO, will review the financial results in a conference call for investors and analysts beginning at 7:00 a.m. Central Time on Thursday, January 26, 2023.
Conference Call Information
The live video conference option may be accessed directly through this link, https://triumph-financial-inc-earnings-q4.open-exchange.net/, or via the Company's website at www.tfin.com through the News & Events, Events & Presentations links. Alternatively, a live conference call option is available by dialing 1-800-267-6316 (International: +1-203-518-9783) requesting to be joined to conference I.D. “Triumph” at the operator prompt. An archive of this conference call will subsequently be available at this same location, referenced above, on the Company’s website.
About Triumph
Triumph Financial, Inc. (Nasdaq: TFIN) is a financial holding company focused on payments, factoring and banking. Headquartered in Dallas, Texas, its diversified portfolio of brands includes TriumphPay, Triumph and TBK Bank. www.tfin.com
Forward-Looking Statements
This letter to shareholders contains forward-looking statements. Any statements about our expectations, beliefs, plans, predictions, forecasts, objectives, assumptions or future events or performance are not historical facts and may be forward-looking. You can identify forward-looking statements by the use of forward-looking terminology such as “believes,” “expects,” “could,” “may,” “will,” “should,” “seeks,” “likely,” “intends,” “plans,” “pro forma,” “projects,” “estimates” or “anticipates” or the negative of these words and phrases or similar words or phrases that are predictions of or indicate future events or trends and that do not relate solely to historical matters. You can also identify forward-looking statements by discussions of strategy, plans or intentions. Forward-looking statements involve numerous risks and uncertainties and you should not rely on them as predictions of future events. Forward-looking statements depend on assumptions, data or methods that may be incorrect or imprecise and we may not be able to realize them. We do not guarantee that the transactions and events described will happen as described (or that they will happen at all). The following factors, among others, could cause actual results and future events to differ materially from those set forth or contemplated in the forward-looking statements: business and economic conditions generally and in the bank and non-bank financial services industries, nationally and within our local market areas; the impact of COVID-19 on our business, including the impact of the actions taken by governmental authorities to try and contain the virus or address the impact of the virus on the United States economy (including, without limitation, the CARES Act), and the resulting effect of all of such items on our operations, liquidity and capital position, and on the financial condition of our borrowers and other customers; our ability to mitigate our risk exposures; our ability to maintain our historical earnings trends; changes in management personnel; interest rate risk; concentration of our products and services in the transportation industry; credit risk associated with our loan portfolio; lack of seasoning in our loan portfolio; deteriorating asset quality and higher loan charge-offs; time and effort necessary to resolve nonperforming assets; inaccuracy of the assumptions and estimates we make in establishing reserves for probable loan losses and other estimates; risks related to the integration of acquired businesses, including our acquisition of HubTran Inc. and developments related to our acquisition of Transport Financial Solutions and the related over-formula advances, and any future acquisitions; our ability to successfully identify and address the risks associated with our possible future acquisitions, and the risks that our prior and possible future acquisitions make it more difficult for investors to evaluate our business, financial condition and results of operations, and impairs our ability to accurately forecast our future performance; lack of liquidity; fluctuations in the fair value and liquidity of the securities we hold for sale; impairment of investment securities, goodwill, other intangible assets or deferred tax assets; our risk management strategies; environmental liability associated with our lending activities; increased competition in the bank and non-bank financial services industries, nationally, regionally or locally, which may adversely affect pricing and terms; the accuracy of our financial statements and related disclosures; material weaknesses in our internal control over financial reporting; system failures or failures to prevent breaches of our network security; the institution and outcome of litigation and other legal proceedings against us or to which we become subject; changes in carry-forwards of net operating losses; changes in federal tax law or policy; the impact of recent and future legislative and regulatory changes, including changes in banking, securities and tax laws and regulations, such as the Dodd-Frank Wall Street Reform and Consumer Protection Act (the “Dodd-Frank Act”) and their application by our regulators; governmental monetary and fiscal policies; changes in the scope and cost of FDIC, insurance and other coverages; failure to receive regulatory approval for future acquisitions; and increases in our capital requirements.
While forward-looking statements reflect our good-faith beliefs, they are not guarantees of future performance. All forward-looking statements are necessarily only estimates of future results. Accordingly, actual results may differ materially from those expressed in or contemplated by the particular forward-looking statement, and, therefore, you are cautioned not to place undue reliance on such statements. Further, any forward-looking statement speaks only as of the date on which it is made, and we undertake no obligation to update any forward-looking statement to reflect events or circumstances after the date on which the statement is made or to reflect the occurrence of unanticipated events or circumstances, except as required by applicable law. For a discussion of such risks and uncertainties, which could cause actual results to differ from those contained in the forward-looking statements, see "Risk Factors" and the forward-looking statement disclosure contained in Triumph’s Annual Report on Form 10-K, filed with the Securities and Exchange Commission on February 14, 2022.
Non-GAAP Financial Measures
This letter to shareholders includes certain non‐GAAP financial measures intended to supplement, not substitute for, comparable GAAP measures. Reconciliations of non‐GAAP financial measures to GAAP financial measures are provided at the end of this letter to shareholders.
The following table sets forth key metrics used by Triumph to monitor our operations. Footnotes in this table can be found in our definitions of non-GAAP financial measures at the end of this document.
|
|
|
|
|
|
|
|
|
|
|
|
|
|
|
|
|
|
|
|
|
|
|
|
|
|
|
|
|
|
|
|
|
|
|
|
|
|
|
|
|
|
|
As of and for the Three Months Ended |
|
As of and for the Year Ended |
| (Dollars in thousands) |
December 31,
2022 |
|
September 30,
2022 |
|
June 30,
2022 |
|
March 31,
2022 |
|
December 31,
2021 |
|
December 31,
2022 |
|
December 31,
2021 |
| Financial Highlights: |
|
|
|
|
|
|
|
|
|
|
|
|
|
| Total assets |
$ |
5,333,783 |
|
|
$ |
5,642,450 |
|
|
$ |
5,955,507 |
|
|
$ |
6,076,434 |
|
|
$ |
5,956,250 |
|
|
$ |
5,333,783 |
|
|
$ |
5,956,250 |
|
| Loans held for investment |
$ |
4,120,291 |
|
|
$ |
4,433,304 |
|
|
$ |
4,435,366 |
|
|
$ |
4,724,078 |
|
|
$ |
4,867,572 |
|
|
$ |
4,120,291 |
|
|
$ |
4,867,572 |
|
| Deposits |
$ |
4,171,336 |
|
|
$ |
4,441,354 |
|
|
$ |
4,780,924 |
|
|
$ |
4,331,786 |
|
|
$ |
4,646,679 |
|
|
$ |
4,171,336 |
|
|
$ |
4,646,679 |
|
| Net income available to common stockholders |
$ |
16,759 |
|
|
$ |
15,428 |
|
|
$ |
43,390 |
|
|
$ |
23,528 |
|
|
$ |
25,839 |
|
|
$ |
99,105 |
|
|
$ |
109,768 |
|
|
|
|
|
|
|
|
|
|
|
|
|
|
|
| Performance Ratios - Annualized: |
|
|
|
|
|
|
|
|
|
|
|
|
|
| Return on average assets |
1.27 |
% |
|
1.13 |
% |
|
3.02 |
% |
|
1.69 |
% |
|
1.77 |
% |
|
1.79 |
% |
|
1.87 |
% |
| Return on average total equity |
7.66 |
% |
|
7.16 |
% |
|
20.08 |
% |
|
11.20 |
% |
|
12.41 |
% |
|
11.46 |
% |
|
14.10 |
% |
| Return on average common equity |
7.69 |
% |
|
7.17 |
% |
|
20.78 |
% |
|
11.41 |
% |
|
12.71 |
% |
|
11.69 |
% |
|
14.52 |
% |
Return on average tangible common equity (1) |
11.14 |
% |
|
10.47 |
% |
|
30.63 |
% |
|
17.02 |
% |
|
19.41 |
% |
|
17.16 |
% |
|
21.42 |
% |
Yield on loans(2) |
9.23 |
% |
|
8.95 |
% |
|
8.79 |
% |
|
8.60 |
% |
|
8.68 |
% |
|
8.88 |
% |
|
7.91 |
% |
| Cost of interest bearing deposits |
0.48 |
% |
|
0.41 |
% |
|
0.41 |
% |
|
0.23 |
% |
|
0.27 |
% |
|
0.38 |
% |
|
0.32 |
% |
| Cost of total deposits |
0.28 |
% |
|
0.24 |
% |
|
0.23 |
% |
|
0.14 |
% |
|
0.16 |
% |
|
0.22 |
% |
|
0.20 |
% |
| Cost of total funds |
0.49 |
% |
|
0.42 |
% |
|
0.40 |
% |
|
0.28 |
% |
|
0.29 |
% |
|
0.39 |
% |
|
0.36 |
% |
Net interest margin(2) |
8.22 |
% |
|
7.71 |
% |
|
7.68 |
% |
|
7.68 |
% |
|
7.66 |
% |
|
7.82 |
% |
|
6.72 |
% |
| Net non-interest expense to average assets |
5.38 |
% |
|
5.15 |
% |
|
2.76 |
% |
|
4.68 |
% |
|
4.56 |
% |
|
4.48 |
% |
|
3.87 |
% |
Adjusted net non-interest expense to average assets (1) |
5.38 |
% |
|
5.15 |
% |
|
2.76 |
% |
|
4.68 |
% |
|
4.56 |
% |
|
4.48 |
% |
|
3.82 |
% |
| Efficiency ratio |
76.90 |
% |
|
78.14 |
% |
|
59.23 |
% |
|
70.65 |
% |
|
70.16 |
% |
|
70.30 |
% |
|
67.87 |
% |
Adjusted efficiency ratio (1) |
76.90 |
% |
|
78.14 |
% |
|
59.23 |
% |
|
70.65 |
% |
|
70.16 |
% |
|
70.30 |
% |
|
67.16 |
% |
|
|
|
|
|
|
|
|
|
|
|
|
|
|
Asset Quality:(3) |
|
|
|
|
|
|
|
|
|
|
|
|
|
| Past due to total loans |
2.53 |
% |
|
2.33 |
% |
|
2.47 |
% |
|
2.73 |
% |
|
2.86 |
% |
|
2.53 |
% |
|
2.86 |
% |
| Non-performing loans to total loans |
1.17 |
% |
|
1.26 |
% |
|
0.95 |
% |
|
0.94 |
% |
|
0.95 |
% |
|
1.17 |
% |
|
0.95 |
% |
| Non-performing assets to total assets |
1.02 |
% |
|
1.11 |
% |
|
0.83 |
% |
|
0.87 |
% |
|
0.92 |
% |
|
1.02 |
% |
|
0.92 |
% |
| ACL to non-performing loans |
88.76 |
% |
|
78.88 |
% |
|
103.51 |
% |
|
93.62 |
% |
|
91.20 |
% |
|
88.76 |
% |
|
91.20 |
% |
| ACL to total loans |
1.04 |
% |
|
0.99 |
% |
|
0.98 |
% |
|
0.88 |
% |
|
0.87 |
% |
|
1.04 |
% |
|
0.87 |
% |
| Net charge-offs to average loans |
0.05 |
% |
|
0.06 |
% |
|
— |
% |
|
0.03 |
% |
|
— |
% |
|
0.14 |
% |
|
0.95 |
% |
|
|
|
|
|
|
|
|
|
|
|
|
|
|
| Capital: |
|
|
|
|
|
|
|
|
|
|
|
|
|
Tier 1 capital to average assets(4) |
13.00 |
% |
|
12.57 |
% |
|
11.76 |
% |
|
11.82 |
% |
|
11.11 |
% |
|
13.00 |
% |
|
11.11 |
% |
Tier 1 capital to risk-weighted assets(4) |
14.58 |
% |
|
13.64 |
% |
|
13.04 |
% |
|
11.96 |
% |
|
11.51 |
% |
|
14.58 |
% |
|
11.51 |
% |
Common equity tier 1 capital to risk-weighted assets(4) |
12.74 |
% |
|
11.93 |
% |
|
11.35 |
% |
|
10.40 |
% |
|
9.94 |
% |
|
12.74 |
% |
|
9.94 |
% |
| Total capital to risk-weighted assets |
17.68 |
% |
|
16.56 |
% |
|
15.91 |
% |
|
14.53 |
% |
|
14.10 |
% |
|
17.68 |
% |
|
14.10 |
% |
| Total equity to total assets |
16.67 |
% |
|
15.79 |
% |
|
14.68 |
% |
|
14.59 |
% |
|
14.42 |
% |
|
16.67 |
% |
|
14.42 |
% |
Tangible common stockholders' equity to tangible assets(1) |
11.41 |
% |
|
10.75 |
% |
|
9.83 |
% |
|
9.86 |
% |
|
9.46 |
% |
|
11.41 |
% |
|
9.46 |
% |
|
|
|
|
|
|
|
|
|
|
|
|
|
|
| Per Share Amounts: |
|
|
|
|
|
|
|
|
|
|
|
|
|
| Book value per share |
$ |
35.09 |
|
|
$ |
34.57 |
|
|
$ |
33.91 |
|
|
$ |
33.45 |
|
|
$ |
32.35 |
|
|
$ |
35.09 |
|
|
$ |
32.35 |
|
Tangible book value per share (1) |
$ |
24.04 |
|
|
$ |
23.60 |
|
|
$ |
22.84 |
|
|
$ |
22.75 |
|
|
$ |
21.34 |
|
|
$ |
24.04 |
|
|
$ |
21.34 |
|
| Basic earnings per common share |
$ |
0.69 |
|
|
$ |
0.64 |
|
|
$ |
1.78 |
|
|
$ |
0.95 |
|
|
$ |
1.04 |
|
|
$ |
4.06 |
|
|
$ |
4.44 |
|
| Diluted earnings per common share |
$ |
0.67 |
|
|
$ |
0.62 |
|
|
$ |
1.74 |
|
|
$ |
0.93 |
|
|
$ |
1.02 |
|
|
$ |
3.96 |
|
|
$ |
4.35 |
|
Adjusted diluted earnings per common share(1) |
$ |
0.67 |
|
|
$ |
0.62 |
|
|
$ |
1.74 |
|
|
$ |
0.93 |
|
|
$ |
1.02 |
|
|
$ |
3.96 |
|
|
$ |
4.44 |
|
| Shares outstanding end of period |
24,053,585 |
|
|
24,478,288 |
|
|
24,457,777 |
|
|
25,161,690 |
|
|
25,158,879 |
|
|
24,053,585 |
|
|
25,158,879 |
|
Unaudited consolidated balance sheet as of:
|
|
|
|
|
|
|
|
|
|
|
|
|
|
|
|
|
|
|
|
|
|
|
|
|
|
|
|
|
|
| (Dollars in thousands) |
December 31,
2022 |
|
September 30,
2022 |
|
June 30,
2022 |
|
March 31,
2022 |
|
December 31,
2021 |
| ASSETS |
|
|
|
|
|
|
|
|
|
| Total cash and cash equivalents |
$ |
408,182 |
|
|
$ |
421,729 |
|
|
$ |
724,237 |
|
|
$ |
413,704 |
|
|
$ |
383,178 |
|
| Securities - available for sale |
254,504 |
|
|
238,434 |
|
|
215,909 |
|
|
191,440 |
|
|
182,426 |
|
| Securities - held to maturity, net |
4,077 |
|
|
4,149 |
|
|
4,335 |
|
|
4,404 |
|
|
4,947 |
|
| Equity securities |
5,191 |
|
|
4,916 |
|
|
5,050 |
|
|
5,085 |
|
|
5,504 |
|
| Loans held for sale |
5,641 |
|
|
78 |
|
|
6 |
|
|
607 |
|
|
7,330 |
|
| Loans held for investment |
4,120,291 |
|
|
4,433,304 |
|
|
4,435,366 |
|
|
4,724,078 |
|
|
4,867,572 |
|
| Allowance for credit losses |
(42,807) |
|
|
(44,111) |
|
|
(43,407) |
|
|
(41,553) |
|
|
(42,213) |
|
| Loans, net |
4,077,484 |
|
|
4,389,193 |
|
|
4,391,959 |
|
|
4,682,525 |
|
|
4,825,359 |
|
| Assets held for sale |
— |
|
|
— |
|
|
24,405 |
|
|
260,085 |
|
|
— |
|
| FHLB and other restricted stock |
6,252 |
|
|
6,213 |
|
|
6,169 |
|
|
12,196 |
|
|
10,146 |
|
| Premises and equipment, net |
103,339 |
|
|
104,272 |
|
|
105,293 |
|
|
91,725 |
|
|
105,729 |
|
| Other real estate owned ("OREO"), net |
— |
|
|
— |
|
|
168 |
|
|
383 |
|
|
524 |
|
| Goodwill and intangible assets, net |
265,767 |
|
|
268,604 |
|
|
270,666 |
|
|
269,119 |
|
|
276,856 |
|
| Bank-owned life insurance |
41,493 |
|
|
41,390 |
|
|
41,278 |
|
|
41,141 |
|
|
40,993 |
|
| Deferred tax asset, net |
16,473 |
|
|
14,663 |
|
|
13,117 |
|
|
10,174 |
|
|
10,023 |
|
| Indemnification asset |
3,896 |
|
|
4,173 |
|
|
4,377 |
|
|
4,582 |
|
|
4,786 |
|
| Other assets |
141,484 |
|
|
144,636 |
|
|
148,538 |
|
|
89,264 |
|
|
98,449 |
|
| Total assets |
$ |
5,333,783 |
|
|
$ |
5,642,450 |
|
|
$ |
5,955,507 |
|
|
$ |
6,076,434 |
|
|
$ |
5,956,250 |
|
| LIABILITIES |
|
|
|
|
|
|
|
|
|
| Non-interest bearing deposits |
$ |
1,756,680 |
|
|
$ |
1,897,309 |
|
|
$ |
2,085,249 |
|
|
$ |
1,859,376 |
|
|
$ |
1,925,370 |
|
| Interest bearing deposits |
2,414,656 |
|
|
2,544,045 |
|
|
2,695,675 |
|
|
2,472,410 |
|
|
2,721,309 |
|
| Total deposits |
4,171,336 |
|
|
4,441,354 |
|
|
4,780,924 |
|
|
4,331,786 |
|
|
4,646,679 |
|
| Deposits held for sale |
— |
|
|
— |
|
|
1,410 |
|
|
377,698 |
|
|
— |
|
| Customer repurchase agreements |
340 |
|
|
13,463 |
|
|
11,746 |
|
|
2,868 |
|
|
2,103 |
|
| Federal Home Loan Bank advances |
30,000 |
|
|
30,000 |
|
|
30,000 |
|
|
230,000 |
|
|
180,000 |
|
| Payment Protection Program Liquidity Facility |
— |
|
|
— |
|
|
— |
|
|
— |
|
|
27,144 |
|
| Subordinated notes |
107,800 |
|
|
107,587 |
|
|
107,377 |
|
|
107,169 |
|
|
106,957 |
|
| Junior subordinated debentures |
41,158 |
|
|
41,016 |
|
|
40,876 |
|
|
40,737 |
|
|
40,602 |
|
| Other liabilities |
94,178 |
|
|
117,857 |
|
|
108,893 |
|
|
99,511 |
|
|
93,901 |
|
| Total liabilities |
4,444,812 |
|
|
4,751,277 |
|
|
5,081,226 |
|
|
5,189,769 |
|
|
5,097,386 |
|
| EQUITY |
|
|
|
|
|
|
|
|
|
| Preferred Stock |
45,000 |
|
|
45,000 |
|
|
45,000 |
|
|
45,000 |
|
|
45,000 |
|
| Common stock |
283 |
|
|
283 |
|
|
283 |
|
|
283 |
|
|
283 |
|
| Additional paid-in-capital |
534,790 |
|
|
529,804 |
|
|
524,636 |
|
|
516,551 |
|
|
510,939 |
|
| Treasury stock, at cost |
(182,658) |
|
|
(156,949) |
|
|
(156,924) |
|
|
(106,105) |
|
|
(104,743) |
|
| Retained earnings |
498,456 |
|
|
481,697 |
|
|
466,269 |
|
|
422,879 |
|
|
399,351 |
|
| Accumulated other comprehensive income (loss) |
(6,900) |
|
|
(8,662) |
|
|
(4,983) |
|
|
8,057 |
|
|
8,034 |
|
| Total stockholders' equity |
888,971 |
|
|
891,173 |
|
|
874,281 |
|
|
886,665 |
|
|
858,864 |
|
| Total liabilities and equity |
$ |
5,333,783 |
|
|
$ |
5,642,450 |
|
|
$ |
5,955,507 |
|
|
$ |
6,076,434 |
|
|
$ |
5,956,250 |
|
Unaudited consolidated statement of income:
|
|
|
|
|
|
|
|
|
|
|
|
|
|
|
|
|
|
|
|
|
|
|
|
|
|
|
|
|
|
|
|
|
|
|
|
|
|
|
|
|
|
|
For the Three Months Ended |
|
For the Year Ended |
| (Dollars in thousands) |
December 31,
2022 |
|
September 30,
2022 |
|
June 30,
2022 |
|
March 31,
2022 |
|
December 31,
2021 |
|
December 31,
2022 |
|
December 31,
2021 |
| Interest income: |
|
|
|
|
|
|
|
|
|
|
|
|
|
| Loans, including fees |
$ |
51,282 |
|
|
$ |
44,928 |
|
|
$ |
44,131 |
|
|
$ |
40,847 |
|
|
$ |
43,979 |
|
|
$ |
181,188 |
|
|
$ |
183,555 |
|
| Factored receivables, including fees |
48,644 |
|
|
53,317 |
|
|
60,026 |
|
|
61,206 |
|
|
62,196 |
|
|
223,193 |
|
|
197,835 |
|
| Securities |
3,372 |
|
|
2,308 |
|
|
1,329 |
|
|
1,178 |
|
|
1,438 |
|
|
8,187 |
|
|
5,401 |
|
| FHLB and other restricted stock |
83 |
|
|
65 |
|
|
34 |
|
|
76 |
|
|
25 |
|
|
258 |
|
|
156 |
|
| Cash deposits |
2,891 |
|
|
2,607 |
|
|
787 |
|
|
128 |
|
|
141 |
|
|
6,413 |
|
|
608 |
|
| Total interest income |
106,272 |
|
|
103,225 |
|
|
106,307 |
|
|
103,435 |
|
|
107,779 |
|
|
419,239 |
|
|
387,555 |
|
| Interest expense: |
|
|
|
|
|
|
|
|
|
|
|
|
|
| Deposits |
3,028 |
|
|
2,743 |
|
|
2,706 |
|
|
1,561 |
|
|
1,907 |
|
|
10,038 |
|
|
9,697 |
|
| Subordinated notes |
1,307 |
|
|
1,304 |
|
|
1,302 |
|
|
1,299 |
|
|
1,297 |
|
|
5,212 |
|
|
6,445 |
|
| Junior subordinated debentures |
926 |
|
|
726 |
|
|
556 |
|
|
454 |
|
|
444 |
|
|
2,662 |
|
|
1,775 |
|
| Other borrowings |
296 |
|
|
182 |
|
|
315 |
|
|
42 |
|
|
74 |
|
|
835 |
|
|
508 |
|
| Total interest expense |
5,557 |
|
|
4,955 |
|
|
4,879 |
|
|
3,356 |
|
|
3,722 |
|
|
18,747 |
|
|
18,425 |
|
| Net interest income |
100,715 |
|
|
98,270 |
|
|
101,428 |
|
|
100,079 |
|
|
104,057 |
|
|
400,492 |
|
|
369,130 |
|
| Credit loss expense (benefit) |
877 |
|
|
2,646 |
|
|
2,901 |
|
|
501 |
|
|
2,008 |
|
|
6,925 |
|
|
(8,830) |
|
| Net interest income after credit loss expense (benefit) |
99,838 |
|
|
95,624 |
|
|
98,527 |
|
|
99,578 |
|
|
102,049 |
|
|
393,567 |
|
|
377,960 |
|
| Non-interest income: |
|
|
|
|
|
|
|
|
|
|
|
|
|
| Service charges on deposits |
1,659 |
|
|
1,558 |
|
|
1,664 |
|
|
1,963 |
|
|
2,050 |
|
|
6,844 |
|
|
7,724 |
|
| Card income |
2,025 |
|
|
2,034 |
|
|
2,080 |
|
|
2,011 |
|
|
2,470 |
|
|
8,150 |
|
|
8,811 |
|
| Net OREO gains (losses) and valuation adjustments |
— |
|
|
(19) |
|
|
18 |
|
|
(132) |
|
|
29 |
|
|
(133) |
|
|
(347) |
|
| Net gains (losses) on sale of securities |
(2) |
|
|
— |
|
|
2,514 |
|
|
— |
|
|
— |
|
|
2,512 |
|
|
5 |
|
| Net gains (losses) on sale of loans |
(82) |
|
|
1,107 |
|
|
17,269 |
|
|
(66) |
|
|
140 |
|
|
18,228 |
|
|
3,105 |
|
| Fee income |
6,126 |
|
|
6,120 |
|
|
6,273 |
|
|
5,703 |
|
|
5,711 |
|
|
24,222 |
|
|
17,628 |
|
| Insurance commissions |
936 |
|
|
1,191 |
|
|
1,346 |
|
|
1,672 |
|
|
1,138 |
|
|
5,145 |
|
|
5,127 |
|
|
|
|
|
|
|
|
|
|
|
|
|
|
|
| Other |
1,457 |
|
|
677 |
|
|
16,996 |
|
|
(30) |
|
|
2,721 |
|
|
19,100 |
|
|
12,448 |
|
| Total non-interest income |
12,119 |
|
|
12,668 |
|
|
48,160 |
|
|
11,121 |
|
|
14,259 |
|
|
84,068 |
|
|
54,501 |
|
| Non-interest expense: |
|
|
|
|
|
|
|
|
|
|
|
|
|
| Salaries and employee benefits |
51,639 |
|
|
49,307 |
|
|
54,257 |
|
|
46,284 |
|
|
52,544 |
|
|
201,487 |
|
|
173,951 |
|
| Occupancy, furniture and equipment |
7,005 |
|
|
6,826 |
|
|
6,507 |
|
|
6,436 |
|
|
6,194 |
|
|
26,774 |
|
|
24,473 |
|
| FDIC insurance and other regulatory assessments |
364 |
|
|
386 |
|
|
382 |
|
|
411 |
|
|
288 |
|
|
1,543 |
|
|
2,118 |
|
| Professional fees |
4,115 |
|
|
4,263 |
|
|
3,607 |
|
|
3,659 |
|
|
2,633 |
|
|
15,644 |
|
|
12,592 |
|
| Amortization of intangible assets |
2,837 |
|
|
2,913 |
|
|
3,064 |
|
|
3,108 |
|
|
3,199 |
|
|
11,922 |
|
|
10,876 |
|
| Advertising and promotion |
2,679 |
|
|
1,929 |
|
|
1,785 |
|
|
1,202 |
|
|
1,640 |
|
|
7,595 |
|
|
5,174 |
|
| Communications and technology |
9,398 |
|
|
11,935 |
|
|
9,820 |
|
|
9,112 |
|
|
7,844 |
|
|
40,265 |
|
|
26,862 |
|
| Other |
8,734 |
|
|
9,130 |
|
|
9,185 |
|
|
8,352 |
|
|
8,662 |
|
|
35,401 |
|
|
31,461 |
|
| Total non-interest expense |
86,771 |
|
|
86,689 |
|
|
88,607 |
|
|
78,564 |
|
|
83,004 |
|
|
340,631 |
|
|
287,507 |
|
| Net income before income tax |
25,186 |
|
|
21,603 |
|
|
58,080 |
|
|
32,135 |
|
|
33,304 |
|
|
137,004 |
|
|
144,954 |
|
| Income tax expense |
7,625 |
|
|
5,374 |
|
|
13,888 |
|
|
7,806 |
|
|
6,664 |
|
|
34,693 |
|
|
31,980 |
|
| Net income |
$ |
17,561 |
|
|
$ |
16,229 |
|
|
$ |
44,192 |
|
|
$ |
24,329 |
|
|
$ |
26,640 |
|
|
$ |
102,311 |
|
|
$ |
112,974 |
|
| Dividends on preferred stock |
(802) |
|
|
(801) |
|
|
(802) |
|
|
(801) |
|
|
(801) |
|
|
(3,206) |
|
|
(3,206) |
|
| Net income available to common stockholders |
$ |
16,759 |
|
|
$ |
15,428 |
|
|
$ |
43,390 |
|
|
$ |
23,528 |
|
|
$ |
25,839 |
|
|
$ |
99,105 |
|
|
$ |
109,768 |
|
Earnings per share:
|
|
|
|
|
|
|
|
|
|
|
|
|
|
|
|
|
|
|
|
|
|
|
|
|
|
|
|
|
|
|
|
|
|
|
|
|
|
|
|
|
|
|
For the Three Months Ended |
|
Year Ended |
| (Dollars in thousands) |
December 31,
2022 |
|
September 30,
2022 |
|
June 30,
2022 |
|
March 31,
2022 |
|
December 31,
2021 |
|
December 31,
2022 |
|
December 31,
2021 |
| Basic |
|
|
|
|
|
|
|
|
|
|
|
|
|
| Net income to common stockholders |
$ |
16,759 |
|
|
$ |
15,428 |
|
|
$ |
43,390 |
|
|
$ |
23,528 |
|
|
$ |
25,839 |
|
|
$ |
99,105 |
|
|
$ |
109,768 |
|
| Weighted average common shares outstanding |
24,129,560 |
|
|
24,227,020 |
|
|
24,427,270 |
|
|
24,800,771 |
|
|
24,786,720 |
|
|
24,393,954 |
|
|
24,736,713 |
|
| Basic earnings per common share |
$ |
0.69 |
|
|
$ |
0.64 |
|
|
$ |
1.78 |
|
|
$ |
0.95 |
|
|
$ |
1.04 |
|
|
$ |
4.06 |
|
|
$ |
4.44 |
|
|
|
|
|
|
|
|
|
|
|
|
|
|
|
| Diluted |
|
|
|
|
|
|
|
|
|
|
|
|
|
| Net income to common stockholders - diluted |
$ |
16,759 |
|
|
$ |
15,428 |
|
|
$ |
43,390 |
|
|
$ |
23,528 |
|
|
$ |
25,839 |
|
|
$ |
99,105 |
|
|
$ |
109,768 |
|
| Weighted average common shares outstanding |
24,129,560 |
|
|
24,227,020 |
|
|
24,427,270 |
|
|
24,800,771 |
|
|
24,786,720 |
|
|
24,393,954 |
|
|
24,736,713 |
|
| Dilutive effects of: |
|
|
|
|
|
|
|
|
|
|
|
|
|
| Assumed exercises of stock options |
72,183 |
|
|
85,239 |
|
|
89,443 |
|
|
107,359 |
|
|
124,462 |
|
|
90,841 |
|
|
130,198 |
|
| Restricted stock awards |
120,328 |
|
|
122,723 |
|
|
144,526 |
|
|
237,305 |
|
|
236,251 |
|
|
148,630 |
|
|
170,276 |
|
| Restricted stock units |
95,465 |
|
|
97,512 |
|
|
85,934 |
|
|
86,099 |
|
|
87,605 |
|
|
98,139 |
|
|
76,049 |
|
| Performance stock units - market based |
115,744 |
|
|
117,358 |
|
|
115,825 |
|
|
139,563 |
|
|
150,969 |
|
|
122,123 |
|
|
136,199 |
|
| Performance stock units - performance based |
341,732 |
|
|
327,016 |
|
|
— |
|
|
— |
|
|
— |
|
|
167,187 |
|
|
— |
|
| Employee stock purchase plan |
4,042 |
|
|
2,389 |
|
|
3,575 |
|
|
771 |
|
|
4,726 |
|
|
2,694 |
|
|
2,617 |
|
| Weighted average shares outstanding - diluted |
24,879,054 |
|
|
24,979,257 |
|
|
24,866,573 |
|
|
25,371,868 |
|
|
25,390,733 |
|
|
25,023,568 |
|
|
25,252,052 |
|
| Diluted earnings per common share |
$ |
0.67 |
|
|
$ |
0.62 |
|
|
$ |
1.74 |
|
|
$ |
0.93 |
|
|
$ |
1.02 |
|
|
$ |
3.96 |
|
|
$ |
4.35 |
|
Shares that were not considered in computing diluted earnings per common share because they were antidilutive or have not met the thresholds to be considered in the dilutive calculation are as follows:
|
|
|
|
|
|
|
|
|
|
|
|
|
|
|
|
|
|
|
|
|
|
|
|
|
|
|
|
|
|
|
|
|
|
|
|
|
|
|
|
|
|
|
For the Three Months Ended |
|
Year Ended |
|
December 31,
2022 |
|
September 30,
2022 |
|
June 30,
2022 |
|
March 31,
2022 |
|
December 31,
2021 |
|
December 31,
2022 |
|
December 31,
2021 |
| Stock options |
49,379 |
|
|
52,878 |
|
|
52,878 |
|
|
12,911 |
|
|
— |
|
|
49,379 |
|
|
16,939 |
|
| Restricted stock awards |
6,348 |
|
|
6,348 |
|
|
6,348 |
|
|
8,463 |
|
|
8,463 |
|
|
6,348 |
|
|
8,463 |
|
| Restricted stock units |
11,250 |
|
|
15,000 |
|
|
15,000 |
|
|
15,000 |
|
|
15,000 |
|
|
11,250 |
|
|
15,000 |
|
| Performance stock units - market based |
45,296 |
|
|
45,296 |
|
|
45,296 |
|
|
— |
|
|
— |
|
|
45,296 |
|
|
— |
|
| Performance stock units - performance based |
— |
|
|
— |
|
|
254,832 |
|
|
258,635 |
|
|
259,383 |
|
|
— |
|
|
259,383 |
|
| Employee stock purchase plan |
— |
|
|
— |
|
|
— |
|
|
— |
|
|
— |
|
|
— |
|
|
— |
|
Loans held for investment summarized as of:
|
|
|
|
|
|
|
|
|
|
|
|
|
|
|
|
|
|
|
|
|
|
|
|
|
|
|
|
|
|
| (Dollars in thousands) |
December 31,
2022 |
|
September 30,
2022 |
|
June 30,
2022 |
|
March 31,
2022 |
|
December 31,
2021 |
| Commercial real estate |
$ |
678,144 |
|
|
$ |
669,742 |
|
|
$ |
649,280 |
|
|
$ |
625,763 |
|
|
$ |
632,775 |
|
| Construction, land development, land |
90,976 |
|
|
75,527 |
|
|
103,377 |
|
|
119,560 |
|
|
123,464 |
|
| 1-4 family residential properties |
125,981 |
|
|
122,594 |
|
|
126,362 |
|
|
117,534 |
|
|
123,115 |
|
| Farmland |
68,934 |
|
|
66,595 |
|
|
70,272 |
|
|
17,910 |
|
|
77,394 |
|
| Commercial |
1,251,110 |
|
|
1,282,199 |
|
|
1,225,479 |
|
|
1,375,044 |
|
|
1,430,429 |
|
| Factored receivables |
1,237,449 |
|
|
1,449,080 |
|
|
1,596,282 |
|
|
1,764,590 |
|
|
1,699,537 |
|
| Consumer |
8,868 |
|
|
9,506 |
|
|
9,709 |
|
|
9,276 |
|
|
10,885 |
|
| Mortgage warehouse |
658,829 |
|
|
758,061 |
|
|
654,605 |
|
|
694,401 |
|
|
769,973 |
|
| Total loans |
$ |
4,120,291 |
|
|
$ |
4,433,304 |
|
|
$ |
4,435,366 |
|
|
$ |
4,724,078 |
|
|
$ |
4,867,572 |
|
Our banking loan portfolio consists of traditional community bank loans as well as commercial finance product lines focused on businesses that require specialized financial solutions and national lending product lines that further diversify our lending operations.
Banking loans held for investment are further summarized below:
|
|
|
|
|
|
|
|
|
|
|
|
|
|
|
|
|
|
|
|
|
|
|
|
|
|
|
|
|
|
| (Dollars in thousands) |
December 31,
2022 |
|
September 30,
2022 |
|
June 30,
2022 |
|
March 31,
2022 |
|
December 31,
2021 |
| Commercial real estate |
$ |
678,144 |
|
|
$ |
669,742 |
|
|
$ |
649,280 |
|
|
$ |
625,763 |
|
|
$ |
632,775 |
|
| Construction, land development, land |
90,976 |
|
|
75,527 |
|
|
103,377 |
|
|
119,560 |
|
|
123,464 |
|
| 1-4 family residential |
125,981 |
|
|
122,594 |
|
|
126,362 |
|
|
117,534 |
|
|
123,115 |
|
| Farmland |
68,934 |
|
|
66,595 |
|
|
70,272 |
|
|
17,910 |
|
|
77,394 |
|
| Commercial - General |
316,364 |
|
|
319,016 |
|
|
319,660 |
|
|
286,936 |
|
|
295,662 |
|
| Commercial - Paycheck Protection Program |
55 |
|
|
60 |
|
|
4,538 |
|
|
12,090 |
|
|
27,197 |
|
| Commercial - Agriculture |
48,494 |
|
|
60,409 |
|
|
60,150 |
|
|
15,887 |
|
|
70,127 |
|
| Commercial - Equipment |
454,117 |
|
|
439,604 |
|
|
431,366 |
|
|
612,277 |
|
|
621,437 |
|
| Commercial - Asset-based lending |
229,754 |
|
|
238,119 |
|
|
239,505 |
|
|
284,808 |
|
|
281,659 |
|
| Commercial - Liquid Credit |
202,326 |
|
|
224,991 |
|
|
170,260 |
|
|
163,046 |
|
|
134,347 |
|
| Consumer |
8,868 |
|
|
9,506 |
|
|
9,709 |
|
|
9,276 |
|
|
10,885 |
|
| Mortgage Warehouse |
658,829 |
|
|
758,061 |
|
|
654,605 |
|
|
694,401 |
|
|
769,973 |
|
| Total banking loans held for investment |
$ |
2,882,842 |
|
|
$ |
2,984,224 |
|
|
$ |
2,839,084 |
|
|
$ |
2,959,488 |
|
|
$ |
3,168,035 |
|
Banking loans held for investment and held for sale, including loans within an asset group held for sale, are summarized below:
|
|
|
|
|
|
|
|
|
|
|
|
|
|
|
|
|
|
|
|
|
|
|
|
|
|
|
|
|
|
| (Dollars in thousands) |
December 31,
2022 |
|
September 30,
2022 |
|
June 30,
2022 |
|
March 31,
2022 |
|
December 31,
2021 |
| Commercial real estate |
$ |
678,144 |
|
|
$ |
669,742 |
|
|
$ |
649,280 |
|
|
$ |
657,515 |
|
|
$ |
632,775 |
|
| Construction, land development, land |
90,976 |
|
|
75,527 |
|
|
103,377 |
|
|
120,672 |
|
|
123,464 |
|
| 1-4 family residential |
125,981 |
|
|
122,662 |
|
|
126,362 |
|
|
131,039 |
|
|
123,827 |
|
| Farmland |
68,934 |
|
|
66,595 |
|
|
70,272 |
|
|
74,230 |
|
|
77,394 |
|
| Commercial - General |
316,364 |
|
|
319,016 |
|
|
319,660 |
|
|
296,528 |
|
|
295,662 |
|
| Commercial - Paycheck Protection Program |
55 |
|
|
60 |
|
|
4,538 |
|
|
12,090 |
|
|
27,197 |
|
| Commercial - Agriculture |
48,494 |
|
|
60,409 |
|
|
60,150 |
|
|
62,540 |
|
|
70,127 |
|
| Commercial - Equipment |
454,117 |
|
|
439,604 |
|
|
431,366 |
|
|
612,277 |
|
|
621,437 |
|
| Commercial - Asset-based lending |
229,754 |
|
|
238,119 |
|
|
239,505 |
|
|
284,808 |
|
|
281,659 |
|
| Commercial - Liquid Credit |
207,967 |
|
|
225,001 |
|
|
170,266 |
|
|
163,056 |
|
|
140,965 |
|
| Consumer |
8,868 |
|
|
9,506 |
|
|
9,709 |
|
|
10,108 |
|
|
10,885 |
|
| Mortgage Warehouse |
658,829 |
|
|
758,061 |
|
|
654,605 |
|
|
694,401 |
|
|
769,973 |
|
| Total banking loans held for investment |
$ |
2,888,483 |
|
|
$ |
2,984,302 |
|
|
$ |
2,839,090 |
|
|
$ |
3,119,264 |
|
|
$ |
3,175,365 |
|
The following table presents the Company’s operating segments:
|
|
|
|
|
|
|
|
|
|
|
|
|
|
|
|
|
|
|
|
|
|
|
|
|
|
|
|
|
|
|
|
|
| (Dollars in thousands) |
|
|
|
|
|
|
|
|
|
|
| Three months ended December 31, 2022 |
|
Banking |
|
Factoring |
|
Payments |
|
Corporate |
|
Consolidated |
| Total interest income |
|
$ |
57,585 |
|
|
$ |
45,325 |
|
|
$ |
3,319 |
|
|
$ |
43 |
|
|
$ |
106,272 |
|
| Intersegment interest allocations |
|
2,916 |
|
|
(3,132) |
|
|
216 |
|
|
— |
|
|
— |
|
| Total interest expense |
|
3,326 |
|
|
— |
|
|
— |
|
|
2,231 |
|
|
5,557 |
|
| Net interest income (expense) |
|
57,175 |
|
|
42,193 |
|
|
3,535 |
|
|
(2,188) |
|
|
100,715 |
|
| Credit loss expense (benefit) |
|
115 |
|
|
934 |
|
|
(187) |
|
|
15 |
|
|
877 |
|
| Net interest income after credit loss expense |
|
57,060 |
|
|
41,259 |
|
|
3,722 |
|
|
(2,203) |
|
|
99,838 |
|
| Noninterest income |
|
6,600 |
|
|
1,939 |
|
|
3,551 |
|
|
29 |
|
|
12,119 |
|
| Noninterest expense |
|
48,029 |
|
|
20,789 |
|
|
17,169 |
|
|
784 |
|
|
86,771 |
|
| Operating income (loss) |
|
$ |
15,631 |
|
|
$ |
22,409 |
|
|
$ |
(9,896) |
|
|
$ |
(2,958) |
|
|
$ |
25,186 |
|
|
|
|
|
|
|
|
|
|
|
|
|
|
|
|
|
|
|
|
|
|
|
|
|
|
|
|
|
|
|
|
|
|
| (Dollars in thousands) |
|
|
|
|
|
|
|
|
|
|
| Three months ended September 30, 2022 |
|
Banking |
|
Factoring |
|
Payments |
|
Corporate |
|
Consolidated |
| Total interest income |
|
$ |
49,864 |
|
|
$ |
49,561 |
|
|
$ |
3,756 |
|
|
$ |
44 |
|
|
$ |
103,225 |
|
| Intersegment interest allocations |
|
2,606 |
|
|
(2,458) |
|
|
(148) |
|
|
— |
|
|
— |
|
| Total interest expense |
|
2,924 |
|
|
— |
|
|
— |
|
|
2,031 |
|
|
4,955 |
|
| Net interest income (expense) |
|
49,546 |
|
|
47,103 |
|
|
3,608 |
|
|
(1,987) |
|
|
98,270 |
|
| Credit loss expense (benefit) |
|
2,388 |
|
|
(52) |
|
|
235 |
|
|
75 |
|
|
2,646 |
|
| Net interest income after credit loss expense |
|
47,158 |
|
|
47,155 |
|
|
3,373 |
|
|
(2,062) |
|
|
95,624 |
|
| Noninterest income |
|
6,189 |
|
|
2,941 |
|
|
3,518 |
|
|
20 |
|
|
12,668 |
|
| Noninterest expense |
|
48,648 |
|
|
22,896 |
|
|
14,066 |
|
|
1,079 |
|
|
86,689 |
|
| Operating income (loss) |
|
$ |
4,699 |
|
|
$ |
27,200 |
|
|
$ |
(7,175) |
|
|
$ |
(3,121) |
|
|
$ |
21,603 |
|
Information pertaining to our factoring segment, which includes only factoring originated by our Triumph Business Capital subsidiary, summarized as of and for the quarters ended:
|
|
|
|
|
|
|
|
|
|
|
|
|
|
|
|
|
|
|
|
|
|
|
|
|
|
|
|
|
|
|
|
|
| Factoring |
|
December 31,
2022 |
|
September 30,
2022 |
|
June 30,
2022 |
|
March 31,
2022 |
|
December 31,
2021 |
| Factored receivable period end balance |
|
$ |
1,151,727,000 |
|
|
$ |
1,330,122,000 |
|
|
$ |
1,474,852,000 |
|
|
$ |
1,666,530,000 |
|
|
$ |
1,546,361,000 |
|
| Yield on average receivable balance |
|
13.85 |
% |
|
14.11 |
% |
|
14.21 |
% |
|
14.16 |
% |
|
14.42 |
% |
| Current quarter charge-off rate |
|
0.14 |
% |
|
0.16 |
% |
|
— |
% |
|
0.04 |
% |
|
0.01 |
% |
| Factored receivables - transportation concentration |
|
96 |
% |
|
96 |
% |
|
94 |
% |
|
90 |
% |
|
90 |
% |
|
|
|
|
|
|
|
|
|
|
|
| Interest income, including fees |
|
$ |
45,325,000 |
|
|
$ |
49,561,000 |
|
|
$ |
55,854,000 |
|
|
$ |
56,374,000 |
|
|
$ |
58,042,000 |
|
Non-interest income(1) |
|
1,939,000 |
|
|
2,941,000 |
|
|
15,521,000 |
|
|
1,871,000 |
|
|
2,295,000 |
|
| Factored receivable total revenue |
|
47,264,000 |
|
|
52,502,000 |
|
|
71,375,000 |
|
|
58,245,000 |
|
|
60,337,000 |
|
| Average net funds employed |
|
1,148,595,000 |
|
|
1,242,133,000 |
|
|
1,409,312,000 |
|
|
1,451,984,000 |
|
|
1,442,551,000 |
|
| Yield on average net funds employed |
|
16.33 |
% |
|
16.77 |
% |
|
20.31 |
% |
|
16.27 |
% |
|
16.59 |
% |
|
|
|
|
|
|
|
|
|
|
|
| Accounts receivable purchased |
|
$ |
3,277,986,000 |
|
|
$ |
3,599,771,000 |
|
|
$ |
4,023,569,000 |
|
|
$ |
4,041,883,000 |
|
|
$ |
4,032,585,000 |
|
| Number of invoices purchased |
|
1,596,843 |
|
|
1,681,489 |
|
|
1,725,721 |
|
|
1,604,012 |
|
|
1,669,387 |
|
| Average invoice size |
|
$ |
2,053 |
|
|
$ |
2,141 |
|
|
$ |
2,332 |
|
|
$ |
2,520 |
|
|
$ |
2,416 |
|
| Average invoice size - transportation |
|
$ |
2,002 |
|
|
$ |
2,073 |
|
|
$ |
2,176 |
|
|
$ |
2,401 |
|
|
$ |
2,291 |
|
| Average invoice size - non-transportation |
|
$ |
6,083 |
|
|
$ |
5,701 |
|
|
$ |
6,469 |
|
|
$ |
5,495 |
|
|
$ |
5,648 |
|
Metrics above include assets and deposits held for sale.
(1)September 30, 2022 non-interest income includes a $1.0 million gain on sale of a portfolio of factored receivables, which contributed 0.33% to the yield on average net funds employed for the quarter.
June 30, 2022 non-interest income includes a $13.2 million gain on sale of a portfolio of factored receivables, which contributed 3.76% to the yield on average net funds employed for the quarter.
Information pertaining to our Payments segment, which includes only our TriumphPay division, summarized as of and for the quarters ended:
|
|
|
|
|
|
|
|
|
|
|
|
|
|
|
|
|
|
|
|
|
|
|
|
|
|
|
|
|
|
|
|
|
| Payments |
|
December 31,
2022 |
|
September 30,
2022 |
|
June 30,
2022 |
|
March 31,
2022 |
|
December 31,
2021 |
| Factored receivable period end balance |
|
$ |
85,722,000 |
|
|
$ |
118,958,000 |
|
|
$ |
145,835,000 |
|
|
$ |
178,879,000 |
|
|
$ |
153,176,000 |
|
|
|
|
|
|
|
|
|
|
|
|
| Total revenue |
|
|
|
|
|
|
|
|
|
|
| Interest income |
|
$ |
3,319,000 |
|
|
$ |
3,756,000 |
|
|
$ |
4,172,000 |
|
|
$ |
4,832,000 |
|
|
$ |
4,154,000 |
|
| Intersegment interest income allocation |
|
216,000 |
|
|
— |
|
|
— |
|
|
— |
|
|
— |
|
Noninterest income(1) |
|
3,551,000 |
|
|
3,518,000 |
|
|
10,309,000 |
|
|
3,242,000 |
|
|
3,209,000 |
|
|
|
$ |
7,086,000 |
|
|
$ |
7,274,000 |
|
|
$ |
14,481,000 |
|
|
$ |
8,074,000 |
|
|
$ |
7,363,000 |
|
|
|
|
|
|
|
|
|
|
|
|
| Total expense |
|
|
|
|
|
|
|
|
|
|
| Intersegment interest expense allocation |
|
$ |
— |
|
|
$ |
148,000 |
|
|
$ |
109,000 |
|
|
$ |
82,000 |
|
|
$ |
94,000 |
|
| Credit loss expense (benefit) |
|
(187,000) |
|
|
235,000 |
|
|
(184,000) |
|
|
354,000 |
|
|
(110,000) |
|
| Noninterest expense |
|
17,169,000 |
|
|
14,066,000 |
|
|
17,663,000 |
|
|
14,333,000 |
|
|
13,376,000 |
|
|
|
$ |
16,982,000 |
|
|
$ |
14,449,000 |
|
|
$ |
17,588,000 |
|
|
$ |
14,769,000 |
|
|
$ |
13,360,000 |
|
|
|
|
|
|
|
|
|
|
|
|
| Pre-tax operating income (loss) |
|
$ |
(9,896,000) |
|
|
$ |
(7,175,000) |
|
|
$ |
(3,107,000) |
|
|
$ |
(6,695,000) |
|
|
$ |
(5,997,000) |
|
| Intersegment interest expense allocation |
|
— |
|
|
148,000 |
|
|
109,000 |
|
|
82,000 |
|
|
94,000 |
|
| Depreciation and software amortization expense |
|
178,000 |
|
|
120,000 |
|
|
103,000 |
|
|
108,000 |
|
|
57,000 |
|
| Intangible amortization expense |
|
1,451,000 |
|
|
1,450,000 |
|
|
1,477,000 |
|
|
1,490,000 |
|
|
1,489,000 |
|
Earnings (losses) before interest, taxes, depreciation, and amortization(2) |
|
$ |
(8,267,000) |
|
|
$ |
(5,457,000) |
|
|
$ |
(1,418,000) |
|
|
$ |
(5,015,000) |
|
|
$ |
(4,357,000) |
|
|
|
|
|
|
|
|
|
|
|
|
|
|
|
|
|
|
|
|
|
|
|
|
|
|
|
|
|
|
|
|
|
|
| EBITDA Margin |
|
(117) |
% |
|
(75) |
% |
|
(10) |
% |
|
(62) |
% |
|
(59) |
% |
|
|
|
|
|
|
|
|
|
|
|
| Number of invoices processed |
|
4,605,020 |
|
|
4,676,249 |
|
|
4,394,351 |
|
|
3,982,879 |
|
|
4,027,680 |
|
| Amount of payments processed |
|
$ |
5,577,014,000 |
|
|
$ |
5,951,706,000 |
|
|
$ |
6,033,898,000 |
|
|
$ |
5,700,759,000 |
|
|
$ |
5,242,051,000 |
|
| Network invoice volume |
|
157,004 |
|
|
144,253 |
|
|
118,580 |
|
|
52,182 |
|
|
— |
|
| Network payment volume |
|
$ |
301,366,000 |
|
|
$ |
288,410,000 |
|
|
$ |
253,312,000 |
|
|
$ |
129,569,000 |
|
|
$ |
— |
|
(1)June 30, 2022 non-interest income includes a $10.2 million gain on an equity investment and a $3.2 million loss on impairment of warrants.
(2)Earnings (losses) before interest, taxes, depreciation, and amortization ("EBITDA") is a non-GAAP financial measure used as a supplemental measure to evaluate the performance of our Payments segment.
Deposits summarized as of:
|
|
|
|
|
|
|
|
|
|
|
|
|
|
|
|
|
|
|
|
|
|
|
|
|
|
|
|
|
|
| (Dollars in thousands) |
December 31,
2022 |
|
September 30,
2022 |
|
June 30,
2022 |
|
March 31,
2022 |
|
December 31,
2021 |
| Non-interest bearing demand |
$ |
1,756,680 |
|
|
$ |
1,897,309 |
|
|
$ |
2,085,249 |
|
|
$ |
1,859,376 |
|
|
$ |
1,925,370 |
|
| Interest bearing demand |
856,512 |
|
|
883,581 |
|
|
879,072 |
|
|
782,859 |
|
|
830,019 |
|
| Individual retirement accounts |
68,125 |
|
|
74,423 |
|
|
80,187 |
|
|
70,311 |
|
|
83,410 |
|
| Money market |
508,534 |
|
|
505,082 |
|
|
538,966 |
|
|
526,324 |
|
|
520,358 |
|
| Savings |
551,780 |
|
|
546,862 |
|
|
543,969 |
|
|
448,878 |
|
|
504,146 |
|
| Certificates of deposit |
319,150 |
|
|
373,734 |
|
|
437,766 |
|
|
431,243 |
|
|
533,206 |
|
| Brokered time deposits |
110,555 |
|
|
160,363 |
|
|
215,715 |
|
|
2,752 |
|
|
40,125 |
|
| Other brokered deposits |
— |
|
|
— |
|
|
— |
|
|
210,043 |
|
|
210,045 |
|
| Total deposits |
$ |
4,171,336 |
|
|
$ |
4,441,354 |
|
|
$ |
4,780,924 |
|
|
$ |
4,331,786 |
|
|
$ |
4,646,679 |
|
Deposits, including deposits held for sale, summarized as of:
|
|
|
|
|
|
|
|
|
|
|
|
|
|
|
|
|
|
|
|
|
|
|
|
|
|
|
|
|
|
| (Dollars in thousands) |
December 31,
2022 |
|
September 30,
2022 |
|
June 30,
2022 |
|
March 31,
2022 |
|
December 31,
2021 |
| Non-interest bearing demand |
$ |
1,756,680 |
|
|
$ |
1,897,309 |
|
|
$ |
2,086,659 |
|
|
$ |
1,972,760 |
|
|
$ |
1,925,370 |
|
| Interest bearing demand |
856,512 |
|
|
883,581 |
|
|
879,072 |
|
|
873,308 |
|
|
830,019 |
|
| Individual retirement accounts |
68,125 |
|
|
74,423 |
|
|
80,187 |
|
|
81,703 |
|
|
83,410 |
|
| Money market |
508,534 |
|
|
505,082 |
|
|
538,966 |
|
|
558,876 |
|
|
520,358 |
|
| Savings |
551,780 |
|
|
546,862 |
|
|
543,969 |
|
|
520,744 |
|
|
504,146 |
|
| Certificates of deposit |
319,150 |
|
|
373,734 |
|
|
437,766 |
|
|
489,298 |
|
|
533,206 |
|
| Brokered time deposits |
110,555 |
|
|
160,363 |
|
|
215,715 |
|
|
2,752 |
|
|
40,125 |
|
| Other brokered deposits |
— |
|
|
— |
|
|
— |
|
|
210,043 |
|
|
210,045 |
|
| Total deposits |
$ |
4,171,336 |
|
|
$ |
4,441,354 |
|
|
$ |
4,782,334 |
|
|
$ |
4,709,484 |
|
|
$ |
4,646,679 |
|
Net interest margin summarized for the three months ended:
|
|
|
|
|
|
|
|
|
|
|
|
|
|
|
|
|
|
|
|
|
|
|
|
|
|
|
|
|
|
|
|
|
|
|
|
|
December 31, 2022 |
|
September 30, 2022 |
| (Dollars in thousands) |
Average
Balance |
|
Interest |
|
Average
Rate(4)
|
|
Average
Balance |
|
Interest |
|
Average
Rate(4)
|
| Interest earning assets: |
|
|
|
|
|
|
|
|
|
|
|
| Interest earning cash balances |
$ |
295,192 |
|
|
$ |
2,891 |
|
|
3.89 |
% |
|
$ |
452,136 |
|
|
$ |
2,607 |
|
|
2.29 |
% |
| Taxable securities |
253,684 |
|
|
3,285 |
|
|
5.14 |
% |
|
231,759 |
|
|
2,217 |
|
|
3.80 |
% |
| Tax-exempt securities |
13,451 |
|
|
87 |
|
|
2.57 |
% |
|
14,197 |
|
|
91 |
|
|
2.54 |
% |
| FHLB and other restricted stock |
6,215 |
|
|
83 |
|
|
5.30 |
% |
|
6,171 |
|
|
65 |
|
|
4.18 |
% |
Loans(1) |
4,294,799 |
|
|
99,926 |
|
|
9.23 |
% |
|
4,355,132 |
|
|
98,245 |
|
|
8.95 |
% |
| Total interest earning assets |
$ |
4,863,341 |
|
|
$ |
106,272 |
|
|
8.67 |
% |
|
$ |
5,059,395 |
|
|
$ |
103,225 |
|
|
8.09 |
% |
| Non-interest earning assets: |
|
|
|
|
|
|
|
|
|
|
|
| Other assets |
640,752 |
|
|
|
|
|
|
641,152 |
|
|
|
|
|
| Total assets |
$ |
5,504,093 |
|
|
|
|
|
|
$ |
5,700,547 |
|
|
|
|
|
| Interest bearing liabilities: |
|
|
|
|
|
|
|
|
|
|
|
| Deposits: |
|
|
|
|
|
|
|
|
|
|
|
| Interest bearing demand |
$ |
852,651 |
|
|
$ |
541 |
|
|
0.25 |
% |
|
$ |
879,851 |
|
|
$ |
812 |
|
|
0.37 |
% |
| Individual retirement accounts |
71,409 |
|
|
93 |
|
|
0.52 |
% |
|
77,004 |
|
|
97 |
|
|
0.50 |
% |
| Money market |
508,899 |
|
|
639 |
|
|
0.50 |
% |
|
524,483 |
|
|
313 |
|
|
0.24 |
% |
| Savings |
526,659 |
|
|
281 |
|
|
0.21 |
% |
|
524,106 |
|
|
209 |
|
|
0.16 |
% |
| Certificates of deposit |
343,110 |
|
|
520 |
|
|
0.60 |
% |
|
407,130 |
|
|
564 |
|
|
0.55 |
% |
| Brokered time deposits |
176,610 |
|
|
954 |
|
|
2.14 |
% |
|
186,856 |
|
|
748 |
|
|
1.59 |
% |
| Other brokered deposits |
35,815 |
|
|
— |
|
|
— |
% |
|
26,758 |
|
|
— |
|
|
— |
% |
| Total interest bearing deposits |
2,515,153 |
|
|
3,028 |
|
|
0.48 |
% |
|
2,626,188 |
|
|
2,743 |
|
|
0.41 |
% |
| Federal Home Loan Bank advances |
30,000 |
|
|
296 |
|
|
3.91 |
% |
|
30,000 |
|
|
182 |
|
|
2.41 |
% |
| Subordinated notes |
107,690 |
|
|
1,307 |
|
|
4.82 |
% |
|
107,477 |
|
|
1,304 |
|
|
4.81 |
% |
| Junior subordinated debentures |
41,091 |
|
|
926 |
|
|
8.94 |
% |
|
40,948 |
|
|
726 |
|
|
7.03 |
% |
| Other borrowings |
5,317 |
|
|
— |
|
|
— |
% |
|
13,180 |
|
|
— |
|
|
— |
% |
| Total interest bearing liabilities |
$ |
2,699,251 |
|
|
$ |
5,557 |
|
|
0.82 |
% |
|
$ |
2,817,793 |
|
|
$ |
4,955 |
|
|
0.70 |
% |
| Non-interest bearing liabilities and equity: |
|
|
|
|
|
|
|
|
|
|
|
| Non-interest bearing demand deposits |
1,807,298 |
|
|
|
|
|
|
1,885,111 |
|
|
|
|
|
| Other liabilities |
88,319 |
|
|
|
|
|
|
98,798 |
|
|
|
|
|
| Total equity |
909,225 |
|
|
|
|
|
|
898,845 |
|
|
|
|
|
| Total liabilities and equity |
$ |
5,504,093 |
|
|
|
|
|
|
$ |
5,700,547 |
|
|
|
|
|
| Net interest income |
|
|
$ |
100,715 |
|
|
|
|
|
|
$ |
98,270 |
|
|
|
Interest spread(2) |
|
|
|
|
7.85 |
% |
|
|
|
|
|
7.39 |
% |
Net interest margin(3) |
|
|
|
|
8.22 |
% |
|
|
|
|
|
7.71 |
% |
(1) Loan balance totals include respective nonaccrual assets.
(2) Net interest spread is the yield on average interest earning assets less the rate on interest bearing liabilities.
(3) Net interest margin is the ratio of net interest income to average interest earning assets.
(4) Average rates have been annualized.
Additional information pertaining to our loan portfolio, including loans held for investment and loans held for sale, summarized for the quarters ended:
|
|
|
|
|
|
|
|
|
|
|
|
|
|
|
|
|
|
|
|
|
|
|
|
|
|
|
|
|
|
| (Dollars in thousands) |
December 31,
2022 |
|
September 30,
2022 |
|
June 30,
2022 |
|
March 31,
2022 |
|
December 31,
2021 |
| Average Banking loans |
$ |
2,891,412 |
|
|
$ |
2,830,507 |
|
|
$ |
3,014,573 |
|
|
$ |
3,032,745 |
|
|
$ |
3,112,072 |
|
| Average Factoring receivables |
1,298,286 |
|
|
1,393,141 |
|
|
1,576,208 |
|
|
1,614,462 |
|
|
1,597,091 |
|
| Average Payments receivables |
105,101 |
|
|
131,484 |
|
|
163,112 |
|
|
166,650 |
|
|
142,008 |
|
| Average total loans |
$ |
4,294,799 |
|
|
$ |
4,355,132 |
|
|
$ |
4,753,893 |
|
|
$ |
4,813,857 |
|
|
$ |
4,851,171 |
|
| Banking yield |
7.04 |
% |
|
6.30 |
% |
|
5.87 |
% |
|
5.46 |
% |
|
5.61 |
% |
| Factoring yield |
13.85 |
% |
|
14.11 |
% |
|
14.21 |
% |
|
14.16 |
% |
|
14.42 |
% |
| Payments yield |
12.53 |
% |
|
11.33 |
% |
|
10.26 |
% |
|
11.76 |
% |
|
11.61 |
% |
| Total loan yield |
9.23 |
% |
|
8.95 |
% |
|
8.79 |
% |
|
8.60 |
% |
|
8.68 |
% |
Metrics and non-GAAP financial reconciliation:
|
|
|
|
|
|
|
|
|
|
|
|
|
|
|
|
|
|
|
|
|
|
|
|
|
|
|
|
|
|
|
|
|
|
|
|
|
|
|
|
|
|
|
|
|
|
|
As of and for the Three Months Ended |
|
As of and for the Year Ended |
(Dollars in thousands,
except per share amounts) |
|
December 31,
2022 |
|
September 30,
2022 |
|
June 30,
2022 |
|
March 31,
2022 |
|
December 31,
2021 |
|
December 31,
2022 |
|
December 31,
2021 |
| Net income available to common stockholders |
|
$ |
16,759 |
|
|
$ |
15,428 |
|
|
$ |
43,390 |
|
|
$ |
23,528 |
|
|
$ |
25,839 |
|
|
$ |
99,105 |
|
|
$ |
109,768 |
|
| Transaction costs |
|
— |
|
|
— |
|
|
— |
|
|
— |
|
|
— |
|
|
— |
|
|
2,992 |
|
|
|
|
|
|
|
|
|
|
|
|
|
|
|
|
| Tax effect of adjustments |
|
— |
|
|
— |
|
|
— |
|
|
— |
|
|
— |
|
|
— |
|
|
(715) |
|
| Adjusted net income available to common stockholders - diluted |
|
$ |
16,759 |
|
|
$ |
15,428 |
|
|
$ |
43,390 |
|
|
$ |
23,528 |
|
|
$ |
25,839 |
|
|
$ |
99,105 |
|
|
$ |
112,045 |
|
|
|
|
|
|
|
|
|
|
|
|
|
|
|
|
| Weighted average shares outstanding - diluted |
|
24,879,054 |
|
|
24,979,257 |
|
|
24,866,573 |
|
|
25,371,868 |
|
|
25,390,733 |
|
|
25,023,568 |
|
|
25,252,052 |
|
| Adjusted diluted earnings per common share |
|
$ |
0.67 |
|
|
$ |
0.62 |
|
|
$ |
1.74 |
|
|
$ |
0.93 |
|
|
$ |
1.02 |
|
|
$ |
3.96 |
|
|
$ |
4.44 |
|
|
|
|
|
|
|
|
|
|
|
|
|
|
|
|
| Average total stockholders' equity |
|
$ |
909,225 |
|
|
$ |
898,845 |
|
|
$ |
882,505 |
|
|
$ |
880,949 |
|
|
$ |
851,683 |
|
|
$ |
892,978 |
|
|
$ |
801,074 |
|
| Average preferred stock liquidation preference |
|
(45,000) |
|
|
(45,000) |
|
|
(45,000) |
|
|
(45,000) |
|
|
(45,000) |
|
|
(45,000) |
|
|
(45,000) |
|
| Average total common stockholders' equity |
|
864,225 |
|
|
853,845 |
|
|
837,505 |
|
|
835,949 |
|
|
806,683 |
|
|
847,978 |
|
|
756,074 |
|
| Average goodwill and other intangibles |
|
(267,206) |
|
|
(269,417) |
|
|
(269,319) |
|
|
(275,378) |
|
|
(278,528) |
|
|
(270,306) |
|
|
(243,541) |
|
| Average tangible common stockholders' equity |
|
$ |
597,019 |
|
|
$ |
584,428 |
|
|
$ |
568,186 |
|
|
$ |
560,571 |
|
|
$ |
528,155 |
|
|
$ |
577,672 |
|
|
$ |
512,533 |
|
|
|
|
|
|
|
|
|
|
|
|
|
|
|
|
| Net income available to common stockholders |
|
$ |
16,759 |
|
|
$ |
15,428 |
|
|
$ |
43,390 |
|
|
$ |
23,528 |
|
|
$ |
25,839 |
|
|
$ |
99,105 |
|
|
$ |
109,768 |
|
| Average tangible common equity |
|
597,019 |
|
|
584,428 |
|
|
568,186 |
|
|
560,571 |
|
|
528,155 |
|
|
577,672 |
|
|
512,533 |
|
| Return on average tangible common equity |
|
11.14 |
% |
|
10.47 |
% |
|
30.63 |
% |
|
17.02 |
% |
|
19.41 |
% |
|
17.16 |
% |
|
21.42 |
% |
|
|
|
|
|
|
|
|
|
|
|
|
|
|
|
| Net interest income |
|
$ |
100,715 |
|
|
$ |
98,270 |
|
|
$ |
101,428 |
|
|
$ |
100,079 |
|
|
$ |
104,057 |
|
|
$ |
400,492 |
|
|
$ |
369,130 |
|
| Non-interest income |
|
12,119 |
|
|
12,668 |
|
|
48,160 |
|
|
11,121 |
|
|
14,259 |
|
|
84,068 |
|
|
54,501 |
|
| Operating revenue |
|
$ |
112,834 |
|
|
$ |
110,938 |
|
|
$ |
149,588 |
|
|
$ |
111,200 |
|
|
$ |
118,316 |
|
|
484,560 |
|
|
423,631 |
|
|
|
|
|
|
|
|
|
|
|
|
|
|
|
|
|
|
|
|
|
|
|
|
|
|
|
|
|
|
|
| Non-interest expenses |
|
$ |
86,771 |
|
|
$ |
86,689 |
|
|
$ |
88,607 |
|
|
$ |
78,564 |
|
|
$ |
83,004 |
|
|
$ |
340,631 |
|
|
$ |
287,507 |
|
| Transaction costs |
|
— |
|
|
— |
|
|
— |
|
|
— |
|
|
— |
|
|
— |
|
|
(2,992) |
|
| Adjusted non-interest expenses |
|
$ |
86,771 |
|
|
$ |
86,689 |
|
|
$ |
88,607 |
|
|
$ |
78,564 |
|
|
$ |
83,004 |
|
|
$ |
340,631 |
|
|
$ |
284,515 |
|
| Adjusted efficiency ratio |
|
76.90 |
% |
|
78.14 |
% |
|
59.23 |
% |
|
70.65 |
% |
|
70.16 |
% |
|
70.30 |
% |
|
67.16 |
% |
|
|
|
|
|
|
|
|
|
|
|
|
|
|
|
| Adjusted net non-interest expense to average assets ratio: |
|
|
|
|
|
|
|
|
|
|
|
|
|
|
| Non-interest expenses |
|
$ |
86,771 |
|
|
$ |
86,689 |
|
|
$ |
88,607 |
|
|
$ |
78,564 |
|
|
$ |
83,004 |
|
|
$ |
340,631 |
|
|
$ |
287,507 |
|
| Transaction costs |
|
— |
|
|
— |
|
|
— |
|
|
— |
|
|
— |
|
|
— |
|
|
(2,992) |
|
| Adjusted non-interest expenses |
|
$ |
86,771 |
|
|
$ |
86,689 |
|
|
$ |
88,607 |
|
|
$ |
78,564 |
|
|
$ |
83,004 |
|
|
$ |
340,631 |
|
|
$ |
284,515 |
|
| Total non-interest income |
|
$ |
12,119 |
|
|
$ |
12,668 |
|
|
$ |
48,160 |
|
|
$ |
11,121 |
|
|
$ |
14,259 |
|
|
$ |
84,068 |
|
|
$ |
54,501 |
|
|
|
|
|
|
|
|
|
|
|
|
|
|
|
|
|
|
|
|
|
|
|
|
|
|
|
|
|
|
|
| Adjusted net non-interest expenses |
|
$ |
74,652 |
|
|
$ |
74,021 |
|
|
$ |
40,447 |
|
|
$ |
67,443 |
|
|
$ |
68,745 |
|
|
$ |
256,563 |
|
|
$ |
230,014 |
|
| Average total assets |
|
$ |
5,504,093 |
|
|
$ |
5,700,547 |
|
|
$ |
5,878,320 |
|
|
$ |
5,843,319 |
|
|
$ |
5,979,762 |
|
|
$ |
5,730,592 |
|
|
$ |
6,026,819 |
|
| Adjusted net non-interest expense to average assets ratio |
|
5.38 |
% |
|
5.15 |
% |
|
2.76 |
% |
|
4.68 |
% |
|
4.56 |
% |
|
4.48 |
% |
|
3.82 |
% |
|
|
|
|
|
|
|
|
|
|
|
|
|
|
|
| Total stockholders' equity |
|
$ |
888,971 |
|
|
$ |
891,173 |
|
|
$ |
874,281 |
|
|
$ |
886,665 |
|
|
$ |
858,864 |
|
|
$ |
888,971 |
|
|
$ |
858,864 |
|
| Preferred stock liquidation preference |
|
(45,000) |
|
|
(45,000) |
|
|
(45,000) |
|
|
(45,000) |
|
|
(45,000) |
|
|
(45,000) |
|
|
(45,000) |
|
| Total common stockholders' equity |
|
843,971 |
|
|
846,173 |
|
|
829,281 |
|
|
841,665 |
|
|
813,864 |
|
|
843,971 |
|
|
813,864 |
|
| Goodwill and other intangibles |
|
(265,767) |
|
|
(268,604) |
|
|
(270,666) |
|
|
(269,119) |
|
|
(276,856) |
|
|
(265,767) |
|
|
(276,856) |
|
| Tangible common stockholders' equity |
|
$ |
578,204 |
|
|
$ |
577,569 |
|
|
$ |
558,615 |
|
|
$ |
572,546 |
|
|
$ |
537,008 |
|
|
$ |
578,204 |
|
|
$ |
537,008 |
|
| Common shares outstanding |
|
24,053,585 |
|
|
24,478,288 |
|
|
24,457,777 |
|
|
25,161,690 |
|
|
25,158,879 |
|
|
24,053,585 |
|
|
25,158,879 |
|
| Tangible book value per share |
|
$ |
24.04 |
|
|
$ |
23.60 |
|
|
$ |
22.84 |
|
|
$ |
22.75 |
|
|
$ |
21.34 |
|
|
$ |
24.04 |
|
|
$ |
21.34 |
|
|
|
|
|
|
|
|
|
|
|
|
|
|
|
|
| Total assets at end of period |
|
$ |
5,333,783 |
|
|
$ |
5,642,450 |
|
|
$ |
5,955,507 |
|
|
$ |
6,076,434 |
|
|
$ |
5,956,250 |
|
|
$ |
5,333,783 |
|
|
$ |
5,956,250 |
|
| Goodwill and other intangibles |
|
(265,767) |
|
|
(268,604) |
|
|
(270,666) |
|
|
(269,119) |
|
|
(276,856) |
|
|
(265,767) |
|
|
(276,856) |
|
| Tangible assets at period end |
|
$ |
5,068,016 |
|
|
$ |
5,373,846 |
|
|
$ |
5,684,841 |
|
|
$ |
5,807,315 |
|
|
$ |
5,679,394 |
|
|
$ |
5,068,016 |
|
|
$ |
5,679,394 |
|
| Tangible common stockholders' equity ratio |
|
11.41 |
% |
|
10.75 |
% |
|
9.83 |
% |
|
9.86 |
% |
|
9.46 |
% |
|
11.41 |
% |
|
9.46 |
% |
1)Triumph uses certain non-GAAP financial measures to provide meaningful supplemental information regarding Triumph's operational performance and to enhance investors' overall understanding of such financial performance. The non-GAAP measures used by Triumph include the following:
•“Adjusted diluted earnings per common share” is defined as adjusted net income available to common stockholders divided by adjusted weighted average diluted common shares outstanding. Excluded from net income available to common stockholders are material gains and expenses related to merger and acquisition-related activities, including divestitures, net of tax. In our judgment, the adjustments made to net income available to common stockholders allow management and investors to better assess our performance in relation to our core net income by removing the volatility associated with certain acquisition-related items and other discrete items that are unrelated to our core business. Weighted average diluted common shares outstanding are adjusted as a result of changes in their dilutive properties given the gain and expense adjustments described herein.
•"Tangible common stockholders' equity" is defined as common stockholders' equity less goodwill and other intangible assets.
•"Total tangible assets" is defined as total assets less goodwill and other intangible assets.
•"Tangible book value per share" is defined as tangible common stockholders' equity divided by total common shares outstanding. This measure is important to investors interested in changes from period-to-period in book value per share exclusive of changes in intangible assets.
•"Tangible common stockholders' equity ratio" is defined as the ratio of tangible common stockholders' equity divided by total tangible assets. We believe that this measure is important to many investors in the marketplace who are interested in relative changes from period-to period in common equity and total assets, each exclusive of changes in intangible assets.
•"Return on Average Tangible Common Equity" is defined as net income available to common stockholders divided by average tangible common stockholders' equity.
•"Adjusted efficiency ratio" is defined as non-interest expenses divided by our operating revenue, which is equal to net interest income plus non-interest income. Also excluded are material gains and expenses related to merger and acquisition-related activities, including divestitures. In our judgment, the adjustments made to operating revenue and non-interest expense allow management and investors to better assess our performance in relation to our core operating revenue by removing the volatility associated with certain acquisition-related items and other discrete items that are unrelated to our core business.
•"Adjusted net non-interest expense to average total assets" is defined as non-interest expenses net of non-interest income divided by total average assets. Excluded are material gains and expenses related to merger and acquisition-related activities, including divestitures. This metric is used by our management to better assess our operating efficiency.
2)Performance ratios include discount accretion on purchased loans for the periods presented as follows:
|
|
|
|
|
|
|
|
|
|
|
|
|
|
|
|
|
|
|
|
|
|
|
|
|
|
|
|
|
|
|
|
|
|
|
|
|
|
|
|
|
|
|
For the Three Months Ended |
|
For the Year Ended |
| (Dollars in thousands) |
December 31,
2022 |
|
September 30,
2022 |
|
June 30,
2022 |
|
March 31,
2022 |
|
December 31,
2021 |
|
December 31,
2022 |
|
December 31,
2021 |
| Loan discount accretion |
$ |
2,012 |
|
|
$ |
1,539 |
|
|
$ |
3,556 |
|
|
$ |
1,536 |
|
|
$ |
1,674 |
|
|
$ |
8,643 |
|
|
$ |
9,289 |
|
3)Asset quality ratios exclude loans held for sale, except for non-performing assets to total assets.
4)Current quarter ratios are preliminary.
Source: Triumph Financial, Inc.
###
Investor Relations:
Luke Wyse
Senior Vice President, Finance & Investor Relations
lwyse@tbkbank.com
214-365-6936
Media Contact:
Amanda Tavackoli
Senior Vice President, Director of Corporate Communication
atavackoli@tbkbank.com
214-365-6930