Document
CALIBER REPORTS FOURTH QUARTER AND FULL YEAR 2023 RESULTS
SCOTTSDALE, Ariz., April 15, 2024 – Caliber (NASDAQ: CWD; “CaliberCos Inc.”), a real estate investor, developer, and asset manager, today reported results for the fourth quarter and full year ended on December 31, 2023.
Fourth Quarter 2023 Financial Highlights (compared to fourth quarter 2022)
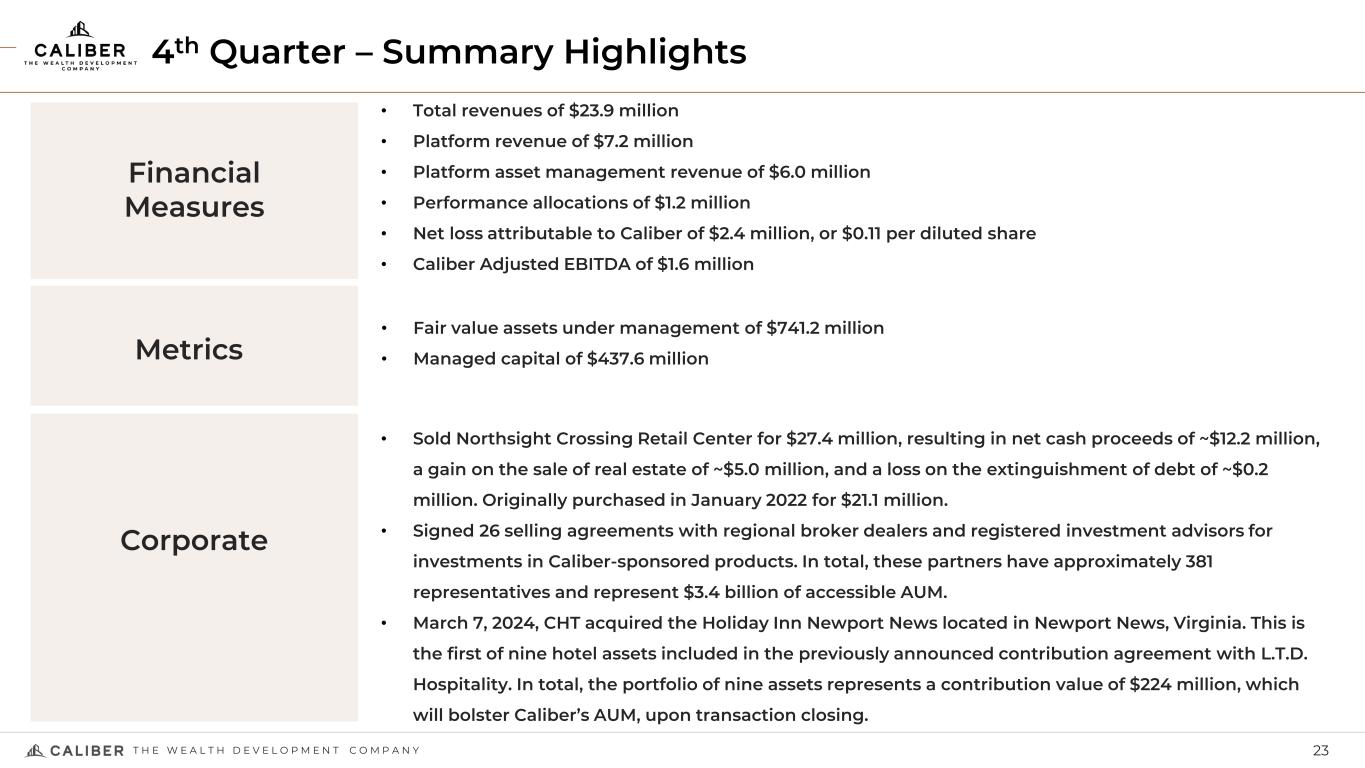
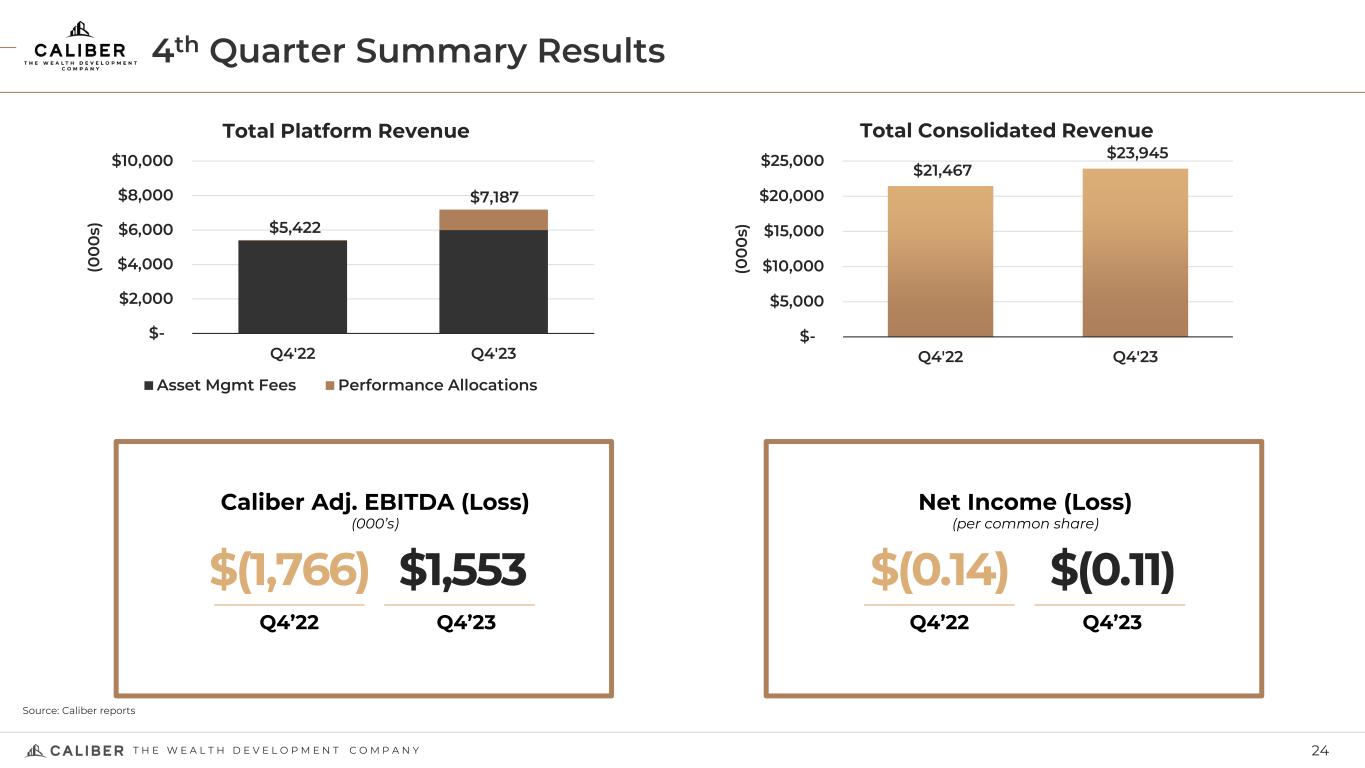
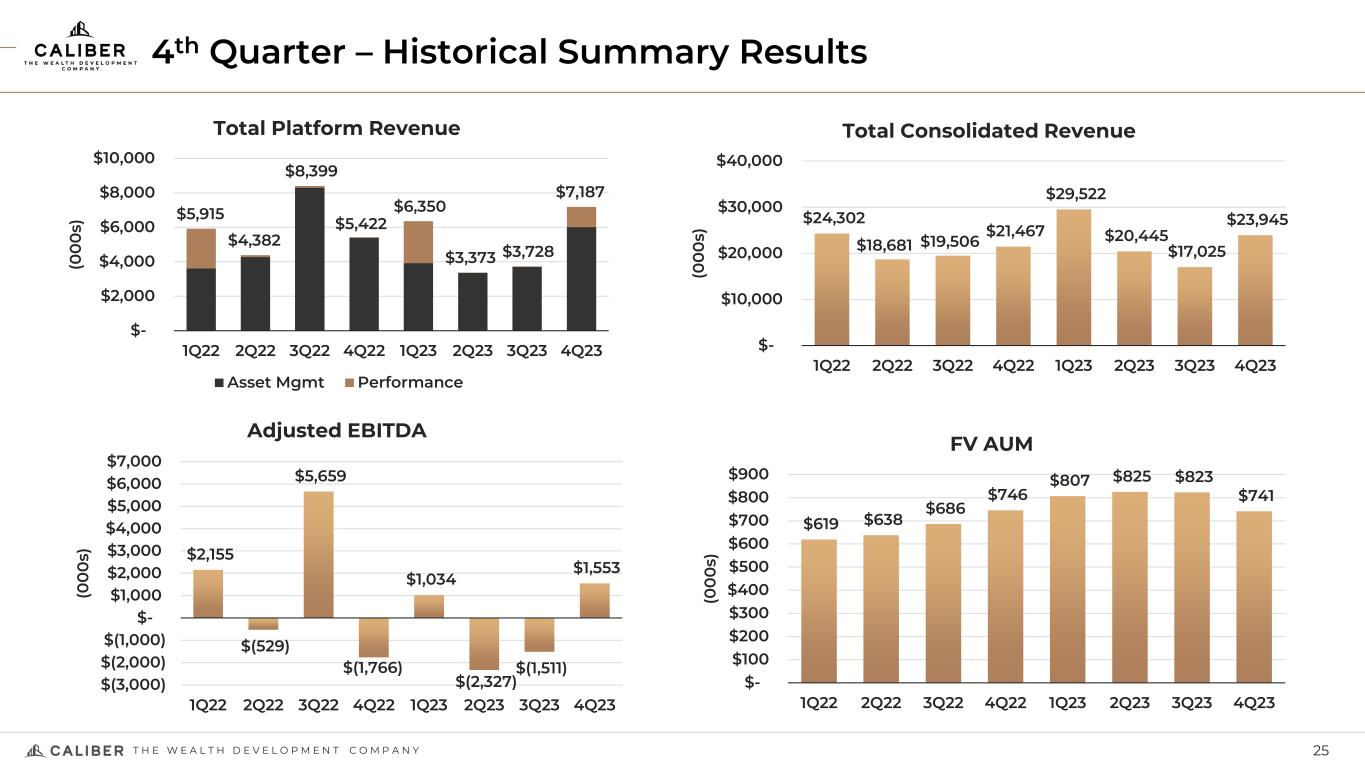
•Total revenue of $23.9 million, an 11.5% increase
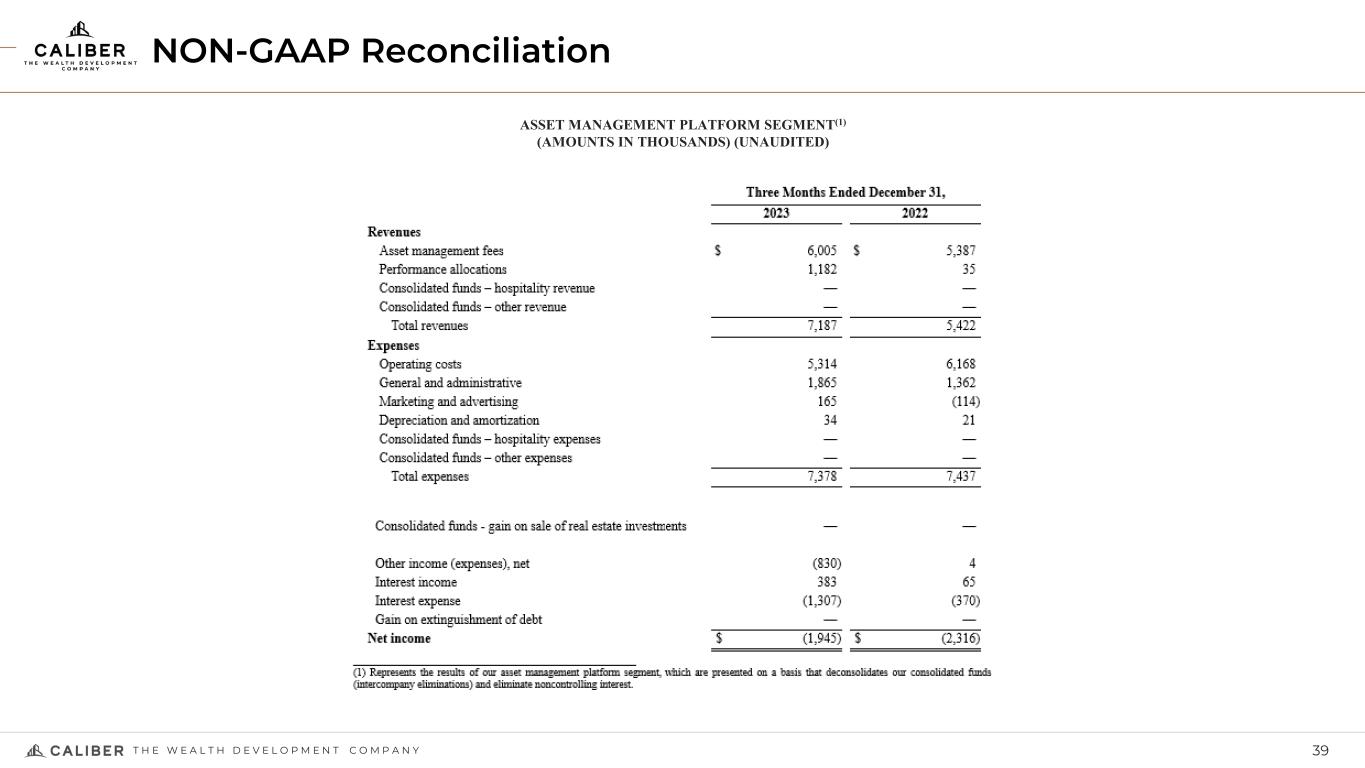
•Platform revenue(1) of $7.2 million, a 32.6% increase
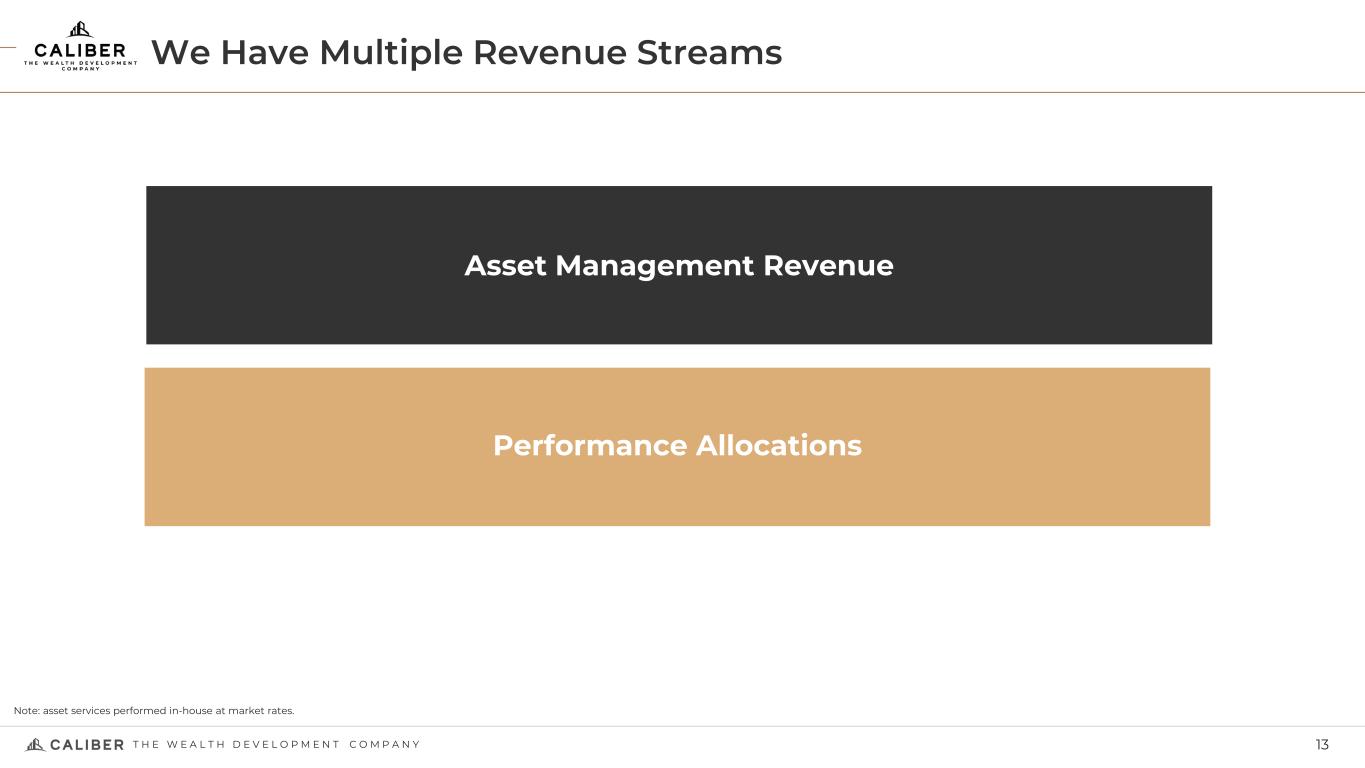
–Asset management revenue(2) of $6.0 million, an 11.5% increase
–Performance allocations(3) of $1.2 million, driven by the sale of Northsight Crossing and South Ridge
•Net loss attributable to Caliber of $2.4 million, or $0.11 per diluted share, compared to net loss attributable to Caliber of $2.5 million or $0.14 per diluted share
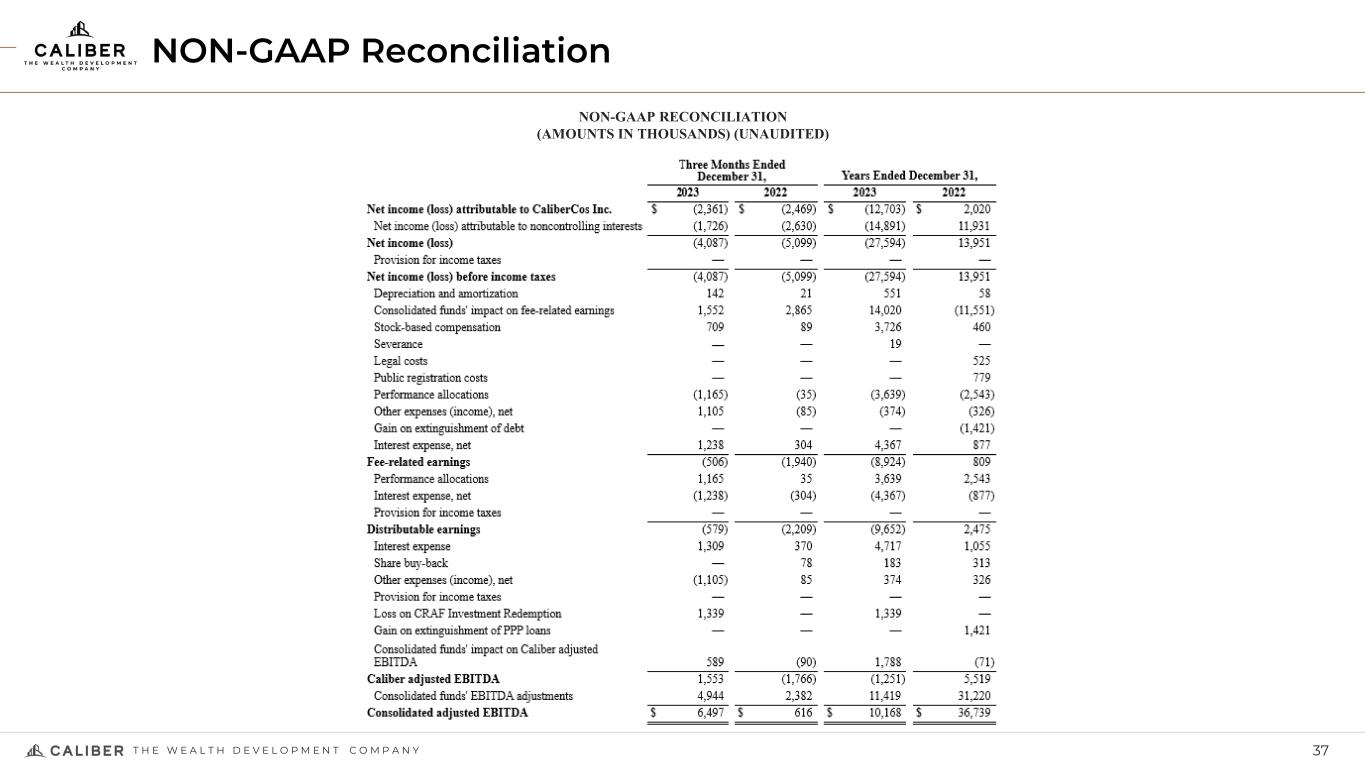
•Caliber Adjusted EBITDA(4) of $1.6 million, compared to Caliber Adjusted EBITDA loss of $1.8 million
Full Year 2023 Financial Highlights (compared to full year 2022)
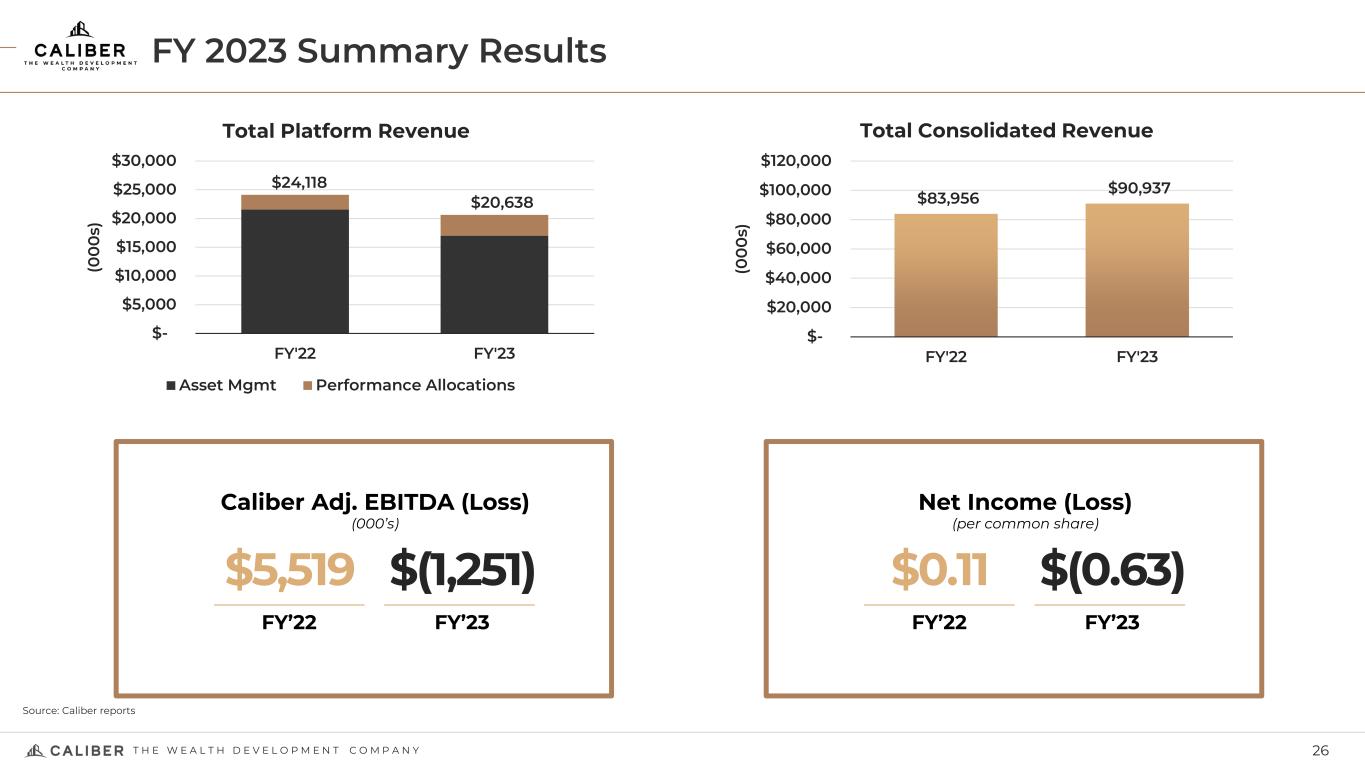
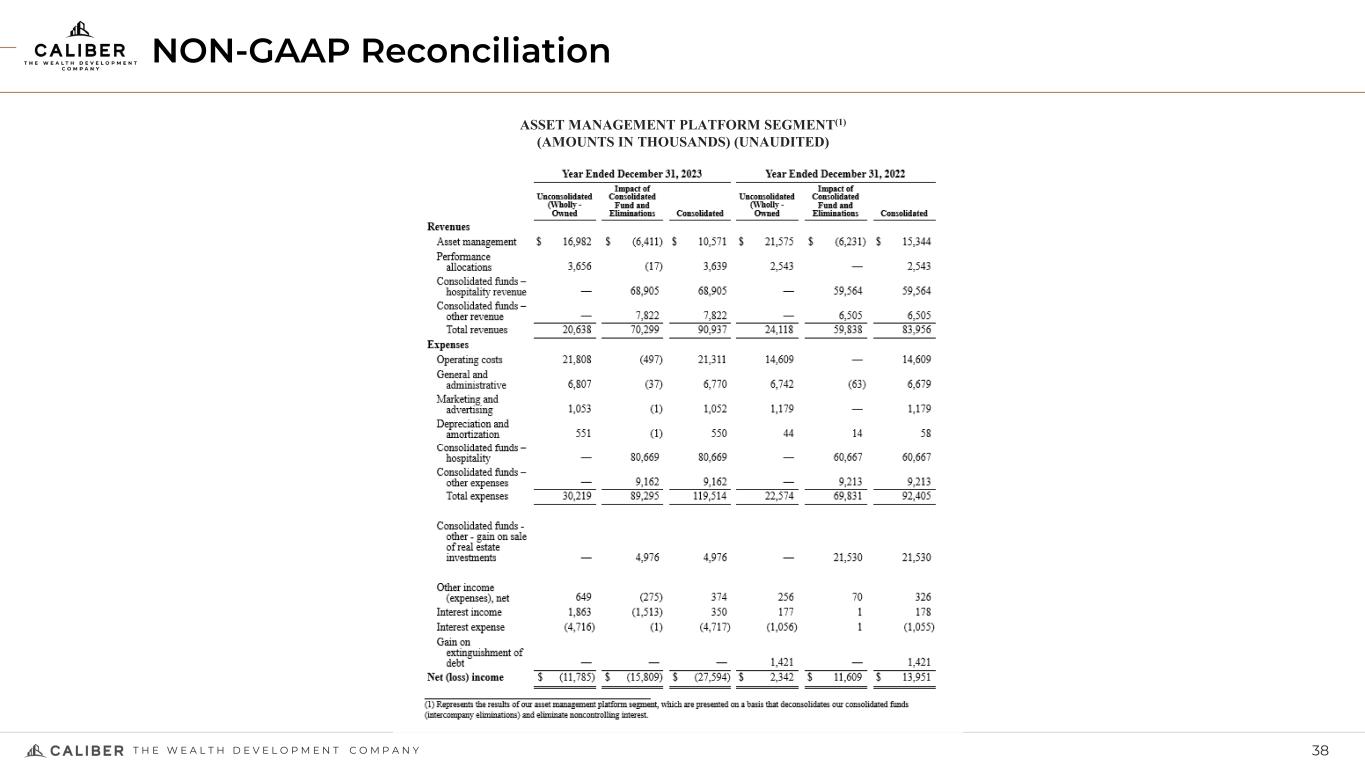
•Total revenue of $90.9 million, a 8.3% increase
•Platform revenue(1) of $20.6 million, a 14.4% decrease
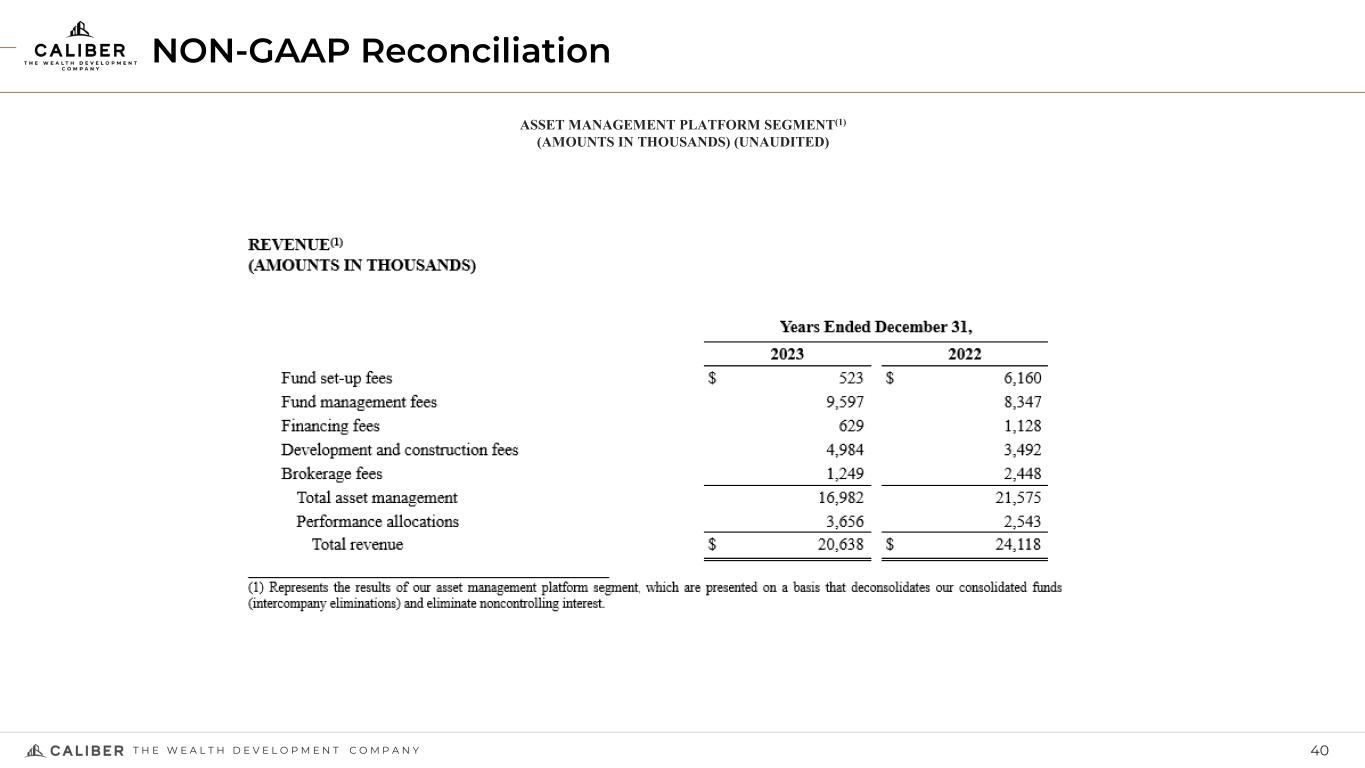
–Asset management revenue(2) of $17.0 million, a 21.3% decrease
–Fund management fees(5) of $9.6 million, a 15.0% increase
–Performance allocations(3) of $3.7 million, a 43.8% increase
•Net loss attributable to Caliber of $12.7 million, or $0.63 per diluted share, compared to net income of $2.0 million or $0.11 per diluted share due to lower platform revenue, an increase in payroll and non-cash equity compensation, and higher interest expense
•Caliber Adjusted EBITDA(4) loss of $1.3 million, compared to Caliber Adjusted EBITDA of $5.5 million
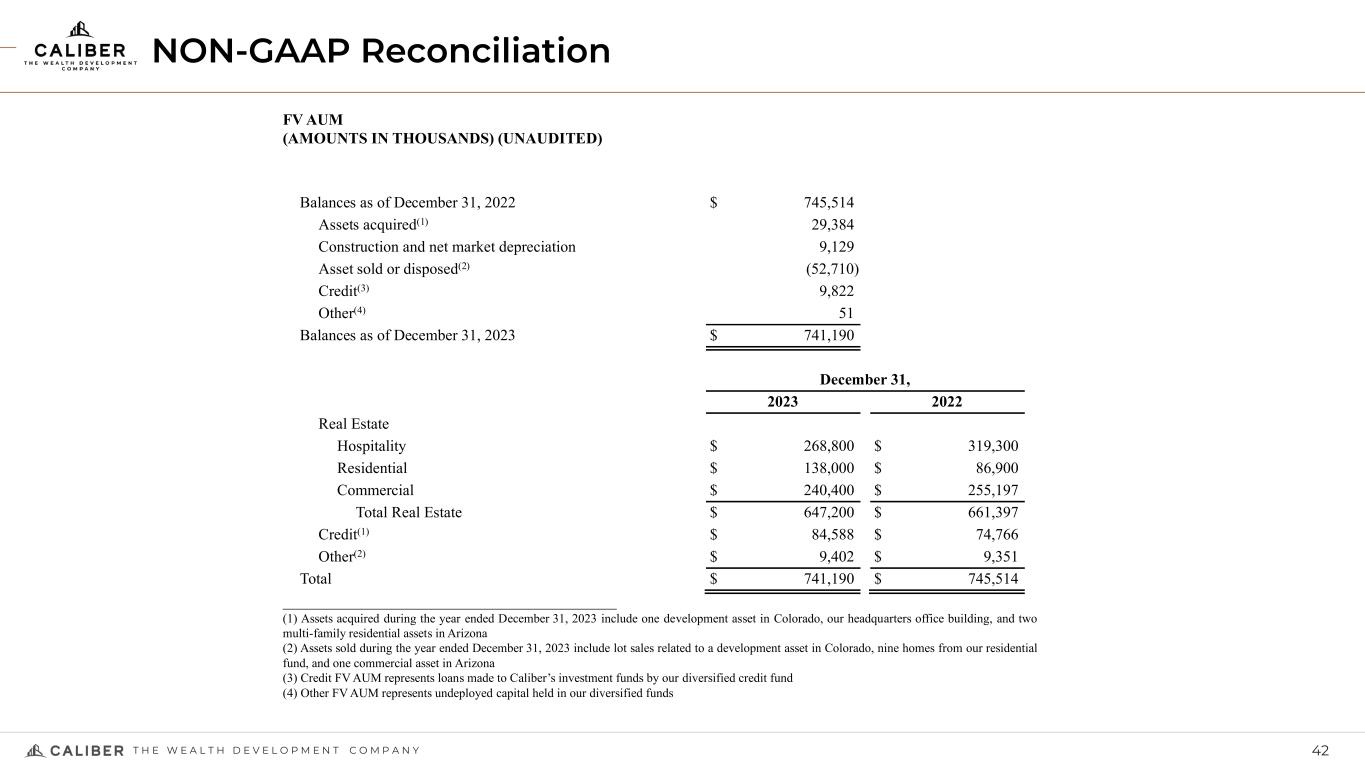
•Fair value assets under management(6) (“FV AUM”) of $741.2 million, a 0.6% decrease, primarily due to asset sales, partially offset by asset purchases
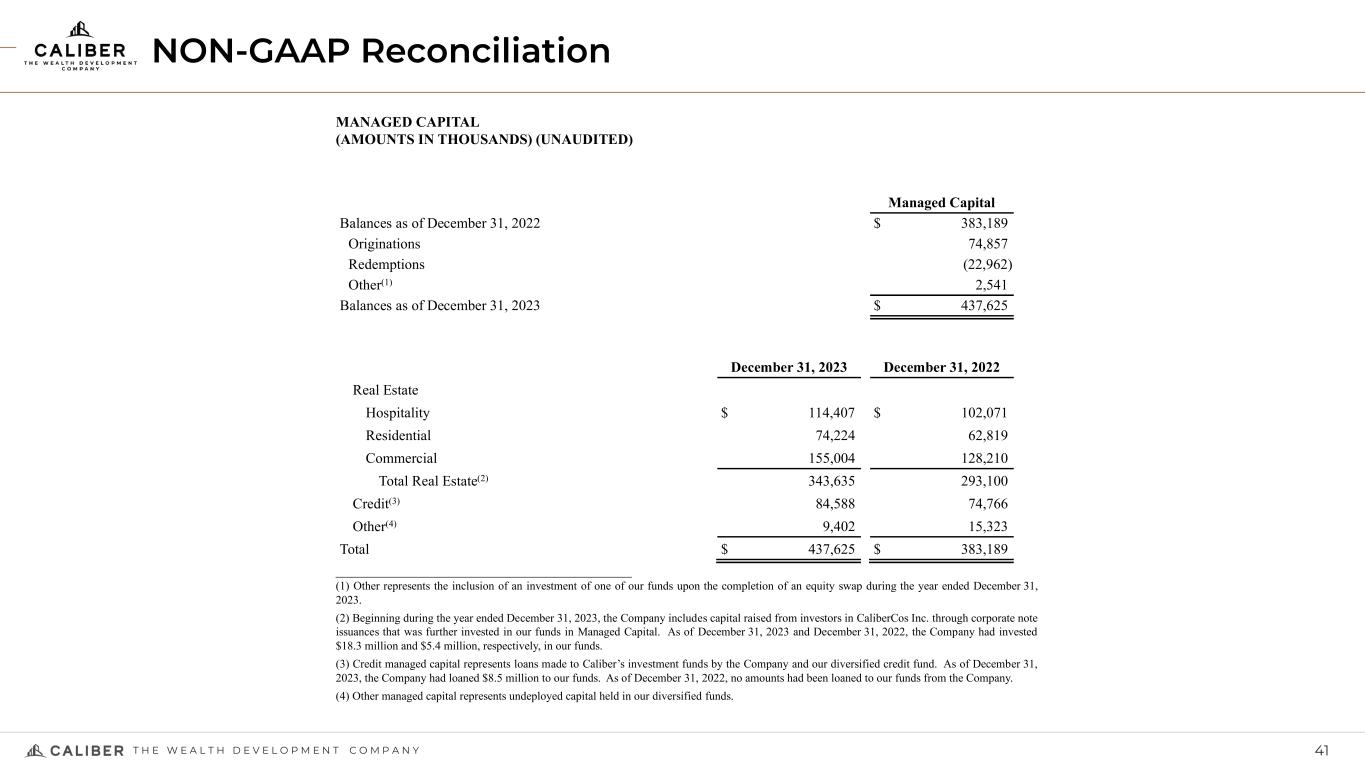
•Managed capital(7) of $437.6 million, a 14.2% year-over-year increase, with originations of $74.9 million, partially offset by redemptions of $23.0 million
Management Commentary
“2023 was a pivotal year for Caliber as we completed our initial public offering, launched new funds, and entered a new wholesale distribution channel, which we believe will be a catalyst for accelerated growth in the future,” said Chris Loeffler, CEO of Caliber. “The ongoing regional banking challenges have created unique investment opportunities for Caliber to acquire discounted assets through the three new funds we launched in 2023. Additionally, our hotel roll-up strategy, the Caliber Hospitality Trust (“CHT”), offers Caliber an attractive vehicle to grow AUM with income-producing hotels.”
Loeffler continued, “The strategic investments we made to scale our business last year coincided with macroeconomic headwinds and a challenging fundraising environment. While we remain confident in Caliber’s growth prospects, we are committed to ensuring that we grow profitably. To that end, we have initiated a review of our current cost structure and will be evaluating potential measures that reflect current market dynamics.
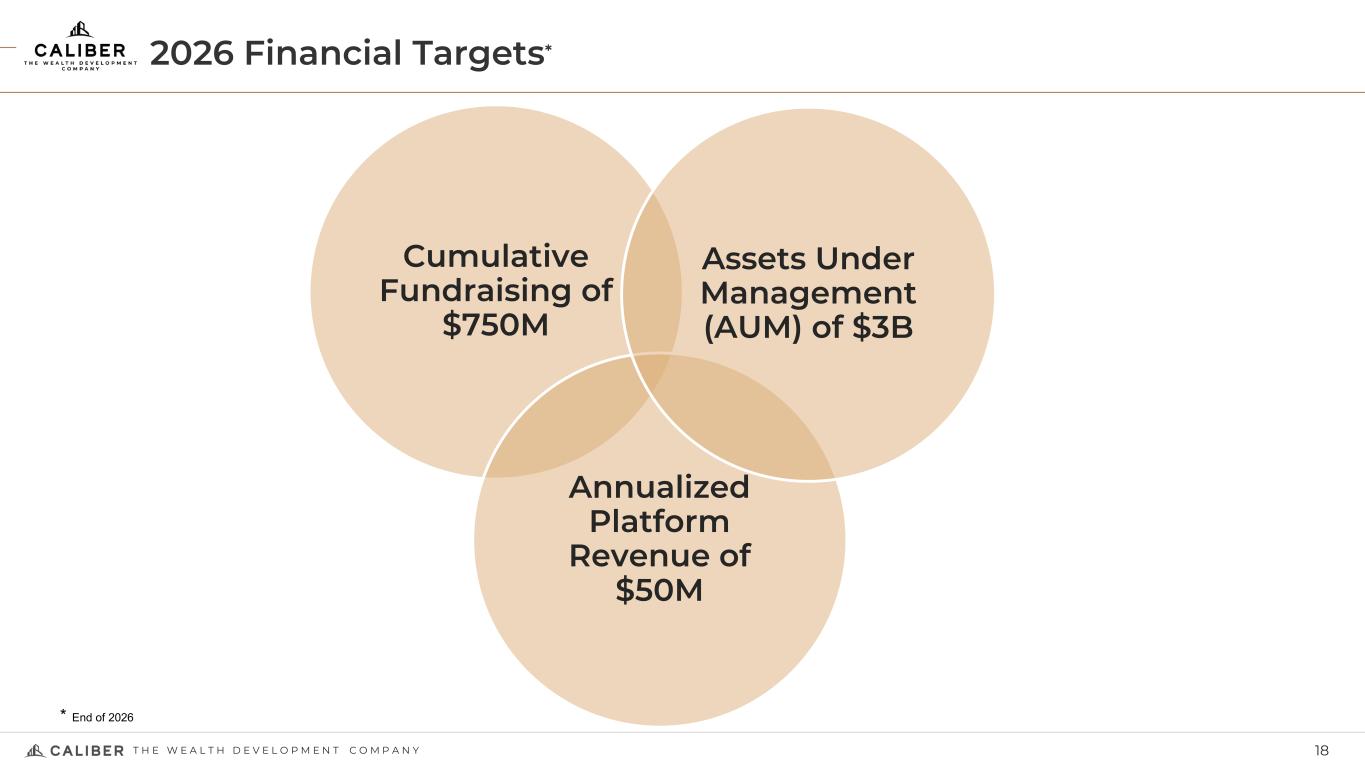
“We remain focused on meeting the three-year financial targets we announced in November 2023, which include achieving cumulative fundraising of $750 million from 2024 to 2026, increasing our AUM to $3 billion by year-end 2026, and generating annualized Platform Revenue of $50 million by year-end 2026. These ambitious targets underscore our commitment to deliver consistent growth and returns to our shareholders over the long term.”
Business Update
The following are key milestones completed both during and subsequent to the fourth quarter ended December 31, 2023.
•On October 13, 2023, Northsight Crossing AZ, LLC, a Caliber co-sponsored single asset syndication, sold Northsight Crossing Retail Center in Scottsdale, Ariz., for $27.4 million, resulting in cash proceeds, net of loan repayment, closing costs and fees, of approximately $12.2 million, a gain on the sale of real estate of approximately $5.0 million, and a loss on the extinguishment of debt of approximately $0.2 million. The property was purchased in January 2022 for $21.1 million.
•On December 28, 2023, the company sold South Ridge, an 80-acre parcel of land in Johnstown, Colo., to Journey Homes for $7.6 million. Caliber purchased the land in September 2021 for $5.38 million as part of its Johnstown Development, an approximately 750-acre master-planned, mixed-use development project.
•As of December 31, 2023, Caliber was actively developing 2,986 multifamily units, 2,386 single family units, 2.8 million square feet of commercial and industrial, and 1.3 million square feet of office and retail.
•On March 7, 2024, CHT acquired the Holiday Inn Newport News located in Newport News, Virginia. This is the first of nine hotel assets included in the previously announced contribution agreement with L.T.D. Hospitality. In total, the portfolio of nine assets represents a contribution value of $224 million, which will bolster Caliber’s AUM, upon transaction closing.
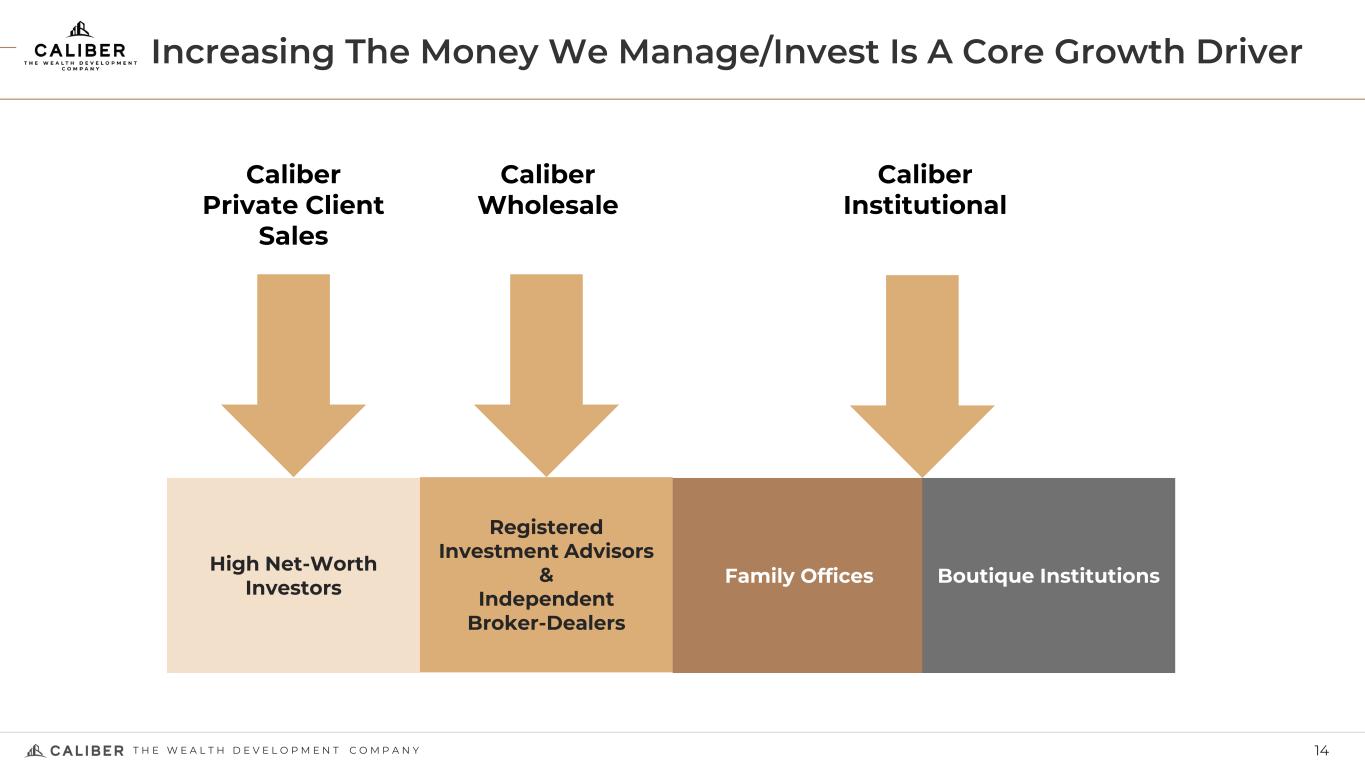
•As of March 27, 2024, Caliber’s new wholesale fundraising team has signed 26 selling agreements with regional broker dealers and registered investment advisors for investments in company-sponsored products. In total, these partners have approximately 381 representatives with $3.4 billion of accessible AUM.
(1) With the evolution and growth of the Company, the Company’s Chief Operating Decision Maker (CODM) assesses performance and resource allocation on an aggregate basis under the Company’s asset management platform, and no longer reviews operating results for development or brokerage activity separately. As such, management concluded that the Company operates through one operating segment, presented as “Platform Results” or “Unconsolidated Results”.
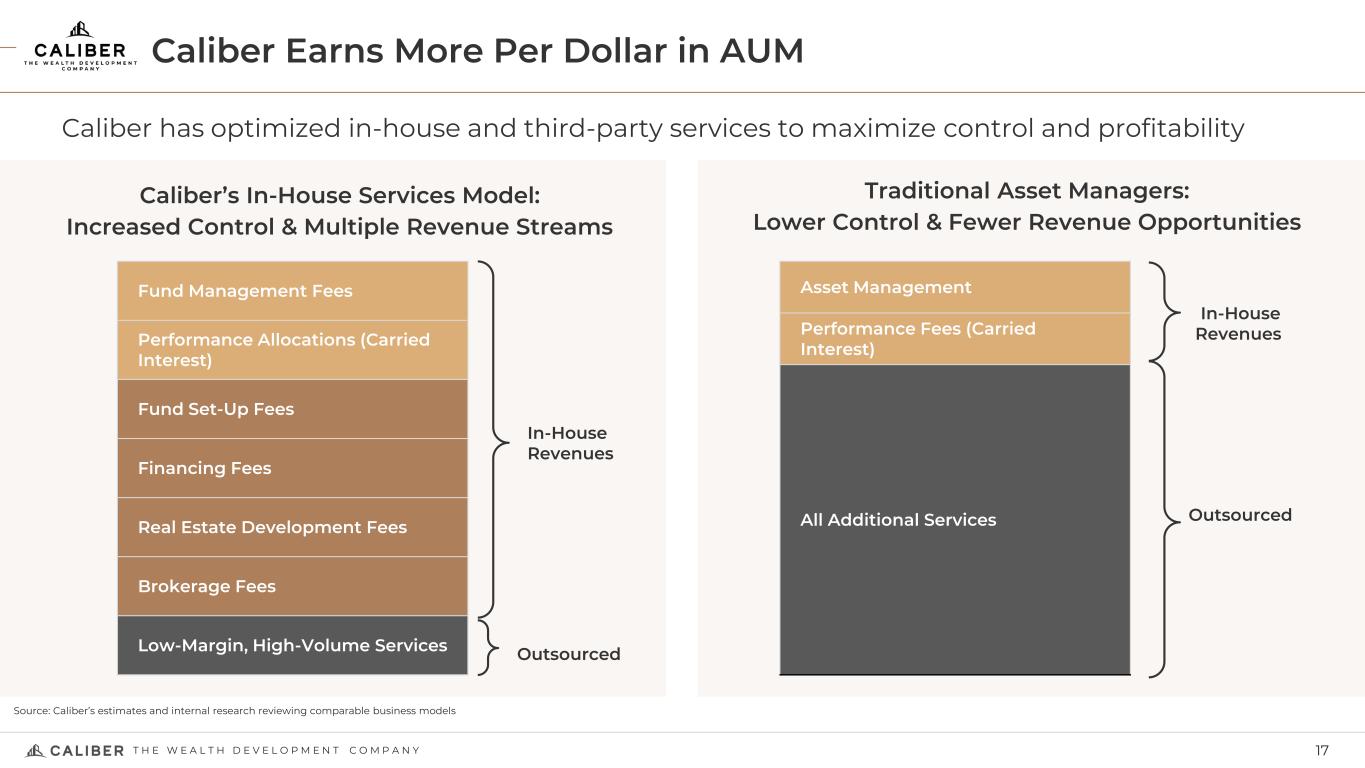
(2) Asset management revenue includes fund set-up fees, fund management fees, financing fees, development and construction fees, and brokerage fees.
(3) Performance allocations are defined as an arrangement in which we are entitled to an allocation of investment returns, generated within the investment funds which we manage, based on a contractual formula.
(4) Caliber Adjusted EBITDA is a non-GAAP financial measure. See “Non-GAAP Financial Measures” below.
(5 ) Fund management fees are generally based on 1.0% to 1.5% of the unreturned capital contributions in a particular fund and include reimbursement for costs incurred on behalf of the fund, including an allocation of certain overhead costs. The Company earns a fund management fee of 0.70% of CHT’s enterprise value and is reimbursed for certain costs incurred on behalf of CHT. Fund management fees are included in asset management revenue.
(6) Fair value assets under management is defined as the aggregate fair value of the real estate assets the Company manages from which it derives management fees, performance revenues and other fees and expense reimbursements as of December 31, 2023.
(7) Managed capital is defined as the total capital raised from investors and invested in our funds, including capital raised from investors in CaliberCos Inc. through corporate note issuances that was further invested in or loaned to our funds. We use this information to monitor, among other things, the amount of ‘preferred return’ that would be paid at the time of a distribution and the potential to earn a performance fee over and above the preferred return at the time of the distribution. Our fund management fees are based on a percentage of managed capital or a percentage of assets under management, and monitoring the change and composition of managed capital provides relevant data points for Caliber management to further calculate and predict future earnings.
Conference Call Information
Caliber will host a conference call today, Monday, April 15, 2024, at 5:00 p.m. Eastern Time (ET) to discuss its fourth quarter and full year 2023 financial results and business outlook. To access this call, dial 1-888-886-7786 (domestic) or 1-416-764-8658 (international) or by clicking on this Call me™ link to request a return call. A live webcast of the conference call will be available via the investor relations section of Caliber’s website under “Financial Results.” The webcast replay of the conference call will be available on Caliber’s website shortly after the call concludes.
About Caliber (CaliberCos Inc.) (NASDAQ: CWD)
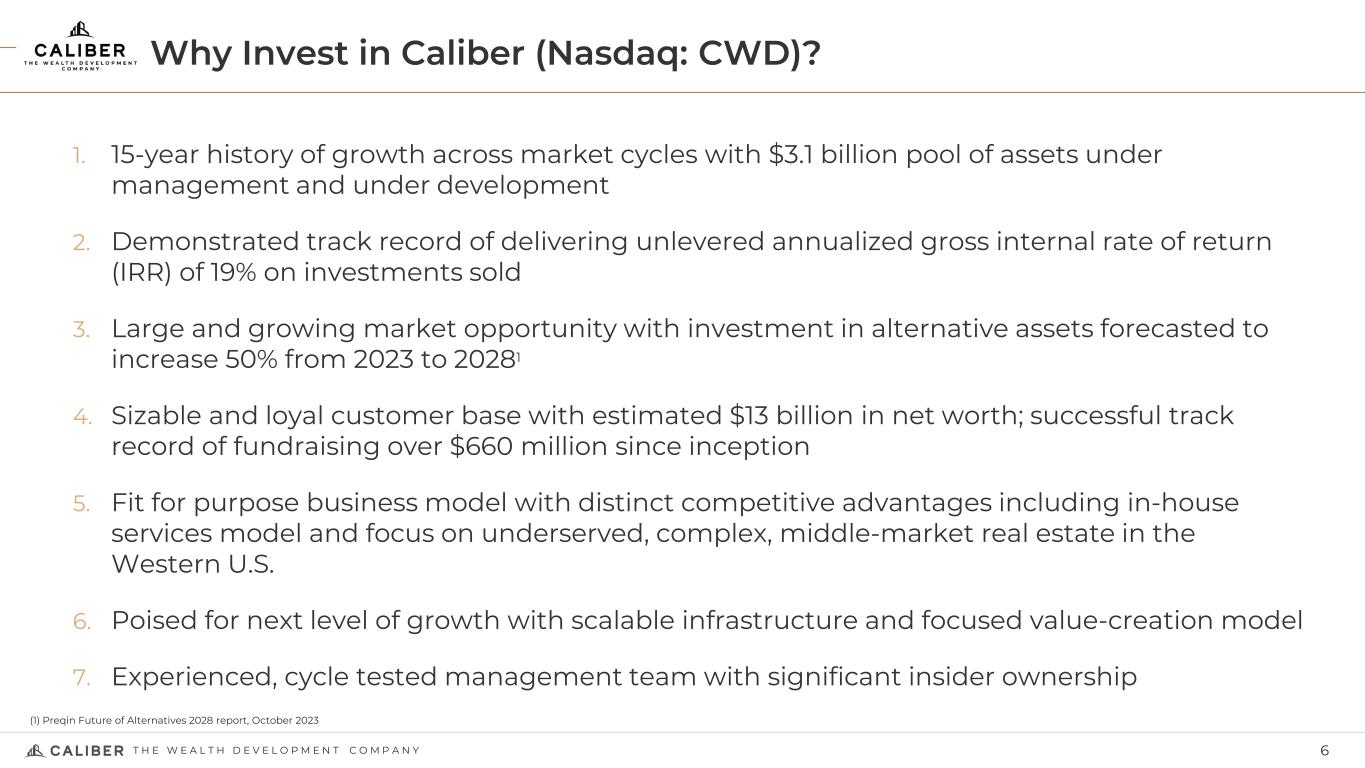
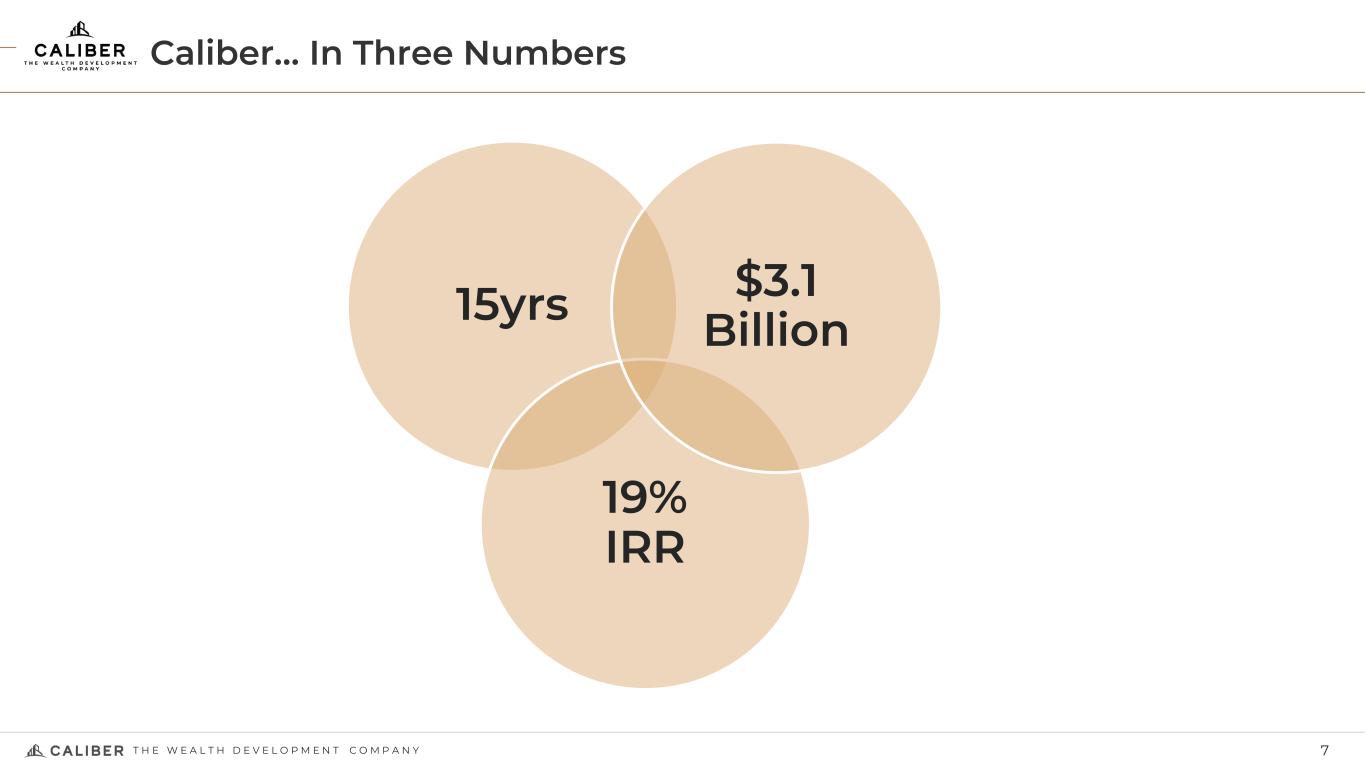
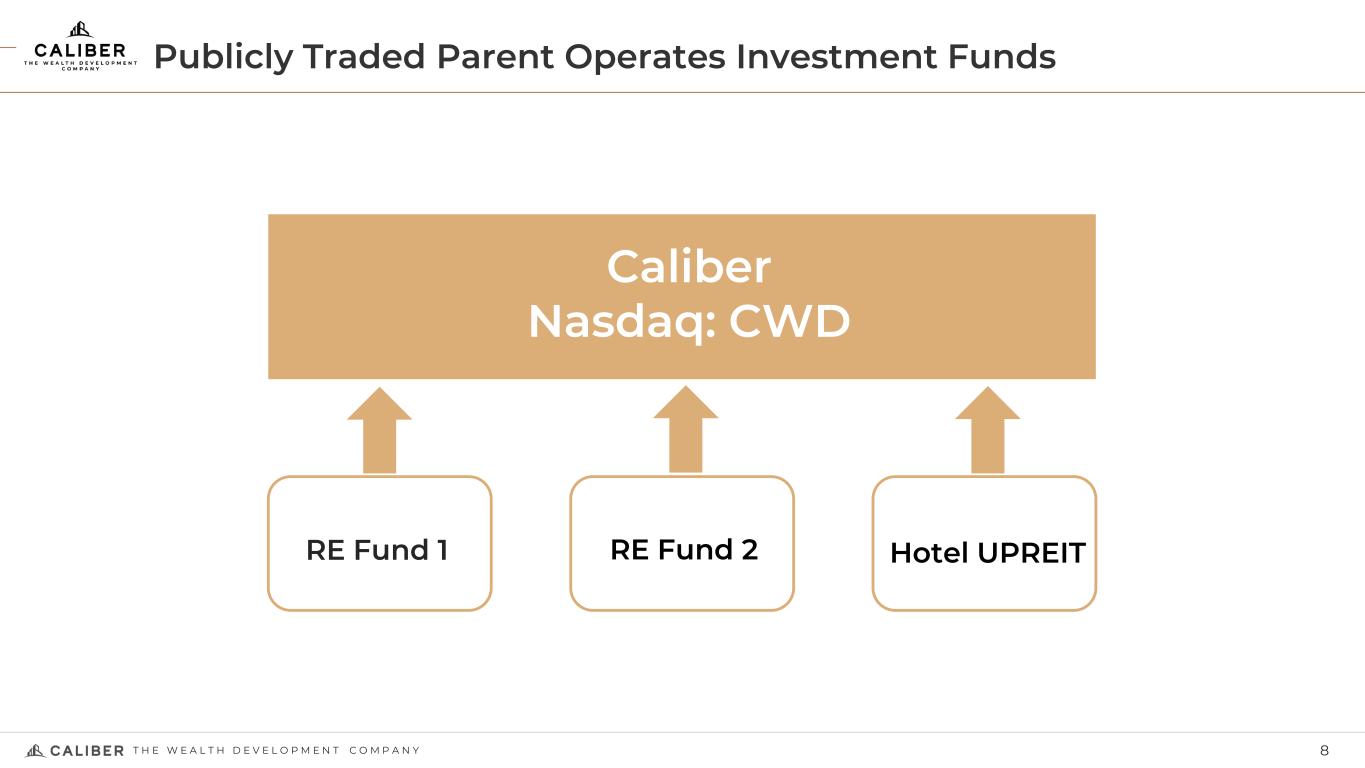
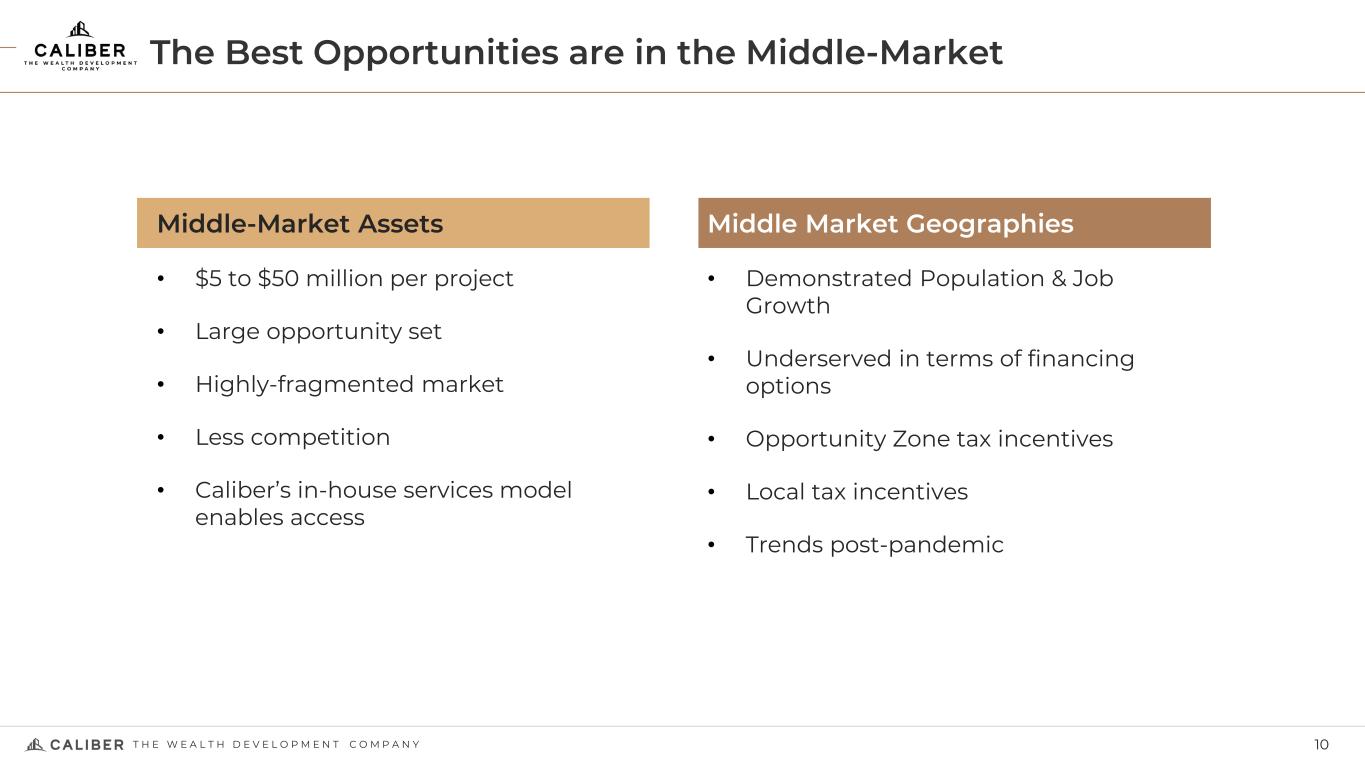
With more than $3.1 billion of managed assets, including estimated costs to complete assets under development, Caliber’s 15-year track record of managing and developing real estate is built on a singular goal: make money in all market conditions. Our growth is fueled by our performance and our competitive advantage: we invest in projects, strategies, and geographies that global real estate institutions do not. Integral to our competitive advantage is our in-house shared services group, which offers Caliber greater control over our real estate and visibility to future investment opportunities. There are multiple ways to participate in Caliber’s success: invest in Nasdaq-listed CaliberCos Inc. and/or invest directly in our Private Funds.
Forward Looking Statements
This press release contains “forward-looking statements” that are subject to substantial risks and uncertainties. All statements, other than statements of historical fact, contained in this press release are forward-looking statements. Forward-looking statements contained in this press release may be identified by the use of words such as “anticipate,” “believe,” “contemplate,” “could,” “estimate,” “expect,” “intend,” “seek,” “may,” “might,” “plan,” “potential,” “predict,” “project,” “target,” “aim,”
“should,” "will” “would,” or the negative of these words or other similar expressions, although not all forward-looking statements contain these words. Forward-looking statements are based on the Company’s current expectations and are subject to inherent uncertainties, risks and assumptions that are difficult to predict. Further, certain forward-looking statements are based on assumptions as to future events that may not prove to be accurate including, but not limited to, the Company’s ability to adequately grow cumulative fundraising, AUM and annualized platform revenue to meet 2026 targeted goals, the closing of the transaction with L.T.D. Hospitality Group LLC and the viability of and ability of the Company to adequately access the real estate and capital markets. These and other risks and uncertainties are described more fully in the section titled “Risk Factors” in the final prospectus related to the Company’s public offering filed with the SEC and other reports filed with the SEC thereafter. Forward-looking statements contained in this announcement are made as of this date, and the Company undertakes no duty to update such information except as required under applicable law.
CONTACTS:
Caliber:
Victoria Rotondo
+1 480-295-7600
Victoria.Rotondo@caliberco.com
Investor Relations:
Lisa Fortuna, Financial Profiles
+1 310-622-8234
ir@caliberco.com
Media Relations:
Kelly McAndrew, Financial Profiles
+1 203-613-1552
KMcAndrew@finprofiles.com
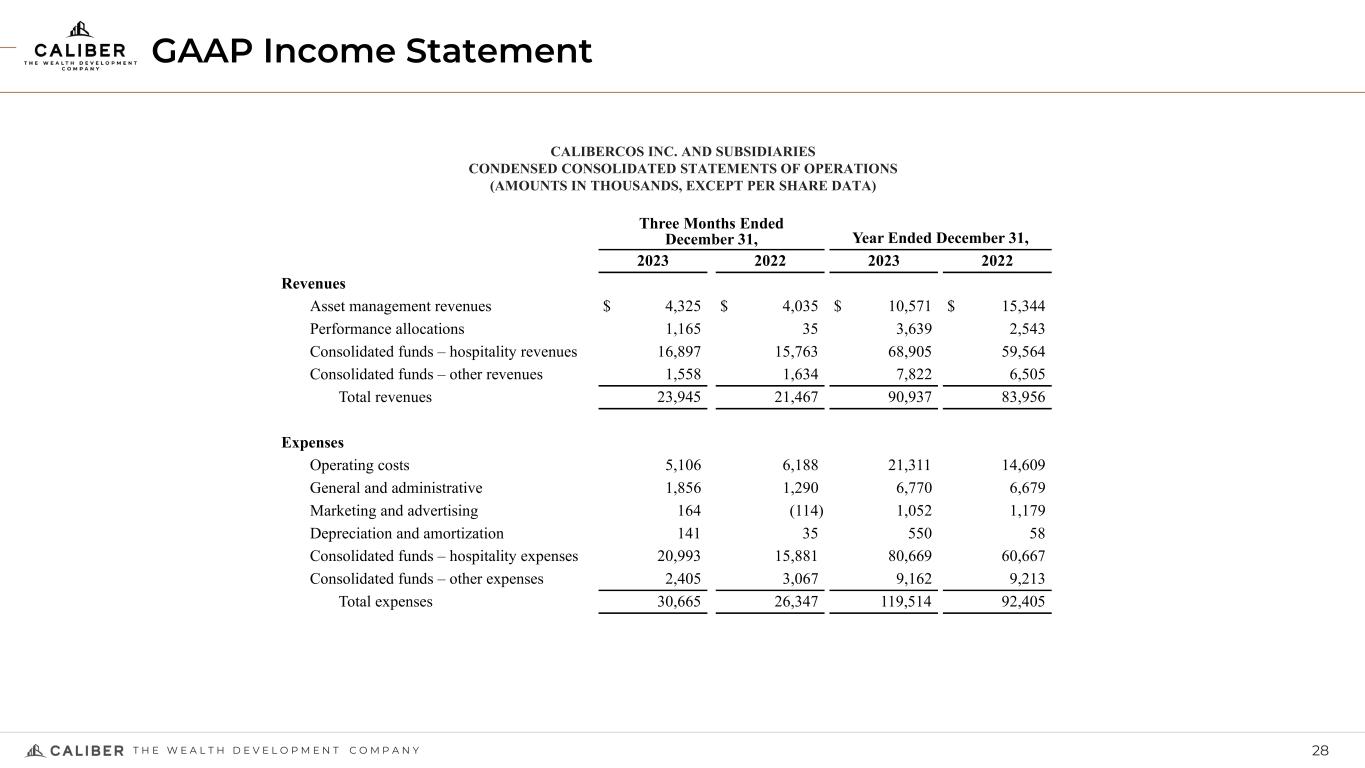
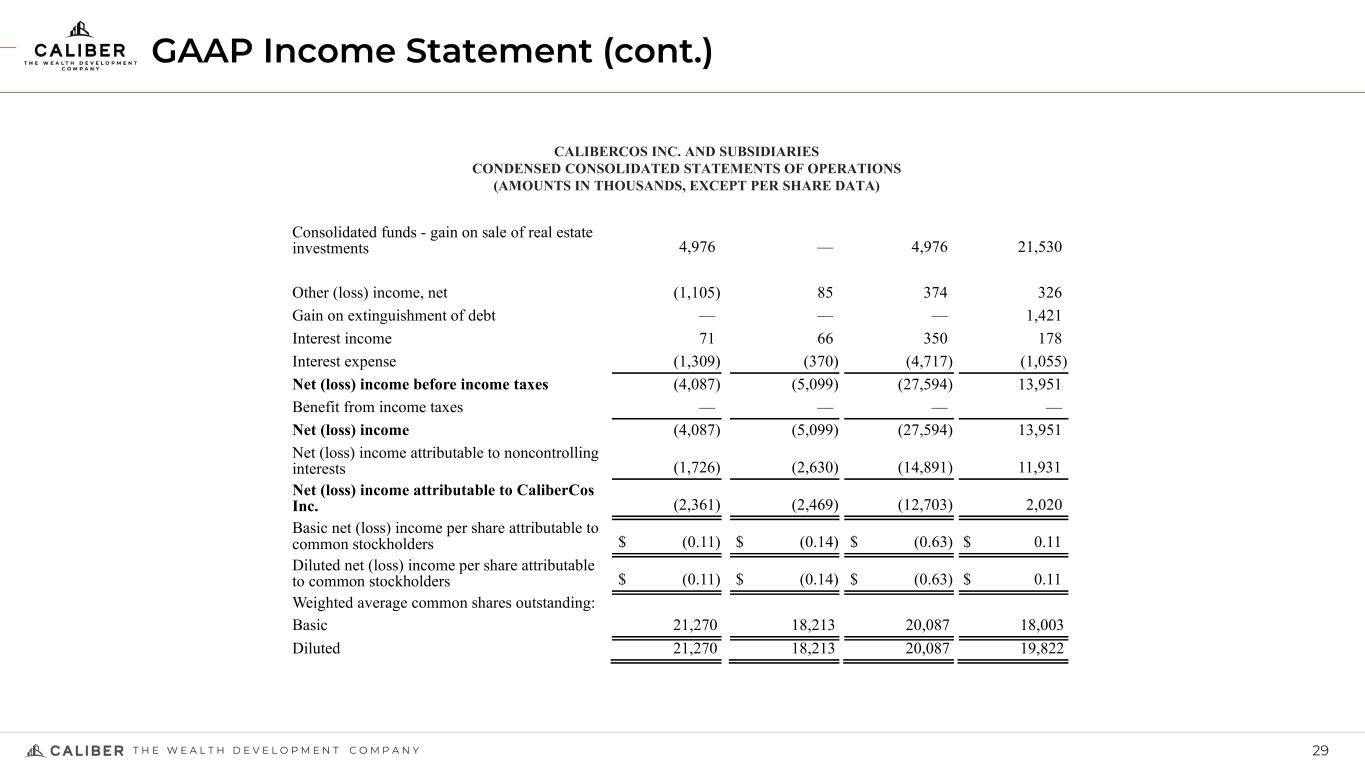
CALIBERCOS INC. AND SUBSIDIARIES
CONDENSED CONSOLIDATED STATEMENTS OF OPERATIONS
(AMOUNTS IN THOUSANDS, EXCEPT PER SHARE DATA)
|
|
|
|
|
|
|
|
|
|
|
|
|
|
|
|
|
|
|
|
|
|
|
|
|
Three Months Ended December 31, |
|
Year Ended December 31, |
|
2023 |
|
2022 |
|
2023 |
|
2022 |
|
(unaudited) |
|
|
| Revenues |
|
|
|
|
|
|
|
| Asset management revenues |
$ |
4,325 |
|
|
$ |
4,035 |
|
|
$ |
10,571 |
|
|
$ |
15,344 |
|
| Performance allocations |
1,165 |
|
|
35 |
|
|
3,639 |
|
|
2,543 |
|
| Consolidated funds – hospitality revenues |
16,897 |
|
|
15,763 |
|
|
68,905 |
|
|
59,564 |
|
| Consolidated funds – other revenues |
1,558 |
|
|
1,634 |
|
|
7,822 |
|
|
6,505 |
|
| Total revenues |
23,945 |
|
|
21,467 |
|
|
90,937 |
|
|
83,956 |
|
|
|
|
|
|
|
|
|
| Expenses |
|
|
|
|
|
|
|
| Operating costs |
5,106 |
|
|
6,188 |
|
|
21,311 |
|
|
14,609 |
|
| General and administrative |
1,856 |
|
|
1,290 |
|
|
6,770 |
|
|
6,679 |
|
| Marketing and advertising |
164 |
|
|
(114) |
|
|
1,052 |
|
|
1,179 |
|
| Depreciation and amortization |
141 |
|
|
35 |
|
|
550 |
|
|
58 |
|
Consolidated funds – hospitality expenses |
20,993 |
|
|
15,881 |
|
|
80,669 |
|
|
60,667 |
|
Consolidated funds – other expenses |
2,405 |
|
|
3,067 |
|
|
9,162 |
|
|
9,213 |
|
| Total expenses |
30,665 |
|
|
26,347 |
|
|
119,514 |
|
|
92,405 |
|
|
|
|
|
|
|
|
|
| Consolidated funds - gain on sale of real estate investments |
4,976 |
|
|
— |
|
|
4,976 |
|
|
21,530 |
|
|
|
|
|
|
|
|
|
| Other (loss) income, net |
(1,105) |
|
|
85 |
|
|
374 |
|
|
326 |
|
| Gain on extinguishment of debt |
— |
|
|
— |
|
|
— |
|
|
1,421 |
|
| Interest income |
71 |
|
|
66 |
|
|
350 |
|
|
178 |
|
| Interest expense |
(1,309) |
|
|
(370) |
|
|
(4,717) |
|
|
(1,055) |
|
| Net (loss) income before income taxes |
(4,087) |
|
|
(5,099) |
|
|
(27,594) |
|
|
13,951 |
|
| Benefit from income taxes |
— |
|
|
— |
|
|
— |
|
|
— |
|
| Net (loss) income |
(4,087) |
|
|
(5,099) |
|
|
(27,594) |
|
|
13,951 |
|
| Net (loss) income attributable to noncontrolling interests |
(1,726) |
|
|
(2,630) |
|
|
(14,891) |
|
|
11,931 |
|
| Net (loss) income attributable to CaliberCos Inc. |
(2,361) |
|
|
(2,469) |
|
|
(12,703) |
|
|
2,020 |
|
| Basic net (loss) income per share attributable to common stockholders |
$ |
(0.11) |
|
|
$ |
(0.14) |
|
|
$ |
(0.63) |
|
|
$ |
0.11 |
|
| Diluted net (loss) income per share attributable to common stockholders |
$ |
(0.11) |
|
|
$ |
(0.14) |
|
|
$ |
(0.63) |
|
|
$ |
0.11 |
|
| Weighted average common shares outstanding: |
|
|
|
|
|
|
|
| Basic |
21,270 |
|
18,213 |
|
20,087 |
|
18,003 |
| Diluted |
21,270 |
|
18,213 |
|
20,087 |
|
19,822 |
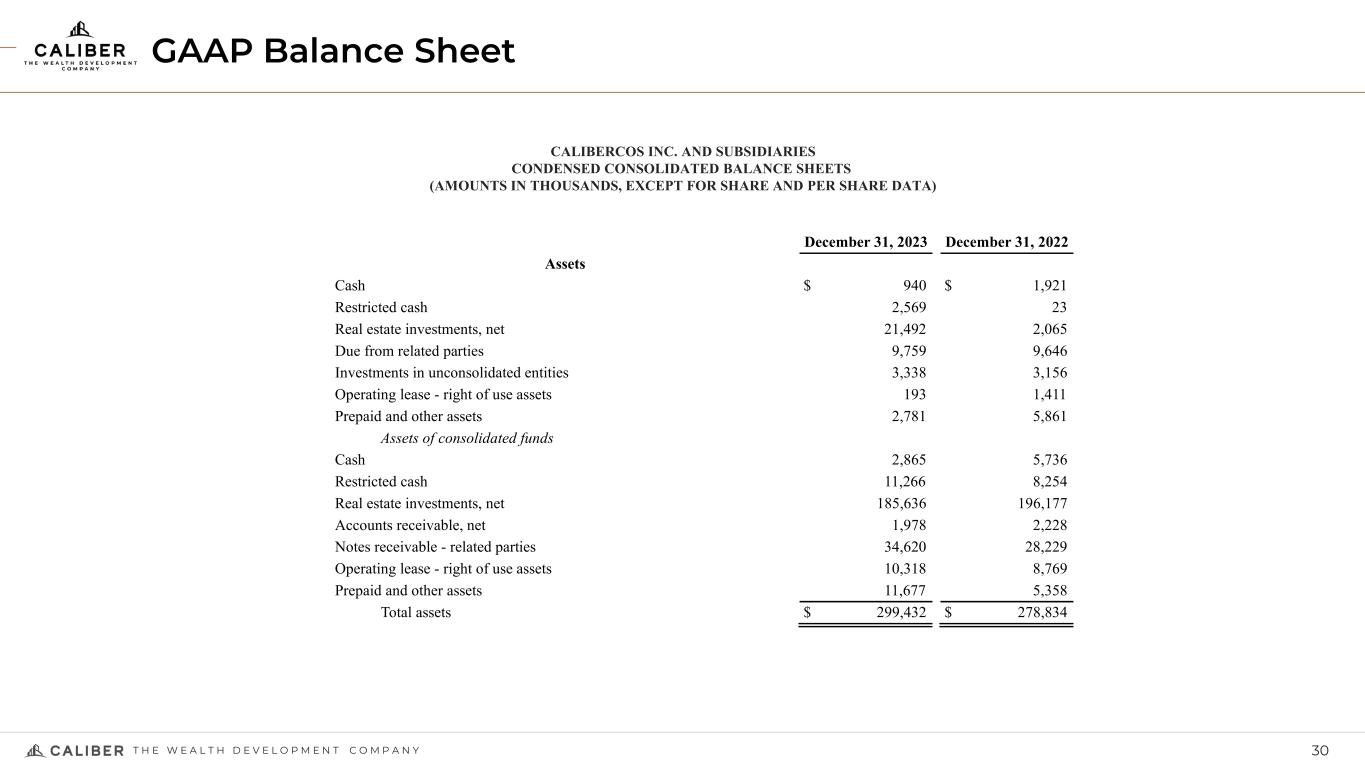
CALIBERCOS INC. AND SUBSIDIARIES
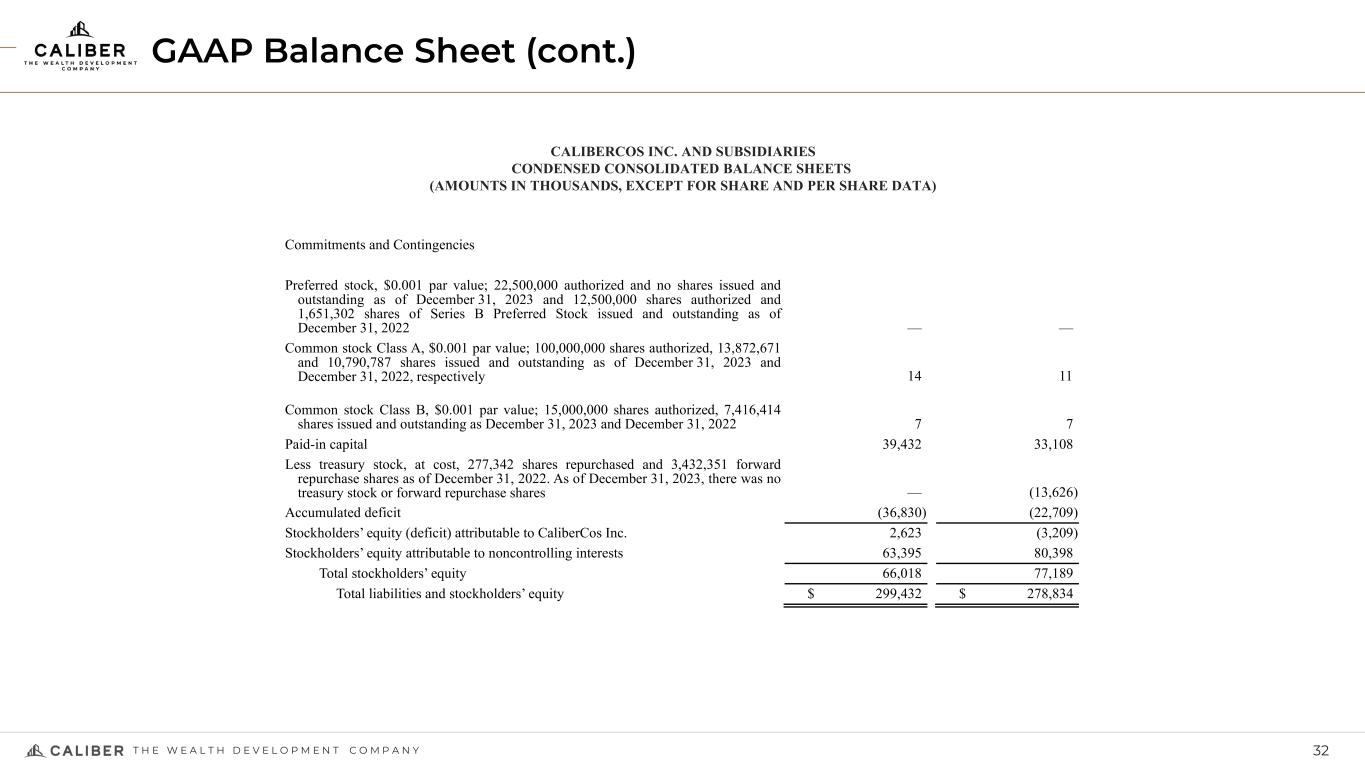
CONDENSED CONSOLIDATED BALANCE SHEETS
(AMOUNTS IN THOUSANDS, EXCEPT FOR SHARE AND PER SHARE DATA)
|
|
|
|
|
|
|
|
|
|
|
|
|
December 31, 2023 |
|
December 31, 2022 |
| Assets |
|
|
|
| Cash |
$ |
940 |
|
|
$ |
1,921 |
|
| Restricted cash |
2,569 |
|
|
23 |
|
| Real estate investments, net |
21,492 |
|
|
2,065 |
|
|
|
|
|
| Due from related parties |
9,759 |
|
|
9,646 |
|
| Investments in unconsolidated entities |
3,338 |
|
|
3,156 |
|
| Operating lease - right of use assets |
193 |
|
|
1,411 |
|
|
|
|
|
| Prepaid and other assets |
2,781 |
|
|
5,861 |
|
Assets of consolidated funds |
|
|
|
| Cash |
2,865 |
|
|
5,736 |
|
| Restricted cash |
11,266 |
|
|
8,254 |
|
| Real estate investments, net |
185,636 |
|
|
196,177 |
|
|
|
|
|
| Accounts receivable, net |
1,978 |
|
|
2,228 |
|
| Notes receivable - related parties |
34,620 |
|
|
28,229 |
|
|
|
|
|
| Operating lease - right of use assets |
10,318 |
|
|
8,769 |
|
|
|
|
|
| Prepaid and other assets |
11,677 |
|
|
5,358 |
|
Total assets |
$ |
299,432 |
|
|
$ |
278,834 |
|
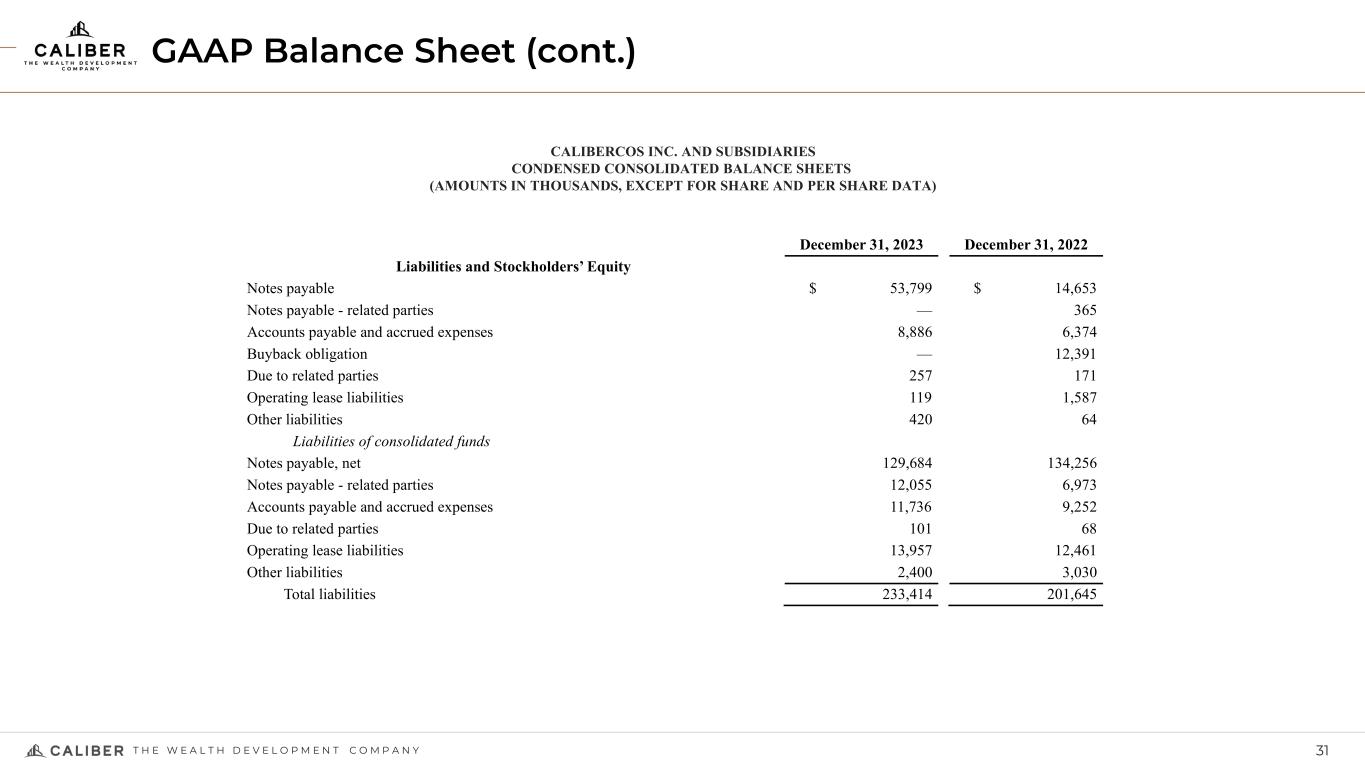
CALIBERCOS INC. AND SUBSIDIARIES
CONDENSED CONSOLIDATED BALANCE SHEETS
(AMOUNTS IN THOUSANDS, EXCEPT FOR SHARE AND PER SHARE DATA)
|
|
|
|
|
|
|
|
|
|
|
|
|
|
|
|
December 31, 2023 |
|
December 31, 2022 |
|
| Liabilities and Stockholders’ Equity |
|
|
|
|
| Notes payable |
$ |
53,799 |
|
|
$ |
14,653 |
|
|
| Notes payable - related parties |
— |
|
|
365 |
|
|
| Accounts payable and accrued expenses |
8,886 |
|
|
6,374 |
|
|
| Buyback obligation |
— |
|
|
12,391 |
|
|
| Due to related parties |
257 |
|
|
171 |
|
|
| Operating lease liabilities |
119 |
|
|
1,587 |
|
|
|
|
|
|
|
| Other liabilities |
420 |
|
|
64 |
|
|
| Liabilities of consolidated funds |
|
|
|
|
| Notes payable, net |
129,684 |
|
|
134,256 |
|
|
| Notes payable - related parties |
12,055 |
|
|
6,973 |
|
|
| Accounts payable and accrued expenses |
11,736 |
|
|
9,252 |
|
|
| Due to related parties |
101 |
|
|
68 |
|
|
| Operating lease liabilities |
13,957 |
|
|
12,461 |
|
|
|
|
|
|
|
| Other liabilities |
2,400 |
|
|
3,030 |
|
|
| Total liabilities |
233,414 |
|
|
201,645 |
|
|
|
|
|
|
|
| Commitments and Contingencies |
|
|
|
|
|
|
|
|
|
Preferred stock, $0.001 par value; 22,500,000 authorized and no shares issued and outstanding as of December 31, 2023 and 12,500,000 shares authorized and 1,651,302 shares of Series B Preferred Stock issued and outstanding as of December 31, 2022 |
— |
|
|
— |
|
|
Common stock Class A, $0.001 par value; 100,000,000 shares authorized, 13,872,671 and 10,790,787 shares issued and outstanding as of December 31, 2023 and December 31, 2022, respectively |
14 |
|
|
11 |
|
|
Common stock Class B, $0.001 par value; 15,000,000 shares authorized, 7,416,414 shares issued and outstanding as December 31, 2023 and December 31, 2022 |
7 |
|
|
7 |
|
|
| Paid-in capital |
39,432 |
|
|
33,108 |
|
|
Less treasury stock, at cost, 277,342 shares repurchased and 3,432,351 forward repurchase shares as of December 31, 2022. As of December 31, 2023, there was no treasury stock or forward repurchase shares |
— |
|
|
(13,626) |
|
|
| Accumulated deficit |
(36,830) |
|
|
(22,709) |
|
|
| Stockholders’ equity (deficit) attributable to CaliberCos Inc. |
2,623 |
|
|
(3,209) |
|
|
| Stockholders’ equity attributable to noncontrolling interests |
63,395 |
|
|
80,398 |
|
|
| Total stockholders’ equity |
66,018 |
|
|
77,189 |
|
|
| Total liabilities and stockholders’ equity |
$ |
299,432 |
|
|
$ |
278,834 |
|
|
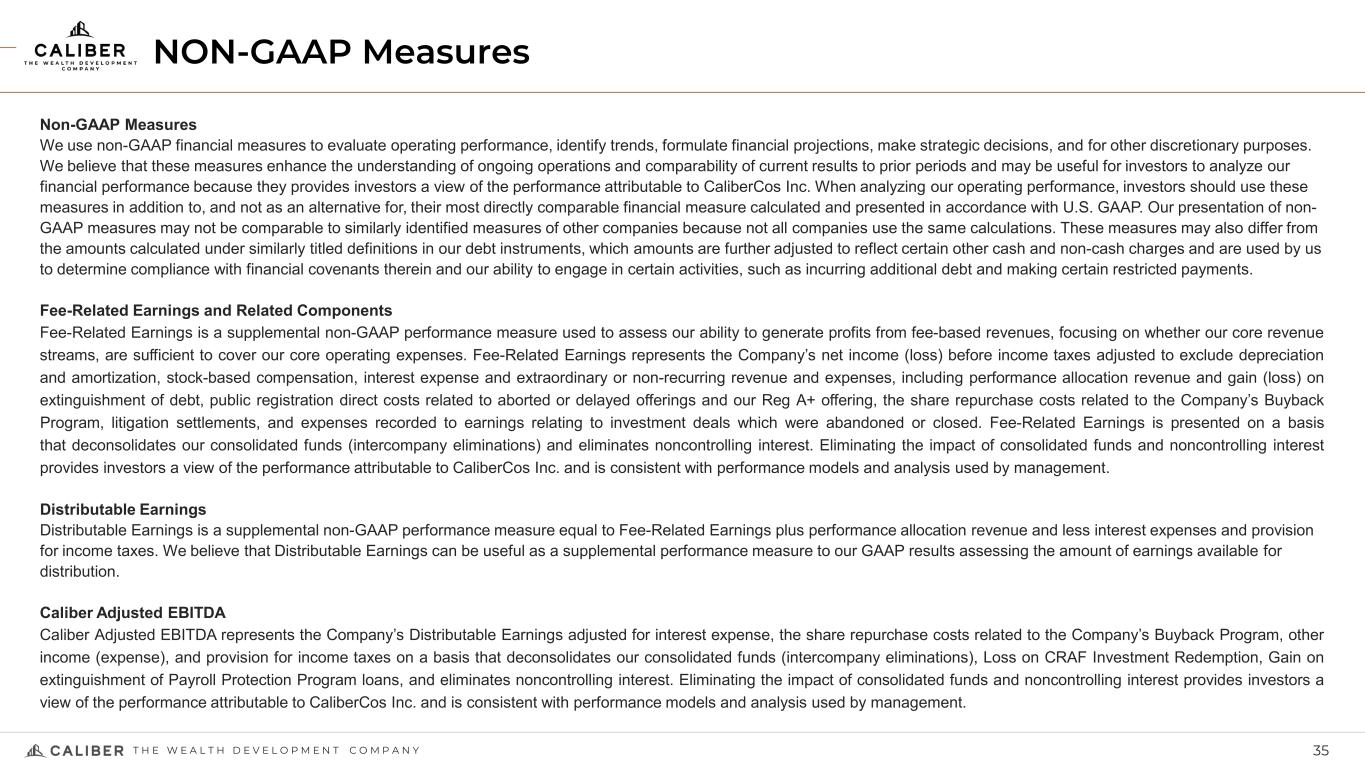
Non-GAAP Measures
We use non-GAAP financial measures to evaluate operating performance, identify trends, formulate financial projections, make strategic decisions, and for other discretionary purposes. We believe that these measures enhance the understanding of ongoing operations and comparability of current results to prior periods and may be useful for investors to analyze our financial performance because they provides investors a view of the performance attributable to CaliberCos Inc. When analyzing our operating performance, investors should use these measures in addition to, and not as an alternative for, their most directly comparable financial measure calculated and presented in accordance with U.S. GAAP. Our presentation of non-GAAP measures may not be comparable to similarly identified measures of other companies because not all companies use the same calculations. These measures may also differ from the amounts calculated under similarly titled definitions in our debt instruments, which amounts are further adjusted to reflect certain other cash and non-cash charges and are used by us to determine compliance with financial covenants therein and our ability to engage in certain activities, such as incurring additional debt and making certain restricted payments.
Fee-Related Earnings and Related Components
Fee-Related Earnings is a supplemental non-GAAP performance measure used to assess our ability to generate profits from fee-based revenues, focusing on whether our core revenue streams, are sufficient to cover our core operating expenses. Fee- Related Earnings represents the Company’s net income (loss) before income taxes adjusted to exclude depreciation and amortization, stock-based compensation, interest expense and extraordinary or non-recurring revenue and expenses, including performance allocation revenue and gain (loss) on extinguishment of debt, public registration direct costs related to aborted or delayed offerings and our Reg A+ offering, the share repurchase costs related to the Company’s Buyback Program, litigation settlements, and expenses recorded to earnings relating to investment deals which were abandoned or closed. Fee-Related Earnings is presented on a basis that deconsolidates our consolidated funds (intercompany eliminations) and eliminates noncontrolling interest. Eliminating the impact of consolidated funds and noncontrolling interest provides investors a view of the performance attributable to CaliberCos Inc. and is consistent with performance models and analysis used by management.
Distributable Earnings
Distributable Earnings is a supplemental non-GAAP performance measure equal to Fee-Related Earnings plus performance allocation revenue and less interest expenses and provision for income taxes. We believe that Distributable Earnings can be useful as a supplemental performance measure to our GAAP results assessing the amount of earnings available for distribution.
Caliber Adjusted EBITDA
Caliber Adjusted EBITDA represents the Company’s Distributable Earnings adjusted for interest expense, the share repurchase costs related to the Company’s Buyback Program, other income (expense), and provision for income taxes on a basis that deconsolidates our consolidated funds (intercompany eliminations), Loss on CRAF Investment Redemption, Gain on extinguishment of Payroll Protection Program loans, and eliminates noncontrolling interest. Eliminating the impact of consolidated funds and noncontrolling interest provides investors a view of the performance attributable to CaliberCos Inc. and is consistent with performance models and analysis used by management.
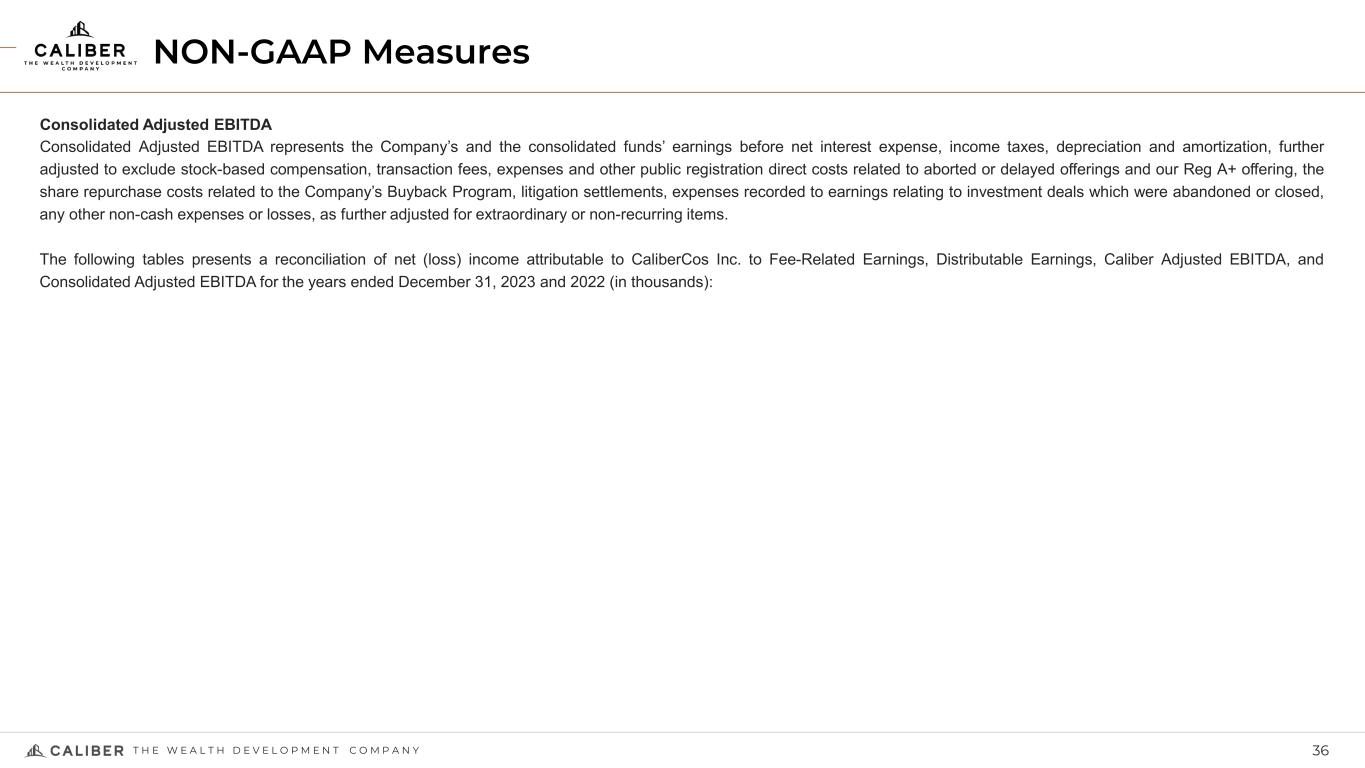
Consolidated Adjusted EBITDA
Consolidated Adjusted EBITDA represents the Company’s and the consolidated funds’ earnings before net interest expense, income taxes, depreciation and amortization, further adjusted to exclude stock-based compensation, transaction fees, expenses and other public registration direct costs related to aborted or delayed offerings and our Reg A+ offering, the share repurchase costs related to the Company’s Buyback Program, litigation settlements, expenses recorded to earnings relating to investment deals which were abandoned or closed, any other non-cash expenses or losses, as further adjusted for extraordinary or non-recurring items.
NON-GAAP RECONCILIATIONS
(AMOUNTS IN THOUSANDS) (UNAUDITED)
|
|
|
|
|
|
|
|
|
|
|
|
|
|
|
|
|
|
|
|
|
|
|
|
|
Three Months Ended December 31, |
|
Years Ended December 31, |
| 2023 |
|
2022 |
|
2023 |
|
2022 |
| Net income (loss) attributable to CaliberCos Inc. |
$ |
(2,361) |
|
|
$ |
(2,469) |
|
|
$ |
(12,703) |
|
|
$ |
2,020 |
|
| Net income (loss) attributable to noncontrolling interests |
(1,726) |
|
|
(2,630) |
|
|
(14,891) |
|
|
11,931 |
|
| Net income (loss) |
(4,087) |
|
|
(5,099) |
|
|
(27,594) |
|
|
13,951 |
|
| Provision for income taxes |
— |
|
|
— |
|
|
— |
|
|
— |
|
| Net income (loss) before income taxes |
(4,087) |
|
|
(5,099) |
|
|
(27,594) |
|
|
13,951 |
|
| Depreciation and amortization |
142 |
|
|
21 |
|
|
551 |
|
|
58 |
|
| Consolidated funds' impact on fee-related earnings |
1,552 |
|
|
2,865 |
|
|
14,020 |
|
|
(11,551) |
|
| Stock-based compensation |
709 |
|
|
89 |
|
|
3,726 |
|
|
460 |
|
| Severance |
— |
|
|
— |
|
|
19 |
|
|
— |
|
| Legal costs |
— |
|
|
— |
|
|
— |
|
|
525 |
|
| Public registration costs |
— |
|
|
— |
|
|
— |
|
|
779 |
|
| Performance allocations |
(1,165) |
|
|
(35) |
|
|
(3,639) |
|
|
(2,543) |
|
| Other expenses (income), net |
1,105 |
|
|
(85) |
|
|
(374) |
|
|
(326) |
|
| Gain on extinguishment of debt |
— |
|
|
— |
|
|
— |
|
|
(1,421) |
|
| Interest expense, net |
1,238 |
|
|
304 |
|
|
4,367 |
|
|
877 |
|
| Fee-related earnings |
(506) |
|
|
(1,940) |
|
|
(8,924) |
|
|
809 |
|
| Performance allocations |
1,165 |
|
|
35 |
|
|
3,639 |
|
|
2,543 |
|
| Interest expense, net |
(1,238) |
|
|
(304) |
|
|
(4,367) |
|
|
(877) |
|
| Provision for income taxes |
— |
|
|
— |
|
|
— |
|
|
— |
|
| Distributable earnings |
(579) |
|
|
(2,209) |
|
|
(9,652) |
|
|
2,475 |
|
| Interest expense |
1,309 |
|
|
370 |
|
|
4,717 |
|
|
1,055 |
|
| Share buy-back |
— |
|
|
78 |
|
|
183 |
|
|
313 |
|
| Other expenses (income), net |
(1,105) |
|
|
85 |
|
|
374 |
|
|
326 |
|
| Provision for income taxes |
— |
|
|
— |
|
|
— |
|
|
— |
|
| Loss on CRAF Investment Redemption |
1,339 |
|
|
— |
|
|
1,339 |
|
|
— |
|
| Gain on extinguishment of PPP loans |
— |
|
|
— |
|
|
— |
|
|
1,421 |
|
| Consolidated funds' impact on Caliber adjusted EBITDA |
589 |
|
|
(90) |
|
|
1,788 |
|
|
(71) |
|
| Caliber adjusted EBITDA |
1,553 |
|
|
(1,766) |
|
|
(1,251) |
|
|
5,519 |
|
| Consolidated funds' EBITDA adjustments |
4,944 |
|
|
2,382 |
|
|
11,419 |
|
|
31,220 |
|
| Consolidated adjusted EBITDA |
$ |
6,497 |
|
|
$ |
616 |
|
|
$ |
10,168 |
|
|
$ |
36,739 |
|
ASSET MANAGEMENT PLATFORM SEGMENT(1)
(AMOUNTS IN THOUSANDS) (UNAUDITED)
|
|
|
|
|
|
|
|
|
|
|
|
|
|
|
|
|
|
|
|
|
|
|
|
|
|
|
|
|
|
|
|
|
|
|
|
|
Year Ended December 31, 2023 |
|
Year Ended December 31, 2022 |
|
Unconsolidated (Wholly - Owned |
|
Impact of Consolidated Fund and Eliminations |
|
Consolidated |
|
Unconsolidated (Wholly - Owned |
|
Impact of Consolidated Fund and Eliminations |
|
Consolidated |
| Revenues |
|
|
|
|
|
|
|
|
|
|
|
| Asset management |
$ |
16,982 |
|
|
$ |
(6,411) |
|
|
$ |
10,571 |
|
|
$ |
21,575 |
|
|
$ |
(6,231) |
|
|
$ |
15,344 |
|
| Performance allocations |
3,656 |
|
|
(17) |
|
|
3,639 |
|
|
2,543 |
|
|
— |
|
|
2,543 |
|
| Consolidated funds – hospitality revenue |
— |
|
|
68,905 |
|
|
68,905 |
|
|
— |
|
|
59,564 |
|
|
59,564 |
|
| Consolidated funds – other revenue |
— |
|
|
7,822 |
|
|
7,822 |
|
|
— |
|
|
6,505 |
|
|
6,505 |
|
| Total revenues |
20,638 |
|
|
70,299 |
|
|
90,937 |
|
|
24,118 |
|
|
59,838 |
|
|
83,956 |
|
| Expenses |
|
|
|
|
|
|
|
|
|
|
|
| Operating costs |
21,808 |
|
|
(497) |
|
|
21,311 |
|
|
14,609 |
|
|
— |
|
|
14,609 |
|
| General and administrative |
6,807 |
|
|
(37) |
|
|
6,770 |
|
|
6,742 |
|
|
(63) |
|
|
6,679 |
|
| Marketing and advertising |
1,053 |
|
|
(1) |
|
|
1,052 |
|
|
1,179 |
|
|
— |
|
|
1,179 |
|
| Depreciation and amortization |
551 |
|
|
(1) |
|
|
550 |
|
|
44 |
|
|
14 |
|
|
58 |
|
| Consolidated funds – hospitality expenses |
— |
|
|
80,669 |
|
|
80,669 |
|
|
— |
|
|
60,667 |
|
|
60,667 |
|
| Consolidated funds – other expenses |
— |
|
|
9,162 |
|
|
9,162 |
|
|
— |
|
|
9,213 |
|
|
9,213 |
|
| Total expenses |
30,219 |
|
|
89,295 |
|
|
119,514 |
|
|
22,574 |
|
|
69,831 |
|
|
92,405 |
|
|
|
|
|
|
|
|
|
|
|
|
|
| Consolidated funds - other - gain on sale of real estate investments |
— |
|
|
4,976 |
|
|
4,976 |
|
|
— |
|
|
21,530 |
|
|
21,530 |
|
|
|
|
|
|
|
|
|
|
|
|
|
| Other income (expenses), net |
649 |
|
|
(275) |
|
|
374 |
|
|
256 |
|
|
70 |
|
|
326 |
|
| Interest income |
1,863 |
|
|
(1,513) |
|
|
350 |
|
|
177 |
|
|
1 |
|
|
178 |
|
| Interest expense |
(4,716) |
|
|
(1) |
|
|
(4,717) |
|
|
(1,056) |
|
|
1 |
|
|
(1,055) |
|
| Gain on extinguishment of debt |
— |
|
|
— |
|
|
— |
|
|
1,421 |
|
|
— |
|
|
1,421 |
|
| Net (loss) income |
$ |
(11,785) |
|
|
$ |
(15,809) |
|
|
$ |
(27,594) |
|
|
$ |
2,342 |
|
|
$ |
11,609 |
|
|
$ |
13,951 |
|
___________________________________________
(1) Represents the results of our asset management platform segment, which are presented on a basis that deconsolidates our consolidated funds (intercompany eliminations) and eliminate noncontrolling interest.
ASSET MANAGEMENT PLATFORM SEGMENT(1)
(AMOUNTS IN THOUSANDS) (UNAUDITED)
|
|
|
|
|
|
|
|
|
|
|
|
|
|
|
|
|
Three Months Ended December 31, |
|
|
|
|
|
2023 |
|
2022 |
|
|
|
|
| Revenues |
|
|
|
|
|
|
|
| Asset management fees |
$ |
6,005 |
|
|
$ |
5,387 |
|
|
|
|
|
| Performance allocations |
1,182 |
|
|
35 |
|
|
|
|
|
| Consolidated funds – hospitality revenue |
— |
|
|
— |
|
|
|
|
|
| Consolidated funds – other revenue |
— |
|
|
— |
|
|
|
|
|
| Total revenues |
7,187 |
|
|
5,422 |
|
|
|
|
|
| Expenses |
|
|
|
|
|
|
|
| Operating costs |
5,314 |
|
|
6,168 |
|
|
|
|
|
| General and administrative |
1,865 |
|
|
1,362 |
|
|
|
|
|
| Marketing and advertising |
165 |
|
|
(114) |
|
|
|
|
|
| Depreciation and amortization |
34 |
|
|
21 |
|
|
|
|
|
| Consolidated funds – hospitality expenses |
— |
|
|
— |
|
|
|
|
|
| Consolidated funds – other expenses |
— |
|
|
— |
|
|
|
|
|
| Total expenses |
7,378 |
|
|
7,437 |
|
|
|
|
|
|
|
|
|
|
|
|
|
| Consolidated funds - gain on sale of real estate investments |
— |
|
|
— |
|
|
|
|
|
|
|
|
|
|
|
|
|
| Other income (expenses), net |
(830) |
|
|
4 |
|
|
|
|
|
| Interest income |
383 |
|
|
65 |
|
|
|
|
|
| Interest expense |
(1,307) |
|
|
(370) |
|
|
|
|
|
| Gain on extinguishment of debt |
— |
|
|
— |
|
|
|
|
|
| Net income |
$ |
(1,945) |
|
|
$ |
(2,316) |
|
|
|
|
|
___________________________________________
(1) Represents the results of our asset management platform segment, which are presented on a basis that deconsolidates our consolidated funds (intercompany eliminations) and eliminate noncontrolling interest.
REVENUE(1)
(AMOUNTS IN THOUSANDS) (UNAUDITED)
|
|
|
|
|
|
|
|
|
|
|
|
|
|
|
|
|
Years Ended December 31, |
|
|
|
|
|
2023 |
|
2022 |
|
|
|
|
| Fund set-up fees |
$ |
523 |
|
|
$ |
6,160 |
|
|
|
|
|
| Fund management fees |
9,597 |
|
|
8,347 |
|
|
|
|
|
| Financing fees |
629 |
|
|
1,128 |
|
|
|
|
|
| Development and construction fees |
4,984 |
|
|
3,492 |
|
|
|
|
|
| Brokerage fees |
1,249 |
|
|
2,448 |
|
|
|
|
|
| Total asset management |
16,982 |
|
|
21,575 |
|
|
|
|
|
| Performance allocations |
3,656 |
|
|
2,543 |
|
|
|
|
|
| Total revenue |
$ |
20,638 |
|
|
$ |
24,118 |
|
|
|
|
|
___________________________________________
(1) Represents the results of our asset management platform segment, which are presented on a basis that deconsolidates our consolidated funds (intercompany eliminations) and eliminate noncontrolling interest.
FV AUM
(AMOUNTS IN THOUSANDS) (UNAUDITED)
|
|
|
|
|
|
|
|
|
|
|
|
| Balances as of December 31, 2022 |
$ |
745,514 |
|
|
|
Assets acquired(1) |
29,384 |
|
|
|
| Construction and net market depreciation |
9,129 |
|
|
|
Asset sold or disposed(2) |
(52,710) |
|
|
|
Credit(3) |
9,822 |
|
|
|
Other(4) |
51 |
|
|
|
| Balances as of December 31, 2023 |
$ |
741,190 |
|
|
|
|
|
|
|
|
December 31, |
|
2023 |
|
2022 |
| Real Estate |
|
|
|
| Hospitality |
$ |
268,800 |
|
|
$ |
319,300 |
|
| Residential |
$ |
138,000 |
|
|
$ |
86,900 |
|
| Commercial |
$ |
240,400 |
|
|
$ |
255,197 |
|
| Total Real Estate |
$ |
647,200 |
|
|
$ |
661,397 |
|
Credit(1) |
$ |
84,588 |
|
|
$ |
74,766 |
|
Other(2) |
$ |
9,402 |
|
|
$ |
9,351 |
|
| Total |
$ |
741,190 |
|
|
$ |
745,514 |
|
___________________________________________
(1) Assets acquired during the year ended December 31, 2023 include one development asset in Colorado, our headquarters office building, and two multi-family residential assets in Arizona
(2) Assets sold during the year ended December 31, 2023 include lot sales related to a development asset in Colorado, nine homes from our residential fund, and one commercial asset in Arizona
(3) Credit FV AUM represents loans made to Caliber’s investment funds by our diversified credit fund
(4) Other FV AUM represents undeployed capital held in our diversified funds (1) Other represents the inclusion of an investment of one of our funds upon the completion of an equity swap during the year ended December 31, 2023.
MANAGED CAPITAL
(AMOUNTS IN THOUSANDS) (UNAUDITED)
|
|
|
|
|
|
|
|
|
|
|
|
|
|
|
Managed Capital |
| Balances as of December 31, 2022 |
|
|
$ |
383,189 |
|
|
|
|
|
|
|
|
|
|
|
|
|
|
|
|
|
|
|
|
|
|
|
|
|
|
|
|
|
|
|
|
|
|
|
|
|
| Originations |
|
|
74,857 |
|
| Redemptions |
|
|
(22,962) |
|
Other(1) |
|
|
2,541 |
|
| Balances as of December 31, 2023 |
|
|
$ |
437,625 |
|
|
|
|
|
|
|
|
|
|
December 31, 2023 |
|
December 31, 2022 |
| Real Estate |
|
|
|
| Hospitality |
$ |
114,407 |
|
|
$ |
102,071 |
|
| Residential |
74,224 |
|
|
62,819 |
|
| Commercial |
155,004 |
|
|
128,210 |
|
Total Real Estate(2) |
343,635 |
|
|
293,100 |
|
Credit(3) |
84,588 |
|
|
74,766 |
|
Other(4) |
9,402 |
|
|
15,323 |
|
| Total |
$ |
437,625 |
|
|
$ |
383,189 |
|
_________________________________________
(2) Beginning during the year ended December 31, 2023, the Company includes capital raised from investors in CaliberCos Inc. through corporate note issuances that was further invested in our funds in Managed Capital. As of December 31, 2023 and December 31, 2022, the Company had invested $18.3 million and $5.4 million, respectively, in our funds.
(3) Credit managed capital represents loans made to Caliber’s investment funds by the Company and our diversified credit fund. As of December 31, 2023, the Company had loaned $8.5 million to our funds. As of December 31, 2022, no amounts had been loaned to our funds from the Company.
(4) Other managed capital represents undeployed capital held in our diversified funds.
