| Washington | 001-36853 | 47-1645716 | ||||||||||||
| (State or other jurisdiction of incorporation) |
(Commission File Number) |
(I.R.S. Employer Identification No.) |
||||||||||||
1301 Second Avenue, Floor 36, Seattle, Washington |
98101 | |||||||||||||
| (Address of principal executive offices) | (Zip Code) | |||||||||||||
Check the appropriate box below if the Form 8-K filing is intended to simultaneously satisfy the filing obligation of the registrant under any of the following provisions: |
|||||
| ☐ | Written communications pursuant to Rule 425 under the Securities Act (17 CFR 230.425) | ||||
| ☐ | Soliciting material pursuant to Rule 14a-12 under the Exchange Act (17 CFR 240.14a-12) | ||||
| ☐ | Pre-commencement communications pursuant to Rule 14d-2(b) under the Exchange Act (17 CFR 240.14d-2(b)) | ||||
| ☐ | Pre-commencement communications pursuant to Rule 13e-4(c) under the Exchange Act (17 CFR 240.13e-4(c)) | ||||
| Title of each class | Trading Symbol(s) | Name of each exchange on which registered | ||||||
| Class A Common Stock, par value $0.0001 per share | ZG | The Nasdaq Global Select Market | ||||||
| Class C Capital Stock, par value $0.0001 per share | Z | The Nasdaq Global Select Market | ||||||
| Item 2.02 | Results of Operations and Financial Condition. | ||||
| Item 9.01 | Financial Statements and Exhibits. | ||||
| Exhibit Number |
Description | |||||||
| 99.1 | ||||||||
| 99.2 | ||||||||
| 99.3 | ||||||||
| 104 | Cover Page Interactive Data File (embedded within the Inline XBRL document). | |||||||
Dated: November 6, 2024 |
ZILLOW GROUP, INC. | ||||||||||
| By: | /s/ JENNIFER ROCK |
||||||||||
| Name: | Jennifer Rock | ||||||||||
| Title: | Chief Accounting Officer | ||||||||||

| Contacts: | ||
| Investors | ||
| Brad Berning | ||
| ir@zillowgroup.com | ||
| Media | ||
| Chrissy Roebuck | ||
| press@zillow.com | ||
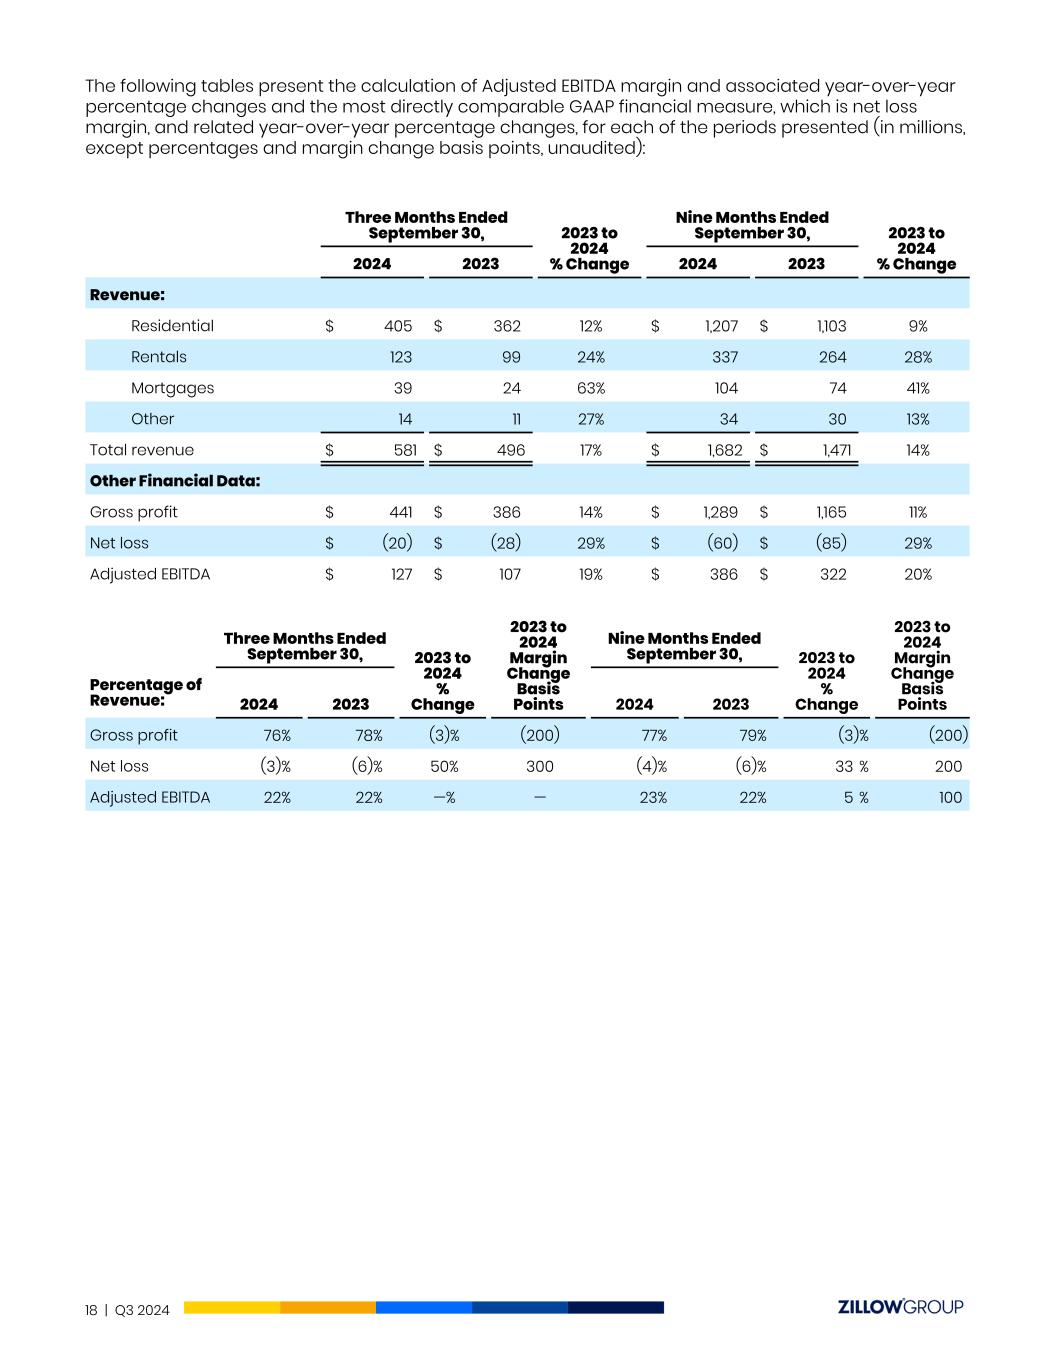
| Three Months Ended September 30, |
2023 to 2024 % Change |
Nine Months Ended September 30, |
2023 to 2024 % Change |
||||||||||||||||||||||||||||||||
| 2024 | 2023 | 2024 | 2023 | ||||||||||||||||||||||||||||||||
| Revenue: | |||||||||||||||||||||||||||||||||||
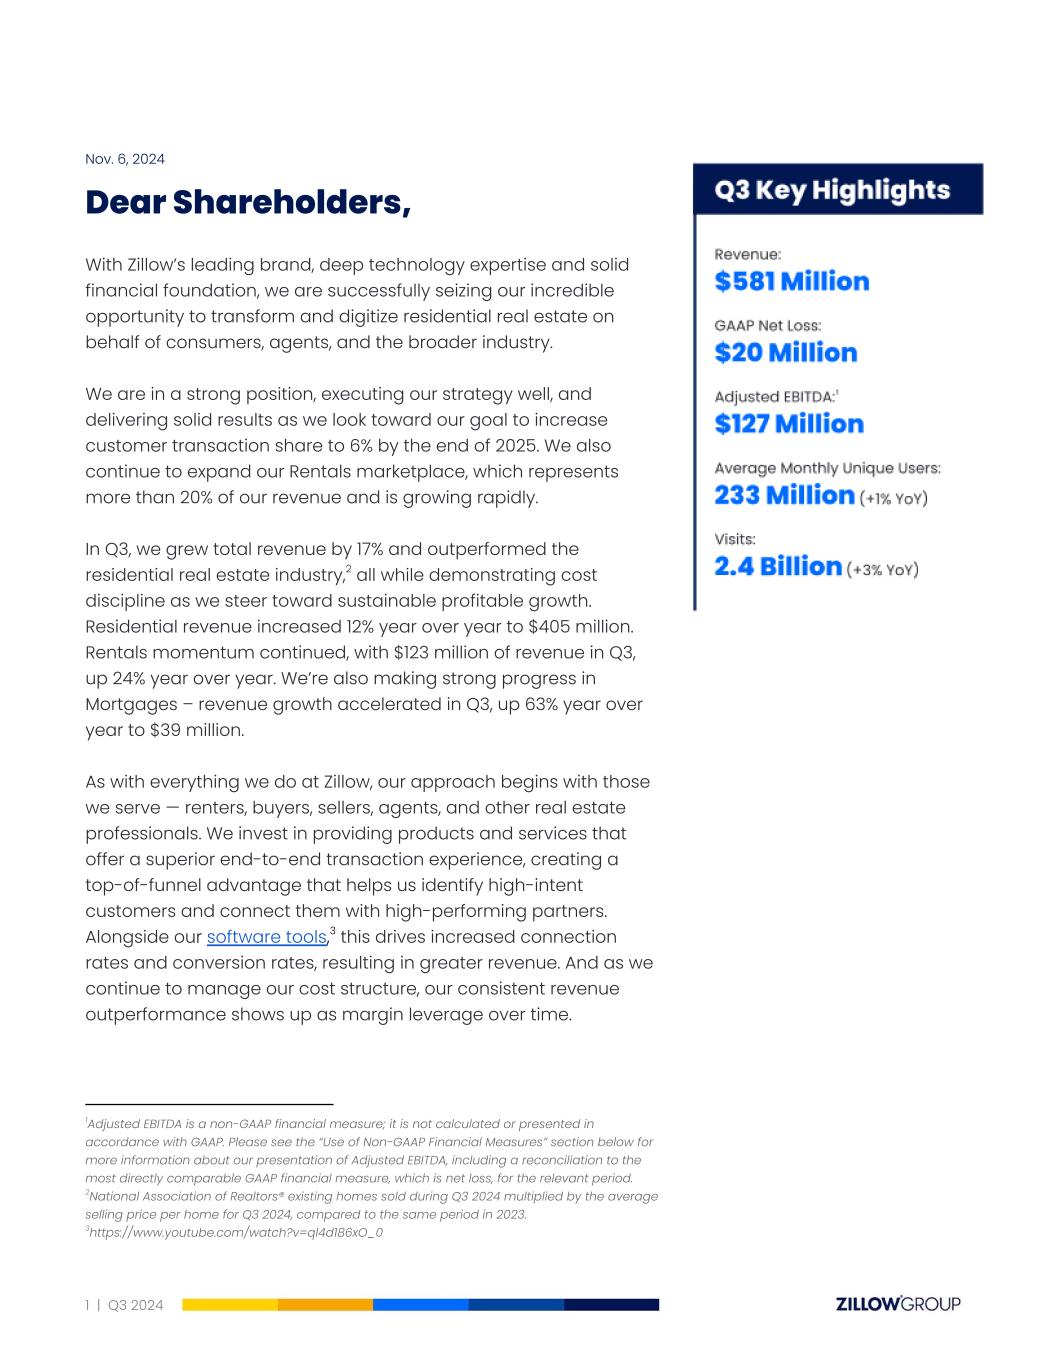
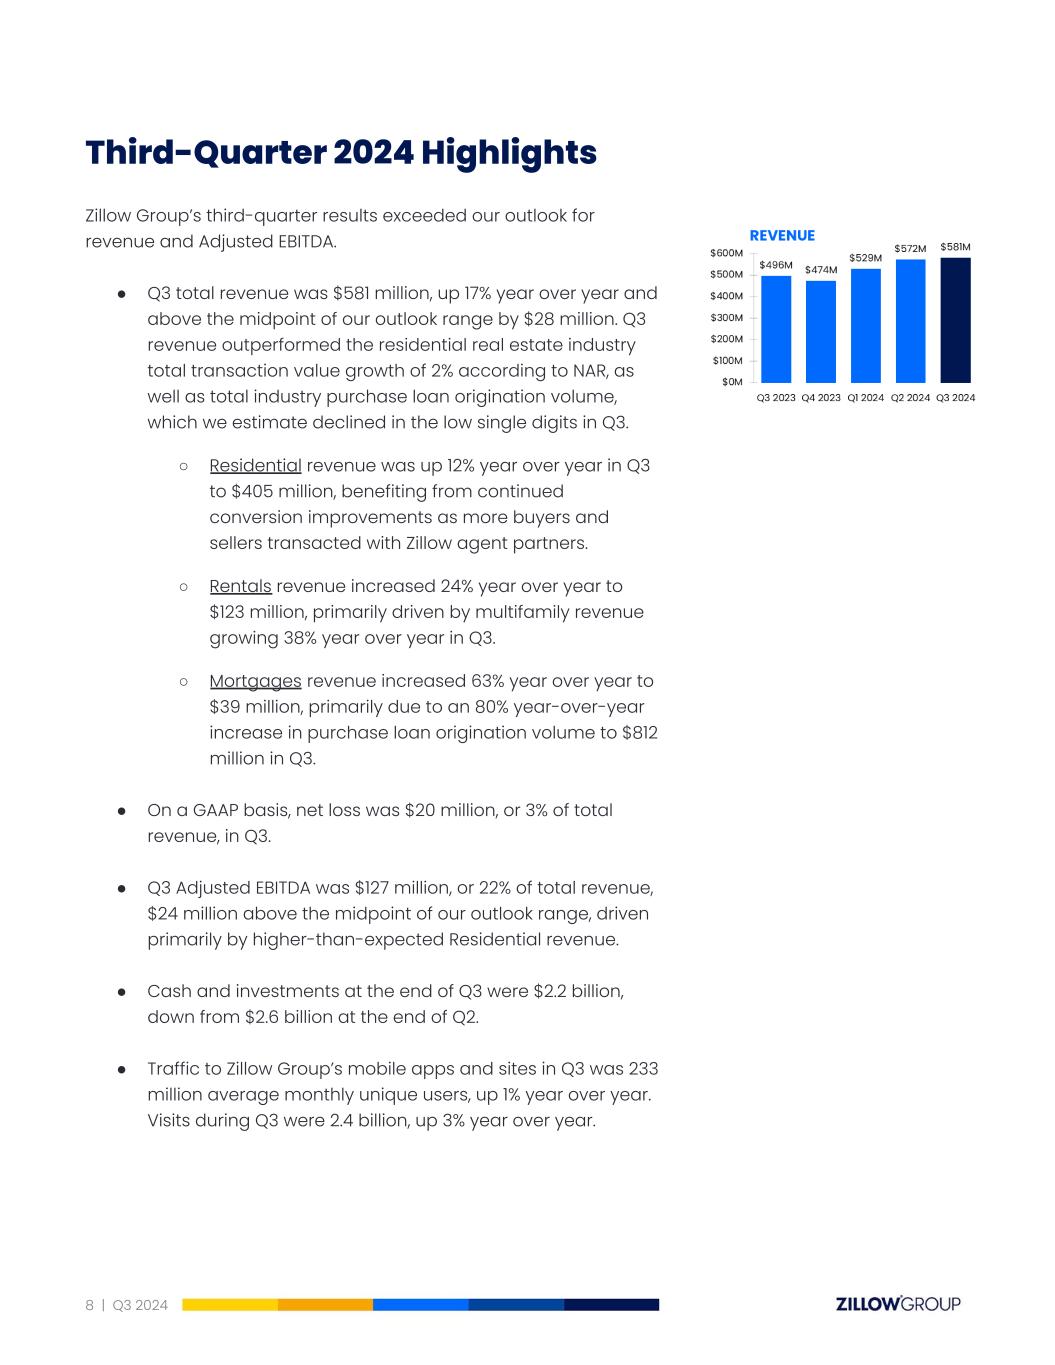
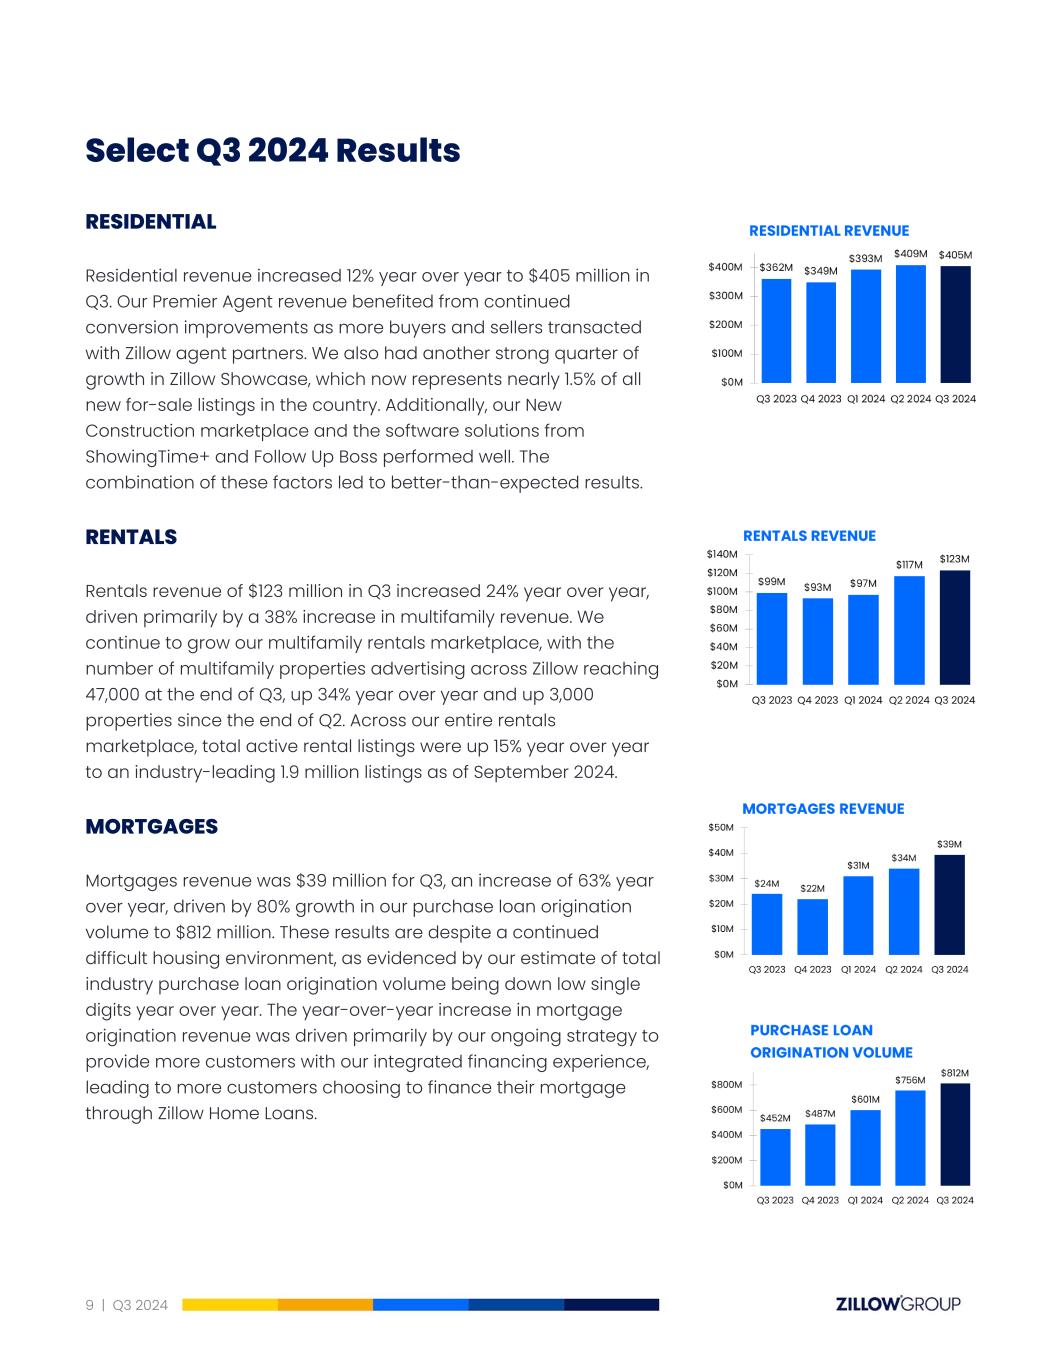
| Residential | $ | 405 | $ | 362 | 12% | $ | 1,207 | $ | 1,103 | 9% | |||||||||||||||||||||||||
| Rentals | 123 | 99 | 24% | 337 | 264 | 28% | |||||||||||||||||||||||||||||
| Mortgages | 39 | 24 | 63% | 104 | 74 | 41% | |||||||||||||||||||||||||||||
| Other | 14 | 11 | 27% | 34 | 30 | 13% | |||||||||||||||||||||||||||||
| Total revenue | $ | 581 | $ | 496 | 17% | $ | 1,682 | $ | 1,471 | 14% | |||||||||||||||||||||||||
| Other Financial Data: | |||||||||||||||||||||||||||||||||||
| Gross profit | $ | 441 | $ | 386 | $ | 1,289 | $ | 1,165 | |||||||||||||||||||||||||||
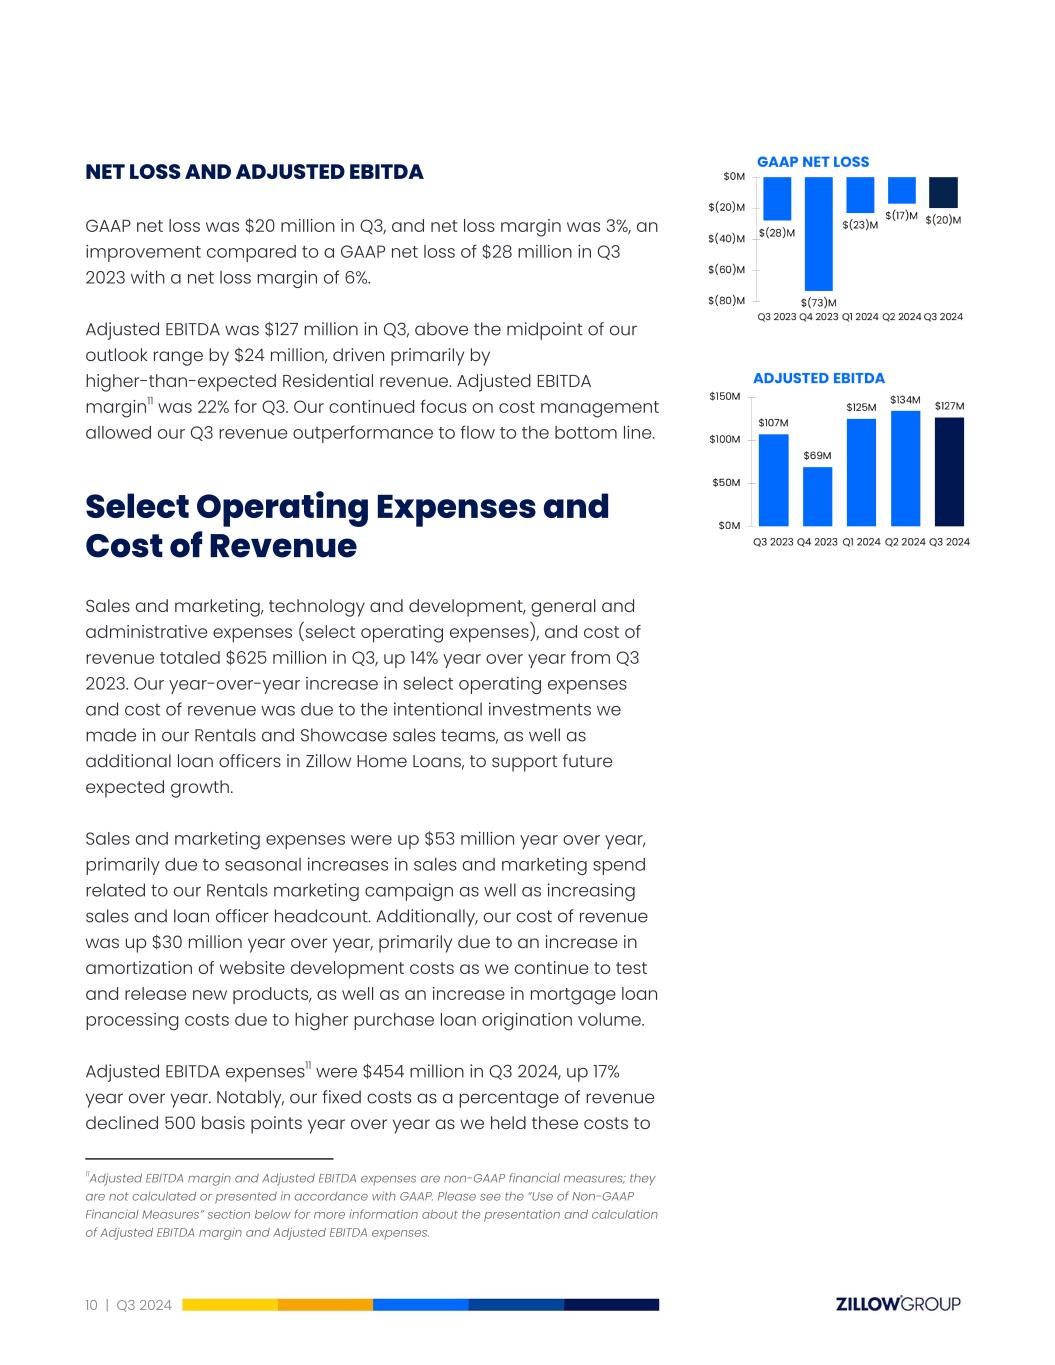
| Net loss | $ | (20) | $ | (28) | $ | (60) | $ | (85) | |||||||||||||||||||||||||||
| Adjusted EBITDA (1) | $ | 127 | $ | 107 | $ | 386 | $ | 322 | |||||||||||||||||||||||||||
| Percentage of Revenue: | |||||||||||||||||||||||||||||||||||
| Gross profit | 76% | 78% | 77% | 79% | |||||||||||||||||||||||||||||||
| Net loss | (3)% | (6)% | (4)% | (6)% | |||||||||||||||||||||||||||||||
Adjusted EBITDA (1) |
22% | 22% | 23% | 22% | |||||||||||||||||||||||||||||||
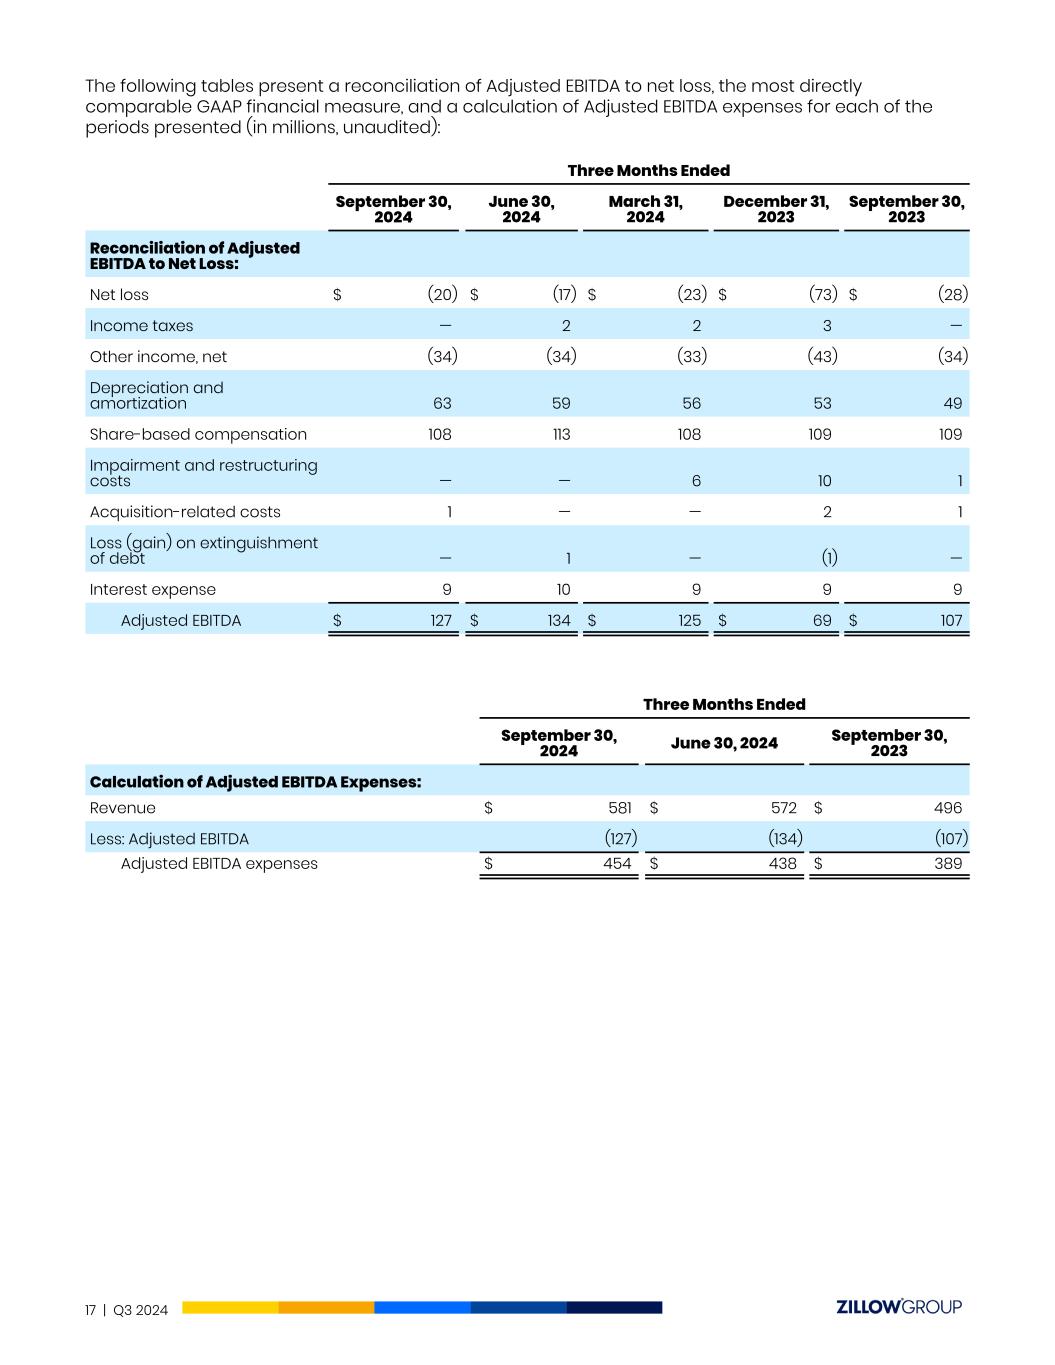
(1) Adjusted EBITDA is a non-GAAP financial measure; it is not calculated or presented in accordance with U.S. generally accepted accounting principles, or GAAP. See below for more information regarding our presentation of Adjusted EBITDA, including a reconciliation of Adjusted EBITDA to the most directly comparable GAAP financial measure, which is net loss, for each of the periods presented. | |||||||||||||||||||||||||||||||||||
| Three Months Ended September 30, |
Nine Months Ended September 30, |
||||||||||||||||||||||
| 2024 | 2023 | 2024 | 2023 | ||||||||||||||||||||
| Reconciliation of Adjusted EBITDA to Net Loss: | |||||||||||||||||||||||
| Net loss | $ | (20) | $ | (28) | $ | (60) | $ | (85) | |||||||||||||||
| Income taxes | — | — | 4 | 1 | |||||||||||||||||||
| Other income, net | (34) | (34) | (101) | (108) | |||||||||||||||||||
| Depreciation and amortization | 63 | 49 | 178 | 134 | |||||||||||||||||||
| Share-based compensation | 108 | 109 | 329 | 342 | |||||||||||||||||||
| Impairment and restructuring costs | — | 1 | 6 | 9 | |||||||||||||||||||
| Acquisition-related costs | 1 | 1 | 1 | 2 | |||||||||||||||||||
| Loss on extinguishment of debt | — | — | 1 | — | |||||||||||||||||||
| Interest expense | 9 | 9 | 28 | 27 | |||||||||||||||||||
| Adjusted EBITDA | $ | 127 | $ | 107 | $ | 386 | $ | 322 | |||||||||||||||
| September 30, 2024 | December 31, 2023 | ||||||||||
| Assets | |||||||||||
| Current assets: | |||||||||||
| Cash and cash equivalents | $ | 1,072 | $ | 1,492 | |||||||
| Short-term investments | 1,101 | 1,318 | |||||||||
| Accounts receivable, net | 117 | 96 | |||||||||
| Mortgage loans held for sale | 164 | 100 | |||||||||
| Prepaid expenses and other current assets | 212 | 140 | |||||||||
| Restricted cash | 3 | 3 | |||||||||
| Total current assets | 2,669 | 3,149 | |||||||||
| Contract cost assets | 24 | 23 | |||||||||
| Property and equipment, net | 356 | 328 | |||||||||
| Right of use assets | 61 | 73 | |||||||||
| Goodwill | 2,818 | 2,817 | |||||||||
| Intangible assets, net | 211 | 241 | |||||||||
| Other assets | 20 | 21 | |||||||||
| Total assets | $ | 6,159 | $ | 6,652 | |||||||
| Liabilities and shareholders’ equity | |||||||||||
| Current liabilities: | |||||||||||
| Accounts payable | $ | 53 | $ | 28 | |||||||
| Accrued expenses and other current liabilities | 114 | 107 | |||||||||
| Accrued compensation and benefits | 49 | 47 | |||||||||
| Borrowings under credit facilities | 148 | 93 | |||||||||
| Deferred revenue | 57 | 52 | |||||||||
| Lease liabilities, current portion | 15 | 37 | |||||||||
| Convertible senior notes, current portion | 418 | 607 | |||||||||
| Total current liabilities | 854 | 971 | |||||||||
| Lease liabilities, net of current portion | 86 | 95 | |||||||||
| Convertible senior notes, net of current portion | 497 | 1,000 | |||||||||
| Other long-term liabilities | 66 | 60 | |||||||||
| Total liabilities | 1,503 | 2,126 | |||||||||
| Shareholders’ equity: | |||||||||||
Class A common stock |
— | — | |||||||||
Class B common stock |
— | — | |||||||||
Class C capital stock |
— | — | |||||||||
| Additional paid-in capital | 6,482 | 6,301 | |||||||||
| Accumulated other comprehensive income (loss) | 4 | (5) | |||||||||
| Accumulated deficit | (1,830) | (1,770) | |||||||||
| Total shareholders’ equity | 4,656 | 4,526 | |||||||||
| Total liabilities and shareholders’ equity | $ | 6,159 | $ | 6,652 | |||||||
| Three Months Ended September 30, |
Nine Months Ended September 30, |
||||||||||||||||||||||
| 2024 | 2023 | 2024 | 2023 | ||||||||||||||||||||
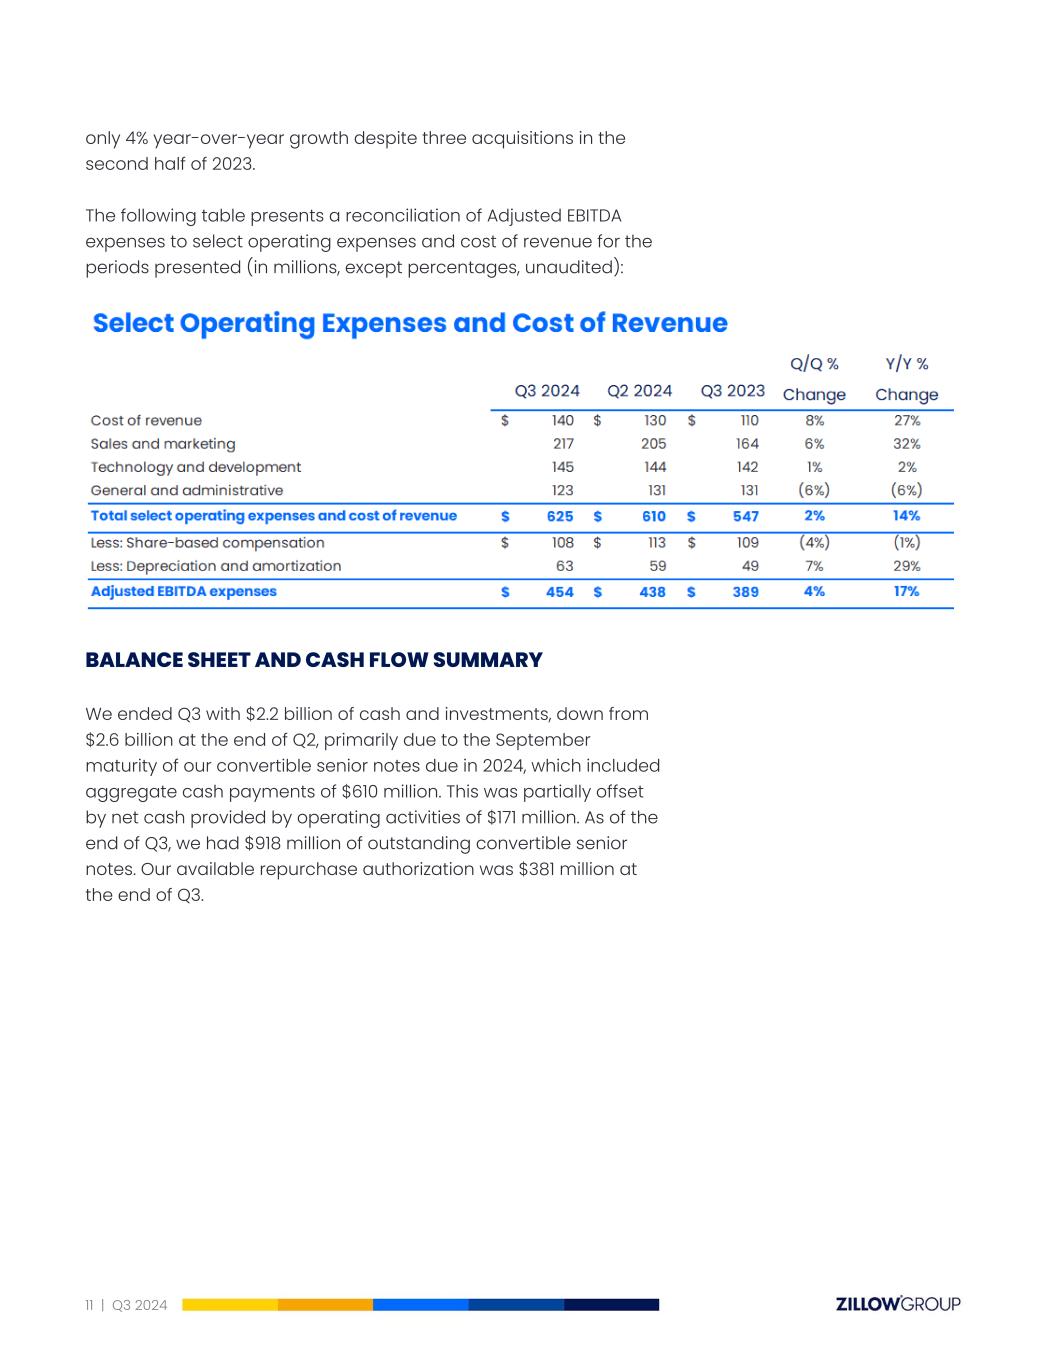
| Revenue | $ | 581 | $ | 496 | $ | 1,682 | $ | 1,471 | |||||||||||||||
Cost of revenue (1) |
140 | 110 | 393 | 306 | |||||||||||||||||||
| Gross profit | 441 | 386 | 1,289 | 1,165 | |||||||||||||||||||
| Operating expenses: | |||||||||||||||||||||||
Sales and marketing (1) |
217 | 164 | 588 | 493 | |||||||||||||||||||
Technology and development (1) |
145 | 142 | 436 | 419 | |||||||||||||||||||
General and administrative (1) |
123 | 131 | 386 | 407 | |||||||||||||||||||
| Impairment and restructuring costs | — | 1 | 6 | 9 | |||||||||||||||||||
| Acquisition-related costs | 1 | 1 | 1 | 2 | |||||||||||||||||||
| Total operating expenses | 486 | 439 | 1,417 | 1,330 | |||||||||||||||||||
| Loss from operations | (45) | (53) | (128) | (165) | |||||||||||||||||||
| Loss on extinguishment of debt | — | — | (1) | — | |||||||||||||||||||
| Other income, net | 34 | 34 | 101 | 108 | |||||||||||||||||||
| Interest expense | (9) | (9) | (28) | (27) | |||||||||||||||||||
| Loss before income taxes | (20) | (28) | (56) | (84) | |||||||||||||||||||
| Income tax expense | — | — | (4) | (1) | |||||||||||||||||||
| Net loss | $ | (20) | $ | (28) | $ | (60) | $ | (85) | |||||||||||||||
| Net loss per share - basic and diluted | $ | (0.08) | $ | (0.12) | $ | (0.26) | $ | (0.36) | |||||||||||||||
| Weighted-average shares outstanding - basic and diluted | 232,521 | 233,295 | 233,553 | 235,560 | |||||||||||||||||||
| (1) Includes share-based compensation expense as follows: | |||||||||||||||||||||||
| Cost of revenue | $ | 3 | $ | 4 | $ | 11 | $ | 12 | |||||||||||||||
| Sales and marketing | 19 | 18 | 57 | 53 | |||||||||||||||||||
| Technology and development | 40 | 42 | 124 | 123 | |||||||||||||||||||
| General and administrative | 46 | 45 | 137 | 154 | |||||||||||||||||||
| Total share-based compensation | $ | 108 | $ | 109 | $ | 329 | $ | 342 | |||||||||||||||
| Adjusted EBITDA (2) | $ | 127 | $ | 107 | $ | 386 | $ | 322 | |||||||||||||||
(2) Adjusted EBITDA is a non-GAAP financial measure; it is not calculated or presented in accordance with U.S. generally accepted accounting principles, or GAAP. See Exhibit 99.1 for more information regarding our presentation of Adjusted EBITDA and for a reconciliation of Adjusted EBITDA to net loss, the most directly comparable GAAP financial measure, for each of the periods presented. | |||||||||||||||||||||||
| Nine Months Ended September 30, |
|||||||||||
| 2024 | 2023 | ||||||||||
| Operating activities | |||||||||||
| Net loss | $ | (60) | $ | (85) | |||||||
| Adjustments to reconcile net loss to net cash provided by operating activities: | |||||||||||
| Depreciation and amortization | 178 | 134 | |||||||||
| Share-based compensation | 329 | 342 | |||||||||
| Amortization of right of use assets | 8 | 18 | |||||||||
| Amortization of contract cost assets | 14 | 16 | |||||||||
| Amortization of debt issuance costs | 4 | 4 | |||||||||
| Impairment costs | 6 | 6 | |||||||||
| Accretion of bond discount | (23) | (29) | |||||||||
| Other adjustments to reconcile net loss to net cash provided by operating activities | 14 | (3) | |||||||||
| Changes in operating assets and liabilities: | |||||||||||
| Accounts receivable | (21) | (26) | |||||||||
| Mortgage loans held for sale | (64) | (55) | |||||||||
| Prepaid expenses and other assets | (73) | (22) | |||||||||
| Contract cost assets | (15) | (16) | |||||||||
| Lease liabilities | (31) | (24) | |||||||||
| Accounts payable | 25 | 7 | |||||||||
| Accrued expenses and other current liabilities | 8 | (3) | |||||||||
| Accrued compensation and benefits | 2 | 4 | |||||||||
| Deferred revenue | 5 | 4 | |||||||||
| Other long-term liabilities | — | (4) | |||||||||
| Net cash provided by operating activities | 306 | 268 | |||||||||
| Investing activities | |||||||||||
| Proceeds from maturities of investments | 906 | 1,136 | |||||||||
| Proceeds from sales of investments | 13 | — | |||||||||
| Purchases of investments | (668) | (638) | |||||||||
| Purchases of property and equipment | (109) | (101) | |||||||||
| Purchases of intangible assets | (21) | (24) | |||||||||
| Cash paid for acquisitions, net | — | (34) | |||||||||
| Net cash provided by investing activities | 121 | 339 | |||||||||
| Financing activities | |||||||||||
| Net borrowings on warehouse line of credit and repurchase agreements | 55 | 54 | |||||||||
| Repurchases of Class A common stock and Class C capital stock | (301) | (336) | |||||||||
| Settlement of long-term debt | (697) | — | |||||||||
| Proceeds from exercise of stock options | 96 | 56 | |||||||||
| Net cash used in financing activities | (847) | (226) | |||||||||
| Net increase (decrease) in cash, cash equivalents and restricted cash during period | (420) | 381 | |||||||||
| Cash, cash equivalents and restricted cash at beginning of period | 1,495 | 1,468 | |||||||||
| Cash, cash equivalents and restricted cash at end of period | $ | 1,075 | $ | 1,849 | |||||||
| Supplemental disclosures of cash flow information | |||||||||||
| Noncash transactions: | |||||||||||
| Capitalized share-based compensation | $ | 56 | $ | 56 | |||||||
| Write-off of fully depreciated property and equipment | 63 | 29 | |||||||||
| Write-off of fully amortized intangible assets | 21 | 4 | |||||||||
| Value of Class C capital stock issued in connection with an acquisition | — | 20 | |||||||||
| Three Months Ended September 30, |
Nine Months Ended September 30, |
||||||||||||||||||||||
| 2024 | 2023 | 2024 | 2023 | ||||||||||||||||||||
Net loss, as reported |
$ | (20) | $ | (28) | $ | (60) | $ | (85) | |||||||||||||||
| Share-based compensation | 108 | 109 | 329 | 342 | |||||||||||||||||||
Impairment and restructuring costs |
— | 1 | 6 | 9 | |||||||||||||||||||
Acquisition-related costs |
1 | 1 | 1 | 2 | |||||||||||||||||||
Loss on extinguishment of debt |
— | — | 1 | — | |||||||||||||||||||
| Income taxes | — | — | 4 | 1 | |||||||||||||||||||
| Net income, adjusted | $ | 89 | $ | 83 | $ | 281 | $ | 269 | |||||||||||||||
| Non-GAAP net income per share: | |||||||||||||||||||||||
| Basic | $ | 0.38 | $ | 0.36 | $ | 1.19 | $ | 1.15 | |||||||||||||||
| Diluted | $ | 0.35 | $ | 0.33 | $ | 1.10 | $ | 1.06 | |||||||||||||||
| Weighted-average shares outstanding: | |||||||||||||||||||||||
| Basic | 232,521 | 233,295 | 233,553 | 235,560 | |||||||||||||||||||
| Diluted | 258,994 | 264,866 | 262,180 | 265,451 | |||||||||||||||||||
| Three Months Ended September 30, |
Nine Months Ended September 30, |
||||||||||||||||||||||
| 2024 | 2023 | 2024 | 2023 | ||||||||||||||||||||
| Denominator for basic calculation | 232,521 | 233,295 | 233,553 | 235,560 | |||||||||||||||||||
| Effect of dilutive securities: | |||||||||||||||||||||||
| Option awards | 3,303 | 2,563 | 2,619 | 1,872 | |||||||||||||||||||
| Unvested restricted stock units | 2,131 | 3,562 | 2,093 | 2,573 | |||||||||||||||||||
| Convertible senior notes due in 2024 and 2026 | 21,039 | 25,446 | 23,915 | 25,446 | |||||||||||||||||||
| Denominator for dilutive calculation | 258,994 | 264,866 | 262,180 | 265,451 | |||||||||||||||||||
| Three Months Ended September 30, |
2023 to 2024 % Change |
Nine Months Ended September 30, |
2023 to 2024 % Change |
||||||||||||||||||||||||||||||||
| 2024 | 2023 | 2024 | 2023 | ||||||||||||||||||||||||||||||||
| Visits (1) | 2,440 | 2,366 | 3% | 7,251 | 6,995 | 4% | |||||||||||||||||||||||||||||
| Average monthly unique users (2) | 233 | 230 | 1% | 227 | 226 | —% | |||||||||||||||||||||||||||||
| (1) Visits includes groups of interactions by users with the Zillow, Trulia and StreetEasy mobile apps and websites. Zillow and StreetEasy measure visits with an internal measurement tool and Trulia measures visits with Adobe Analytics. | |||||||||||||||||||||||||||||||||||
| (2) Zillow, StreetEasy and HotPads measure unique users with an internal measurement tool and Trulia measures unique users with Adobe Analytics. | |||||||||||||||||||||||||||||||||||
| Three Months Ended September 30, |
2023 to 2024 % Change |
Nine Months Ended September 30, |
2023 to 2024 % Change |
||||||||||||||||||||||||||||||||
| 2024 | 2023 | 2024 | 2023 | ||||||||||||||||||||||||||||||||
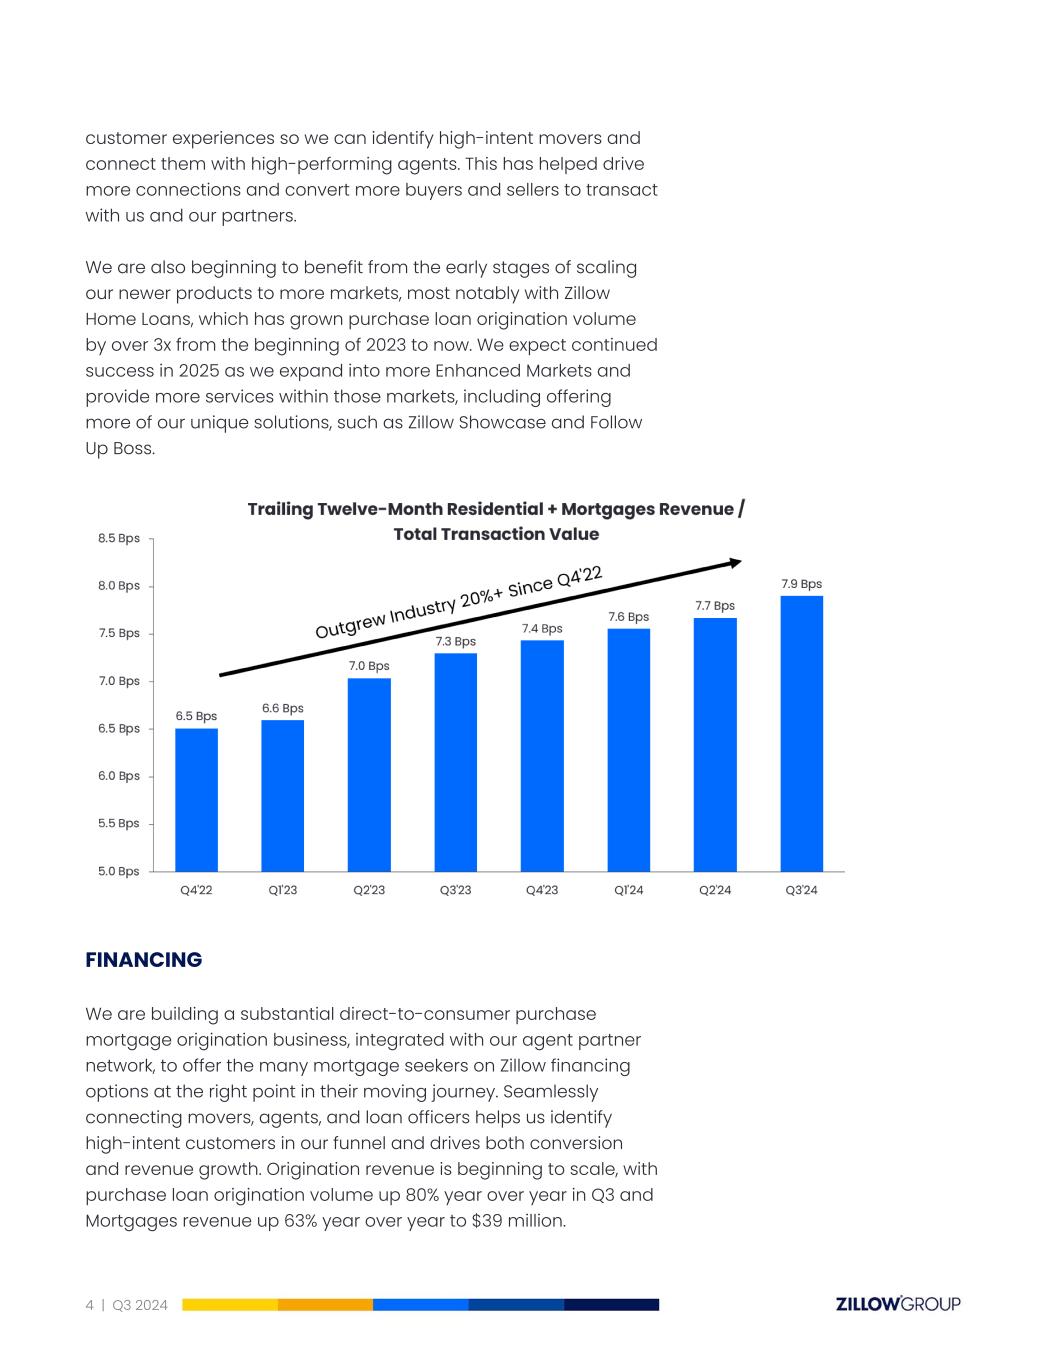
| Purchase loan origination volume | $ | 812 | $ | 452 | 80% | $ | 2,169 | $ | 1,047 | 107% | |||||||||||||||||||||||||
| Refinance loan origination volume | 7 | 5 | 40% | 14 | 12 | 17% | |||||||||||||||||||||||||||||
| Total loan origination volume | $ | 819 | $ | 457 | 79% | $ | 2,183 | $ | 1,059 | 106% | |||||||||||||||||||||||||
