| Maryland | 001-36160 | 45-2433192 | ||||||||||||
| Delaware | 333-256637-01 |
80-0831163 | ||||||||||||
| (State or Other Jurisdiction of Incorporation) |
(Commission File Number) |
(IRS Employer Identification No.) |
||||||||||||
| Title of each class | Trading Symbol(s) | Name of each exchange on which registered | ||||||
| Common Stock, par value $0.01 per share | BRX | New York Stock Exchange | ||||||
| ☐ | Written communication pursuant to Rule 425 under the Securities Act (17 CFR 230.425) | ||||
| ☐ | Soliciting material pursuant to Rule 14a-12 under the Exchange Act (17 CFR 240.14a-12) | ||||
| ☐ | Pre-commencement communication pursuant to Rule 14d-2(b) under the Exchange Act (17 CFR 240.14d-2(b)) | ||||
| ☐ | Pre-commencement communication pursuant to Rule 13e-4(c) under the Exchange Act (17 CFR 240.13e-4(c)) | ||||
| Press release issued July 29, 2024. | ||||||||
| Brixmor Property Group Inc. Supplemental Financial Information for the second quarter ended June 30, 2024. | ||||||||
| 104 | Cover Page Interactive Data File (embedded within the Inline XBRL document) | |||||||
Date: July 29, 2024 |
BRIXMOR PROPERTY GROUP INC. | |||||||
| By: | /s/ Steven F. Siegel | |||||||
| Name: | Steven F. Siegel | |||||||
| Title: | Executive Vice President, | |||||||
| General Counsel and Secretary | ||||||||
| BRIXMOR OPERATING PARTNERSHIP LP | ||||||||
| By: | Brixmor OP GP LLC, its general partner | |||||||
| By: | BPG Subsidiary LLC, its sole member | |||||||
| By: | /s/ Steven F. Siegel | |||||||
| Name: | Steven F. Siegel | |||||||
| Title: | Executive Vice President, | |||||||
| General Counsel and Secretary | ||||||||

| (Unaudited, dollars in millions, except per share amounts) | 2024E | 2024E Per Diluted Share | ||||||||||||
| Net income | $291 - $300 | $0.96 - $0.99 | ||||||||||||
| Depreciation and amortization related to real estate | 360 | 1.19 | ||||||||||||
| Gain on sale of real estate assets | (17) | (0.06) | ||||||||||||
| Impairment of real estate asset | 5 | 0.02 | ||||||||||||
| Nareit FFO | $639 - $648 | $2.11 - 2.14 | ||||||||||||
| CONSOLIDATED BALANCE SHEETS | |||||||||||||||||||||||
Unaudited, dollars in thousands, except share information |
|||||||||||||||||||||||
As of |
As of |
||||||||||||||||||||||
| 6/30/24 | 12/31/23 | ||||||||||||||||||||||
Assets |
|||||||||||||||||||||||
Real estate |
|||||||||||||||||||||||
| Land | $ | 1,779,106 | $ | 1,794,011 | |||||||||||||||||||
| Buildings and tenant improvements | 8,673,678 | 8,570,874 | |||||||||||||||||||||
| Construction in progress | 109,735 | 126,007 | |||||||||||||||||||||
| Lease intangibles | 499,460 | 504,995 | |||||||||||||||||||||
| 11,061,979 | 10,995,887 | ||||||||||||||||||||||
| Accumulated depreciation and amortization | (3,315,103) | (3,198,980) | |||||||||||||||||||||
| Real estate, net | 7,746,876 | 7,796,907 | |||||||||||||||||||||
| Cash and cash equivalents | 473,615 | 866 | |||||||||||||||||||||
| Restricted cash | 1,341 | 18,038 | |||||||||||||||||||||
| Marketable securities | 21,985 | 19,914 | |||||||||||||||||||||
| Receivables, net, including straight-line rent receivables of $195,330 and $180,810, respectively | 252,664 | 278,775 | |||||||||||||||||||||
| Deferred charges and prepaid expenses, net | 169,872 | 164,061 | |||||||||||||||||||||
| Real estate assets held for sale | 11,048 | — | |||||||||||||||||||||
| Other assets | 53,300 | 54,155 | |||||||||||||||||||||
| Total assets | $ | 8,730,701 | $ | 8,332,716 | |||||||||||||||||||
| Liabilities | |||||||||||||||||||||||
| Debt obligations, net | $ | 5,375,222 | $ | 4,933,525 | |||||||||||||||||||
| Accounts payable, accrued expenses and other liabilities | 500,293 | 548,890 | |||||||||||||||||||||
| Total liabilities | 5,875,515 | 5,482,415 | |||||||||||||||||||||
| Equity | |||||||||||||||||||||||
| Common stock, $0.01 par value; authorized 3,000,000,000 shares; | |||||||||||||||||||||||
310,472,378 and 309,723,386 shares issued and 301,345,386 and 300,596,394 |
|||||||||||||||||||||||
| shares outstanding | 3,013 | 3,006 | |||||||||||||||||||||
| Additional paid-in capital | 3,307,357 | 3,310,590 | |||||||||||||||||||||
| Accumulated other comprehensive income (loss) | 12,377 | (2,700) | |||||||||||||||||||||
| Distributions in excess of net income | (467,561) | (460,595) | |||||||||||||||||||||
| Total equity | 2,855,186 | 2,850,301 | |||||||||||||||||||||
| Total liabilities and equity | $ | 8,730,701 | $ | 8,332,716 | |||||||||||||||||||
vi |
|
|||||||
| CONSOLIDATED STATEMENTS OF OPERATIONS | |||||||||||||||||||||||||||||
| Unaudited, dollars in thousands, except per share amounts | |||||||||||||||||||||||||||||
| Three Months Ended | Six Months Ended | ||||||||||||||||||||||||||||
| 6/30/24 | 6/30/23 | 6/30/24 | 6/30/23 | ||||||||||||||||||||||||||
| Revenues | |||||||||||||||||||||||||||||
| Rental income | $ | 315,587 | $ | 309,192 | $ | 635,076 | $ | 620,322 | |||||||||||||||||||||
| Other revenues | 102 | 601 | 854 | 915 | |||||||||||||||||||||||||
| Total revenues | 315,689 | 309,793 | 635,930 | 621,237 | |||||||||||||||||||||||||
| Operating expenses | |||||||||||||||||||||||||||||
| Operating costs | 36,919 | 35,705 | 74,076 | 71,600 | |||||||||||||||||||||||||
| Real estate taxes | 36,349 | 43,712 | 77,757 | 88,400 | |||||||||||||||||||||||||
| Depreciation and amortization | 92,018 | 88,812 | 183,236 | 176,553 | |||||||||||||||||||||||||
| Impairment of real estate assets | 5,280 | 16,736 | 5,280 | 17,836 | |||||||||||||||||||||||||
| General and administrative | 29,689 | 28,514 | 58,180 | 57,686 | |||||||||||||||||||||||||
| Total operating expenses | 200,255 | 213,479 | 398,529 | 412,075 | |||||||||||||||||||||||||
| Other income (expense) | |||||||||||||||||||||||||||||
| Dividends and interest | 6,632 | 57 | 10,509 | 72 | |||||||||||||||||||||||||
| Interest expense | (53,655) | (47,485) | (105,143) | (96,165) | |||||||||||||||||||||||||
| Gain on sale of real estate assets | 1,814 | 3,857 | 16,956 | 52,325 | |||||||||||||||||||||||||
| Gain on extinguishment of debt, net | 281 | 4,350 | 281 | 4,350 | |||||||||||||||||||||||||
| Other | (381) | (685) | (974) | (1,090) | |||||||||||||||||||||||||
| Total other expense | (45,309) | (39,906) | (78,371) | (40,508) | |||||||||||||||||||||||||
| Net income | $ | 70,125 | $ | 56,408 | $ | 159,030 | $ | 168,654 | |||||||||||||||||||||
| Net income per common share: | |||||||||||||||||||||||||||||
| Basic | $ | 0.23 | $ | 0.19 | $ | 0.53 | $ | 0.56 | |||||||||||||||||||||
| Diluted | $ | 0.23 | $ | 0.19 | $ | 0.52 | $ | 0.56 | |||||||||||||||||||||
| Weighted average shares: | |||||||||||||||||||||||||||||
| Basic | 302,197 | 300,961 | 302,120 | 300,899 | |||||||||||||||||||||||||
| Diluted | 302,903 | 302,285 | 302,796 | 302,234 | |||||||||||||||||||||||||
vii |
|
|||||||
| FUNDS FROM OPERATIONS (FFO) | ||||||||||||||||||||||||||||||||
| Unaudited, dollars in thousands, except per share amounts | ||||||||||||||||||||||||||||||||
| Three Months Ended | Six Months Ended | |||||||||||||||||||||||||||||||
| 6/30/24 | 6/30/23 | 6/30/24 | 6/30/23 | |||||||||||||||||||||||||||||
| Net income | $ | 70,125 | $ | 56,408 | $ | 159,030 | $ | 168,654 | ||||||||||||||||||||||||
| Depreciation and amortization related to real estate | 90,218 | 87,806 | 179,891 | 174,554 | ||||||||||||||||||||||||||||
| Gain on sale of real estate assets | (1,814) | (3,857) | (16,956) | (52,325) | ||||||||||||||||||||||||||||
| Impairment of real estate assets | 5,280 | 16,736 | 5,280 | 17,836 | ||||||||||||||||||||||||||||
| Nareit FFO | $ | 163,809 | $ | 157,093 | $ | 327,245 | $ | 308,719 | ||||||||||||||||||||||||
| Nareit FFO per diluted share | $ | 0.54 | $ | 0.52 | $ | 1.08 | $ | 1.02 | ||||||||||||||||||||||||
| Weighted average diluted shares outstanding | 302,903 | 302,285 | 302,796 | 302,234 | ||||||||||||||||||||||||||||
| Items that impact FFO comparability | ||||||||||||||||||||||||||||||||
| Transaction expenses, net | $ | (13) | $ | (37) | $ | (58) | $ | (95) | ||||||||||||||||||||||||
| Gain on extinguishment of debt, net | 281 | 4,350 | 281 | 4,350 | ||||||||||||||||||||||||||||
| Total items that impact FFO comparability | $ | 268 | $ | 4,313 | $ | 223 | $ | 4,255 | ||||||||||||||||||||||||
| Items that impact FFO comparability, net per share | $ | 0.00 | $ | 0.01 | $ | 0.00 | $ | 0.01 | ||||||||||||||||||||||||
| Additional Disclosures | ||||||||||||||||||||||||||||||||
| Straight-line rental income, net | $ | 7,981 | $ | 7,421 | $ | 15,536 | $ | 11,422 | ||||||||||||||||||||||||
| Accretion of below-market leases, net of amortization of above-market leases and tenant inducements | 1,810 | 1,568 | 3,534 | 4,236 | ||||||||||||||||||||||||||||
| Straight-line ground rent expense, net (1) | 6 | 8 | 11 | 17 | ||||||||||||||||||||||||||||
| Dividends declared per share | $ | 0.2725 | $ | 0.2600 | $ | 0.5450 | $ | 0.5200 | ||||||||||||||||||||||||
| Dividends declared | $ | 82,117 | $ | 78,154 | $ | 164,221 | $ | 156,296 | ||||||||||||||||||||||||
| Dividend payout ratio (as % of Nareit FFO) | 50.1 | % | 49.8 | % | 50.2 | % | 50.6 | % | ||||||||||||||||||||||||
| (1) Straight-line ground rent expense, net is included in Operating costs on the Consolidated Statements of Operations. | ||||||||||||||||||||||||||||||||
viii |
|
|||||||
| SAME PROPERTY NOI ANALYSIS | ||||||||||||||||||||||||||||||||||||||||||||
| Unaudited, dollars in thousands | ||||||||||||||||||||||||||||||||||||||||||||
| Three Months Ended | Six Months Ended | |||||||||||||||||||||||||||||||||||||||||||
| 6/30/24 | 6/30/23 | Change | 6/30/24 | 6/30/23 | Change | |||||||||||||||||||||||||||||||||||||||
| Same Property NOI Analysis | ||||||||||||||||||||||||||||||||||||||||||||
| Number of properties | 355 | 355 | — | 354 | 354 | — | ||||||||||||||||||||||||||||||||||||||
| Percent billed | 91.4 | % | 90.5 | % | 0.9 | % | 91.4 | % | 90.5 | % | 0.9 | % | ||||||||||||||||||||||||||||||||
| Percent leased | 95.4 | % | 94.2 | % | 1.2 | % | 95.4 | % | 94.2 | % | 1.2 | % | ||||||||||||||||||||||||||||||||
| Revenues | ||||||||||||||||||||||||||||||||||||||||||||
| Base rent | $ | 227,524 | $ | 219,260 | $ | 451,980 | $ | 435,478 | ||||||||||||||||||||||||||||||||||||
| Expense reimbursements | 68,303 | 69,433 | 139,536 | 139,096 | ||||||||||||||||||||||||||||||||||||||||
| Revenues deemed uncollectible | (1,389) | (1,973) | (1,174) | (3,081) | ||||||||||||||||||||||||||||||||||||||||
| Ancillary and other rental income / Other revenues | 5,845 | 6,126 | 12,085 | 11,542 | ||||||||||||||||||||||||||||||||||||||||
| Percentage rents | 2,341 | 1,940 | 6,575 | 5,655 | ||||||||||||||||||||||||||||||||||||||||
| 302,624 | 294,786 | 2.7 | % | 609,002 | 588,690 | 3.5 | % | |||||||||||||||||||||||||||||||||||||
| Operating expenses | ||||||||||||||||||||||||||||||||||||||||||||
| Operating costs | (36,629) | (34,383) | (72,913) | (68,511) | ||||||||||||||||||||||||||||||||||||||||
| Real estate taxes | (36,525) | (42,947) | (77,454) | (86,316) | ||||||||||||||||||||||||||||||||||||||||
| (73,154) | (77,330) | (5.4) | % | (150,367) | (154,827) | (2.9) | % | |||||||||||||||||||||||||||||||||||||
| Same property NOI | $ | 229,470 | $ | 217,456 | 5.5 | % | $ | 458,635 | $ | 433,863 | 5.7 | % | ||||||||||||||||||||||||||||||||
| NOI margin | 75.8 | % | 73.8 | % | 75.3 | % | 73.7 | % | ||||||||||||||||||||||||||||||||||||
| Expense recovery ratio | 93.4 | % | 89.8 | % | 92.8 | % | 89.8 | % | ||||||||||||||||||||||||||||||||||||
| Percent Contribution to Same Property NOI Performance: | ||||||||||||||||||||||||||||||||||||||||||||
| Change | Percent Contribution | Change | Percent Contribution | |||||||||||||||||||||||||||||||||||||||||
| Base rent | $ | 8,264 | 3.8 | % | $ | 16,502 | 3.8 | % | ||||||||||||||||||||||||||||||||||||
| Revenues deemed uncollectible | 584 | 0.2 | % | 1,907 | 0.5 | % | ||||||||||||||||||||||||||||||||||||||
| Net expense reimbursements | 3,046 | 1.4 | % | 4,900 | 1.1 | % | ||||||||||||||||||||||||||||||||||||||
| Ancillary and other rental income / Other revenues | (281) | (0.1) | % | 543 | 0.1 | % | ||||||||||||||||||||||||||||||||||||||
| Percentage rents | 401 | 0.2 | % | 920 | 0.2 | % | ||||||||||||||||||||||||||||||||||||||
| 5.5 | % | 5.7 | % | |||||||||||||||||||||||||||||||||||||||||
| Reconciliation of Net Income to Same Property NOI | ||||||||||||||||||||||||||||||||||||||||||||
| Net income | $ | 70,125 | $ | 56,408 | $ | 159,030 | $ | 168,654 | ||||||||||||||||||||||||||||||||||||
| Adjustments: | ||||||||||||||||||||||||||||||||||||||||||||
| Non-same property NOI | (2,195) | (3,247) | (5,032) | (8,754) | ||||||||||||||||||||||||||||||||||||||||
| Lease termination fees | (959) | (676) | (1,349) | (2,945) | ||||||||||||||||||||||||||||||||||||||||
| Straight-line rental income, net | (7,981) | (7,421) | (15,536) | (11,422) | ||||||||||||||||||||||||||||||||||||||||
| Accretion of below-market leases, net of amortization of above-market leases and tenant inducements | (1,810) | (1,568) | (3,534) | (4,236) | ||||||||||||||||||||||||||||||||||||||||
| Straight-line ground rent expense, net | (6) | (8) | (11) | (17) | ||||||||||||||||||||||||||||||||||||||||
| Depreciation and amortization | 92,018 | 88,812 | 183,236 | 176,553 | ||||||||||||||||||||||||||||||||||||||||
| Impairment of real estate assets | 5,280 | 16,736 | 5,280 | 17,836 | ||||||||||||||||||||||||||||||||||||||||
| General and administrative | 29,689 | 28,514 | 58,180 | 57,686 | ||||||||||||||||||||||||||||||||||||||||
| Total other expense | 45,309 | 39,906 | 78,371 | 40,508 | ||||||||||||||||||||||||||||||||||||||||
| Same property NOI | $ | 229,470 | $ | 217,456 | $ | 458,635 | $ | 433,863 | ||||||||||||||||||||||||||||||||||||
ix |
|
|||||||
| EBITDA & RECONCILIATION OF DEBT OBLIGATIONS, NET TO NET PRINCIPAL DEBT | |||||||||||||||||||||||||||||
| Unaudited, dollars in thousands | |||||||||||||||||||||||||||||
| Three Months Ended | Six Months Ended | ||||||||||||||||||||||||||||
| 6/30/24 | 6/30/23 | 6/30/24 | 6/30/23 | ||||||||||||||||||||||||||
| Net income | $ | 70,125 | $ | 56,408 | $ | 159,030 | $ | 168,654 | |||||||||||||||||||||
| Interest expense | 53,655 | 47,485 | 105,143 | 96,165 | |||||||||||||||||||||||||
| Federal and state taxes | 655 | 638 | 1,366 | 1,348 | |||||||||||||||||||||||||
| Depreciation and amortization | 92,018 | 88,812 | 183,236 | 176,553 | |||||||||||||||||||||||||
| EBITDA | 216,453 | 193,343 | 448,775 | 442,720 | |||||||||||||||||||||||||
| Gain on sale of real estate assets | (1,814) | (3,857) | (16,956) | (52,325) | |||||||||||||||||||||||||
| Impairment of real estate assets | 5,280 | 16,736 | 5,280 | 17,836 | |||||||||||||||||||||||||
| EBITDAre | $ | 219,919 | $ | 206,222 | $ | 437,099 | $ | 408,231 | |||||||||||||||||||||
| EBITDAre | $ | 219,919 | $ | 206,222 | $ | 437,099 | $ | 408,231 | |||||||||||||||||||||
| Transaction expenses, net | 13 | 37 | 58 | 95 | |||||||||||||||||||||||||
| Gain on extinguishment of debt, net | (281) | (4,350) | (281) | (4,350) | |||||||||||||||||||||||||
| Total adjustments | (268) | (4,313) | (223) | (4,255) | |||||||||||||||||||||||||
| Adjusted EBITDA | $ | 219,651 | $ | 201,909 | $ | 436,876 | $ | 403,976 | |||||||||||||||||||||
| Adjusted EBITDA | $ | 219,651 | $ | 201,909 | $ | 436,876 | $ | 403,976 | |||||||||||||||||||||
| Straight-line rental income, net | (7,981) | (7,421) | (15,536) | (11,422) | |||||||||||||||||||||||||
| Accretion of below-market leases, net of amortization of above-market leases and tenant inducements | (1,810) | (1,568) | (3,534) | (4,236) | |||||||||||||||||||||||||
| Straight-line ground rent expense, net (1) | (6) | (8) | (11) | (17) | |||||||||||||||||||||||||
| Total adjustments | (9,797) | (8,997) | (19,081) | (15,675) | |||||||||||||||||||||||||
| Cash Adjusted EBITDA | $ | 209,854 | $ | 192,912 | $ | 417,795 | $ | 388,301 | |||||||||||||||||||||
| (1) Straight-line ground rent expense, net is included in Operating costs on the Consolidated Statements of Operations. | |||||||||||||||||||||||||||||
| Reconciliation of Debt Obligations, Net to Net Principal Debt | |||||||||||||||||||||||||||||
| As of | |||||||||||||||||||||||||||||
| 6/30/24 | |||||||||||||||||||||||||||||
| Debt obligations, net | $ | 5,375,222 | |||||||||||||||||||||||||||
| Less: Net unamortized premium | (15,681) | ||||||||||||||||||||||||||||
| Add: Deferred financing fees | 28,912 | ||||||||||||||||||||||||||||
| Less: Cash, cash equivalents and restricted cash | (474,956) | ||||||||||||||||||||||||||||
| Net Principal Debt | $ | 4,913,497 | |||||||||||||||||||||||||||
| Adjusted EBITDA, current quarter annualized | $ | 878,604 | |||||||||||||||||||||||||||
| Net Principal Debt to Adjusted EBITDA, current quarter annualized | 5.6x | ||||||||||||||||||||||||||||
| Adjusted EBITDA, trailing twelve months | $ | 841,907 | |||||||||||||||||||||||||||
| Net Principal Debt to Adjusted EBITDA, trailing twelve months | 5.8x | ||||||||||||||||||||||||||||
x |
|
|||||||

| > | SUPPLEMENTAL DISCLOSURE | ||||
| Three Months Ended June 30, 2024 | |||||
| TABLE OF CONTENTS | |||||||||||||||||
| Page | |||||||||||||||||
| Note: Financial and operational information is unaudited. | |||||||||||||||||
| For additional information, please visit https://www.brixmor.com; follow Brixmor on LinkedIn at https://www.linkedin.com/company/brixmor, Facebook at https://www.facebook.com/Brixmor, Instagram at https://www.instagram.com/brixmorpropertygroup, and Youtube at https://www.youtube.com/user/Brixmor. | |||||||||||||||||
| This Supplemental Disclosure may contain forward-looking statements within the meaning of Section 27A of the Securities Act of 1933 and Section 21E of the Securities Exchange Act of 1934. These statements include, but are not limited to, statements related to the Company’s expectations regarding the performance of its business, its financial results, its liquidity and capital resources and other non-historical statements. You can identify these forward-looking statements by the use of words such as “outlook,” “believes,” “expects,” “potential,” “continues,” “may,” “will,” “should,” “seeks,” “projects,” “predicts,” “intends,” “plans,” “estimates,” “anticipates” or the negative version of these words or other comparable words. Such forward-looking statements are subject to various risks and uncertainties, including those described under the sections entitled “Forward-Looking Statements” and “Risk Factors” in the Company’s Annual Report on Form 10-K for the year ended December 31, 2023, as such factors may be updated from time to time in the Company's periodic filings with the SEC, which are accessible on the SEC’s website at www.sec.gov. Accordingly, there are or will be important factors that could cause actual outcomes or results to differ materially from those indicated in these statements. These factors should not be construed as exhaustive and should be read in conjunction with the other cautionary statements that are included in this release and in the Company’s other periodic filings with the SEC. The forward looking statements speak only as of the date of this release, and the Company expressly disclaims any obligation or undertaking to publicly update or review any forward-looking statement, whether as a result of new information, future developments, or otherwise, except to the extent otherwise required by law. | |||||||||||||||||
| Supplemental Disclosure - Three Months Ended June 30, 2024 |  |
|||||||
GLOSSARY OF TERMS |
||||||||||||||||||||||||||||||||||||||
Term |
Definition |
|||||||||||||||||||||||||||||||||||||
| Adjusted SOFR | Secured Overnight Financing Rate, plus 0.10%. | |||||||||||||||||||||||||||||||||||||
Anchor Spaces |
Spaces equal to or greater than 10,000 square feet ("SF") of GLA. |
|||||||||||||||||||||||||||||||||||||
Anchor Space Repositioning |
Anchor leasing that is primarily focused on reconfiguring or significantly remerchandising existing space with minimal work required outside of normal tenant improvement and landlord costs. |
|||||||||||||||||||||||||||||||||||||
Annualized Base Rent ("ABR") |
Contractual monthly base rent as of a specified date, under leases that have been signed or commenced as of the specified date, multiplied by 12. Annualized base rent differs from how rent is calculated in accordance with GAAP for purposes of financial statements. See Straight-line Rent definition for additional information. For purposes of calculating ABR, all signed or commenced leases with an initial term of one year or greater are included and all signed leases on space that will be vacated by existing tenants in the near term are excluded. | |||||||||||||||||||||||||||||||||||||
ABR PSF |
ABR divided by leased GLA, excluding the GLA of lessee-owned leasehold improvements. |
|||||||||||||||||||||||||||||||||||||
Billed GLA |
Aggregate GLA of all commenced leases with an initial term of one year or greater, as of a specified date. |
|||||||||||||||||||||||||||||||||||||
| Core-Based Statistical Areas ("CBSA") | Defined by the United States Census Bureau as the collection of both Metropolitan and Micropolitan Statistical Areas. Metropolitan Statistical Areas are defined as a region associated with at least one urbanized area that has a population of at least 50,000 and comprises the central county or counties containing the core, plus adjacent outlying counties having a high degree of social and economic integration with the central county or counties as measured through commuting. Micropolitan Statistical Areas are defined as a region with at least one urbanized area that has a population of at least 10,000 but less than 50,000, plus adjacent territories that have a high degree of social and economic integration with the central county or counties as measured through commuting. References to CBSA rank are based on population estimates from Synergos Technologies, Inc. |
|||||||||||||||||||||||||||||||||||||
| EBITDA, EBITDAre, Adjusted EBITDA, Cash Adjusted EBITDA, Net Principal Debt to Adjusted EBITDA, current quarter annualized, & Net Principal Debt to Adjusted EBITDA, trailing twelve months |
Supplemental, non-GAAP performance measures. Please see below for more information on the limitations of non-GAAP performance measures.
A reconciliation of net income to each of these measures is provided on page 7.
EBITDA is calculated as the sum of net income (loss), calculated in accordance with GAAP, excluding (i) interest expense, (ii) federal and state taxes, and (iii) depreciation and amortization. EBITDAre, which is computed in accordance with Nareit's definition, represents EBITDA excluding (i) gains and losses from the sale of certain real estate assets, (ii) gains and losses from change in control, (iii) impairment write-downs of certain real estate assets and investments in entities when the impairment is directly attributable to decreases in the value of depreciable real estate held by the entity. Adjusted EBITDA represents EBITDAre excluding (i) gain (loss) on extinguishment of debt, net and (ii) other items that the Company believes are not indicative of the Company's operating performance. Cash Adjusted EBITDA represents Adjusted EBITDA excluding (i) straight-line rental income, net, (ii) accretion of below-market leases, net of amortization of above-market leases and tenant inducements and (iii) straight-line ground rent expense, net. Net Principal Debt to Adjusted EBITDA, current quarter annualized and Net Principal Debt to Adjusted EBITDA, trailing twelve months are calculated as Net Principal Debt divided by quarterly annualized Adjusted EBITDA or trailing twelve month Adjusted EBITDA, respectively. EBITDA, EBITDAre, Adjusted EBITDA, Cash Adjusted EBITDA, Net Principal Debt to Adjusted EBITDA, current quarter annualized, and Net Principal Debt to Adjusted EBITDA, trailing twelve months are calculated after adjustments for unconsolidated joint ventures to reflect each measure on the same basis.
|
|||||||||||||||||||||||||||||||||||||
| Essential Tenants | Businesses deemed necessary for day-to-day living, such as grocery, pharmacy, and general merchandise (discount) businesses. | |||||||||||||||||||||||||||||||||||||
| Generally Accepted Accounting Principles ("GAAP") | GAAP refers to a common set of United States of America accounting rules, standards, and procedures issued by the Financial Accounting Standards Board. | |||||||||||||||||||||||||||||||||||||
Gross Leasable Area ("GLA") |
Represents the total amount of leasable property square footage. |
|||||||||||||||||||||||||||||||||||||
Leased GLA |
Aggregate GLA of all signed or commenced leases with an initial term of one year or greater, as of a specified date, excluding all signed leases on space that will be vacated by existing tenants in the near term. | |||||||||||||||||||||||||||||||||||||
| Local Tenants | Single-state operators with fewer than 20 locations. | |||||||||||||||||||||||||||||||||||||
| Major Tenants | Any grocer and all national / regional anchor tenants. | |||||||||||||||||||||||||||||||||||||
| Nareit | National Association of Real Estate Investment Trusts. |
|||||||||||||||||||||||||||||||||||||
| Nareit Funds From Operations (“FFO") |
A supplemental, non-GAAP performance measure. Please see below for more information on the limitations of non-GAAP performance measures. A reconciliation of net income to Nareit FFO is provided on page 8.
Nareit defines FFO as net income (loss), calculated in accordance with GAAP, excluding (i) depreciation and amortization related to real estate, (ii) gains and losses from the sale of certain real estate assets, (iii) gains and losses from change in control, (iv) impairment write-downs of certain real estate assets and investments in entities when the impairment is directly attributable to decreases in the value of depreciable real estate held by the entity and (v) after adjustments for unconsolidated joint ventures calculated to reflect FFO on the same basis.
|
|||||||||||||||||||||||||||||||||||||
| National / Regional Tenants | Multi-state operators or single-state operators with 20 or more locations and state agencies and government offices. Includes franchise locations. | |||||||||||||||||||||||||||||||||||||
| Net Effective Rent Before Tenant Specific Landlord Work | Average ABR PSF over the lease term adjusted for tenant improvements and allowances (excluding base building costs) and third-party leasing commissions. For purposes of calculating net effective rent before tenant specific landlord work, ABR PSF includes the GLA of lessee-owned leasehold improvements. | |||||||||||||||||||||||||||||||||||||
Net Operating Income ("NOI") |
A supplemental, non-GAAP performance measure. Please see below for more information on the limitations of non-GAAP performance measures.
A reconciliation of net income to NOI is provided on page 10.
Calculated as total property revenues (base rent, expense reimbursements, adjustments for revenues deemed uncollectible, ancillary and other rental income, percentage rents, and other revenues) less direct property operating expenses (operating costs and real estate taxes). NOI excludes (i) lease termination fees, (ii) straight-line rental income, net, (iii) accretion of below-market leases, net of amortization of above-market leases and tenant inducements, (iv) straight-line ground rent expense, net, (v) depreciation and amortization, (vi) impairment of real estate assets, (vii) general and administrative expense, and (viii) other income and expense (including interest expense and gain on sale of real estate assets).
|
|||||||||||||||||||||||||||||||||||||
| Net Principal Debt | Debt obligations, net, calculated in accordance with GAAP, excluding net unamortized premium or discount and deferred financing fees less cash, cash equivalents, and restricted cash. A reconciliation of debt obligations, net to Net Principal Debt is provided on page 7. |
|||||||||||||||||||||||||||||||||||||
New Development |
Refers to ground up development of new shopping centers. Does not refer to outparcel development. |
|||||||||||||||||||||||||||||||||||||
| New Development & Reinvestment Stabilization | New Development and Reinvestment projects are deemed stabilized upon reaching 90.0% billed occupancy of the impacted space. New Development projects are included in the operating portfolio upon the earlier of (i) reaching 90.0% billed occupancy of the impacted space or (ii) one year after the associated assets are placed in service. | |||||||||||||||||||||||||||||||||||||
NOI Yield |
Calculated as the projected incremental NOI as a percentage of the estimated incremental third-party costs of a specified project, net of any project specific credits (lease termination fees or other ancillary credits). | |||||||||||||||||||||||||||||||||||||
| Non-owned Major Tenants | Also known as shadow anchors. Refers to tenants that are situated on parcels that are owned by unrelated third parties, but, due to their location within or immediately adjacent to a shopping center, appear to the consumer as a retail tenant of the shopping center and, as a result, attract additional consumer traffic to the center. | |||||||||||||||||||||||||||||||||||||
Outparcel(s) |
Refers to a portion of a shopping center, separate from the main retail buildings and generally located on the outer edge of a property, which may currently, or in the future, contain one or several freestanding buildings. |
|||||||||||||||||||||||||||||||||||||
Outparcel Development |
Construction of a new outparcel. May also refer to the demolition of an existing outparcel building to accommodate the construction of a new outparcel. | |||||||||||||||||||||||||||||||||||||
Percent Billed |
Billed GLA as a percentage of total GLA. |
|||||||||||||||||||||||||||||||||||||
| Supplemental Disclosure - Three Months Ended June 30, 2024 | Page 1 |
|
||||||
GLOSSARY OF TERMS |
||||||||||||||||||||||||||||||||||||||
Term |
Definition |
|||||||||||||||||||||||||||||||||||||
Percent Leased |
Leased GLA as a percentage of total GLA. |
|||||||||||||||||||||||||||||||||||||
PSF |
Per square foot of GLA. |
|||||||||||||||||||||||||||||||||||||
| Redevelopment | Larger scale projects that typically involve new construction, reconfiguration, significant remerchandising, and upgrades or demolition of a portion of the shopping center to accommodate new retailers. | |||||||||||||||||||||||||||||||||||||
| Reinvestment Projects | Represents anchor space repositioning, outparcel development, and/or redevelopment projects. | |||||||||||||||||||||||||||||||||||||
Rent Spread |
Represents the percentage change in contractual ABR PSF in the first year of the new lease relative to contractual ABR PSF in the last year of the old lease. Rent spreads are presented only for leases deemed comparable. For purposes of calculating rent spreads, ABR PSF includes the GLA of lessee-owned leasehold improvements. | |||||||||||||||||||||||||||||||||||||
New Rent Spread |
Includes new leases signed on units that were occupied within the prior 12 months. New leases signed on units that have been vacant for longer than 12 months, new leases signed on first generation space, and new leases that are ancillary in nature regardless of term are deemed non-comparable and excluded from New Rent Spreads. | |||||||||||||||||||||||||||||||||||||
Renewal Rent Spread |
Includes renewal leases signed with the same tenant in all or a portion of the same location or that include the expansion into space that was occupied within the prior 12 months. Renewals that include the expansion of an existing tenant into space that has been vacant for longer than 12 months and renewals that are ancillary in nature regardless of term are deemed non-comparable and excluded from Renewal Rent Spreads. | |||||||||||||||||||||||||||||||||||||
Option Rent Spread |
Includes contractual renewal options exercised by tenants in the same location to extend the term of an expiring lease. |
|||||||||||||||||||||||||||||||||||||
Total Rent Spread |
Combined spreads for new, renewal, and option leases. | |||||||||||||||||||||||||||||||||||||
Same Property NOI |
A supplemental, non-GAAP performance measure. Please see below for more information on the limitations of non-GAAP performance measures. A reconciliation of net income to Same Property NOI is provided on page 11.
Represents NOI of properties owned for the entirety of both periods and excluding properties under development and completed New Development properties that have been stabilized for less than one year. Same Property NOI excludes income or expense associated with the Company's captive insurance company.
|
|||||||||||||||||||||||||||||||||||||
| Number of Properties in Same Property NOI Analysis: | Three Months Ended 6/30/24 |
Six Months Ended 6/30/24 |
||||||||||||||||||||||||||||||||||||
| Total properties in Brixmor Property Group portfolio | 360 | 360 | ||||||||||||||||||||||||||||||||||||
| Acquired properties excluded from Same Property NOI | (2) | (2) | ||||||||||||||||||||||||||||||||||||
| Additional exclusions (1) | (3) | (4) | ||||||||||||||||||||||||||||||||||||
| Same Property NOI pool (2) | 355 | 354 | ||||||||||||||||||||||||||||||||||||
| (1) Additional exclusions for the three months ended June 30, 2024 and 2023 include two properties that were subject to partial dispositions in 2023 and one property that was subject to partial disposition in 2024. Additional exclusions for the six months ended June 30, 2024 and 2023 include three properties that were subject to partial dispositions in 2023 and one property subject to partial disposition in 2024. | ||||||||||||||||||||||||||||||||||||||
| (2) The Same Property NOI pool includes the balance of a shopping center when an outparcel has been acquired or if a partial disposition can be disaggregated from the remaining property. One outparcel acquired in 2023 is excluded from the Same Property NOI pool for the three and six months ended June 30, 2024 and 2023. | ||||||||||||||||||||||||||||||||||||||
Small Shop Spaces |
Spaces less than 10,000 SF of GLA. |
|||||||||||||||||||||||||||||||||||||
| Secured Overnight Financing Rate ("SOFR") | SOFR is a benchmark interest rate for dollar-denominated derivatives and loans that replaced the London Interbank Offered Rate ("LIBOR"). | |||||||||||||||||||||||||||||||||||||
Straight-line Rent |
Non-cash revenue recognized related to the GAAP requirement to average a tenant's contractual base rent over the life of the lease. The Company commences recognizing rental revenue based on the date it makes the underlying asset available for use by the tenant. The cumulative difference between rental revenue recognized and contractual payment terms is recognized as deferred rent and included in Receivables, net on the Consolidated Balance Sheets. The Company periodically evaluates the collectability of its receivables related to straight-line rent. Any receivables that are deemed to be uncollectible are recognized as a reduction to straight-line rental income, net. |
|||||||||||||||||||||||||||||||||||||
Year Built |
Year of most recent redevelopment or year built if no redevelopment has occurred. |
|||||||||||||||||||||||||||||||||||||
Non-GAAP Performance Measures |
||||||||||||||||||||||||||||||||||||||
| The Company presents the non-GAAP performance measures set forth below. These measures should not be considered as alternatives to, or more meaningful than, net income (calculated in accordance with GAAP) or other GAAP financial measures, as an indicator of financial performance and are not alternatives to, or more meaningful than, cash flow from operating activities (calculated in accordance with GAAP) as a measure of liquidity. Non-GAAP performance measures have limitations as they do not include all items of income and expense that affect operations, and accordingly, should always be considered as supplemental financial results to those calculated in accordance with GAAP. The Company’s computation of these non-GAAP performance measures may differ in certain respects from the methodology utilized by other REITs and, therefore, may not be comparable to similarly titled measures presented by such other REITs. Investors are cautioned that items excluded from these non-GAAP performance measures are relevant to understanding and addressing financial performance. | ||||||||||||||||||||||||||||||||||||||
The Company believes that the non-GAAP performance measures it presents are useful to investors for the following reasons: |
||||||||||||||||||||||||||||||||||||||
| • EBITDA, EBITDAre, Adjusted EBITDA, Cash Adjusted EBITDA, Net Principal Debt to Adjusted EBITDA, current quarter annualized, & Net Principal Debt to Adjusted EBITDA, trailing twelve months |
Considering the nature of its business as a real estate owner and operator, the Company believes that EBITDA, EBITDAre, Adjusted EBITDA, Cash Adjusted EBITDA, Net Principal Debt to Adjusted EBITDA, current quarter annualized, and Net Principal Debt to Adjusted EBITDA, trailing twelve months, are useful to investors in measuring its operating performance because they exclude items included in net income that do not relate to or are not indicative of the operating performance of the Company’s real estate. The Company believes EBITDA, EBITDAre, Adjusted EBITDA, Cash Adjusted EBITDA, Net Principal Debt to Adjusted EBITDA, current quarter annualized, and Net Principal Debt to Adjusted EBITDA, trailing twelve months are widely known and understood measures of performance, independent of a company's capital structure and items which can make periodic and peer analyses of performance more difficult, and that these metrics can provide investors with a more consistent basis by which to compare the Company with its peers. | |||||||||||||||||||||||||||||||||||||
| • Nareit FFO | Considering the nature of its business as a real estate owner and operator, the Company believes that Nareit FFO is useful to investors in measuring its operating and financial performance because the definition excludes items included in net income that do not relate to or are not indicative of the Company’s operating and financial performance, such as depreciation and amortization related to real estate, and items which can make periodic and peer analyses of operating and financial performance more difficult, such as gains and losses from the sale of certain real estate assets and impairment write-downs of certain real estate assets. | |||||||||||||||||||||||||||||||||||||
• NOI and Same Property NOI |
Considering the nature of its business as a real estate owner and operator, the Company believes that NOI is useful to investors in measuring the operating performance of its portfolio because the definition excludes various items included in net income that do not relate to, or are not indicative of, the operating performance of the Company’s properties, such as lease termination fees, straight-line rental income, net, accretion of below-market leases, net of amortization of above-market leases and tenant inducements, straight-line ground rent expense, net, income or expense associated with the Company's captive insurance company, depreciation and amortization, impairment of real estate assets, general and administrative expense, and other income and expense (including interest expense and gain on sale of real estate assets). The Company believes that Same Property NOI is also useful to investors because it further eliminates disparities in NOI by only including NOI of properties owned for the entirety of both periods presented and excluding properties under development and completed New Development properties that have been stabilized for less than one year and therefore provides a more consistent metric for comparing the operating performance of the Company's real estate between periods. | |||||||||||||||||||||||||||||||||||||
| Supplemental Disclosure - Three Months Ended June 30, 2024 | Page 2 |
|
||||||
RESULTS OVERVIEW & GUIDANCE |
|||||||||||||||||||||||||||||||||||||||||
Unaudited, dollars in thousands, except per share and per square foot amounts |
|||||||||||||||||||||||||||||||||||||||||
Three Months Ended |
Six Months Ended | ||||||||||||||||||||||||||||||||||||||||
Summary Financial Results |
6/30/24 | 6/30/23 | 6/30/24 | 6/30/23 | |||||||||||||||||||||||||||||||||||||
Total revenues (page 6) |
$ 315,689 | $ 309,793 | $ 635,930 | $ 621,237 | |||||||||||||||||||||||||||||||||||||
Net income (page 6) |
70,125 | 56,408 | 159,030 | 168,654 | |||||||||||||||||||||||||||||||||||||
Net income per diluted share (page 6) |
0.23 | 0.19 | 0.52 | 0.56 | |||||||||||||||||||||||||||||||||||||
NOI (page 10) |
231,665 | 220,703 | 463,667 | 442,617 | |||||||||||||||||||||||||||||||||||||
EBITDA (page 7) |
216,453 | 193,343 | 448,775 | 442,720 | |||||||||||||||||||||||||||||||||||||
EBITDAre (page 7) |
219,919 | 206,222 | 437,099 | 408,231 | |||||||||||||||||||||||||||||||||||||
Adjusted EBITDA (page 7) |
219,651 | 201,909 | 436,876 | 403,976 | |||||||||||||||||||||||||||||||||||||
Cash Adjusted EBITDA (page 7) |
209,854 | 192,912 | 417,795 | 388,301 | |||||||||||||||||||||||||||||||||||||
Nareit FFO (page 8) |
163,809 | 157,093 | 327,245 | 308,719 | |||||||||||||||||||||||||||||||||||||
Nareit FFO per diluted share (page 8) |
0.54 | 0.52 | 1.08 | 1.02 | |||||||||||||||||||||||||||||||||||||
Items that impact FFO comparability, net per share (page 8) |
0.00 | 0.01 | 0.00 | 0.01 | |||||||||||||||||||||||||||||||||||||
Dividends declared per share (page 8) |
0.2725 | 0.2600 | 0.5450 | 0.5200 | |||||||||||||||||||||||||||||||||||||
Dividend payout ratio (as % of Nareit FFO) (page 8) |
50.1 | % | 49.8 | % | 50.2 | % | 50.6 | % | |||||||||||||||||||||||||||||||||
| Three Months Ended | |||||||||||||||||||||||||||||||||||||||||
| Summary Operating and Financial Ratios | 6/30/24 | 3/31/24 | 12/31/23 | 9/30/23 | 6/30/23 | ||||||||||||||||||||||||||||||||||||
NOI margin (page 10) |
76.0 | % | 74.7 | % | 72.9 | % | 74.2 | % | 73.5 | % | |||||||||||||||||||||||||||||||
Same property NOI performance (page 11) (1) |
5.5 | % | 5.9 | % | 3.1 | % | 4.8 | % | 2.7 | % | |||||||||||||||||||||||||||||||
Fixed charge coverage, current quarter annualized (page 13) |
4.1x | 4.2x | 4.3x | 4.3x | 4.3x | ||||||||||||||||||||||||||||||||||||
Fixed charge coverage, trailing twelve months (page 13) |
4.2x | 4.3x | 4.2x | 4.2x | 4.1x | ||||||||||||||||||||||||||||||||||||
Net Principal Debt to Adjusted EBITDA, current quarter annualized (page 7) (2) |
5.6x | 5.6x | 6.0x | 6.1x | 6.1x | ||||||||||||||||||||||||||||||||||||
Net Principal Debt to Adjusted EBITDA, trailing twelve months (page 7) (2) |
5.8x | 5.9x | 6.1x | 6.1x | 6.1x | ||||||||||||||||||||||||||||||||||||
Outstanding Classes of Stock |
As of 6/30/24 | As of 3/31/24 | As of 12/31/23 | As of 9/30/23 | As of 6/30/23 | ||||||||||||||||||||||||||||||||||||
Common shares outstanding (page 13) |
301,345 | 301,299 | 300,596 | 300,596 | 300,593 | ||||||||||||||||||||||||||||||||||||
| Three Months Ended | |||||||||||||||||||||||||||||||||||||||||
| Summary Acquisitions and Dispositions | 6/30/24 | 3/31/24 | 12/31/23 | 9/30/23 | 6/30/23 | ||||||||||||||||||||||||||||||||||||
Aggregate purchase price of acquisitions (page 17) |
$ 17,250 | $ — | $ 400 | $ — | $ 1,803 | ||||||||||||||||||||||||||||||||||||
Aggregate sale price of dispositions (page 18) |
345 | 68,960 | 21,576 | 16,975 | 26,771 | ||||||||||||||||||||||||||||||||||||
| NOI adjustment for acquisitions and dispositions, net (3) | 65 | ||||||||||||||||||||||||||||||||||||||||
| Summary Portfolio Statistics (4) | As of 6/30/24 | As of 3/31/24 | As of 12/31/23 | As of 9/30/23 | As of 6/30/23 | ||||||||||||||||||||||||||||||||||||
Number of properties (page 26) |
360 | 359 | 362 | 364 | 365 | ||||||||||||||||||||||||||||||||||||
Percent billed (page 26) |
91.4 | % | 90.6 | % | 90.6 | % | 90.0 | % | 90.4 | % | |||||||||||||||||||||||||||||||
Percent leased (page 26) |
95.4 | % | 95.1 | % | 94.7 | % | 93.9 | % | 94.1 | % | |||||||||||||||||||||||||||||||
ABR PSF (page 26) |
$ 17.26 | $ 17.12 | $ 16.88 | $ 16.77 | $ 16.60 | ||||||||||||||||||||||||||||||||||||
New lease rent spread (page 29) |
50.2 | % | 39.7 | % | 37.4 | % | 52.7 | % | 22.4 | % | |||||||||||||||||||||||||||||||
New & renewal lease rent spread (page 29) |
27.7 | % | 19.5 | % | 19.6 | % | 22.3 | % | 15.4 | % | |||||||||||||||||||||||||||||||
Total - new, renewal & option lease rent spread (page 29) |
19.7 | % | 14.1 | % | 15.6 | % | 17.5 | % | 12.9 | % | |||||||||||||||||||||||||||||||
Total - new, renewal & option GLA (page 29) |
2,343,546 | 2,626,599 | 2,679,220 | 2,733,476 | 2,302,495 | ||||||||||||||||||||||||||||||||||||
| 2024 Guidance | Current | Previous (at 4/29/24) |
YTD | ||||||||||||||||||||||||||||||||||||||
| Nareit FFO per diluted share | $2.11 - 2.14 | $2.08 - $2.11 | $1.08 | ||||||||||||||||||||||||||||||||||||||
| Same property NOI performance | 4.25% - 5.00% | 3.50% - 4.25% | 5.7% | ||||||||||||||||||||||||||||||||||||||
| (1) Reflects same property NOI as reported for the specified period. | |||||||||||||||||||||||||||||||||||||||||
| (2) Net Principal Debt is as of the end of each specified period. | |||||||||||||||||||||||||||||||||||||||||
| (3) Represents an estimate of the incremental NOI that the Company would have recognized if the assets that were acquired during the quarter had been owned for the full quarter, adjusted for one-time items, net of NOI recognized during the quarter for the assets that were disposed of during the quarter. | |||||||||||||||||||||||||||||||||||||||||
| (4) Reflects portfolio statistics as reported for the specified period. | |||||||||||||||||||||||||||||||||||||||||
| Supplemental Disclosure - Three Months Ended June 30, 2024 | Page 3 |
|
||||||
| > | FINANCIAL SUMMARY | ||||
| Supplemental Disclosure | |||||
| Three Months Ended June 30, 2024 | |||||
| CONSOLIDATED BALANCE SHEETS | ||||||||||||||||||||||||||
Unaudited, dollars in thousands, except share information |
||||||||||||||||||||||||||
As of |
As of |
|||||||||||||||||||||||||
| 6/30/24 | 12/31/23 | |||||||||||||||||||||||||
Assets |
||||||||||||||||||||||||||
Real estate |
||||||||||||||||||||||||||
| Land | $ | 1,779,106 | $ | 1,794,011 | ||||||||||||||||||||||
| Buildings and tenant improvements | 8,673,678 | 8,570,874 | ||||||||||||||||||||||||
| Construction in progress | 109,735 | 126,007 | ||||||||||||||||||||||||
| Lease intangibles | 499,460 | 504,995 | ||||||||||||||||||||||||
| 11,061,979 | 10,995,887 | |||||||||||||||||||||||||
| Accumulated depreciation and amortization | (3,315,103) | (3,198,980) | ||||||||||||||||||||||||
| Real estate, net | 7,746,876 | 7,796,907 | ||||||||||||||||||||||||
| Cash and cash equivalents | 473,615 | 866 | ||||||||||||||||||||||||
| Restricted cash | 1,341 | 18,038 | ||||||||||||||||||||||||
| Marketable securities | 21,985 | 19,914 | ||||||||||||||||||||||||
| Receivables, net, including straight-line rent receivables of $195,330 and $180,810, respectively | 252,664 | 278,775 | ||||||||||||||||||||||||
| Deferred charges and prepaid expenses, net | 169,872 | 164,061 | ||||||||||||||||||||||||
| Real estate assets held for sale | 11,048 | — | ||||||||||||||||||||||||
| Other assets | 53,300 | 54,155 | ||||||||||||||||||||||||
| Total assets | $ | 8,730,701 | $ | 8,332,716 | ||||||||||||||||||||||
| Liabilities | ||||||||||||||||||||||||||
| Debt obligations, net | $ | 5,375,222 | $ | 4,933,525 | ||||||||||||||||||||||
| Accounts payable, accrued expenses and other liabilities | 500,293 | 548,890 | ||||||||||||||||||||||||
| Total liabilities | 5,875,515 | 5,482,415 | ||||||||||||||||||||||||
| Equity | ||||||||||||||||||||||||||
| Common stock, $0.01 par value; authorized 3,000,000,000 shares; | ||||||||||||||||||||||||||
310,472,378 and 309,723,386 shares issued and 301,345,386 and 300,596,394 |
||||||||||||||||||||||||||
| shares outstanding | 3,013 | 3,006 | ||||||||||||||||||||||||
| Additional paid-in capital | 3,307,357 | 3,310,590 | ||||||||||||||||||||||||
| Accumulated other comprehensive income (loss) | 12,377 | (2,700) | ||||||||||||||||||||||||
| Distributions in excess of net income | (467,561) | (460,595) | ||||||||||||||||||||||||
| Total equity | 2,855,186 | 2,850,301 | ||||||||||||||||||||||||
| Total liabilities and equity | $ | 8,730,701 | $ | 8,332,716 | ||||||||||||||||||||||
| Supplemental Disclosure - Three Months Ended June 30, 2024 | Page 5 |
|
||||||
| CONSOLIDATED STATEMENTS OF OPERATIONS | |||||||||||||||||||||||||||||
| Unaudited, dollars in thousands, except per share amounts | |||||||||||||||||||||||||||||
| Three Months Ended | Six Months Ended | ||||||||||||||||||||||||||||
| 6/30/24 | 6/30/23 | 6/30/24 | 6/30/23 | ||||||||||||||||||||||||||
| Revenues | |||||||||||||||||||||||||||||
| Rental income | $ | 315,587 | $ | 309,192 | $ | 635,076 | $ | 620,322 | |||||||||||||||||||||
| Other revenues | 102 | 601 | 854 | 915 | |||||||||||||||||||||||||
| Total revenues | 315,689 | 309,793 | 635,930 | 621,237 | |||||||||||||||||||||||||
| Operating expenses | |||||||||||||||||||||||||||||
| Operating costs | 36,919 | 35,705 | 74,076 | 71,600 | |||||||||||||||||||||||||
| Real estate taxes | 36,349 | 43,712 | 77,757 | 88,400 | |||||||||||||||||||||||||
| Depreciation and amortization | 92,018 | 88,812 | 183,236 | 176,553 | |||||||||||||||||||||||||
| Impairment of real estate assets | 5,280 | 16,736 | 5,280 | 17,836 | |||||||||||||||||||||||||
| General and administrative | 29,689 | 28,514 | 58,180 | 57,686 | |||||||||||||||||||||||||
| Total operating expenses | 200,255 | 213,479 | 398,529 | 412,075 | |||||||||||||||||||||||||
| Other income (expense) | |||||||||||||||||||||||||||||
| Dividends and interest | 6,632 | 57 | 10,509 | 72 | |||||||||||||||||||||||||
| Interest expense | (53,655) | (47,485) | (105,143) | (96,165) | |||||||||||||||||||||||||
| Gain on sale of real estate assets | 1,814 | 3,857 | 16,956 | 52,325 | |||||||||||||||||||||||||
| Gain on extinguishment of debt, net | 281 | 4,350 | 281 | 4,350 | |||||||||||||||||||||||||
| Other | (381) | (685) | (974) | (1,090) | |||||||||||||||||||||||||
| Total other expense | (45,309) | (39,906) | (78,371) | (40,508) | |||||||||||||||||||||||||
| Net income | $ | 70,125 | $ | 56,408 | $ | 159,030 | $ | 168,654 | |||||||||||||||||||||
| Net income per common share: | |||||||||||||||||||||||||||||
| Basic | $ | 0.23 | $ | 0.19 | $ | 0.53 | $ | 0.56 | |||||||||||||||||||||
| Diluted | $ | 0.23 | $ | 0.19 | $ | 0.52 | $ | 0.56 | |||||||||||||||||||||
| Weighted average shares: | |||||||||||||||||||||||||||||
| Basic | 302,197 | 300,961 | 302,120 | 300,899 | |||||||||||||||||||||||||
| Diluted | 302,903 | 302,285 | 302,796 | 302,234 | |||||||||||||||||||||||||
| Supplemental Disclosure - Three Months Ended June 30, 2024 | Page 6 |
|
||||||
| EBITDA & RECONCILIATION OF DEBT OBLIGATIONS, NET TO NET PRINCIPAL DEBT | |||||||||||||||||||||||||||||
| Unaudited, dollars in thousands | |||||||||||||||||||||||||||||
| Three Months Ended | Six Months Ended | ||||||||||||||||||||||||||||
| 6/30/24 | 6/30/23 | 6/30/24 | 6/30/23 | ||||||||||||||||||||||||||
| Net income | $ | 70,125 | $ | 56,408 | $ | 159,030 | $ | 168,654 | |||||||||||||||||||||
| Interest expense | 53,655 | 47,485 | 105,143 | 96,165 | |||||||||||||||||||||||||
| Federal and state taxes | 655 | 638 | 1,366 | 1,348 | |||||||||||||||||||||||||
| Depreciation and amortization | 92,018 | 88,812 | 183,236 | 176,553 | |||||||||||||||||||||||||
| EBITDA | 216,453 | 193,343 | 448,775 | 442,720 | |||||||||||||||||||||||||
| Gain on sale of real estate assets | (1,814) | (3,857) | (16,956) | (52,325) | |||||||||||||||||||||||||
| Impairment of real estate assets | 5,280 | 16,736 | 5,280 | 17,836 | |||||||||||||||||||||||||
| EBITDAre | $ | 219,919 | $ | 206,222 | $ | 437,099 | $ | 408,231 | |||||||||||||||||||||
| EBITDAre | $ | 219,919 | $ | 206,222 | $ | 437,099 | $ | 408,231 | |||||||||||||||||||||
| Transaction expenses, net | 13 | 37 | 58 | 95 | |||||||||||||||||||||||||
| Gain on extinguishment of debt, net | (281) | (4,350) | (281) | (4,350) | |||||||||||||||||||||||||
| Total adjustments | (268) | (4,313) | (223) | (4,255) | |||||||||||||||||||||||||
| Adjusted EBITDA | $ | 219,651 | $ | 201,909 | $ | 436,876 | $ | 403,976 | |||||||||||||||||||||
| Adjusted EBITDA | $ | 219,651 | $ | 201,909 | $ | 436,876 | $ | 403,976 | |||||||||||||||||||||
| Straight-line rental income, net | (7,981) | (7,421) | (15,536) | (11,422) | |||||||||||||||||||||||||
| Accretion of below-market leases, net of amortization of above-market leases and tenant inducements | (1,810) | (1,568) | (3,534) | (4,236) | |||||||||||||||||||||||||
| Straight-line ground rent expense, net (1) | (6) | (8) | (11) | (17) | |||||||||||||||||||||||||
| Total adjustments | (9,797) | (8,997) | (19,081) | (15,675) | |||||||||||||||||||||||||
| Cash Adjusted EBITDA | $ | 209,854 | $ | 192,912 | $ | 417,795 | $ | 388,301 | |||||||||||||||||||||
| (1) Straight-line ground rent expense, net is included in Operating costs on the Consolidated Statements of Operations. | |||||||||||||||||||||||||||||
| Reconciliation of Debt Obligations, Net to Net Principal Debt | |||||||||||||||||||||||||||||
| As of | |||||||||||||||||||||||||||||
| 6/30/24 | |||||||||||||||||||||||||||||
| Debt obligations, net | $ | 5,375,222 | |||||||||||||||||||||||||||
| Less: Net unamortized premium | (15,681) | ||||||||||||||||||||||||||||
| Add: Deferred financing fees | 28,912 | ||||||||||||||||||||||||||||
| Less: Cash, cash equivalents and restricted cash | (474,956) | ||||||||||||||||||||||||||||
| Net Principal Debt | $ | 4,913,497 | |||||||||||||||||||||||||||
| Adjusted EBITDA, current quarter annualized | $ | 878,604 | |||||||||||||||||||||||||||
| Net Principal Debt to Adjusted EBITDA, current quarter annualized | 5.6x | ||||||||||||||||||||||||||||
| Adjusted EBITDA, trailing twelve months | $ | 841,907 | |||||||||||||||||||||||||||
| Net Principal Debt to Adjusted EBITDA, trailing twelve months | 5.8x | ||||||||||||||||||||||||||||
| Supplemental Disclosure - Three Months Ended June 30, 2024 | Page 7 |
|
||||||
| FUNDS FROM OPERATIONS (FFO) | ||||||||||||||||||||||||||||||||
| Unaudited, dollars in thousands, except per share amounts | ||||||||||||||||||||||||||||||||
| Three Months Ended | Six Months Ended | |||||||||||||||||||||||||||||||
| 6/30/24 | 6/30/23 | 6/30/24 | 6/30/23 | |||||||||||||||||||||||||||||
| Net income | $ | 70,125 | $ | 56,408 | $ | 159,030 | $ | 168,654 | ||||||||||||||||||||||||
| Depreciation and amortization related to real estate | 90,218 | 87,806 | 179,891 | 174,554 | ||||||||||||||||||||||||||||
| Gain on sale of real estate assets | (1,814) | (3,857) | (16,956) | (52,325) | ||||||||||||||||||||||||||||
| Impairment of real estate assets | 5,280 | 16,736 | 5,280 | 17,836 | ||||||||||||||||||||||||||||
| Nareit FFO | $ | 163,809 | $ | 157,093 | $ | 327,245 | $ | 308,719 | ||||||||||||||||||||||||
| Nareit FFO per diluted share | $ | 0.54 | $ | 0.52 | $ | 1.08 | $ | 1.02 | ||||||||||||||||||||||||
| Weighted average diluted shares outstanding | 302,903 | 302,285 | 302,796 | 302,234 | ||||||||||||||||||||||||||||
| Items that impact FFO comparability | ||||||||||||||||||||||||||||||||
| Transaction expenses, net | $ | (13) | $ | (37) | $ | (58) | $ | (95) | ||||||||||||||||||||||||
| Gain on extinguishment of debt, net | 281 | 4,350 | 281 | 4,350 | ||||||||||||||||||||||||||||
| Total items that impact FFO comparability | $ | 268 | $ | 4,313 | $ | 223 | $ | 4,255 | ||||||||||||||||||||||||
| Items that impact FFO comparability, net per share | $ | 0.00 | $ | 0.01 | $ | 0.00 | $ | 0.01 | ||||||||||||||||||||||||
| Additional Disclosures | ||||||||||||||||||||||||||||||||
| Straight-line rental income, net | $ | 7,981 | $ | 7,421 | $ | 15,536 | $ | 11,422 | ||||||||||||||||||||||||
| Accretion of below-market leases, net of amortization of above-market leases and tenant inducements | 1,810 | 1,568 | 3,534 | 4,236 | ||||||||||||||||||||||||||||
| Straight-line ground rent expense, net (1) | 6 | 8 | 11 | 17 | ||||||||||||||||||||||||||||
| Dividends declared per share | $ | 0.2725 | $ | 0.2600 | $ | 0.5450 | $ | 0.520 | ||||||||||||||||||||||||
| Dividends declared | $ | 82,117 | $ | 78,154 | $ | 164,221 | $ | 156,296 | ||||||||||||||||||||||||
| Dividend payout ratio (as % of Nareit FFO) | 50.1 | % | 49.8 | % | 50.2 | % | 50.6 | % | ||||||||||||||||||||||||
| (1) Straight-line ground rent expense, net is included in Operating costs on the Consolidated Statements of Operations. | ||||||||||||||||||||||||||||||||
| Supplemental Disclosure - Three Months Ended June 30, 2024 | Page 8 |
|
||||||
| SUPPLEMENTAL BALANCE SHEET DETAIL | |||||||||||||||||||||||
| Unaudited, dollars in thousands | |||||||||||||||||||||||
| As of | As of | ||||||||||||||||||||||
| 6/30/24 | 12/31/23 | ||||||||||||||||||||||
| Deferred charges and prepaid expenses, net | |||||||||||||||||||||||
| Deferred charges, net | $ | 143,675 | $ | 141,816 | |||||||||||||||||||
| Prepaid expenses, net | 26,197 | 22,245 | |||||||||||||||||||||
| Total deferred charges and prepaid expenses, net | $ | 169,872 | $ | 164,061 | |||||||||||||||||||
| Other assets | |||||||||||||||||||||||
| Right-of-use asset | $ | 30,484 | $ | 32,350 | |||||||||||||||||||
| Furniture, fixtures and leasehold improvements, net | 12,568 | 14,120 | |||||||||||||||||||||
| Interest rate swaps | 5,349 | 4,364 | |||||||||||||||||||||
| Other | 4,899 | 3,321 | |||||||||||||||||||||
| Total other assets | $ | 53,300 | $ | 54,155 | |||||||||||||||||||
| Accounts payable, accrued expenses and other liabilities | |||||||||||||||||||||||
| Accounts payable and other accrued expenses | $ | 257,127 | $ | 289,215 | |||||||||||||||||||
| Below market leases, net | 78,552 | 82,583 | |||||||||||||||||||||
| Dividends payable | 85,472 | 85,692 | |||||||||||||||||||||
| Lease liability | 30,767 | 36,105 | |||||||||||||||||||||
| Interest rate swaps | — | 6,877 | |||||||||||||||||||||
| Other | 48,375 | 48,418 | |||||||||||||||||||||
| Total accounts payable, accrued expenses and other liabilities | $ | 500,293 | $ | 548,890 | |||||||||||||||||||
| Supplemental Disclosure - Three Months Ended June 30, 2024 | Page 9 |
|
||||||
| NOI & SUPPLEMENTAL STATEMENT OF OPERATIONS DETAIL | ||||||||||||||||||||||||||||||||
| Unaudited, dollars in thousands | ||||||||||||||||||||||||||||||||
| Three Months Ended | Six Months Ended | |||||||||||||||||||||||||||||||
| 6/30/24 | 6/30/23 | 6/30/24 | 6/30/23 | |||||||||||||||||||||||||||||
| Net Operating Income Detail | ||||||||||||||||||||||||||||||||
| Base rent | $ | 229,323 | $ | 223,099 | $ | 456,799 | $ | 445,301 | ||||||||||||||||||||||||
| Expense reimbursements | 68,543 | 70,612 | 140,798 | 142,477 | ||||||||||||||||||||||||||||
| Revenues deemed uncollectible | (1,145) | (1,961) | (1,002) | (3,047) | ||||||||||||||||||||||||||||
| Ancillary and other rental income / Other revenues | 5,875 | 6,425 | 12,313 | 12,169 | ||||||||||||||||||||||||||||
| Percentage rents | 2,343 | 1,953 | 6,603 | 5,734 | ||||||||||||||||||||||||||||
| Operating costs | (36,925) | (35,713) | (74,087) | (71,617) | ||||||||||||||||||||||||||||
| Real estate taxes | (36,349) | (43,712) | (77,757) | (88,400) | ||||||||||||||||||||||||||||
| Net operating income | $ | 231,665 | $ | 220,703 | $ | 463,667 | $ | 442,617 | ||||||||||||||||||||||||
| Operating Ratios | ||||||||||||||||||||||||||||||||
| NOI margin (NOI / revenues) | 76.0 | % | 73.5 | % | 75.3 | % | 73.4 | % | ||||||||||||||||||||||||
| Expense recovery ratio (expense reimbursements / (operating costs + real estate taxes)) | 93.5 | % | 88.9 | % | 92.7 | % | 89.0 | % | ||||||||||||||||||||||||
| Reconciliation of Net Income to Net Operating Income | ||||||||||||||||||||||||||||||||
| Net income | $ | 70,125 | $ | 56,408 | $ | 159,030 | $ | 168,654 | ||||||||||||||||||||||||
| Lease termination fees | (959) | (676) | (1,349) | (2,945) | ||||||||||||||||||||||||||||
| Straight-line rental income, net | (7,981) | (7,421) | (15,536) | (11,422) | ||||||||||||||||||||||||||||
| Accretion of below-market leases, net of amortization of above-market leases and tenant inducements | (1,810) | (1,568) | (3,534) | (4,236) | ||||||||||||||||||||||||||||
| Straight-line ground rent expense, net (1) | (6) | (8) | (11) | (17) | ||||||||||||||||||||||||||||
| Depreciation and amortization | 92,018 | 88,812 | 183,236 | 176,553 | ||||||||||||||||||||||||||||
| Impairment of real estate assets | 5,280 | 16,736 | 5,280 | 17,836 | ||||||||||||||||||||||||||||
| General and administrative | 29,689 | 28,514 | 58,180 | 57,686 | ||||||||||||||||||||||||||||
| Total other expense | 45,309 | 39,906 | 78,371 | 40,508 | ||||||||||||||||||||||||||||
| Net operating income | $ | 231,665 | $ | 220,703 | $ | 463,667 | $ | 442,617 | ||||||||||||||||||||||||
| Supplemental Statement of Operations Detail | ||||||||||||||||||||||||||||||||
| Rental income | ||||||||||||||||||||||||||||||||
| Base rent | $ | 229,323 | $ | 223,099 | $ | 456,799 | $ | 445,301 | ||||||||||||||||||||||||
| Expense reimbursements | 68,543 | 70,612 | 140,798 | 142,477 | ||||||||||||||||||||||||||||
| Revenues deemed uncollectible | (1,145) | (1,961) | (1,002) | (3,047) | ||||||||||||||||||||||||||||
| Lease termination fees | 959 | 676 | 1,349 | 2,945 | ||||||||||||||||||||||||||||
| Straight-line rental income, net | 7,981 | 7,421 | 15,536 | 11,422 | ||||||||||||||||||||||||||||
| Accretion of below-market leases, net of amortization of above-market leases and tenant inducements | 1,810 | 1,568 | 3,534 | 4,236 | ||||||||||||||||||||||||||||
| Ancillary and other rental income | 5,773 | 5,824 | 11,459 | 11,254 | ||||||||||||||||||||||||||||
| Percentage rents | 2,343 | 1,953 | 6,603 | 5,734 | ||||||||||||||||||||||||||||
| Total rental income | $ | 315,587 | $ | 309,192 | $ | 635,076 | $ | 620,322 | ||||||||||||||||||||||||
| Other revenues | $ | 102 | $ | 601 | $ | 854 | $ | 915 | ||||||||||||||||||||||||
| Interest expense | ||||||||||||||||||||||||||||||||
| Note interest | $ | 47,884 | $ | 41,338 | $ | 93,509 | $ | 83,992 | ||||||||||||||||||||||||
| Unsecured credit facility and term loan interest | 5,702 | 6,118 | 11,417 | 12,054 | ||||||||||||||||||||||||||||
| Capitalized interest | (1,007) | (949) | (1,927) | (1,898) | ||||||||||||||||||||||||||||
| Deferred financing cost amortization | 1,795 | 1,714 | 3,591 | 3,469 | ||||||||||||||||||||||||||||
| Debt premium and discount accretion, net | (719) | (736) | (1,447) | (1,452) | ||||||||||||||||||||||||||||
| Total interest expense | $ | 53,655 | $ | 47,485 | $ | 105,143 | $ | 96,165 | ||||||||||||||||||||||||
| Other | ||||||||||||||||||||||||||||||||
| Federal and state taxes | $ | 655 | $ | 638 | $ | 1,366 | $ | 1,348 | ||||||||||||||||||||||||
| Other | (274) | 47 | (392) | (258) | ||||||||||||||||||||||||||||
| Total other | $ | 381 | $ | 685 | $ | 974 | $ | 1,090 | ||||||||||||||||||||||||
| Additional Disclosures | ||||||||||||||||||||||||||||||||
| Capitalized construction compensation costs | $ | 5,018 | $ | 4,272 | $ | 9,953 | $ | 8,905 | ||||||||||||||||||||||||
| Capitalized real estate taxes, insurance, and utilities | 828 | 942 | 1,811 | 1,888 | ||||||||||||||||||||||||||||
| Capitalized leasing legal costs (2) | 652 | 1,021 | 1,658 | 2,394 | ||||||||||||||||||||||||||||
| Capitalized leasing commission costs | 2,014 | 1,792 | 4,093 | 4,003 | ||||||||||||||||||||||||||||
| Equity compensation expense, net | 5,442 | 4,644 | 8,801 | 8,835 | ||||||||||||||||||||||||||||
| (1) Straight-line ground rent expense, net is included in Operating costs on the Consolidated Statements of Operations. | ||||||||||||||||||||||||||||||||
| (2) Capitalized leasing legal costs represent incremental direct costs associated with the execution of a lease. | ||||||||||||||||||||||||||||||||
| Supplemental Disclosure - Three Months Ended June 30, 2024 | Page 10 |
|
||||||
| SAME PROPERTY NOI ANALYSIS | ||||||||||||||||||||||||||||||||||||||||||||
| Unaudited, dollars in thousands | ||||||||||||||||||||||||||||||||||||||||||||
| Three Months Ended | Six Months Ended | |||||||||||||||||||||||||||||||||||||||||||
| 6/30/24 | 6/30/23 | Change | 6/30/24 | 6/30/23 | Change | |||||||||||||||||||||||||||||||||||||||
| Same Property NOI Analysis | ||||||||||||||||||||||||||||||||||||||||||||
| Number of properties | 355 | 355 | — | 354 | 354 | — | ||||||||||||||||||||||||||||||||||||||
| Percent billed | 91.4 | % | 90.5 | % | 0.9 | % | 91.4 | % | 90.5 | % | 0.9 | % | ||||||||||||||||||||||||||||||||
| Percent leased | 95.4 | % | 94.2 | % | 1.2 | % | 95.4 | % | 94.2 | % | 1.2 | % | ||||||||||||||||||||||||||||||||
| Revenues | ||||||||||||||||||||||||||||||||||||||||||||
| Base rent | $ | 227,524 | $ | 219,260 | $ | 451,980 | $ | 435,478 | ||||||||||||||||||||||||||||||||||||
| Expense reimbursements | 68,303 | 69,433 | 139,536 | 139,096 | ||||||||||||||||||||||||||||||||||||||||
| Revenues deemed uncollectible | (1,389) | (1,973) | (1,174) | (3,081) | ||||||||||||||||||||||||||||||||||||||||
| Ancillary and other rental income / Other revenues | 5,845 | 6,126 | 12,085 | 11,542 | ||||||||||||||||||||||||||||||||||||||||
| Percentage rents | 2,341 | 1,940 | 6,575 | 5,655 | ||||||||||||||||||||||||||||||||||||||||
| 302,624 | 294,786 | 2.7 | % | 609,002 | 588,690 | 3.5 | % | |||||||||||||||||||||||||||||||||||||
| Operating expenses | ||||||||||||||||||||||||||||||||||||||||||||
| Operating costs | (36,629) | (34,383) | (72,913) | (68,511) | ||||||||||||||||||||||||||||||||||||||||
| Real estate taxes | (36,525) | (42,947) | (77,454) | (86,316) | ||||||||||||||||||||||||||||||||||||||||
| (73,154) | (77,330) | (5.4) | % | (150,367) | (154,827) | (2.9) | % | |||||||||||||||||||||||||||||||||||||
| Same property NOI | $ | 229,470 | $ | 217,456 | 5.5 | % | $ | 458,635 | $ | 433,863 | 5.7 | % | ||||||||||||||||||||||||||||||||
| NOI margin | 75.8 | % | 73.8 | % | 75.3 | % | 73.7 | % | ||||||||||||||||||||||||||||||||||||
| Expense recovery ratio | 93.4 | % | 89.8 | % | 92.8 | % | 89.8 | % | ||||||||||||||||||||||||||||||||||||
| Percent Contribution to Same Property NOI Performance: | ||||||||||||||||||||||||||||||||||||||||||||
| Change | Percent Contribution | Change | Percent Contribution | |||||||||||||||||||||||||||||||||||||||||
| Base rent | $ | 8,264 | 3.8 | % | $ | 16,502 | 3.8 | % | ||||||||||||||||||||||||||||||||||||
| Revenues deemed uncollectible | 584 | 0.2 | % | 1,907 | 0.5 | % | ||||||||||||||||||||||||||||||||||||||
| Net expense reimbursements | 3,046 | 1.4 | % | 4,900 | 1.1 | % | ||||||||||||||||||||||||||||||||||||||
| Ancillary and other rental income / Other revenues | (281) | (0.1) | % | 543 | 0.1 | % | ||||||||||||||||||||||||||||||||||||||
| Percentage rents | 401 | 0.2 | % | 920 | 0.2 | % | ||||||||||||||||||||||||||||||||||||||
| 5.5 | % | 5.7 | % | |||||||||||||||||||||||||||||||||||||||||
| Reconciliation of Net Income to Same Property NOI | ||||||||||||||||||||||||||||||||||||||||||||
| Net income | $ | 70,125 | $ | 56,408 | $ | 159,030 | $ | 168,654 | ||||||||||||||||||||||||||||||||||||
| Adjustments: | ||||||||||||||||||||||||||||||||||||||||||||
| Non-same property NOI | (2,195) | (3,247) | (5,032) | (8,754) | ||||||||||||||||||||||||||||||||||||||||
| Lease termination fees | (959) | (676) | (1,349) | (2,945) | ||||||||||||||||||||||||||||||||||||||||
| Straight-line rental income, net | (7,981) | (7,421) | (15,536) | (11,422) | ||||||||||||||||||||||||||||||||||||||||
| Accretion of below-market leases, net of amortization of above-market leases and tenant inducements | (1,810) | (1,568) | (3,534) | (4,236) | ||||||||||||||||||||||||||||||||||||||||
| Straight-line ground rent expense, net | (6) | (8) | (11) | (17) | ||||||||||||||||||||||||||||||||||||||||
| Depreciation and amortization | 92,018 | 88,812 | 183,236 | 176,553 | ||||||||||||||||||||||||||||||||||||||||
| Impairment of real estate assets | 5,280 | 16,736 | 5,280 | 17,836 | ||||||||||||||||||||||||||||||||||||||||
| General and administrative | 29,689 | 28,514 | 58,180 | 57,686 | ||||||||||||||||||||||||||||||||||||||||
| Total other expense | 45,309 | 39,906 | 78,371 | 40,508 | ||||||||||||||||||||||||||||||||||||||||
| Same property NOI | $ | 229,470 | $ | 217,456 | $ | 458,635 | $ | 433,863 | ||||||||||||||||||||||||||||||||||||
| Supplemental Disclosure - Three Months Ended June 30, 2024 | Page 11 |
|
||||||
| CAPITAL EXPENDITURES | ||||||||||||||||||||||||||||||||
| Unaudited, dollars in thousands | ||||||||||||||||||||||||||||||||
| Three Months Ended | Six Months Ended | |||||||||||||||||||||||||||||||
| 6/30/24 | 6/30/23 | 6/30/24 | 6/30/23 | |||||||||||||||||||||||||||||
| Leasing related: | ||||||||||||||||||||||||||||||||
| Tenant improvements and tenant inducements | $ | 23,544 | $ | 20,025 | $ | 45,293 | $ | 38,398 | ||||||||||||||||||||||||
| External leasing commissions | 3,287 | 3,934 | 6,794 | 6,725 | ||||||||||||||||||||||||||||
| 26,831 | 23,959 | 52,087 | 45,123 | |||||||||||||||||||||||||||||
| Maintenance capital expenditures | 10,924 | 13,990 | 16,885 | 24,634 | ||||||||||||||||||||||||||||
| Total leasing related and maintenance capital expenditures | $ | 37,755 | $ | 37,949 | $ | 68,972 | $ | 69,757 | ||||||||||||||||||||||||
| Value-enhancing: | ||||||||||||||||||||||||||||||||
| Anchor space repositionings | $ | 14,774 | $ | 10,863 | $ | 26,900 | $ | 19,856 | ||||||||||||||||||||||||
| Outparcel developments | 2,828 | 2,183 | 4,987 | 3,427 | ||||||||||||||||||||||||||||
| Redevelopments | 29,729 | 29,229 | 50,481 | 57,849 | ||||||||||||||||||||||||||||
| Other (1) | 5,708 | 6,418 | 13,452 | 11,108 | ||||||||||||||||||||||||||||
| Total value-enhancing capital expenditures | $ | 53,039 | $ | 48,693 | $ | 95,820 | $ | 92,240 | ||||||||||||||||||||||||
| (1) Includes, but is not limited to, minor value-enhancing projects, LED lighting upgrades, and solar projects. | ||||||||||||||||||||||||||||||||
| Supplemental Disclosure - Three Months Ended June 30, 2024 | Page 12 |
|
||||||
| CAPITALIZATION, LIQUIDITY & DEBT RATIOS | ||||||||||||||||||||||||||||||||
| Unaudited, dollars and shares in thousands except per share amounts | ||||||||||||||||||||||||||||||||
| As of | As of | |||||||||||||||||||||||||||||||
| 6/30/24 | 12/31/23 | |||||||||||||||||||||||||||||||
| Equity Capitalization: | ||||||||||||||||||||||||||||||||
| Common shares outstanding | 301,345 | 300,596 | ||||||||||||||||||||||||||||||
| Common share price | $ | 23.09 | $ | 23.27 | ||||||||||||||||||||||||||||
| Total equity capitalization | $ | 6,958,056 | $ | 6,994,869 | ||||||||||||||||||||||||||||
| Debt: | ||||||||||||||||||||||||||||||||
| Revolving credit facility | $ | — | $ | 18,500 | ||||||||||||||||||||||||||||
| Term loan facility | 500,000 | 500,000 | ||||||||||||||||||||||||||||||
| Unsecured notes | 4,888,453 | 4,418,805 | ||||||||||||||||||||||||||||||
| Total principal debt | 5,388,453 | 4,937,305 | ||||||||||||||||||||||||||||||
| Add: Net unamortized premium | 15,681 | 20,974 | ||||||||||||||||||||||||||||||
| Less: Deferred financing fees | (28,912) | (24,754) | ||||||||||||||||||||||||||||||
| Debt obligations, net | 5,375,222 | 4,933,525 | ||||||||||||||||||||||||||||||
| Less: Cash, cash equivalents and restricted cash | (474,956) | (18,904) | ||||||||||||||||||||||||||||||
| Net debt | $ | 4,900,266 | $ | 4,914,621 | ||||||||||||||||||||||||||||
| Total market capitalization | $ | 11,858,322 | $ | 11,909,490 | ||||||||||||||||||||||||||||
| Liquidity: | ||||||||||||||||||||||||||||||||
| Cash, cash equivalents and restricted cash | $ | 474,956 | $ | 18,904 | ||||||||||||||||||||||||||||
| Available under Revolving Credit Facility (1) | 1,248,597 | 1,230,074 | ||||||||||||||||||||||||||||||
| $ | 1,723,553 | $ | 1,248,978 | |||||||||||||||||||||||||||||
| Ratios: | ||||||||||||||||||||||||||||||||
| Principal debt to total market capitalization | 45.4 | % | 41.5 | % | ||||||||||||||||||||||||||||
| Principal debt to total assets, before depreciation | 44.7 | % | 42.8 | % | ||||||||||||||||||||||||||||
| Unencumbered assets to unsecured debt | 2.2x | 2.3x | ||||||||||||||||||||||||||||||
| Net Principal Debt to Adjusted EBITDA, current quarter annualized (2) | 5.6x | 6.0x | ||||||||||||||||||||||||||||||
| Net Principal Debt to Adjusted EBITDA, trailing twelve months (2) | 5.8x | 6.1x | ||||||||||||||||||||||||||||||
| Interest coverage, current quarter annualized (Adjusted EBITDA / interest expense) | 4.1x | 4.3x | ||||||||||||||||||||||||||||||
| Interest coverage, trailing twelve months (Adjusted EBITDA / interest expense) | 4.2x | 4.2x | ||||||||||||||||||||||||||||||
| Fixed charge coverage, current quarter annualized (Adjusted EBITDA / (interest expense + scheduled principal payments)) | 4.1x | 4.3x | ||||||||||||||||||||||||||||||
| Fixed charge coverage, trailing twelve months (Adjusted EBITDA / (interest expense + scheduled principal payments)) | 4.2x | 4.2x | ||||||||||||||||||||||||||||||
| As of | As of | |||||||||||||||||||||||||||||||
| 6/30/24 | 12/31/23 | |||||||||||||||||||||||||||||||
| Percentage of total debt: (3) | ||||||||||||||||||||||||||||||||
| Fixed | 100.0 | % | 99.6 | % | ||||||||||||||||||||||||||||
| Variable | — | % | 0.4 | % | ||||||||||||||||||||||||||||
| Unencumbered summary: | ||||||||||||||||||||||||||||||||
| Percent of properties, ABR and NOI | 100.0 | % | 100.0 | % | ||||||||||||||||||||||||||||
| Weighted average maturity (years): | ||||||||||||||||||||||||||||||||
| Fixed | 4.8 | 4.1 | ||||||||||||||||||||||||||||||
| Variable | — | 2.5 | ||||||||||||||||||||||||||||||
| Total | 4.8 | 4.1 | ||||||||||||||||||||||||||||||
| Credit Ratings & Outlook: (4) | ||||||||||||||||||||||||||||||||
| Fitch Ratings | BBB | Stable | ||||||||||||||||||||||||||||||
| Moody's Investors Service | Baa3 | Positive | ||||||||||||||||||||||||||||||
| S&P Global Ratings | BBB | Stable | ||||||||||||||||||||||||||||||
| (1) Funds available under the Revolving Credit Facility are reduced by outstanding letters of credit totaling $1.4 million. | ||||||||||||||||||||||||||||||||
| (2) Net Principal Debt is as of the end of each specified period. | ||||||||||||||||||||||||||||||||
| (3) Includes the impact of the Company's interest rate swap agreements. | ||||||||||||||||||||||||||||||||
| (4) As of July 29, 2024. | ||||||||||||||||||||||||||||||||
| Supplemental Disclosure - Three Months Ended June 30, 2024 | Page 13 |
|
||||||
| DEBT OBLIGATIONS | |||||||||||||||||||||||
| Unaudited, dollars in thousands | |||||||||||||||||||||||
| Maturity Schedule - Debt Obligations | |||||||||||||||||||||||
| Year | Maturities | Weighted Average Stated Interest Rate (1) | |||||||||||||||||||||
| 2024 | $ | — | — | % | |||||||||||||||||||
| 2025 | 670,000 | 3.85 | % | ||||||||||||||||||||
| 2026 | 607,542 | 4.17 | % | ||||||||||||||||||||
| 2027 | 900,000 | 3.94 | % | ||||||||||||||||||||
| 2028 | 357,708 | 2.35 | % | ||||||||||||||||||||
| 2029 | 753,203 | 4.14 | % | ||||||||||||||||||||
| 2030 | 800,000 | 4.05 | % | ||||||||||||||||||||
| 2031 | 500,000 | 2.50 | % | ||||||||||||||||||||
| 2032 | — | — | % | ||||||||||||||||||||
| 2033 | — | — | % | ||||||||||||||||||||
| 2034+ | 800,000 | 5.63 | % | ||||||||||||||||||||
| Total Debt Obligations | $ | 5,388,453 | 4.01 | % | |||||||||||||||||||
| Net unamortized premium | 15,681 | ||||||||||||||||||||||
| Deferred financing costs | (28,912) | ||||||||||||||||||||||
| Debt Obligations, Net | $ | 5,375,222 | |||||||||||||||||||||
| Summary of Outstanding Debt Obligations | |||||||||||||||||||||||||||||||||||
| Outstanding | Weighted Average | Maturity | Percent of | ||||||||||||||||||||||||||||||||
| Loan | Principal Balance | Stated Interest Rate (1) | Date | Total Indebtedness | |||||||||||||||||||||||||||||||
| Fixed Rate Debt: | |||||||||||||||||||||||||||||||||||
| Term Loan Facility (Adjusted SOFR + 95 basis points) (2)(3)(4) | $ | 500,000 | 3.98 | % | 7/26/27 | 9.28 | % | ||||||||||||||||||||||||||||
| Unsecured Notes | |||||||||||||||||||||||||||||||||||
| 3.85% 2025 Brixmor OP Notes | 670,000 | 3.85 | % | 2/1/25 | 12.43 | % | |||||||||||||||||||||||||||||
| 4.13% 2026 Brixmor OP Notes | 600,000 | 4.13 | % | 6/15/26 | 11.13 | % | |||||||||||||||||||||||||||||
| 7.97% 2026 Brixmor LLC Notes | 694 | 7.97 | % | 8/14/26 | 0.01 | % | |||||||||||||||||||||||||||||
| 7.65% 2026 Brixmor LLC Notes | 6,100 | 7.65 | % | 11/2/26 | 0.11 | % | |||||||||||||||||||||||||||||
| 7.68% 2026 Brixmor LLC Notes I | 748 | 7.68 | % | 11/2/26 | 0.01 | % | |||||||||||||||||||||||||||||
| 3.90% 2027 Brixmor OP Notes | 400,000 | 3.90 | % | 3/15/27 | 7.42 | % | |||||||||||||||||||||||||||||
| 6.90% 2028 Brixmor LLC Notes I | 2,222 | 6.90 | % | 2/15/28 | 0.04 | % | |||||||||||||||||||||||||||||
| 6.90% 2028 Brixmor LLC Notes II | 5,486 | 6.90 | % | 2/15/28 | 0.10 | % | |||||||||||||||||||||||||||||
| 2.25% 2028 Brixmor OP Notes | 350,000 | 2.25 | % | 4/1/28 | 6.50 | % | |||||||||||||||||||||||||||||
| 4.13% 2029 Brixmor OP Notes | 750,000 | 4.13 | % | 5/15/29 | 13.92 | % | |||||||||||||||||||||||||||||
| 7.50% 2029 Brixmor LLC Notes | 3,203 | 7.50 | % | 7/30/29 | 0.06 | % | |||||||||||||||||||||||||||||
| 4.05% 2030 Brixmor OP Notes | 800,000 | 4.05 | % | 7/1/30 | 14.85 | % | |||||||||||||||||||||||||||||
| 2.50% 2031 Brixmor OP Notes | 500,000 | 2.50 | % | 8/16/31 | 9.28 | % | |||||||||||||||||||||||||||||
| 5.50%, 2034 Brixmor OP Notes | 400,000 | 5.50 | % | 2/15/34 | 7.43 | % | |||||||||||||||||||||||||||||
| 5.75%, 2035 Brixmor OP Notes | 400,000 | 5.75 | % | 2/15/35 | 7.43 | % | |||||||||||||||||||||||||||||
| Total Fixed Rate Unsecured Notes | 4,888,453 | 4.01 | % | 90.72 | % | ||||||||||||||||||||||||||||||
| Total Fixed Rate Debt | $ | 5,388,453 | 4.01 | % | 100.00 | % | |||||||||||||||||||||||||||||
| Variable Rate Debt: | |||||||||||||||||||||||||||||||||||
| Revolving Credit Facility (Adjusted SOFR + 85 basis points) (4) | $ | — | 6.28 | % | 6/30/26 | — | % | ||||||||||||||||||||||||||||
| Total Variable Rate Debt | $ | — | 6.28 | % | — | % | |||||||||||||||||||||||||||||
| Total Debt Obligations | $ | 5,388,453 | 4.01 | % | 100.00 | % | |||||||||||||||||||||||||||||
| Net unamortized premium | 15,681 | ||||||||||||||||||||||||||||||||||
| Deferred financing costs | (28,912) | ||||||||||||||||||||||||||||||||||
| Debt Obligations, Net | $ | 5,375,222 | |||||||||||||||||||||||||||||||||
| (1) Weighted average stated interest rate includes the impact of the Company's interest rate swap agreements. | |||||||||||||||||||||||||||||||||||
| (2) Effective June 1, 2022, $300.0 million of the Term Loan Facility is swapped from Adjusted SOFR to a fixed, combined rate of 2.59% (plus a spread, currently 95 basis points) through July 26, 2024. Effective July 26, 2024, $300.0 million of the Term Loan Facility is swapped from SOFR to a fixed, combined rate of 4.08% (plus a spread, currently 95 basis points, and SOFR adjustment of 10 basis points) through the maturity of the loan on July 26, 2027. | |||||||||||||||||||||||||||||||||||
| (3) Effective May 1, 2023, $200.0 million of the Term Loan Facility is swapped from SOFR to a fixed, combined rate of 3.59% (plus a spread, currently 95 basis points, and SOFR adjustment of 10 basis points) through the maturity of the loan on July 26, 2027. | |||||||||||||||||||||||||||||||||||
| (4) Effective July 8, 2024, the Term Loan Facility and Revolving Credit Facility qualify for a 2 basis point rate reduction due to the achievement of certain sustainability metric targets for the year ended December 31, 2023. | |||||||||||||||||||||||||||||||||||
| Supplemental Disclosure - Three Months Ended June 30, 2024 | Page 14 |
|
||||||
| COVENANT DISCLOSURE | ||||||||||||||||||||||||||||||||||||||
| Unaudited, dollars in thousands | ||||||||||||||||||||||||||||||||||||||
| Unsecured OP Notes Covenant Disclosure | ||||||||||||||||||||||||||||||||||||||
| Covenants | 6/30/24 | |||||||||||||||||||||||||||||||||||||
| I. Aggregate debt test | < 65% | 45.7 | % | |||||||||||||||||||||||||||||||||||
| Total Debt | 5,375,222 | |||||||||||||||||||||||||||||||||||||
| Total Assets | 11,762,656 | |||||||||||||||||||||||||||||||||||||
| II. Secured debt test (1) | < 40% | N/A | ||||||||||||||||||||||||||||||||||||
| Total Secured Debt (1) | — | |||||||||||||||||||||||||||||||||||||
| Total Assets | 11,762,656 | |||||||||||||||||||||||||||||||||||||
| III. Unencumbered asset ratio | > 150% | 218.8 | % | |||||||||||||||||||||||||||||||||||
| Total Unencumbered Assets | 11,762,656 | |||||||||||||||||||||||||||||||||||||
| Unsecured Debt | 5,375,222 | |||||||||||||||||||||||||||||||||||||
| Prior Twelve Months | Prior Six Months, Annualized | |||||||||||||||||||||||||||||||||||||
| IV. Debt service test (2) | > 1.5x | 3.9x | 3.8x | |||||||||||||||||||||||||||||||||||
| Consolidated EBITDA | 841,907 | 873,752 | ||||||||||||||||||||||||||||||||||||
| Annual Debt Service Charge | 218,617 | 231,251 | ||||||||||||||||||||||||||||||||||||
| (1) The Company had no secured debt as of June 30, 2024. | ||||||||||||||||||||||||||||||||||||||
| (2) For the OP's 2.250% 2028 Notes, 4.050% 2030 Notes, 2.500% 2031 Notes, 5.500% 2034 Notes, and 5.750% 2035 Notes, the covenant calculation reference period for calculating EBITDA and Debt Service Charge is the most recent twelve months for which it reported financial results. For all other OP Notes, the reference period is the most recent six months for which it reported financial results, annualized. | ||||||||||||||||||||||||||||||||||||||
| For detailed descriptions of the unsecured OP notes covenant calculations and definitions of capitalized terms please refer to the Prospectus Supplement filed by the OP with the Securities and Exchange Commission on August 11, 2021 and the notes and indenture incorporated therein by reference. | ||||||||||||||||||||||||||||||||||||||
| Unsecured Credit Facility Covenant Disclosure | ||||||||||||||||||||||||||||||||||||||
| Covenants | 6/30/24 | |||||||||||||||||||||||||||||||||||||
| I. Leverage ratio | < 60% | 34.6 | % | |||||||||||||||||||||||||||||||||||
| Total Outstanding Indebtedness | 5,388,453 | |||||||||||||||||||||||||||||||||||||
| Balance Sheet Cash (1) | 487,279 | |||||||||||||||||||||||||||||||||||||
| Total Asset Value | 14,162,418 | |||||||||||||||||||||||||||||||||||||
| II. Secured leverage ratio (2) | < 40% | N/A | ||||||||||||||||||||||||||||||||||||
| Total Secured Indebtedness (2) | — | |||||||||||||||||||||||||||||||||||||
| Balance Sheet Cash (1) | 487,279 | |||||||||||||||||||||||||||||||||||||
| Total Asset Value | 14,162,418 | |||||||||||||||||||||||||||||||||||||
| III. Unsecured leverage ratio | < 60% | 34.6 | % | |||||||||||||||||||||||||||||||||||
| Total Unsecured Indebtedness | 5,388,453 | |||||||||||||||||||||||||||||||||||||
| Unrestricted Cash (3) | 485,938 | |||||||||||||||||||||||||||||||||||||
| Unencumbered Asset Value | 14,162,418 | |||||||||||||||||||||||||||||||||||||
| IV. Fixed charge coverage ratio | > 1.5x | 4.2x | ||||||||||||||||||||||||||||||||||||
| Total Net Operating Income | 920,006 | |||||||||||||||||||||||||||||||||||||
| Capital Expenditure Reserve | 9,563 | |||||||||||||||||||||||||||||||||||||
| Fixed Charges | 218,605 | |||||||||||||||||||||||||||||||||||||
| (1) Balance Sheet Cash consists of the OP's Cash and cash equivalents, Restricted cash, and certain Marketable securities. | ||||||||||||||||||||||||||||||||||||||
| (2) The Company had no secured indebtedness as of June 30, 2024. | ||||||||||||||||||||||||||||||||||||||
| (3) Unrestricted Cash consists of the OP's Cash and cash equivalents and certain Marketable securities. | ||||||||||||||||||||||||||||||||||||||
| For detailed descriptions of the Unsecured Credit Facility covenant calculations and definitions of capitalized terms please refer to the Third Amended and Restated Revolving Credit and Term Loan Agreement, dated as of April 28, 2022 filed as Exhibit 10.1 to Form 10-Q, filed with the Securities and Exchange Commission on May 2, 2022. | ||||||||||||||||||||||||||||||||||||||
| Supplemental Disclosure - Three Months Ended June 30, 2024 | Page 15 |
|
||||||
| > | INVESTMENT SUMMARY | ||||
| Supplemental Disclosure | |||||
| Three Months Ended June 30, 2024 | |||||
ACQUISITIONS |
|||||||||||||||||||||||||||||||||||||||||||||||
Dollars in thousands, except ABR PSF |
|||||||||||||||||||||||||||||||||||||||||||||||
Property Name |
CBSA | Purchase Date |
Purchase Price |
GLA / Acres (1) |
Percent Leased (1) | ABR PSF (1)(2) |
Major Tenants (1)(3) | ||||||||||||||||||||||||||||||||||||||||
| There were no acquisitions completed during the three months ended March 31, 2024. | |||||||||||||||||||||||||||||||||||||||||||||||
| Three Months Ended June 30, 2024 | |||||||||||||||||||||||||||||||||||||||||||||||
| West Center | New York-Newark-Jersey City, NY-NJ-PA | 4/24/24 | $ | 17,250 | 42,594 | 98.9 | % | 29.53 | Wild by Nature Market (King Kullen) | ||||||||||||||||||||||||||||||||||||||
| $ | 17,250 | 42,594 | |||||||||||||||||||||||||||||||||||||||||||||
| TOTAL - SIX MONTHS ENDED JUNE 30, 2024 | $ | 17,250 | 42,594 | ||||||||||||||||||||||||||||||||||||||||||||
| (1) Data presented is as of the quarter end subsequent to the acquisition date. | |||||||||||||||||||||||||||||||||||||||||||||||
| (2) ABR PSF excludes the GLA of lessee-owned leasehold improvements. | |||||||||||||||||||||||||||||||||||||||||||||||
| (3) Major tenants exclude non-owned major tenants. | |||||||||||||||||||||||||||||||||||||||||||||||
| Supplemental Disclosure - Three Months Ended June 30, 2024 | Page 17 |
|
||||||
DISPOSITIONS |
|||||||||||||||||||||||||||||||||||||||||||||||
Dollars in thousands, except ABR PSF |
|||||||||||||||||||||||||||||||||||||||||||||||
Property Name |
CBSA | Sale Date |
Sale Price |
GLA / Acres (1) |
Percent Leased (1) | ABR PSF (1)(2) |
Major Tenants (1)(3) | ||||||||||||||||||||||||||||||||||||||||
| Three Months Ended March 31, 2024 | |||||||||||||||||||||||||||||||||||||||||||||||
| 18 Ryan | Detroit-Warren-Dearborn, MI | 1/31/24 | $ | 12,400 | 101,564 | 100.0 | % | $ | 10.01 | Dream Market, Dollar Tree, Planet Fitness | |||||||||||||||||||||||||||||||||||||
| Mall at 163rd Street | Miami-Fort Lauderdale-Pompano Beach, FL | 3/11/24 | 46,000 | 342,385 | 76.8 | % | 12.83 | Citi Trends, Ross Dress for Less | |||||||||||||||||||||||||||||||||||||||
| North Dixie Plaza | Elizabethtown-Fort Knox, KY | 3/28/24 | 10,560 | 130,466 | 100.0 | % | 8.62 | At Home, Staples | |||||||||||||||||||||||||||||||||||||||
| $ | 68,960 | 574,415 | |||||||||||||||||||||||||||||||||||||||||||||
| Three Months Ended June 30, 2024 | |||||||||||||||||||||||||||||||||||||||||||||||
| Land at Western Village (4) | Cincinnati, OH-KY-IN | 4/23/24 | $ | 95 | — | — | % | $ | — | - | |||||||||||||||||||||||||||||||||||||
| Victory Square - Bridgestone (4) | Savannah, GA | 6/20/24 | 250 | 6,702 | 100.0 | % | N/A | - | |||||||||||||||||||||||||||||||||||||||
| $ | 345 | 6,702 | |||||||||||||||||||||||||||||||||||||||||||||
| TOTAL - SIX MONTHS ENDED JUNE 30, 2024 | $ | 69,305 | 581,117 | ||||||||||||||||||||||||||||||||||||||||||||
| (1) Data presented is as of the quarter end prior to the sale date. | |||||||||||||||||||||||||||||||||||||||||||||||
| (2) ABR PSF excludes the GLA of lessee-owned leasehold improvements. | |||||||||||||||||||||||||||||||||||||||||||||||
| (3) Major tenants exclude non-owned major tenants. | |||||||||||||||||||||||||||||||||||||||||||||||
| (4) Represents partial sale of property. Data presented reflects only the portion of property sold. | |||||||||||||||||||||||||||||||||||||||||||||||
| Supplemental Disclosure - Three Months Ended June 30, 2024 | Page 18 |
|
||||||
ANCHOR SPACE REPOSITIONING SUMMARY |
||||||||||||||||||||||||||||||||||||||
Dollars in thousands |
||||||||||||||||||||||||||||||||||||||
Property Name |
CBSA | Description | ||||||||||||||||||||||||||||||||||||
IN PROCESS ANCHOR SPACE REPOSITIONINGS |
||||||||||||||||||||||||||||||||||||||
| New Projects Added To In Process Pipeline During The Three Months Ended June 30, 2024 | ||||||||||||||||||||||||||||||||||||||
| 1 | Kingston Overlook | Knoxville, TN | Remerchandise former Badcock Furniture with a 24K SF Sprouts Farmers Market | |||||||||||||||||||||||||||||||||||
| In Process Projects | ||||||||||||||||||||||||||||||||||||||
| 2 | Springdale | Mobile, AL | Remerchandise former Michaels with a 10K SF Five Below and additional retailers | |||||||||||||||||||||||||||||||||||
| 3 | Gateway Plaza | Los Angeles-Long Beach-Anaheim, CA | Remerchandise former Party City with an 11K SF Five Below and a 4K SF Wells Fargo | |||||||||||||||||||||||||||||||||||
| 4 | Carmen Plaza | Oxnard-Thousand Oaks-Ventura, CA | Remerchandise former 24 Hour Fitness with a 37K SF specialty grocer | |||||||||||||||||||||||||||||||||||
| 5 | Arapahoe Crossings | Denver-Aurora-Lakewood, CO | Remerchandise former Stein Mart with a 17K SF Ace Hardware and a 13K SF Activate | |||||||||||||||||||||||||||||||||||
| 6 | Center of Bonita Springs | Cape Coral-Fort Myers, FL | Remerchandise former Old Time Pottery with a 42K SF Kohl's and a 29K SF Burlington Stores | |||||||||||||||||||||||||||||||||||
| 7 | Coastal Way - Coastal Landing - Project I | Tampa-St. Petersburg-Clearwater, FL | Terminate existing Bed Bath & Beyond and remerchandise with a 28K SF Sprouts Farmers Market | |||||||||||||||||||||||||||||||||||
| 8 | Coastal Way - Coastal Landing - Project II | Tampa-St. Petersburg-Clearwater, FL | Demolish former Sears to accommodate construction of a 104K SF BJ's Wholesale Club | |||||||||||||||||||||||||||||||||||
| 9 | Rivercrest Shopping Center | Chicago-Naperville-Elgin, IL-IN-WI | Remerchandise former Best Buy with a 55K SF Tony's Fresh Market (Heritage Grocers) | |||||||||||||||||||||||||||||||||||
| 10 | Pine Tree Shopping Center | Portland-South Portland, ME | Remerchandise former Big Lots with a 25K SF ALDI | |||||||||||||||||||||||||||||||||||
| 11 | Arborland Center | Ann Arbor, MI | Remerchandise former Bed Bath & Beyond with a 22K SF Marshalls, a 20K SF HomeGoods and additional retailers | |||||||||||||||||||||||||||||||||||
| 12 | Redford Plaza | Detroit-Warren-Dearborn, MI | Relocate and rightsize existing Burlington Stores to 30K SF and remerchandise the vacated space with a 23K SF Ross Dress for Less and a 15K SF Aaron's | |||||||||||||||||||||||||||||||||||
| 13 | Sun Ray Shopping Center | Minneapolis-St. Paul-Bloomington, MN-WI | Remerchandise former Valu Thrift Store with a 22K SF Ross Dress for Less and a 12K SF Five Below | |||||||||||||||||||||||||||||||||||
| 14 | Bedford Grove | Manchester-Nashua, NH | Remerchandise former Bed Bath & Beyond with a 29K SF Planet Fitness and additional retailers | |||||||||||||||||||||||||||||||||||
| 15 | Parkway Plaza | Binghamton, NY | Remerchandise former PriceRite with a 22K SF Ross Dress for Less and a 15K SF Boot Barn | |||||||||||||||||||||||||||||||||||
| 16 | Barn Plaza | Philadelphia-Camden-Wilmington, PA-NJ-DE-MD | Remerchandise anchor space with a 44K SF Whole Foods Market (Amazon) and an 11K SF Barnes & Noble | |||||||||||||||||||||||||||||||||||
| 17 | Bristol Park | Philadelphia-Camden-Wilmington, PA-NJ-DE-MD | Combine several small shop spaces for a 19K SF Planet Fitness | |||||||||||||||||||||||||||||||||||
| 18 | Ridglea Plaza | Dallas-Fort Worth-Arlington, TX | Combine adjacent spaces for a 53K SF EōS Fitness | |||||||||||||||||||||||||||||||||||
| 19 | Northshore - Project II | Houston-The Woodlands-Sugar Land, TX | Remerchandise and expand former Sellers Bros. with a 30K SF El Rancho (Heritage Grocers) | |||||||||||||||||||||||||||||||||||
| Number of Projects | Net Estimated Costs (1) | Gross Costs to Date | Expected NOI Yield (1) | |||||||||||||||||||||||||||||||||||
| Total In Process | 19 | $ | 95,200 | $ | 41,850 | 7% - 14% | ||||||||||||||||||||||||||||||||
| STABILIZED ANCHOR SPACE REPOSITIONINGS | ||||||||||||||||||||||||||||||||||||||
| Projects Stabilized During the Three Months Ended June 30, 2024 | ||||||||||||||||||||||||||||||||||||||
| 1 | Granada Shoppes | Naples-Marco Island, FL | Remerchandise former Orchard Supply Hardware with a 29K SF HomeSense and a 9K SF Five Below | |||||||||||||||||||||||||||||||||||
| 2 | Speedway Super Center | Indianapolis-Carmel-Anderson, IN | Combine adjacent small shop spaces for an 11K SF pOpshelf | |||||||||||||||||||||||||||||||||||
| 3 | Hampton Village Centre | Detroit-Warren-Dearborn, MI | Combine several small shop spaces for a 15K SF Barnes & Noble | |||||||||||||||||||||||||||||||||||
| 4 | Windvale Center | Houston-The Woodlands-Sugar Land, TX | Remerchandise former Randall's and adjacent spaces with a 64K SF Tesla showroom and service center | |||||||||||||||||||||||||||||||||||
| Projects Stabilized During the Three Months Ended March 31, 2024 | ||||||||||||||||||||||||||||||||||||||
| 5 | Cudahy Plaza | Los Angeles-Long Beach-Anaheim, CA | Remerchandise former Big Lots with a 26K SF Sprouts Farmers Market | |||||||||||||||||||||||||||||||||||
| 6 | Northshore - Project I | Houston-The Woodlands-Sugar Land, TX | Combine adjacent small shop spaces for a 12K SF specialty medical use | |||||||||||||||||||||||||||||||||||
| Number of Projects | Net Project Costs (1) |
NOI Yield (1) | ||||||||||||||||||||||||||||||||||||
| Total Stabilized | 6 | $ | 17,350 | 12 | % | |||||||||||||||||||||||||||||||||
| (1) Reflects gross project costs less any project specific credits (lease termination fees or other ancillary credits). | ||||||||||||||||||||||||||||||||||||||
| The in process projects listed above are actively underway and reflect projects for which leases have been signed with the tenant(s) listed in the project descriptions. There is no guarantee that the Company will complete any or all of these projects or that | ||||||||||||||||||||||||||||||||||||||
| the net estimated costs or expected NOI yields will be the amounts shown. The net estimated costs and expected NOI yields are management's best estimates based on current information and may change over time. For more information, please refer to | ||||||||||||||||||||||||||||||||||||||
| the “Risk Factors” section of the Company’s Annual Report on Form 10-K for the year ended December 31, 2023. | ||||||||||||||||||||||||||||||||||||||
| Supplemental Disclosure - Three Months Ended June 30, 2024 | Page 19 |
|
||||||
OUTPARCEL DEVELOPMENT SUMMARY |
||||||||||||||||||||||||||||||||||||||||||||
Dollars in thousands |
||||||||||||||||||||||||||||||||||||||||||||
Stabilization |
Net Estimated | Gross Costs | Expected |
|||||||||||||||||||||||||||||||||||||||||
Property Name |
CBSA | Project Description |
Quarter |
Costs (1) |
to Date |
NOI Yield (1) |
||||||||||||||||||||||||||||||||||||||
IN PROCESS OUTPARCEL DEVELOPMENTS (2) |
||||||||||||||||||||||||||||||||||||||||||||
| New Projects Added To In Process Pipeline During The Three Months Ended June 30, 2024 | ||||||||||||||||||||||||||||||||||||||||||||
| 1 | Pacoima Center | Los Angeles-Long Beach-Anaheim, CA | Construction of a 3K SF Starbucks with a drive-thru | Mar-25 | $ | 500 | $ | 400 | 54 | % | ||||||||||||||||||||||||||||||||||
In Process Projects |
||||||||||||||||||||||||||||||||||||||||||||
| 2 | Nesconset Shopping Center | New York-Newark-Jersey City, NY-NJ-PA | Construction of a 7K SF multi-tenant outparcel, including a 4K SF Aspen Dental and a 3K SF Bethpage Federal Credit Union (re-located from within the center) | Sep-24 | 4,900 | 4,600 | 9 | % | ||||||||||||||||||||||||||||||||||||
| 3 | Brunswick Town Center | Cleveland-Elyria, OH | Construction of an 8K SF multi-tenant outparcel, including a 4K SF First Watch and a 4K SF Mission BBQ | Sep-24 | 3,550 | 2,900 | 9 | % | ||||||||||||||||||||||||||||||||||||
| 4 | Northgate Shopping Center | Deltona-Daytona Beach-Ormond Beach, FL | Construction of a 2K SF Chipotle | Dec-24 | 1,700 | 1,100 | 10 | % | ||||||||||||||||||||||||||||||||||||
| 5 | Bedford Grove | Manchester-Nashua, NH | Construction of a 7K SF Evviva Trattoria endcap | Dec-24 | 800 | 700 | 14 | % | ||||||||||||||||||||||||||||||||||||
| 6 | McMullen Creek Market | Charlotte-Concord-Gastonia, NC-SC | Construction of a 4K SF Aspen Dental | Dec-24 | 1,750 | 1,350 | 10 | % | ||||||||||||||||||||||||||||||||||||
| 7 | Panama City Square | Panama City, FL | Construction of a 6K SF LongHorn Steakhouse | Mar-25 | 1,800 | 1,500 | 8 | % | ||||||||||||||||||||||||||||||||||||
| 8 | Mansell Crossing | Atlanta-Sandy Springs-Alpharetta, GA | Construction of an 11K SF Cooper’s Hawk Winery & Restaurant | Jun-25 | 4,900 | 700 | 10 | % | ||||||||||||||||||||||||||||||||||||
| TOTAL IN PROCESS OUTPARCEL DEVELOPMENT ACTIVITIES / WEIGHTED AVERAGE | $ | 19,900 | $ | 13,250 | 11 | % | ||||||||||||||||||||||||||||||||||||||
| Stabilization | Net Project | |||||||||||||||||||||||||||||||||||||||||||
| Property Name | CBSA | Project Description | Quarter | Costs (1,2) | NOI Yield (1,2) | |||||||||||||||||||||||||||||||||||||||
| STABILIZED OUTPARCEL DEVELOPMENTS | ||||||||||||||||||||||||||||||||||||||||||||
| Projects Stabilized During the Three Months Ended June 30, 2024 | ||||||||||||||||||||||||||||||||||||||||||||
| 1 | Springdale (3) | Mobile, AL | Construction of a 1K SF Seven Brew | Jun-24 | $ | 100 | 78 | % | ||||||||||||||||||||||||||||||||||||
| 2 | Upland Town Square | Riverside-San Bernardino-Ontario, CA | Construction of a 1K SF Dutch Bros. Coffee | Jun-24 | 550 | 8 | % | |||||||||||||||||||||||||||||||||||||
| TOTAL STABILIZED OUTPARCEL DEVELOPMENT ACTIVITIES / WEIGHTED AVERAGE | $ | 650 | 18 | % | ||||||||||||||||||||||||||||||||||||||||
| (1) Reflects gross project costs less any project specific credits (lease termination fees or other ancillary credits). | ||||||||||||||||||||||||||||||||||||||||||||
| (2) Net project costs and NOI yields may vary from those previously disclosed due to final project reconciliations. | ||||||||||||||||||||||||||||||||||||||||||||
| (3) Project commenced and stabilized during the three months ended June 30, 2024. | ||||||||||||||||||||||||||||||||||||||||||||
| The in process projects listed above are actively underway and reflect projects for which leases have been signed with the tenant(s) listed in the project descriptions. There is no guarantee that the Company will complete any or all of these projects, that the | ||||||||||||||||||||||||||||||||||||||||||||
| net estimated costs or expected NOI yields will be the amounts shown, or that stabilization will occur as anticipated. The net estimated costs, expected NOI yields, and anticipated stabilization dates are management's best estimates based on current | ||||||||||||||||||||||||||||||||||||||||||||
| information and may change over time. For more information, please refer to the “Risk Factors” section of the Company’s Annual Report on Form 10-K for the year ended December 31, 2023. | ||||||||||||||||||||||||||||||||||||||||||||
| Supplemental Disclosure - Three Months Ended June 30, 2024 | Page 20 |
|
||||||
REDEVELOPMENT SUMMARY |
||||||||||||||||||||||||||||||||||||||||||||||||||
Dollars in thousands |
||||||||||||||||||||||||||||||||||||||||||||||||||
Net |
Gross |
Expected |
||||||||||||||||||||||||||||||||||||||||||||||||
Property |
Stabilization |
Estimated |
Costs |
NOI |
||||||||||||||||||||||||||||||||||||||||||||||
Property Name |
CBSA | Project Description |
Acreage |
Quarter |
Costs (1) |
to Date |
Yield (1) |
|||||||||||||||||||||||||||||||||||||||||||
IN PROCESS REDEVELOPMENTS |
||||||||||||||||||||||||||||||||||||||||||||||||||
| New Projects Added To In Process Pipeline During The Three Months Ended June 30, 2024 | ||||||||||||||||||||||||||||||||||||||||||||||||||
| 1 | Burlington Square I, II & III | Boston-Cambridge-Newton, MA-NH | Redevelopment and reconfiguration of center to accommodate new retailers including a 5K SF Tatte Bakery & Cafe, a 4K SF Life Alive Organic Cafe, and a 2K SF YogaSix; and shopping center upgrades including façade and sidewalk renovations, new landscaping and stormwater improvements, and common area enhancements | 7 | Sep-25 | $ | 8,500 | $ | 600 | 12 | % | |||||||||||||||||||||||||||||||||||||||
| 2 | Pointe Orlando - Phase II | Orlando-Kissimmee-Sanford, FL | Remerchandise with relevant retailers including a 10K SF Activate and a 10K SF Dick's Last Resort; rebranding and reconfiguration of first level to match Phase I improvements including an entry roadway and valet; and extensive shopping center upgrades including façade, landscaping and lighting upgrades and common area enhancements including public seating areas and improved pedestrian plazas | 17 | Mar-26 | 40,450 | 4,750 | 9 | % | |||||||||||||||||||||||||||||||||||||||||
| 3 | Westridge Court / Block 59 | Chicago-Naperville-Elgin, IL-IN-WI | Redevelopment, reconfiguration, and rebranding of center, including the demolition of an underutilized two-story building, to accommodate the addition of a vibrant restaurant and entertainment district with an event plaza through the construction of multiple outparcels including a 9K SF The Cheesecake Factory, an 8K SF Yard House, an 8K SF Ruth's Chris Steak House, a 3K SF Shake Shack, and a 2K SF Stan's Donuts; construction of additional multi-tenant outparcels including a 7K SF Piccolo Buco and a 4K SF First Watch and a 3K SF Velvet Taco, a 2K SF Crisp & Green, and a 2K SF Fresh Fin; and shopping center upgrades including new landscaping, signage, lighting, and improved vehicular and pedestrian circulation and connectivity | 82 | Sep-26 | 53,200 | 7,600 | 9 | % | |||||||||||||||||||||||||||||||||||||||||
| In Process Projects | ||||||||||||||||||||||||||||||||||||||||||||||||||
| 4 | Vail Ranch Center | Riverside-San Bernardino-Ontario, CA | Redevelopment of former Stein Mart with a 25K SF Burlington Stores and an 11K SF Five Below; relocation and expansion of existing Kahoots to 10K SF; redevelopment of former Kahoots outparcel with a 3K SF Carbon Health, a 2K SF Dave's Hot Chicken, and additional retailers; remerchandise additional small shop space with relevant retailers including a 6K SF Bark Social; and shopping center upgrades including façade renovations, parking, and roof repairs | 10 | Dec-24 | 10,750 | 9,550 | 9 | % | |||||||||||||||||||||||||||||||||||||||||
| 5 | Pointe Orlando - Phase I | Orlando-Kissimmee-Sanford, FL | Remerchandise existing small shop retail with relevant retailers including a 29K SF Sports & Social, an 11K SF Hampton Social, a 7K SF Kavas Tacos & Tequila; rebranding and reconfiguration of the center; and extensive shopping center upgrades including façade, landscaping and lighting upgrades and common area enhancements including public seating areas, addition of digital directories and kiosks and improved pedestrian plazas | 17 | Dec-24 | 41,250 | 29,300 | 8 | % | |||||||||||||||||||||||||||||||||||||||||
| 6 | East Port Plaza | Port St. Lucie, FL | Construction of a 3K SF Starbucks outparcel; remerchandise existing small shop spaces and extensive shopping center upgrades including façade, landscaping, lighting and parking updates, point of entry and signage improvements, and common area enhancements including improved pedestrian walkways | 32 | Dec-24 | 7,150 | 4,050 | 8 | % | |||||||||||||||||||||||||||||||||||||||||
| 7 | Roosevelt Mall | Philadelphia-Camden-Wilmington, PA-NJ-DE-MD | Redevelopment and reconfiguration of center to accommodate addition of a 24K SF Sprouts Farmers Market and a 10K SF JD Sports; construction of several outparcels including a 3K SF Raising Cane's and a 2K SF Panda Express; and shopping center upgrades including façade and sidewalk renovations, new landscaping and signage, and common area enhancements | 36 | Dec-24 | 40,900 | 30,350 | 7 | % | |||||||||||||||||||||||||||||||||||||||||
| 8 | Middletown Plaza | New York-Newark-Jersey City, NY-NJ-PA | Redevelopment of former Walgreens, Party Fair, and additional junior anchor space with a 14K SF Trader Joe's and additional retailers; and shopping center upgrades including façade and sidewalk renovations, and new landscaping and signage | 21 | Mar-25 | 8,900 | 4,650 | 9 | % | |||||||||||||||||||||||||||||||||||||||||
| 9 | Puente Hills Town Center | Los Angeles-Long Beach-Anaheim, CA | Redevelopment and expansion of several in-line retail spaces to accommodate a 20K SF ALDI; remerchandise existing adjacent small shop space including a 9K SF Five Below, an 8K SF Skechers, and a 5K SF Bath and Body Works; and shopping center upgrades including parking and sidewalk improvements | 11 | Jun-25 | 4,900 | 3,350 | 8 | % | |||||||||||||||||||||||||||||||||||||||||
| 10 | WaterTower Plaza | Worcester, MA-CT | Redevelopment of former Shaw's with a 46K SF grocer; reconfigure and remerchandise adjacent small shop space including an 11K SF Five Below and a 9K SF Ulta; and shopping center upgrades including the addition of patio areas, façade renovations, and parking enhancements | 27 | Jun-25 | 11,200 | 10,350 | 10 | % | |||||||||||||||||||||||||||||||||||||||||
| 11 | Jones Plaza | Houston-The Woodlands-Sugar Land, TX | Relocation and expansion of existing Aaron's to 14K SF to accommodate a 15K SF La Michoacana Supermarket; and shopping center upgrades including façade renovations | 9 | Jun-25 | 2,150 | 1,850 | 15 | % | |||||||||||||||||||||||||||||||||||||||||
| 12 | The Davis Collection | Sacramento-Roseville-Folsom, CA | Extensive redevelopment, reconfiguration, and rebranding of center including demolition of 92K SF to accommodate construction of a 25K SF Nordstrom Rack, a 17K SF PetSmart, a 10K SF Ulta, and approximately 20K SF of additional retail surrounding an outdoor community courtyard; construction of two multi-tenant outparcel buildings including a 4K SF Urban Plates, a 3K SF The Melt, a 2K SF Mendocino Farms, and additional retailers; and shopping center upgrades including construction of pedestrian plazas and walkways, new landscaping and signage, and parking enhancements | 8 | Sep-25 | 45,950 | 12,800 | 8 | % | |||||||||||||||||||||||||||||||||||||||||
| 13 | College Plaza | New York-Newark-Jersey City, NY-NJ-PA | Redevelopment of former Bob's Stores and adjacent retail space with a 21K SF Burlington Stores; remerchandise former Blink Fitness with a 10K SF Five Below and additional retailers; construction of outparcels including a 5K SF Chick-fil-A and a 4K SF Aspen Dental; and shopping center upgrades including façade and sidewalk renovations | 25 | Sep-25 | 12,900 | 6,700 | 10 | % | |||||||||||||||||||||||||||||||||||||||||
| Supplemental Disclosure - Three Months Ended June 30, 2024 | Page 21 |
|
||||||
REDEVELOPMENT SUMMARY |
||||||||||||||||||||||||||||||||||||||||||||||||||
Dollars in thousands |
||||||||||||||||||||||||||||||||||||||||||||||||||
Net |
Gross |
Expected |
||||||||||||||||||||||||||||||||||||||||||||||||
Property |
Stabilization |
Estimated |
Costs |
NOI |
||||||||||||||||||||||||||||||||||||||||||||||
Property Name |
CBSA | Project Description |
Acreage |
Quarter |
Costs (1) |
to Date |
Yield (1) |
|||||||||||||||||||||||||||||||||||||||||||
| 14 | Westminster City Center | Denver-Aurora-Lakewood, CO | Relocation and expansion of existing Golf Galaxy to 43K SF in former Babies "R" Us location; backfill of former Golf Galaxy with a 16K SF Petco; redevelopment of former Gordmans with a 27K SF Sierra Trading Post and an additional retailer; remerchandise former Dress Barn with a 9K SF Five Below; addition of a 6K SF Seo's Martial Arts; and remerchandise existing outparcels with a 6K SF Sola Salon Suites and a 6K SF Hook & Reel | 27 | Dec-25 | 15,900 | 13,700 | 8 | % | |||||||||||||||||||||||||||||||||||||||||
| 15 | Tinley Park Plaza (2) | Chicago-Naperville-Elgin, IL-IN-WI | Redevelopment of former Walt's and adjacent space with a 22K SF Ross Dress for Less, a 9K SF Five Below, and additional retailers; and shopping center upgrades including façade and roof renovations | 22 | Dec-25 | 11,000 | 3,300 | 12 | % | |||||||||||||||||||||||||||||||||||||||||
| 16 | Preston Park Village | Dallas-Fort Worth-Arlington, TX | Redevelopment of former Kroger with a 24K SF HomeGoods and a 13K SF Petco; construction of a multi-tenant outparcel building; and shopping center upgrades including expansion and upgrade of existing outdoor dining patios, façade renovations, parking reconfiguration, and landscaping and signage enhancements | 26 | Mar-26 | 34,600 | 21,800 | 7 | % | |||||||||||||||||||||||||||||||||||||||||
| 17 | Wynnewood Village - Phase IV (3) | Dallas-Fort Worth-Arlington, TX | Ground-up construction of a 111K SF Target; remerchandise of existing anchor space with a 26K SF Burlington Stores; construction of two multi-tenant outparcel buildings; and shopping center upgrades including façade renovations, landscaping enhancements, signage upgrades, and parking lot improvements | 65 | Jun-26 | 44,800 | 11,200 | 9 | % | |||||||||||||||||||||||||||||||||||||||||
| TOTAL IN PROCESS REDEVELOPMENT ACTIVITIES / WEIGHTED AVERAGE | $ | 394,500 | $ | 175,900 | 9 | % | ||||||||||||||||||||||||||||||||||||||||||||
Property |
Stabilization |
Net Project |
NOI |
|||||||||||||||||||||||||||||||||||||||||||||||
Property Name |
CBSA | Project Description |
Acreage |
Quarter |
Costs (1,4) | Yield (1,4) | ||||||||||||||||||||||||||||||||||||||||||||
STABILIZED REDEVELOPMENTS |
||||||||||||||||||||||||||||||||||||||||||||||||||
| Projects Stabilized During The Three Months Ended June 30, 2024 | ||||||||||||||||||||||||||||||||||||||||||||||||||
| 1 | Plymouth Square Shopping Center (5) | Philadelphia-Camden-Wilmington, PA-NJ-DE-MD | Redevelopment and remerchandise of 94K SF in-line and lower-level retail space, including a 19K SF Planet Fitness, an 8K SF P.J. Whelihan's Pub + Restaurant, a 7K SF My Salon Suites, a 7K SF Rally House, and additional retailers; and shopping center upgrades including façade and parking renovations, new landscaping and signage, and improved pedestrian and vehicular access | 17 | Jun-24 | $ | 22,300 | 7 | % | |||||||||||||||||||||||||||||||||||||||||
| Projects Stabilized During The Three Months Ended March 31, 2024 | ||||||||||||||||||||||||||||||||||||||||||||||||||
| 2 | Dalewood I, II & III Shopping Center | New York-Newark-Jersey City, NY-NJ-PA | Remerchandise former Mrs. Green's Natural Market, former Pet Valu, and former Rite Aid with a 12K SF Barnes & Noble, a 10K SF Ulta, a 6K SF J.Crew, and a 3K SF Paris Baguette, and additional retailers; and shopping center upgrades including façade renovations and common area enhancements | 6 | Mar-24 | 8,050 | 14 | % | ||||||||||||||||||||||||||||||||||||||||||
| TOTAL STABILIZED REDEVELOPMENT ACTIVITIES / WEIGHTED AVERAGE | $ | 30,350 | 9 | % | ||||||||||||||||||||||||||||||||||||||||||||||
| (1) Reflects gross project costs less any project specific credits (lease termination fees or other ancillary credits). | ||||||||||||||||||||||||||||||||||||||||||||||||||
| (2) Net project costs exclude $2.5M of project specific credits (lease termination fees or other ancillary credits). | ||||||||||||||||||||||||||||||||||||||||||||||||||
| (3) Net project costs exclude $0.5M of project specific credits (lease termination fees or other ancillary credits). | ||||||||||||||||||||||||||||||||||||||||||||||||||
| (4) Net project costs and NOI yields may vary from those previously disclosed due to final project reconciliations. | ||||||||||||||||||||||||||||||||||||||||||||||||||
| (5) Net project costs exclude $0.3M of project specific credits (lease termination fees or other ancillary credits). | ||||||||||||||||||||||||||||||||||||||||||||||||||
| The in process projects listed above are actively underway and reflect projects for which leases have been signed with the tenant(s) listed in the project descriptions. There is no guarantee that the Company will complete any or all of these projects, that the | ||||||||||||||||||||||||||||||||||||||||||||||||||
| net estimated costs or expected NOI yields will be the amounts shown, or that stabilization will occur as anticipated. The net estimated costs, expected NOI yields, and anticipated stabilization dates are management's best estimates based on current | ||||||||||||||||||||||||||||||||||||||||||||||||||
| information and may change over time. For more information, please refer to the “Risk Factors” section of the Company’s Annual Report on Form 10-K for the year ended December 31, 2023. | ||||||||||||||||||||||||||||||||||||||||||||||||||
| Supplemental Disclosure - Three Months Ended June 30, 2024 | Page 22 |
|
||||||
| FUTURE REDEVELOPMENT OPPORTUNITIES | |||||||||||||||||||||||
| Property Name | CBSA | Project Description | |||||||||||||||||||||
| MAJOR REDEVELOPMENTS | |||||||||||||||||||||||
| 1 | Village at Mira Mesa | San Diego-Chula Vista-Carlsbad, CA | Redevelopment of existing anchor space for potential residential rental component | ||||||||||||||||||||
| 2 | Kings Park Plaza | New York-Newark-Jersey City, NY-NJ-PA | Redevelopment of shopping center to leverage proximity to area transit, remerchandise with multiple retailers, potential multi-family component | ||||||||||||||||||||
| 3 | Morris Hills Shopping Center | New York-Newark-Jersey City, NY-NJ-PA | Densification of site, including multi-tenant outparcel development, potential multi-family component | ||||||||||||||||||||
| 4 | Rockland Plaza | New York-Newark-Jersey City, NY-NJ-PA | Extensive redevelopment and repositioning of shopping center, multiple outparcel developments | ||||||||||||||||||||
| 5 | Three Village Shopping Center | New York-Newark-Jersey City, NY-NJ-PA | Extensive repositioning and reconfiguration, densification of site | ||||||||||||||||||||
| 6 | Roosevelt Mall - Future Phases | Philadelphia-Camden-Wilmington, PA-NJ-DE-MD | Extensive repositioning and reconfiguration, densification of site | ||||||||||||||||||||
| 7 | Market Plaza | Dallas-Fort Worth-Arlington, TX | Extensive redevelopment and repositioning of shopping center, remerchandise with potential multi family and/or medical office component | ||||||||||||||||||||
| 8 | Wynnewood Village - Future Phases | Dallas-Fort Worth-Arlington, TX | Redevelopment and repositioning of shopping center, densification of site | ||||||||||||||||||||
| MINOR REDEVELOPMENTS | |||||||||||||||||||||||
| 1 | Brea Gateway | Los Angeles-Long Beach-Anaheim, CA | Reposition of former anchor which may include site densification with addition of outparcel pad development | ||||||||||||||||||||
| 2 | Metro 580 (1) | San Francisco-Oakland-Berkeley, CA | Redevelopment of existing anchor space for multiple retailers | ||||||||||||||||||||
| 3 | Arvada Plaza | Denver-Aurora-Lakewood, CO | Redevelopment and repositioning of shopping center | ||||||||||||||||||||
| 4 | Colonial Commons - Orange (1) | New Haven-Milford, CT | Redevelopment and repositioning of shopping center | ||||||||||||||||||||
| 5 | Coconut Creek Plaza | Miami-Fort Lauderdale-Pompano Beach, FL | Redevelopment of existing anchor space, inline shop space and outparcel development | ||||||||||||||||||||
| 6 | Sunrise Town Center | Miami-Fort Lauderdale-Pompano Beach, FL | Redevelopment and repositioning of shopping center with new anchor prototype | ||||||||||||||||||||
| 7 | Venetian Isle Shopping Center | Miami-Fort Lauderdale-Pompano Beach, FL | Redevelopment of existing anchor space for new anchor prototype, potential outparcel development | ||||||||||||||||||||
| 8 | Dolphin Village | Tampa-St. Petersburg-Clearwater, FL | Redevelopment and reposition of existing center with new anchor prototype | ||||||||||||||||||||
| 9 | Tyrone Gardens | Tampa-St. Petersburg-Clearwater, FL | Redevelopment and repositioning of shopping center | ||||||||||||||||||||
| 10 | Kings Market | Atlanta-Sandy Springs-Alpharetta, GA | Redevelopment and repositioning of shopping center | ||||||||||||||||||||
| 11 | Northeast Plaza | Atlanta-Sandy Springs-Alpharetta, GA | Redevelopment of existing anchor space for multiple retailers, densification of site | ||||||||||||||||||||
| 12 | High Point Centre | Chicago-Naperville-Elgin, IL-IN-WI | Redevelopment and repositioning of shopping center | ||||||||||||||||||||
| 13 | North Riverside Plaza | Chicago-Naperville-Elgin, IL-IN-WI | Redevelopment and reposition of rear portion of shopping center | ||||||||||||||||||||
| 14 | London Marketplace | London, KY | Redevelopment and expansion of existing anchor space | ||||||||||||||||||||
| 15 | Richfield Hub | Minneapolis-St. Paul-Bloomington, MN-WI | Redevelopment of existing anchor space, inline shop space and outparcel development | ||||||||||||||||||||
| 16 | Sun Ray Shopping Center | Minneapolis-St. Paul-Bloomington, MN-WI | Redevelopment and repositioning of shopping center | ||||||||||||||||||||
| 17 | Capitol Shopping Center | Concord, NH | Redevelopment of existing anchor space for multiple retailers | ||||||||||||||||||||
| 18 | West Center (1) | New York-Newark-Jersey City, NY-NJ-PA | Redevelopment and repositioning of shopping center, densification of site | ||||||||||||||||||||
| 19 | Parkway Plaza | Winston-Salem, NC | Reposition of former anchors which may include site densification with addition of outparcel pad development | ||||||||||||||||||||
| 20 | Harpers Station | Cincinnati, OH-KY-IN | Redevelopment of existing anchor space for multiple retailers | ||||||||||||||||||||
| 21 | South Towne Centre | Dayton-Kettering, OH | Redevelopment of existing anchor space for multiple retailers | ||||||||||||||||||||
| 22 | 69th Street Plaza | Philadelphia-Camden-Wilmington, PA-NJ-DE-MD | Redevelopment of existing anchor space for multiple retailers, densification of site | ||||||||||||||||||||
| 23 | Barn Plaza | Philadelphia-Camden-Wilmington, PA-NJ-DE-MD | Redevelopment of existing anchor space for multiple retailers, densification of site | ||||||||||||||||||||
| 24 | Bristol Park | Philadelphia-Camden-Wilmington, PA-NJ-DE-MD | Redevelopment of existing anchor space, inline shop space and façade renovation | ||||||||||||||||||||
| 25 | Valley Fair | Philadelphia-Camden-Wilmington, PA-NJ-DE-MD | Reposition of former anchor and façade renovation | ||||||||||||||||||||
| 26 | Circle Center | Hilton Head Island-Bluffton, SC | Redevelopment and repositioning of shopping center | ||||||||||||||||||||
| 27 | Arboretum Village | Dallas-Fort Worth-Arlington, TX | Densification of site, including multi-tenant outparcel development | ||||||||||||||||||||
| 28 | Preston Park Village - Future Phases | Dallas-Fort Worth-Arlington, TX | Redevelopment and repositioning of shopping center | ||||||||||||||||||||
| 29 | Webb Royal Plaza | Dallas-Fort Worth-Arlington, TX | Redevelopment and repositioning of shopping center | ||||||||||||||||||||
| 30 | Braesgate | Houston-The Woodlands-Sugar Land, TX | Redevelopment of existing anchor space for multiple retailers | ||||||||||||||||||||
| Supplemental Disclosure - Three Months Ended June 30, 2024 | Page 23 |
|
||||||
| FUTURE REDEVELOPMENT OPPORTUNITIES | |||||||||||||||||||||||
| Property Name | CBSA | Project Description | |||||||||||||||||||||
| 31 | Clear Lake Camino South | Houston-The Woodlands-Sugar Land, TX | Redevelopment of existing anchor space for multiple retailers, densification of site | ||||||||||||||||||||
| 32 | Lake Pointe Village | Houston-The Woodlands-Sugar Land, TX | Reposition of existing vacant space and site densification | ||||||||||||||||||||
| 33 | Maplewood | Houston-The Woodlands-Sugar Land, TX | Redevelopment of existing anchor space for multiple retailers, densification of site | ||||||||||||||||||||
| 34 | Hanover Square | Richmond, VA | Densification of site, including multi-tenant outparcel development | ||||||||||||||||||||
| (1) Indicates project added to the pipeline during the three months ended June 30, 2024. | |||||||||||||||||||||||
| The Company has identified potential future reinvestment opportunities at the properties listed above. Many of these opportunities are, or will soon be, in preliminary planning phases and as such, may not ultimately become active reinvestments. Proceeding | |||||||||||||||||||||||
| with these reinvestments could be subject to factors outside of the Company’s control which could delay, suspend, or defer the expected opportunity or timing of execution. While the Company believes that these projects are likely to become active in the | |||||||||||||||||||||||
| near-term, it should be noted that this list will fluctuate as projects become active, or are suspended or otherwise rescheduled. For more information, please refer to the “Risk Factors” section of the Company’s Annual Report on Form 10-K for the year ended | |||||||||||||||||||||||
| December 31, 2023. | |||||||||||||||||||||||
| Supplemental Disclosure - Three Months Ended June 30, 2024 | Page 24 |
|
||||||
| > | PORTFOLIO SUMMARY | ||||
| Supplemental Disclosure | |||||
| Three Months Ended June 30, 2024 | |||||
| PORTFOLIO OVERVIEW | ||||||||||||||||||||||||||||||||||||||||||||||||||||||||
| Dollars in thousands, except per square foot amounts | ||||||||||||||||||||||||||||||||||||||||||||||||||||||||
| As of: | ||||||||||||||||||||||||||||||||||||||||||||||||||||||||
| 6/30/24 | 3/31/24 | 12/31/23 | 9/30/23 | 6/30/23 | ||||||||||||||||||||||||||||||||||||||||||||||||||||
| Number of properties | 360 | 359 | 362 | 364 | 365 | |||||||||||||||||||||||||||||||||||||||||||||||||||
| GLA | 63,750,978 | 63,870,524 | 64,460,825 | 64,827,439 | 64,897,615 | |||||||||||||||||||||||||||||||||||||||||||||||||||
| Percent billed | 91.4% | 90.6% | 90.6% | 90.0% | 90.4% | |||||||||||||||||||||||||||||||||||||||||||||||||||
| Percent leased | 95.4% | 95.1% | 94.7% | 93.9% | 94.1% | |||||||||||||||||||||||||||||||||||||||||||||||||||
| TOTAL ≥ 10,000 SF | 97.5% | 97.3% | 96.8% | 95.7% | 96.2% | |||||||||||||||||||||||||||||||||||||||||||||||||||
| TOTAL < 10,000 SF | 90.8% | 90.5% | 90.3% | 89.8% | 89.4% | |||||||||||||||||||||||||||||||||||||||||||||||||||
| ABR | $ | 987,681 | $ | 978,178 | $ | 968,949 | $ | 958,128 | $ | 952,560 | ||||||||||||||||||||||||||||||||||||||||||||||
| ABR PSF | $ | 17.26 | $ | 17.12 | $ | 16.88 | $ | 16.77 | $ | 16.60 | ||||||||||||||||||||||||||||||||||||||||||||||
| PORTFOLIO BY UNIT SIZE AS OF 6/30/24 | ||||||||||||||||||||||||||||||||||||||||||||||||||||||||
|
Number of
Units
|
GLA | Percent of GLA | Percent Billed | Percent Leased | ABR | Percent of ABR | ABR PSF | |||||||||||||||||||||||||||||||||||||||||||||||||
| ≥ 35,000 SF | 395 | 22,436,264 | 35.2% | 95.2% | 98.6% | $ | 223,236 | 22.6% | $ | 11.47 | ||||||||||||||||||||||||||||||||||||||||||||||
| 20,000 - 34,999 SF | 484 | 12,619,697 | 19.8% | 92.1% | 95.6% | 148,489 | 15.0% | 12.42 | ||||||||||||||||||||||||||||||||||||||||||||||||
| 10,000 - 19,999 SF | 604 | 8,244,777 | 12.9% | 92.9% | 97.5% | 126,279 | 12.8% | 16.04 | ||||||||||||||||||||||||||||||||||||||||||||||||
| 5,000 - 9,999 SF | 1,096 | 7,585,121 | 11.9% | 86.5% | 91.6% | 144,339 | 14.6% | 21.58 | ||||||||||||||||||||||||||||||||||||||||||||||||
| < 5,000 SF | 5,990 | 12,865,119 | 20.2% | 86.0% | 90.4% | 345,338 | 35.0% | 30.71 | ||||||||||||||||||||||||||||||||||||||||||||||||
| TOTAL | 8,569 | 63,750,978 | 100.0% | 91.4% | 95.4% | $ | 987,681 | 100.0% | $ | 17.26 | ||||||||||||||||||||||||||||||||||||||||||||||
| TOTAL ≥ 10,000 SF | 1,483 | 43,300,738 | 67.9% | 93.9% | 97.5% | $ | 498,004 | 50.4% | $ | 12.68 | ||||||||||||||||||||||||||||||||||||||||||||||
| TOTAL < 10,000 SF | 7,086 | 20,450,240 | 32.1% | 86.2% | 90.8% | 489,677 | 49.6% | 27.31 | ||||||||||||||||||||||||||||||||||||||||||||||||
| Reflects portfolio statistics as reported for the specified period. | ||||||||||||||||||||||||||||||||||||||||||||||||||||||||
| Supplemental Disclosure - Three Months Ended June 30, 2024 | Page 26 |
|
||||||
| PORTFOLIO COMPOSITION | ||||||||||||||
| Dollars in thousands | ||||||||||||||
| ESSENTIAL AND OTHER TENANTS | |||||||||||
| Percent of Portfolio Leased GLA | Percent of Portfolio ABR | ||||||||||
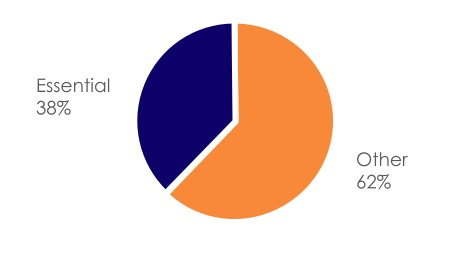
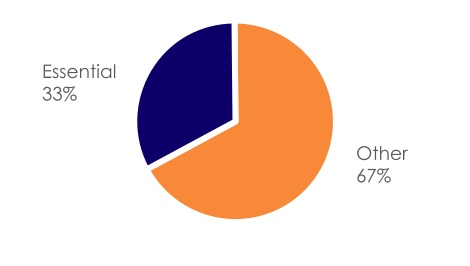
| NATIONAL / REGIONAL AND LOCAL TENANTS | |||||||||||
| Percent of Portfolio Leased GLA | Percent of Portfolio ABR | ||||||||||
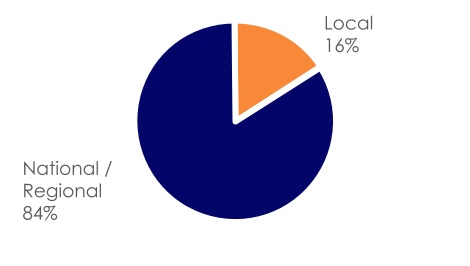
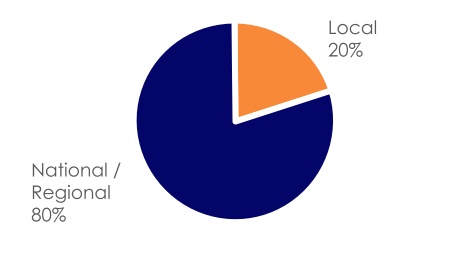
| ANCHOR AND SMALL SHOP TENANTS | |||||||||||
| Percent of Portfolio Leased GLA | Percent of Portfolio ABR | ||||||||||
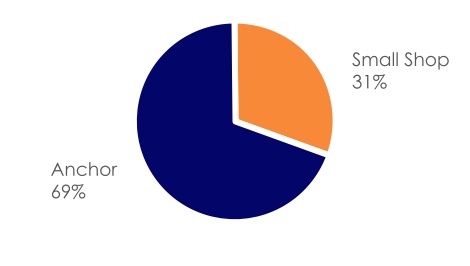
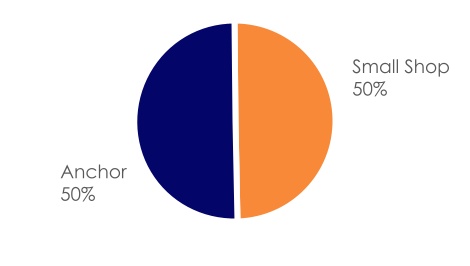
| Merchandise Mix | ABR | Percent of ABR | ||||||||||||
| ESSENTIAL | $ | 309,024 | 33 | % | ||||||||||
| Grocery | 137,420 | 14 | % | |||||||||||
| General Merchandise (Discount / Dollar) | 30,765 | 3 | % | |||||||||||
| Pet | 27,876 | 3 | % | |||||||||||
| Medical (Essential) | 27,169 | 3 | % | |||||||||||
| Financial services | 25,343 | 3 | % | |||||||||||
| Home improvement | 16,891 | 2 | % | |||||||||||
| Mail / Shipping and Other services | 15,138 | 2 | % | |||||||||||
| Auto | 10,651 | 1 | % | |||||||||||
| Other Essential | 9,353 | 1 | % | |||||||||||
| Pharmacy | 8,418 | 1 | % | |||||||||||
| OTHER | $ | 678,657 | 67 | % | ||||||||||
| Restaurants | 165,952 | 17 | % | |||||||||||
| Other Personal Services | 75,812 | 8 | % | |||||||||||
| Off-Price Apparel | 66,075 | 6 | % | |||||||||||
| Fitness / Sports | 60,680 | 6 | % | |||||||||||
| Value Apparel, Shoes, Accessories | 48,583 | 5 | % | |||||||||||
| General Merchandise (Department, Gift, etc.) | 43,428 | 4 | % | |||||||||||
| Other Retail | 40,606 | 4 | % | |||||||||||
| Home Décor | 40,288 | 4 | % | |||||||||||
| Other Medical | 30,775 | 3 | % | |||||||||||
| Electronics & Appliance | 24,423 | 2 | % | |||||||||||
| Entertainment | 23,365 | 2 | % | |||||||||||
| Health & Beauty | 20,342 | 2 | % | |||||||||||
| Hobby & Crafts | 17,000 | 2 | % | |||||||||||
| Other Professional Services | 11,909 | 1 | % | |||||||||||
| Liquor | 9,419 | 1 | % | |||||||||||
| TOTAL | $ | 987,681 | 100 | % | ||||||||||
| Supplemental Disclosure - Three Months Ended June 30, 2024 | Page 27 |
|
||||||
TOP FORTY RETAILERS RANKED BY ABR |
|||||||||||||||||||||||||||||||||||||||||||||||||||||
Dollars in thousands, except per square foot amounts |
|||||||||||||||||||||||||||||||||||||||||||||||||||||
| Retailer | Owned Leases (1) | Leased GLA (1) | Percent of GLA (1) | ABR (1) | Percent of ABR (1) | ABR PSF (1) | |||||||||||||||||||||||||||||||||||||||||||||||
| 1 | The TJX Companies, Inc. (2) | 91 | 2,646,402 | 4.2 | % | $ | 33,851 | 3.4 | % | $ | 12.79 | ||||||||||||||||||||||||||||||||||||||||||
| 2 | The Kroger Co. (3) | 44 | 2,994,662 | 4.7 | % | 22,802 | 2.3 | % | 7.61 | ||||||||||||||||||||||||||||||||||||||||||||
| 3 | Burlington Stores, Inc. | 40 | 1,663,459 | 2.6 | % | 19,842 | 2.0 | % | 11.93 | ||||||||||||||||||||||||||||||||||||||||||||
| 4 | Dollar Tree Stores, Inc. (4) | 119 | 1,355,657 | 2.1 | % | 16,328 | 1.7 | % | 12.04 | ||||||||||||||||||||||||||||||||||||||||||||
| 5 | Publix Super Markets, Inc. | 31 | 1,433,291 | 2.2 | % | 14,595 | 1.5 | % | 10.18 | ||||||||||||||||||||||||||||||||||||||||||||
| 6 | Ross Stores, Inc (5) | 44 | 1,124,164 | 1.8 | % | 14,227 | 1.4 | % | 12.66 | ||||||||||||||||||||||||||||||||||||||||||||
| 7 | Five Below, Inc. | 63 | 604,884 | 0.9 | % | 12,243 | 1.2 | % | 20.24 | ||||||||||||||||||||||||||||||||||||||||||||
| 8 | L.A Fitness International, LLC (6) | 14 | 566,362 | 0.9 | % | 11,057 | 1.1 | % | 19.52 | ||||||||||||||||||||||||||||||||||||||||||||
| 9 | Amazon.com, Inc. / Whole Foods Market Services, Inc. | 17 | 608,939 | 1.0 | % | 10,876 | 1.1 | % | 17.86 | ||||||||||||||||||||||||||||||||||||||||||||
| 10 | PetSmart, Inc. | 27 | 587,566 | 0.9 | % | 10,093 | 1.0 | % | 17.18 | ||||||||||||||||||||||||||||||||||||||||||||
| 490 | 13,585,386 | 21.3 | % | 165,914 | 16.7 | % | 12.21 | ||||||||||||||||||||||||||||||||||||||||||||||
| 11 | Albertson's Companies, Inc (7) | 14 | 750,202 | 1.2 | % | 9,828 | 1.0 | % | 13.10 | ||||||||||||||||||||||||||||||||||||||||||||
| 12 | Ahold Delhaize (8) | 16 | 864,919 | 1.4 | % | 9,647 | 1.0 | % | 11.15 | ||||||||||||||||||||||||||||||||||||||||||||
| 13 | Ulta Beauty, Inc. | 35 | 387,064 | 0.6 | % | 9,447 | 1.0 | % | 24.41 | ||||||||||||||||||||||||||||||||||||||||||||
| 14 | Kohl's Corporation | 14 | 1,051,137 | 1.6 | % | 8,819 | 0.9 | % | 8.39 | ||||||||||||||||||||||||||||||||||||||||||||
| 15 | PETCO Animal Supplies, Inc. | 35 | 479,951 | 0.8 | % | 8,617 | 0.9 | % | 17.95 | ||||||||||||||||||||||||||||||||||||||||||||
| 16 | Big Lots, Inc. | 27 | 908,492 | 1.4 | % | 6,688 | 0.7 | % | 7.36 | ||||||||||||||||||||||||||||||||||||||||||||
| 17 | The Michaels Companies, Inc. | 21 | 472,884 | 0.7 | % | 6,282 | 0.6 | % | 13.28 | ||||||||||||||||||||||||||||||||||||||||||||
| 18 | ALDI (9) | 18 | 571,927 | 0.9 | % | 5,327 | 0.5 | % | 9.31 | ||||||||||||||||||||||||||||||||||||||||||||
| 19 | Party City Holdco Inc. | 23 | 340,834 | 0.5 | % | 5,112 | 0.5 | % | 15.00 | ||||||||||||||||||||||||||||||||||||||||||||
| 20 | Barnes & Noble, Inc. | 14 | 297,565 | 0.5 | % | 4,976 | 0.5 | % | 16.72 | ||||||||||||||||||||||||||||||||||||||||||||
| 707 | 19,710,361 | 30.9 | % | 240,657 | 24.3 | % | 12.21 | ||||||||||||||||||||||||||||||||||||||||||||||
| 21 | JOANN Stores, Inc. | 19 | 398,614 | 0.6 | % | 4,924 | 0.5 | % | 12.35 | ||||||||||||||||||||||||||||||||||||||||||||
| 22 | CVS Health | 14 | 218,744 | 0.3 | % | 4,695 | 0.5 | % | 21.46 | ||||||||||||||||||||||||||||||||||||||||||||
| 23 | Staples, Inc. | 17 | 341,969 | 0.5 | % | 4,670 | 0.5 | % | 13.66 | ||||||||||||||||||||||||||||||||||||||||||||
| 24 | JP Morgan Chase & Co. | 24 | 91,376 | 0.1 | % | 4,620 | 0.5 | % | 50.56 | ||||||||||||||||||||||||||||||||||||||||||||
| 25 | Sprouts Farmers Market, Inc. | 7 | 200,417 | 0.3 | % | 4,612 | 0.5 | % | 23.01 | ||||||||||||||||||||||||||||||||||||||||||||
| 26 | Gap, Inc. (10) | 14 | 233,319 | 0.4 | % | 4,525 | 0.5 | % | 19.39 | ||||||||||||||||||||||||||||||||||||||||||||
| 27 | Harbor Freight Tools | 22 | 386,226 | 0.6 | % | 4,497 | 0.5 | % | 11.64 | ||||||||||||||||||||||||||||||||||||||||||||
| 28 | Best Buy Co., Inc. (11) | 9 | 346,681 | 0.5 | % | 4,460 | 0.5 | % | 12.86 | ||||||||||||||||||||||||||||||||||||||||||||
| 29 | Hobby Lobby Stores, Inc. | 11 | 604,732 | 0.9 | % | 4,348 | 0.4 | % | 7.19 | ||||||||||||||||||||||||||||||||||||||||||||
| 30 | The Home Depot, Inc. | 5 | 428,868 | 0.7 | % | 4,196 | 0.4 | % | 9.78 | ||||||||||||||||||||||||||||||||||||||||||||
| 31 | Chipotle Mexican Grill, Inc. | 33 | 82,205 | 0.1 | % | 4,129 | 0.4 | % | 50.23 | ||||||||||||||||||||||||||||||||||||||||||||
| 32 | Bath & Body Works, Inc. | 40 | 162,141 | 0.3 | % | 4,031 | 0.4 | % | 24.86 | ||||||||||||||||||||||||||||||||||||||||||||
| 33 | Starbucks Corporation | 38 | 72,668 | 0.1 | % | 3,969 | 0.4 | % | 54.62 | ||||||||||||||||||||||||||||||||||||||||||||
| 34 | National Vision, Inc. (12) | 37 | 135,061 | 0.2 | % | 3,935 | 0.4 | % | 29.13 | ||||||||||||||||||||||||||||||||||||||||||||
| 35 | DICK's Sporting Goods, Inc. (13) | 9 | 305,476 | 0.5 | % | 3,896 | 0.4 | % | 12.75 | ||||||||||||||||||||||||||||||||||||||||||||
| 36 | Bank of America, NA | 26 | 87,863 | 0.1 | % | 3,760 | 0.4 | % | 42.79 | ||||||||||||||||||||||||||||||||||||||||||||
| 37 | Office Depot, Inc. (14) | 14 | 299,761 | 0.5 | % | 3,743 | 0.4 | % | 12.49 | ||||||||||||||||||||||||||||||||||||||||||||
| 38 | Designer Brands Inc. (DSW) | 12 | 232,077 | 0.4 | % | 3,735 | 0.4 | % | 16.09 | ||||||||||||||||||||||||||||||||||||||||||||
| 39 | AMC Entertainment | 4 | 200,955 | 0.3 | % | 3,731 | 0.4 | % | 18.57 | ||||||||||||||||||||||||||||||||||||||||||||
| 40 | Trader Joe's Company, Inc. | 10 | 129,700 | 0.2 | % | 3,526 | 0.4 | % | 27.19 | ||||||||||||||||||||||||||||||||||||||||||||
| TOTAL TOP 40 RETAILERS | 1,072 | 24,669,214 | 38.5 | % | $ | 324,659 | 33.1 | % | $ | 13.16 | |||||||||||||||||||||||||||||||||||||||||||
| (1) Includes only locations which are owned or guaranteed by the parent company. Excludes | (6) Includes LA Fitness-7, Esporta Fitness-6, and City Sports Club-1. | (11) Includes Best Buy-8 and Yardbird-1. | |||||||||||||||||||||||||||||||||||||||||||||||||||
| all franchise locations. | (7) Includes Tom Thumb-3, Vons-3, Acme-2, Jewel-Osco-2, Albertsons-1, El Rancho (sublease)-1, | (12) Includes America's Best Contacts & Eyeglasses-35 and Eyeglass World-2. | |||||||||||||||||||||||||||||||||||||||||||||||||||
| (2) Includes T.J. Maxx-32, Marshalls-31, HomeGoods-21, Sierra Trading Post-5, and HomeSense-2. | Shop & Save Market-1, and Star Market-1. | (13) Includes Golf Galaxy-4, DICK'S Sporting Goods Warehouse Sale-3, | |||||||||||||||||||||||||||||||||||||||||||||||||||
| (3) Includes Kroger-32, King Soopers-4, Ralphs-3, Dillons-1, Food 4 Less-1, Harris Teeter-1, | (8) Includes Giant Food-6, Super Stop & Shop-5, Food Lion-2, Bottom Dollar Food-1, | and DICK'S Sporting Goods-2. | |||||||||||||||||||||||||||||||||||||||||||||||||||
| Pay Less-1, and Pick 'N Save-1. | ShopRite (sublease)-1, and non-grocer (sublease)-1. | (14) Includes Office Depot-9 and OfficeMax-5. | |||||||||||||||||||||||||||||||||||||||||||||||||||
| (4) Includes Dollar Tree-107 and Family Dollar-12. | (9) Includes ALDI-12 and Winn-Dixie-6. | ||||||||||||||||||||||||||||||||||||||||||||||||||||
| (5) Includes Ross Dress for Less-39 and dd's Discounts-5. | (10) Includes Old Navy-12 and Gap Factory-2. | ||||||||||||||||||||||||||||||||||||||||||||||||||||
| Supplemental Disclosure - Three Months Ended June 30, 2024 | Page 28 |
|
||||||
| NEW & RENEWAL LEASE SUMMARY | |||||||||||||||||||||||||||||||||||||||||||||||||||||||||||||||||||||||||||||||||||
Dollars in thousands, except per square foot amounts |
|||||||||||||||||||||||||||||||||||||||||||||||||||||||||||||||||||||||||||||||||||
| Tenant Improvements and Allowances PSF | Third-Party Leasing Commissions PSF | Weighted Average Lease Term (years) | Comparable Only |
||||||||||||||||||||||||||||||||||||||||||||||||||||||||||||||||||||||||||||||||
Leases |
GLA |
New ABR |
New ABR PSF |
Leases |
GLA |
New ABR PSF |
Old ABR PSF |
Rent Spread |
|||||||||||||||||||||||||||||||||||||||||||||||||||||||||||||||||||||||||||
TOTAL - NEW, RENEWAL & OPTION LEASES |
|||||||||||||||||||||||||||||||||||||||||||||||||||||||||||||||||||||||||||||||||||
| Three months ended 6/30/24 | 383 | 2,343,546 | $ | 43,608 | $ | 18.61 | $ | 3.72 | $ | 2.28 | 6.5 | 317 | 1,919,675 | $ | 18.57 | $ | 15.52 | 19.7 | % | ||||||||||||||||||||||||||||||||||||||||||||||||||||||||||||||||
| Three months ended 3/31/24 | 351 | 2,626,599 | 44,206 | 16.83 | 3.43 | 1.73 | 6.4 | 287 | 2,144,714 | 16.32 | 14.30 | 14.1 | % | ||||||||||||||||||||||||||||||||||||||||||||||||||||||||||||||||||||||
| Three months ended 12/31/23 | 402 | 2,679,220 | 46,347 | 17.30 | 5.29 | 2.46 | 6.7 | 315 | 2,218,623 | 16.63 | 14.38 | 15.6 | % | ||||||||||||||||||||||||||||||||||||||||||||||||||||||||||||||||||||||
| Three months ended 9/30/23 | 427 | 2,733,476 | 50,591 | 18.51 | 4.29 | 2.14 | 6.7 | 354 | 2,294,170 | 18.09 | 15.39 | 17.5 | % | ||||||||||||||||||||||||||||||||||||||||||||||||||||||||||||||||||||||
| TOTAL - TWELVE MONTHS ENDED 6/30/24 | 1,563 | 10,382,841 | $ | 184,752 | $ | 17.79 | $ | 4.20 | $ | 2.15 | 6.6 | 1,273 | 8,577,182 | $ | 17.38 | $ | 14.89 | 16.7 | % | ||||||||||||||||||||||||||||||||||||||||||||||||||||||||||||||||
| NEW & RENEWAL LEASES ONLY | |||||||||||||||||||||||||||||||||||||||||||||||||||||||||||||||||||||||||||||||||||
| Three months ended 6/30/24 | 328 | 1,434,942 | $ | 30,733 | $ | 21.42 | $ | 6.07 | $ | 3.72 | 7.3 | 262 | 1,011,071 | $ | 22.52 | $ | 17.63 | 27.7 | % | ||||||||||||||||||||||||||||||||||||||||||||||||||||||||||||||||
| Three months ended 3/31/24 | 294 | 1,322,079 | 29,944 | 22.65 | 6.81 | 3.44 | 7.7 | 230 | 840,194 | 24.68 | 20.65 | 19.5 | % | ||||||||||||||||||||||||||||||||||||||||||||||||||||||||||||||||||||||
| Three months ended 12/31/23 | 357 | 1,739,188 | 36,717 | 21.11 | 8.15 | 3.78 | 7.6 | 270 | 1,278,591 | 21.32 | 17.82 | 19.6 | % | ||||||||||||||||||||||||||||||||||||||||||||||||||||||||||||||||||||||
| Three months ended 9/30/23 | 368 | 1,748,987 | 37,730 | 21.57 | 6.71 | 3.34 | 7.7 | 295 | 1,309,681 | 21.87 | 17.88 | 22.3 | % | ||||||||||||||||||||||||||||||||||||||||||||||||||||||||||||||||||||||
| TOTAL - TWELVE MONTHS ENDED 6/30/24 | 1,347 | 6,245,196 | $ | 135,124 | $ | 21.64 | $ | 6.99 | $ | 3.57 | 7.6 | 1,057 | 4,439,537 | $ | 22.39 | $ | 18.33 | 22.1 | % | ||||||||||||||||||||||||||||||||||||||||||||||||||||||||||||||||
| NEW LEASES | |||||||||||||||||||||||||||||||||||||||||||||||||||||||||||||||||||||||||||||||||||
| Three months ended 6/30/24 | 133 | 603,593 | $ | 14,376 | $ | 23.82 | $ | 13.36 | $ | 8.67 | 9.3 | 69 | 310,779 | $ | 24.11 | $ | 16.05 | 50.2 | % | ||||||||||||||||||||||||||||||||||||||||||||||||||||||||||||||||
| Three months ended 3/31/24 | 117 | 709,164 | 15,152 | 21.37 | 10.73 | 6.31 | 9.8 | 54 | 230,991 | 26.08 | 18.67 | 39.7 | % | ||||||||||||||||||||||||||||||||||||||||||||||||||||||||||||||||||||||
| Three months ended 12/31/23 | 150 | 798,868 | 16,772 | 20.99 | 15.43 | 8.14 | 9.6 | 65 | 387,876 | 20.49 | 14.91 | 37.4 | % | ||||||||||||||||||||||||||||||||||||||||||||||||||||||||||||||||||||||
| Three months ended 9/30/23 | 151 | 789,336 | 17,949 | 22.74 | 14.24 | 7.38 | 10.6 | 78 | 350,030 | 25.32 | 16.58 | 52.7 | % | ||||||||||||||||||||||||||||||||||||||||||||||||||||||||||||||||||||||
| TOTAL - TWELVE MONTHS ENDED 6/30/24 | 551 | 2,900,961 | $ | 64,249 | $ | 22.15 | $ | 13.52 | $ | 7.60 | 9.9 | 266 | 1,279,676 | $ | 23.70 | $ | 16.32 | 45.2 | % | ||||||||||||||||||||||||||||||||||||||||||||||||||||||||||||||||
| RENEWAL LEASES | |||||||||||||||||||||||||||||||||||||||||||||||||||||||||||||||||||||||||||||||||||
| Three months ended 6/30/24 | 195 | 831,349 | $ | 16,357 | $ | 19.68 | $ | 0.77 | $ | 0.12 | 6.0 | 193 | 700,292 | $ | 21.81 | $ | 18.34 | 18.9 | % | ||||||||||||||||||||||||||||||||||||||||||||||||||||||||||||||||
| Three months ended 3/31/24 | 177 | 612,915 | 14,792 | 24.13 | 2.28 | 0.12 | 5.2 | 176 | 609,203 | 24.15 | 21.40 | 12.9 | % | ||||||||||||||||||||||||||||||||||||||||||||||||||||||||||||||||||||||
| Three months ended 12/31/23 | 207 | 940,320 | 19,945 | 21.21 | 1.97 | 0.08 | 5.9 | 205 | 890,715 | 21.68 | 19.08 | 13.6 | % | ||||||||||||||||||||||||||||||||||||||||||||||||||||||||||||||||||||||
| Three months ended 9/30/23 | 217 | 959,651 | 19,781 | 20.61 | 0.52 | 0.02 | 5.4 | 217 | 959,651 | 20.61 | 18.36 | 12.3 | % | ||||||||||||||||||||||||||||||||||||||||||||||||||||||||||||||||||||||
| TOTAL - TWELVE MONTHS ENDED 6/30/24 | 796 | 3,344,235 | $ | 70,875 | $ | 21.19 | $ | 1.31 | $ | 0.08 | 5.6 | 791 | 3,159,861 | $ | 21.86 | $ | 19.14 | 14.2 | % | ||||||||||||||||||||||||||||||||||||||||||||||||||||||||||||||||
| OPTION LEASES | |||||||||||||||||||||||||||||||||||||||||||||||||||||||||||||||||||||||||||||||||||
| Three months ended 6/30/24 | 55 | 908,604 | $ | 12,875 | $ | 14.17 | $ | — | $ | — | 5.2 | 55 | 908,604 | $ | 14.17 | $ | 13.16 | 7.7 | % | ||||||||||||||||||||||||||||||||||||||||||||||||||||||||||||||||
| Three months ended 3/31/24 | 57 | 1,304,520 | 14,262 | 10.93 | — | — | 5.1 | 57 | 1,304,520 | 10.93 | 10.21 | 7.1 | % | ||||||||||||||||||||||||||||||||||||||||||||||||||||||||||||||||||||||
| Three months ended 12/31/23 | 45 | 940,032 | 9,630 | 10.24 | — | — | 5.0 | 45 | 940,032 | 10.24 | 9.71 | 5.5 | % | ||||||||||||||||||||||||||||||||||||||||||||||||||||||||||||||||||||||
| Three months ended 9/30/23 | 59 | 984,489 | 12,861 | 13.06 | — | — | 4.9 | 59 | 984,489 | 13.06 | 12.07 | 8.2 | % | ||||||||||||||||||||||||||||||||||||||||||||||||||||||||||||||||||||||
| TOTAL - TWELVE MONTHS ENDED 6/30/24 | 216 | 4,137,645 | $ | 49,628 | $ | 11.99 | $ | — | $ | — | 5.1 | 216 | 4,137,645 | $ | 11.99 | $ | 11.19 | 7.1 | % | ||||||||||||||||||||||||||||||||||||||||||||||||||||||||||||||||
| LEASES BY ANCHOR AND SMALL SHOP | Three Months Ended 6/30/24 | Twelve Months Ended 6/30/24 | |||||||||||||||||||||||||||||||||||||||||||||||||||||||||||||||||||||||||||||||||
| % of Leases | GLA | % of GLA | % of ABR | New ABR PSF | Rent Spread (1) | % of Leases | GLA | % of GLA | % of ABR | New ABR PSF | Rent Spread (1) | ||||||||||||||||||||||||||||||||||||||||||||||||||||||||||||||||||||||||
Anchor Leases (≥ 10,000 SF) |
|||||||||||||||||||||||||||||||||||||||||||||||||||||||||||||||||||||||||||||||||||
| Total - New, Renewal & Option Leases | 15 | % | 1,505,000 | 64 | % | 46 | % | $ | 13.36 | 21.0 | % | 15 | % | 6,829,012 | 66 | % | 46 | % | $ | 12.42 | 15.9 | % | |||||||||||||||||||||||||||||||||||||||||||||||||||||||||||||
| New & Renewal Leases Only | 8 | % | 690,663 | 48 | % | 31 | % | 13.95 | 53.8 | % | 10 | % | 3,159,736 | 51 | % | 34 | % | 14.56 | 29.6 | % | |||||||||||||||||||||||||||||||||||||||||||||||||||||||||||||||
| New Leases | 11 | % | 282,591 | 47 | % | 34 | % | 17.47 | 96.3 | % | 13 | % | 1,566,248 | 54 | % | 39 | % | 16.10 | 64.4 | % | |||||||||||||||||||||||||||||||||||||||||||||||||||||||||||||||
| Renewal Leases | 6 | % | 408,072 | 49 | % | 29 | % | 11.50 | 32.1 | % | 8 | % | 1,593,488 | 48 | % | 29 | % | 13.05 | 14.2 | % | |||||||||||||||||||||||||||||||||||||||||||||||||||||||||||||||
| Option Leases | 55 | % | 814,337 | 90 | % | 81 | % | 12.86 | 7.1 | % | 48 | % | 3,669,276 | 89 | % | 78 | % | 10.57 | 6.8 | % | |||||||||||||||||||||||||||||||||||||||||||||||||||||||||||||||
Small Shop Leases (< 10,000 SF) |
|||||||||||||||||||||||||||||||||||||||||||||||||||||||||||||||||||||||||||||||||||
| Total - New, Renewal & Option Leases | 85 | % | 838,546 | 36 | % | 54 | % | $ | 28.03 | 18.5 | % | 85 | % | 3,553,829 | 34 | % | 54 | % | $ | 28.13 | 17.6 | % | |||||||||||||||||||||||||||||||||||||||||||||||||||||||||||||
| New & Renewal Leases Only | 92 | % | 744,279 | 52 | % | 69 | % | 28.35 | 19.9 | % | 90 | % | 3,085,460 | 49 | % | 66 | % | 28.88 | 19.0 | % | |||||||||||||||||||||||||||||||||||||||||||||||||||||||||||||||
| New Leases | 89 | % | 321,002 | 53 | % | 66 | % | 29.40 | 32.3 | % | 87 | % | 1,334,713 | 46 | % | 61 | % | 29.25 | 34.8 | % | |||||||||||||||||||||||||||||||||||||||||||||||||||||||||||||||
| Renewal Leases | 94 | % | 423,277 | 51 | % | 71 | % | 27.55 | 15.4 | % | 92 | % | 1,750,747 | 52 | % | 71 | % | 28.61 | 14.2 | % | |||||||||||||||||||||||||||||||||||||||||||||||||||||||||||||||
| Option Leases | 45 | % | 94,267 | 10 | % | 19 | % | 25.50 | 10.1 | % | 52 | % | 468,369 | 11 | % | 22 | % | 23.15 | 8.8 | % | |||||||||||||||||||||||||||||||||||||||||||||||||||||||||||||||
(1) Comparable leases only. |
|||||||||||||||||||||||||||||||||||||||||||||||||||||||||||||||||||||||||||||||||||
Excludes leases signed for terms of less than one year. |
|||||||||||||||||||||||||||||||||||||||||||||||||||||||||||||||||||||||||||||||||||
ABR PSF includes the GLA of lessee-owned leasehold improvements. |
|||||||||||||||||||||||||||||||||||||||||||||||||||||||||||||||||||||||||||||||||||
Reflects portfolio statistics as reported for the specified period. |
|||||||||||||||||||||||||||||||||||||||||||||||||||||||||||||||||||||||||||||||||||
| Supplemental Disclosure - Three Months Ended June 30, 2024 | Page 29 |
|
||||||
| NEW LEASE NET EFFECTIVE RENT & LEASES SIGNED BUT NOT YET COMMENCED | ||||||||||||||||||||||||||||||||||||||||||||||||||||||||||||||||||||
| Dollars in thousands, except per square foot amounts | ||||||||||||||||||||||||||||||||||||||||||||||||||||||||||||||||||||
| NEW LEASE NET EFFECTIVE RENT | ||||||||||||||||||||||||||||||||||||||||||||||||||||||||||||||||||||
| Twelve Months Ended | Three Months Ended | |||||||||||||||||||||||||||||||||||||||||||||||||||||||||||||||||||
| 6/30/24 | 6/30/24 | 3/31/24 | 12/31/23 | 9/30/23 | 6/30/23 | |||||||||||||||||||||||||||||||||||||||||||||||||||||||||||||||
| NEW LEASES | ||||||||||||||||||||||||||||||||||||||||||||||||||||||||||||||||||||
| Weighted average over lease term: | ||||||||||||||||||||||||||||||||||||||||||||||||||||||||||||||||||||
| Base rent | $ | 24.12 | $ | 25.87 | $ | 22.96 | $ | 22.94 | $ | 25.00 | $ | 25.01 | ||||||||||||||||||||||||||||||||||||||||||||||||||||||||
| Tenant improvements and allowances | (1.56) | (1.63) | (1.22) | (1.76) | (1.61) | (1.70) | ||||||||||||||||||||||||||||||||||||||||||||||||||||||||||||||
| Third-party leasing commissions | (0.77) | (0.88) | (0.65) | (0.82) | (0.75) | (0.90) | ||||||||||||||||||||||||||||||||||||||||||||||||||||||||||||||
| NET EFFECTIVE RENT BEFORE TENANT SPECIFIC LANDLORD WORK | 21.79 | 23.36 | 21.09 | 20.36 | 22.64 | 22.41 | ||||||||||||||||||||||||||||||||||||||||||||||||||||||||||||||
| Tenant specific landlord work (1) | (2.51) | (2.15) | (2.67) | (2.77) | (2.38) | (2.60) | ||||||||||||||||||||||||||||||||||||||||||||||||||||||||||||||
| NET EFFECTIVE RENT | $ | 19.28 | $ | 21.21 | $ | 18.42 | $ | 17.59 | $ | 20.26 | $ | 19.81 | ||||||||||||||||||||||||||||||||||||||||||||||||||||||||
| Net effective rent before tenant specific landlord work / | ||||||||||||||||||||||||||||||||||||||||||||||||||||||||||||||||||||
| base rent | 90% | 90% | 92% | 89% | 91% | 90% | ||||||||||||||||||||||||||||||||||||||||||||||||||||||||||||||
| Net effective rent / base rent | 80% | 82% | 80% | 77% | 81% | 79% | ||||||||||||||||||||||||||||||||||||||||||||||||||||||||||||||
| Weighted average term (years) | 9.9 | 9.3 | 9.8 | 9.6 | 10.6 | 9.9 | ||||||||||||||||||||||||||||||||||||||||||||||||||||||||||||||
| PERCENT OF TOTAL NET EFFECTIVE RENT BY ANCHOR AND SMALL SHOP | ||||||||||||||||||||||||||||||||||||||||||||||||||||||||||||||||||||
| ≥ 10,000 SF | 36% | 33% | 46% | 28% | 39% | 23% | ||||||||||||||||||||||||||||||||||||||||||||||||||||||||||||||
| < 10,000 SF | 64% | 67% | 54% | 72% | 61% | 77% | ||||||||||||||||||||||||||||||||||||||||||||||||||||||||||||||
| LEASES SIGNED BUT NOT YET COMMENCED (2) | ||||||||||||||||||||||||||||||||||||||||||||||||||||||||||||||||||||
| As of: 6/30/2024 | Leases | GLA | ABR | ABR PSF | ||||||||||||||||||||||||||||||||||||||||||||||||||||||||||||||||
| ≥ 10,000 SF | 75 | 1,911,023 | $ | 30,742 | $ | 16.09 | ||||||||||||||||||||||||||||||||||||||||||||||||||||||||||||||
| < 10,000 SF | 322 | 1,038,400 | 33,955 | 32.70 | ||||||||||||||||||||||||||||||||||||||||||||||||||||||||||||||||
| TOTAL | 397 | 2,949,423 | $ | 64,697 | $ | 21.94 | ||||||||||||||||||||||||||||||||||||||||||||||||||||||||||||||
| EXPECTED TIMING OF THE LEASES SIGNED BUT NOT YET COMMENCED | ||||||||||||||||||||||||||||||||||||||||||||||||||||||||||||||||||||
| 2024 (remaining) | 2025 | 2026+ | Total | |||||||||||||||||||||||||||||||||||||||||||||||||||||||||||||||||
| Projected Lease Commencements | $ | 31,112 | $ | 29,244 | $ | 4,341 | $ | 64,697 | ||||||||||||||||||||||||||||||||||||||||||||||||||||||||||||
| (1) Represents base building costs funded through tenant allowances. | ||||||||||||||||||||||||||||||||||||||||||||||||||||||||||||||||||||
| (2) Signed but not commenced population represents approximately 460 basis points of total portfolio GLA ($64.7M in ABR), 60 basis points ($9.3M in ABR) of which represents leases on space that will be vacated by existing tenants in the near term. | ||||||||||||||||||||||||||||||||||||||||||||||||||||||||||||||||||||
| ABR PSF includes the GLA of lessee-owned leasehold improvements. | ||||||||||||||||||||||||||||||||||||||||||||||||||||||||||||||||||||
| Reflects portfolio statistics as reported for the specified period. | ||||||||||||||||||||||||||||||||||||||||||||||||||||||||||||||||||||
| Supplemental Disclosure - Three Months Ended June 30, 2024 | Page 30 |
|
||||||
| LEASE EXPIRATION SCHEDULE | ||||||||||||||||||||||||||||||||||||||||||||||||||||||||||||||||||||||||||||||||||||||||||||||||||||||||||||||||||||||||||
| ASSUMES NO EXERCISE OF RENEWAL OPTIONS | ||||||||||||||||||||||||||||||||||||||||||||||||||||||||||||||||||||||||||||||||||||||||||||||||||||||||||||||||||||||||||
| TOTAL PORTFOLIO | SPACES ≥ 10,000 SF |
SPACES < 10,000 SF | ||||||||||||||||||||||||||||||||||||||||||||||||||||||||||||||||||||||||||||||||||||||||||||||||||||||||||||||||||||||||
| Number | % of | % of | ABR PSF | Number | % of | % of | ABR PSF | Number | % of | % of | ABR PSF | |||||||||||||||||||||||||||||||||||||||||||||||||||||||||||||||||||||||||||||||||||||||||||||||||||||||||||||||
| of | Leased | Leased | In-Place | In-place | at | of | Leased | Leased | In-Place | In-place | at | of | Leased | Leased | In-Place | In-place | at | |||||||||||||||||||||||||||||||||||||||||||||||||||||||||||||||||||||||||||||||||||||||||||||||||||||||||
| Leases | GLA | GLA | ABR | ABR PSF | Expiration | Leases | GLA | GLA | ABR | ABR PSF | Expiration | Leases | GLA | GLA | ABR | ABR PSF | Expiration | |||||||||||||||||||||||||||||||||||||||||||||||||||||||||||||||||||||||||||||||||||||||||||||||||||||||||
| M-M | 203 | 609,154 | 1.0 | % | 1.0 | % | $ | 16.95 | $ | 16.95 | 13 | 214,079 | 0.5 | % | 0.5 | % | $ | 11.44 | $ | 11.44 | 190 | 395,075 | 2.1 | % | 1.6 | % | $ | 19.94 | $ | 19.94 | ||||||||||||||||||||||||||||||||||||||||||||||||||||||||||||||||||||||||||||||||||||||||||||
| 2024 | 342 | 1,718,284 | 2.8 | % | 2.5 | % | 14.63 | 14.63 | 38 | 975,815 | 2.3 | % | 2.1 | % | 10.49 | 10.49 | 304 | 742,469 | 4.0 | % | 3.0 | % | 20.08 | 20.08 | ||||||||||||||||||||||||||||||||||||||||||||||||||||||||||||||||||||||||||||||||||||||||||||||||||
| 2025 | 1,084 | 7,284,845 | 12.0 | % | 10.5 | % | 14.28 | 14.34 | 170 | 4,779,567 | 11.3 | % | 9.7 | % | 10.10 | 10.13 | 914 | 2,505,278 | 13.5 | % | 11.4 | % | 22.26 | 22.39 | ||||||||||||||||||||||||||||||||||||||||||||||||||||||||||||||||||||||||||||||||||||||||||||||||||
| 2026 | 1,034 | 7,019,620 | 11.5 | % | 11.5 | % | 16.18 | 16.42 | 162 | 4,717,011 | 11.2 | % | 10.8 | % | 11.37 | 11.42 | 872 | 2,302,609 | 12.4 | % | 12.2 | % | 26.03 | 26.68 | ||||||||||||||||||||||||||||||||||||||||||||||||||||||||||||||||||||||||||||||||||||||||||||||||||
| 2027 | 1,083 | 8,405,295 | 13.8 | % | 13.3 | % | 15.59 | 16.02 | 188 | 5,839,664 | 13.8 | % | 13.3 | % | 11.34 | 11.44 | 895 | 2,565,631 | 13.8 | % | 13.2 | % | 25.27 | 26.43 | ||||||||||||||||||||||||||||||||||||||||||||||||||||||||||||||||||||||||||||||||||||||||||||||||||
| 2028 | 961 | 6,788,722 | 11.2 | % | 11.7 | % | 17.08 | 17.70 | 165 | 4,630,282 | 11.0 | % | 11.3 | % | 12.14 | 12.23 | 796 | 2,158,440 | 11.6 | % | 12.2 | % | 27.67 | 29.44 | ||||||||||||||||||||||||||||||||||||||||||||||||||||||||||||||||||||||||||||||||||||||||||||||||||
| 2029 | 884 | 8,303,234 | 13.7 | % | 12.5 | % | 14.91 | 15.78 | 192 | 6,282,729 | 14.9 | % | 14.0 | % | 11.10 | 11.39 | 692 | 2,020,505 | 10.9 | % | 11.0 | % | 26.77 | 29.40 | ||||||||||||||||||||||||||||||||||||||||||||||||||||||||||||||||||||||||||||||||||||||||||||||||||
| 2030 | 431 | 4,347,926 | 7.2 | % | 6.8 | % | 15.39 | 16.82 | 103 | 3,259,588 | 7.7 | % | 7.4 | % | 11.30 | 12.05 | 328 | 1,088,338 | 5.9 | % | 6.1 | % | 27.62 | 31.11 | ||||||||||||||||||||||||||||||||||||||||||||||||||||||||||||||||||||||||||||||||||||||||||||||||||
| 2031 | 329 | 2,717,495 | 4.5 | % | 4.7 | % | 16.94 | 19.02 | 66 | 1,856,257 | 4.4 | % | 4.8 | % | 12.88 | 14.05 | 263 | 861,238 | 4.6 | % | 4.5 | % | 25.68 | 29.73 | ||||||||||||||||||||||||||||||||||||||||||||||||||||||||||||||||||||||||||||||||||||||||||||||||||
| 2032 | 351 | 2,705,869 | 4.4 | % | 4.9 | % | 17.87 | 20.04 | 61 | 1,794,395 | 4.2 | % | 4.3 | % | 12.06 | 13.04 | 290 | 911,474 | 4.9 | % | 5.5 | % | 29.30 | 33.81 | ||||||||||||||||||||||||||||||||||||||||||||||||||||||||||||||||||||||||||||||||||||||||||||||||||
| 2033 | 414 | 3,173,604 | 5.2 | % | 6.0 | % | 18.54 | 21.12 | 85 | 2,058,249 | 4.9 | % | 5.3 | % | 13.04 | 14.28 | 329 | 1,115,355 | 6.0 | % | 6.6 | % | 28.68 | 33.75 | ||||||||||||||||||||||||||||||||||||||||||||||||||||||||||||||||||||||||||||||||||||||||||||||||||
| 2034+ | 741 | 7,732,469 | 12.7 | % | 14.6 | % | 18.58 | 21.83 | 196 | 5,827,403 | 13.8 | % | 16.5 | % | 14.07 | 16.05 | 545 | 1,905,066 | 10.3 | % | 12.7 | % | 32.37 | 39.51 | ||||||||||||||||||||||||||||||||||||||||||||||||||||||||||||||||||||||||||||||||||||||||||||||||||
| ASSUMES EXERCISE OF ALL RENEWAL OPTIONS (1) | ||||||||||||||||||||||||||||||||||||||||||||||||||||||||||||||||||||||||||||||||||||||||||||||||||||||||||||||||||||||||||
| TOTAL PORTFOLIO | SPACES ≥ 10,000 SF |
SPACES < 10,000 SF | ||||||||||||||||||||||||||||||||||||||||||||||||||||||||||||||||||||||||||||||||||||||||||||||||||||||||||||||||||||||||
| Number | % of | % of | ABR PSF | Number | % of | % of | ABR PSF | Number | % of | % of | ABR PSF | |||||||||||||||||||||||||||||||||||||||||||||||||||||||||||||||||||||||||||||||||||||||||||||||||||||||||||||||
| of | Leased | Leased | In-Place | In-place | at | of | Leased | Leased | In-Place | In-place | at | of | Leased | Leased | In-Place | In-place | at | |||||||||||||||||||||||||||||||||||||||||||||||||||||||||||||||||||||||||||||||||||||||||||||||||||||||||
| Leases | GLA | GLA | ABR | ABR PSF | Expiration | Leases | GLA | GLA | ABR | ABR PSF | Expiration | Leases | GLA | GLA | ABR | ABR PSF | Expiration | |||||||||||||||||||||||||||||||||||||||||||||||||||||||||||||||||||||||||||||||||||||||||||||||||||||||||
| M-M | 203 | 609,154 | 1.0 | % | 1.0 | % | $ | 16.95 | $ | 16.95 | 13 | 214,079 | 0.5 | % | 0.5 | % | $ | 11.44 | $ | 11.44 | 190 | 395,075 | 2.1 | % | 1.6 | % | $ | 19.94 | $ | 19.94 | ||||||||||||||||||||||||||||||||||||||||||||||||||||||||||||||||||||||||||||||||||||||||||||
| 2024 | 304 | 1,199,249 | 2.0 | % | 1.8 | % | 14.46 | 14.53 | 25 | 530,681 | 1.3 | % | 0.9 | % | 8.12 | 8.12 | 279 | 668,568 | 3.6 | % | 2.7 | % | 19.50 | 19.63 | ||||||||||||||||||||||||||||||||||||||||||||||||||||||||||||||||||||||||||||||||||||||||||||||||||
| 2025 | 798 | 3,465,208 | 5.7 | % | 5.5 | % | 15.66 | 15.77 | 67 | 1,622,326 | 3.8 | % | 2.8 | % | 8.62 | 8.69 | 731 | 1,842,882 | 9.9 | % | 8.2 | % | 21.85 | 22.00 | ||||||||||||||||||||||||||||||||||||||||||||||||||||||||||||||||||||||||||||||||||||||||||||||||||
| 2026 | 695 | 2,494,512 | 4.1 | % | 5.0 | % | 19.91 | 20.45 | 42 | 954,228 | 2.3 | % | 2.1 | % | 11.19 | 11.34 | 653 | 1,540,284 | 8.3 | % | 8.0 | % | 25.32 | 26.09 | ||||||||||||||||||||||||||||||||||||||||||||||||||||||||||||||||||||||||||||||||||||||||||||||||||
| 2027 | 714 | 2,741,168 | 4.5 | % | 5.8 | % | 20.81 | 21.79 | 52 | 1,094,819 | 2.6 | % | 2.8 | % | 12.71 | 12.94 | 662 | 1,646,349 | 8.9 | % | 8.8 | % | 26.19 | 27.67 | ||||||||||||||||||||||||||||||||||||||||||||||||||||||||||||||||||||||||||||||||||||||||||||||||||
| 2028 | 641 | 2,275,259 | 3.7 | % | 5.2 | % | 22.48 | 23.96 | 40 | 826,000 | 2.0 | % | 2.2 | % | 13.40 | 13.62 | 601 | 1,449,259 | 7.8 | % | 8.2 | % | 27.66 | 29.85 | ||||||||||||||||||||||||||||||||||||||||||||||||||||||||||||||||||||||||||||||||||||||||||||||||||
| 2029 | 532 | 1,909,173 | 3.1 | % | 4.1 | % | 21.37 | 23.79 | 28 | 616,187 | 1.5 | % | 1.4 | % | 11.00 | 12.25 | 504 | 1,292,986 | 7.0 | % | 6.9 | % | 26.32 | 29.29 | ||||||||||||||||||||||||||||||||||||||||||||||||||||||||||||||||||||||||||||||||||||||||||||||||||
| 2030 | 323 | 1,851,695 | 3.0 | % | 3.3 | % | 17.73 | 19.68 | 39 | 1,007,302 | 2.4 | % | 2.3 | % | 11.57 | 12.51 | 284 | 844,393 | 4.5 | % | 4.3 | % | 25.09 | 28.22 | ||||||||||||||||||||||||||||||||||||||||||||||||||||||||||||||||||||||||||||||||||||||||||||||||||
| 2031 | 308 | 1,788,148 | 2.9 | % | 3.2 | % | 17.91 | 20.26 | 35 | 1,017,283 | 2.4 | % | 2.4 | % | 11.78 | 12.89 | 273 | 770,865 | 4.2 | % | 4.1 | % | 25.99 | 29.98 | ||||||||||||||||||||||||||||||||||||||||||||||||||||||||||||||||||||||||||||||||||||||||||||||||||
| 2032 | 304 | 2,011,074 | 3.4 | % | 3.7 | % | 18.21 | 20.22 | 53 | 1,237,319 | 2.9 | % | 3.2 | % | 12.86 | 13.88 | 251 | 773,755 | 4.2 | % | 4.2 | % | 26.77 | 30.36 | ||||||||||||||||||||||||||||||||||||||||||||||||||||||||||||||||||||||||||||||||||||||||||||||||||
| 2033 | 323 | 2,093,911 | 3.4 | % | 3.8 | % | 18.01 | 20.59 | 61 | 1,297,995 | 3.1 | % | 3.2 | % | 12.38 | 13.54 | 262 | 795,916 | 4.3 | % | 4.5 | % | 27.19 | 32.08 | ||||||||||||||||||||||||||||||||||||||||||||||||||||||||||||||||||||||||||||||||||||||||||||||||||
| 2034+ | 2,713 | 38,367,966 | 63.2 | % | 57.6 | % | 14.80 | 19.10 | 984 | 31,816,820 | 75.2 | % | 76.2 | % | 11.92 | 15.17 | 1,729 | 6,551,146 | 35.2 | % | 38.5 | % | 28.80 | 38.15 | ||||||||||||||||||||||||||||||||||||||||||||||||||||||||||||||||||||||||||||||||||||||||||||||||||
| (1) ABR for leases whose future option rent is based on fair market value or on a percentage change in CPI is reported as the ABR for the last year of the current lease term. | ||||||||||||||||||||||||||||||||||||||||||||||||||||||||||||||||||||||||||||||||||||||||||||||||||||||||||||||||||||||||||
| ABR PSF includes the GLA of lessee-owned leasehold improvements. | ||||||||||||||||||||||||||||||||||||||||||||||||||||||||||||||||||||||||||||||||||||||||||||||||||||||||||||||||||||||||||
| LEASE RETENTION RATE AT NATURAL EXPIRATION | ||||||||||||||||||||||||||||||||||||||||||||||||||||||||||||||||||||||||||||||||||||||||||||||||||||||||||||||||||||||||||
| By Count | By GLA | |||||||||||||||||||||||||||||||||||||||||||||||||||||||||||||||||||||||||||||||||||||||||||||||||||||||||||||||||||||||||
| Twelve Months Ended 6/30/24 | 80.8% | 87.1% | ||||||||||||||||||||||||||||||||||||||||||||||||||||||||||||||||||||||||||||||||||||||||||||||||||||||||||||||||||||||||
| Supplemental Disclosure - Three Months Ended June 30, 2024 | Page 31 |
|
||||||
| MAJOR CBSA DETAIL | ||||||||||||||||||||||||||||||||||||||||||||||||||||||||||||||||||||||||||
Dollars in thousands, except per square foot amounts |
||||||||||||||||||||||||||||||||||||||||||||||||||||||||||||||||||||||||||
| PROPERTIES BY LARGEST US CBSAs | Percent of |
|||||||||||||||||||||||||||||||||||||||||||||||||||||||||||||||||||||||||
Number of |
Percent |
Percent |
Number of |
Percent |
Percent |
|||||||||||||||||||||||||||||||||||||||||||||||||||||||||||||||||||||
| Largest US CBSAs by 2023 Population | Properties |
GLA |
Billed |
Leased |
ABR |
ABR PSF |
Properties |
of GLA |
of ABR |
|||||||||||||||||||||||||||||||||||||||||||||||||||||||||||||||||
| Top 50 Largest US CBSAs by Population | 251 | 43,917,786 | 90.9 | % | 95.0 | % | $ | 706,680 | $ | 17.96 | 69.7 | % | 68.9 | % | 71.5 | % | ||||||||||||||||||||||||||||||||||||||||||||||||||||||||||
| CBSAs Ranked 51 - 100 by Population | 41 | 7,409,551 | 90.3 | % | 95.1 | % | 98,994 | 14.90 | 11.4 | % | 11.6 | % | 10.0 | % | ||||||||||||||||||||||||||||||||||||||||||||||||||||||||||||
| Other CBSAs | 68 | 12,423,641 | 94.0 | % | 96.9 | % | 182,007 | 16.22 | 18.9 | % | 19.5 | % | 18.5 | % | ||||||||||||||||||||||||||||||||||||||||||||||||||||||||||||
| TOTAL | 360 | 63,750,978 | 91.4 | % | 95.4 | % | $ | 987,681 | $ | 17.26 | 100.0 | % | 100.0 | % | 100.0 | % | ||||||||||||||||||||||||||||||||||||||||||||||||||||||||||
| BRIXMOR LARGEST CBSAs BY ABR | ||||||||||||||||||||||||||||||||||||||||||||||||||||||||||||||||||||||||||
Percent of |
||||||||||||||||||||||||||||||||||||||||||||||||||||||||||||||||||||||||||
| CBSA | Number of |
Percent |
Percent |
Number of |
Percent |
Percent |
||||||||||||||||||||||||||||||||||||||||||||||||||||||||||||||||||||
| Largest CBSAs by ABR | Rank | Properties |
GLA |
Billed |
Leased |
ABR |
ABR PSF |
Properties |
of GLA |
of ABR |
||||||||||||||||||||||||||||||||||||||||||||||||||||||||||||||||
| 1 | Philadelphia-Camden-Wilmington, PA-NJ-DE-MD | 8 | 22 | 4,003,813 | 90.6 | % | 95.7 | % | $ | 73,417 | $ | 22.13 | 6.0 | % | 6.2 | % | 7.3 | % | ||||||||||||||||||||||||||||||||||||||||||||||||||||||||
| 2 | New York-Newark-Jersey City, NY-NJ-PA | 1 | 27 | 3,250,743 | 92.1 | % | 94.2 | % | 70,606 | 23.42 | 7.4 | % | 5.0 | % | 7.1 | % | ||||||||||||||||||||||||||||||||||||||||||||||||||||||||||
| 3 | Houston-The Woodlands-Sugar Land, TX | 5 | 30 | 4,006,702 | 92.2 | % | 95.2 | % | 56,836 | 15.33 | 8.2 | % | 6.3 | % | 5.8 | % | ||||||||||||||||||||||||||||||||||||||||||||||||||||||||||
| 4 | Chicago-Naperville-Elgin, IL-IN-WI | 3 | 16 | 4,054,692 | 84.7 | % | 89.4 | % | 55,735 | 15.77 | 4.3 | % | 6.4 | % | 5.6 | % | ||||||||||||||||||||||||||||||||||||||||||||||||||||||||||
| 5 | Dallas-Fort Worth-Arlington, TX | 4 | 13 | 2,713,715 | 86.1 | % | 95.3 | % | 50,791 | 20.70 | 3.5 | % | 4.3 | % | 5.1 | % | ||||||||||||||||||||||||||||||||||||||||||||||||||||||||||
| 6 | Los Angeles-Long Beach-Anaheim, CA | 2 | 11 | 1,901,253 | 94.3 | % | 98.9 | % | 44,441 | 25.69 | 3.0 | % | 3.0 | % | 4.5 | % | ||||||||||||||||||||||||||||||||||||||||||||||||||||||||||
| 7 | Atlanta-Sandy Springs-Alpharetta, GA | 7 | 23 | 3,304,570 | 93.5 | % | 95.8 | % | 44,091 | 14.45 | 6.3 | % | 5.2 | % | 4.5 | % | ||||||||||||||||||||||||||||||||||||||||||||||||||||||||||
| 8 | Tampa-St. Petersburg-Clearwater, FL | 17 | 11 | 1,796,844 | 87.1 | % | 97.8 | % | 30,638 | 18.06 | 3.0 | % | 2.8 | % | 3.1 | % | ||||||||||||||||||||||||||||||||||||||||||||||||||||||||||
| 9 | Cincinnati, OH-KY-IN | 30 | 7 | 1,860,090 | 96.9 | % | 97.0 | % | 26,074 | 18.41 | 1.8 | % | 2.9 | % | 2.6 | % | ||||||||||||||||||||||||||||||||||||||||||||||||||||||||||
| 10 | Naples-Marco Island, FL | 138 | 5 | 1,068,109 | 93.8 | % | 99.2 | % | 21,550 | 20.67 | 1.3 | % | 1.7 | % | 2.2 | % | ||||||||||||||||||||||||||||||||||||||||||||||||||||||||||
| 10 Largest CBSAs by ABR | — | 165 | 27,960,531 | 90.6 | % | 95.1 | % | 474,179 | 18.99 | 44.8 | % | 43.8 | % | 47.8 | % | |||||||||||||||||||||||||||||||||||||||||||||||||||||||||||
| 11 | Orlando-Kissimmee-Sanford, FL | 22 | 5 | 804,051 | 88.4 | % | 97.4 | % | 19,940 | 25.52 | 1.3 | % | 1.3 | % | 2.0 | % | ||||||||||||||||||||||||||||||||||||||||||||||||||||||||||
| 12 | Miami-Fort Lauderdale-Pompano Beach, FL | 9 | 8 | 1,145,130 | 93.8 | % | 95.5 | % | 19,239 | 18.01 | 2.1 | % | 1.8 | % | 1.9 | % | ||||||||||||||||||||||||||||||||||||||||||||||||||||||||||
| 13 | Denver-Aurora-Lakewood, CO | 19 | 6 | 1,313,386 | 92.5 | % | 96.2 | % | 19,050 | 16.21 | 1.6 | % | 2.1 | % | 1.9 | % | ||||||||||||||||||||||||||||||||||||||||||||||||||||||||||
| 14 | Detroit-Warren-Dearborn, MI | 14 | 7 | 1,359,658 | 88.9 | % | 97.3 | % | 17,180 | 14.17 | 1.8 | % | 2.1 | % | 1.7 | % | ||||||||||||||||||||||||||||||||||||||||||||||||||||||||||
| 15 | San Diego-Chula Vista-Carlsbad, CA | 18 | 3 | 655,343 | 94.4 | % | 95.4 | % | 16,422 | 26.45 | 0.8 | % | 1.0 | % | 1.7 | % | ||||||||||||||||||||||||||||||||||||||||||||||||||||||||||
| 16 | Charlotte-Concord-Gastonia, NC-SC | 23 | 4 | 1,301,277 | 95.9 | % | 96.8 | % | 15,223 | 13.55 | 1.1 | % | 2.0 | % | 1.5 | % | ||||||||||||||||||||||||||||||||||||||||||||||||||||||||||
| 17 | Minneapolis-St. Paul-Bloomington, MN-WI | 16 | 8 | 1,086,726 | 80.7 | % | 89.3 | % | 14,751 | 16.90 | 2.2 | % | 1.7 | % | 1.5 | % | ||||||||||||||||||||||||||||||||||||||||||||||||||||||||||
| 18 | Ann Arbor, MI | 149 | 3 | 814,826 | 94.0 | % | 96.8 | % | 13,459 | 17.18 | 0.8 | % | 1.3 | % | 1.4 | % | ||||||||||||||||||||||||||||||||||||||||||||||||||||||||||
| 19 | San Francisco-Oakland-Berkeley, CA | 13 | 2 | 506,520 | 93.8 | % | 96.3 | % | 12,159 | 30.60 | 0.6 | % | 0.8 | % | 1.2 | % | ||||||||||||||||||||||||||||||||||||||||||||||||||||||||||
| 20 | Vallejo, CA | 123 | 1 | 519,266 | 91.2 | % | 99.3 | % | 11,816 | 23.10 | 0.3 | % | 0.8 | % | 1.2 | % | ||||||||||||||||||||||||||||||||||||||||||||||||||||||||||
| 20 Largest CBSAs by ABR | — | 212 | 37,466,714 | 90.8 | % | 95.3 | % | 633,418 | 18.90 | 57.4 | % | 58.7 | % | 63.8 | % | |||||||||||||||||||||||||||||||||||||||||||||||||||||||||||
| 21 | North Port-Sarasota-Bradenton, FL | 66 | 5 | 737,243 | 98.2 | % | 99.2 | % | 11,376 | 15.69 | 1.4 | % | 1.2 | % | 1.2 | % | ||||||||||||||||||||||||||||||||||||||||||||||||||||||||||
| 22 | Port St. Lucie, FL | 112 | 5 | 692,612 | 91.3 | % | 95.8 | % | 11,190 | 17.03 | 1.4 | % | 1.1 | % | 1.1 | % | ||||||||||||||||||||||||||||||||||||||||||||||||||||||||||
| 23 | Binghamton, NY | 200 | 4 | 751,541 | 93.6 | % | 96.8 | % | 11,033 | 15.17 | 1.1 | % | 1.2 | % | 1.1 | % | ||||||||||||||||||||||||||||||||||||||||||||||||||||||||||
| 24 | Boston-Cambridge-Newton, MA-NH | 11 | 6 | 722,376 | 94.2 | % | 95.8 | % | 10,666 | 15.42 | 1.7 | % | 1.1 | % | 1.1 | % | ||||||||||||||||||||||||||||||||||||||||||||||||||||||||||
| 25 | Allentown-Bethlehem-Easton, PA-NJ | 70 | 3 | 824,148 | 95.1 | % | 97.8 | % | 10,631 | 14.39 | 0.8 | % | 1.3 | % | 1.1 | % | ||||||||||||||||||||||||||||||||||||||||||||||||||||||||||
| 26 | Riverside-San Bernardino-Ontario, CA | 12 | 4 | 501,668 | 90.9 | % | 98.3 | % | 10,624 | 24.70 | 1.1 | % | 0.8 | % | 1.1 | % | ||||||||||||||||||||||||||||||||||||||||||||||||||||||||||
| 27 | Nashville-Davidson--Murfreesboro--Franklin, TN | 34 | 4 | 797,885 | 96.7 | % | 97.1 | % | 10,593 | 13.73 | 1.1 | % | 1.3 | % | 1.1 | % | ||||||||||||||||||||||||||||||||||||||||||||||||||||||||||
| Supplemental Disclosure - Three Months Ended June 30, 2024 | Page 32 |
|
||||||
| MAJOR CBSA DETAIL | ||||||||||||||||||||||||||||||||||||||||||||||||||||||||||||||||||||||||||
Dollars in thousands, except per square foot amounts |
||||||||||||||||||||||||||||||||||||||||||||||||||||||||||||||||||||||||||
| BRIXMOR LARGEST CBSAs BY ABR | ||||||||||||||||||||||||||||||||||||||||||||||||||||||||||||||||||||||||||
Percent of |
||||||||||||||||||||||||||||||||||||||||||||||||||||||||||||||||||||||||||
| CBSA | Number of |
Percent |
Percent |
Number of |
Percent |
Percent |
||||||||||||||||||||||||||||||||||||||||||||||||||||||||||||||||||||
| Largest CBSAs by ABR | Rank | Properties |
GLA |
Billed |
Leased |
ABR |
ABR PSF |
Properties |
of GLA |
of ABR |
||||||||||||||||||||||||||||||||||||||||||||||||||||||||||||||||
| 28 | Memphis, TN-MS-AR | 45 | 1 | 649,252 | 95.5 | % | 95.5 | % | 9,838 | 16.71 | 0.3 | % | 1.0 | % | 1.0 | % | ||||||||||||||||||||||||||||||||||||||||||||||||||||||||||
| 29 | Cleveland-Elyria, OH | 35 | 3 | 803,543 | 89.9 | % | 92.5 | % | 9,738 | 13.19 | 0.8 | % | 1.3 | % | 1.0 | % | ||||||||||||||||||||||||||||||||||||||||||||||||||||||||||
| 30 | Jacksonville, FL | 39 | 3 | 693,762 | 96.2 | % | 96.6 | % | 8,312 | 12.95 | 0.8 | % | 1.1 | % | 0.8 | % | ||||||||||||||||||||||||||||||||||||||||||||||||||||||||||
| 31 | Indianapolis-Carmel-Anderson, IN | 33 | 2 | 715,057 | 92.2 | % | 93.6 | % | 8,188 | 12.42 | 0.6 | % | 1.1 | % | 0.8 | % | ||||||||||||||||||||||||||||||||||||||||||||||||||||||||||
| 32 | Louisville/Jefferson County, KY-IN | 46 | 4 | 699,917 | 87.6 | % | 93.6 | % | 7,774 | 12.20 | 1.1 | % | 1.1 | % | 0.8 | % | ||||||||||||||||||||||||||||||||||||||||||||||||||||||||||
| 33 | Hartford-East Hartford-Middletown, CT | 49 | 3 | 570,969 | 86.4 | % | 87.2 | % | 7,484 | 15.55 | 0.8 | % | 0.9 | % | 0.8 | % | ||||||||||||||||||||||||||||||||||||||||||||||||||||||||||
| 34 | Worcester, MA-CT | 58 | 3 | 513,394 | 88.1 | % | 97.4 | % | 6,936 | 16.54 | 0.8 | % | 0.8 | % | 0.7 | % | ||||||||||||||||||||||||||||||||||||||||||||||||||||||||||
| 35 | Scranton--Wilkes-Barre, PA | 103 | 2 | 618,795 | 99.5 | % | 99.5 | % | 6,553 | 24.16 | 0.6 | % | 1.0 | % | 0.7 | % | ||||||||||||||||||||||||||||||||||||||||||||||||||||||||||
| 36 | Milwaukee-Waukesha, WI | 41 | 3 | 520,125 | 93.1 | % | 98.5 | % | 6,512 | 12.71 | 0.8 | % | 0.8 | % | 0.7 | % | ||||||||||||||||||||||||||||||||||||||||||||||||||||||||||
| 37 | New Haven-Milford, CT | 71 | 4 | 486,863 | 87.8 | % | 94.3 | % | 6,295 | 13.70 | 1.1 | % | 0.8 | % | 0.6 | % | ||||||||||||||||||||||||||||||||||||||||||||||||||||||||||
| 38 | Wilmington, NC | 168 | 2 | 379,107 | 98.0 | % | 100.0 | % | 6,289 | 16.76 | 0.6 | % | 0.6 | % | 0.6 | % | ||||||||||||||||||||||||||||||||||||||||||||||||||||||||||
| 39 | Greensboro-High Point, NC | 80 | 1 | 407,244 | 100.0 | % | 100.0 | % | 6,051 | 14.86 | 0.3 | % | 0.6 | % | 0.6 | % | ||||||||||||||||||||||||||||||||||||||||||||||||||||||||||
| 40 | College Station-Bryan, TX | 180 | 3 | 433,728 | 94.6 | % | 95.3 | % | 6,031 | 17.56 | 0.8 | % | 0.7 | % | 0.6 | % | ||||||||||||||||||||||||||||||||||||||||||||||||||||||||||
| 41 | Oxnard-Thousand Oaks-Ventura, CA | 74 | 2 | 319,844 | 84.2 | % | 96.6 | % | 5,928 | 19.88 | 0.6 | % | 0.5 | % | 0.6 | % | ||||||||||||||||||||||||||||||||||||||||||||||||||||||||||
| 42 | Poughkeepsie-Newburgh-Middletown, NY | 87 | 3 | 399,379 | 97.2 | % | 98.7 | % | 5,724 | 14.76 | 0.8 | % | 0.6 | % | 0.6 | % | ||||||||||||||||||||||||||||||||||||||||||||||||||||||||||
| 43 | Washington-Arlington-Alexandria, DC-VA-MD-WV | 6 | 2 | 412,533 | 92.2 | % | 92.2 | % | 5,468 | 14.82 | 0.6 | % | 0.6 | % | 0.6 | % | ||||||||||||||||||||||||||||||||||||||||||||||||||||||||||
| 44 | Spartanburg, SC | 153 | 1 | 376,980 | 94.1 | % | 94.1 | % | 4,927 | 14.22 | 0.3 | % | 0.6 | % | 0.5 | % | ||||||||||||||||||||||||||||||||||||||||||||||||||||||||||
| 45 | Manchester-Nashua, NH | 132 | 2 | 234,324 | 80.7 | % | 99.5 | % | 4,862 | 22.42 | 0.6 | % | 0.4 | % | 0.5 | % | ||||||||||||||||||||||||||||||||||||||||||||||||||||||||||
| 46 | Cape Coral-Fort Myers, FL | 75 | 1 | 281,822 | 83.6 | % | 98.9 | % | 4,858 | 17.88 | 0.3 | % | 0.4 | % | 0.5 | % | ||||||||||||||||||||||||||||||||||||||||||||||||||||||||||
| 47 | Boulder, CO | 161 | 1 | 275,919 | 85.5 | % | 95.6 | % | 4,613 | 17.49 | 0.3 | % | 0.4 | % | 0.5 | % | ||||||||||||||||||||||||||||||||||||||||||||||||||||||||||
| 48 | Raleigh-Cary, NC | 42 | 2 | 286,697 | 98.8 | % | 99.5 | % | 4,560 | 16.11 | 0.6 | % | 0.4 | % | 0.5 | % | ||||||||||||||||||||||||||||||||||||||||||||||||||||||||||
| 49 | Panama City, FL | 236 | 2 | 403,492 | 96.2 | % | 99.7 | % | 4,537 | 11.45 | 0.6 | % | 0.6 | % | 0.5 | % | ||||||||||||||||||||||||||||||||||||||||||||||||||||||||||
| 50 | Norwich-New London, CT | 186 | 1 | 243,511 | 91.7 | % | 93.4 | % | 4,438 | 19.96 | 0.3 | % | 0.4 | % | 0.4 | % | ||||||||||||||||||||||||||||||||||||||||||||||||||||||||||
| 50 Largest CBSAs by ABR | — | 294 | 53,220,444 | 91.4 | % | 95.6 | % | 855,447 | 17.88 | 80.4 | % | 83.4 | % | 86.5 | % | |||||||||||||||||||||||||||||||||||||||||||||||||||||||||||
| 51 | Charleston-North Charleston, SC | 73 | 2 | 499,441 | 70.9 | % | 82.2 | % | 4,401 | 10.87 | 0.6 | % | 0.8 | % | 0.4 | % | ||||||||||||||||||||||||||||||||||||||||||||||||||||||||||
| 52 | Kansas City, MO-KS | 31 | 3 | 448,226 | 92.7 | % | 93.8 | % | 4,318 | 10.27 | 0.8 | % | 0.7 | % | 0.4 | % | ||||||||||||||||||||||||||||||||||||||||||||||||||||||||||
| 53 | Greenville-Anderson, SC | 60 | 2 | 220,723 | 98.3 | % | 98.9 | % | 4,255 | 19.97 | 0.6 | % | 0.3 | % | 0.4 | % | ||||||||||||||||||||||||||||||||||||||||||||||||||||||||||
| 54 | Mobile, AL | 130 | 1 | 410,401 | 85.1 | % | 85.1 | % | 4,134 | 12.13 | 0.3 | % | 0.6 | % | 0.4 | % | ||||||||||||||||||||||||||||||||||||||||||||||||||||||||||
| 55 | Dayton-Kettering, OH | 77 | 1 | 333,998 | 84.4 | % | 85.8 | % | 4,107 | 14.72 | 0.3 | % | 0.5 | % | 0.4 | % | ||||||||||||||||||||||||||||||||||||||||||||||||||||||||||
| 56 | Winston-Salem, NC | 90 | 2 | 351,938 | 83.8 | % | 88.0 | % | 3,823 | 12.87 | 0.6 | % | 0.6 | % | 0.4 | % | ||||||||||||||||||||||||||||||||||||||||||||||||||||||||||
| 57 | Bakersfield, CA | 63 | 1 | 240,068 | 95.3 | % | 95.3 | % | 3,761 | 16.76 | 0.3 | % | 0.4 | % | 0.4 | % | ||||||||||||||||||||||||||||||||||||||||||||||||||||||||||
| 58 | Greenville, NC | 257 | 1 | 233,153 | 90.0 | % | 100.0 | % | 3,626 | 15.55 | 0.3 | % | 0.4 | % | 0.4 | % | ||||||||||||||||||||||||||||||||||||||||||||||||||||||||||
| 59 | Atlantic City-Hammonton, NJ | 182 | 1 | 179,183 | 97.3 | % | 97.3 | % | 3,561 | 20.42 | 0.3 | % | 0.3 | % | 0.4 | % | ||||||||||||||||||||||||||||||||||||||||||||||||||||||||||
| 60 | Springfield, MA | 91 | 2 | 321,353 | 90.0 | % | 97.0 | % | 3,534 | 15.34 | 0.6 | % | 0.5 | % | 0.4 | % | ||||||||||||||||||||||||||||||||||||||||||||||||||||||||||
| 61 | Hilton Head Island-Bluffton, SC | 202 | 2 | 231,952 | 79.1 | % | 79.1 | % | 3,487 | 19.01 | 0.6 | % | 0.4 | % | 0.4 | % | ||||||||||||||||||||||||||||||||||||||||||||||||||||||||||
| 62 | Virginia Beach-Norfolk-Newport News, VA-NC | 38 | 1 | 150,014 | 99.8 | % | 99.8 | % | 3,354 | 22.63 | 0.3 | % | 0.2 | % | 0.3 | % | ||||||||||||||||||||||||||||||||||||||||||||||||||||||||||
| 63 | Fresno, CA | 56 | 1 | 215,166 | 97.3 | % | 97.3 | % | 3,315 | 15.83 | 0.3 | % | 0.3 | % | 0.3 | % | ||||||||||||||||||||||||||||||||||||||||||||||||||||||||||
| 64 | Sacramento-Roseville-Folsom, CA | 27 | 1 | 83,413 | 15.6 | % | 100.0 | % | 3,082 | 36.95 | 0.3 | % | 0.1 | % | 0.3 | % | ||||||||||||||||||||||||||||||||||||||||||||||||||||||||||
| 65 | Pittsfield, MA | 331 | 1 | 188,444 | 99.1 | % | 99.1 | % | 2,986 | 15.99 | 0.3 | % | 0.3 | % | 0.3 | % | ||||||||||||||||||||||||||||||||||||||||||||||||||||||||||
| Supplemental Disclosure - Three Months Ended June 30, 2024 | Page 33 |
|
||||||
| MAJOR CBSA DETAIL | ||||||||||||||||||||||||||||||||||||||||||||||||||||||||||||||||||||||||||
Dollars in thousands, except per square foot amounts |
||||||||||||||||||||||||||||||||||||||||||||||||||||||||||||||||||||||||||
| BRIXMOR LARGEST CBSAs BY ABR | ||||||||||||||||||||||||||||||||||||||||||||||||||||||||||||||||||||||||||
Percent of |
||||||||||||||||||||||||||||||||||||||||||||||||||||||||||||||||||||||||||
| CBSA | Number of |
Percent |
Percent |
Number of |
Percent |
Percent |
||||||||||||||||||||||||||||||||||||||||||||||||||||||||||||||||||||
| Largest CBSAs by ABR | Rank | Properties |
GLA |
Billed |
Leased |
ABR |
ABR PSF |
Properties |
of GLA |
of ABR |
||||||||||||||||||||||||||||||||||||||||||||||||||||||||||||||||
| 66 | Columbus, OH | 32 | 2 | 277,000 | 89.6 | % | 93.0 | % | 2,977 | 11.95 | 0.6 | % | 0.4 | % | 0.3 | % | ||||||||||||||||||||||||||||||||||||||||||||||||||||||||||
| 67 | Savannah, GA | 133 | 2 | 214,679 | 96.4 | % | 97.9 | % | 2,971 | 14.14 | 0.6 | % | 0.3 | % | 0.3 | % | ||||||||||||||||||||||||||||||||||||||||||||||||||||||||||
| 68 | Roanoke, VA | 164 | 2 | 311,149 | 97.8 | % | 100.0 | % | 2,933 | 11.63 | 0.6 | % | 0.5 | % | 0.3 | % | ||||||||||||||||||||||||||||||||||||||||||||||||||||||||||
| 69 | Elkhart-Goshen, IN | 226 | 1 | 214,067 | 98.0 | % | 98.0 | % | 2,789 | 13.30 | 0.3 | % | 0.3 | % | 0.3 | % | ||||||||||||||||||||||||||||||||||||||||||||||||||||||||||
| 70 | Concord, NH | 286 | 1 | 196,542 | 100.0 | % | 100.0 | % | 2,731 | 14.66 | 0.3 | % | 0.3 | % | 0.3 | % | ||||||||||||||||||||||||||||||||||||||||||||||||||||||||||
| 71 | Bridgeport-Stamford-Norwalk, CT | 61 | 1 | 161,075 | 95.5 | % | 95.5 | % | 2,615 | 17.01 | 0.3 | % | 0.3 | % | 0.3 | % | ||||||||||||||||||||||||||||||||||||||||||||||||||||||||||
| 72 | Duluth, MN-WI | 174 | 1 | 183,105 | 90.8 | % | 95.8 | % | 2,495 | 14.23 | 0.3 | % | 0.3 | % | 0.3 | % | ||||||||||||||||||||||||||||||||||||||||||||||||||||||||||
| 73 | Santa Maria-Santa Barbara, CA | 124 | 1 | 166,696 | 100.0 | % | 100.0 | % | 2,478 | 14.87 | 0.3 | % | 0.3 | % | 0.3 | % | ||||||||||||||||||||||||||||||||||||||||||||||||||||||||||
| 74 | Richmond, VA | 44 | 1 | 141,233 | 96.8 | % | 99.2 | % | 2,423 | 17.30 | 0.3 | % | 0.2 | % | 0.2 | % | ||||||||||||||||||||||||||||||||||||||||||||||||||||||||||
| 75 | Greeneville, TN | 483 | 1 | 224,139 | 99.3 | % | 100.0 | % | 2,260 | 10.20 | 0.3 | % | 0.4 | % | 0.2 | % | ||||||||||||||||||||||||||||||||||||||||||||||||||||||||||
| 76 | Flint, MI | 137 | 1 | 164,632 | 100.0 | % | 100.0 | % | 2,253 | 13.78 | 0.3 | % | 0.3 | % | 0.2 | % | ||||||||||||||||||||||||||||||||||||||||||||||||||||||||||
| 77 | Rutland, VT | 539 | 1 | 223,314 | 98.6 | % | 98.6 | % | 2,253 | 10.24 | 0.3 | % | 0.4 | % | 0.2 | % | ||||||||||||||||||||||||||||||||||||||||||||||||||||||||||
| 78 | Trenton-Princeton, NJ | 146 | 1 | 149,993 | 97.3 | % | 100.0 | % | 2,215 | 14.77 | 0.3 | % | 0.2 | % | 0.2 | % | ||||||||||||||||||||||||||||||||||||||||||||||||||||||||||
| 79 | Tucson, AZ | 54 | 1 | 165,350 | 79.3 | % | 100.0 | % | 2,209 | 13.36 | 0.3 | % | 0.3 | % | 0.2 | % | ||||||||||||||||||||||||||||||||||||||||||||||||||||||||||
| 80 | Manhattan, KS | 323 | 1 | 214,898 | 94.9 | % | 98.2 | % | 2,203 | 16.90 | 0.3 | % | 0.3 | % | 0.2 | % | ||||||||||||||||||||||||||||||||||||||||||||||||||||||||||
| 81 | Austin-Round Rock-Georgetown, TX | 26 | 1 | 170,605 | 95.4 | % | 96.1 | % | 2,187 | 13.33 | 0.3 | % | 0.3 | % | 0.2 | % | ||||||||||||||||||||||||||||||||||||||||||||||||||||||||||
| 82 | Portland-South Portland, ME | 104 | 1 | 287,533 | 100.0 | % | 100.0 | % | 2,143 | 17.99 | 0.3 | % | 0.5 | % | 0.2 | % | ||||||||||||||||||||||||||||||||||||||||||||||||||||||||||
| 83 | Columbus, IN | 440 | 1 | 143,740 | 100.0 | % | 100.0 | % | 2,125 | 14.78 | 0.3 | % | 0.2 | % | 0.2 | % | ||||||||||||||||||||||||||||||||||||||||||||||||||||||||||
| 84 | Crestview-Fort Walton Beach-Destin, FL | 170 | 1 | 158,118 | 99.1 | % | 100.0 | % | 2,042 | 12.91 | 0.3 | % | 0.2 | % | 0.2 | % | ||||||||||||||||||||||||||||||||||||||||||||||||||||||||||
| 85 | St. Louis, MO-IL | 21 | 2 | 208,998 | 84.4 | % | 84.4 | % | 1,989 | 11.48 | 0.6 | % | 0.3 | % | 0.2 | % | ||||||||||||||||||||||||||||||||||||||||||||||||||||||||||
| 86 | Ithaca, NY | 380 | 1 | 204,405 | 92.5 | % | 92.5 | % | 1,970 | 10.41 | 0.3 | % | 0.3 | % | 0.2 | % | ||||||||||||||||||||||||||||||||||||||||||||||||||||||||||
| 87 | Deltona-Daytona Beach-Ormond Beach, FL | 86 | 1 | 184,379 | 98.7 | % | 100.0 | % | 1,934 | 10.49 | 0.3 | % | 0.3 | % | 0.2 | % | ||||||||||||||||||||||||||||||||||||||||||||||||||||||||||
| 88 | Palm Bay-Melbourne-Titusville, FL | 96 | 1 | 131,243 | 93.1 | % | 96.8 | % | 1,928 | 15.17 | 0.3 | % | 0.2 | % | 0.2 | % | ||||||||||||||||||||||||||||||||||||||||||||||||||||||||||
| 89 | Toledo, OH | 95 | 1 | 298,765 | 79.0 | % | 82.9 | % | 1,869 | 13.21 | 0.3 | % | 0.5 | % | 0.2 | % | ||||||||||||||||||||||||||||||||||||||||||||||||||||||||||
| 90 | California-Lexington Park, MD | 360 | 1 | 92,335 | 100.0 | % | 100.0 | % | 1,862 | 20.17 | 0.3 | % | 0.1 | % | 0.2 | % | ||||||||||||||||||||||||||||||||||||||||||||||||||||||||||
| 91 | Georgetown, SC | 510 | 1 | 120,095 | 86.4 | % | 98.8 | % | 1,810 | 15.26 | 0.3 | % | 0.2 | % | 0.2 | % | ||||||||||||||||||||||||||||||||||||||||||||||||||||||||||
| 92 | Ocean City, NJ | 409 | 1 | 136,351 | 98.2 | % | 98.2 | % | 1,806 | 13.48 | 0.3 | % | 0.2 | % | 0.2 | % | ||||||||||||||||||||||||||||||||||||||||||||||||||||||||||
| 93 | Lansing-East Lansing, MI | 108 | 1 | 160,946 | 100.0 | % | 100.0 | % | 1,711 | 10.63 | 0.3 | % | 0.3 | % | 0.2 | % | ||||||||||||||||||||||||||||||||||||||||||||||||||||||||||
| 94 | London, KY | 295 | 1 | 166,026 | 100.0 | % | 100.0 | % | 1,622 | 9.77 | 0.3 | % | 0.3 | % | 0.2 | % | ||||||||||||||||||||||||||||||||||||||||||||||||||||||||||
| 95 | Durham-Chapel Hill, NC | 92 | 1 | 97,226 | 96.3 | % | 97.8 | % | 1,591 | 16.73 | 0.3 | % | 0.2 | % | 0.2 | % | ||||||||||||||||||||||||||||||||||||||||||||||||||||||||||
| 96 | Muskegon, MI | 256 | 1 | 104,600 | 96.2 | % | 96.2 | % | 1,546 | 15.37 | 0.3 | % | 0.2 | % | 0.2 | % | ||||||||||||||||||||||||||||||||||||||||||||||||||||||||||
| 97 | Lafayette-West Lafayette, IN | 208 | 1 | 132,027 | 98.9 | % | 100.0 | % | 1,496 | 11.33 | 0.3 | % | 0.2 | % | 0.2 | % | ||||||||||||||||||||||||||||||||||||||||||||||||||||||||||
| 98 | Corpus Christi, TX | 135 | 1 | 84,667 | 72.0 | % | 87.6 | % | 1,265 | 17.06 | 0.3 | % | 0.1 | % | 0.1 | % | ||||||||||||||||||||||||||||||||||||||||||||||||||||||||||
| 99 | Modesto, CA | 106 | 1 | 86,689 | 100.0 | % | 100.0 | % | 1,231 | 14.62 | 0.3 | % | 0.1 | % | 0.1 | % | ||||||||||||||||||||||||||||||||||||||||||||||||||||||||||
| 100 | Knoxville, TN | 64 | 1 | 119,360 | 100.0 | % | 100.0 | % | 1,020 | 8.55 | 0.3 | % | 0.2 | % | 0.1 | % | ||||||||||||||||||||||||||||||||||||||||||||||||||||||||||
| 100 Largest CBSAs by ABR | — | 355 | 63,423,897 | 91.4 | % | 95.4 | % | 984,143 | 17.28 | 98.6 | % | 99.5 | % | 99.6 | % | |||||||||||||||||||||||||||||||||||||||||||||||||||||||||||
| Other CBSAs | — | 5 | 327,081 | 85.1 | % | 85.6 | % | 3,538 | 12.87 | 1.4 | % | 0.5 | % | 0.4 | % | |||||||||||||||||||||||||||||||||||||||||||||||||||||||||||
TOTAL |
— | 360 | 63,750,978 | 91.4 | % | 95.4 | % | $ | 987,681 | $ | 17.26 | 100.0 | % | 100.0 | % | 100.0 | % | |||||||||||||||||||||||||||||||||||||||||||||||||||||||||
| Supplemental Disclosure - Three Months Ended June 30, 2024 | Page 34 |
|
||||||
| PROPERTIES BY STATE | |||||||||||||||||||||||||||||||||||||||||||||||||||||||||||||||||
| Dollars in thousands, except per square foot amounts | |||||||||||||||||||||||||||||||||||||||||||||||||||||||||||||||||
| Percent of | |||||||||||||||||||||||||||||||||||||||||||||||||||||||||||||||||
| Number of | Percent | Percent | Number of | Percent | Percent | ||||||||||||||||||||||||||||||||||||||||||||||||||||||||||||
| State | Properties | GLA | Billed | Leased | ABR | ABR PSF | Properties | of GLA | of ABR | ||||||||||||||||||||||||||||||||||||||||||||||||||||||||
| 1 | Florida | 48 | 8,096,805 | 92.1 | % | 97.7 | % | $ | 137,544 | $ | 17.75 | 13.3 | % | 12.7 | % | 13.9 | % | ||||||||||||||||||||||||||||||||||||||||||||||||
| 2 | Texas | 48 | 7,409,417 | 90.0 | % | 95.2 | % | 117,110 | 17.37 | 13.3 | % | 11.6 | % | 11.9 | % | ||||||||||||||||||||||||||||||||||||||||||||||||||
| 3 | California | 28 | 5,195,926 | 92.2 | % | 97.9 | % | 115,257 | 24.23 | 7.8 | % | 8.1 | % | 11.7 | % | ||||||||||||||||||||||||||||||||||||||||||||||||||
| 4 | New York | 27 | 3,440,285 | 94.6 | % | 96.4 | % | 70,863 | 21.73 | 7.5 | % | 5.3 | % | 7.2 | % | ||||||||||||||||||||||||||||||||||||||||||||||||||
| 5 | Pennsylvania | 24 | 4,329,497 | 91.1 | % | 96.0 | % | 70,325 | 20.76 | 6.7 | % | 6.8 | % | 7.1 | % | ||||||||||||||||||||||||||||||||||||||||||||||||||
| 6 | Illinois | 16 | 4,054,692 | 84.7 | % | 89.4 | % | 55,735 | 15.77 | 4.4 | % | 6.4 | % | 5.6 | % | ||||||||||||||||||||||||||||||||||||||||||||||||||
| 7 | Georgia | 26 | 3,598,171 | 93.8 | % | 96.0 | % | 47,965 | 14.38 | 7.2 | % | 5.6 | % | 4.9 | % | ||||||||||||||||||||||||||||||||||||||||||||||||||
| 8 | New Jersey | 16 | 2,821,855 | 93.0 | % | 94.9 | % | 47,505 | 18.82 | 4.4 | % | 4.4 | % | 4.8 | % | ||||||||||||||||||||||||||||||||||||||||||||||||||
| 9 | North Carolina | 13 | 3,056,642 | 95.2 | % | 97.1 | % | 41,163 | 14.63 | 3.6 | % | 4.8 | % | 4.2 | % | ||||||||||||||||||||||||||||||||||||||||||||||||||
| 10 | Michigan | 14 | 2,704,191 | 92.2 | % | 97.3 | % | 36,982 | 14.72 | 3.9 | % | 4.2 | % | 3.7 | % | ||||||||||||||||||||||||||||||||||||||||||||||||||
| 11 | Ohio | 13 | 2,893,757 | 90.6 | % | 92.3 | % | 35,864 | 15.62 | 3.6 | % | 4.5 | % | 3.6 | % | ||||||||||||||||||||||||||||||||||||||||||||||||||
| 12 | Tennessee | 7 | 1,790,636 | 96.8 | % | 97.1 | % | 23,711 | 13.94 | 1.9 | % | 2.8 | % | 2.4 | % | ||||||||||||||||||||||||||||||||||||||||||||||||||
| 13 | Colorado | 7 | 1,589,305 | 91.3 | % | 96.1 | % | 23,663 | 16.44 | 1.9 | % | 2.5 | % | 2.4 | % | ||||||||||||||||||||||||||||||||||||||||||||||||||
| 14 | Massachusetts | 10 | 1,504,179 | 91.8 | % | 97.2 | % | 21,675 | 16.68 | 2.8 | % | 2.4 | % | 2.2 | % | ||||||||||||||||||||||||||||||||||||||||||||||||||
| 15 | Connecticut | 9 | 1,462,418 | 88.8 | % | 91.5 | % | 20,832 | 15.82 | 2.5 | % | 2.3 | % | 2.1 | % | ||||||||||||||||||||||||||||||||||||||||||||||||||
| 16 | South Carolina | 8 | 1,449,191 | 83.7 | % | 88.7 | % | 18,880 | 14.91 | 2.2 | % | 2.3 | % | 1.9 | % | ||||||||||||||||||||||||||||||||||||||||||||||||||
| 17 | Kentucky | 6 | 1,545,582 | 93.7 | % | 96.4 | % | 18,297 | 13.74 | 1.7 | % | 2.4 | % | 1.9 | % | ||||||||||||||||||||||||||||||||||||||||||||||||||
| 18 | Minnesota | 9 | 1,269,831 | 82.1 | % | 90.2 | % | 17,246 | 16.46 | 2.5 | % | 2.0 | % | 1.7 | % | ||||||||||||||||||||||||||||||||||||||||||||||||||
| 19 | Indiana | 5 | 1,204,891 | 94.9 | % | 95.8 | % | 14,598 | 12.75 | 1.4 | % | 1.9 | % | 1.5 | % | ||||||||||||||||||||||||||||||||||||||||||||||||||
| 20 | New Hampshire | 5 | 672,254 | 91.4 | % | 97.9 | % | 10,040 | 15.89 | 1.4 | % | 1.1 | % | 1.0 | % | ||||||||||||||||||||||||||||||||||||||||||||||||||
| 21 | Virginia | 5 | 735,278 | 94.6 | % | 96.0 | % | 9,746 | 15.09 | 1.4 | % | 1.2 | % | 1.0 | % | ||||||||||||||||||||||||||||||||||||||||||||||||||
| 22 | Wisconsin | 3 | 520,125 | 93.1 | % | 98.5 | % | 6,512 | 12.71 | 0.8 | % | 0.8 | % | 0.7 | % | ||||||||||||||||||||||||||||||||||||||||||||||||||
| 23 | Maryland | 2 | 371,986 | 98.8 | % | 98.8 | % | 6,294 | 17.68 | 0.6 | % | 0.6 | % | 0.6 | % | ||||||||||||||||||||||||||||||||||||||||||||||||||
| 24 | Missouri | 4 | 495,523 | 90.6 | % | 91.6 | % | 4,800 | 10.65 | 1.1 | % | 0.8 | % | 0.5 | % | ||||||||||||||||||||||||||||||||||||||||||||||||||
| 25 | Alabama | 1 | 410,401 | 85.1 | % | 85.1 | % | 4,134 | 12.13 | 0.3 | % | 0.6 | % | 0.4 | % | ||||||||||||||||||||||||||||||||||||||||||||||||||
| 26 | Kansas | 2 | 376,599 | 92.2 | % | 94.0 | % | 3,710 | 13.56 | 0.6 | % | 0.6 | % | 0.4 | % | ||||||||||||||||||||||||||||||||||||||||||||||||||
| 27 | Vermont | 1 | 223,314 | 98.6 | % | 98.6 | % | 2,253 | 10.24 | 0.3 | % | 0.4 | % | 0.2 | % | ||||||||||||||||||||||||||||||||||||||||||||||||||
| 28 | Arizona | 1 | 165,350 | 79.3 | % | 100.0 | % | 2,209 | 13.36 | 0.3 | % | 0.3 | % | 0.2 | % | ||||||||||||||||||||||||||||||||||||||||||||||||||
| 29 | Maine | 1 | 287,533 | 100.0 | % | 100.0 | % | 2,143 | 17.99 | 0.3 | % | 0.5 | % | 0.2 | % | ||||||||||||||||||||||||||||||||||||||||||||||||||
| 30 | West Virginia | 1 | 75,344 | 54.1 | % | 54.1 | % | 625 | 15.33 | 0.3 | % | 0.1 | % | 0.1 | % | ||||||||||||||||||||||||||||||||||||||||||||||||||
| TOTAL | 360 | 63,750,978 | 91.4 | % | 95.4 | % | $ | 987,681 | $ | 17.26 | 100.0 | % | 100.0 | % | 100.0 | % | |||||||||||||||||||||||||||||||||||||||||||||||||
| Supplemental Disclosure - Three Months Ended June 30, 2024 | Page 35 |
|
||||||
PROPERTY LIST |
||||||||||||||||||||||||||||||||||||||||||||||||||||||||||||||||||||||||||
Dollars in thousands, except per square foot amounts |
||||||||||||||||||||||||||||||||||||||||||||||||||||||||||||||||||||||||||
Year |
Percent |
Non-Owned |
||||||||||||||||||||||||||||||||||||||||||||||||||||||||||||||||||||||||
Property Name |
City |
State |
Core-Based Statistical Area | Built |
GLA |
Leased |
ABR |
ABR PSF |
Grocer (1) (4) | Other Major Tenants (4) | Major Tenants |
|||||||||||||||||||||||||||||||||||||||||||||||||||||||||||||||
| 1 | Springdale | Mobile | AL | Mobile, AL | 2004 | 410,401 | 85.1 | % | $ | 4,134 | $ | 12.13 | Sam's Club* | bealls, Burlington Stores, Conn's Home Plus, Crunch Fitness, David's Bridal, Five Below, Fresenius Medical Care, Marshalls, Piccadilly, Shoe Station, Ulta, World Market | — | |||||||||||||||||||||||||||||||||||||||||||||||||||||||||||
| 2 | Northmall Centre | Tucson | AZ | Tucson, AZ | 1996 | 165,350 | 100.0 | % | 2,209 | 13.36 | Sam's Club* | Ace Pickleball Club, Big 5 Sporting Goods, CareMore, Defy-Tucson, Dollar Tree | — | |||||||||||||||||||||||||||||||||||||||||||||||||||||||||||||
| 3 | Bakersfield Plaza | Bakersfield | CA | Bakersfield, CA | 1970 | 240,068 | 95.3 | % | 3,761 | 16.76 | Lassens Natural Foods & Vitamins | AMC, Burlington Stores, Five Below, In Shape Fitness, Kids Empire, Ross Dress for Less | Hobby Lobby | |||||||||||||||||||||||||||||||||||||||||||||||||||||||||||||
| 4 | Brea Gateway | Brea | CA | Los Angeles-Long Beach-Anaheim, CA | 1994 | 181,819 | 100.0 | % | 5,155 | 28.75 | Ralphs (Kroger) | HomeGoods, Rite Aid, World Market | — | |||||||||||||||||||||||||||||||||||||||||||||||||||||||||||||
| 5 | Carmen Plaza | Camarillo | CA | Oxnard-Thousand Oaks-Ventura, CA | 2000 | 128,369 | 95.1 | % | 3,371 | 29.19 | TBA, Trader Joe's* | CVS, Harbor Freight Tools | — | |||||||||||||||||||||||||||||||||||||||||||||||||||||||||||||
| 6 | Plaza Rio Vista | Cathedral | CA | Riverside-San Bernardino-Ontario, CA | 2005 | 75,415 | 98.3 | % | 1,590 | 23.96 | Stater Bros. | — | — | |||||||||||||||||||||||||||||||||||||||||||||||||||||||||||||
| 7 | Cudahy Plaza | Cudahy | CA | Los Angeles-Long Beach-Anaheim, CA | 2021 | 123,200 | 100.0 | % | 3,010 | 24.43 | Sprouts Farmers Market | Burlington Stores, Chuze Fitness | — | |||||||||||||||||||||||||||||||||||||||||||||||||||||||||||||
| 8 | The Davis Collection (3) | Davis | CA | Sacramento-Roseville-Folsom, CA | 2024 | 83,413 | 100.0 | % | 3,082 | 36.95 | Trader Joe's | Nordstrom Rack, PetSmart, Ulta | — | |||||||||||||||||||||||||||||||||||||||||||||||||||||||||||||
| 9 | Felicita Plaza | Escondido | CA | San Diego-Chula Vista-Carlsbad, CA | 2001 | 98,594 | 100.0 | % | 1,787 | 18.12 | Vons (Albertsons) | Chuze Fitness | — | |||||||||||||||||||||||||||||||||||||||||||||||||||||||||||||
| 10 | Felicita Town Center | Escondido | CA | San Diego-Chula Vista-Carlsbad, CA | 1987 | 124,670 | 84.1 | % | 3,142 | 29.97 | Major Market, Trader Joe's | — | — | |||||||||||||||||||||||||||||||||||||||||||||||||||||||||||||
| 11 | Arbor - Broadway Faire (2) | Fresno | CA | Fresno, CA | 1995 | 215,166 | 97.3 | % | 3,315 | 15.83 | Smart & Final Extra! (Chedraui USA) | Boot Barn, PetSmart, The Home Depot | DICK's Sporting Goods | |||||||||||||||||||||||||||||||||||||||||||||||||||||||||||||
| 12 | Lompoc Center | Lompoc | CA | Santa Maria-Santa Barbara, CA | 1960 | 166,696 | 100.0 | % | 2,478 | 14.87 | ALDI | Boot Barn, Harbor Freight Tools, Marshalls, Michaels, Old Navy, Petco, Ulta | — | |||||||||||||||||||||||||||||||||||||||||||||||||||||||||||||
| 13 | Briggsmore Plaza | Modesto | CA | Modesto, CA | 1998 | 86,689 | 100.0 | % | 1,231 | 14.62 | Grocery Outlet | American Freight, dd's Discounts (Ross) | In Shape Fitness | |||||||||||||||||||||||||||||||||||||||||||||||||||||||||||||
| 14 | Montebello Plaza | Montebello | CA | Los Angeles-Long Beach-Anaheim, CA | 1974 | 284,331 | 97.6 | % | 6,389 | 23.20 | Albertsons | Best Buy, CVS, Kohl's, Optum Urgent Care, Ross Dress for Less | — | |||||||||||||||||||||||||||||||||||||||||||||||||||||||||||||
| 15 | California Oaks Center | Murrieta | CA | Riverside-San Bernardino-Ontario, CA | 1990 | 124,481 | 98.4 | % | 2,394 | 20.18 | Barons Market | Crunch Fitness, Dollar Tree | — | |||||||||||||||||||||||||||||||||||||||||||||||||||||||||||||
| 16 | Pacoima Center | Pacoima | CA | Los Angeles-Long Beach-Anaheim, CA | 1995 | 215,930 | 100.0 | % | 2,847 | 13.34 | Food 4 Less (Kroger) | AutoZone, Ross Dress for Less, Target | — | |||||||||||||||||||||||||||||||||||||||||||||||||||||||||||||
| 17 | Metro 580 | Pleasanton | CA | San Francisco-Oakland-Berkeley, CA | 1996 | 177,573 | 93.2 | % | 2,644 | 34.24 | — | Kohl's, Party City | Walmart | |||||||||||||||||||||||||||||||||||||||||||||||||||||||||||||
| 18 | Rose Pavilion | Pleasanton | CA | San Francisco-Oakland-Berkeley, CA | 2019 | 328,947 | 98.0 | % | 9,515 | 29.73 | 99 Ranch Market, Trader Joe's | CVS, Fitness 19, Macy's Home Store, Restoration Hardware, Total Wine & More | — | |||||||||||||||||||||||||||||||||||||||||||||||||||||||||||||
| 19 | Puente Hills Town Center (3) | Rowland Heights | CA | Los Angeles-Long Beach-Anaheim, CA | 2024 | 258,685 | 97.2 | % | 6,645 | 26.42 | ALDI | Dollar Tree, East West Bank, Goodwill, Marshalls, Planet Fitness | — | |||||||||||||||||||||||||||||||||||||||||||||||||||||||||||||
| 20 | Ocean View Plaza | San Clemente | CA | Los Angeles-Long Beach-Anaheim, CA | 1990 | 169,963 | 100.0 | % | 5,757 | 33.87 | Ralphs (Kroger), Trader Joe's | Crunch Fitness, CVS | — | |||||||||||||||||||||||||||||||||||||||||||||||||||||||||||||
| 21 | Plaza By The Sea | San Clemente | CA | Los Angeles-Long Beach-Anaheim, CA | 1976 | 48,697 | 100.0 | % | 1,422 | 29.20 | Stater Bros. | — | — | |||||||||||||||||||||||||||||||||||||||||||||||||||||||||||||
| 22 | Village at Mira Mesa | San Diego | CA | San Diego-Chula Vista-Carlsbad, CA | 2023 | 432,079 | 97.6 | % | 11,493 | 27.54 | Sprouts Farmers Market, Vons (Albertsons) | BevMo, Burlington Stores, CVS, Marshalls, Michaels, Petco | — | |||||||||||||||||||||||||||||||||||||||||||||||||||||||||||||
| 23 | San Dimas Plaza | San Dimas | CA | Los Angeles-Long Beach-Anaheim, CA | 1986 | 164,757 | 95.6 | % | 3,983 | 25.30 | Smart & Final Extra! (Chedraui USA) | Harbor Freight Tools, T.J.Maxx | Burlington, Big 5 Sporting Goods | |||||||||||||||||||||||||||||||||||||||||||||||||||||||||||||
| 24 | Bristol Plaza | Santa Ana | CA | Los Angeles-Long Beach-Anaheim, CA | 2003 | 111,403 | 100.0 | % | 3,892 | 35.65 | Trader Joe's | Petco, Rite Aid, Ross Dress for Less | — | |||||||||||||||||||||||||||||||||||||||||||||||||||||||||||||
| 25 | Gateway Plaza | Santa Fe Springs | CA | Los Angeles-Long Beach-Anaheim, CA | 2002 | 289,268 | 100.0 | % | 4,059 | 27.29 | El Super (Chedraui USA), Walmart Supercenter | Five Below, Ross Dress for Less | Target | |||||||||||||||||||||||||||||||||||||||||||||||||||||||||||||
| 26 | Santa Paula Center | Santa Paula | CA | Oxnard-Thousand Oaks-Ventura, CA | 1995 | 191,475 | 97.6 | % | 2,557 | 14.00 | Vons (Albertsons) | Ace Hardware, Big 5 Sporting Goods, Big Lots, CVS, Dollar Tree, Regency Theaters | — | |||||||||||||||||||||||||||||||||||||||||||||||||||||||||||||
| 27 | Vail Ranch Center (3) | Temecula | CA | Riverside-San Bernardino-Ontario, CA | 2024 | 201,682 | 98.6 | % | 4,214 | 28.41 | Stater Bros. | Burlington Stores, Dollar Tree, Five Below, Harbor Freight Tools, Kahoots | — | |||||||||||||||||||||||||||||||||||||||||||||||||||||||||||||
| 28 | Country Hills Shopping Center | Torrance | CA | Los Angeles-Long Beach-Anaheim, CA | 1977 | 53,200 | 100.0 | % | 1,282 | 24.10 | Ralphs (Kroger) | — | — | |||||||||||||||||||||||||||||||||||||||||||||||||||||||||||||
| 29 | Upland Town Square | Upland | CA | Riverside-San Bernardino-Ontario, CA | 1994 | 100,090 | 97.6 | % | 2,426 | 25.08 | Sprouts Farmers Market | — | — | |||||||||||||||||||||||||||||||||||||||||||||||||||||||||||||
| 30 | Gateway Plaza - Vallejo (2) | Vallejo | CA | Vallejo, CA | 2023 | 519,266 | 99.3 | % | 11,816 | 23.10 | Costco* | Boot Barn, Century Theatres, City Sports Club, DSW, Mancini's Sleepworld, Marshalls, Michaels, OfficeMax, Pep Boys, Petco, PetSmart, Ross Dress for Less, Sky Zone, Ulta | Target | |||||||||||||||||||||||||||||||||||||||||||||||||||||||||||||
| 31 | Arvada Plaza | Arvada | CO | Denver-Aurora-Lakewood, CO | 1994 | 95,236 | 100.0 | % | 832 | 8.74 | King Soopers (Kroger) | Arc | — | |||||||||||||||||||||||||||||||||||||||||||||||||||||||||||||
| 32 | Arapahoe Crossings | Aurora | CO | Denver-Aurora-Lakewood, CO | 1996 | 476,299 | 95.1 | % | 7,810 | 17.42 | King Soopers (Kroger) | 2nd & Charles, Ace Hardware, Activate, AMC, Big Lots, Boot Barn, Burlington Stores, Goldfish Swim School, Kohl's, Planet Fitness | — | |||||||||||||||||||||||||||||||||||||||||||||||||||||||||||||
| Supplemental Disclosure - Three Months Ended June 30, 2024 | Page 36 |
|
||||||
PROPERTY LIST |
||||||||||||||||||||||||||||||||||||||||||||||||||||||||||||||||||||||||||
Dollars in thousands, except per square foot amounts |
||||||||||||||||||||||||||||||||||||||||||||||||||||||||||||||||||||||||||
Year |
Percent |
Non-Owned |
||||||||||||||||||||||||||||||||||||||||||||||||||||||||||||||||||||||||
Property Name |
City |
State |
Core-Based Statistical Area | Built |
GLA |
Leased |
ABR |
ABR PSF |
Grocer (1) (4) | Other Major Tenants (4) | Major Tenants |
|||||||||||||||||||||||||||||||||||||||||||||||||||||||||||||||
| 33 | Aurora Plaza | Aurora | CO | Denver-Aurora-Lakewood, CO | 1996 | 178,013 | 100.0 | % | 2,266 | 13.18 | King Soopers (Kroger) | Chuze Fitness, iGen | — | |||||||||||||||||||||||||||||||||||||||||||||||||||||||||||||
| 34 | Villa Monaco | Denver | CO | Denver-Aurora-Lakewood, CO | 1978 | 121,101 | 98.9 | % | 2,131 | 17.80 | — | Chuze Fitness | — | |||||||||||||||||||||||||||||||||||||||||||||||||||||||||||||
| 35 | Centennial Shopping Center | Englewood | CO | Denver-Aurora-Lakewood, CO | 2013 | 113,830 | 100.0 | % | 1,408 | 38.56 | King Soopers (Kroger) | — | — | |||||||||||||||||||||||||||||||||||||||||||||||||||||||||||||
| 36 | Superior Marketplace | Superior | CO | Boulder, CO | 1997 | 275,919 | 95.6 | % | 4,613 | 17.49 | Whole Foods Market (Amazon), Costco*, SuperTarget* | Barnes & Noble, Chuck E. Cheese's, Goldfish Swim School, Michaels, PetSmart, Restoration Hardware Outlet, Stickley Furniture, T.J.Maxx, Ulta | — | |||||||||||||||||||||||||||||||||||||||||||||||||||||||||||||
| 37 | Westminster City Center (3) | Westminster | CO | Denver-Aurora-Lakewood, CO | 2024 | 328,907 | 92.3 | % | 4,603 | 15.16 | — | Barnes & Noble, David's Bridal, Dollar Tree, DSW, Golf Galaxy, JOANN, Party City, Petco, Ross Dress for Less, Sierra Trading Post, The Tile Shop, Ulta | — | |||||||||||||||||||||||||||||||||||||||||||||||||||||||||||||
| 38 | The Shoppes at Fox Run | Glastonbury | CT | Hartford-East Hartford-Middletown, CT | 1974 | 108,167 | 94.1 | % | 2,998 | 29.46 | Whole Foods Market (Amazon) | Petco | — | |||||||||||||||||||||||||||||||||||||||||||||||||||||||||||||
| 39 | Parkway Plaza | Hamden | CT | New Haven-Milford, CT | 2006 | 72,353 | 100.0 | % | 1,093 | 15.11 | PriceRite (Wakefern) | — | The Home Depot | |||||||||||||||||||||||||||||||||||||||||||||||||||||||||||||
| 40 | The Manchester Collection | Manchester | CT | Hartford-East Hartford-Middletown, CT | 2001 | 312,908 | 80.1 | % | 2,769 | 11.84 | Walmart Supercenter* | Advance Auto Parts, Crazy Hot Deals, DSW, Edge Fitness, Hobby Lobby, Namco, Savers, U.S Furniture | Best Buy, The Home Depot, Walmart | |||||||||||||||||||||||||||||||||||||||||||||||||||||||||||||
| 41 | Turnpike Plaza | Newington | CT | Hartford-East Hartford-Middletown, CT | 2004 | 149,894 | 97.1 | % | 1,717 | 11.79 | Price Chopper (Northeast Grocery) | — | — | |||||||||||||||||||||||||||||||||||||||||||||||||||||||||||||
| 42 | North Haven Crossing | North Haven | CT | New Haven-Milford, CT | 1993 | 102,787 | 100.0 | % | 1,881 | 18.30 | — | Barnes & Noble, Dollar Tree, HomeGoods, PetSmart | — | |||||||||||||||||||||||||||||||||||||||||||||||||||||||||||||
| 43 | Colonial Commons - Orange | Orange | CT | New Haven-Milford, CT | 1996 | 133,786 | 91.0 | % | 824 | 6.77 | — | — | — | |||||||||||||||||||||||||||||||||||||||||||||||||||||||||||||
| 44 | Stratford Square | Stratford | CT | Bridgeport-Stamford-Norwalk, CT | 1984 | 161,075 | 95.5 | % | 2,615 | 17.01 | — | Esporta Fitness, Five Below, Marshalls | — | |||||||||||||||||||||||||||||||||||||||||||||||||||||||||||||
| 45 | Waterbury Plaza | Waterbury | CT | New Haven-Milford, CT | 2000 | 177,937 | 91.3 | % | 2,497 | 15.37 | Super Stop & Shop (Ahold Delhaize) | Dollar Tree, Joey'z Shopping Spree | Target | |||||||||||||||||||||||||||||||||||||||||||||||||||||||||||||
| 46 | Waterford Commons | Waterford | CT | Norwich-New London, CT | 2004 | 243,511 | 93.4 | % | 4,438 | 19.96 | — | Books-A-Million, DICK'S Sporting Goods, DSW, Michaels, Party City, Tractor Supply Co., Ulta | Best Buy, Raymour & Flanigan | |||||||||||||||||||||||||||||||||||||||||||||||||||||||||||||
| 47 | Center of Bonita Springs | Bonita Springs | FL | Cape Coral-Fort Myers, FL | 2014 | 281,822 | 98.9 | % | 4,858 | 17.88 | Publix | bealls, Burlington Stores, Crunch Fitness, Kohl's, Naples Community Hospital, NewSouth Window Solutions | — | |||||||||||||||||||||||||||||||||||||||||||||||||||||||||||||
| 48 | Coastal Way - Coastal Landing (2) | Brooksville | FL | Tampa-St. Petersburg-Clearwater, FL | 2008 | 393,249 | 98.9 | % | 6,219 | 18.77 | BJ's Wholesale Club, Sprouts Farmers Market | Belk, HomeGoods, Marshalls, Michaels, Office Depot, Petco, Ulta | — | |||||||||||||||||||||||||||||||||||||||||||||||||||||||||||||
| 49 | Clearwater Mall | Clearwater | FL | Tampa-St. Petersburg-Clearwater, FL | 1973 | 300,929 | 100.0 | % | 8,006 | 26.60 | Costco*, SuperTarget* | Burlington Stores, Dollar Tree, Five Below, Golf Galaxy, Michaels, PetSmart, Ross Dress for Less, Ulta | Lowe's | |||||||||||||||||||||||||||||||||||||||||||||||||||||||||||||
| 50 | Coconut Creek Plaza | Coconut Creek | FL | Miami-Fort Lauderdale-Pompano Beach, FL | 2005 | 264,921 | 91.7 | % | 3,837 | 15.79 | Publix | Big Lots, Harvest Church, Off the Wall Trampoline, Planet Fitness | — | |||||||||||||||||||||||||||||||||||||||||||||||||||||||||||||
| 51 | Century Plaza Shopping Center | Deerfield Beach | FL | Miami-Fort Lauderdale-Pompano Beach, FL | 2006 | 90,483 | 90.7 | % | 2,105 | 25.66 | — | Broward County Library, CVS | — | |||||||||||||||||||||||||||||||||||||||||||||||||||||||||||||
| 52 | Northgate Shopping Center | DeLand | FL | Deltona-Daytona Beach-Ormond Beach, FL | 1993 | 184,379 | 100.0 | % | 1,934 | 10.49 | Publix | Big Lots, Planet Fitness, Tractor Supply Co. | — | |||||||||||||||||||||||||||||||||||||||||||||||||||||||||||||
| 53 | Sun Plaza | Fort Walton Beach | FL | Crestview-Fort Walton Beach-Destin, FL | 2004 | 158,118 | 100.0 | % | 2,042 | 12.91 | Publix, ALDI* | bealls, Books-A-Million, Office Depot, T.J.Maxx | — | |||||||||||||||||||||||||||||||||||||||||||||||||||||||||||||
| 54 | Normandy Square | Jacksonville | FL | Jacksonville, FL | 1996 | 89,822 | 100.0 | % | 933 | 10.69 | Winn-Dixie (ALDI) | Ace Hardware, Family Dollar | — | |||||||||||||||||||||||||||||||||||||||||||||||||||||||||||||
| 55 | Regency Park Shopping Center | Jacksonville | FL | Jacksonville, FL | 1985 | 329,740 | 95.8 | % | 3,082 | 10.48 | — | American Freight, bealls, Crunch Fitness, Dollar Tree, Ollie's Bargain Outlet, Surplus Warehouse | — | |||||||||||||||||||||||||||||||||||||||||||||||||||||||||||||
| 56 | Ventura Downs | Kissimmee | FL | Orlando-Kissimmee-Sanford, FL | 2018 | 98,191 | 100.0 | % | 2,133 | 21.72 | — | Esporta Fitness, La Familia Pawn & Jewelry | — | |||||||||||||||||||||||||||||||||||||||||||||||||||||||||||||
| 57 | Marketplace at Wycliffe | Lake Worth | FL | Miami-Fort Lauderdale-Pompano Beach, FL | 2002 | 135,820 | 100.0 | % | 2,870 | 21.49 | Walmart Neighborhood Market | Walgreens | — | |||||||||||||||||||||||||||||||||||||||||||||||||||||||||||||
| 58 | Venetian Isle Shopping Ctr | Lighthouse Point | FL | Miami-Fort Lauderdale-Pompano Beach, FL | 1992 | 184,416 | 94.4 | % | 2,037 | 11.88 | Publix | City Mattress, Dollar Tree, Staples | — | |||||||||||||||||||||||||||||||||||||||||||||||||||||||||||||
| 59 | Marco Town Center | Marco Island | FL | Naples-Marco Island, FL | 2023 | 109,545 | 98.0 | % | 3,117 | 29.05 | Publix | — | — | |||||||||||||||||||||||||||||||||||||||||||||||||||||||||||||
| 60 | Shops at Palm Lakes | Miami | FL | Miami-Fort Lauderdale-Pompano Beach, FL | 2023 | 231,536 | 100.0 | % | 5,278 | 24.91 | Fresco y Más | dd's Discounts (Ross), LA Fitness, Ross Dress for Less | — | |||||||||||||||||||||||||||||||||||||||||||||||||||||||||||||
| 61 | Freedom Square | Naples | FL | Naples-Marco Island, FL | 2021 | 193,242 | 99.5 | % | 2,787 | 14.50 | Publix | Burlington Stores, HomeGoods, Pet Supplies Plus, Planet Fitness | — | |||||||||||||||||||||||||||||||||||||||||||||||||||||||||||||
| 62 | Granada Shoppes | Naples | FL | Naples-Marco Island, FL | 2011 | 306,579 | 98.2 | % | 5,978 | 19.85 | Trader Joe's | Chuck E. Cheese's, Connors Steak and Seafood, Dollar Tree, Haverty's Furniture, Hobby Lobby, HomeSense, Marshalls | — | |||||||||||||||||||||||||||||||||||||||||||||||||||||||||||||
| 63 | Naples Plaza | Naples | FL | Naples-Marco Island, FL | 2013 | 201,795 | 100.0 | % | 4,211 | 21.23 | Publix | Marshalls, Office Depot, PGA TOUR Superstore, West Marine | — | |||||||||||||||||||||||||||||||||||||||||||||||||||||||||||||
| 64 | Park Shore Plaza | Naples | FL | Naples-Marco Island, FL | 2017 | 256,948 | 100.0 | % | 5,457 | 22.41 | The Fresh Market | Barnes & Noble, Burlington Stores, Dollar Tree, HomeGoods, Party City, Saks OFF Fifth | — | |||||||||||||||||||||||||||||||||||||||||||||||||||||||||||||
| 65 | Chelsea Place | New Port Richey | FL | Tampa-St. Petersburg-Clearwater, FL | 1992 | 81,144 | 96.7 | % | 1,117 | 14.24 | Publix | — | — | |||||||||||||||||||||||||||||||||||||||||||||||||||||||||||||
| 66 | Presidential Plaza West | North Lauderdale | FL | Miami-Fort Lauderdale-Pompano Beach, FL | 2006 | 88,441 | 98.2 | % | 1,141 | 13.14 | Sedano's | Family Dollar | — | |||||||||||||||||||||||||||||||||||||||||||||||||||||||||||||
| Supplemental Disclosure - Three Months Ended June 30, 2024 | Page 37 |
|
||||||
PROPERTY LIST |
||||||||||||||||||||||||||||||||||||||||||||||||||||||||||||||||||||||||||
Dollars in thousands, except per square foot amounts |
||||||||||||||||||||||||||||||||||||||||||||||||||||||||||||||||||||||||||
Year |
Percent |
Non-Owned |
||||||||||||||||||||||||||||||||||||||||||||||||||||||||||||||||||||||||
Property Name |
City |
State |
Core-Based Statistical Area | Built |
GLA |
Leased |
ABR |
ABR PSF |
Grocer (1) (4) | Other Major Tenants (4) | Major Tenants |
|||||||||||||||||||||||||||||||||||||||||||||||||||||||||||||||
| 67 | Colonial Marketplace | Orlando | FL | Orlando-Kissimmee-Sanford, FL | 1986 | 141,069 | 100.0 | % | 2,658 | 18.84 | — | LA Fitness | Target | |||||||||||||||||||||||||||||||||||||||||||||||||||||||||||||
| 68 | Conway Crossing | Orlando | FL | Orlando-Kissimmee-Sanford, FL | 2002 | 76,321 | 100.0 | % | 1,253 | 16.42 | Publix | — | — | |||||||||||||||||||||||||||||||||||||||||||||||||||||||||||||
| 69 | Hunter's Creek Plaza | Orlando | FL | Orlando-Kissimmee-Sanford, FL | 1998 | 74,583 | 100.0 | % | 1,406 | 19.34 | Seabra Foods | Office Depot | — | |||||||||||||||||||||||||||||||||||||||||||||||||||||||||||||
| 70 | Pointe Orlando (3) | Orlando | FL | Orlando-Kissimmee-Sanford, FL | 2024 | 413,887 | 95.0 | % | 12,490 | 31.76 | — | Activate, Capital Grille, Cuba Libre, Dick's Last Resort, Hampton Social, Improv & Fat Fish Blue, Maggiano's Little Italy, Main Event, Monkey Joe's, Regal Cinemas, Rodizio Grill, Sports & Social, Wonderworks | — | |||||||||||||||||||||||||||||||||||||||||||||||||||||||||||||
| 71 | Martin Downs Town Center | Palm City | FL | Port St. Lucie, FL | 1996 | 64,546 | 100.0 | % | 860 | 13.32 | Publix | — | — | |||||||||||||||||||||||||||||||||||||||||||||||||||||||||||||
| 72 | Martin Downs Village Center | Palm City | FL | Port St. Lucie, FL | 1987 | 167,145 | 91.0 | % | 3,444 | 23.63 | — | Goodwill, Walgreens | — | |||||||||||||||||||||||||||||||||||||||||||||||||||||||||||||
| 73 | 23rd Street Station | Panama City | FL | Panama City, FL | 1995 | 98,827 | 98.7 | % | 1,538 | 15.77 | Publix | — | — | |||||||||||||||||||||||||||||||||||||||||||||||||||||||||||||
| 74 | Panama City Square | Panama City | FL | Panama City, FL | 1989 | 304,665 | 100.0 | % | 2,999 | 10.04 | Walmart Supercenter | Big Lots, Harbor Freight Tools, HomeGoods, T.J.Maxx | — | |||||||||||||||||||||||||||||||||||||||||||||||||||||||||||||
| 75 | East Port Plaza (3) | Port St. Lucie | FL | Port St. Lucie, FL | 2024 | 214,489 | 98.3 | % | 3,311 | 15.71 | Publix | Fortis Institute, Goodwill, Urban Air Adventure Park, Walgreens | — | |||||||||||||||||||||||||||||||||||||||||||||||||||||||||||||
| 76 | Shoppes of Victoria Square | Port St. Lucie | FL | Port St. Lucie, FL | 1990 | 95,186 | 98.9 | % | 1,382 | 14.67 | Winn-Dixie (ALDI) | — | — | |||||||||||||||||||||||||||||||||||||||||||||||||||||||||||||
| 77 | Lake St. Charles | Riverview | FL | Tampa-St. Petersburg-Clearwater, FL | 1999 | 61,015 | 100.0 | % | 788 | 13.82 | Winn-Dixie (ALDI) | — | — | |||||||||||||||||||||||||||||||||||||||||||||||||||||||||||||
| 78 | Cobblestone Village | Royal Palm Beach | FL | Miami-Fort Lauderdale-Pompano Beach, FL | 2005 | 39,404 | 96.5 | % | 919 | 24.18 | SuperTarget* | — | — | |||||||||||||||||||||||||||||||||||||||||||||||||||||||||||||
| 79 | Beneva Village Shoppes | Sarasota | FL | North Port-Sarasota-Bradenton, FL | 2020 | 144,078 | 98.9 | % | 2,907 | 20.40 | Publix | Archwell Health, Harbor Freight Tools | — | |||||||||||||||||||||||||||||||||||||||||||||||||||||||||||||
| 80 | Sarasota Village | Sarasota | FL | North Port-Sarasota-Bradenton, FL | 1972 | 173,184 | 100.0 | % | 2,361 | 13.98 | Publix | Big Lots, Crunch Fitness, HomeGoods | — | |||||||||||||||||||||||||||||||||||||||||||||||||||||||||||||
| 81 | Atlantic Plaza | Satellite Beach | FL | Palm Bay-Melbourne-Titusville, FL | 2008 | 131,243 | 96.8 | % | 1,928 | 15.17 | Publix | Home Centric, Planet Fitness | — | |||||||||||||||||||||||||||||||||||||||||||||||||||||||||||||
| 82 | Seminole Plaza | Seminole | FL | Tampa-St. Petersburg-Clearwater, FL | 2020 | 156,718 | 100.0 | % | 2,219 | 14.16 | Sprouts Farmers Market | bealls, Burlington Stores, T.J.Maxx | — | |||||||||||||||||||||||||||||||||||||||||||||||||||||||||||||
| 83 | Cobblestone Village | St. Augustine | FL | Jacksonville, FL | 2003 | 274,200 | 96.4 | % | 4,297 | 16.50 | Publix | Bealls Florida, Burlington Stores, Michaels, Party City, Petco | — | |||||||||||||||||||||||||||||||||||||||||||||||||||||||||||||
| 84 | Dolphin Village | St. Pete Beach | FL | Tampa-St. Petersburg-Clearwater, FL | 1990 | 135,796 | 94.0 | % | 2,427 | 19.01 | Publix | CVS, Dollar Tree | — | |||||||||||||||||||||||||||||||||||||||||||||||||||||||||||||
| 85 | Rutland Plaza | St. Petersburg | FL | Tampa-St. Petersburg-Clearwater, FL | 2002 | 149,562 | 98.8 | % | 1,453 | 9.83 | Winn-Dixie (ALDI) | bealls, Big Lots | — | |||||||||||||||||||||||||||||||||||||||||||||||||||||||||||||
| 86 | Tyrone Gardens | St. Petersburg | FL | Tampa-St. Petersburg-Clearwater, FL | 2023 | 195,214 | 90.4 | % | 2,486 | 14.09 | Winn-Dixie (ALDI) | Big Lots, Chuck E. Cheese's, Crunch Fitness | — | |||||||||||||||||||||||||||||||||||||||||||||||||||||||||||||
| 87 | Downtown Publix | Stuart | FL | Port St. Lucie, FL | 2000 | 151,246 | 93.8 | % | 2,193 | 15.45 | Publix | Revive Health & Wellness | — | |||||||||||||||||||||||||||||||||||||||||||||||||||||||||||||
| 88 | Sunrise Town Center | Sunrise | FL | Miami-Fort Lauderdale-Pompano Beach, FL | 1989 | 110,109 | 92.4 | % | 1,052 | 10.34 | Patel Brothers | Dollar Tree | Walmart | |||||||||||||||||||||||||||||||||||||||||||||||||||||||||||||
| 89 | Carrollwood Center | Tampa | FL | Tampa-St. Petersburg-Clearwater, FL | 2002 | 92,678 | 97.5 | % | 1,850 | 20.46 | Publix | Phenix Salon Suites | — | |||||||||||||||||||||||||||||||||||||||||||||||||||||||||||||
| 90 | Ross Plaza | Tampa | FL | Tampa-St. Petersburg-Clearwater, FL | 1996 | 84,707 | 98.6 | % | 1,463 | 17.52 | — | Dollar Tree, Ross Dress for Less | — | |||||||||||||||||||||||||||||||||||||||||||||||||||||||||||||
| 91 | Tarpon Mall | Tarpon Springs | FL | Tampa-St. Petersburg-Clearwater, FL | 2003 | 145,832 | 100.0 | % | 2,610 | 17.90 | Publix | Petco, T.J.Maxx, Ulta | — | |||||||||||||||||||||||||||||||||||||||||||||||||||||||||||||
| 92 | Venice Plaza | Venice | FL | North Port-Sarasota-Bradenton, FL | 1999 | 132,345 | 98.8 | % | 1,080 | 8.26 | Winn-Dixie (ALDI) | T.J.Maxx | — | |||||||||||||||||||||||||||||||||||||||||||||||||||||||||||||
| 93 | Venice Shopping Center | Venice | FL | North Port-Sarasota-Bradenton, FL | 2000 | 109,801 | 97.8 | % | 1,039 | 9.67 | Publix | American Freight | — | |||||||||||||||||||||||||||||||||||||||||||||||||||||||||||||
| 94 | Venice Village | Venice | FL | North Port-Sarasota-Bradenton, FL | 2022 | 177,835 | 100.0 | % | 3,989 | 22.74 | Publix | JOANN, Planet Fitness | — | |||||||||||||||||||||||||||||||||||||||||||||||||||||||||||||
| 95 | Mansell Crossing | Alpharetta | GA | Atlanta-Sandy Springs-Alpharetta, GA | 1993 | 291,622 | 96.1 | % | 4,434 | 21.71 | — | American Freight, Barnes & Noble, Cooper's Hawk Winery & Restaurant, DSW, Macy's Furniture Gallery, REI, T.J.Maxx | Burlington Stores, HomeGoods, Michaels, Ross Dress for Less, Studio Movie Grill | |||||||||||||||||||||||||||||||||||||||||||||||||||||||||||||
| 96 | Northeast Plaza | Atlanta | GA | Atlanta-Sandy Springs-Alpharetta, GA | 1952 | 422,609 | 94.3 | % | 5,041 | 12.85 | City Farmers Market | dd's Discounts (Ross), Dollar General, Dollar Tree, Goodwill, NCG Cinemas, Octapharma, P.C.X. | — | |||||||||||||||||||||||||||||||||||||||||||||||||||||||||||||
| 97 | Sweetwater Village | Austell | GA | Atlanta-Sandy Springs-Alpharetta, GA | 1985 | 66,197 | 100.0 | % | 602 | 9.09 | Food Depot | Dollar Tree | — | |||||||||||||||||||||||||||||||||||||||||||||||||||||||||||||
| 98 | Vineyards at Chateau Elan | Braselton | GA | Atlanta-Sandy Springs-Alpharetta, GA | 2002 | 79,047 | 100.0 | % | 1,356 | 17.15 | Publix | — | — | |||||||||||||||||||||||||||||||||||||||||||||||||||||||||||||
| 99 | Salem Road Station | Covington | GA | Atlanta-Sandy Springs-Alpharetta, GA | 2000 | 67,270 | 100.0 | % | 849 | 12.62 | Publix | — | — | |||||||||||||||||||||||||||||||||||||||||||||||||||||||||||||
| 100 | Keith Bridge Commons | Cumming | GA | Atlanta-Sandy Springs-Alpharetta, GA | 2002 | 94,886 | 97.4 | % | 1,397 | 15.12 | Kroger | — | — | |||||||||||||||||||||||||||||||||||||||||||||||||||||||||||||
| 101 | Northside | Dalton | GA | Dalton, GA | 2001 | 78,922 | 100.0 | % | 903 | 12.21 | — | America's Thrift Stores, Dollar Tree | — | |||||||||||||||||||||||||||||||||||||||||||||||||||||||||||||
| 102 | Cosby Station | Douglasville | GA | Atlanta-Sandy Springs-Alpharetta, GA | 1994 | 77,811 | 100.0 | % | 979 | 12.58 | Publix | — | — | |||||||||||||||||||||||||||||||||||||||||||||||||||||||||||||
| 103 | Park Plaza | Douglasville | GA | Atlanta-Sandy Springs-Alpharetta, GA | 1986 | 46,670 | 93.8 | % | 867 | 19.89 | Kroger* | — | — | |||||||||||||||||||||||||||||||||||||||||||||||||||||||||||||
| Supplemental Disclosure - Three Months Ended June 30, 2024 | Page 38 |
|
||||||
PROPERTY LIST |
||||||||||||||||||||||||||||||||||||||||||||||||||||||||||||||||||||||||||
Dollars in thousands, except per square foot amounts |
||||||||||||||||||||||||||||||||||||||||||||||||||||||||||||||||||||||||||
Year |
Percent |
Non-Owned |
||||||||||||||||||||||||||||||||||||||||||||||||||||||||||||||||||||||||
Property Name |
City |
State |
Core-Based Statistical Area | Built |
GLA |
Leased |
ABR |
ABR PSF |
Grocer (1) (4) | Other Major Tenants (4) | Major Tenants |
|||||||||||||||||||||||||||||||||||||||||||||||||||||||||||||||
| 104 | Venture Pointe | Duluth | GA | Atlanta-Sandy Springs-Alpharetta, GA | 1995 | 155,172 | 100.0 | % | 1,779 | 11.46 | Costco* | American Freight, Ollie's Bargain Outlet, Studio Movie Grill | Big Lots | |||||||||||||||||||||||||||||||||||||||||||||||||||||||||||||
| 105 | Banks Station | Fayetteville | GA | Atlanta-Sandy Springs-Alpharetta, GA | 2006 | 178,871 | 79.7 | % | 1,385 | 11.56 | Food Depot | Staples | — | |||||||||||||||||||||||||||||||||||||||||||||||||||||||||||||
| 106 | Barrett Place | Kennesaw | GA | Atlanta-Sandy Springs-Alpharetta, GA | 1992 | 220,787 | 100.0 | % | 3,235 | 15.19 | ALDI | Best Buy, Michaels, Nordstrom Rack, PetSmart | — | |||||||||||||||||||||||||||||||||||||||||||||||||||||||||||||
| 107 | Shops of Huntcrest | Lawrenceville | GA | Atlanta-Sandy Springs-Alpharetta, GA | 2003 | 97,040 | 98.7 | % | 1,448 | 15.12 | Publix | — | — | |||||||||||||||||||||||||||||||||||||||||||||||||||||||||||||
| 108 | Mableton Walk | Mableton | GA | Atlanta-Sandy Springs-Alpharetta, GA | 1994 | 105,884 | 96.2 | % | 1,689 | 16.58 | Publix | — | — | |||||||||||||||||||||||||||||||||||||||||||||||||||||||||||||
| 109 | The Village at Mableton | Mableton | GA | Atlanta-Sandy Springs-Alpharetta, GA | 2023 | 221,201 | 96.0 | % | 2,351 | 11.07 | — | Burlington Stores, DashMart, dd's Discounts (Ross), Dollar Tree, Five Below, Ollie's Bargain Outlet, Planet Fitness, Ross Dress for Less | — | |||||||||||||||||||||||||||||||||||||||||||||||||||||||||||||
| 110 | Eastlake Plaza | Marietta | GA | Atlanta-Sandy Springs-Alpharetta, GA | 1982 | 56,176 | 100.0 | % | 1,048 | 19.06 | — | Crunch Fitness | — | |||||||||||||||||||||||||||||||||||||||||||||||||||||||||||||
| 111 | New Chastain Corners | Marietta | GA | Atlanta-Sandy Springs-Alpharetta, GA | 2004 | 113,079 | 96.3 | % | 1,444 | 13.26 | Kroger | — | — | |||||||||||||||||||||||||||||||||||||||||||||||||||||||||||||
| 112 | Pavilions at Eastlake | Marietta | GA | Atlanta-Sandy Springs-Alpharetta, GA | 1996 | 144,351 | 95.3 | % | 2,234 | 16.25 | Kroger | — | — | |||||||||||||||||||||||||||||||||||||||||||||||||||||||||||||
| 113 | Creekwood Village | Rex | GA | Atlanta-Sandy Springs-Alpharetta, GA | 1990 | 69,778 | 100.0 | % | 696 | 9.97 | Food Depot | — | — | |||||||||||||||||||||||||||||||||||||||||||||||||||||||||||||
| 114 | ConneXion | Roswell | GA | Atlanta-Sandy Springs-Alpharetta, GA | 2016 | 107,355 | 94.8 | % | 2,039 | 20.03 | — | Planet Fitness | — | |||||||||||||||||||||||||||||||||||||||||||||||||||||||||||||
| 115 | Holcomb Bridge Crossing | Roswell | GA | Atlanta-Sandy Springs-Alpharetta, GA | 1988 | 93,420 | 92.7 | % | 1,111 | 12.83 | — | PGA TOUR Superstore | — | |||||||||||||||||||||||||||||||||||||||||||||||||||||||||||||
| 116 | Kings Market | Roswell | GA | Atlanta-Sandy Springs-Alpharetta, GA | 2005 | 275,294 | 94.3 | % | 3,016 | 11.62 | Publix | Ace Pickleball Club, Frontgate, Sky Zone | — | |||||||||||||||||||||||||||||||||||||||||||||||||||||||||||||
| 117 | Victory Square | Savannah | GA | Savannah, GA | 2007 | 113,217 | 98.6 | % | 1,812 | 16.23 | SuperTarget* | Citi Trends, Dollar Tree, NCG Cinemas, Staples | The Home Depot | |||||||||||||||||||||||||||||||||||||||||||||||||||||||||||||
| 118 | Stockbridge Village | Stockbridge | GA | Atlanta-Sandy Springs-Alpharetta, GA | 2008 | 184,185 | 100.0 | % | 3,388 | 18.39 | Kroger | DaVita Dialysis | — | |||||||||||||||||||||||||||||||||||||||||||||||||||||||||||||
| 119 | Stone Mountain Festival | Stone Mountain | GA | Atlanta-Sandy Springs-Alpharetta, GA | 2006 | 135,865 | 94.2 | % | 1,703 | 13.31 | — | Conn's Home Plus, Harbor Freight Tools, NCG Cinemas | — | |||||||||||||||||||||||||||||||||||||||||||||||||||||||||||||
| 120 | Wilmington Island | Wilmington Island | GA | Savannah, GA | 1985 | 101,462 | 97.1 | % | 1,159 | 11.76 | Kroger | — | — | |||||||||||||||||||||||||||||||||||||||||||||||||||||||||||||
| 121 | Annex of Arlington | Arlington Heights | IL | Chicago-Naperville-Elgin, IL-IN-WI | 1999 | 199,663 | 97.4 | % | 3,994 | 20.54 | Trader Joe's | Binny's Beverage Depot, Chuck E. Cheese's, Dollar Tree, Kirkland's, Party City, Petco, Ulta | — | |||||||||||||||||||||||||||||||||||||||||||||||||||||||||||||
| 122 | Ridge Plaza | Arlington Heights | IL | Chicago-Naperville-Elgin, IL-IN-WI | 2000 | 151,643 | 89.7 | % | 2,194 | 16.13 | — | Harbor Freight Tools, XSport Fitness | Kohl's | |||||||||||||||||||||||||||||||||||||||||||||||||||||||||||||
| 123 | Southfield Plaza | Bridgeview | IL | Chicago-Naperville-Elgin, IL-IN-WI | 2006 | 196,445 | 100.0 | % | 2,543 | 12.95 | Shop & Save Market (Albertsons) | Hobby Lobby, Octapharma, Planet Fitness, Walgreens | — | |||||||||||||||||||||||||||||||||||||||||||||||||||||||||||||
| 124 | Commons of Chicago Ridge | Chicago Ridge | IL | Chicago-Naperville-Elgin, IL-IN-WI | 1998 | 325,023 | 98.1 | % | 4,878 | 16.45 | — | Discovery Clothing, Dollar Tree, KPot Korean BBQ & Hot Pot, Marshalls, Pep Boys, Ross Dress for Less, Shoe Carnival, The Home Depot, XSport Fitness | — | |||||||||||||||||||||||||||||||||||||||||||||||||||||||||||||
| 125 | Rivercrest Shopping Center | Crestwood | IL | Chicago-Naperville-Elgin, IL-IN-WI | 1992 | 541,651 | 94.7 | % | 6,342 | 13.10 | Tony's Fresh Market (Heritage Grocers) | AMC, At Home, Burlington Stores, Dollar Tree, Hollywood Park, JOANN, National Tire & Battery, OfficeMax, Party City, PetSmart, Planet Fitness, Ross Dress for Less | — | |||||||||||||||||||||||||||||||||||||||||||||||||||||||||||||
| 126 | The Commons of Crystal Lake | Crystal Lake | IL | Chicago-Naperville-Elgin, IL-IN-WI | 1987 | 273,060 | 77.4 | % | 2,332 | 11.03 | Jewel-Osco (Albertsons) | Burlington Stores, Harbor Freight Tools | Hobby Lobby | |||||||||||||||||||||||||||||||||||||||||||||||||||||||||||||
| 127 | Elmhurst Crossing | Elmhurst | IL | Chicago-Naperville-Elgin, IL-IN-WI | 2005 | 347,503 | 100.0 | % | 5,022 | 14.45 | Whole Foods Market (Amazon) | At Home, Five Below, Kohl's, Petco, Shoe Carnival | — | |||||||||||||||||||||||||||||||||||||||||||||||||||||||||||||
| 128 | The Quentin Collection | Kildeer | IL | Chicago-Naperville-Elgin, IL-IN-WI | 2006 | 171,530 | 62.9 | % | 1,389 | 12.87 | — | Bear Paddle Swim School, Painted Tree Marketplace | — | |||||||||||||||||||||||||||||||||||||||||||||||||||||||||||||
| 129 | Butterfield Square | Libertyville | IL | Chicago-Naperville-Elgin, IL-IN-WI | 1997 | 106,683 | 75.4 | % | 1,297 | 16.12 | Sunset Foods | — | — | |||||||||||||||||||||||||||||||||||||||||||||||||||||||||||||
| 130 | High Point Centre | Lombard | IL | Chicago-Naperville-Elgin, IL-IN-WI | 2019 | 240,259 | 70.5 | % | 2,552 | 15.07 | — | Altitude Trampoline Park, JOANN, LA Fitness | — | |||||||||||||||||||||||||||||||||||||||||||||||||||||||||||||
| 131 | Long Meadow Commons | Mundelein | IL | Chicago-Naperville-Elgin, IL-IN-WI | 1997 | 118,281 | 92.5 | % | 1,751 | 16.89 | Jewel-Osco (Albertsons) | Planet Fitness | — | |||||||||||||||||||||||||||||||||||||||||||||||||||||||||||||
| 132 | Westridge Court / Block 59 (2)(3) | Naperville | IL | Chicago-Naperville-Elgin, IL-IN-WI | 2024 | 535,013 | 83.8 | % | 9,646 | 23.17 | The Fresh Market | DICK’S Sporting Goods Warehouse Sale, Discovery Clothing, Edge Fitness, Five Below, Funtopia USA, La-Z-Boy Furniture, Painted Tree Marketplace, Star Cinema Grille, Ulta, World Market | — | |||||||||||||||||||||||||||||||||||||||||||||||||||||||||||||
| 133 | North Riverside Plaza | North Riverside | IL | Chicago-Naperville-Elgin, IL-IN-WI | 2007 | 387,873 | 94.1 | % | 4,491 | 12.31 | Amazon Fresh | Best Buy, Burlington Stores, Kohl's, Michaels, Petco | — | |||||||||||||||||||||||||||||||||||||||||||||||||||||||||||||
| 134 | Ravinia Plaza | Orland Park | IL | Chicago-Naperville-Elgin, IL-IN-WI | 1990 | 101,800 | 89.2 | % | 1,802 | 19.85 | Whole Foods Market (Amazon) | Skechers | — | |||||||||||||||||||||||||||||||||||||||||||||||||||||||||||||
| 135 | Rollins Crossing | Round Lake Beach | IL | Chicago-Naperville-Elgin, IL-IN-WI | 1998 | 120,292 | 91.1 | % | 1,759 | 16.05 | — | Buffalo Wild Wings, Esporta Fitness, Harbor Freight Tools, Petco | — | |||||||||||||||||||||||||||||||||||||||||||||||||||||||||||||
| 136 | Tinley Park Plaza (3) | Tinley Park | IL | Chicago-Naperville-Elgin, IL-IN-WI | 2024 | 237,973 | 94.8 | % | 3,743 | 16.60 | Amazon Fresh | Burlington Stores, Dollar Tree, Planet Fitness, Ross Dress for Less, The Tile Shop | — | |||||||||||||||||||||||||||||||||||||||||||||||||||||||||||||
| 137 | Meridian Village | Carmel | IN | Indianapolis-Carmel-Anderson, IN | 1990 | 130,431 | 96.2 | % | 1,417 | 11.29 | — | Ollie's Bargain Outlet | — | |||||||||||||||||||||||||||||||||||||||||||||||||||||||||||||
| 138 | Columbus Center | Columbus | IN | Columbus, IN | 1964 | 143,740 | 100.0 | % | 2,125 | 14.78 | — | Burlington Stores, Five Below, HomeGoods, T.J.Maxx | Target | |||||||||||||||||||||||||||||||||||||||||||||||||||||||||||||
| Supplemental Disclosure - Three Months Ended June 30, 2024 | Page 39 |
|
||||||
PROPERTY LIST |
||||||||||||||||||||||||||||||||||||||||||||||||||||||||||||||||||||||||||
Dollars in thousands, except per square foot amounts |
||||||||||||||||||||||||||||||||||||||||||||||||||||||||||||||||||||||||||
Year |
Percent |
Non-Owned |
||||||||||||||||||||||||||||||||||||||||||||||||||||||||||||||||||||||||
Property Name |
City |
State |
Core-Based Statistical Area | Built |
GLA |
Leased |
ABR |
ABR PSF |
Grocer (1) (4) | Other Major Tenants (4) | Major Tenants |
|||||||||||||||||||||||||||||||||||||||||||||||||||||||||||||||
| 139 | Market Centre | Goshen | IN | Elkhart-Goshen, IN | 1994 | 214,067 | 98.0 | % | 2,789 | 13.30 | Walmart Supercenter* | Burlington Stores, Dollar Tree, JOANN, Ross Dress for Less, Staples | — | |||||||||||||||||||||||||||||||||||||||||||||||||||||||||||||
| 140 | Speedway Super Center | Speedway | IN | Indianapolis-Carmel-Anderson, IN | 2022 | 584,626 | 93.0 | % | 6,771 | 12.69 | Kroger | Aaron's, American Freight, Burlington Stores, Dollar Tree, Empire Beauty School, Harbor Freight Tools, HealthNet, Indiana Bureau of Motor Vehicles, Kohl's, Mattress Firm, Oak Street Health, Petco, pOpshelf, Ross Dress for Less, T.J.Maxx | — | |||||||||||||||||||||||||||||||||||||||||||||||||||||||||||||
| 141 | Sagamore Park Centre | West Lafayette | IN | Lafayette-West Lafayette, IN | 2018 | 132,027 | 100.0 | % | 1,496 | 11.33 | Pay Less (Kroger) | — | — | |||||||||||||||||||||||||||||||||||||||||||||||||||||||||||||
| 142 | Westchester Square | Lenexa | KS | Kansas City, MO-KS | 1987 | 161,701 | 88.5 | % | 1,507 | 10.53 | Hy-Vee | — | — | |||||||||||||||||||||||||||||||||||||||||||||||||||||||||||||
| 143 | West Loop Shopping Center | Manhattan | KS | Manhattan, KS | 2013 | 214,898 | 98.2 | % | 2,203 | 16.90 | Dillons (Kroger) | JOANN, Marshalls | — | |||||||||||||||||||||||||||||||||||||||||||||||||||||||||||||
| 144 | Florence Plaza - Florence Square (2) | Florence | KY | Cincinnati, OH-KY-IN | 2014 | 679,639 | 98.3 | % | 8,901 | 16.84 | Kroger | Aaron's, Barnes & Noble, Bob's Discount Furniture, Burlington Stores, Boot Barn, Chuck E. Cheese's, Five Below, Harbor Freight Tools, Hobby Lobby, HomeGoods, KPot Korean BBQ & Hot Pot, Old Navy, Ollie's Bargain Outlet, Ross Dress for Less, Shoe Carnival, Sierra Trading Post, Staples, T.J.Maxx, Ulta | — | |||||||||||||||||||||||||||||||||||||||||||||||||||||||||||||
| 145 | Jeffersontown Commons | Jeffersontown | KY | Louisville/Jefferson County, KY-IN | 1959 | 208,388 | 85.1 | % | 1,783 | 10.66 | — | Ace Pickleball Club, CVS, Dollar Tree | — | |||||||||||||||||||||||||||||||||||||||||||||||||||||||||||||
| 146 | London Marketplace | London | KY | London, KY | 1994 | 166,026 | 100.0 | % | 1,622 | 9.77 | Kroger | bealls, Kohl's, Marshalls, Planet Fitness | — | |||||||||||||||||||||||||||||||||||||||||||||||||||||||||||||
| 147 | Eastgate Shopping Center | Louisville | KY | Louisville/Jefferson County, KY-IN | 2002 | 174,842 | 99.1 | % | 2,151 | 12.42 | Kroger | Petco | — | |||||||||||||||||||||||||||||||||||||||||||||||||||||||||||||
| 148 | Plainview Village | Louisville | KY | Louisville/Jefferson County, KY-IN | 1997 | 157,747 | 93.5 | % | 1,763 | 12.60 | Kroger | Anytime Fitness | — | |||||||||||||||||||||||||||||||||||||||||||||||||||||||||||||
| 149 | Stony Brook I & II | Louisville | KY | Louisville/Jefferson County, KY-IN | 1988 | 158,940 | 98.8 | % | 2,077 | 13.23 | Kroger Marketplace | — | — | |||||||||||||||||||||||||||||||||||||||||||||||||||||||||||||
| 150 | Points West Plaza | Brockton | MA | Boston-Cambridge-Newton, MA-NH | 1960 | 140,488 | 100.0 | % | 1,276 | 9.08 | America's Food Basket | Citi Trends, Crunch Fitness | — | |||||||||||||||||||||||||||||||||||||||||||||||||||||||||||||
| 151 | Burlington Square I, II & III (3) | Burlington | MA | Boston-Cambridge-Newton, MA-NH | 2024 | 79,698 | 95.1 | % | 2,632 | 34.73 | — | Golf Galaxy, Staples | Duluth Trading Co. | |||||||||||||||||||||||||||||||||||||||||||||||||||||||||||||
| 152 | Holyoke Shopping Center | Holyoke | MA | Springfield, MA | 2000 | 195,995 | 96.6 | % | 1,839 | 14.08 | Super Stop & Shop (Ahold Delhaize) | JOANN, Ocean State Job Lot | — | |||||||||||||||||||||||||||||||||||||||||||||||||||||||||||||
| 153 | WaterTower Plaza (3) | Leominster | MA | Worcester, MA-CT | 2024 | 282,831 | 99.0 | % | 4,110 | 14.95 | TBA | Barnes & Noble, Five Below, Michaels, Ocean State Job Lot, Party City, Petco, Staples, T.J.Maxx, The Paper Store | — | |||||||||||||||||||||||||||||||||||||||||||||||||||||||||||||
| 154 | Lunenberg Crossing | Lunenburg | MA | Worcester, MA-CT | 1994 | 25,515 | 72.5 | % | 299 | 16.16 | Hannaford Bros.* | — | Walmart | |||||||||||||||||||||||||||||||||||||||||||||||||||||||||||||
| 155 | Lynn Marketplace | Lynn | MA | Boston-Cambridge-Newton, MA-NH | 1968 | 78,046 | 95.5 | % | 1,536 | 20.60 | Stop And Compare | Crunch Fitness | — | |||||||||||||||||||||||||||||||||||||||||||||||||||||||||||||
| 156 | Webster Square Shopping Center | Marshfield | MA | Boston-Cambridge-Newton, MA-NH | 2005 | 182,756 | 94.3 | % | 2,775 | 16.11 | Star Market (Albertsons) | Marshalls, Ocean State Job Lot | — | |||||||||||||||||||||||||||||||||||||||||||||||||||||||||||||
| 157 | Berkshire Crossing | Pittsfield | MA | Pittsfield, MA | 1994 | 188,444 | 99.1 | % | 2,986 | 15.99 | Market 32 (Northeast Grocery) | Barnes & Noble, Michaels, Staples, Ulta | The Home Depot, Walmart | |||||||||||||||||||||||||||||||||||||||||||||||||||||||||||||
| 158 | Westgate Plaza | Westfield | MA | Springfield, MA | 1996 | 125,358 | 97.8 | % | 1,695 | 16.98 | ALDI | Ocean State Job Lot, PetSmart, T.J.Maxx | — | |||||||||||||||||||||||||||||||||||||||||||||||||||||||||||||
| 159 | Perkins Farm Marketplace | Worcester | MA | Worcester, MA-CT | 1967 | 205,048 | 98.2 | % | 2,527 | 20.08 | Super Stop & Shop (Ahold Delhaize) | Citi Trends, Crunch Fitness, Ollie's Bargain Outlet | — | |||||||||||||||||||||||||||||||||||||||||||||||||||||||||||||
| 160 | South Plaza Shopping Center | California | MD | California-Lexington Park, MD | 2005 | 92,335 | 100.0 | % | 1,862 | 20.17 | — | Best Buy, Old Navy, Petco, Ross Dress for Less | — | |||||||||||||||||||||||||||||||||||||||||||||||||||||||||||||
| 161 | Fox Run | Prince Frederick | MD | Washington-Arlington-Alexandria, DC-VA-MD-WV | 2022 | 279,651 | 98.4 | % | 4,432 | 16.80 | Giant Food (Ahold Delhaize) | Big Lots, JOANN, Planet Fitness, Ross Dress for Less, Ulta | — | |||||||||||||||||||||||||||||||||||||||||||||||||||||||||||||
| 162 | Pine Tree Shopping Center | Portland | ME | Portland-South Portland, ME | 1958 | 287,533 | 100.0 | % | 2,143 | 17.99 | — | Big Lots, Dollar Tree, JOANN, Lowe's, O'Reilly Auto Parts | — | |||||||||||||||||||||||||||||||||||||||||||||||||||||||||||||
| 163 | Arborland Center | Ann Arbor | MI | Ann Arbor, MI | 2000 | 403,536 | 96.4 | % | 7,428 | 19.36 | Kroger | DSW, HomeGoods, Marshalls, Michaels, Nordstrom Rack, OfficeMax, Old Navy, Petco, Ulta | — | |||||||||||||||||||||||||||||||||||||||||||||||||||||||||||||
| 164 | Maple Village | Ann Arbor | MI | Ann Arbor, MI | 2020 | 288,528 | 97.2 | % | 5,010 | 17.86 | Plum Market | Burlington Stores, Dunham's Sports, HomeGoods, LA Fitness, Sierra Trading Post, Ulta | — | |||||||||||||||||||||||||||||||||||||||||||||||||||||||||||||
| 165 | Grand Crossing | Brighton | MI | Detroit-Warren-Dearborn, MI | 2005 | 85,389 | 93.9 | % | 1,006 | 12.55 | Busch’s Fresh Food Market | Ace Hardware | — | |||||||||||||||||||||||||||||||||||||||||||||||||||||||||||||
| 166 | Farmington Crossroads | Farmington | MI | Detroit-Warren-Dearborn, MI | 1986 | 85,168 | 100.0 | % | 1,030 | 12.09 | — | Ollie's Bargain Outlet, True Value | — | |||||||||||||||||||||||||||||||||||||||||||||||||||||||||||||
| 167 | Silver Pointe Shopping Center | Fenton | MI | Flint, MI | 1996 | 164,632 | 100.0 | % | 2,253 | 13.78 | VG's Food (SpartanNash) | Dunham's Sports | Five Below, Michaels, Old Navy, T.J.Maxx | |||||||||||||||||||||||||||||||||||||||||||||||||||||||||||||
| 168 | Cascade East | Grand Rapids | MI | Grand Rapids-Kentwood, MI | 1983 | 99,529 | 92.6 | % | 833 | 9.04 | D&W Fresh Market (SpartanNash) | — | — | |||||||||||||||||||||||||||||||||||||||||||||||||||||||||||||
| 169 | Delta Center | Lansing | MI | Lansing-East Lansing, MI | 1985 | 160,946 | 100.0 | % | 1,711 | 10.63 | — | DICK’S Sporting Goods Warehouse Sale, Dollar Tree, DXL Destination XL, Funcity Adventure Park, Planet Fitness | — | |||||||||||||||||||||||||||||||||||||||||||||||||||||||||||||
| 170 | Lakes Crossing | Muskegon | MI | Muskegon, MI | 2008 | 104,600 | 96.2 | % | 1,546 | 15.37 | — | JOANN, Party City, Shoe Carnival, Ulta | Kohl's | |||||||||||||||||||||||||||||||||||||||||||||||||||||||||||||
| 171 | Redford Plaza | Redford | MI | Detroit-Warren-Dearborn, MI | 1992 | 308,078 | 94.3 | % | 3,623 | 12.63 | Sun Valley Supermarket | Aaron's, Burlington Stores, Citi Trends, Dollar Tree, Harbor Freight Tools, Octapharma, Ross Dress for less | — | |||||||||||||||||||||||||||||||||||||||||||||||||||||||||||||
| Supplemental Disclosure - Three Months Ended June 30, 2024 | Page 40 |
|
||||||
PROPERTY LIST |
||||||||||||||||||||||||||||||||||||||||||||||||||||||||||||||||||||||||||
Dollars in thousands, except per square foot amounts |
||||||||||||||||||||||||||||||||||||||||||||||||||||||||||||||||||||||||||
Year |
Percent |
Non-Owned |
||||||||||||||||||||||||||||||||||||||||||||||||||||||||||||||||||||||||
Property Name |
City |
State |
Core-Based Statistical Area | Built |
GLA |
Leased |
ABR |
ABR PSF |
Grocer (1) (4) | Other Major Tenants (4) | Major Tenants |
|||||||||||||||||||||||||||||||||||||||||||||||||||||||||||||||
| 172 | Hampton Village Centre | Rochester Hills | MI | Detroit-Warren-Dearborn, MI | 2004 | 465,309 | 97.4 | % | 7,090 | 20.50 | TBA | Barnes & Noble, DSW, Emagine Theatre, Kohl's, OfficeMax, Old Navy, Petco, T.J.Maxx, Ulta | Target | |||||||||||||||||||||||||||||||||||||||||||||||||||||||||||||
| 173 | Southfield Plaza | Southfield | MI | Detroit-Warren-Dearborn, MI | 1970 | 101,781 | 100.0 | % | 1,305 | 12.82 | — | Citi Trends, Party City, Planet Fitness | Burlington Stores, Forman Mills | |||||||||||||||||||||||||||||||||||||||||||||||||||||||||||||
| 174 | Delco Plaza | Sterling Heights | MI | Detroit-Warren-Dearborn, MI | 1996 | 154,853 | 100.0 | % | 1,160 | 7.49 | — | Dunham's Sports, Tractor Supply Co., Urban Air Adventure Park | — | |||||||||||||||||||||||||||||||||||||||||||||||||||||||||||||
| 175 | West Ridge | Westland | MI | Detroit-Warren-Dearborn, MI | 1989 | 159,080 | 99.3 | % | 1,966 | 12.44 | — | Crunch Fitness, Party City, Petco, Rally House, Ross Dress for Less | Burlington Stores, Target | |||||||||||||||||||||||||||||||||||||||||||||||||||||||||||||
| 176 | Washtenaw Fountain Plaza | Ypsilanti | MI | Ann Arbor, MI | 2005 | 122,762 | 97.0 | % | 1,021 | 8.58 | Save-A-Lot (Rabban Brothers) | Big Lots, Dollar Tree, Planet Fitness | — | |||||||||||||||||||||||||||||||||||||||||||||||||||||||||||||
| 177 | Southport Centre I - VI | Apple Valley | MN | Minneapolis-St. Paul-Bloomington, MN-WI | 1985 | 124,260 | 69.5 | % | 2,021 | 23.41 | SuperTarget* | Dollar Tree, Walgreens | — | |||||||||||||||||||||||||||||||||||||||||||||||||||||||||||||
| 178 | Champlin Marketplace | Champlin | MN | Minneapolis-St. Paul-Bloomington, MN-WI | 2005 | 91,970 | 100.0 | % | 1,347 | 15.21 | Cub Foods (United Natural Foods Inc.) | — | — | |||||||||||||||||||||||||||||||||||||||||||||||||||||||||||||
| 179 | Burning Tree Plaza | Duluth | MN | Duluth, MN-WI | 1987 | 183,105 | 95.8 | % | 2,495 | 14.23 | — | Best Buy, Dollar Tree, Harbor Freight Tools, HomeGoods, JOANN, T.J.Maxx | — | |||||||||||||||||||||||||||||||||||||||||||||||||||||||||||||
| 180 | Westwind Plaza | Minnetonka | MN | Minneapolis-St. Paul-Bloomington, MN-WI | 2007 | 91,670 | 95.6 | % | 2,071 | 24.62 | Cub Foods* | Ablelight Thrift, MGM Wine and Spirits | — | |||||||||||||||||||||||||||||||||||||||||||||||||||||||||||||
| 181 | Richfield Hub | Richfield | MN | Minneapolis-St. Paul-Bloomington, MN-WI | 1952 | 213,595 | 91.5 | % | 2,456 | 12.56 | Loma Bonita Market | Dollar Tree, Marshalls, Michaels, Walgreens | — | |||||||||||||||||||||||||||||||||||||||||||||||||||||||||||||
| 182 | Roseville Center | Roseville | MN | Minneapolis-St. Paul-Bloomington, MN-WI | 2021 | 82,576 | 98.8 | % | 1,127 | 19.76 | ALDI, Cub Foods* | Dollar Tree | — | |||||||||||||||||||||||||||||||||||||||||||||||||||||||||||||
| 183 | Marketplace @ 42 | Savage | MN | Minneapolis-St. Paul-Bloomington, MN-WI | 1999 | 118,693 | 100.0 | % | 2,061 | 17.36 | Fresh Thyme Farmers Market (Meijer) | Dollar Tree, Marshalls | — | |||||||||||||||||||||||||||||||||||||||||||||||||||||||||||||
| 184 | Sun Ray Shopping Center | St. Paul | MN | Minneapolis-St. Paul-Bloomington, MN-WI | 1958 | 290,897 | 80.8 | % | 2,535 | 14.97 | Cub Foods (United Natural Foods Inc.) | BioLife Plasma Services, Citi Trends, Dollar Tree, Five Below, Planet Fitness, Ross Dress for Less | — | |||||||||||||||||||||||||||||||||||||||||||||||||||||||||||||
| 185 | White Bear Hills Shopping Center | White Bear Lake | MN | Minneapolis-St. Paul-Bloomington, MN-WI | 1996 | 73,065 | 100.0 | % | 1,133 | 15.51 | Festival Foods (Knowlan's Super Markets) | Dollar Tree | — | |||||||||||||||||||||||||||||||||||||||||||||||||||||||||||||
| 186 | Ellisville Square | Ellisville | MO | St. Louis, MO-IL | 1989 | 137,408 | 78.7 | % | 1,512 | 14.41 | ALDI | Chuck E. Cheese's, Michaels, Party City, Petco | — | |||||||||||||||||||||||||||||||||||||||||||||||||||||||||||||
| 187 | Watts Mill Plaza | Kansas City | MO | Kansas City, MO-KS | 1997 | 161,717 | 99.2 | % | 1,569 | 9.78 | Price Chopper (Associated Wholesale) | Fowling Warehouse | — | |||||||||||||||||||||||||||||||||||||||||||||||||||||||||||||
| 188 | Liberty Corners | Liberty | MO | Kansas City, MO-KS | 1987 | 124,808 | 93.8 | % | 1,242 | 10.61 | Price Chopper (Associated Wholesale) | — | — | |||||||||||||||||||||||||||||||||||||||||||||||||||||||||||||
| 189 | Maplewood Square | Maplewood | MO | St. Louis, MO-IL | 1998 | 71,590 | 95.4 | % | 477 | 6.98 | Schnucks | — | — | |||||||||||||||||||||||||||||||||||||||||||||||||||||||||||||
| 190 | Devonshire Place | Cary | NC | Raleigh-Cary, NC | 1996 | 106,680 | 100.0 | % | 1,706 | 16.34 | — | Burlington Stores, Dollar Tree, Harbor Freight Tools, REI | — | |||||||||||||||||||||||||||||||||||||||||||||||||||||||||||||
| 191 | McMullen Creek Market | Charlotte | NC | Charlotte-Concord-Gastonia, NC-SC | 1988 | 285,424 | 94.6 | % | 4,699 | 17.41 | Walmart Neighborhood Market | Burlington Stores, Dollar Tree, pOpshelf, Staples | — | |||||||||||||||||||||||||||||||||||||||||||||||||||||||||||||
| 192 | The Commons at Chancellor Park | Charlotte | NC | Charlotte-Concord-Gastonia, NC-SC | 1994 | 348,604 | 100.0 | % | 2,204 | 9.07 | Patel Brothers | Big Air Trampoline, Big Lots, Dollar Tree, Gabe's, The Home Depot, Tokyo Grill and Supreme Buffet, Value City Furniture | — | |||||||||||||||||||||||||||||||||||||||||||||||||||||||||||||
| 193 | Garner Towne Square | Garner | NC | Raleigh-Cary, NC | 1997 | 180,017 | 99.2 | % | 2,854 | 15.98 | LIDL | Boot Barn, Conn's Home Plus, Harbor Freight Tools, PetSmart | Target, The Home Depot | |||||||||||||||||||||||||||||||||||||||||||||||||||||||||||||
| 194 | Franklin Square | Gastonia | NC | Charlotte-Concord-Gastonia, NC-SC | 1989 | 317,824 | 93.8 | % | 4,006 | 14.96 | Walmart Supercenter* | bealls, Best Buy, Dollar Tree, Five Below, Michaels, Pep Boys, pOpshelf, Ross Dress for Less | — | |||||||||||||||||||||||||||||||||||||||||||||||||||||||||||||
| 195 | Wendover Place | Greensboro | NC | Greensboro-High Point, NC | 2000 | 407,244 | 100.0 | % | 6,051 | 14.86 | — | Burlington Stores, DICK'S Sporting Goods, Kohl's, Michaels, Old Navy, Party City, PetSmart, Ross Dress for Less, Shoe Carnival, Ulta, Wayfair Outlet | Target | |||||||||||||||||||||||||||||||||||||||||||||||||||||||||||||
| 196 | University Commons | Greenville | NC | Greenville, NC | 1996 | 233,153 | 100.0 | % | 3,626 | 15.55 | Harris Teeter (Kroger) | Barnes & Noble, Petco, HomeGoods, Shoe Carnival, T.J.Maxx | Target | |||||||||||||||||||||||||||||||||||||||||||||||||||||||||||||
| 197 | Roxboro Square | Roxboro | NC | Durham-Chapel Hill, NC | 2005 | 97,226 | 97.8 | % | 1,591 | 16.73 | — | Person County Health & Human Services | — | |||||||||||||||||||||||||||||||||||||||||||||||||||||||||||||
| 198 | Innes Street Market | Salisbury | NC | Charlotte-Concord-Gastonia, NC-SC | 2002 | 349,425 | 98.1 | % | 4,314 | 12.59 | Food Lion (Ahold Delhaize) | Lowe's, Marshalls, Old Navy, PetSmart, Staples, Tinseltown | — | |||||||||||||||||||||||||||||||||||||||||||||||||||||||||||||
| 199 | New Centre Market | Wilmington | NC | Wilmington, NC | 1998 | 143,762 | 100.0 | % | 2,274 | 16.25 | — | Burlington Stores, Party City, PetSmart, Shoe Carnival, Sportsman's Warehouse | Target | |||||||||||||||||||||||||||||||||||||||||||||||||||||||||||||
| 200 | University Commons | Wilmington | NC | Wilmington, NC | 2007 | 235,345 | 100.0 | % | 4,015 | 17.06 | Lowes Foods (Alex Lee) | Dollar Tree, HomeGoods, Skechers, T.J.Maxx | — | |||||||||||||||||||||||||||||||||||||||||||||||||||||||||||||
| 201 | Parkway Plaza | Winston-Salem | NC | Winston-Salem, NC | 2005 | 279,630 | 86.3 | % | 2,909 | 12.73 | Compare Foods | Badcock Home Furniture, Citi Trends, Modern Home, Office Depot, O'Reilly Auto Parts | — | |||||||||||||||||||||||||||||||||||||||||||||||||||||||||||||
| 202 | Stratford Commons | Winston-Salem | NC | Winston-Salem, NC | 1995 | 72,308 | 94.8 | % | 914 | 13.33 | CHEF'STORE (US Foods) | Mattress Firm | — | |||||||||||||||||||||||||||||||||||||||||||||||||||||||||||||
| 203 | Bedford Grove | Bedford | NH | Manchester-Nashua, NH | 1989 | 103,076 | 98.8 | % | 2,227 | 23.08 | — | Boston Interiors, Planet Fitness | — | |||||||||||||||||||||||||||||||||||||||||||||||||||||||||||||
| Supplemental Disclosure - Three Months Ended June 30, 2024 | Page 41 |
|
||||||
PROPERTY LIST |
||||||||||||||||||||||||||||||||||||||||||||||||||||||||||||||||||||||||||
Dollars in thousands, except per square foot amounts |
||||||||||||||||||||||||||||||||||||||||||||||||||||||||||||||||||||||||||
Year |
Percent |
Non-Owned |
||||||||||||||||||||||||||||||||||||||||||||||||||||||||||||||||||||||||
Property Name |
City |
State |
Core-Based Statistical Area | Built |
GLA |
Leased |
ABR |
ABR PSF |
Grocer (1) (4) | Other Major Tenants (4) | Major Tenants |
|||||||||||||||||||||||||||||||||||||||||||||||||||||||||||||||
| 204 | Capitol Shopping Center | Concord | NH | Concord, NH | 2001 | 196,542 | 100.0 | % | 2,731 | 14.66 | Market Basket (DeMoulas Supermarkets) | Burlington Stores, JOANN, Marshalls | — | |||||||||||||||||||||||||||||||||||||||||||||||||||||||||||||
| 205 | Willow Springs Plaza | Nashua | NH | Manchester-Nashua, NH | 1990 | 131,248 | 100.0 | % | 2,635 | 21.89 | Patel Brothers | Jordan's Warehouse, Mavis Discount Tires, New Hampshire Liquor and Wine Outlet, Petco | The Home Depot | |||||||||||||||||||||||||||||||||||||||||||||||||||||||||||||
| 206 | Seacoast Shopping Center | Seabrook | NH | Boston-Cambridge-Newton, MA-NH | 1991 | 89,634 | 90.7 | % | 787 | 9.68 | — | JOANN, The Zoo Health Club, Tractor Supply Co. | Ashley Furniture, Cardi's Furniture, Ocean State Job Lot | |||||||||||||||||||||||||||||||||||||||||||||||||||||||||||||
| 207 | Tri-City Plaza | Somersworth | NH | Boston-Cambridge-Newton, MA-NH | 1990 | 151,754 | 97.1 | % | 1,660 | 11.27 | Market Basket (DeMoulas Supermarkets) | Staples, T.J.Maxx | — | |||||||||||||||||||||||||||||||||||||||||||||||||||||||||||||
| 208 | Laurel Square | Brick | NJ | New York-Newark-Jersey City, NY-NJ-PA | 2023 | 245,984 | 95.7 | % | 2,294 | 9.74 | Livoti’s Old World Market | Ashley Homestore, At Home, Dollar Tree, Planet Fitness, Senior Helpers Town Square | — | |||||||||||||||||||||||||||||||||||||||||||||||||||||||||||||
| 209 | The Shoppes at Cinnaminson | Cinnaminson | NJ | Philadelphia-Camden-Wilmington, PA-NJ-DE-MD | 2010 | 301,211 | 99.6 | % | 5,090 | 24.87 | ShopRite (Eickhoff Supermarkets) | Burlington Stores, Planet Fitness, Ross Dress for Less | — | |||||||||||||||||||||||||||||||||||||||||||||||||||||||||||||
| 210 | Acme Clark | Clark | NJ | New York-Newark-Jersey City, NY-NJ-PA | 2007 | 52,812 | 100.0 | % | 1,465 | 27.74 | Acme (Albertsons) | — | — | |||||||||||||||||||||||||||||||||||||||||||||||||||||||||||||
| 211 | Collegetown Shopping Center | Glassboro | NJ | Philadelphia-Camden-Wilmington, PA-NJ-DE-MD | 2021 | 231,464 | 97.7 | % | 3,570 | 15.97 | LIDL | Big Lots, Esporta Fitness, Five Below, Pep Boys, Ross Dress for Less, Ulta | — | |||||||||||||||||||||||||||||||||||||||||||||||||||||||||||||
| 212 | Hamilton Plaza | Hamilton | NJ | Trenton-Princeton, NJ | 1972 | 149,993 | 100.0 | % | 2,215 | 14.77 | Grocery Outlet | 2nd Ave, Crab Du Jour, DaVita Dialysis, Planet Fitness, Rothman Orthopaedic Institute | — | |||||||||||||||||||||||||||||||||||||||||||||||||||||||||||||
| 213 | Bennetts Mills Plaza | Jackson | NJ | New York-Newark-Jersey City, NY-NJ-PA | 2002 | 127,230 | 100.0 | % | 1,811 | 14.23 | Super Stop & Shop (Ahold Delhaize) | — | — | |||||||||||||||||||||||||||||||||||||||||||||||||||||||||||||
| 214 | Marlton Crossing | Marlton | NJ | Philadelphia-Camden-Wilmington, PA-NJ-DE-MD | 2019 | 337,878 | 95.4 | % | 7,547 | 23.55 | Sprouts Farmers Market | Arthur Murray Dance Studio, Burlington Stores, Chickie's & Pete's, DSW, HomeGoods, Michaels, T.J.Maxx | — | |||||||||||||||||||||||||||||||||||||||||||||||||||||||||||||
| 215 | Middletown Plaza (3) | Middletown | NJ | New York-Newark-Jersey City, NY-NJ-PA | 2024 | 201,679 | 92.3 | % | 3,780 | 20.32 | Trader Joe's | At Home, Party Fair, Petco, Retro Fitness | — | |||||||||||||||||||||||||||||||||||||||||||||||||||||||||||||
| 216 | Larchmont Centre | Mount Laurel | NJ | Philadelphia-Camden-Wilmington, PA-NJ-DE-MD | 1985 | 103,787 | 94.5 | % | 1,357 | 31.54 | ShopRite | — | — | |||||||||||||||||||||||||||||||||||||||||||||||||||||||||||||
| 217 | Old Bridge Gateway | Old Bridge | NJ | New York-Newark-Jersey City, NY-NJ-PA | 2022 | 254,548 | 81.9 | % | 4,181 | 20.07 | Bhavani Food Market, TBA | Dollar Tree, Marshalls, Pep Boys, Petco, Texas Roadhouse | — | |||||||||||||||||||||||||||||||||||||||||||||||||||||||||||||
| 218 | Morris Hills Shopping Center | Parsippany | NJ | New York-Newark-Jersey City, NY-NJ-PA | 1994 | 159,561 | 78.5 | % | 2,654 | 21.19 | — | Blink Fitness (Equinox) | — | |||||||||||||||||||||||||||||||||||||||||||||||||||||||||||||
| 219 | Rio Grande Plaza | Rio Grande | NJ | Ocean City, NJ | 1997 | 136,351 | 98.2 | % | 1,806 | 13.48 | ShopRite* | Burlington Stores, Dollar Tree, PetSmart, Planet Fitness, Skechers | — | |||||||||||||||||||||||||||||||||||||||||||||||||||||||||||||
| 220 | Ocean Heights Plaza | Somers Point | NJ | Atlantic City-Hammonton, NJ | 2006 | 179,183 | 97.3 | % | 3,561 | 20.42 | ShopRite (Village Supermarket) | Staples | — | |||||||||||||||||||||||||||||||||||||||||||||||||||||||||||||
| 221 | Springfield Place | Springfield | NJ | New York-Newark-Jersey City, NY-NJ-PA | 1965 | 36,209 | 100.0 | % | 710 | 19.61 | ShopRite (Village Supermarket) | — | — | |||||||||||||||||||||||||||||||||||||||||||||||||||||||||||||
| 222 | Tinton Falls Plaza | Tinton Falls | NJ | New York-Newark-Jersey City, NY-NJ-PA | 2006 | 87,760 | 98.8 | % | 1,575 | 18.16 | Uncle Giuseppe's* | Dollar Tree, Jersey Strong | — | |||||||||||||||||||||||||||||||||||||||||||||||||||||||||||||
| 223 | Cross Keys Commons | Turnersville | NJ | Philadelphia-Camden-Wilmington, PA-NJ-DE-MD | 1989 | 216,205 | 100.0 | % | 3,889 | 17.99 | Walmart Supercenter* | Marshalls, Ross Dress for Less, Staples, Ulta | — | |||||||||||||||||||||||||||||||||||||||||||||||||||||||||||||
| 224 | Parkway Plaza | Carle Place | NY | New York-Newark-Jersey City, NY-NJ-PA | 1993 | 89,749 | 96.0 | % | 2,939 | 34.10 | ALDI | T.J.Maxx | — | |||||||||||||||||||||||||||||||||||||||||||||||||||||||||||||
| 225 | Suffolk Plaza | East Setauket | NY | New York-Newark-Jersey City, NY-NJ-PA | 1998 | 84,316 | 90.9 | % | 1,819 | 24.34 | TBA, BJ's Wholesale Club* | Five Below | Kohl's, Walmart | |||||||||||||||||||||||||||||||||||||||||||||||||||||||||||||
| 226 | Three Village Shopping Center | East Setauket | NY | New York-Newark-Jersey City, NY-NJ-PA | 1991 | 77,458 | 91.3 | % | 2,111 | 29.85 | Stop & Shop* | — | Walgreens | |||||||||||||||||||||||||||||||||||||||||||||||||||||||||||||
| 227 | West Center | East Setauket | NY | New York-Newark-Jersey City, NY-NJ-PA | 1965 | 42,594 | 98.9 | % | 1,244 | 29.53 | Wild by Nature Market (King Kullen) | — | — | |||||||||||||||||||||||||||||||||||||||||||||||||||||||||||||
| 228 | Stewart Plaza | Garden City | NY | New York-Newark-Jersey City, NY-NJ-PA | 2022 | 217,893 | 100.0 | % | 4,399 | 20.19 | — | Burlington Stores, Crazy Hot Deals, Dollar Tree, Floor & Décor, Phenix Salon Suites | — | |||||||||||||||||||||||||||||||||||||||||||||||||||||||||||||
| 229 | Dalewood I, II & III Shopping Center | Hartsdale | NY | New York-Newark-Jersey City, NY-NJ-PA | 2024 | 196,148 | 91.1 | % | 6,229 | 35.67 | H-Mart | Barnes & Noble, T.J.Maxx, Ulta | — | |||||||||||||||||||||||||||||||||||||||||||||||||||||||||||||
| 230 | Unity Plaza | Hopewell Junction | NY | Poughkeepsie-Newburgh-Middletown, NY | 2005 | 67,462 | 100.0 | % | 1,430 | 21.20 | Acme (Albertsons) | — | — | |||||||||||||||||||||||||||||||||||||||||||||||||||||||||||||
| 231 | Cayuga Mall | Ithaca | NY | Ithaca, NY | 1969 | 204,405 | 92.5 | % | 1,970 | 10.41 | ALDI | Big Lots, JOANN, Planet Fitness, True Value, VA Community Based Outpatient | — | |||||||||||||||||||||||||||||||||||||||||||||||||||||||||||||
| 232 | Kings Park Plaza | Kings Park | NY | New York-Newark-Jersey City, NY-NJ-PA | 1985 | 72,208 | 100.0 | % | 1,725 | 23.89 | Key Food Marketplace | T.J.Maxx | — | |||||||||||||||||||||||||||||||||||||||||||||||||||||||||||||
| 233 | Village Square Shopping Center | Larchmont | NY | New York-Newark-Jersey City, NY-NJ-PA | 1981 | 17,000 | 100.0 | % | 679 | 39.94 | Trader Joe's | — | — | |||||||||||||||||||||||||||||||||||||||||||||||||||||||||||||
| 234 | Falcaro's Plaza | Lawrence | NY | New York-Newark-Jersey City, NY-NJ-PA | 1972 | 61,904 | 100.0 | % | 1,567 | 25.31 | KolSave Market* | Dollar Tree, Planet Fitness | — | |||||||||||||||||||||||||||||||||||||||||||||||||||||||||||||
| 235 | Mamaroneck Centre | Mamaroneck | NY | New York-Newark-Jersey City, NY-NJ-PA | 2020 | 36,470 | 100.0 | % | 1,473 | 40.39 | North Shore Farms | CVS | — | |||||||||||||||||||||||||||||||||||||||||||||||||||||||||||||
| 236 | Sunshine Square | Medford | NY | New York-Newark-Jersey City, NY-NJ-PA | 2007 | 222,775 | 93.3 | % | 3,472 | 17.47 | Super Stop & Shop (Ahold Delhaize) | Lumber Liquidators, Planet Fitness, Savers | — | |||||||||||||||||||||||||||||||||||||||||||||||||||||||||||||
| 237 | Wallkill Plaza | Middletown | NY | Poughkeepsie-Newburgh-Middletown, NY | 1986 | 209,910 | 97.5 | % | 2,211 | 11.14 | — | Ashley Homestore, Big Lots, Citi Trends, David's Bridal, Hobby Lobby | — | |||||||||||||||||||||||||||||||||||||||||||||||||||||||||||||
| Supplemental Disclosure - Three Months Ended June 30, 2024 | Page 42 |
|
||||||
PROPERTY LIST |
||||||||||||||||||||||||||||||||||||||||||||||||||||||||||||||||||||||||||
Dollars in thousands, except per square foot amounts |
||||||||||||||||||||||||||||||||||||||||||||||||||||||||||||||||||||||||||
Year |
Percent |
Non-Owned |
||||||||||||||||||||||||||||||||||||||||||||||||||||||||||||||||||||||||
Property Name |
City |
State |
Core-Based Statistical Area | Built |
GLA |
Leased |
ABR |
ABR PSF |
Grocer (1) (4) | Other Major Tenants (4) | Major Tenants |
|||||||||||||||||||||||||||||||||||||||||||||||||||||||||||||||
| 238 | Monroe ShopRite Plaza | Monroe | NY | Poughkeepsie-Newburgh-Middletown, NY | 1985 | 122,007 | 100.0 | % | 2,083 | 17.07 | ShopRite (Wakefern) | Crazy Hot Deals, U.S. Post Office | — | |||||||||||||||||||||||||||||||||||||||||||||||||||||||||||||
| 239 | Rockland Plaza | Nanuet | NY | New York-Newark-Jersey City, NY-NJ-PA | 2006 | 251,589 | 98.1 | % | 5,690 | 24.82 | A Matter of Health | Barnes & Noble, Crazy Hot Deals, Jembro, Marshalls, Ulta | — | |||||||||||||||||||||||||||||||||||||||||||||||||||||||||||||
| 240 | North Ridge Shopping Center | New Rochelle | NY | New York-Newark-Jersey City, NY-NJ-PA | 1971 | 39,743 | 100.0 | % | 1,589 | 39.98 | — | — | — | |||||||||||||||||||||||||||||||||||||||||||||||||||||||||||||
| 241 | Nesconset Shopping Center | Port Jefferson Station | NY | New York-Newark-Jersey City, NY-NJ-PA | 1961 | 129,996 | 94.2 | % | 3,393 | 27.72 | — | Dollar Tree, HomeGoods | — | |||||||||||||||||||||||||||||||||||||||||||||||||||||||||||||
| 242 | Roanoke Plaza | Riverhead | NY | New York-Newark-Jersey City, NY-NJ-PA | 2002 | 99,131 | 100.0 | % | 2,132 | 21.51 | Fine Fare | CVS, T.J.Maxx | — | |||||||||||||||||||||||||||||||||||||||||||||||||||||||||||||
| 243 | The Shops at Riverhead | Riverhead | NY | New York-Newark-Jersey City, NY-NJ-PA | 2018 | 120,089 | 100.0 | % | 3,132 | 26.08 | Costco* | HomeSense, Marshalls, PetSmart, Ulta | — | |||||||||||||||||||||||||||||||||||||||||||||||||||||||||||||
| 244 | Rockville Centre | Rockville Centre | NY | New York-Newark-Jersey City, NY-NJ-PA | 1975 | 44,131 | 100.0 | % | 1,298 | 29.41 | — | HomeGoods | — | |||||||||||||||||||||||||||||||||||||||||||||||||||||||||||||
| 245 | College Plaza (3) | Selden | NY | New York-Newark-Jersey City, NY-NJ-PA | 2024 | 193,265 | 93.7 | % | 4,292 | 26.01 | ShopRite (Wakefern) | Burlington Stores, Five Below, Wren Kitchens | Firestone | |||||||||||||||||||||||||||||||||||||||||||||||||||||||||||||
| 246 | Campus Plaza | Vestal | NY | Binghamton, NY | 2003 | 160,744 | 98.0 | % | 2,138 | 13.58 | — | Dollar Tree, Staples | — | |||||||||||||||||||||||||||||||||||||||||||||||||||||||||||||
| 247 | Parkway Plaza | Vestal | NY | Binghamton, NY | 1995 | 207,123 | 100.0 | % | 2,451 | 11.83 | — | Boot Barn, JOANN, Kohl's, PetSmart, Ross Dress for Less | Target | |||||||||||||||||||||||||||||||||||||||||||||||||||||||||||||
| 248 | Shoppes at Vestal | Vestal | NY | Binghamton, NY | 2000 | 92,328 | 100.0 | % | 1,647 | 17.84 | — | HomeGoods, Michaels, Old Navy | — | |||||||||||||||||||||||||||||||||||||||||||||||||||||||||||||
| 249 | Town Square Mall (2) | Vestal | NY | Binghamton, NY | 1991 | 291,346 | 92.9 | % | 4,797 | 17.73 | Sam's Club*, Walmart Supercenter* | AMC, Barnes & Noble, Burlington Stores, DICK’S Sporting Goods Warehouse Sale, Dollar Tree, DSW, Shoe Carnival, T.J.Maxx, Ulta | — | |||||||||||||||||||||||||||||||||||||||||||||||||||||||||||||
| 250 | Highridge Plaza | Yonkers | NY | New York-Newark-Jersey City, NY-NJ-PA | 1977 | 88,501 | 95.8 | % | 2,953 | 34.83 | H-Mart | — | — | |||||||||||||||||||||||||||||||||||||||||||||||||||||||||||||
| 251 | Brunswick Town Center | Brunswick | OH | Cleveland-Elyria, OH | 2004 | 151,048 | 95.8 | % | 2,497 | 17.87 | Giant Eagle | — | The Home Depot | |||||||||||||||||||||||||||||||||||||||||||||||||||||||||||||
| 252 | Brentwood Plaza | Cincinnati | OH | Cincinnati, OH-KY-IN | 2004 | 227,738 | 98.7 | % | 2,795 | 18.48 | Kroger | Ace Hardware, Petco, Planet Fitness, Rainbow Shops | — | |||||||||||||||||||||||||||||||||||||||||||||||||||||||||||||
| 253 | Delhi Shopping Center | Cincinnati | OH | Cincinnati, OH-KY-IN | 1973 | 165,348 | 99.3 | % | 1,597 | 9.81 | Kroger | Pet Supplies Plus, Salvation Army | — | |||||||||||||||||||||||||||||||||||||||||||||||||||||||||||||
| 254 | Harpers Station | Cincinnati | OH | Cincinnati, OH-KY-IN | 1994 | 253,551 | 99.5 | % | 4,229 | 16.77 | Fresh Thyme Farmers Market (Meijer) | Esporta Fitness, HomeGoods, Painted Tree Marketplace, T.J.Maxx | — | |||||||||||||||||||||||||||||||||||||||||||||||||||||||||||||
| 255 | Western Hills Plaza | Cincinnati | OH | Cincinnati, OH-KY-IN | 2021 | 242,883 | 84.0 | % | 4,634 | 23.69 | — | Dollar Tree, Michaels, Old Navy, PetSmart, T.J.Maxx, Ulta | Target | |||||||||||||||||||||||||||||||||||||||||||||||||||||||||||||
| 256 | Western Village | Cincinnati | OH | Cincinnati, OH-KY-IN | 2005 | 115,791 | 100.0 | % | 1,343 | 38.21 | Kroger | — | — | |||||||||||||||||||||||||||||||||||||||||||||||||||||||||||||
| 257 | Crown Point | Columbus | OH | Columbus, OH | 1980 | 145,280 | 95.0 | % | 1,513 | 10.99 | Kroger | Dollar Tree, Planet Fitness | — | |||||||||||||||||||||||||||||||||||||||||||||||||||||||||||||
| 258 | Greentree Shopping Center | Columbus | OH | Columbus, OH | 2005 | 131,720 | 90.8 | % | 1,464 | 13.12 | Kroger | — | — | |||||||||||||||||||||||||||||||||||||||||||||||||||||||||||||
| 259 | South Towne Centre | Dayton | OH | Dayton-Kettering, OH | 1972 | 333,998 | 85.8 | % | 4,107 | 14.72 | Health Foods Unlimited | Burlington Stores, JOANN, Party City, PetSmart, Value City Furniture | — | |||||||||||||||||||||||||||||||||||||||||||||||||||||||||||||
| 260 | Southland Shopping Center | Middleburg Heights | OH | Cleveland-Elyria, OH | 1951 | 582,492 | 90.7 | % | 6,015 | 11.38 | Giant Eagle, Marc's, BJ's Wholesale Club* | Dollar Tree, Five Below, JOANN, Marshalls, OfficeMax, Party City, Petco, Treasure Hunt, UFC Gym | — | |||||||||||||||||||||||||||||||||||||||||||||||||||||||||||||
| 261 | The Shoppes at North Olmsted | North Olmsted | OH | Cleveland-Elyria, OH | 2002 | 70,003 | 100.0 | % | 1,226 | 17.51 | — | Ollie's Bargain Outlet, Sears Outlet | — | |||||||||||||||||||||||||||||||||||||||||||||||||||||||||||||
| 262 | Surrey Square Mall | Norwood | OH | Cincinnati, OH-KY-IN | 2010 | 175,140 | 100.0 | % | 2,575 | 28.35 | Kroger | Advance Auto Parts, Rainbow Shops | — | |||||||||||||||||||||||||||||||||||||||||||||||||||||||||||||
| 263 | Miracle Mile Shopping Plaza | Toledo | OH | Toledo, OH | 1955 | 298,765 | 82.9 | % | 1,869 | 13.21 | Kroger | Big Lots, Crunch Fitness, Dollar General, Harbor Freight Tools | — | |||||||||||||||||||||||||||||||||||||||||||||||||||||||||||||
| 264 | Village West | Allentown | PA | Allentown-Bethlehem-Easton, PA-NJ | 1999 | 140,474 | 98.7 | % | 2,876 | 20.74 | Giant Food (Ahold Delhaize) | CVS | — | |||||||||||||||||||||||||||||||||||||||||||||||||||||||||||||
| 265 | Park Hills Plaza | Altoona | PA | Altoona, PA | 1985 | 9,894 | 100.0 | % | 366 | 36.99 | Weis Markets* | — | Burlington Stores, Dunham's Sports, Harbor Freight Tools, Shoe Carnival, Urban Air Adventure Park | |||||||||||||||||||||||||||||||||||||||||||||||||||||||||||||
| 266 | Lehigh Shopping Center | Bethlehem | PA | Allentown-Bethlehem-Easton, PA-NJ | 1955 | 373,766 | 96.6 | % | 4,218 | 14.09 | Giant Food (Ahold Delhaize) | Big Lots, Citi Trends, Marshalls, PetSmart, Powerhouse Gym, Staples | — | |||||||||||||||||||||||||||||||||||||||||||||||||||||||||||||
| 267 | Bristol Park | Bristol | PA | Philadelphia-Camden-Wilmington, PA-NJ-DE-MD | 1993 | 260,953 | 98.5 | % | 3,122 | 12.46 | — | Ollie's Bargain Outlet, Planet Fitness | — | |||||||||||||||||||||||||||||||||||||||||||||||||||||||||||||
| 268 | Chalfont Village Shopping Center | Chalfont | PA | Philadelphia-Camden-Wilmington, PA-NJ-DE-MD | 1989 | 46,051 | 59.5 | % | 317 | 11.57 | — | — | — | |||||||||||||||||||||||||||||||||||||||||||||||||||||||||||||
| 269 | New Britain Village Square | Chalfont | PA | Philadelphia-Camden-Wilmington, PA-NJ-DE-MD | 1989 | 143,716 | 95.1 | % | 2,746 | 20.78 | Giant Food (Ahold Delhaize) | Wine & Spirits Shoppe | — | |||||||||||||||||||||||||||||||||||||||||||||||||||||||||||||
| 270 | Collegeville Shopping Center | Collegeville | PA | Philadelphia-Camden-Wilmington, PA-NJ-DE-MD | 2020 | 101,630 | 90.7 | % | 1,832 | 19.99 | Kimberton Whole Foods | — | — | |||||||||||||||||||||||||||||||||||||||||||||||||||||||||||||
| 271 | Plymouth Square Shopping Center | Conshohocken | PA | Philadelphia-Camden-Wilmington, PA-NJ-DE-MD | 2024 | 234,874 | 88.4 | % | 4,773 | 22.99 | Weis Markets | Planet Fitness, REI, Wren Kitchens | — | |||||||||||||||||||||||||||||||||||||||||||||||||||||||||||||
| 272 | Whitemarsh Shopping Center | Conshohocken | PA | Philadelphia-Camden-Wilmington, PA-NJ-DE-MD | 2002 | 76,391 | 100.0 | % | 2,234 | 29.24 | Giant Food (Ahold Delhaize) | — | — | |||||||||||||||||||||||||||||||||||||||||||||||||||||||||||||
| Supplemental Disclosure - Three Months Ended June 30, 2024 | Page 43 |
|
||||||
PROPERTY LIST |
||||||||||||||||||||||||||||||||||||||||||||||||||||||||||||||||||||||||||
Dollars in thousands, except per square foot amounts |
||||||||||||||||||||||||||||||||||||||||||||||||||||||||||||||||||||||||||
Year |
Percent |
Non-Owned |
||||||||||||||||||||||||||||||||||||||||||||||||||||||||||||||||||||||||
Property Name |
City |
State |
Core-Based Statistical Area | Built |
GLA |
Leased |
ABR |
ABR PSF |
Grocer (1) (4) | Other Major Tenants (4) | Major Tenants |
|||||||||||||||||||||||||||||||||||||||||||||||||||||||||||||||
| 273 | Valley Fair | Devon | PA | Philadelphia-Camden-Wilmington, PA-NJ-DE-MD | 2001 | 45,086 | 100.0 | % | 682 | 15.13 | Hung Vuong Food Market* | — | — | |||||||||||||||||||||||||||||||||||||||||||||||||||||||||||||
| 274 | Dickson City Crossings | Dickson City | PA | Scranton--Wilkes-Barre, PA | 2023 | 312,355 | 98.9 | % | 3,830 | 19.59 | — | Burlington Stores, Dollar Tree, Gabe's, JOANN, Party City, PetSmart, Sierra Trading Post, T.J.Maxx, The Home Depot | — | |||||||||||||||||||||||||||||||||||||||||||||||||||||||||||||
| 275 | Barn Plaza | Doylestown | PA | Philadelphia-Camden-Wilmington, PA-NJ-DE-MD | 2002 | 238,793 | 79.5 | % | 4,039 | 21.26 | Whole Foods Market (Amazon) | Barnes & Noble, Kohl's | — | |||||||||||||||||||||||||||||||||||||||||||||||||||||||||||||
| 276 | Pilgrim Gardens | Drexel Hill | PA | Philadelphia-Camden-Wilmington, PA-NJ-DE-MD | 1955 | 75,223 | 98.0 | % | 1,519 | 20.61 | — | Ross Dress for Less | — | |||||||||||||||||||||||||||||||||||||||||||||||||||||||||||||
| 277 | North Penn Market Place | Lansdale | PA | Philadelphia-Camden-Wilmington, PA-NJ-DE-MD | 1977 | 58,358 | 92.2 | % | 1,058 | 21.07 | Weis Markets* | DaVita Dialysis | — | |||||||||||||||||||||||||||||||||||||||||||||||||||||||||||||
| 278 | Village at Newtown | Newtown | PA | Philadelphia-Camden-Wilmington, PA-NJ-DE-MD | 2021 | 226,909 | 98.9 | % | 8,333 | 38.56 | McCaffrey's | Ulta | — | |||||||||||||||||||||||||||||||||||||||||||||||||||||||||||||
| 279 | Ivyridge | Philadelphia | PA | Philadelphia-Camden-Wilmington, PA-NJ-DE-MD | 1963 | 106,348 | 97.9 | % | 3,038 | 29.18 | — | Target | — | |||||||||||||||||||||||||||||||||||||||||||||||||||||||||||||
| 280 | Roosevelt Mall (3) | Philadelphia | PA | Philadelphia-Camden-Wilmington, PA-NJ-DE-MD | 2024 | 588,789 | 97.8 | % | 10,337 | 39.75 | Sprouts Farmers Market | JD Sports, LA Fitness, Macy's, Oak Street Health, Ross Dress for Less | — | |||||||||||||||||||||||||||||||||||||||||||||||||||||||||||||
| 281 | Shoppes at Valley Forge | Phoenixville | PA | Philadelphia-Camden-Wilmington, PA-NJ-DE-MD | 2003 | 176,676 | 100.0 | % | 1,680 | 9.51 | Redner's Warehouse Market | Big Lots, Ross Dress for Less | — | |||||||||||||||||||||||||||||||||||||||||||||||||||||||||||||
| 282 | County Line Plaza | Souderton | PA | Philadelphia-Camden-Wilmington, PA-NJ-DE-MD | 1971 | 154,608 | 95.1 | % | 1,719 | 11.69 | ALDI | Big Lots, Dollar Tree, Five Below, Planet Fitness | — | |||||||||||||||||||||||||||||||||||||||||||||||||||||||||||||
| 283 | 69th Street Plaza | Upper Darby | PA | Philadelphia-Camden-Wilmington, PA-NJ-DE-MD | 1994 | 41,711 | 100.0 | % | 473 | 11.34 | Fresh Grocer* | — | — | |||||||||||||||||||||||||||||||||||||||||||||||||||||||||||||
| 284 | Warminster Towne Center | Warminster | PA | Philadelphia-Camden-Wilmington, PA-NJ-DE-MD | 1997 | 237,152 | 100.0 | % | 4,062 | 18.58 | ShopRite (Wakefern) | Famous Footwear, Harbor Freight Tools, Old Navy, Party City, Pep Boys, PetSmart, Ross Dress for Less, Sportsman's Warehouse | Kohl's | |||||||||||||||||||||||||||||||||||||||||||||||||||||||||||||
| 285 | Shops at Prospect | West Hempfield | PA | Lancaster, PA | 1994 | 63,392 | 91.6 | % | 811 | 13.96 | Giant Food (Ahold Delhaize) | — | — | |||||||||||||||||||||||||||||||||||||||||||||||||||||||||||||
| 286 | Whitehall Square | Whitehall | PA | Allentown-Bethlehem-Easton, PA-NJ | 2006 | 309,908 | 98.9 | % | 3,537 | 11.76 | Redner's Warehouse Market | Decor Home Furniture, Dollar Tree, Gabe's, PetSmart, Ross Dress for Less, Staples | — | |||||||||||||||||||||||||||||||||||||||||||||||||||||||||||||
| 287 | Wilkes-Barre Township Marketplace | Wilkes-Barre | PA | Scranton--Wilkes-Barre, PA | 2004 | 306,440 | 100.0 | % | 2,723 | 35.97 | Walmart Supercenter | Chuck E. Cheese's, Cracker Barrel, Party City, Pet Supplies Plus | — | |||||||||||||||||||||||||||||||||||||||||||||||||||||||||||||
| 288 | Belfair Towne Village | Bluffton | SC | Hilton Head Island-Bluffton, SC | 2006 | 166,639 | 99.2 | % | 3,047 | 18.44 | Kroger | — | — | |||||||||||||||||||||||||||||||||||||||||||||||||||||||||||||
| 289 | Milestone Plaza | Greenville | SC | Greenville-Anderson, SC | 1995 | 89,721 | 98.5 | % | 1,686 | 20.25 | Lowes Foods (Alex Lee) | — | — | |||||||||||||||||||||||||||||||||||||||||||||||||||||||||||||
| 290 | Circle Center | Hilton Head Island | SC | Hilton Head Island-Bluffton, SC | 2000 | 65,313 | 27.8 | % | 440 | 24.23 | — | — | — | |||||||||||||||||||||||||||||||||||||||||||||||||||||||||||||
| 291 | Island Plaza | James Island | SC | Charleston-North Charleston, SC | 1994 | 174,094 | 100.0 | % | 1,892 | 11.01 | Food Lion (Ahold Delhaize) | Dollar Tree, Gold's Gym, Harbor Freight Tools | — | |||||||||||||||||||||||||||||||||||||||||||||||||||||||||||||
| 292 | Festival Centre | North Charleston | SC | Charleston-North Charleston, SC | 1987 | 325,347 | 72.7 | % | 2,509 | 10.76 | — | American Freight, NewSpring Church, Planet Fitness | — | |||||||||||||||||||||||||||||||||||||||||||||||||||||||||||||
| 293 | Pawleys Island Plaza | Pawleys Island | SC | Georgetown, SC | 2015 | 120,095 | 98.8 | % | 1,810 | 15.26 | Publix | Petco, T.J.Maxx, Ulta | — | |||||||||||||||||||||||||||||||||||||||||||||||||||||||||||||
| 294 | Fairview Corners I & II | Simpsonville | SC | Greenville-Anderson, SC | 2003 | 131,002 | 99.1 | % | 2,569 | 19.79 | — | Petco, Ross Dress for Less, T.J.Maxx | Target | |||||||||||||||||||||||||||||||||||||||||||||||||||||||||||||
| 295 | Hillcrest Market Place | Spartanburg | SC | Spartanburg, SC | 2023 | 376,980 | 94.1 | % | 4,927 | 14.22 | Publix | Five Below, Hobby Lobby, Marshalls, NCG Cinemas, Petco, Ross Dress for Less | — | |||||||||||||||||||||||||||||||||||||||||||||||||||||||||||||
| 296 | Watson Glen Shopping Center | Franklin | TN | Nashville-Davidson--Murfreesboro--Franklin, TN | 1988 | 265,571 | 100.0 | % | 3,606 | 13.75 | ALDI | At Home, Big Lots, HomeGoods | — | |||||||||||||||||||||||||||||||||||||||||||||||||||||||||||||
| 297 | Williamson Square | Franklin | TN | Nashville-Davidson--Murfreesboro--Franklin, TN | 1988 | 331,386 | 95.7 | % | 4,378 | 13.80 | — | Dollar Tree, Family Leisure, Goldfish Swim School, Hobby Lobby, Painted Tree Marketplace, Planet Fitness | — | |||||||||||||||||||||||||||||||||||||||||||||||||||||||||||||
| 298 | Greeneville Commons | Greeneville | TN | Greeneville, TN | 2002 | 224,139 | 100.0 | % | 2,260 | 10.20 | — | bealls, Belk, Hobby Lobby, Marshalls, Ross Dress for Less | — | |||||||||||||||||||||||||||||||||||||||||||||||||||||||||||||
| 299 | Kingston Overlook | Knoxville | TN | Knoxville, TN | 1996 | 119,360 | 100.0 | % | 1,020 | 8.55 | — | Badcock Home Furniture, Painted Tree Marketplace, Urban Air Adventure Park | — | |||||||||||||||||||||||||||||||||||||||||||||||||||||||||||||
| 300 | The Commons at Wolfcreek (2) | Memphis | TN | Memphis, TN-MS-AR | 2014 | 649,252 | 95.5 | % | 9,838 | 16.71 | — | Academy Sports + Outdoors, Best Buy, Big Lots, Burlington Stores, Citi Trends, Crazy Hot Deals, Dave & Busters, David's Bridal, Dollar Tree, DSW, Michaels, Office Depot, Old Navy, Painted Tree Marketplace, PetSmart, T.J.Maxx | Target, The Home Depot | |||||||||||||||||||||||||||||||||||||||||||||||||||||||||||||
| 301 | Georgetown Square | Murfreesboro | TN | Nashville-Davidson--Murfreesboro--Franklin, TN | 2003 | 114,117 | 95.8 | % | 1,527 | 13.96 | Kroger | — | — | |||||||||||||||||||||||||||||||||||||||||||||||||||||||||||||
| 302 | Nashboro Village | Nashville | TN | Nashville-Davidson--Murfreesboro--Franklin, TN | 1998 | 86,811 | 95.2 | % | 1,082 | 13.10 | Kroger | — | Walgreens | |||||||||||||||||||||||||||||||||||||||||||||||||||||||||||||
| 303 | Parmer Crossing | Austin | TX | Austin-Round Rock-Georgetown, TX | 1989 | 170,605 | 96.1 | % | 2,187 | 13.33 | Desi Brothers | Big Lots, Dollar Tree, Harbor Freight Tools, Planet Fitness | — | |||||||||||||||||||||||||||||||||||||||||||||||||||||||||||||
| 304 | Baytown Shopping Center | Baytown | TX | Houston-The Woodlands-Sugar Land, TX | 1987 | 95,941 | 97.8 | % | 1,650 | 17.58 | — | Goodwill, Sky Zone | — | |||||||||||||||||||||||||||||||||||||||||||||||||||||||||||||
| 305 | El Camino | Bellaire | TX | Houston-The Woodlands-Sugar Land, TX | 2008 | 71,651 | 100.0 | % | 739 | 10.31 | El Ahorro Supermarket | Dollar Tree, Family Dollar | — | |||||||||||||||||||||||||||||||||||||||||||||||||||||||||||||
| 306 | Townshire | Bryan | TX | College Station-Bryan, TX | 2002 | 136,887 | 85.2 | % | 940 | 8.06 | — | AlphaGraphics | — | |||||||||||||||||||||||||||||||||||||||||||||||||||||||||||||
| 307 | Central Station | College Station | TX | College Station-Bryan, TX | 1976 | 178,141 | 100.0 | % | 3,552 | 20.40 | — | Dollar Tree, HomeGoods, Party City, Spec's Liquors | Kohl's | |||||||||||||||||||||||||||||||||||||||||||||||||||||||||||||
| Supplemental Disclosure - Three Months Ended June 30, 2024 | Page 44 |
|
||||||
PROPERTY LIST |
||||||||||||||||||||||||||||||||||||||||||||||||||||||||||||||||||||||||||
Dollars in thousands, except per square foot amounts |
||||||||||||||||||||||||||||||||||||||||||||||||||||||||||||||||||||||||||
Year |
Percent |
Non-Owned |
||||||||||||||||||||||||||||||||||||||||||||||||||||||||||||||||||||||||
Property Name |
City |
State |
Core-Based Statistical Area | Built |
GLA |
Leased |
ABR |
ABR PSF |
Grocer (1) (4) | Other Major Tenants (4) | Major Tenants |
|||||||||||||||||||||||||||||||||||||||||||||||||||||||||||||||
| 308 | Rock Prairie Crossing | College Station | TX | College Station-Bryan, TX | 2002 | 118,700 | 100.0 | % | 1,539 | 29.23 | Kroger | CVS | — | |||||||||||||||||||||||||||||||||||||||||||||||||||||||||||||
| 309 | Carmel Village | Corpus Christi | TX | Corpus Christi, TX | 2019 | 84,667 | 87.6 | % | 1,265 | 17.06 | — | Crunch Fitness, Five Below | — | |||||||||||||||||||||||||||||||||||||||||||||||||||||||||||||
| 310 | Arboretum Village | Dallas | TX | Dallas-Fort Worth-Arlington, TX | 2014 | 95,354 | 95.2 | % | 2,422 | 26.67 | Tom Thumb (Albertsons) | Ace Hardware, PetSmart | — | |||||||||||||||||||||||||||||||||||||||||||||||||||||||||||||
| 311 | Claremont Village | Dallas | TX | Dallas-Fort Worth-Arlington, TX | 1976 | 66,980 | 100.0 | % | 1,352 | 20.40 | — | EOS Fitness | — | |||||||||||||||||||||||||||||||||||||||||||||||||||||||||||||
| 312 | Kessler Plaza | Dallas | TX | Dallas-Fort Worth-Arlington, TX | 1975 | 68,962 | 98.2 | % | 806 | 11.90 | — | Canales | — | |||||||||||||||||||||||||||||||||||||||||||||||||||||||||||||
| 313 | Stevens Park Village | Dallas | TX | Dallas-Fort Worth-Arlington, TX | 1974 | 45,492 | 100.0 | % | 525 | 11.54 | — | Big Lots | — | |||||||||||||||||||||||||||||||||||||||||||||||||||||||||||||
| 314 | Webb Royal Plaza | Dallas | TX | Dallas-Fort Worth-Arlington, TX | 1961 | 108,545 | 90.7 | % | 1,271 | 13.54 | El Rio Grande Latin Market | Family Dollar | — | |||||||||||||||||||||||||||||||||||||||||||||||||||||||||||||
| 315 | Wynnewood Village (3) | Dallas | TX | Dallas-Fort Worth-Arlington, TX | 2024 | 576,556 | 94.1 | % | 8,242 | 19.46 | El Rancho (Heritage Grocers), Kroger | Burlington Stores, Citi Trends, Dollar Tree, Five Below, Kids Empire, LA Fitness, Ross Dress for Less, South Oak Cliff Dialysis, Target | — | |||||||||||||||||||||||||||||||||||||||||||||||||||||||||||||
| 316 | Parktown | Deer Park | TX | Houston-The Woodlands-Sugar Land, TX | 1999 | 118,221 | 96.9 | % | 1,202 | 10.49 | Food Town | bealls, Walgreens | — | |||||||||||||||||||||||||||||||||||||||||||||||||||||||||||||
| 317 | Ridglea Plaza | Fort Worth | TX | Dallas-Fort Worth-Arlington, TX | 1990 | 170,519 | 100.0 | % | 2,066 | 12.12 | Tom Thumb (Albertsons) | Dollar Tree, Goody Goody Wine & Spirits | — | |||||||||||||||||||||||||||||||||||||||||||||||||||||||||||||
| 318 | Trinity Commons | Fort Worth | TX | Dallas-Fort Worth-Arlington, TX | 1998 | 197,526 | 96.2 | % | 4,390 | 23.11 | Tom Thumb (Albertsons) | DSW, Ulta | — | |||||||||||||||||||||||||||||||||||||||||||||||||||||||||||||
| 319 | Preston Ridge | Frisco | TX | Dallas-Fort Worth-Arlington, TX | 2018 | 788,584 | 99.4 | % | 18,208 | 23.22 | SuperTarget* | Best Buy, Big Lots, Boot Barn, DSW, Half Price Books, Macy's Backstage, Marshalls, Nordstrom Rack, Old Navy, Party City, PetSmart, pOpshelf, Ross Dress for Less, Sky Zone, Staples, T.J.Maxx, Ulta | — | |||||||||||||||||||||||||||||||||||||||||||||||||||||||||||||
| 320 | Village Plaza | Garland | TX | Dallas-Fort Worth-Arlington, TX | 2002 | 89,444 | 100.0 | % | 1,556 | 17.48 | Truong Nguyen Market | — | — | |||||||||||||||||||||||||||||||||||||||||||||||||||||||||||||
| 321 | Highland Village Town Center | Highland Village | TX | Dallas-Fort Worth-Arlington, TX | 1996 | 101,874 | 98.7 | % | 1,262 | 12.86 | — | Painted Tree Marketplace, Planet Fitness | — | |||||||||||||||||||||||||||||||||||||||||||||||||||||||||||||
| 322 | Bay Forest | Houston | TX | Houston-The Woodlands-Sugar Land, TX | 2004 | 71,667 | 95.3 | % | 744 | 10.90 | Kroger | — | — | |||||||||||||||||||||||||||||||||||||||||||||||||||||||||||||
| 323 | Beltway South | Houston | TX | Houston-The Woodlands-Sugar Land, TX | 1998 | 107,174 | 91.4 | % | 936 | 33.61 | Kroger | — | — | |||||||||||||||||||||||||||||||||||||||||||||||||||||||||||||
| 324 | Braes Heights | Houston | TX | Houston-The Woodlands-Sugar Land, TX | 2022 | 92,179 | 98.2 | % | 2,929 | 32.34 | — | CVS, My Salon Suites | — | |||||||||||||||||||||||||||||||||||||||||||||||||||||||||||||
| 325 | Braesgate | Houston | TX | Houston-The Woodlands-Sugar Land, TX | 1997 | 91,982 | 96.3 | % | 734 | 8.28 | Food Town | — | — | |||||||||||||||||||||||||||||||||||||||||||||||||||||||||||||
| 326 | Broadway | Houston | TX | Houston-The Woodlands-Sugar Land, TX | 2006 | 74,988 | 98.7 | % | 973 | 13.67 | El Ahorro Supermarket | Blink Fitness (Equinox), Melrose Fashions | — | |||||||||||||||||||||||||||||||||||||||||||||||||||||||||||||
| 327 | Clear Lake Camino South | Houston | TX | Houston-The Woodlands-Sugar Land, TX | 1964 | 106,058 | 68.7 | % | 1,054 | 15.84 | ALDI | Mr. Gatti's Pizza, Spec's Liquors | — | |||||||||||||||||||||||||||||||||||||||||||||||||||||||||||||
| 328 | Hearthstone Corners | Houston | TX | Houston-The Woodlands-Sugar Land, TX | 2019 | 208,147 | 97.8 | % | 2,513 | 12.34 | El Rancho (Heritage Grocers) | Big Lots, Conn's Home Plus, XL Parts | — | |||||||||||||||||||||||||||||||||||||||||||||||||||||||||||||
| 329 | Jester Village | Houston | TX | Houston-The Woodlands-Sugar Land, TX | 2022 | 62,665 | 93.7 | % | 1,335 | 22.74 | — | 24 Hour Fitness | — | |||||||||||||||||||||||||||||||||||||||||||||||||||||||||||||
| 330 | Jones Plaza (3) | Houston | TX | Houston-The Woodlands-Sugar Land, TX | 2024 | 111,206 | 90.5 | % | 1,189 | 11.81 | La Michoacana Supermarket | Aaron's, Fitness Connection | — | |||||||||||||||||||||||||||||||||||||||||||||||||||||||||||||
| 331 | Jones Square | Houston | TX | Houston-The Woodlands-Sugar Land, TX | 1999 | 169,786 | 96.8 | % | 1,657 | 10.08 | — | Big Lots, Hobby Lobby, King Dollar, Octapharma, Walgreens | — | |||||||||||||||||||||||||||||||||||||||||||||||||||||||||||||
| 332 | Maplewood | Houston | TX | Houston-The Woodlands-Sugar Land, TX | 2004 | 99,177 | 99.2 | % | 1,023 | 10.39 | Foodarama | bealls, Kids Empire | — | |||||||||||||||||||||||||||||||||||||||||||||||||||||||||||||
| 333 | Merchants Park | Houston | TX | Houston-The Woodlands-Sugar Land, TX | 2009 | 246,656 | 99.1 | % | 4,182 | 17.10 | Kroger | Big Lots, JD Sports, Petco, Planet Fitness, Ross Dress for Less | — | |||||||||||||||||||||||||||||||||||||||||||||||||||||||||||||
| 334 | Northgate | Houston | TX | Houston-The Woodlands-Sugar Land, TX | 1972 | 38,724 | 100.0 | % | 648 | 16.73 | El Rancho* | WSS | — | |||||||||||||||||||||||||||||||||||||||||||||||||||||||||||||
| 335 | Northshore (2) | Houston | TX | Houston-The Woodlands-Sugar Land, TX | 2001 | 232,654 | 97.1 | % | 3,402 | 15.28 | El Rancho (Heritage Grocers) | Conn's Home Plus, Dollar Tree, Kamada Plasma, Melrose Fashions, Nova Healthcare, Office Depot | — | |||||||||||||||||||||||||||||||||||||||||||||||||||||||||||||
| 336 | Northtown Plaza | Houston | TX | Houston-The Woodlands-Sugar Land, TX | 1960 | 190,529 | 96.3 | % | 2,600 | 14.36 | El Rancho (Heritage Grocers) | Crazy Boss Big Discount Store, dd's Discounts (Ross) | — | |||||||||||||||||||||||||||||||||||||||||||||||||||||||||||||
| 337 | Orange Grove | Houston | TX | Houston-The Woodlands-Sugar Land, TX | 2005 | 184,664 | 99.1 | % | 2,223 | 12.67 | — | 24 Hour Fitness, Burlington Stores, Floor & Décor, WSS | — | |||||||||||||||||||||||||||||||||||||||||||||||||||||||||||||
| 338 | Royal Oaks Village | Houston | TX | Houston-The Woodlands-Sugar Land, TX | 2001 | 146,279 | 91.6 | % | 3,441 | 25.69 | H-E-B | — | — | |||||||||||||||||||||||||||||||||||||||||||||||||||||||||||||
| 339 | Tanglewilde Center | Houston | TX | Houston-The Woodlands-Sugar Land, TX | 1998 | 82,623 | 84.9 | % | 1,209 | 17.23 | ALDI | Dollar Tree, Party City | — | |||||||||||||||||||||||||||||||||||||||||||||||||||||||||||||
| 340 | West U Marketplace | Houston | TX | Houston-The Woodlands-Sugar Land, TX | 2000 | 60,136 | 100.0 | % | 1,616 | 26.87 | Whole Foods Market (Amazon) | — | — | |||||||||||||||||||||||||||||||||||||||||||||||||||||||||||||
| 341 | Westheimer Commons | Houston | TX | Houston-The Woodlands-Sugar Land, TX | 1984 | 245,714 | 96.6 | % | 2,733 | 11.51 | Fiesta Mart (Chedraui USA) | King Dollar, Marshalls, Rainbow Shops, Retro Fitness, Sanitas Medical Center, Shoe Carnival, Walgreens | — | |||||||||||||||||||||||||||||||||||||||||||||||||||||||||||||
| 342 | Crossroads Centre - Pasadena | Pasadena | TX | Houston-The Woodlands-Sugar Land, TX | 1997 | 146,567 | 96.4 | % | 2,144 | 16.19 | Kroger | LA Fitness | — | |||||||||||||||||||||||||||||||||||||||||||||||||||||||||||||
| 343 | Spencer Square | Pasadena | TX | Houston-The Woodlands-Sugar Land, TX | 1998 | 181,888 | 99.0 | % | 2,079 | 11.54 | Kroger | bealls, Octapharma, Petco, Retro Fitness | — | |||||||||||||||||||||||||||||||||||||||||||||||||||||||||||||
| 344 | Pearland Plaza | Pearland | TX | Houston-The Woodlands-Sugar Land, TX | 1995 | 156,491 | 98.5 | % | 1,462 | 9.49 | Kroger | American Freight, Goodwill, Harbor Freight Tools, Walgreens | — | |||||||||||||||||||||||||||||||||||||||||||||||||||||||||||||
| Supplemental Disclosure - Three Months Ended June 30, 2024 | Page 45 |
|
||||||
PROPERTY LIST |
||||||||||||||||||||||||||||||||||||||||||||||||||||||||||||||||||||||||||
Dollars in thousands, except per square foot amounts |
||||||||||||||||||||||||||||||||||||||||||||||||||||||||||||||||||||||||||
Year |
Percent |
Non-Owned |
||||||||||||||||||||||||||||||||||||||||||||||||||||||||||||||||||||||||
Property Name |
City |
State |
Core-Based Statistical Area | Built |
GLA |
Leased |
ABR |
ABR PSF |
Grocer (1) (4) | Other Major Tenants (4) | Major Tenants |
|||||||||||||||||||||||||||||||||||||||||||||||||||||||||||||||
| 345 | Market Plaza | Plano | TX | Dallas-Fort Worth-Arlington, TX | 2002 | 147,500 | 88.7 | % | 2,935 | 23.41 | Central Market (H-E-B) | — | — | |||||||||||||||||||||||||||||||||||||||||||||||||||||||||||||
| 346 | Preston Park Village (3) | Plano | TX | Dallas-Fort Worth-Arlington, TX | 2024 | 256,379 | 81.5 | % | 5,756 | 27.54 | — | Gap Factory Store, HomeGoods, Petco | — | |||||||||||||||||||||||||||||||||||||||||||||||||||||||||||||
| 347 | Keegan's Meadow | Stafford | TX | Houston-The Woodlands-Sugar Land, TX | 1999 | 125,100 | 97.0 | % | 1,621 | 13.76 | El Rancho | Retro Fitness | — | |||||||||||||||||||||||||||||||||||||||||||||||||||||||||||||
| 348 | Lake Pointe Village | Sugar Land | TX | Houston-The Woodlands-Sugar Land, TX | 2010 | 162,263 | 87.8 | % | 4,321 | 30.32 | Whole Foods Market (Amazon) | — | — | |||||||||||||||||||||||||||||||||||||||||||||||||||||||||||||
| 349 | Texas City Bay | Texas City | TX | Houston-The Woodlands-Sugar Land, TX | 2005 | 224,884 | 93.5 | % | 2,498 | 12.07 | Kroger | Conn's Home Plus, Five Below, Harbor Freight Tools, Planet Fitness | — | |||||||||||||||||||||||||||||||||||||||||||||||||||||||||||||
| 350 | Windvale Center | The Woodlands | TX | Houston-The Woodlands-Sugar Land, TX | 2002 | 100,688 | 89.5 | % | 1,979 | 21.95 | — | Tesla | — | |||||||||||||||||||||||||||||||||||||||||||||||||||||||||||||
| 351 | Culpeper Town Square | Culpeper | VA | Washington-Arlington-Alexandria, DC-VA-MD-WV | 1999 | 132,882 | 79.1 | % | 1,036 | 9.85 | — | Goodwill, Ollie's Bargain Outlet, Tractor Supply Co. | — | |||||||||||||||||||||||||||||||||||||||||||||||||||||||||||||
| 352 | Hanover Square | Mechanicsville | VA | Richmond, VA | 1991 | 141,233 | 99.2 | % | 2,423 | 17.30 | — | Gold's Gym, Hobby Lobby | Kohl's | |||||||||||||||||||||||||||||||||||||||||||||||||||||||||||||
| 353 | Cave Spring Corners | Roanoke | VA | Roanoke, VA | 2005 | 144,942 | 100.0 | % | 1,356 | 15.75 | Kroger | Hamrick's | — | |||||||||||||||||||||||||||||||||||||||||||||||||||||||||||||
| 354 | Hunting Hills | Roanoke | VA | Roanoke, VA | 1989 | 166,207 | 100.0 | % | 1,577 | 9.49 | — | Dollar Tree, Kohl's, PetSmart | — | |||||||||||||||||||||||||||||||||||||||||||||||||||||||||||||
| 355 | Hilltop Plaza | Virginia Beach | VA | Virginia Beach-Norfolk-Newport News, VA-NC | 2010 | 150,014 | 99.8 | % | 3,354 | 22.63 | Trader Joe's | Five Below, JOANN, PetSmart, Ulta | — | |||||||||||||||||||||||||||||||||||||||||||||||||||||||||||||
| 356 | Rutland Plaza | Rutland | VT | Rutland, VT | 1997 | 223,314 | 98.6 | % | 2,253 | 10.24 | Market 32 (Northeast Grocery) | Planet Fitness, T.J.Maxx, Walmart | — | |||||||||||||||||||||||||||||||||||||||||||||||||||||||||||||
| 357 | Mequon Pavilions | Mequon | WI | Milwaukee-Waukesha, WI | 1967 | 218,392 | 97.1 | % | 3,709 | 17.50 | Sendik's Food Market | Marshalls, Sierra Trading Post, The Tile Shop | — | |||||||||||||||||||||||||||||||||||||||||||||||||||||||||||||
| 358 | Moorland Square Shopping Ctr | New Berlin | WI | Milwaukee-Waukesha, WI | 1990 | 98,303 | 98.7 | % | 1,057 | 10.89 | Pick 'n Save (Kroger) | — | — | |||||||||||||||||||||||||||||||||||||||||||||||||||||||||||||
| 359 | Paradise Pavilion | West Bend | WI | Milwaukee-Waukesha, WI | 2000 | 203,430 | 100.0 | % | 1,746 | 8.58 | — | Hobby Lobby, Kohl's | Big Lots, Five Below, HomeGoods, Sierra Trading Post | |||||||||||||||||||||||||||||||||||||||||||||||||||||||||||||
| 360 | Grand Central Plaza | Parkersburg | WV | Parkersburg-Vienna, WV | 1986 | 75,344 | 54.1 | % | 625 | 15.33 | — | Sportsman's Warehouse | — | |||||||||||||||||||||||||||||||||||||||||||||||||||||||||||||
TOTAL PORTFOLIO |
63,750,978 | 95.4 | % | $ | 987,681 | $ | 17.26 | |||||||||||||||||||||||||||||||||||||||||||||||||||||||||||||||||||
| (1) * Indicates grocer is not owned. | ||||||||||||||||||||||||||||||||||||||||||||||||||||||||||||||||||||||||||
| (2) Property is listed as two individual properties on Company website for marketing purposes. | ||||||||||||||||||||||||||||||||||||||||||||||||||||||||||||||||||||||||||
| (3) Indicates property is currently in redevelopment. | ||||||||||||||||||||||||||||||||||||||||||||||||||||||||||||||||||||||||||
| (4) Major Tenants exclude tenants that have ceased to operate prior to their lease expiration date. | ||||||||||||||||||||||||||||||||||||||||||||||||||||||||||||||||||||||||||
| Supplemental Disclosure - Three Months Ended June 30, 2024 | Page 46 |
|
||||||