
| American Homes 4 Rent | Maryland | 001-36013 | 46-1229660 | ||||||||
| American Homes 4 Rent, L.P. | Delaware | 333-221878-02 | 80-0860173 | ||||||||
| (State or other jurisdiction of incorporation) | (Commission File Number) | (IRS Employer Identification No.) | |||||||||
| ☐ | Written communications pursuant to Rule 425 under the Securities Act (17 CFR 230.425) | ||||
| ☐ | Soliciting material pursuant to Rule 14a-12 under the Exchange Act (17 CFR 240.14a-12) | ||||
| ☐ | Pre-commencement communications pursuant to Rule 14d-2(b) under the Exchange Act (17 CFR 240.14d-2(b)) | ||||
| ☐ | Pre-commencement communications pursuant to Rule 13e-4(c) under the Exchange Act (17 CFR 240.13e-4(c)) | ||||
| Title of each class | Trading symbols | Name of each exchange on which registered | ||||||||||||
| Class A common shares of beneficial interest, $.01 par value | AMH | New York Stock Exchange | ||||||||||||
| Series G perpetual preferred shares of beneficial interest, $.01 par value | AMH-G | New York Stock Exchange | ||||||||||||
| Series H perpetual preferred shares of beneficial interest, $.01 par value | AMH-H | New York Stock Exchange | ||||||||||||
| AMERICAN HOMES 4 RENT | |||||||||||
| By: | /s/ Sara Vogt-Lowell | ||||||||||
| Sara Vogt-Lowell | |||||||||||
| Chief Administrative Officer, Chief Legal Officer and Secretary | |||||||||||
| AMERICAN HOMES 4 RENT, L.P. | |||||||||||
By: |
American Homes 4 Rent, its General Partner |
||||||||||
| By: | /s/ Sara Vogt-Lowell | ||||||||||
| Sara Vogt-Lowell | |||||||||||
| Chief Administrative Officer, Chief Legal Officer and Secretary | |||||||||||

| Full Year 2025 | |||||||||||
| Previous Guidance | Current Guidance | ||||||||||
| Core FFO attributable to common share and unit holders | $1.84 - $1.88 | $1.86 - $1.88 | |||||||||
| Core FFO attributable to common share and unit holders growth | 4.0% - 6.2% | 5.1% - 6.2% | |||||||||
| Same-Home | |||||||||||
| Core revenues growth | 3.00% - 4.50% | 3.25% - 4.25% | |||||||||
| Core property operating expenses growth | 3.00% - 4.50% | 2.75% - 3.75% | |||||||||
| Core NOI growth | 2.75% - 4.75% | 3.50% - 4.50% | |||||||||
| Full Year 2025 (Unchanged) |
|||||||||||
| Investment Program | Properties | Investment | |||||||||
| Wholly owned acquisitions | — | — | |||||||||
| Wholly owned development deliveries | 1,800 - 2,000 | $700 - $800 million | |||||||||
| Development pipeline, pro rata share of JV and Property Enhancing Capex | — | $100 - $200 million | |||||||||
| Total capital investment (wholly owned and pro rata JV) | 1,800 - 2,000 | $0.8 - $1.0 billion | |||||||||
| Total gross capital investment (JVs at 100%) | 2,200 - 2,400 | $1.0 - $1.2 billion | |||||||||
| September 30, 2025 | December 31, 2024 | ||||||||||
| (Unaudited) | |||||||||||
| Assets | |||||||||||
| Single-family properties: | |||||||||||
| Land | $ | 2,404,153 | $ | 2,370,006 | |||||||
| Buildings and improvements | 11,930,388 | 11,559,461 | |||||||||
| Single-family properties in operation | 14,334,541 | 13,929,467 | |||||||||
| Less: accumulated depreciation | (3,298,648) | (3,048,868) | |||||||||
| Single-family properties in operation, net | 11,035,893 | 10,880,599 | |||||||||
| Single-family properties under development and development land | 1,215,323 | 1,272,284 | |||||||||
| Single-family properties and land held for sale, net | 219,637 | 212,808 | |||||||||
| Total real estate assets, net | 12,470,853 | 12,365,691 | |||||||||
| Cash and cash equivalents | 45,631 | 199,413 | |||||||||
| Restricted cash | 130,104 | 150,803 | |||||||||
| Rent and other receivables | 56,493 | 48,452 | |||||||||
| Escrow deposits, prepaid expenses and other assets | 268,120 | 337,379 | |||||||||
| Investments in unconsolidated joint ventures | 161,986 | 159,134 | |||||||||
| Goodwill | 120,279 | 120,279 | |||||||||
| Total assets | $ | 13,253,466 | $ | 13,381,151 | |||||||
| Liabilities | |||||||||||
| Revolving credit facility | $ | 110,000 | $ | — | |||||||
| Asset-backed securitizations, net | — | 924,344 | |||||||||
| Unsecured senior notes, net | 4,733,543 | 4,086,418 | |||||||||
| Accounts payable and accrued expenses | 571,956 | 521,759 | |||||||||
| Total liabilities | 5,415,499 | 5,532,521 | |||||||||
| Commitments and contingencies | |||||||||||
| Equity | |||||||||||
| Shareholders’ equity: | |||||||||||
Class A common shares ($0.01 par value per share, 450,000,000 shares authorized, 370,468,321 and 368,987,993 shares issued and outstanding at September 30, 2025 and December 31, 2024, respectively) |
3,705 | 3,690 | |||||||||
Class B common shares ($0.01 par value per share, 50,000,000 shares authorized, 635,075 shares issued and outstanding at September 30, 2025 and December 31, 2024) |
6 | 6 | |||||||||
Preferred shares ($0.01 par value per share, 100,000,000 shares authorized, 9,200,000 shares issued and outstanding at September 30, 2025 and December 31, 2024) |
92 | 92 | |||||||||
| Additional paid-in capital | 7,550,962 | 7,529,008 | |||||||||
| Accumulated deficit | (400,445) | (380,632) | |||||||||
| Accumulated other comprehensive income | 6,944 | 7,852 | |||||||||
| Total shareholders’ equity | 7,161,264 | 7,160,016 | |||||||||
| Noncontrolling interest | 676,703 | 688,614 | |||||||||
| Total equity | 7,837,967 | 7,848,630 | |||||||||
| Total liabilities and equity | $ | 13,253,466 | $ | 13,381,151 | |||||||
| For the Three Months Ended September 30, |
For the Nine Months Ended September 30, |
||||||||||||||||||||||
| 2025 | 2024 | 2025 | 2024 | ||||||||||||||||||||
| Rents and other single-family property revenues | $ | 478,464 | $ | 445,055 | $ | 1,395,243 | $ | 1,292,104 | |||||||||||||||
| Expenses: | |||||||||||||||||||||||
| Property operating expenses | 181,604 | 172,031 | 509,223 | 477,428 | |||||||||||||||||||
| Property management expenses | 33,384 | 31,973 | 101,977 | 95,757 | |||||||||||||||||||
| General and administrative expense | 20,503 | 19,247 | 60,182 | 62,825 | |||||||||||||||||||
| Interest expense | 48,199 | 43,611 | 139,928 | 120,866 | |||||||||||||||||||
| Acquisition and other transaction costs | 3,661 | 2,605 | 9,377 | 8,866 | |||||||||||||||||||
| Depreciation and amortization | 126,656 | 119,691 | 378,523 | 353,020 | |||||||||||||||||||
| Hurricane-related charges, net | — | 3,904 | — | 3,904 | |||||||||||||||||||
| Total expenses | 414,007 | 393,062 | 1,199,210 | 1,122,666 | |||||||||||||||||||
| Gain on sale and impairment of single-family properties and other, net | 47,620 | 32,697 | 161,544 | 145,490 | |||||||||||||||||||
| Loss on early extinguishment of debt | (180) | (5,306) | (396) | (6,323) | |||||||||||||||||||
| Other income and expense, net | 4,904 | 8,256 | 11,957 | 15,664 | |||||||||||||||||||
| Net income | 116,801 | 87,640 | 369,138 | 324,269 | |||||||||||||||||||
| Noncontrolling interest | 13,618 | 10,333 | 43,458 | 38,559 | |||||||||||||||||||
| Dividends on preferred shares | 3,486 | 3,486 | 10,458 | 10,458 | |||||||||||||||||||
| Net income attributable to common shareholders | $ | 99,697 | $ | 73,821 | $ | 315,222 | $ | 275,252 | |||||||||||||||
| Weighted-average common shares outstanding: | |||||||||||||||||||||||
| Basic | 371,248,842 | 366,981,466 | 370,721,279 | 366,757,369 | |||||||||||||||||||
| Diluted | 371,580,911 | 367,600,636 | 371,084,326 | 367,294,979 | |||||||||||||||||||
| Net income attributable to common shareholders per share: | |||||||||||||||||||||||
| Basic | $ | 0.27 | $ | 0.20 | $ | 0.85 | $ | 0.75 | |||||||||||||||
| Diluted | $ | 0.27 | $ | 0.20 | $ | 0.85 | $ | 0.75 | |||||||||||||||
| For the Three Months Ended September 30, |
For the Nine Months Ended September 30, |
||||||||||||||||||||||
| 2025 | 2024 | 2025 | 2024 | ||||||||||||||||||||
| (Unaudited) | (Unaudited) | (Unaudited) | (Unaudited) | ||||||||||||||||||||
| Net income attributable to common shareholders | $ | 99,697 | $ | 73,821 | $ | 315,222 | $ | 275,252 | |||||||||||||||
| Adjustments: | |||||||||||||||||||||||
| Noncontrolling interests in the Operating Partnership | 13,618 | 10,333 | 43,458 | 38,559 | |||||||||||||||||||
| Gain on sale and impairment of single-family properties and other, net | (47,620) | (32,697) | (161,544) | (145,490) | |||||||||||||||||||
| Adjustments for unconsolidated real estate joint ventures | 1,918 | 1,116 | 5,223 | 3,909 | |||||||||||||||||||
| Depreciation and amortization | 126,656 | 119,691 | 378,523 | 353,020 | |||||||||||||||||||
| Less: depreciation and amortization of non-real estate assets | (5,696) | (4,930) | (16,572) | (14,354) | |||||||||||||||||||
| FFO attributable to common share and unit holders | $ | 188,573 | $ | 167,334 | $ | 564,310 | $ | 510,896 | |||||||||||||||
| Adjustments: | |||||||||||||||||||||||
| Acquisition, other transaction costs and other | 3,158 | 2,605 | 8,693 | 8,866 | |||||||||||||||||||
| Noncash share-based compensation - general and administrative | 3,917 | 3,601 | 12,771 | 17,999 | |||||||||||||||||||
| Noncash share-based compensation - property management | 864 | 1,043 | 3,247 | 3,827 | |||||||||||||||||||
| Hurricane-related charges, net | — | 3,904 | — | 3,904 | |||||||||||||||||||
| Loss on early extinguishment of debt | 180 | 5,306 | 396 | 6,323 | |||||||||||||||||||
| Core FFO attributable to common share and unit holders | $ | 196,692 | $ | 183,793 | $ | 589,417 | $ | 551,815 | |||||||||||||||
| Recurring Capital Expenditures | (20,399) | (23,088) | (57,743) | (58,615) | |||||||||||||||||||
| Leasing costs | (765) | (995) | (3,102) | (2,832) | |||||||||||||||||||
| Adjusted FFO attributable to common share and unit holders | $ | 175,528 | $ | 159,710 | $ | 528,572 | $ | 490,368 | |||||||||||||||
| Common distributions | (126,610) | (109,133) | (380,899) | (327,670) | |||||||||||||||||||
| Retained Cash Flow | $ | 48,918 | $ | 50,577 | $ | 147,673 | $ | 162,698 | |||||||||||||||
| Per FFO share and unit: | |||||||||||||||||||||||
| FFO attributable to common share and unit holders | $ | 0.45 | $ | 0.40 | $ | 1.34 | $ | 1.22 | |||||||||||||||
| Core FFO attributable to common share and unit holders | $ | 0.47 | $ | 0.44 | $ | 1.39 | $ | 1.32 | |||||||||||||||
| Adjusted FFO attributable to common share and unit holders | $ | 0.42 | $ | 0.38 | $ | 1.25 | $ | 1.17 | |||||||||||||||
| Weighted-average FFO shares and units: | |||||||||||||||||||||||
| Common shares outstanding | 371,248,842 | 366,981,466 | 370,721,279 | 366,757,369 | |||||||||||||||||||
Share-based compensation plan and forward sale equity contracts (1) |
632,730 | 1,015,421 | 695,497 | 927,581 | |||||||||||||||||||
| Operating partnership units | 50,732,415 | 51,376,980 | 51,110,313 | 51,376,980 | |||||||||||||||||||
| Total weighted-average FFO shares and units | 422,613,987 | 419,373,867 | 422,527,089 | 419,061,930 | |||||||||||||||||||
| For the Three Months Ended September 30, |
For the Nine Months Ended September 30, |
||||||||||||||||||||||
| 2025 | 2024 | 2025 | 2024 | ||||||||||||||||||||
| (Unaudited) | (Unaudited) | (Unaudited) | (Unaudited) | ||||||||||||||||||||
| Net income per common share–diluted | $ | 0.27 | $ | 0.20 | $ | 0.85 | $ | 0.75 | |||||||||||||||
| Adjustments: | |||||||||||||||||||||||
| Conversion from GAAP share count | (0.03) | (0.02) | (0.10) | (0.09) | |||||||||||||||||||
| Noncontrolling interests in the Operating Partnership | 0.03 | 0.02 | 0.10 | 0.09 | |||||||||||||||||||
| Gain on sale and impairment of single-family properties and other, net | (0.11) | (0.08) | (0.38) | (0.35) | |||||||||||||||||||
| Adjustments for unconsolidated real estate joint ventures | — | — | 0.01 | 0.01 | |||||||||||||||||||
| Depreciation and amortization | 0.30 | 0.29 | 0.90 | 0.84 | |||||||||||||||||||
| Less: depreciation and amortization of non-real estate assets | (0.01) | (0.01) | (0.04) | (0.03) | |||||||||||||||||||
| FFO attributable to common share and unit holders | $ | 0.45 | $ | 0.40 | $ | 1.34 | $ | 1.22 | |||||||||||||||
| Adjustments: | |||||||||||||||||||||||
| Acquisition, other transaction costs and other | 0.01 | 0.01 | 0.01 | 0.02 | |||||||||||||||||||
| Noncash share-based compensation - general and administrative | 0.01 | 0.01 | 0.03 | 0.04 | |||||||||||||||||||
| Noncash share-based compensation - property management | — | — | 0.01 | 0.01 | |||||||||||||||||||
| Hurricane-related charges, net | — | 0.01 | — | 0.01 | |||||||||||||||||||
| Loss on early extinguishment of debt | — | 0.01 | — | 0.02 | |||||||||||||||||||
| Core FFO attributable to common share and unit holders | $ | 0.47 | $ | 0.44 | $ | 1.39 | $ | 1.32 | |||||||||||||||
| Recurring Capital Expenditures | (0.05) | (0.06) | (0.13) | (0.14) | |||||||||||||||||||
| Leasing costs | — | — | (0.01) | (0.01) | |||||||||||||||||||
| Adjusted FFO attributable to common share and unit holders | $ | 0.42 | $ | 0.38 | $ | 1.25 | $ | 1.17 | |||||||||||||||
| For the Three Months Ended September 30, |
For the Nine Months Ended September 30, |
||||||||||||||||||||||
| 2025 | 2024 | 2025 | 2024 | ||||||||||||||||||||
| (Unaudited) | (Unaudited) | (Unaudited) | (Unaudited) | ||||||||||||||||||||
| Core revenues and Same-Home core revenues | |||||||||||||||||||||||
| Rents and other single-family property revenues | $ | 478,464 | $ | 445,055 | $ | 1,395,243 | $ | 1,292,104 | |||||||||||||||
| Tenant charge-backs | (72,843) | (67,615) | (189,161) | (172,323) | |||||||||||||||||||
| Core revenues | 405,621 | 377,440 | 1,206,082 | 1,119,781 | |||||||||||||||||||
| Less: Non-Same-Home core revenues | (47,795) | (32,705) | (138,545) | (94,991) | |||||||||||||||||||
| Same-Home core revenues | $ | 357,826 | $ | 344,735 | $ | 1,067,537 | $ | 1,024,790 | |||||||||||||||
| Core property operating expenses and Same-Home core property operating expenses | |||||||||||||||||||||||
| Property operating expenses | $ | 181,604 | $ | 172,031 | $ | 509,223 | $ | 477,428 | |||||||||||||||
| Property management expenses | 33,384 | 31,973 | 101,977 | 95,757 | |||||||||||||||||||
| Noncash share-based compensation - property management | (864) | (1,043) | (3,247) | (3,827) | |||||||||||||||||||
| Expenses reimbursed by tenant charge-backs | (72,843) | (67,615) | (189,161) | (172,323) | |||||||||||||||||||
| Core property operating expenses | 141,281 | 135,346 | 418,792 | 397,035 | |||||||||||||||||||
| Less: Non-Same-Home core property operating expenses | (18,244) | (15,169) | (54,176) | (43,918) | |||||||||||||||||||
| Same-Home core property operating expenses | $ | 123,037 | $ | 120,177 | $ | 364,616 | $ | 353,117 | |||||||||||||||
| Core NOI and Same-Home Core NOI | |||||||||||||||||||||||
| Net income | $ | 116,801 | $ | 87,640 | $ | 369,138 | $ | 324,269 | |||||||||||||||
| Hurricane-related charges, net | — | 3,904 | — | 3,904 | |||||||||||||||||||
| Loss on early extinguishment of debt | 180 | 5,306 | 396 | 6,323 | |||||||||||||||||||
| Gain on sale and impairment of single-family properties and other, net | (47,620) | (32,697) | (161,544) | (145,490) | |||||||||||||||||||
| Depreciation and amortization | 126,656 | 119,691 | 378,523 | 353,020 | |||||||||||||||||||
| Acquisition and other transaction costs | 3,661 | 2,605 | 9,377 | 8,866 | |||||||||||||||||||
| Noncash share-based compensation - property management | 864 | 1,043 | 3,247 | 3,827 | |||||||||||||||||||
| Interest expense | 48,199 | 43,611 | 139,928 | 120,866 | |||||||||||||||||||
| General and administrative expense | 20,503 | 19,247 | 60,182 | 62,825 | |||||||||||||||||||
| Other income and expense, net | (4,904) | (8,256) | (11,957) | (15,664) | |||||||||||||||||||
| Core NOI | 264,340 | 242,094 | 787,290 | 722,746 | |||||||||||||||||||
| Less: Non-Same-Home Core NOI | (29,551) | (17,536) | (84,369) | (51,073) | |||||||||||||||||||
| Same-Home Core NOI | $ | 234,789 | $ | 224,558 | $ | 702,921 | $ | 671,673 | |||||||||||||||

| AMH | ||||||||
| Summary | |||||
| Financial Information | |||||
| Property and Other Information | |||||
2 |
||||||||
| AMH | ||||||||
| Refer to “Defined Terms and Non-GAAP Reconciliations” for definitions of metrics and reconciliations to GAAP. | 3 |
|||||||
| AMH | ||||||||
| Refer to “Defined Terms and Non-GAAP Reconciliations” for definitions of metrics and reconciliations to GAAP. | 4 |
|||||||
| AMH | ||||||||
| Refer to “Defined Terms and Non-GAAP Reconciliations” for definitions of metrics and reconciliations to GAAP. | 5 |
|||||||
| AMH | ||||||||
| Full Year 2025 | |||||||||||
| Previous Guidance | Current Guidance | ||||||||||
| Core FFO attributable to common share and unit holders | $1.84 - $1.88 | $1.86 - $1.88 | |||||||||
| Core FFO attributable to common share and unit holders growth | 4.0% - 6.2% | 5.1% - 6.2% | |||||||||
| Same-Home | |||||||||||
| Core revenues growth | 3.00% - 4.50% | 3.25% - 4.25% | |||||||||
| Core property operating expenses growth | 3.00% - 4.50% | 2.75% - 3.75% | |||||||||
| Core NOI growth | 2.75% - 4.75% | 3.50% - 4.50% | |||||||||
| Full Year 2025 (Unchanged) |
|||||||||||
| Investment Program | Properties | Investment | |||||||||
| Wholly owned acquisitions | — | — | |||||||||
| Wholly owned development deliveries | 1,800 - 2,000 | $700 - $800 million | |||||||||
| Development pipeline, pro rata share of JV and Property Enhancing Capex | — | $100 - $200 million | |||||||||
| Total capital investment (wholly owned and pro rata JV) | 1,800 - 2,000 | $0.8 - $1.0 billion | |||||||||
| Total gross capital investment (JVs at 100%) | 2,200 - 2,400 | $1.0 - $1.2 billion | |||||||||
| Refer to “Defined Terms and Non-GAAP Reconciliations” for definitions of metrics and reconciliations to GAAP. | 6 |
|||||||
| AMH | ||||||||
| Refer to “Defined Terms and Non-GAAP Reconciliations” for definitions of metrics and reconciliations to GAAP. | 7 |
|||||||
| AMH | ||||||||
| For the Three Months Ended Sep 30, |
For the Nine Months Ended Sep 30, |
||||||||||||||||||||||
| 2025 | 2024 | 2025 | 2024 | ||||||||||||||||||||
| Core revenues and Same-Home core revenues | |||||||||||||||||||||||
| Rents and other single-family property revenues | $ | 478,464 | $ | 445,055 | $ | 1,395,243 | $ | 1,292,104 | |||||||||||||||
| Tenant charge-backs | (72,843) | (67,615) | (189,161) | (172,323) | |||||||||||||||||||
| Core revenues | 405,621 | 377,440 | 1,206,082 | 1,119,781 | |||||||||||||||||||
| Less: Non-Same-Home core revenues | (47,795) | (32,705) | (138,545) | (94,991) | |||||||||||||||||||
| Same-Home core revenues | $ | 357,826 | $ | 344,735 | $ | 1,067,537 | $ | 1,024,790 | |||||||||||||||
| Core property operating expenses and Same-Home core property operating expenses | |||||||||||||||||||||||
| Property operating expenses | $ | 181,604 | $ | 172,031 | $ | 509,223 | $ | 477,428 | |||||||||||||||
| Property management expenses | 33,384 | 31,973 | 101,977 | 95,757 | |||||||||||||||||||
| Noncash share-based compensation - property management | (864) | (1,043) | (3,247) | (3,827) | |||||||||||||||||||
| Expenses reimbursed by tenant charge-backs | (72,843) | (67,615) | (189,161) | (172,323) | |||||||||||||||||||
| Core property operating expenses | 141,281 | 135,346 | 418,792 | 397,035 | |||||||||||||||||||
| Less: Non-Same-Home core property operating expenses | (18,244) | (15,169) | (54,176) | (43,918) | |||||||||||||||||||
| Same-Home core property operating expenses | $ | 123,037 | $ | 120,177 | $ | 364,616 | $ | 353,117 | |||||||||||||||
| Core NOI and Same-Home Core NOI | |||||||||||||||||||||||
| Net income | $ | 116,801 | $ | 87,640 | $ | 369,138 | $ | 324,269 | |||||||||||||||
| Hurricane-related charges, net | — | 3,904 | — | 3,904 | |||||||||||||||||||
| Loss on early extinguishment of debt | 180 | 5,306 | 396 | 6,323 | |||||||||||||||||||
| Gain on sale and impairment of single-family properties and other, net | (47,620) | (32,697) | (161,544) | (145,490) | |||||||||||||||||||
| Depreciation and amortization | 126,656 | 119,691 | 378,523 | 353,020 | |||||||||||||||||||
| Acquisition and other transaction costs | 3,661 | 2,605 | 9,377 | 8,866 | |||||||||||||||||||
| Noncash share-based compensation - property management | 864 | 1,043 | 3,247 | 3,827 | |||||||||||||||||||
| Interest expense | 48,199 | 43,611 | 139,928 | 120,866 | |||||||||||||||||||
| General and administrative expense | 20,503 | 19,247 | 60,182 | 62,825 | |||||||||||||||||||
| Other income and expense, net | (4,904) | (8,256) | (11,957) | (15,664) | |||||||||||||||||||
| Core NOI | 264,340 | 242,094 | 787,290 | 722,746 | |||||||||||||||||||
| Less: Non-Same-Home Core NOI | (29,551) | (17,536) | (84,369) | (51,073) | |||||||||||||||||||
| Same-Home Core NOI | $ | 234,789 | $ | 224,558 | $ | 702,921 | $ | 671,673 | |||||||||||||||
| Refer to “Defined Terms and Non-GAAP Reconciliations” for definitions of metrics and reconciliations to GAAP. | 8 |
|||||||
| AMH | ||||||||
| For the Three Months Ended | |||||||||||||||||||||||||||||
| Sep 30, 2025 |
Jun 30, 2025 |
Mar 31, 2025 |
Dec 31, 2024 |
Sep 30, 2024 |
|||||||||||||||||||||||||
| Core revenues and Same-Home core revenues | |||||||||||||||||||||||||||||
| Rents and other single-family property revenues | $ | 478,464 | $ | 457,503 | $ | 459,276 | $ | 436,593 | $ | 445,055 | |||||||||||||||||||
| Tenant charge-backs | (72,843) | (52,457) | (63,861) | (49,108) | (67,615) | ||||||||||||||||||||||||
| Core revenues | 405,621 | 405,046 | 395,415 | 387,485 | 377,440 | ||||||||||||||||||||||||
| Less: Non-Same-Home core revenues | (47,795) | (46,830) | (43,920) | (41,750) | (32,705) | ||||||||||||||||||||||||
| Same-Home core revenues | $ | 357,826 | $ | 358,216 | $ | 351,495 | $ | 345,735 | $ | 344,735 | |||||||||||||||||||
| Core property operating expenses and Same-Home core property operating expenses | |||||||||||||||||||||||||||||
| Property operating expenses | $ | 181,604 | $ | 160,089 | $ | 167,530 | $ | 148,455 | $ | 172,031 | |||||||||||||||||||
| Property management expenses | 33,384 | 34,412 | 34,181 | 33,564 | 31,973 | ||||||||||||||||||||||||
| Noncash share-based compensation - property management | (864) | (1,137) | (1,246) | (987) | (1,043) | ||||||||||||||||||||||||
| Expenses reimbursed by tenant charge-backs | (72,843) | (52,457) | (63,861) | (49,108) | (67,615) | ||||||||||||||||||||||||
| Core property operating expenses | 141,281 | 140,907 | 136,604 | 131,924 | 135,346 | ||||||||||||||||||||||||
| Less: Non-Same-Home core property operating expenses | (18,244) | (18,287) | (17,645) | (16,300) | (15,169) | ||||||||||||||||||||||||
| Same-Home core property operating expenses | $ | 123,037 | $ | 122,620 | $ | 118,959 | $ | 115,624 | $ | 120,177 | |||||||||||||||||||
| Core NOI and Same-Home Core NOI | |||||||||||||||||||||||||||||
| Net income | $ | 116,801 | $ | 123,624 | $ | 128,713 | $ | 143,873 | $ | 87,640 | |||||||||||||||||||
| Hurricane-related charges, net | — | — | — | 4,980 | 3,904 | ||||||||||||||||||||||||
| Loss on early extinguishment of debt | 180 | — | 216 | — | 5,306 | ||||||||||||||||||||||||
| Gain on sale and impairment of single-family properties and other, net | (47,620) | (51,908) | (62,016) | (80,266) | (32,697) | ||||||||||||||||||||||||
| Depreciation and amortization | 126,656 | 126,939 | 124,928 | 123,990 | 119,691 | ||||||||||||||||||||||||
| Acquisition and other transaction costs | 3,661 | 2,655 | 3,061 | 3,326 | 2,605 | ||||||||||||||||||||||||
| Noncash share-based compensation - property management | 864 | 1,137 | 1,246 | 987 | 1,043 | ||||||||||||||||||||||||
| Interest expense | 48,199 | 46,303 | 45,426 | 44,485 | 43,611 | ||||||||||||||||||||||||
| General and administrative expense | 20,503 | 20,008 | 19,671 | 20,765 | 19,247 | ||||||||||||||||||||||||
| Other income and expense, net | (4,904) | (4,619) | (2,434) | (6,579) | (8,256) | ||||||||||||||||||||||||
| Core NOI | 264,340 | 264,139 | 258,811 | 255,561 | 242,094 | ||||||||||||||||||||||||
| Less: Non-Same-Home Core NOI | (29,551) | (28,543) | (26,275) | (25,450) | (17,536) | ||||||||||||||||||||||||
| Same-Home Core NOI | $ | 234,789 | $ | 235,596 | $ | 232,536 | $ | 230,111 | $ | 224,558 | |||||||||||||||||||
| Refer to “Defined Terms and Non-GAAP Reconciliations” for definitions of metrics and reconciliations to GAAP. | 9 |
|||||||
| AMH | ||||||||
| For the Three Months Ended Sep 30, |
For the Nine Months Ended Sep 30, |
||||||||||||||||||||||
| 2025 | 2024 | 2025 | 2024 | ||||||||||||||||||||
| Operating Data | |||||||||||||||||||||||
| Net income attributable to common shareholders | $ | 99,697 | $ | 73,821 | $ | 315,222 | $ | 275,252 | |||||||||||||||
| Core revenues | $ | 405,621 | $ | 377,440 | $ | 1,206,082 | $ | 1,119,781 | |||||||||||||||
| Core NOI | $ | 264,340 | $ | 242,094 | $ | 787,290 | $ | 722,746 | |||||||||||||||
| Core NOI margin | 65.2 | % | 64.1 | % | 65.3 | % | 64.5 | % | |||||||||||||||
| Fully Adjusted EBITDAre | $ | 232,909 | $ | 211,737 | $ | 695,530 | $ | 636,046 | |||||||||||||||
| Fully Adjusted EBITDAre Margin | 56.9 | % | 55.5 | % | 57.2 | % | 56.3 | % | |||||||||||||||
| Per FFO share and unit: | |||||||||||||||||||||||
| FFO attributable to common share and unit holders | $ | 0.45 | $ | 0.40 | $ | 1.34 | $ | 1.22 | |||||||||||||||
| Core FFO attributable to common share and unit holders | $ | 0.47 | $ | 0.44 | $ | 1.39 | $ | 1.32 | |||||||||||||||
| Adjusted FFO attributable to common share and unit holders | $ | 0.42 | $ | 0.38 | $ | 1.25 | $ | 1.17 | |||||||||||||||
| Sep 30, 2025 |
Jun 30, 2025 |
Mar 31, 2025 |
Dec 31, 2024 |
Sep 30, 2024 |
|||||||||||||||||||||||||
| Selected Balance Sheet Information - end of period | |||||||||||||||||||||||||||||
| Single-family properties in operation, net | $ | 11,035,893 | $ | 10,947,696 | $ | 10,932,960 | $ | 10,880,599 | $ | 10,398,690 | |||||||||||||||||||
| Total assets | $ | 13,253,466 | $ | 13,592,318 | $ | 13,289,223 | $ | 13,381,151 | $ | 12,844,285 | |||||||||||||||||||
| Outstanding borrowings under revolving credit facility | $ | 110,000 | $ | — | $ | 410,000 | $ | — | $ | — | |||||||||||||||||||
| Total Debt | $ | 4,910,000 | $ | 5,227,529 | $ | 4,989,015 | $ | 5,075,391 | $ | 4,578,772 | |||||||||||||||||||
| Total Capitalization | $ | 19,164,198 | $ | 20,669,137 | $ | 21,157,336 | $ | 21,059,213 | $ | 20,851,847 | |||||||||||||||||||
| Total Debt to Total Capitalization | 25.6 | % | 25.3 | % | 23.6 | % | 24.1 | % | 22.0 | % | |||||||||||||||||||
| Net Debt and Preferred Shares to Adjusted EBITDAre | 5.1 x | 5.2 x | 5.3 x | 5.4 x | 5.0 x | ||||||||||||||||||||||||
| NYSE AMH Class A common share closing price | $ | 33.25 | $ | 36.07 | $ | 37.81 | $ | 37.42 | $ | 38.39 | |||||||||||||||||||
| Portfolio Data - end of period | |||||||||||||||||||||||||||||
| Occupied single-family properties | 57,061 | 58,317 | 58,246 | 57,486 | 55,726 | ||||||||||||||||||||||||
| Single-family properties leased, not yet occupied | 478 | 406 | 567 | 378 | 347 | ||||||||||||||||||||||||
| Single-family properties in turnover process | 2,867 | 1,753 | 1,619 | 2,098 | 2,271 | ||||||||||||||||||||||||
| Single-family properties recently renovated or developed | 245 | 118 | 257 | 565 | 544 | ||||||||||||||||||||||||
| Single-family properties newly acquired and under renovation | 13 | 2 | 11 | 4 | 11 | ||||||||||||||||||||||||
| Total single-family properties, excluding properties held for sale | 60,664 | 60,596 | 60,700 | 60,531 | 58,899 | ||||||||||||||||||||||||
| Single-family properties held for sale | 1,028 | 904 | 661 | 805 | 1,003 | ||||||||||||||||||||||||
| Total single-family properties wholly owned | 61,692 | 61,500 | 61,361 | 61,336 | 59,902 | ||||||||||||||||||||||||
| Single-family properties managed under joint ventures | 3,721 | 3,616 | 3,487 | 3,376 | 3,271 | ||||||||||||||||||||||||
| Total single-family properties wholly owned and managed | 65,413 | 65,116 | 64,848 | 64,712 | 63,173 | ||||||||||||||||||||||||
Total Average Occupied Days Percentage (1) |
95.2 | % | 95.7 | % | 94.8 | % | 94.2 | % | 95.1 | % | |||||||||||||||||||
| Same-Home Average Occupied Days Percentage (53,412 properties) | 95.9 | % | 96.5 | % | 96.0 | % | 95.4 | % | 96.1 | % | |||||||||||||||||||
| Other Data | |||||||||||||||||||||||||||||
| Distributions declared per common share | $ | 0.30 | $ | 0.30 | $ | 0.30 | $ | 0.26 | $ | 0.26 | |||||||||||||||||||
| Distributions declared per Series G perpetual preferred share | $ | 0.37 | $ | 0.37 | $ | 0.37 | $ | 0.37 | $ | 0.37 | |||||||||||||||||||
| Distributions declared per Series H perpetual preferred share | $ | 0.39 | $ | 0.39 | $ | 0.39 | $ | 0.39 | $ | 0.39 | |||||||||||||||||||
| Refer to “Defined Terms and Non-GAAP Reconciliations” for definitions of metrics and reconciliations to GAAP. | 10 |
|||||||
| AMH | ||||||||
| For the Three Months Ended Sep 30, |
For the Nine Months Ended Sep 30, |
||||||||||||||||||||||
| 2025 | 2024 | 2025 | 2024 | ||||||||||||||||||||
| Rents and other single-family property revenues | $ | 478,464 | $ | 445,055 | $ | 1,395,243 | $ | 1,292,104 | |||||||||||||||
| Expenses: | |||||||||||||||||||||||
| Property operating expenses | 181,604 | 172,031 | 509,223 | 477,428 | |||||||||||||||||||
| Property management expenses | 33,384 | 31,973 | 101,977 | 95,757 | |||||||||||||||||||
| General and administrative expense | 20,503 | 19,247 | 60,182 | 62,825 | |||||||||||||||||||
| Interest expense | 48,199 | 43,611 | 139,928 | 120,866 | |||||||||||||||||||
| Acquisition and other transaction costs | 3,661 | 2,605 | 9,377 | 8,866 | |||||||||||||||||||
| Depreciation and amortization | 126,656 | 119,691 | 378,523 | 353,020 | |||||||||||||||||||
| Hurricane-related charges, net | — | 3,904 | — | 3,904 | |||||||||||||||||||
| Total expenses | 414,007 | 393,062 | 1,199,210 | 1,122,666 | |||||||||||||||||||
| Gain on sale and impairment of single-family properties and other, net | 47,620 | 32,697 | 161,544 | 145,490 | |||||||||||||||||||
| Loss on early extinguishment of debt | (180) | (5,306) | (396) | (6,323) | |||||||||||||||||||
| Other income and expense, net | 4,904 | 8,256 | 11,957 | 15,664 | |||||||||||||||||||
| Net income | 116,801 | 87,640 | 369,138 | 324,269 | |||||||||||||||||||
| Noncontrolling interest | 13,618 | 10,333 | 43,458 | 38,559 | |||||||||||||||||||
| Dividends on preferred shares | 3,486 | 3,486 | 10,458 | 10,458 | |||||||||||||||||||
| Net income attributable to common shareholders | $ | 99,697 | $ | 73,821 | $ | 315,222 | $ | 275,252 | |||||||||||||||
| Weighted-average common shares outstanding: | |||||||||||||||||||||||
| Basic | 371,248,842 | 366,981,466 | 370,721,279 | 366,757,369 | |||||||||||||||||||
| Diluted | 371,580,911 | 367,600,636 | 371,084,326 | 367,294,979 | |||||||||||||||||||
| Net income attributable to common shareholders per share: | |||||||||||||||||||||||
| Basic | $ | 0.27 | $ | 0.20 | $ | 0.85 | $ | 0.75 | |||||||||||||||
| Diluted | $ | 0.27 | $ | 0.20 | $ | 0.85 | $ | 0.75 | |||||||||||||||
| Refer to “Defined Terms and Non-GAAP Reconciliations” for definitions of metrics and reconciliations to GAAP. | 11 |
|||||||
| AMH | ||||||||
| For the Three Months Ended Sep 30, |
For the Nine Months Ended Sep 30, |
||||||||||||||||||||||
| 2025 | 2024 | 2025 | 2024 | ||||||||||||||||||||
| Net income attributable to common shareholders | $ | 99,697 | $ | 73,821 | $ | 315,222 | $ | 275,252 | |||||||||||||||
| Adjustments: | |||||||||||||||||||||||
| Noncontrolling interests in the Operating Partnership | 13,618 | 10,333 | 43,458 | 38,559 | |||||||||||||||||||
| Gain on sale and impairment of single-family properties and other, net | (47,620) | (32,697) | (161,544) | (145,490) | |||||||||||||||||||
| Adjustments for unconsolidated real estate joint ventures | 1,918 | 1,116 | 5,223 | 3,909 | |||||||||||||||||||
| Depreciation and amortization | 126,656 | 119,691 | 378,523 | 353,020 | |||||||||||||||||||
| Less: depreciation and amortization of non-real estate assets | (5,696) | (4,930) | (16,572) | (14,354) | |||||||||||||||||||
| FFO attributable to common share and unit holders | $ | 188,573 | $ | 167,334 | $ | 564,310 | $ | 510,896 | |||||||||||||||
| Adjustments: | |||||||||||||||||||||||
| Acquisition, other transaction costs and other | 3,158 | 2,605 | 8,693 | 8,866 | |||||||||||||||||||
| Noncash share-based compensation - general and administrative | 3,917 | 3,601 | 12,771 | 17,999 | |||||||||||||||||||
| Noncash share-based compensation - property management | 864 | 1,043 | 3,247 | 3,827 | |||||||||||||||||||
| Hurricane-related charges, net | — | 3,904 | — | 3,904 | |||||||||||||||||||
| Loss on early extinguishment of debt | 180 | 5,306 | 396 | 6,323 | |||||||||||||||||||
| Core FFO attributable to common share and unit holders | $ | 196,692 | $ | 183,793 | $ | 589,417 | $ | 551,815 | |||||||||||||||
| Recurring Capital Expenditures | (20,399) | (23,088) | (57,743) | (58,615) | |||||||||||||||||||
| Leasing costs | (765) | (995) | (3,102) | (2,832) | |||||||||||||||||||
| Adjusted FFO attributable to common share and unit holders | $ | 175,528 | $ | 159,710 | $ | 528,572 | $ | 490,368 | |||||||||||||||
| Per FFO share and unit: | |||||||||||||||||||||||
| FFO attributable to common share and unit holders | $ | 0.45 | $ | 0.40 | $ | 1.34 | $ | 1.22 | |||||||||||||||
| Core FFO attributable to common share and unit holders | $ | 0.47 | $ | 0.44 | $ | 1.39 | $ | 1.32 | |||||||||||||||
| Adjusted FFO attributable to common share and unit holders | $ | 0.42 | $ | 0.38 | $ | 1.25 | $ | 1.17 | |||||||||||||||
| Weighted-average FFO shares and units: | |||||||||||||||||||||||
| Common shares outstanding | 371,248,842 | 366,981,466 | 370,721,279 | 366,757,369 | |||||||||||||||||||
Share-based compensation plan and forward sale equity contracts (1) |
632,730 | 1,015,421 | 695,497 | 927,581 | |||||||||||||||||||
| Operating partnership units | 50,732,415 | 51,376,980 | 51,110,313 | 51,376,980 | |||||||||||||||||||
| Total weighted-average FFO shares and units | 422,613,987 | 419,373,867 | 422,527,089 | 419,061,930 | |||||||||||||||||||
| Refer to “Defined Terms and Non-GAAP Reconciliations” for definitions of metrics and reconciliations to GAAP. | 12 |
|||||||
| AMH | ||||||||
| For the Three Months Ended Sep 30, |
For the Nine Months Ended Sep 30, |
||||||||||||||||||||||
| 2025 | 2024 | 2025 | 2024 | ||||||||||||||||||||
| Rents from single-family properties | $ | 400,494 | $ | 374,499 | $ | 1,189,363 | $ | 1,107,962 | |||||||||||||||
| Fees from single-family properties | 9,456 | 8,084 | 28,388 | 24,229 | |||||||||||||||||||
| Bad debt | (4,329) | (5,143) | (11,669) | (12,410) | |||||||||||||||||||
| Core revenues | 405,621 | 377,440 | 1,206,082 | 1,119,781 | |||||||||||||||||||
| Property tax expense | 67,037 | 62,942 | 200,096 | 191,556 | |||||||||||||||||||
HOA fees, net (1) |
7,308 | 6,913 | 21,471 | 19,965 | |||||||||||||||||||
R&M and turnover costs, net (1) |
32,102 | 31,449 | 91,191 | 84,558 | |||||||||||||||||||
| Insurance | 4,794 | 5,138 | 14,339 | 14,863 | |||||||||||||||||||
Property management expenses, net (2) |
30,040 | 28,904 | 91,695 | 86,093 | |||||||||||||||||||
| Core property operating expenses | 141,281 | 135,346 | 418,792 | 397,035 | |||||||||||||||||||
| Core NOI | $ | 264,340 | $ | 242,094 | $ | 787,290 | $ | 722,746 | |||||||||||||||
| Core NOI margin | 65.2 | % | 64.1 | % | 65.3 | % | 64.5 | % | |||||||||||||||
| For the Three Months Ended Sep 30, 2025 |
|||||||||||||||||||||||||||||
| Same-Home Properties | Stabilized Properties | Non-Stabilized Properties (3) |
Held for Sale and Other Properties (4) |
Total Single-Family Properties Wholly Owned |
|||||||||||||||||||||||||
| Property count | 53,412 | 3,823 | 3,416 | 1,041 | 61,692 | ||||||||||||||||||||||||
| Average Occupied Days Percentage | 95.9 | % | 95.8 | % | 82.2 | % | 42.7 | % | 94.3 | % | |||||||||||||||||||
| Rents from single-family properties | $ | 352,997 | $ | 27,730 | $ | 16,934 | $ | 2,833 | $ | 400,494 | |||||||||||||||||||
| Fees from single-family properties | 8,179 | 720 | 455 | 102 | 9,456 | ||||||||||||||||||||||||
| Bad debt | (3,350) | (216) | (395) | (368) | (4,329) | ||||||||||||||||||||||||
| Core revenues | 357,826 | 28,234 | 16,994 | 2,567 | 405,621 | ||||||||||||||||||||||||
| Property tax expense | 58,955 | 4,100 | 3,114 | 868 | 67,037 | ||||||||||||||||||||||||
HOA fees, net (1) |
6,671 | 347 | 246 | 44 | 7,308 | ||||||||||||||||||||||||
R&M and turnover costs, net (1) |
27,951 | 1,070 | 2,366 | 715 | 32,102 | ||||||||||||||||||||||||
| Insurance | 4,147 | 384 | 202 | 61 | 4,794 | ||||||||||||||||||||||||
Property management expenses, net (2) |
25,313 | 2,128 | 2,313 | 286 | 30,040 | ||||||||||||||||||||||||
| Core property operating expenses | 123,037 | 8,029 | 8,241 | 1,974 | 141,281 | ||||||||||||||||||||||||
| Core NOI | $ | 234,789 | $ | 20,205 | $ | 8,753 | $ | 593 | $ | 264,340 | |||||||||||||||||||
| Core NOI margin | 65.6 | % | 71.6 | % | 51.5 | % | 23.1 | % | 65.2 | % | |||||||||||||||||||
| Refer to “Defined Terms and Non-GAAP Reconciliations” for definitions of metrics and reconciliations to GAAP. | 13 |
|||||||
| AMH | ||||||||
| For the Three Months Ended Sep 30, |
For the Nine Months Ended Sep 30, |
||||||||||||||||||||||||||||||||||
| 2025 | 2024 | Change | 2025 | 2024 | Change | ||||||||||||||||||||||||||||||
| Number of Same-Home properties | 53,412 | 53,412 | 53,412 | 53,412 | |||||||||||||||||||||||||||||||
| Average Occupied Days Percentage | 95.9 | % | 96.1 | % | (0.2) | % | 96.2 | % | 96.3 | % | (0.1) | % | |||||||||||||||||||||||
| Average Monthly Realized Rent per Property | $ | 2,296 | $ | 2,218 | 3.5 | % | $ | 2,274 | $ | 2,188 | 3.9 | % | |||||||||||||||||||||||
| Turnover Rate | 7.3 | % | 7.9 | % | (0.6) | % | 21.5 | % | 21.7 | % | (0.2) | % | |||||||||||||||||||||||
| Turnover Rate - TTM | 27.4 | % | N/A | 27.4 | % | N/A | |||||||||||||||||||||||||||||
| Core NOI: | |||||||||||||||||||||||||||||||||||
| Rents from single-family properties | $ | 352,997 | $ | 341,556 | 3.3 | % | $ | 1,051,672 | $ | 1,012,730 | 3.8 | % | |||||||||||||||||||||||
| Fees from single-family properties | 8,179 | 7,264 | 12.6 | % | 24,577 | 21,681 | 13.4 | % | |||||||||||||||||||||||||||
| Bad debt | (3,350) | (4,085) | (18.0) | % | (8,712) | (9,621) | (9.4) | % | |||||||||||||||||||||||||||
| Core revenues | 357,826 | 344,735 | 3.8 | % | 1,067,537 | 1,024,790 | 4.2 | % | |||||||||||||||||||||||||||
| Property tax expense | 58,955 | 57,319 | 2.9 | % | 176,223 | 173,369 | 1.6 | % | |||||||||||||||||||||||||||
HOA fees, net (1) |
6,671 | 6,271 | 6.4 | % | 19,279 | 18,214 | 5.8 | % | |||||||||||||||||||||||||||
R&M and turnover costs, net (1) |
27,951 | 27,348 | 2.2 | % | 79,049 | 73,824 | 7.1 | % | |||||||||||||||||||||||||||
| Insurance | 4,147 | 4,399 | (5.7) | % | 12,474 | 13,019 | (4.2) | % | |||||||||||||||||||||||||||
Property management expenses, net (2) |
25,313 | 24,840 | 1.9 | % | 77,591 | 74,691 | 3.9 | % | |||||||||||||||||||||||||||
| Core property operating expenses | 123,037 | 120,177 | 2.4 | % | 364,616 | 353,117 | 3.3 | % | |||||||||||||||||||||||||||
| Core NOI | $ | 234,789 | $ | 224,558 | 4.6 | % | $ | 702,921 | $ | 671,673 | 4.7 | % | |||||||||||||||||||||||
| Core NOI margin | 65.6 | % | 65.1 | % | 65.8 | % | 65.5 | % | |||||||||||||||||||||||||||
| Selected Property Expenditure Details: | |||||||||||||||||||||||||||||||||||
| Recurring Capital Expenditures | $ | 18,366 | $ | 20,245 | (9.3) | % | $ | 51,531 | $ | 51,367 | 0.3 | % | |||||||||||||||||||||||
| Per property: | |||||||||||||||||||||||||||||||||||
| Average Recurring Capital Expenditures | $ | 344 | $ | 379 | (9.3) | % | $ | 965 | $ | 962 | 0.3 | % | |||||||||||||||||||||||
Average R&M and turnover costs, net, plus Recurring Capital Expenditures |
$ | 867 | $ | 891 | (2.7) | % | $ | 2,445 | $ | 2,344 | 4.3 | % | |||||||||||||||||||||||
| Property Enhancing Capex | $ | 8,595 | $ | 9,320 | $ | 25,358 | $ | 25,474 | |||||||||||||||||||||||||||
| Refer to “Defined Terms and Non-GAAP Reconciliations” for definitions of metrics and reconciliations to GAAP. | 14 |
|||||||
| AMH | ||||||||
| For the Three Months Ended | |||||||||||||||||||||||||||||
| Sep 30, 2025 |
Jun 30, 2025 |
Mar 31, 2025 |
Dec 31, 2024 |
Sep 30, 2024 |
|||||||||||||||||||||||||
| Average Occupied Days Percentage | 95.9 | % | 96.5 | % | 96.0 | % | 95.4 | % | 96.1 | % | |||||||||||||||||||
| Average Monthly Realized Rent per Property | $ | 2,296 | $ | 2,277 | $ | 2,253 | $ | 2,238 | $ | 2,218 | |||||||||||||||||||
| Average Change in Rent for Renewals | 4.0 | % | 4.4 | % | 4.5 | % | 5.0 | % | 5.2 | % | |||||||||||||||||||
| Average Change in Rent for Re-Leases | 2.5 | % | 4.1 | % | 1.4 | % | 0.3 | % | 5.3 | % | |||||||||||||||||||
| Average Blended Change in Rent | 3.6 | % | 4.3 | % | 3.6 | % | 3.4 | % | 5.2 | % | |||||||||||||||||||
| Core NOI: | |||||||||||||||||||||||||||||
| Rents from single-family properties | $ | 352,997 | $ | 352,148 | $ | 346,527 | $ | 341,908 | $ | 341,556 | |||||||||||||||||||
| Fees from single-family properties | 8,179 | 8,215 | 8,183 | 7,915 | 7,264 | ||||||||||||||||||||||||
| Bad debt | (3,350) | (2,147) | (3,215) | (4,088) | (4,085) | ||||||||||||||||||||||||
| Core revenues | 357,826 | 358,216 | 351,495 | 345,735 | 344,735 | ||||||||||||||||||||||||
| Property tax expense | 58,955 | 58,251 | 59,017 | 54,567 | 57,319 | ||||||||||||||||||||||||
HOA fees, net (1) |
6,671 | 6,502 | 6,106 | 6,282 | 6,271 | ||||||||||||||||||||||||
R&M and turnover costs, net (1) |
27,951 | 27,576 | 23,522 | 24,432 | 27,348 | ||||||||||||||||||||||||
| Insurance | 4,147 | 4,108 | 4,219 | 4,404 | 4,399 | ||||||||||||||||||||||||
Property management expenses, net (2) |
25,313 | 26,183 | 26,095 | 25,939 | 24,840 | ||||||||||||||||||||||||
| Core property operating expenses | 123,037 | 122,620 | 118,959 | 115,624 | 120,177 | ||||||||||||||||||||||||
| Core NOI | $ | 234,789 | $ | 235,596 | $ | 232,536 | $ | 230,111 | $ | 224,558 | |||||||||||||||||||
| Core NOI margin | 65.6 | % | 65.8 | % | 66.2 | % | 66.6 | % | 65.1 | % | |||||||||||||||||||
| Selected Property Expenditure Details: | |||||||||||||||||||||||||||||
| Recurring Capital Expenditures | $ | 18,366 | $ | 18,292 | $ | 14,873 | $ | 15,165 | $ | 20,245 | |||||||||||||||||||
| Per property: | |||||||||||||||||||||||||||||
| Average Recurring Capital Expenditures | $ | 344 | $ | 342 | $ | 279 | $ | 284 | $ | 379 | |||||||||||||||||||
Average R&M and turnover costs, net, plus Recurring Capital Expenditures |
$ | 867 | $ | 859 | $ | 719 | $ | 741 | $ | 891 | |||||||||||||||||||
| Property Enhancing Capex | $ | 8,595 | $ | 8,082 | $ | 8,681 | $ | 7,087 | $ | 9,320 | |||||||||||||||||||
| Refer to “Defined Terms and Non-GAAP Reconciliations” for definitions of metrics and reconciliations to GAAP. | 15 |
|||||||
| AMH | ||||||||
| Market | Number of Properties | Avg. Gross Book Value per Property | % of 3Q25 NOI |
Avg. Change in Rent for Renewals (1) |
Avg. Change in Rent for Re-Leases (1) |
Avg. Blended Change in
Rent (1)
|
||||||||||||||||||||||||||||||||
| Atlanta, GA | 5,246 | $ | 228,387 | 9.5 | % | 3.2 | % | 1.1 | % | 2.7 | % | |||||||||||||||||||||||||||
| Charlotte, NC | 3,853 | 223,267 | 7.5 | % | 3.9 | % | 3.2 | % | 3.7 | % | ||||||||||||||||||||||||||||
| Dallas-Fort Worth, TX | 3,517 | 176,606 | 5.7 | % | 3.3 | % | — | % | 2.5 | % | ||||||||||||||||||||||||||||
| Nashville, TN | 3,098 | 251,718 | 7.0 | % | 3.2 | % | 2.7 | % | 3.1 | % | ||||||||||||||||||||||||||||
| Jacksonville, FL | 2,923 | 218,991 | 4.8 | % | 3.1 | % | 0.3 | % | 2.3 | % | ||||||||||||||||||||||||||||
| Phoenix, AZ | 2,897 | 220,296 | 5.9 | % | 4.3 | % | (3.0) | % | 2.5 | % | ||||||||||||||||||||||||||||
| Indianapolis, IN | 2,741 | 176,521 | 4.0 | % | 5.1 | % | 5.8 | % | 5.3 | % | ||||||||||||||||||||||||||||
| Tampa, FL | 2,613 | 233,232 | 4.5 | % | 3.8 | % | 1.1 | % | 3.2 | % | ||||||||||||||||||||||||||||
| Houston, TX | 2,110 | 180,583 | 2.9 | % | 4.0 | % | (0.9) | % | 3.0 | % | ||||||||||||||||||||||||||||
| Columbus, OH | 2,066 | 199,069 | 4.0 | % | 6.0 | % | 7.4 | % | 6.3 | % | ||||||||||||||||||||||||||||
| Raleigh, NC | 2,054 | 202,970 | 3.6 | % | 3.4 | % | 2.0 | % | 3.1 | % | ||||||||||||||||||||||||||||
| Cincinnati, OH | 2,059 | 199,925 | 4.0 | % | 5.0 | % | 9.2 | % | 6.0 | % | ||||||||||||||||||||||||||||
| Las Vegas, NV | 1,981 | 286,007 | 4.2 | % | 3.0 | % | (0.6) | % | 2.0 | % | ||||||||||||||||||||||||||||
| Salt Lake City, UT | 1,864 | 304,986 | 4.5 | % | 4.9 | % | 4.7 | % | 4.8 | % | ||||||||||||||||||||||||||||
| Orlando, FL | 1,744 | 223,329 | 3.1 | % | 3.3 | % | — | % | 2.5 | % | ||||||||||||||||||||||||||||
| Greater Chicago area, IL and IN | 1,479 | 195,166 | 2.7 | % | 6.7 | % | 11.1 | % | 7.7 | % | ||||||||||||||||||||||||||||
| Charleston, SC | 1,394 | 231,717 | 2.7 | % | 3.3 | % | 3.0 | % | 3.2 | % | ||||||||||||||||||||||||||||
| San Antonio, TX | 1,044 | 201,404 | 1.4 | % | 3.2 | % | (4.5) | % | 0.9 | % | ||||||||||||||||||||||||||||
| Savannah/Hilton Head, SC | 970 | 211,547 | 1.9 | % | 4.8 | % | 2.7 | % | 4.3 | % | ||||||||||||||||||||||||||||
| Seattle, WA | 931 | 330,984 | 2.4 | % | 7.5 | % | 7.0 | % | 7.4 | % | ||||||||||||||||||||||||||||
All Other (2) |
6,828 | 234,414 | 13.7 | % | 3.6 | % | 2.8 | % | 3.4 | % | ||||||||||||||||||||||||||||
| Total/Average | 53,412 | $ | 223,024 | 100.0 | % | 4.0 | % | 2.5 | % | 3.6 | % | |||||||||||||||||||||||||||
| Average Occupied Days Percentage | Average Monthly Realized Rent per Property | |||||||||||||||||||||||||||||||||||||
| Market | 3Q25 QTD | 3Q24 QTD | Change | 3Q25 QTD | 3Q24 QTD | Change | ||||||||||||||||||||||||||||||||
| Atlanta, GA | 95.9 | % | 96.1 | % | (0.2) | % | $ | 2,321 | $ | 2,256 | 2.9 | % | ||||||||||||||||||||||||||
| Charlotte, NC | 96.2 | % | 96.5 | % | (0.3) | % | 2,252 | 2,170 | 3.8 | % | ||||||||||||||||||||||||||||
| Dallas-Fort Worth, TX | 96.0 | % | 96.3 | % | (0.3) | % | 2,347 | 2,285 | 2.7 | % | ||||||||||||||||||||||||||||
| Nashville, TN | 96.1 | % | 96.0 | % | 0.1 | % | 2,406 | 2,334 | 3.1 | % | ||||||||||||||||||||||||||||
| Jacksonville, FL | 95.6 | % | 95.4 | % | 0.2 | % | 2,208 | 2,160 | 2.2 | % | ||||||||||||||||||||||||||||
| Phoenix, AZ | 95.3 | % | 95.4 | % | (0.1) | % | 2,185 | 2,129 | 2.6 | % | ||||||||||||||||||||||||||||
| Indianapolis, IN | 96.6 | % | 96.5 | % | 0.1 | % | 1,971 | 1,870 | 5.4 | % | ||||||||||||||||||||||||||||
| Tampa, FL | 94.9 | % | 95.7 | % | (0.8) | % | 2,464 | 2,396 | 2.8 | % | ||||||||||||||||||||||||||||
| Houston, TX | 96.6 | % | 96.5 | % | 0.1 | % | 2,134 | 2,056 | 3.8 | % | ||||||||||||||||||||||||||||
| Columbus, OH | 97.1 | % | 96.6 | % | 0.5 | % | 2,291 | 2,180 | 5.1 | % | ||||||||||||||||||||||||||||
| Raleigh, NC | 96.0 | % | 96.6 | % | (0.6) | % | 2,106 | 2,038 | 3.3 | % | ||||||||||||||||||||||||||||
| Cincinnati, OH | 96.5 | % | 96.7 | % | (0.2) | % | 2,252 | 2,128 | 5.8 | % | ||||||||||||||||||||||||||||
| Las Vegas, NV | 94.7 | % | 95.8 | % | (1.1) | % | 2,338 | 2,281 | 2.5 | % | ||||||||||||||||||||||||||||
| Salt Lake City, UT | 96.0 | % | 96.4 | % | (0.4) | % | 2,532 | 2,434 | 4.0 | % | ||||||||||||||||||||||||||||
| Orlando, FL | 96.4 | % | 94.9 | % | 1.5 | % | 2,418 | 2,374 | 1.9 | % | ||||||||||||||||||||||||||||
| Greater Chicago area, IL and IN | 96.8 | % | 97.0 | % | (0.2) | % | 2,617 | 2,436 | 7.4 | % | ||||||||||||||||||||||||||||
| Charleston, SC | 94.6 | % | 96.1 | % | (1.5) | % | 2,356 | 2,282 | 3.2 | % | ||||||||||||||||||||||||||||
| San Antonio, TX | 95.2 | % | 96.3 | % | (1.1) | % | 1,948 | 1,947 | 0.1 | % | ||||||||||||||||||||||||||||
| Savannah/Hilton Head, SC | 95.4 | % | 95.7 | % | (0.3) | % | 2,346 | 2,232 | 5.1 | % | ||||||||||||||||||||||||||||
| Seattle, WA | 96.3 | % | 95.9 | % | 0.4 | % | 2,911 | 2,782 | 4.6 | % | ||||||||||||||||||||||||||||
All Other (2) |
95.9 | % | 95.7 | % | 0.2 | % | 2,275 | 2,199 | 3.5 | % | ||||||||||||||||||||||||||||
| Total/Average | 95.9 | % | 96.1 | % | (0.2) | % | $ | 2,296 | $ | 2,218 | 3.5 | % | ||||||||||||||||||||||||||
| Refer to “Defined Terms and Non-GAAP Reconciliations” for definitions of metrics and reconciliations to GAAP. | 16 |
|||||||
| AMH | ||||||||
| Sep 30, 2025 | Dec 31, 2024 | ||||||||||
| (Unaudited) | |||||||||||
| Assets | |||||||||||
| Single-family properties: | |||||||||||
| Land | $ | 2,404,153 | $ | 2,370,006 | |||||||
| Buildings and improvements | 11,930,388 | 11,559,461 | |||||||||
| Single-family properties in operation | 14,334,541 | 13,929,467 | |||||||||
| Less: accumulated depreciation | (3,298,648) | (3,048,868) | |||||||||
| Single-family properties in operation, net | 11,035,893 | 10,880,599 | |||||||||
| Single-family properties under development and development land | 1,215,323 | 1,272,284 | |||||||||
| Single-family properties and land held for sale, net | 219,637 | 212,808 | |||||||||
| Total real estate assets, net | 12,470,853 | 12,365,691 | |||||||||
| Cash and cash equivalents | 45,631 | 199,413 | |||||||||
| Restricted cash | 130,104 | 150,803 | |||||||||
| Rent and other receivables | 56,493 | 48,452 | |||||||||
| Escrow deposits, prepaid expenses and other assets | 268,120 | 337,379 | |||||||||
| Investments in unconsolidated joint ventures | 161,986 | 159,134 | |||||||||
| Goodwill | 120,279 | 120,279 | |||||||||
| Total assets | $ | 13,253,466 | $ | 13,381,151 | |||||||
| Liabilities | |||||||||||
| Revolving credit facility | $ | 110,000 | $ | — | |||||||
| Asset-backed securitizations, net | — | 924,344 | |||||||||
| Unsecured senior notes, net | 4,733,543 | 4,086,418 | |||||||||
| Accounts payable and accrued expenses | 571,956 | 521,759 | |||||||||
| Total liabilities | 5,415,499 | 5,532,521 | |||||||||
| Commitments and contingencies | |||||||||||
| Equity | |||||||||||
| Shareholders’ equity: | |||||||||||
| Class A common shares | 3,705 | 3,690 | |||||||||
| Class B common shares | 6 | 6 | |||||||||
| Preferred shares | 92 | 92 | |||||||||
| Additional paid-in capital | 7,550,962 | 7,529,008 | |||||||||
| Accumulated deficit | (400,445) | (380,632) | |||||||||
| Accumulated other comprehensive income | 6,944 | 7,852 | |||||||||
| Total shareholders’ equity | 7,161,264 | 7,160,016 | |||||||||
| Noncontrolling interest | 676,703 | 688,614 | |||||||||
| Total equity | 7,837,967 | 7,848,630 | |||||||||
| Total liabilities and equity | $ | 13,253,466 | $ | 13,381,151 | |||||||
| Refer to “Defined Terms and Non-GAAP Reconciliations” for definitions of metrics and reconciliations to GAAP. | 17 |
|||||||
| AMH | ||||||||
| Unsecured Balance | % of Total | Interest Rate (1) |
Years to Maturity (2) |
||||||||||||||||||||
| Floating rate debt: | |||||||||||||||||||||||
Revolving credit facility (2) |
$ | 110,000 | 2.2 | % | 5.19 | % | 3.8 | ||||||||||||||||
| Total floating rate debt | 110,000 | 2.2 | % | 5.19 | % | 3.8 | |||||||||||||||||
| Fixed rate debt: | |||||||||||||||||||||||
| 2028 unsecured senior notes | 500,000 | 10.2 | % | 4.08 | % | 2.4 | |||||||||||||||||
| 2029 unsecured senior notes | 400,000 | 8.1 | % | 4.90 | % | 3.4 | |||||||||||||||||
| 2030 unsecured senior notes | 650,000 | 13.3 | % | 4.95 | % | 4.7 | |||||||||||||||||
| 2031 unsecured senior notes | 450,000 | 9.2 | % | 2.46 | % | 5.8 | |||||||||||||||||
| 2032 unsecured senior notes | 600,000 | 12.2 | % | 3.63 | % | 6.5 | |||||||||||||||||
| 2034 unsecured senior notes I | 600,000 | 12.2 | % | 5.50 | % | 8.3 | |||||||||||||||||
| 2034 unsecured senior notes II | 500,000 | 10.2 | % | 5.50 | % | 8.8 | |||||||||||||||||
| 2035 unsecured senior notes | 500,000 | 10.2 | % | 5.08 | % | 9.5 | |||||||||||||||||
| 2051 unsecured senior notes | 300,000 | 6.1 | % | 3.38 | % | 25.8 | |||||||||||||||||
| 2052 unsecured senior notes | 300,000 | 6.1 | % | 4.30 | % | 26.6 | |||||||||||||||||
| Total fixed rate debt | 4,800,000 | 97.8 | % | 4.46 | % | 8.7 | |||||||||||||||||
| Total Debt | 4,910,000 | 100.0 | % | 4.47 | % | 8.6 | |||||||||||||||||
| Unamortized discounts and loan costs | (66,457) | ||||||||||||||||||||||
| Total debt per balance sheet | $ | 4,843,543 | |||||||||||||||||||||
Maturity Schedule by Year (2) |
Total Debt | % of Total | |||||||||
| Remaining 2025 | $ | — | — | % | |||||||
| 2026 | — | — | % | ||||||||
| 2027 | — | — | % | ||||||||
| 2028 | 500,000 | 10.2 | % | ||||||||
| 2029 | 510,000 | 10.4 | % | ||||||||
| Thereafter | 3,900,000 | 79.4 | % | ||||||||
| Total | $ | 4,910,000 | 100.0 | % | |||||||
| For the Three Months Ended Sep 30, |
For the Nine Months Ended Sep 30, |
||||||||||||||||||||||
| 2025 | 2024 | 2025 | 2024 | ||||||||||||||||||||
| Interest expense per income statement and included in Core FFO attributable to common share and unit holders | $ | 48,199 | $ | 43,611 | $ | 139,928 | $ | 120,866 | |||||||||||||||
| Less: amortization of discounts, loan costs and cash flow hedges | (2,670) | (3,006) | (7,618) | (8,966) | |||||||||||||||||||
| Add: capitalized interest | 13,714 | 12,894 | 41,787 | 40,247 | |||||||||||||||||||
| Cash interest | $ | 59,243 | $ | 53,499 | $ | 174,097 | $ | 152,147 | |||||||||||||||
| Refer to “Defined Terms and Non-GAAP Reconciliations” for definitions of metrics and reconciliations to GAAP. | 18 |
|||||||
| AMH | ||||||||
| Total Capitalization | ||||||||||||||||||||
| Total Debt | $ | 4,910,000 | 25.6 | % | ||||||||||||||||
| Total preferred shares | 230,000 | 1.2 | % | |||||||||||||||||
| Common equity at market value: | ||||||||||||||||||||
| Common shares outstanding | 371,103,396 | |||||||||||||||||||
| Operating partnership units | 50,676,980 | |||||||||||||||||||
| Total shares and units | 421,780,376 | |||||||||||||||||||
| NYSE AMH Class A common share closing price at September 30, 2025 | $ | 33.25 | ||||||||||||||||||
| Market value of common shares and operating partnership units | 14,024,198 | 73.2 | % | |||||||||||||||||
| Total Capitalization | $ | 19,164,198 | 100.0 | % | ||||||||||||||||
| Preferred Shares | Earliest Redemption Date | Outstanding Shares | Annual Dividend Per Share |
Annual Dividend Amount |
||||||||||||||||||||||||||||||||||
| Series | Per Share | Total | ||||||||||||||||||||||||||||||||||||
| 5.875% Series G Perpetual Preferred Shares | 7/17/2022 | 4,600,000 | $ | 25.00 | $ | 115,000 | $ | 1.469 | $ | 6,756 | ||||||||||||||||||||||||||||
| 6.250% Series H Perpetual Preferred Shares | 9/19/2023 | 4,600,000 | $ | 25.00 | 115,000 | $ | 1.563 | 7,188 | ||||||||||||||||||||||||||||||
| Total preferred shares | 9,200,000 | $ | 230,000 | $ | 13,944 | |||||||||||||||||||||||||||||||||
| Credit Ratios | Credit Ratings | ||||||||||||||||||||||
| Net Debt and Preferred Shares to Adjusted EBITDAre | 5.1 x | Rating Agency | Rating | Outlook | |||||||||||||||||||
| Fixed Charge Coverage | 4.1 x | Moody's Investor Service | Baa2 | Stable | |||||||||||||||||||
Unencumbered Core NOI percentage (1) |
100.0 | % | S&P Global Ratings | BBB | Positive | ||||||||||||||||||
| Unsecured Senior Notes Covenant Ratios | Requirement | Actual | |||||||||||||||
| Ratio of Indebtedness to Total Assets | < | 60.0 | % | 30.1 | % | ||||||||||||
| Ratio of Secured Debt to Total Assets | < | 40.0 | % | — | % | ||||||||||||
| Ratio of Unencumbered Assets to Unsecured Debt | > | 150.0 | % | 332.3 | % | ||||||||||||
| Ratio of Consolidated Income Available for Debt Service to Interest Expense | > | 1.50 x | 4.32 x | ||||||||||||||
| Unsecured Credit Facility Covenant Ratios | Requirement | Actual | |||||||||||||||
| Ratio of Total Indebtedness to Total Asset Value | < | 60.0 | % | 27.9 | % | ||||||||||||
| Ratio of Secured Indebtedness to Total Asset Value | < | 40.0 | % | 0.7 | % | ||||||||||||
| Ratio of Unsecured Indebtedness to Unencumbered Asset Value | < | 60.0 | % | 29.4 | % | ||||||||||||
| Ratio of EBITDA to Fixed Charges | > | 1.50 x | 3.84 x | ||||||||||||||
| Ratio of Unencumbered NOI to Unsecured Interest Expense | > | 1.75 x | 5.30 x | ||||||||||||||
| Refer to “Defined Terms and Non-GAAP Reconciliations” for definitions of metrics and reconciliations to GAAP. | 19 |
|||||||
| AMH | ||||||||
| Market | Number of Properties |
Percentage of Total Properties |
Avg. Gross Book Value per Property | Avg. Sq. Ft. |
Avg. Age (years) |
|||||||||||||||||||||||||||
| Atlanta, GA | 6,013 | 9.9 | % | $ | 240,282 | 2,197 | 17.5 | |||||||||||||||||||||||||
| Charlotte, NC | 4,257 | 7.0 | % | 233,471 | 2,119 | 18.7 | ||||||||||||||||||||||||||
| Dallas-Fort Worth, TX | 3,725 | 6.1 | % | 179,224 | 2,082 | 21.2 | ||||||||||||||||||||||||||
| Nashville, TN | 3,401 | 5.6 | % | 264,864 | 2,123 | 16.8 | ||||||||||||||||||||||||||
| Jacksonville, FL | 3,376 | 5.6 | % | 235,884 | 1,930 | 14.4 | ||||||||||||||||||||||||||
| Phoenix, AZ | 3,305 | 5.4 | % | 227,866 | 1,859 | 19.7 | ||||||||||||||||||||||||||
| Indianapolis, IN | 3,009 | 5.0 | % | 182,740 | 1,931 | 22.4 | ||||||||||||||||||||||||||
| Tampa, FL | 3,099 | 5.1 | % | 253,672 | 1,959 | 14.7 | ||||||||||||||||||||||||||
| Las Vegas, NV | 2,701 | 4.5 | % | 319,296 | 1,971 | 10.6 | ||||||||||||||||||||||||||
| Houston, TX | 2,302 | 3.8 | % | 182,713 | 2,064 | 19.7 | ||||||||||||||||||||||||||
| Raleigh, NC | 2,160 | 3.6 | % | 205,805 | 1,899 | 19.0 | ||||||||||||||||||||||||||
| Columbus, OH | 2,232 | 3.7 | % | 214,622 | 1,902 | 21.3 | ||||||||||||||||||||||||||
| Orlando, FL | 2,211 | 3.6 | % | 252,418 | 1,946 | 16.3 | ||||||||||||||||||||||||||
| Cincinnati, OH | 2,098 | 3.5 | % | 201,615 | 1,842 | 22.7 | ||||||||||||||||||||||||||
| Salt Lake City, UT | 1,930 | 3.2 | % | 308,431 | 2,242 | 18.5 | ||||||||||||||||||||||||||
| Charleston, SC | 1,653 | 2.7 | % | 246,128 | 1,962 | 13.4 | ||||||||||||||||||||||||||
| Greater Chicago area, IL and IN | 1,508 | 2.5 | % | 195,395 | 1,870 | 24.1 | ||||||||||||||||||||||||||
| San Antonio, TX | 1,156 | 1.9 | % | 205,575 | 1,910 | 16.2 | ||||||||||||||||||||||||||
| Boise, ID | 1,100 | 1.8 | % | 320,300 | 1,882 | 10.8 | ||||||||||||||||||||||||||
| Savannah/Hilton Head, SC | 1,043 | 1.7 | % | 220,717 | 1,885 | 16.5 | ||||||||||||||||||||||||||
All Other (3) |
8,385 | 13.8 | % | 254,979 | 1,946 | 17.9 | ||||||||||||||||||||||||||
| Total/Average | 60,664 | 100.0 | % | $ | 236,294 | 1,999 | 17.9 | |||||||||||||||||||||||||
| Market |
Avg. Occupied Days
Percentage (2)
|
Avg. Monthly Realized Rent
per Property (2)
|
Avg. Change in Rent for
Renewals (2)
|
Avg. Change in Rent for
Re-Leases (2)
|
Avg. Blended Change
in Rent (2)
|
|||||||||||||||||||||||||||
| Atlanta, GA | 95.0 | % | $ | 2,334 | 3.3 | % | 1.4 | % | 2.8 | % | ||||||||||||||||||||||
| Charlotte, NC | 95.7 | % | 2,272 | 4.0 | % | 3.3 | % | 3.8 | % | |||||||||||||||||||||||
| Dallas-Fort Worth, TX | 95.6 | % | 2,347 | 3.3 | % | (0.4) | % | 2.5 | % | |||||||||||||||||||||||
| Nashville, TN | 95.8 | % | 2,422 | 3.3 | % | 2.7 | % | 3.1 | % | |||||||||||||||||||||||
| Jacksonville, FL | 95.1 | % | 2,226 | 3.1 | % | 0.6 | % | 2.4 | % | |||||||||||||||||||||||
| Phoenix, AZ | 94.6 | % | 2,183 | 4.4 | % | (2.8) | % | 2.7 | % | |||||||||||||||||||||||
| Indianapolis, IN | 96.3 | % | 1,972 | 5.1 | % | 5.7 | % | 5.3 | % | |||||||||||||||||||||||
| Tampa, FL | 93.7 | % | 2,498 | 3.8 | % | 1.1 | % | 3.2 | % | |||||||||||||||||||||||
| Las Vegas, NV | 93.8 | % | 2,383 | 3.1 | % | (0.4) | % | 2.2 | % | |||||||||||||||||||||||
| Houston, TX | 95.8 | % | 2,121 | 4.3 | % | (1.0) | % | 3.1 | % | |||||||||||||||||||||||
| Raleigh, NC | 95.9 | % | 2,110 | 3.4 | % | 2.1 | % | 3.1 | % | |||||||||||||||||||||||
| Columbus, OH | 96.2 | % | 2,309 | 5.9 | % | 7.5 | % | 6.3 | % | |||||||||||||||||||||||
| Orlando, FL | 95.4 | % | 2,442 | 3.1 | % | (0.2) | % | 2.3 | % | |||||||||||||||||||||||
| Cincinnati, OH | 96.4 | % | 2,253 | 5.0 | % | 9.1 | % | 6.0 | % | |||||||||||||||||||||||
| Salt Lake City, UT | 95.8 | % | 2,530 | 4.9 | % | 4.6 | % | 4.8 | % | |||||||||||||||||||||||
| Charleston, SC | 93.2 | % | 2,373 | 3.2 | % | 3.1 | % | 3.2 | % | |||||||||||||||||||||||
| Greater Chicago area, IL and IN | 96.7 | % | 2,620 | 6.8 | % | 11.1 | % | 7.8 | % | |||||||||||||||||||||||
| San Antonio, TX | 93.7 | % | 1,947 | 3.1 | % | (4.7) | % | 0.6 | % | |||||||||||||||||||||||
| Boise, ID | 94.7 | % | 2,325 | 3.6 | % | 3.7 | % | 3.6 | % | |||||||||||||||||||||||
| Savannah/Hilton Head, SC | 94.8 | % | 2,350 | 4.8 | % | 2.6 | % | 4.2 | % | |||||||||||||||||||||||
All Other (3) |
94.9 | % | 2,346 | 4.3 | % | 3.3 | % | 4.1 | % | |||||||||||||||||||||||
| Total/Average | 95.2 | % | $ | 2,306 | 4.0 | % | 2.4 | % | 3.6 | % | ||||||||||||||||||||||
| Refer to “Defined Terms and Non-GAAP Reconciliations” for definitions of metrics and reconciliations to GAAP. | 20 |
|||||||
| AMH | ||||||||
| 3Q25 Additions | YTD 3Q25 Additions | |||||||||||||||||||||||||
| Market | Number of Properties | Average Total Investment Cost |
Number of Properties | Average Total Investment Cost |
||||||||||||||||||||||
| Tampa, FL | 75 | $ | 381,268 | 199 | $ | 383,974 | ||||||||||||||||||||
| Orlando, FL | 61 | 433,151 | 150 | 417,105 | ||||||||||||||||||||||
| Las Vegas, NV | 60 | 446,999 | 193 | 429,520 | ||||||||||||||||||||||
| Columbus, OH | 56 | 376,470 | 90 | 378,031 | ||||||||||||||||||||||
| Tucson, AZ | 48 | 397,174 | 144 | 392,285 | ||||||||||||||||||||||
| Phoenix, AZ | 42 | 392,364 | 90 | 394,650 | ||||||||||||||||||||||
| Jacksonville, FL | 39 | 373,923 | 137 | 373,291 | ||||||||||||||||||||||
| Charlotte, NC | 34 | 371,428 | 62 | 371,460 | ||||||||||||||||||||||
| Atlanta, GA | 33 | 390,683 | 137 | 368,881 | ||||||||||||||||||||||
| Greenville, SC | 29 | 282,062 | 29 | 282,062 | ||||||||||||||||||||||
| Nashville, TN | 27 | 449,161 | 72 | 455,367 | ||||||||||||||||||||||
| Seattle, WA | 21 | 537,456 | 48 | 549,030 | ||||||||||||||||||||||
| Charleston, SC | 16 | 380,907 | 56 | 386,540 | ||||||||||||||||||||||
| Denver, CO | 15 | 495,113 | 44 | 484,012 | ||||||||||||||||||||||
| Boise, ID | 15 | 418,279 | 46 | 434,227 | ||||||||||||||||||||||
| Savannah/Hilton Head, SC | 9 | 315,383 | 24 | 333,167 | ||||||||||||||||||||||
| Oklahoma City, OK | 5 | 243,122 | 5 | 243,122 | ||||||||||||||||||||||
| Indianapolis, IN | 1 | 290,366 | 1 | 290,366 | ||||||||||||||||||||||
| Cincinnati, OH | 1 | 333,303 | 3 | 337,147 | ||||||||||||||||||||||
| Total/Average | 587 | $ | 399,717 | 1,530 | $ | 400,891 | ||||||||||||||||||||
| Sep 30, 2025 Single-Family Properties Held for Sale |
3Q25 Dispositions | YTD 3Q25 Dispositions | ||||||||||||||||||||||||||||||
| Market | Number of Properties | Average Net Proceeds per Property |
Number of Properties | Average Net Proceeds per Property |
||||||||||||||||||||||||||||
| Dallas-Fort Worth, TX | 116 | 20 | $ | 272,333 | 110 | $ | 296,019 | |||||||||||||||||||||||||
| Houston, TX | 94 | 32 | 221,154 | 87 | 241,609 | |||||||||||||||||||||||||||
| Atlanta, GA | 89 | 50 | 299,700 | 128 | 305,083 | |||||||||||||||||||||||||||
| Greater Chicago area, IL and IN | 68 | 8 | 311,690 | 17 | 295,153 | |||||||||||||||||||||||||||
| Phoenix, AZ | 63 | 19 | 327,833 | 82 | 355,528 | |||||||||||||||||||||||||||
| Charlotte, NC | 53 | 19 | 339,702 | 47 | 361,458 | |||||||||||||||||||||||||||
| Raleigh, NC | 49 | 12 | 307,546 | 29 | 326,198 | |||||||||||||||||||||||||||
| San Antonio, TX | 47 | 15 | 188,016 | 45 | 204,202 | |||||||||||||||||||||||||||
| Austin, TX | 39 | 20 | 278,601 | 63 | 273,632 | |||||||||||||||||||||||||||
| Tampa, FL | 38 | 24 | 308,031 | 76 | 330,045 | |||||||||||||||||||||||||||
| Indianapolis, IN | 37 | 14 | 244,771 | 31 | 260,712 | |||||||||||||||||||||||||||
| Orlando, FL | 36 | 19 | 307,462 | 69 | 320,347 | |||||||||||||||||||||||||||
| Jacksonville, FL | 35 | 13 | 321,170 | 35 | 304,392 | |||||||||||||||||||||||||||
| Las Vegas, NV | 28 | 9 | 387,992 | 27 | 402,882 | |||||||||||||||||||||||||||
| Tucson, AZ | 26 | 10 | 266,172 | 20 | 267,060 | |||||||||||||||||||||||||||
| Savannah/Hilton Head, SC | 25 | 9 | 291,892 | 19 | 283,953 | |||||||||||||||||||||||||||
| Columbus, OH | 24 | 11 | 311,207 | 20 | 305,830 | |||||||||||||||||||||||||||
| Memphis, TN | 21 | 11 | 273,671 | 23 | 261,311 | |||||||||||||||||||||||||||
| Nashville, TN | 17 | 16 | 381,674 | 50 | 358,878 | |||||||||||||||||||||||||||
| Salt Lake City, UT | 14 | 7 | 654,216 | 15 | 658,274 | |||||||||||||||||||||||||||
All Other (1) |
109 | 57 | 405,798 | 188 | 386,072 | |||||||||||||||||||||||||||
| Total/Average | 1,028 | 395 | $ | 315,533 | 1,181 | $ | 321,544 | |||||||||||||||||||||||||
| Refer to “Defined Terms and Non-GAAP Reconciliations” for definitions of metrics and reconciliations to GAAP. | 21 |
|||||||
| AMH | ||||||||
| YTD 3Q25 Deliveries | Sep 30, 2025 Lots for Future Delivery |
|||||||||||||||||||||||||
| Market | Number of Properties | Average Total Investment Cost | Average Monthly Rent |
|||||||||||||||||||||||
| Las Vegas, NV | 280 | $ | 412,000 | $ | 2,500 | 611 | ||||||||||||||||||||
| Phoenix, AZ | 279 | 375,000 | 2,200 | 1,145 | ||||||||||||||||||||||
| Tampa, FL | 199 | 384,000 | 2,670 | 370 | ||||||||||||||||||||||
| Atlanta, GA | 154 | 374,000 | 2,500 | 932 | ||||||||||||||||||||||
| Orlando, FL | 150 | 417,000 | 2,610 | 507 | ||||||||||||||||||||||
| Jacksonville, FL | 134 | 376,000 | 2,380 | 388 | ||||||||||||||||||||||
| Nashville, TN | 128 | 471,000 | 2,780 | 107 | ||||||||||||||||||||||
| Denver, CO | 94 | 522,000 | 3,170 | 477 | ||||||||||||||||||||||
| Seattle, WA | 90 | 479,000 | 3,220 | 575 | ||||||||||||||||||||||
| Columbus, OH | 89 | 378,000 | 2,700 | 586 | ||||||||||||||||||||||
| Charlotte, NC | 87 | 359,000 | 2,480 | 276 | ||||||||||||||||||||||
| Charleston, SC | 56 | 387,000 | 2,460 | 1,119 | ||||||||||||||||||||||
| Boise, ID | 46 | 434,000 | 2,460 | 303 | ||||||||||||||||||||||
| Salt Lake City, UT | 46 | 480,000 | 2,930 | 261 | ||||||||||||||||||||||
| Raleigh, NC | — | — | — | 66 | ||||||||||||||||||||||
| Total/Average | 1,832 | $ | 408,000 | $ | 2,580 | 7,723 | ||||||||||||||||||||
| Lots optioned | 524 | |||||||||||||||||||||||||
| Total lots owned and optioned | 8,247 | |||||||||||||||||||||||||
| Dec 31, 2024 Lots for Future Delivery |
YTD 3Q25
Net Additions/(Reductions) (3)
|
YTD 3Q25 Deliveries |
Full Year Estimated 2025 Deliveries (1) |
Deliveries Thereafter (1) |
||||||||||||||||||||||||||||
Wholly-owned development pipeline (2) |
9,458 | (490) | 1,464 | 1,800 - 2,000 | 7,068 | |||||||||||||||||||||||||||
Joint venture development pipeline (2)(4) |
765 | 346 | 368 | ~400 | 711 | |||||||||||||||||||||||||||
| Total development pipeline | 10,223 | (144) | 1,832 | 2,200 - 2,400 | 7,779 | |||||||||||||||||||||||||||
| Refer to “Defined Terms and Non-GAAP Reconciliations” for definitions of metrics and reconciliations to GAAP. | 22 |
|||||||
| AMH | ||||||||
| MTM | 4Q25 | 1Q26 | 2Q26 | 3Q26 | Thereafter | |||||||||||||||||||||||||||||||||
| Lease expirations | 1,814 | 6,697 | 16,900 | 16,487 | 11,216 | 4,425 | ||||||||||||||||||||||||||||||||
| Share Repurchases | ||||||||||||||||||||
| Period | Common Shares Repurchased | Purchase Price | Avg. Price Paid Per Share | |||||||||||||||||
| 2023 | — | $ | — | $ | — | |||||||||||||||
| 2024 | — | — | — | |||||||||||||||||
| 1Q25 | — | — | — | |||||||||||||||||
| 2Q25 | — | — | — | |||||||||||||||||
| 3Q25 | — | — | — | |||||||||||||||||
| Total | — | — | $ | — | ||||||||||||||||
| Remaining authorization: | $ | 265,067 | ||||||||||||||||||
| ATM Shares Sold Directly | ATM Shares Sold Forward | |||||||||||||||||||||||||||||||||||||||||||||||||
| Period | Common Shares Sold Directly | Gross Proceeds | Avg. Issuance Price Per Share | Common Shares Sold Forward | Future Gross Proceeds | Avg. Price Per Share | Period Settled | Total ATM Gross Proceeds | ||||||||||||||||||||||||||||||||||||||||||
| 2023 | 2,799,683 | $ | 101,958 | $ | 36.42 | — | $ | — | $ | — | $ | 101,958 | ||||||||||||||||||||||||||||||||||||||
| 2024 | 932,746 | 33,756 | 36.19 | 2,987,024 | 110,616 | 37.03 | 4Q24 | 144,372 | ||||||||||||||||||||||||||||||||||||||||||
| 1Q25 | — | — | — | — | — | — | — | |||||||||||||||||||||||||||||||||||||||||||
| 2Q25 | — | — | — | — | — | — | — | |||||||||||||||||||||||||||||||||||||||||||
| 3Q25 | — | — | — | — | — | — | — | |||||||||||||||||||||||||||||||||||||||||||
| 246,330 | ||||||||||||||||||||||||||||||||||||||||||||||||||
| Remaining authorization: | $ | 753,670 | ||||||||||||||||||||||||||||||||||||||||||||||||
| Refer to “Defined Terms and Non-GAAP Reconciliations” for definitions of metrics and reconciliations to GAAP. | 23 |
|||||||
| AMH | ||||||||
| Full Year 2025 | |||||||||||
| Previous Guidance | Current Guidance | ||||||||||
| Core FFO attributable to common share and unit holders | $1.84 - $1.88 | $1.86 - $1.88 | |||||||||
| Core FFO attributable to common share and unit holders growth | 4.0% - 6.2% | 5.1% - 6.2% | |||||||||
| Same-Home | |||||||||||
| Core revenues growth | 3.00% - 4.50% | 3.25% - 4.25% | |||||||||
| Core property operating expenses growth | 3.00% - 4.50% | 2.75% - 3.75% | |||||||||
| Core NOI growth | 2.75% - 4.75% | 3.50% - 4.50% | |||||||||
| Full Year 2025 (Unchanged) |
|||||||||||
| Investment Program | Properties | Investment | |||||||||
| Wholly owned acquisitions | — | — | |||||||||
| Wholly owned development deliveries | 1,800 - 2,000 | $700 - $800 million | |||||||||
| Development pipeline, pro rata share of JV and Property Enhancing Capex | — | $100 - $200 million | |||||||||
| Total capital investment (wholly owned and pro rata JV) | 1,800 - 2,000 | $0.8 - $1.0 billion | |||||||||
| Total gross capital investment (JVs at 100%) | 2,200 - 2,400 | $1.0 - $1.2 billion | |||||||||
| Refer to “Defined Terms and Non-GAAP Reconciliations” for definitions of metrics and reconciliations to GAAP. | 24 |
|||||||
| AMH | ||||||||
25 |
||||||||
| AMH | ||||||||
| (Amounts in thousands) | Sep 30, 2025 |
Jun 30, 2025 |
Mar 31, 2025 |
Dec 31, 2024 |
Sep 30, 2024 |
||||||||||||||||||||||||
| Total Debt | $ | 4,910,000 | $ | 5,227,529 | $ | 4,989,015 | $ | 5,075,391 | $ | 4,578,772 | |||||||||||||||||||
| Less: cash and cash equivalents | (45,631) | (323,258) | (69,698) | (199,413) | (162,477) | ||||||||||||||||||||||||
| Less: restricted cash related to securitizations | (3,114) | (13,188) | (19,122) | (26,588) | (26,273) | ||||||||||||||||||||||||
| Net debt | $ | 4,861,255 | $ | 4,891,083 | $ | 4,900,195 | $ | 4,849,390 | $ | 4,390,022 | |||||||||||||||||||
| Preferred shares at liquidation value | 230,000 | 230,000 | 230,000 | 230,000 | 230,000 | ||||||||||||||||||||||||
| Net debt and preferred shares | $ | 5,091,255 | $ | 5,121,083 | $ | 5,130,195 | $ | 5,079,390 | $ | 4,620,022 | |||||||||||||||||||
| Adjusted EBITDAre - TTM | $ | 1,001,181 | $ | 982,928 | $ | 963,598 | $ | 942,299 | $ | 919,174 | |||||||||||||||||||
| Net Debt and Preferred Shares to Adjusted EBITDAre | 5.1 x | 5.2 x | 5.3 x | 5.4 x | 5.0 x | ||||||||||||||||||||||||
| (Amounts in thousands) | For the Trailing Twelve Months Ended Sep 30, 2025 |
||||
| Interest expense per income statement | $ | 184,413 | |||
| Less: amortization of discounts, loan costs and cash flow hedges | (10,141) | ||||
| Add: capitalized interest | 54,683 | ||||
| Cash interest | 228,955 | ||||
| Dividends on preferred shares | 13,944 | ||||
| Fixed charges | $ | 242,899 | |||
| Adjusted EBITDAre - TTM | $ | 1,001,181 | |||
| Fixed Charge Coverage | 4.1 x | ||||
26 |
||||||||
| AMH | ||||||||
27 |
||||||||
| AMH | ||||||||
| For the Three Months Ended Sep 30, |
For the Nine Months Ended Sep 30, |
||||||||||||||||||||||
| 2025 | 2024 | 2025 | 2024 | ||||||||||||||||||||
| Net income | $ | 116,801 | $ | 87,640 | $ | 369,138 | $ | 324,269 | |||||||||||||||
| Interest expense | 48,199 | 43,611 | 139,928 | 120,866 | |||||||||||||||||||
| Depreciation and amortization | 126,656 | 119,691 | 378,523 | 353,020 | |||||||||||||||||||
| EBITDA | $ | 291,656 | $ | 250,942 | $ | 887,589 | $ | 798,155 | |||||||||||||||
| Gain on sale and impairment of single-family properties and other, net | (47,620) | (32,697) | (161,544) | (145,490) | |||||||||||||||||||
| Adjustments for unconsolidated real estate joint ventures | 1,918 | 1,116 | 5,223 | 3,909 | |||||||||||||||||||
| EBITDAre | $ | 245,954 | $ | 219,361 | $ | 731,268 | $ | 656,574 | |||||||||||||||
| Noncash share-based compensation - general and administrative | 3,917 | 3,601 | 12,771 | 17,999 | |||||||||||||||||||
| Noncash share-based compensation - property management | 864 | 1,043 | 3,247 | 3,827 | |||||||||||||||||||
| Acquisition, other transaction costs and other | 3,158 | 2,605 | 8,693 | 8,866 | |||||||||||||||||||
| Hurricane-related charges, net | — | 3,904 | — | 3,904 | |||||||||||||||||||
| Loss on early extinguishment of debt | 180 | 5,306 | 396 | 6,323 | |||||||||||||||||||
| Adjusted EBITDAre | $ | 254,073 | $ | 235,820 | $ | 756,375 | $ | 697,493 | |||||||||||||||
| Recurring Capital Expenditures | (20,399) | (23,088) | (57,743) | (58,615) | |||||||||||||||||||
| Leasing costs | (765) | (995) | (3,102) | (2,832) | |||||||||||||||||||
| Fully Adjusted EBITDAre | $ | 232,909 | $ | 211,737 | $ | 695,530 | $ | 636,046 | |||||||||||||||
| Rents and other single-family property revenues | $ | 478,464 | $ | 445,055 | $ | 1,395,243 | $ | 1,292,104 | |||||||||||||||
| Less: tenant charge-backs | (72,843) | (67,615) | (189,161) | (172,323) | |||||||||||||||||||
| Adjustments for unconsolidated joint ventures - income | 3,675 | 3,935 | 10,839 | 10,575 | |||||||||||||||||||
| Rents and other single-family property revenues, net of tenant charge-backs and adjustments for unconsolidated joint ventures | $ | 409,296 | $ | 381,375 | $ | 1,216,921 | $ | 1,130,356 | |||||||||||||||
| Adjusted EBITDAre Margin | 62.1 | % | 61.8 | % | 62.2 | % | 61.7 | % | |||||||||||||||
| Fully Adjusted EBITDAre Margin | 56.9 | % | 55.5 | % | 57.2 | % | 56.3 | % | |||||||||||||||
28 |
||||||||
| AMH | ||||||||
| For the Trailing Twelve Months Ended | |||||||||||||||||||||||||||||
| Sep 30, 2025 |
Jun 30, 2025 |
Mar 31, 2025 |
Dec 31, 2024 |
Sep 30, 2024 |
|||||||||||||||||||||||||
| Net income | $ | 513,011 | $ | 483,850 | $ | 468,760 | $ | 468,142 | $ | 415,206 | |||||||||||||||||||
| Interest expense | 184,413 | 179,825 | 172,200 | 165,351 | 155,957 | ||||||||||||||||||||||||
| Depreciation and amortization | 502,513 | 495,548 | 486,212 | 477,010 | 468,791 | ||||||||||||||||||||||||
| EBITDA | $ | 1,199,937 | $ | 1,159,223 | $ | 1,127,172 | $ | 1,110,503 | $ | 1,039,954 | |||||||||||||||||||
| Gain on sale and impairment of single-family properties and other, net | (241,810) | (226,887) | (218,871) | (225,756) | (174,572) | ||||||||||||||||||||||||
| Adjustments for unconsolidated real estate joint ventures | 6,036 | 5,234 | 4,609 | 4,722 | 5,240 | ||||||||||||||||||||||||
| EBITDAre | $ | 964,163 | $ | 937,570 | $ | 912,910 | $ | 889,469 | $ | 870,622 | |||||||||||||||||||
| Noncash share-based compensation - general and administrative | 15,389 | 15,073 | 18,645 | 20,617 | 20,493 | ||||||||||||||||||||||||
| Noncash share-based compensation - property management | 4,234 | 4,413 | 4,616 | 4,814 | 4,706 | ||||||||||||||||||||||||
| Acquisition, other transaction costs and other | 12,019 | 11,466 | 12,958 | 12,192 | 13,126 | ||||||||||||||||||||||||
| Hurricane-related charges, net | 4,980 | 8,884 | 8,884 | 8,884 | 3,904 | ||||||||||||||||||||||||
| Loss on early extinguishment of debt | 396 | 5,522 | 5,585 | 6,323 | 6,323 | ||||||||||||||||||||||||
| Adjusted EBITDAre | $ | 1,001,181 | $ | 982,928 | $ | 963,598 | $ | 942,299 | $ | 919,174 | |||||||||||||||||||
29 |
||||||||
| AMH | ||||||||
| For the Three Months Ended Sep 30, |
For the Nine Months Ended Sep 30, |
||||||||||||||||||||||
| 2025 | 2024 | 2025 | 2024 | ||||||||||||||||||||
| Property management expenses | $ | 33,384 | $ | 31,973 | $ | 101,977 | $ | 95,757 | |||||||||||||||
| Less: tenant charge-backs | (2,480) | (2,026) | (7,035) | (5,837) | |||||||||||||||||||
| Less: noncash share-based compensation - property management | (864) | (1,043) | (3,247) | (3,827) | |||||||||||||||||||
| Property management expenses, net | $ | 30,040 | $ | 28,904 | $ | 91,695 | $ | 86,093 | |||||||||||||||
| General and administrative expense | $ | 20,503 | $ | 19,247 | $ | 60,182 | $ | 62,825 | |||||||||||||||
| Less: noncash share-based compensation - general and administrative | (3,917) | (3,601) | (12,771) | (17,999) | |||||||||||||||||||
| General and administrative expense, net | $ | 16,586 | $ | 15,646 | $ | 47,411 | $ | 44,826 | |||||||||||||||
30 |
||||||||
| AMH | ||||||||
| For the Three Months Ended Sep 30, |
For the Nine Months Ended Sep 30, |
||||||||||||||||||||||
| 2025 | 2024 | 2025 | 2024 | ||||||||||||||||||||
| Net income per common share–diluted | $ | 0.27 | $ | 0.20 | $ | 0.85 | $ | 0.75 | |||||||||||||||
| Adjustments: | |||||||||||||||||||||||
| Conversion from GAAP share count | (0.03) | (0.02) | (0.10) | (0.09) | |||||||||||||||||||
| Noncontrolling interests in the Operating Partnership | 0.03 | 0.02 | 0.10 | 0.09 | |||||||||||||||||||
| Gain on sale and impairment of single-family properties and other, net | (0.11) | (0.08) | (0.38) | (0.35) | |||||||||||||||||||
| Adjustments for unconsolidated real estate joint ventures | — | — | 0.01 | 0.01 | |||||||||||||||||||
| Depreciation and amortization | 0.30 | 0.29 | 0.90 | 0.84 | |||||||||||||||||||
| Less: depreciation and amortization of non-real estate assets | (0.01) | (0.01) | (0.04) | (0.03) | |||||||||||||||||||
| FFO attributable to common share and unit holders | $ | 0.45 | $ | 0.40 | $ | 1.34 | $ | 1.22 | |||||||||||||||
| Adjustments: | |||||||||||||||||||||||
| Acquisition, other transaction costs and other | 0.01 | 0.01 | 0.01 | 0.02 | |||||||||||||||||||
| Noncash share-based compensation - general and administrative | 0.01 | 0.01 | 0.03 | 0.04 | |||||||||||||||||||
| Noncash share-based compensation - property management | — | — | 0.01 | 0.01 | |||||||||||||||||||
| Hurricane-related charges, net | — | 0.01 | — | 0.01 | |||||||||||||||||||
| Loss on early extinguishment of debt | — | 0.01 | — | 0.02 | |||||||||||||||||||
| Core FFO attributable to common share and unit holders | $ | 0.47 | $ | 0.44 | $ | 1.39 | $ | 1.32 | |||||||||||||||
| Recurring Capital Expenditures | (0.05) | (0.06) | (0.13) | (0.14) | |||||||||||||||||||
| Leasing costs | — | — | (0.01) | (0.01) | |||||||||||||||||||
| Adjusted FFO attributable to common share and unit holders | $ | 0.42 | $ | 0.38 | $ | 1.25 | $ | 1.17 | |||||||||||||||
31 |
||||||||
| AMH | ||||||||
| For the Three Months Ended Sep 30, 2025 |
|||||
| Adjusted FFO attributable to common share and unit holders | $ | 175,528 | |||
| Common distributions | (126,610) | ||||
| Retained Cash Flow | $ | 48,918 | |||
32 |
||||||||
| AMH | ||||||||
33 |
||||||||
| Executive Management | ||||||||
| Bryan Smith | Sara Vogt-Lowell | |||||||
| Chief Executive Officer | Chief Administrative Officer, Chief Legal Officer and Secretary | |||||||
| Chris Lau | ||||||||
| Chief Financial Officer and Senior Executive Vice President | ||||||||
| AMH Diversified Portfolio | ||||||||
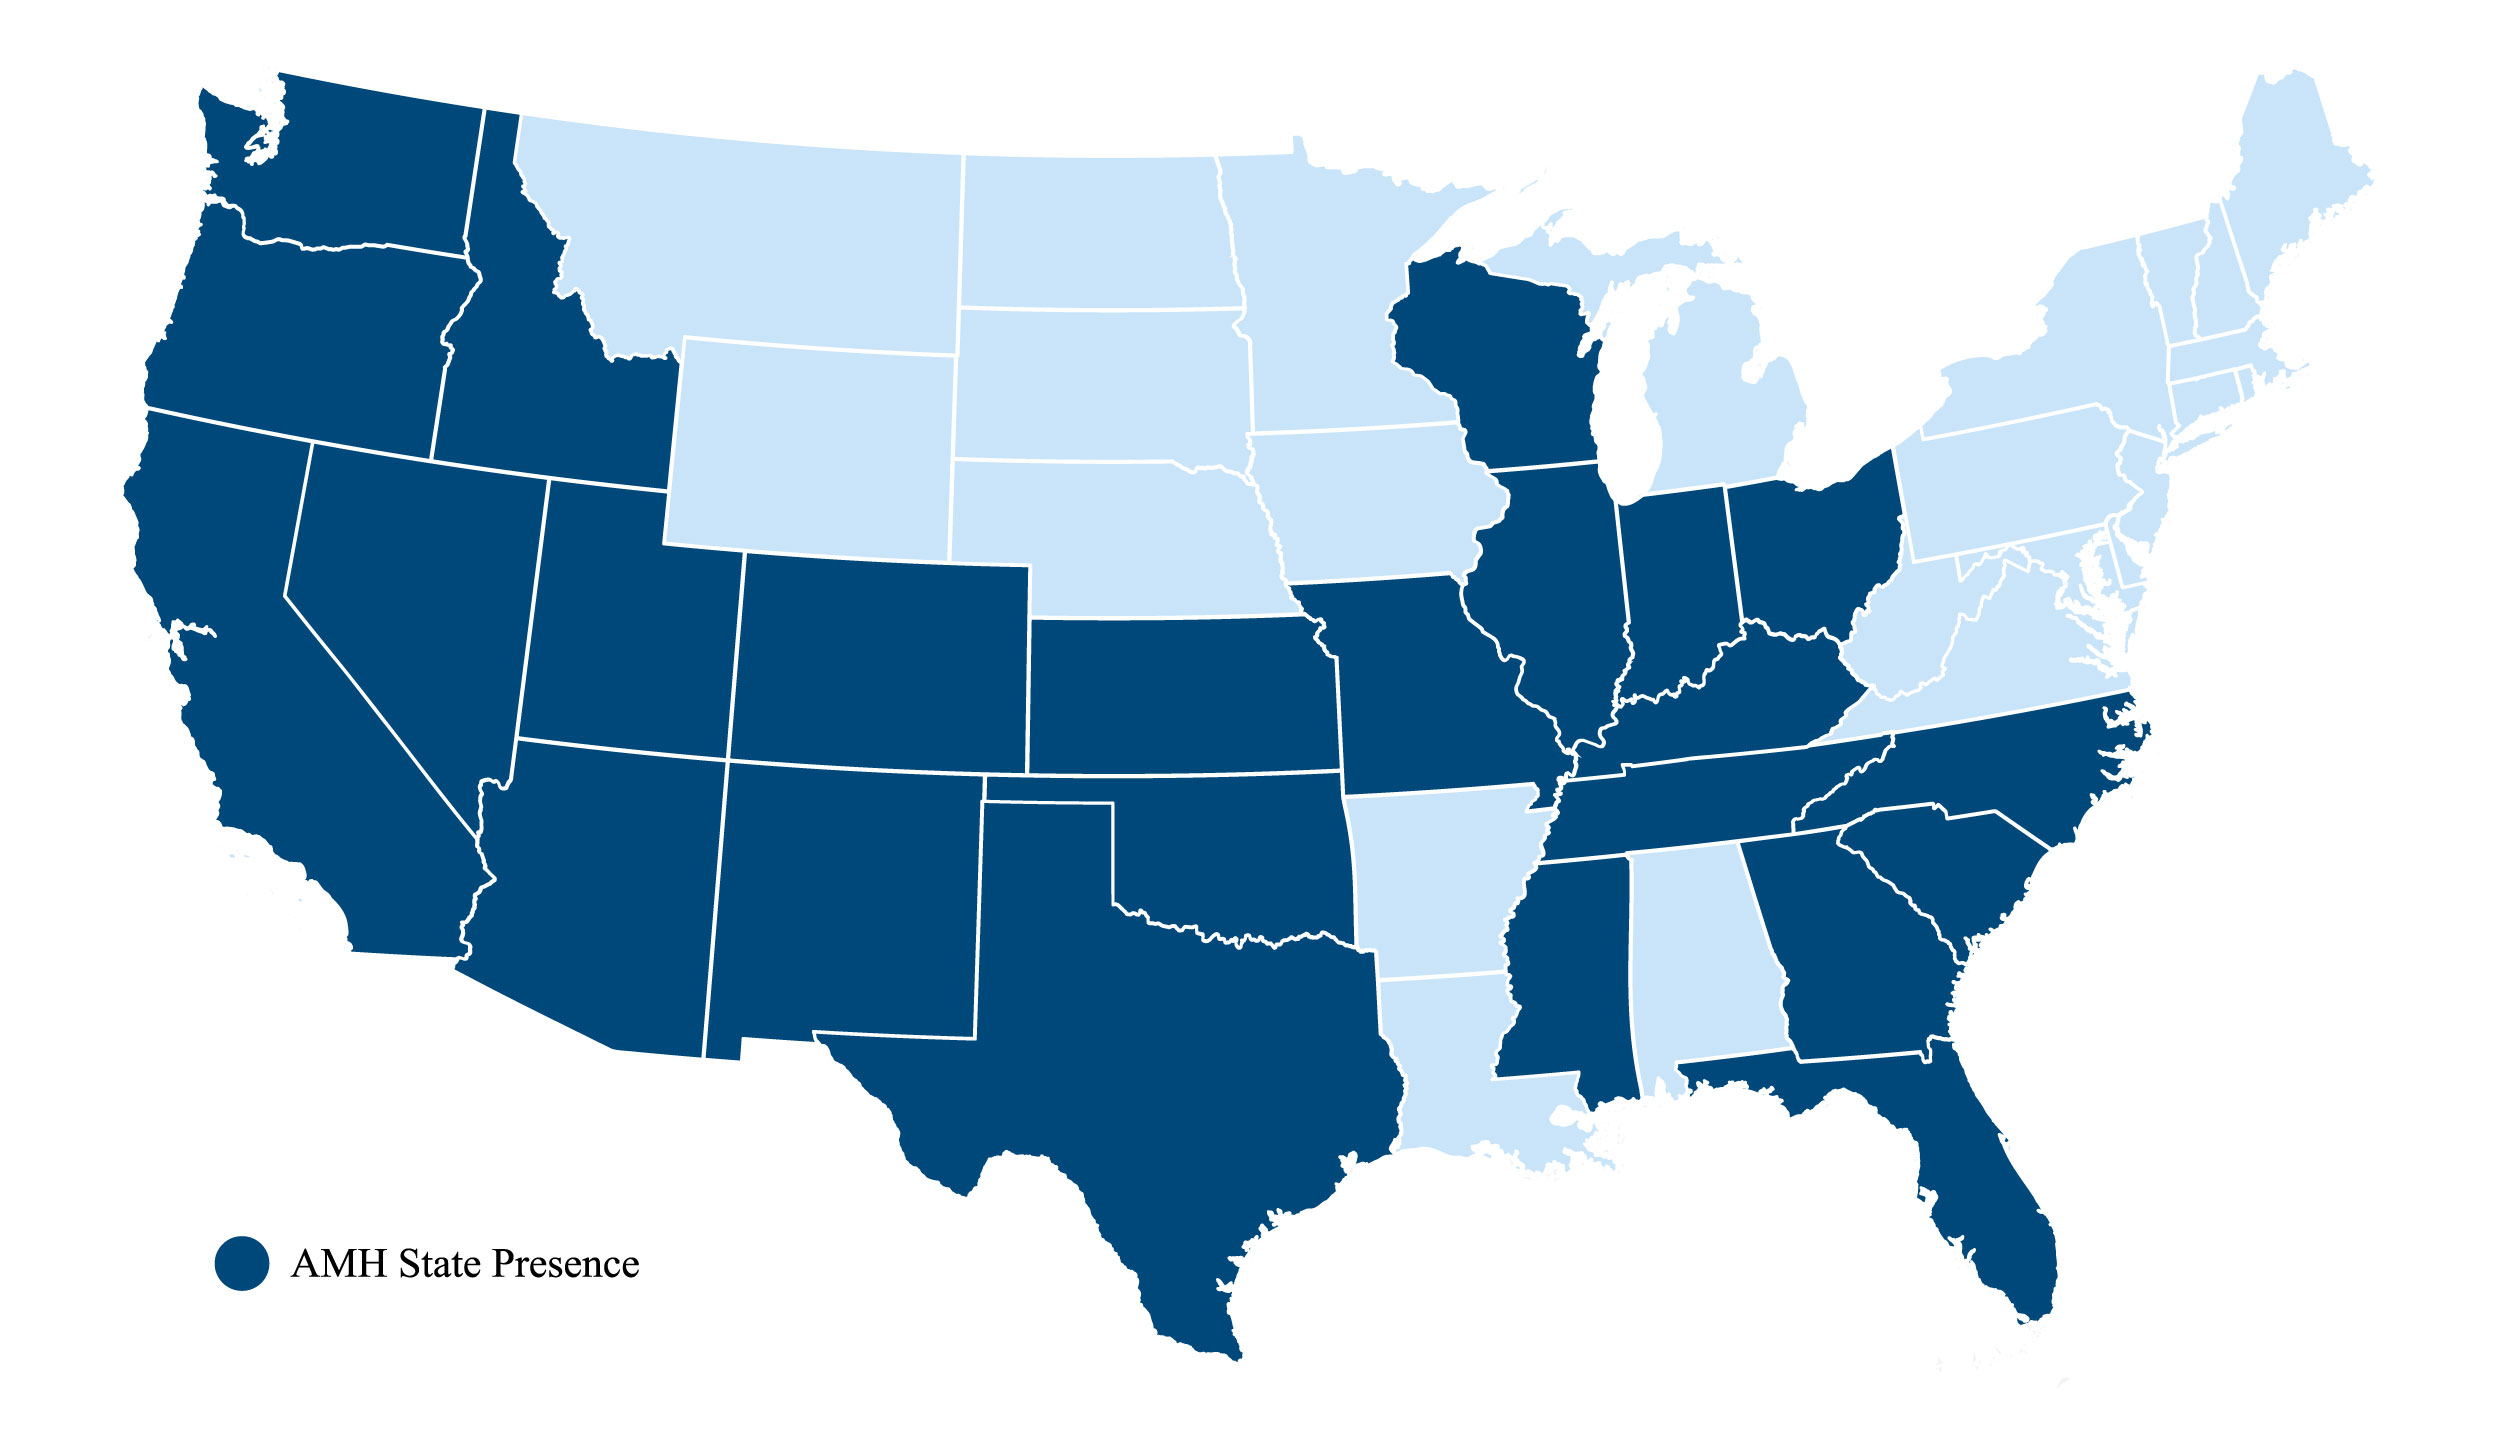
| Corporate Information | Investor Relations | |||||||
| 280 Pilot Road | (855) 794-2447 | |||||||
| Las Vegas, NV 89119 | investors@amh.com | |||||||
| Media Relations | ||||||||
| 23975 Park Sorrento, Suite 300 | ||||||||
| Calabasas, CA 91302 | (855) 774-4663 | |||||||
| media@amh.com | ||||||||
| (702) 847-7800 | ||||||||
| www.amh.com | ||||||||