UNITED STATES
SECURITIES AND EXCHANGE COMMISSION
Washington, D.C. 20459
FORM 8-K
CURRENT REPORT PURSUANT TO SECTION 13 OR 15(D)
OF THE SECURITIES EXCHANGE ACT OF 1934
Date of report: April 29, 2024
(Date of earliest event reported)
LTC PROPERTIES, INC.
(Exact name of Registrant as specified in its charter)
Maryland |
|
1-11314 |
|
71-0720518 |
(State or other jurisdiction of |
|
(Commission file number) |
|
(I.R.S. Employer |
incorporation or organization) |
|
|
|
Identification No) |
3011 Townsgate Road, Suite 220
Westlake Village, CA 91361
(Address of principal executive offices)
(805) 981-8655
(Registrant’s telephone number, including area code)
2829 Townsgate Road, Suite 350 Westlake Village, CA 91361
(Former Address)
Check the appropriate box below if the Form 8-K filing is intended to simultaneously satisfy the filing obligation of the registrant under any of the following provisions (see General Instruction A.2. below):
☐ Written communications pursuant to Rule 425 under the Securities Act (17 CFR 230.425)
☐ Soliciting material pursuant to Rule 14a-12 under the Exchange Act (17 CFR 240.14a-12)
☐ Pre-commencement communications pursuant to Rule 14d-2(b) under the Exchange Act (17 CFR 240.14d-2(b))
☐ Pre-commencement communications pursuant to Rule 13e-4(c) under the Exchange Act (17 CFR 240.13e-4(c))
Securities registered pursuant to Section 12(b) of the Act:
Title of each class |
|
Trading symbol(s) |
|
Name of each exchange on which registered |
Common stock, $.01 par value |
|
LTC |
|
New York Stock Exchange |
Indicate by check mark whether the registrant is an emerging growth company as defined in Rule 405 of the Securities Act of 1933 (§230.405 of this chapter) or Rule 12b-2 of the Securities Exchange Act of 1934 (§240.12b-2 of this chapter).
Emerging growth company ☐
If an emerging growth company, indicate by check mark if the registrant has elected not to use the extended transition period for complying with any new or revised financial accounting standards provided pursuant to Section 13(a) of the Exchange Act. ☐
Item 2.02. — Results of Operations and Financial Condition
On April 29, 2024, LTC Properties, Inc. announced the operating results for the quarter ended March 31, 2024. The text of the press release and the supplemental information package are furnished herewith as Exhibits 99.1 and 99.2, respectively, and are specifically incorporated by reference herein.
The information in this Form 8-K and the related information in the exhibits attached hereto shall not be deemed “filed” for purposes of Section 18 of the Securities Exchange Act of 1934, as amended (the “Exchange Act”), or otherwise subject to the liabilities of that section and shall not be incorporated by reference into any filing of LTC under the Securities Act of 1933, as amended, or the Exchange Act, regardless of any general incorporation language in such filing, except as shall be expressly set forth by specific reference in any such filing.
Item 9.01. — Financial Statements and Exhibits
99.1 |
||
|
|
|
99.2 |
LTC Properties, Inc. Supplemental Information Package for the period ending March 31, 2024. |
|
|
|
|
104 |
Cover Page Interactive Data File (embedded within the Inline XBRL document) |
SIGNATURE
Pursuant to the requirements of Section 13 or 15(d) of the Securities Exchange Act of 1934, the Registrant has duly caused this report to be signed on its behalf by the undersigned, hereunto duly authorized.
|
LTC PROPERTIES, INC. |
|
|
|
|
Dated: April 29, 2024 |
By: |
/s/WENDY L. SIMPSON |
|
|
Wendy L. Simpson |
|
|
Chairman & CEO |
Exhibit 99.1
|
|
FOR IMMEDIATE RELEASE For more information contact: Mandi Hogan (805) 981-8655 |
LTC REPORTS 2024 FIRST QUARTER RESULTS AND DISCUSSES RECENT ACTIVITIES
WESTLAKE VILLAGE, CALIFORNIA, April 29, 2024 -- LTC Properties, Inc. (NYSE: LTC) (“LTC” or the “Company”), a real estate investment trust that primarily invests in seniors housing and health care properties, today announced operating results for the first quarter ended March 31, 2024.
|
|
|
|
|
|
|
|
|
Three Months Ended |
||||
|
|
March 31, |
||||
|
|
2024 |
|
2023 |
||
|
|
(unaudited) |
||||
|
|
|
|
|
|
|
Net income available to common stockholders |
|
$ |
24,065 |
|
$ |
32,929 |
Diluted earnings per common share |
|
$ |
0.56 |
|
$ |
0.80 |
NAREIT funds from operations ("FFO") attributable to common stockholders |
|
$ |
29,909 |
|
$ |
27,200 |
NAREIT diluted FFO per common share |
|
$ |
0.69 |
|
$ |
0.66 |
FFO attributable to common stockholders, excluding non-recurring items |
|
$ |
27,532 |
|
$ |
27,462 |
Funds available for distribution ("FAD") |
|
$ |
31,274 |
|
$ |
30,085 |
FAD, excluding non-recurring items |
|
$ |
28,897 |
|
$ |
28,515 |
First quarter 2024 financial results were impacted by:
| ● | Higher rental revenue due to the repayment of $2.4 million of rent credit in connection with the sale of a 110-unit assisted living community, discussed below, rent received from a 2023 second quarter acquisition, the timing of cash rent received, lease renewals, and annual rent escalations, partially offset by property sales and transitioned portfolios; |
| ● | Higher interest income from mortgage loans resulting from mortgage loan originations during 2023, and funding under a construction loan in 2024; |
| ● | Lower interest and other income primarily due to the exit IRR and prepayment fee received in 2023 in connection to the payoff of two mezzanine loans, partially offset by a 2023 mezzanine loan origination; |
| ● | Higher interest expense primarily due to higher interest rates and a higher outstanding balance on LTC’s revolving line of credit, partially offset by scheduled principal paydowns on LTC’s senior unsecured notes; |
| ● | Decrease in provision for credit losses primarily due to higher dollar volume of loan originations in the 2023 first quarter than in the 2024 first quarter; and |
| ● | A $3.3 million net gain on sale in 2024 related to seven assisted living communities, of which five were located in Texas, one was located in Florida and one was located in Wisconsin. See below for further discussion of the sales transactions. |
During the first quarter of 2024, LTC completed the following transactions:
| ● | Completed the previously announced sale and re-lease process for 10 assisted living communities under the ALG Senior (“ALG”) master lease. These properties, seven of which were built in the 90s, are primarily located in small rural towns, were non-revenue generating, and were temporarily transitioned to ALG in July 2022 following the COVID pandemic, allowing LTC time to find a more permanent solution for the portfolio, as follows: |
1
| o | Transitioned two of the properties located in Georgia and South Carolina to an operator new to LTC. The lease term is two years with two one-year extension options. The initial rent for the first six months is zero, after which rent will be based on mutually agreed upon fair market rent. The master lease includes a purchase option that can be exercised in 2027, if the two one-year lease extensions are exercised. Additionally, LTC agreed to fund up to $906,000 for capital improvements for the first year, and up to $240,000 for a working capital note, at 8.25%, maturing on December 31, 2025; |
| o | Sold five of the properties located in Texas for $1.6 million, as mentioned above. LTC received $925,000 of proceeds, net of transaction costs, and recorded a loss on sale of $356,000; |
| o | In April 2024, two of the properties located in Texas, that were closed in 2023 and 2024, were sold for $500,000. LTC received proceeds of approximately $400,000, net of transaction costs, and anticipates recording a minimal gain on sale in the second quarter of 2024; and |
| o | In April 2024, transitioned one of the properties located in Texas to an operator new to LTC. The lease term is for two years with two one-year extension options, each of which is contingent on certain coverage thresholds. The initial rent for the first six months is zero, after which rent will be based on mutually agreed upon fair market rent. The master lease includes a purchase option that can be exercised beginning in 2026, if the one-year lease extension is exercised. Additionally, LTC agreed to fund up to $570,000 for capital improvements for the first year of the lease, and up to $290,000 for a working capital note, at a rate of 9.0%, maturing concurrently with the master lease maturity. |
| ● | As previously announced, sold its interest in a joint venture investment in a 110-unit assisted living community in Wisconsin for $23.1 million, which yielded 8.1% to LTC in 2023. The purchase price included repayment of $2.4 million of rent credit provided to the operator during new construction lease-up, as well as the payoff of a $550,000 note receivable. LTC received net proceeds of $20.2 million, net of transaction costs, and recorded a gain on sale of $4.0 million; |
| ● | Sold a 60-unit assisted living community in Florida for $4.5 million, as mentioned above. LTC received proceeds of $4.3 million, net of transaction costs, and recorded a loss on sale of $319,000; |
| ● | Funded $2.9 million under a $19.5 million mortgage loan commitment for the construction of an 85-unit assisted living and memory care community in Michigan. The borrower contributed $12.1 million of equity upon origination in July 2023, which was used to initially fund the construction. The loan has a term of approximately three years, and is interest only at a rate of 8.75%. The loan includes two, one-year extensions, each of which is contingent on certain coverage thresholds; |
| ● | As previously announced, amended its unsecured revolving line of credit to accelerate the one-year extension option notice date to January 4, 2024. Concurrently, LTC exercised its option to extend the maturity date on its unsecured revolving line of credit to November 19, 2026. All other provisions of the agreement remain unchanged; |
| ● | Repaid $25.2 million under LTC’s revolving line of credit; |
| ● | Paid $6.0 million in regular scheduled principal payments under LTC’s senior unsecured notes; and |
| ● | Sold 139,100 shares of LTC’s common stock for $4.5 million in net proceeds under its equity distribution agreements. |
Subsequent to March 31, 2024, LTC completed the following transactions:
| ● | As previously announced, originated a $12.7 million mortgage loan to Ignite Medical Resorts. The mortgage loan is secured by a skilled nursing and assisted living campus in Texas. The campus was built in 2017, and includes 78 units (48 skilled nursing and 30 assisted living) and 104 licensed beds (70 skilled nursing and 34 assisted living). The five-year mortgage loan is interest only at a current rate of 9.15%. The investment will be accounted for as an unconsolidated joint venture, and is expected to generate approximately $884,000 of revenue in 2024; |
| ● | Transitioned an assisted living community located in Texas from ALG to an operator new to LTC, and sold two former ALG assisted living communities for $500,000, as mentioned above; |
| ● | Executed a term sheet with HMG Healthcare (“HMG”), whereby an agreement has been reached, in principle, to amend the master lease covering 11 skilled nursing centers in Texas to extend the term through December 2028. Annual rent will increase by $1.0 million to $9.0 million for 2024. Rent will increase to $9.5 million in 2025, to $10.0 million in 2026 and then escalating 3.3% annually thereafter through 2028. The amended master lease provides HMG with two five-year renewal options, with rent in the initial year of the first renewal term adjusting to fair market rent subject to a collar between 2.5% and 12.5%. As a condition of the amendment, HMG will repay $11.9 million on its $13.5 million working capital note during the 2024 second quarter. Upon the repayment, the remaining balance of the working capital note will be interest-free, and will be repaid in installments through 2028; |
2
| ● | An operator exercised its renewal option for another five years, from March 2025 through February 2030. Annual cash and GAAP rent for 2024 are $8.0 million and $7.0 million, respectively, escalating 2.5% annually. The master lease covers 666 beds across four skilled nursing centers, three in Texas and one in Wisconsin, and a behavioral health care hospital in Nevada; and |
| ● | Sold 204,700 shares of common stock for $6.5 million in net proceeds under its equity distribution agreements. |
“After solid execution in 2023 during which we further optimized and strengthened our portfolio, we entered this year stronger and in a better position to concentrate on growing our company,” said Wendy Simpson, LTC’s Chairman and Chief Executive Officer. “Our senior management team is devoting the majority of their time on producing this strategic, long-term and sustainable growth, and we feel very good about LTC’s future opportunities.”
Conference Call Information
LTC will conduct a conference call on Tuesday, April 30, 2024, at 8:00 a.m. Pacific Time (11:00 a.m. Eastern Time), to provide commentary on its performance and operating results for the quarter ended March 31, 2024. The conference call is accessible by telephone and the internet. Interested parties may access the live conference call via the following:
Webcast |
|
www.LTCreit.com |
USA Toll-Free Number |
|
(888) 506-0062 |
International Number |
|
(973) 528-0011 |
Conference Access Code |
|
674331 |
Additionally, an audio replay of the call will be available one hour after the live call through May 14, 2024 via the following:
USA Toll-Free Number |
|
(877) 481-4010 |
International Number |
|
(919) 882-2331 |
Conference Number |
|
50325 |
About LTC
LTC is a real estate investment trust (REIT) investing in seniors housing and health care properties primarily through sale-leasebacks, mortgage financing, joint-ventures and structured finance solutions including preferred equity and mezzanine lending. LTC’s investment portfolio includes 194 properties in 26 states with 32 operating partners. Based on its gross real estate investments, LTC’s investment portfolio is comprised of approximately 50% seniors housing and 50% skilled nursing properties. Learn more at www.LTCreit.com.
Forward-Looking Statements
This press release includes statements that are not purely historical and are “forward-looking statements” within the meaning of Section 27A of the Securities Act of 1933, as amended, and Section 21E of the Securities Exchange Act of 1934, as amended, including statements regarding the Company’s expectations, beliefs, intentions or strategies regarding the future. All statements other than historical facts contained in this press release are forward-looking statements. These forward-looking statements involve a number of risks and uncertainties. Please see LTC’s most recent Annual Report on Form 10-K, its subsequent Quarterly Reports on Form 10-Q, and its other publicly available filings with the Securities and Exchange Commission for a discussion of these and other risks and uncertainties. All forward-looking statements included in this press release are based on information available to the Company on the date hereof, and LTC assumes no obligation to update such forward-looking statements. Although the Company’s management believes that the assumptions and expectations reflected in such forward-looking statements are reasonable, no assurance can be given that such expectations will prove to have been correct. The actual results achieved by the Company may differ materially from any forward-looking statements due to the risks and uncertainties of such statements.
(financial tables follow)
3
LTC PROPERTIES, INC.
CONSOLIDATED STATEMENTS OF INCOME
(amounts in thousands, except per share amounts)
|
|
Three Months Ended |
||||
|
|
March 31, |
||||
|
|
2024 |
|
2023 |
||
|
|
(unaudited) |
||||
Revenues: |
|
|
|
|
|
|
Rental income |
|
$ |
33,549 |
|
$ |
31,735 |
Interest income from financing receivables(1) |
|
|
3,830 |
|
|
3,751 |
Interest income from mortgage loans |
|
|
12,448 |
|
|
11,244 |
Interest and other income |
|
|
1,539 |
|
|
2,770 |
Total revenues |
|
|
51,366 |
|
|
49,500 |
|
|
|
|
|
|
|
Expenses: |
|
|
|
|
|
|
Interest expense |
|
|
11,045 |
|
|
10,609 |
Depreciation and amortization |
|
|
9,095 |
|
|
9,210 |
Impairment loss |
|
|
— |
|
|
434 |
Provision for credit losses |
|
|
24 |
|
|
1,731 |
Transaction costs |
|
|
266 |
|
|
117 |
Property tax expense |
|
|
3,383 |
|
|
3,293 |
General and administrative expenses |
|
|
6,491 |
|
|
6,294 |
Total expenses |
|
|
30,304 |
|
|
31,688 |
|
|
|
|
|
|
|
Other operating income: |
|
|
|
|
|
|
Gain on sale of real estate, net |
|
|
3,251 |
|
|
15,373 |
Operating income |
|
|
24,313 |
|
|
33,185 |
Income from unconsolidated joint ventures |
|
|
376 |
|
|
376 |
Net income |
|
|
24,689 |
|
|
33,561 |
Income allocated to non-controlling interests |
|
|
(459) |
|
|
(427) |
Net income attributable to LTC Properties, Inc. |
|
|
24,230 |
|
|
33,134 |
Income allocated to participating securities |
|
|
(165) |
|
|
(205) |
Net income available to common stockholders |
|
$ |
24,065 |
|
$ |
32,929 |
|
|
|
|
|
|
|
Earnings per common share: |
|
|
|
|
|
|
Basic |
|
$ |
0.56 |
|
$ |
0.80 |
Diluted |
|
$ |
0.56 |
|
$ |
0.80 |
|
|
|
|
|
|
|
Weighted average shares used to calculate earnings per |
|
|
|
|
|
|
common share: |
|
|
|
|
|
|
Basic |
|
|
42,891 |
|
|
41,082 |
Diluted |
|
|
43,032 |
|
|
41,189 |
|
|
|
|
|
|
|
Dividends declared and paid per common share |
|
$ |
0.57 |
|
$ |
0.57 |
| (1) | Represents rental income from acquisitions through sale-leaseback transactions, subject to leases which contain purchase options. In accordance with GAAP, the properties are required to be presented as financing receivables on our Consolidated Balance Sheets and the rental income to be presented as Interest income from financing receivables on our Consolidated Statements of Income. |
4
Supplemental Reporting Measures
FFO and FAD are supplemental measures of a real estate investment trust’s (“REIT”) financial performance that are not defined by U.S. generally accepted accounting principles (“GAAP”). Investors, analysts and the Company use FFO and FAD as supplemental measures of operating performance. The Company believes FFO and FAD are helpful in evaluating the operating performance of a REIT. Real estate values historically rise and fall with market conditions, but cost accounting for real estate assets in accordance with GAAP assumes that the value of real estate assets diminishes predictably over time. We believe that by excluding the effect of historical cost depreciation, which may be of limited relevance in evaluating current performance, FFO and FAD facilitate like comparisons of operating performance between periods. Occasionally, the Company may exclude non-recurring items from FFO and FAD in order to allow investors, analysts and our management to compare the Company’s operating performance on a consistent basis without having to account for differences caused by unanticipated items.
FFO, as defined by the National Association of Real Estate Investment Trusts (“NAREIT”), means net income available to common stockholders (computed in accordance with GAAP) excluding gains or losses on the sale of real estate and impairment write-downs of depreciable real estate, plus real estate depreciation and amortization, and after adjustments for unconsolidated partnerships and joint ventures. The Company’s computation of FFO may not be comparable to FFO reported by other REITs that do not define the term in accordance with the current NAREIT definition or have a different interpretation of the current NAREIT definition from that of the Company; therefore, caution should be exercised when comparing our Company’s FFO to that of other REITs.
We define FAD as FFO excluding the effects of straight-line rent, amortization of lease inducement, effective interest income, deferred income from unconsolidated joint ventures, non-cash compensation charges, capitalized interest and non-cash interest charges. GAAP requires rental revenues related to non-contingent leases that contain specified rental increases over the life of the lease to be recognized evenly over the life of the lease. This method results in rental income in the early years of a lease that is higher than actual cash received, creating a straight-line rent receivable asset included in our consolidated balance sheet. At some point during the lease, depending on its terms, cash rent payments exceed the straight-line rent which results in the straight-line rent receivable asset decreasing to zero over the remainder of the lease term. Effective interest method, as required by GAAP, is a technique for calculating the actual interest rate for the term of a mortgage loan based on the initial origination value. Similar to the accounting methodology of straight-line rent, the actual interest rate is higher than the stated interest rate in the early years of the mortgage loan thus creating an effective interest receivable asset included in the interest receivable line item in our consolidated balance sheet and reduces down to zero when, at some point during the mortgage loan, the stated interest rate is higher than the actual interest rate. FAD is useful in analyzing the portion of cash flow that is available for distribution to stockholders. Investors, analysts and the Company utilize FAD as an indicator of common dividend potential. The FAD payout ratio, which represents annual distributions to common shareholders expressed as a percentage of FAD, facilitates the comparison of dividend coverage between REITs.
While the Company uses FFO and FAD as supplemental performance measures of our cash flow generated by operations and cash available for distribution to stockholders, such measures are not representative of cash generated from operating activities in accordance with GAAP, and are not necessarily indicative of cash available to fund cash needs and should not be considered an alternative to net income available to common stockholders.
5
Reconciliation of FFO and FAD
The following table reconciles GAAP net income available to common stockholders to each of NAREIT FFO attributable to common stockholders and FAD (unaudited, amounts in thousands, except per share amounts):
|
|
Three Months Ended |
|
||||
|
|
March 31, |
|
||||
|
|
2024 |
|
2023 |
|
||
|
|
|
|
|
|
|
|
GAAP net income available to common stockholders |
|
$ |
24,065 |
|
$ |
32,929 |
|
Add: Impairment loss |
|
|
— |
|
|
434 |
|
Add: Depreciation and amortization |
|
|
9,095 |
|
|
9,210 |
|
Less: Gain on sale of real estate, net |
|
|
(3,251) |
|
|
(15,373) |
|
NAREIT FFO attributable to common stockholders |
|
|
29,909 |
|
|
27,200 |
|
|
|
|
|
|
|
|
|
Add: Non-recurring items |
|
|
(2,377) |
(1) |
|
262 |
(2) |
FFO attributable to common stockholders, excluding non-recurring items |
|
$ |
27,532 |
|
$ |
27,462 |
|
|
|
|
|
|
|
|
|
NAREIT FFO attributable to common stockholders |
|
$ |
29,909 |
|
$ |
27,200 |
|
Non-cash income: |
|
|
|
|
|
|
|
Add: straight-line rental adjustment |
|
|
550 |
|
|
465 |
|
Add: amortization of lease incentives |
|
|
233 |
|
|
209 |
|
Less: Effective interest income |
|
|
(1,644) |
|
|
(1,608) |
|
Net non-cash income |
|
|
(861) |
|
|
(934) |
|
|
|
|
|
|
|
|
|
Non-cash expense: |
|
|
|
|
|
|
|
Add: Non-cash compensation charges |
|
|
2,202 |
|
|
2,088 |
|
Add: Provision for credit losses |
|
|
24 |
|
|
1,731 |
(3) |
Net non-cash expense |
|
|
2,226 |
|
|
3,819 |
|
|
|
|
|
|
|
|
|
Funds available for distribution (FAD) |
|
$ |
31,274 |
|
$ |
30,085 |
|
|
|
|
|
|
|
|
|
Less: Non-recurring income |
|
|
(2,377) |
(1) |
|
(1,570) |
(4) |
Funds available for distribution (FAD), excluding non-recurring items |
|
$ |
28,897 |
|
$ |
28,515 |
|
| (1) | Represents the repayment of rent credit received in connection with the sale of a 110-unit assisted living community in Wisconsin. The rent credit was provided to the operator during new construction lease-up. |
| (2) | Represents the net of (3) and (4) below. |
| (3) | Includes $1,832 of provision for credit losses related to the $121,321 acquisition accounted for as a financing receivable and $61,900 of mortgage loan originations. |
| (4) | Represents the exit IRR and prepayment fee received in 2023 in connection to the payoff of two mezzanine loans. |
6
Reconciliation of FFO and FAD (continued)
The following table continues the reconciliation between GAAP net income available to common stockholders and each of NAREIT FFO attributable to common stockholders and FAD (unaudited, amounts in thousands, except per share amounts):
|
|
Three Months Ended |
||||
|
|
March 31, |
||||
|
|
2024 |
|
2023 |
||
|
|
|
|
|
|
|
NAREIT Basic FFO attributable to common stockholders per share |
|
$ |
0.70 |
|
$ |
0.66 |
NAREIT Diluted FFO attributable to common stockholders per share |
|
$ |
0.69 |
|
$ |
0.66 |
|
|
|
|
|
|
|
NAREIT Diluted FFO attributable to common stockholders |
|
$ |
30,074 |
|
$ |
27,200 |
Weighted average shares used to calculate NAREIT diluted FFO per share attributable to common stockholders |
|
|
43,309 |
|
|
41,189 |
|
|
|
|
|
|
|
|
|
|
|
|
|
|
Diluted FFO attributable to common stockholders, excluding non-recurring items |
|
$ |
27,697 |
|
$ |
27,462 |
Weighted average shares used to calculate diluted FFO, excluding non-recurring items, per share attributable to common stockholders |
|
|
43,309 |
|
|
41,189 |
|
|
|
|
|
|
|
|
|
|
|
|
|
|
Diluted FAD |
|
$ |
31,439 |
|
$ |
30,085 |
|
|
|
|
|
|
|
Weighted average shares used to calculate diluted FAD per share |
|
|
43,309 |
|
|
41,189 |
|
|
|
|
|
|
|
|
|
|
|
|
|
|
Diluted FAD, excluding non-recurring items |
|
$ |
29,062 |
|
$ |
28,515 |
Weighted average shares used to calculate diluted FAD, excluding non-recurring items, per share |
|
|
43,309 |
|
|
41,189 |
|
|
|
|
|
|
|
7
LTC PROPERTIES, INC.
CONSOLIDATED BALANCE SHEETS
(amounts in thousands, except per share, audited)
|
|
March 31, 2024 |
|
December 31, 2023 |
||
|
|
(unaudited) |
|
(audited) |
||
ASSETS |
|
|
|
|
|
|
Investments: |
|
|
|
|
|
|
Land |
|
$ |
120,137 |
|
$ |
121,725 |
Buildings and improvements |
|
|
1,219,622 |
|
|
1,235,600 |
Accumulated depreciation and amortization |
|
|
(383,782) |
|
|
(387,751) |
Operating real estate property, net |
|
|
955,977 |
|
|
969,574 |
Properties held-for-sale, net of accumulated depreciation: 2024—$2,773; 2023—$3,616 |
|
|
389 |
|
|
18,391 |
Real property investments, net |
|
|
956,366 |
|
|
987,965 |
Financing receivables,(1) net of credit loss reserve: 2024—$1,980; 2023—$1,980 |
|
|
196,010 |
|
|
196,032 |
Mortgage loans receivable, net of credit loss reserve: 2024—$4,845; 2023—$4,814 |
|
|
480,250 |
|
|
477,266 |
Real estate investments, net |
|
|
1,632,626 |
|
|
1,661,263 |
Notes receivable, net of credit loss reserve: 2024—$605; 2023—$611 |
|
|
59,946 |
|
|
60,490 |
Investments in unconsolidated joint ventures |
|
|
19,340 |
|
|
19,340 |
Investments, net |
|
|
1,711,912 |
|
|
1,741,093 |
|
|
|
|
|
|
|
Other assets: |
|
|
|
|
|
|
Cash and cash equivalents |
|
|
9,010 |
|
|
20,286 |
Debt issue costs related to revolving line of credit |
|
|
1,786 |
|
|
1,557 |
Interest receivable |
|
|
55,842 |
|
|
53,960 |
Straight-line rent receivable |
|
|
19,075 |
|
|
19,626 |
Lease incentives |
|
|
3,578 |
|
|
2,607 |
Prepaid expenses and other assets |
|
|
17,192 |
|
|
15,969 |
Total assets |
|
$ |
1,818,395 |
|
$ |
1,855,098 |
|
|
|
|
|
|
|
LIABILITIES |
|
|
|
|
|
|
Revolving line of credit |
|
$ |
277,050 |
|
$ |
302,250 |
Term loans, net of debt issue costs: 2024—$305; 2023—$342 |
|
|
99,695 |
|
|
99,658 |
Senior unsecured notes, net of debt issue costs: 2024—$1,194; 2023—$1,251 |
|
|
483,466 |
|
|
489,409 |
Accrued interest |
|
|
4,861 |
|
|
3,865 |
Accrued expenses and other liabilities |
|
|
34,481 |
|
|
43,649 |
Total liabilities |
|
|
899,553 |
|
|
938,831 |
|
|
|
|
|
|
|
EQUITY |
|
|
|
|
|
|
Stockholders’ equity: |
|
|
|
|
|
|
Common stock: $0.01 par value; 60,000 shares authorized; shares issued and outstanding: 2024—43,271; 2023—43,022 |
|
|
433 |
|
|
430 |
Capital in excess of par value |
|
|
996,631 |
|
|
991,656 |
Cumulative net income |
|
|
1,658,625 |
|
|
1,634,395 |
Accumulated other comprehensive income |
|
|
6,488 |
|
|
6,110 |
Cumulative distributions |
|
|
(1,775,928) |
|
|
(1,751,312) |
Total LTC Properties, Inc. stockholders’ equity |
|
|
886,249 |
|
|
881,279 |
Non-controlling interests |
|
|
32,593 |
|
|
34,988 |
Total equity |
|
|
918,842 |
|
|
916,267 |
Total liabilities and equity |
|
$ |
1,818,395 |
|
$ |
1,855,098 |
| (1) | Represents acquisitions through sale-leaseback transactions, subject to leases which contain purchase options. In accordance with GAAP, the properties are required to be presented as financing receivables on our Consolidated Balance Sheets. |
8
|
RENEWAL AND TRANSITION SUPPLEMENTAL OPERATING AND FINANCIAL DATA FIRST QUARTER 2024 |
|
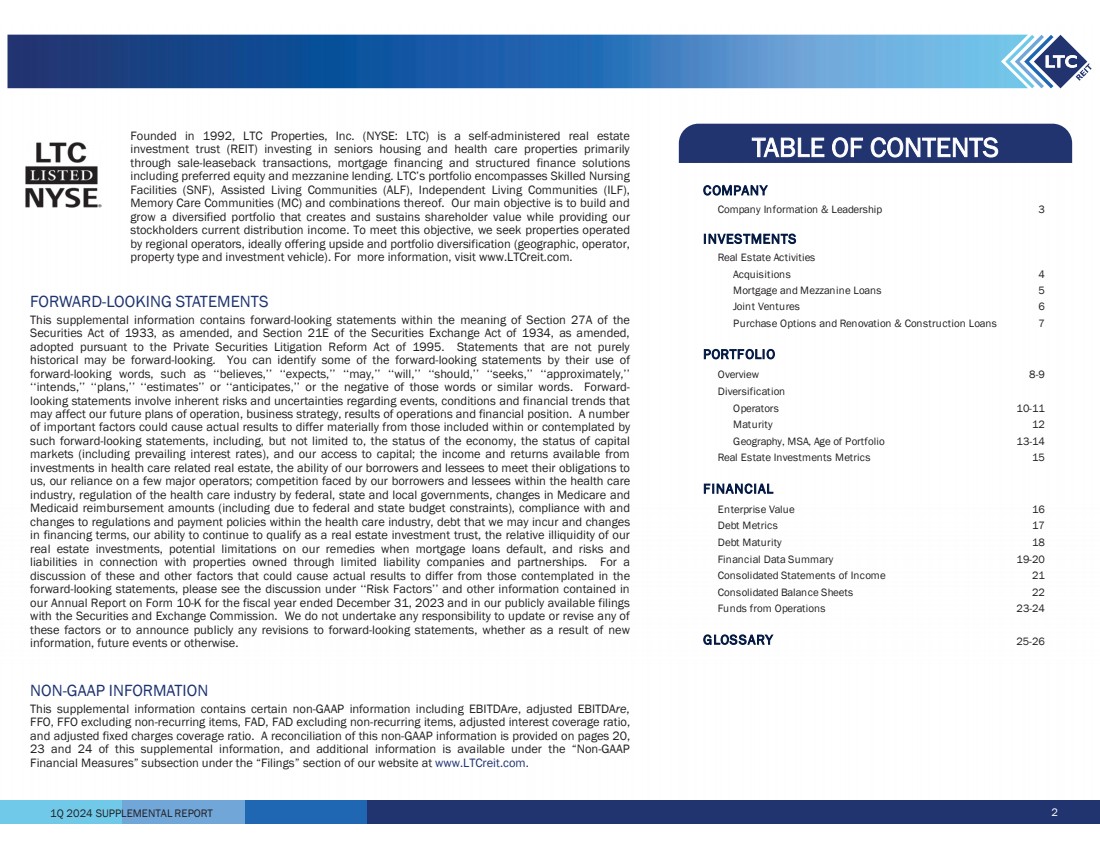
1Q 2024 SUPPLEMENTAL REPORT FORWARD-LOOKING STATEMENTS This supplemental information contains forward-looking statements within the meaning of Section 27A of the Securities Act of 1933, as amended, and Section 21E of the Securities Exchange Act of 1934, as amended, adopted pursuant to the Private Securities Litigation Reform Act of 1995. Statements that are not purely historical may be forward-looking. You can identify some of the forward-looking statements by their use of forward-looking words, such as ‘‘believes,’’ ‘‘expects,’’ ‘‘may,’’ ‘‘will,’’ ‘‘should,’’ ‘‘seeks,’’ ‘‘approximately,’’ ‘‘intends,’’ ‘‘plans,’’ ‘‘estimates’’ or ‘‘anticipates,’’ or the negative of those words or similar words. Forward-looking statements involve inherent risks and uncertainties regarding events, conditions and financial trends that may affect our future plans of operation, business strategy, results of operations and financial position. A number of important factors could cause actual results to differ materially from those included within or contemplated by such forward-looking statements, including, but not limited to, the status of the economy, the status of capital markets (including prevailing interest rates), and our access to capital; the income and returns available from investments in health care related real estate, the ability of our borrowers and lessees to meet their obligations to us, our reliance on a few major operators; competition faced by our borrowers and lessees within the health care industry, regulation of the health care industry by federal, state and local governments, changes in Medicare and Medicaid reimbursement amounts (including due to federal and state budget constraints), compliance with and changes to regulations and payment policies within the health care industry, debt that we may incur and changes in financing terms, our ability to continue to qualify as a real estate investment trust, the relative illiquidity of our real estate investments, potential limitations on our remedies when mortgage loans default, and risks and liabilities in connection with properties owned through limited liability companies and partnerships. For a discussion of these and other factors that could cause actual results to differ from those contemplated in the forward-looking statements, please see the discussion under ‘‘Risk Factors’’ and other information contained in our Annual Report on Form 10-K for the fiscal year ended December 31, 2023 and in our publicly available filings with the Securities and Exchange Commission. We do not undertake any responsibility to update or revise any of these factors or to announce publicly any revisions to forward-looking statements, whether as a result of new information, future events or otherwise. NON-GAAP INFORMATION This supplemental information contains certain non-GAAP information including EBITDAre, adjusted EBITDAre, FFO, FFO excluding non-recurring items, FAD, FAD excluding non-recurring items, adjusted interest coverage ratio, and adjusted fixed charges coverage ratio. A reconciliation of this non-GAAP information is provided on pages 20, 23 and 24 of this supplemental information, and additional information is available under the “Non-GAAP Financial Measures” subsection under the “Filings” section of our website at www.LTCreit.com. TABLE OF CONTENTS 2 COMPANY Company Information & Leadership 3 INVESTMENTS Real Estate Activities Acquisitions 4 Mortgage and Mezzanine Loans 5 Joint Ventures 6 Purchase Options and Renovation & Construction Loans 7 PORTFOLIO Overview 8-9 Diversification Operators 10-11 Maturity 12 Geography, MSA, Age of Portfolio 13-14 Real Estate Investments Metrics 15 FINANCIAL Enterprise Value 16 Debt Metrics 17 Debt Maturity 18 Financial Data Summary 19-20 Consolidated Statements of Income 21 Consolidated Balance Sheets 22 Funds from Operations 23-24 GLOSSARY 25-26 Founded in 1992, LTC Properties, Inc. (NYSE: LTC) is a self-administered real estate investment trust (REIT) investing in seniors housing and health care properties primarily through sale-leaseback transactions, mortgage financing and structured finance solutions including preferred equity and mezzanine lending. LTC’s portfolio encompasses Skilled Nursing Facilities (SNF), Assisted Living Communities (ALF), Independent Living Communities (ILF), Memory Care Communities (MC) and combinations thereof. Our main objective is to build and grow a diversified portfolio that creates and sustains shareholder value while providing our stockholders current distribution income. To meet this objective, we seek properties operated by regional operators, ideally offering upside and portfolio diversification (geographic, operator, property type and investment vehicle). For more information, visit www.LTCreit.com. |
|
1Q 2024 SUPPLEMENTAL REPORT 3 Any opinions, estimates, or forecasts regarding LTC’s performance made by the analysts listed above do not represent the opinions, estimates, and forecasts of LTC or its management. BOARD OF DIRECTORS ANALYSTS LEADERSHIP LTC PROPERTIES, INC. 3011 Townsgate Road Suite 220 Westlake Village, CA 91361 805-981-8655 www.LTCreit.com TRANSFER AGENT Broadridge Shareholder Services c/o Broadridge Corporate Issuer Solutions 1155 Long Island Avenue Edgewood, NY 11717-8309 ATTN: IWS 866-708-5586 WENDY SIMPSON Chairman CORNELIA CHENG ESG Committee Chairman DAVID GRUBER Director BOYD HENDRICKSON Lead Independent Director and Nominating & Corporate Governance Committee Chairman JAMES PIECZYNSKI Investment Committee Chairman DEVRA SHAPIRO Audit Committee Chairman TIMOTHY TRICHE, MD Compensation Committee Chairman JUAN SANABRIA BMO Capital Markets Corp. OMOTAYO OKUSANYA Deutsche Bank Securities Inc. JOE DICKSTEIN Jefferies LLC AARON HECHT JMP Securities, LLC AUSTIN WURSCHMIDT KeyBanc Capital Markets, Inc. MICHAEL CARROLL RBC Capital Markets Corp. RICHARD ANDERSON Wedbush CONNOR SIVERSKY Wells Fargo Securities, LLC WENDY SIMPSON Chairman and Chief Executive Officer PAM KESSLER Co-President, CFO and Secretary CLINT MALIN Co-President and Chief Investment Officer DOUG KOREY Executive Vice President, Managing Director of Business Development GIBSON SATTERWHITE Senior Vice President, Asset Management MANDI HOGAN Senior Vice President of Marketing, Investor Relations and ESG CECE CHIKHALE Executive Vice President, Chief Accounting Officer and Treasurer |
|
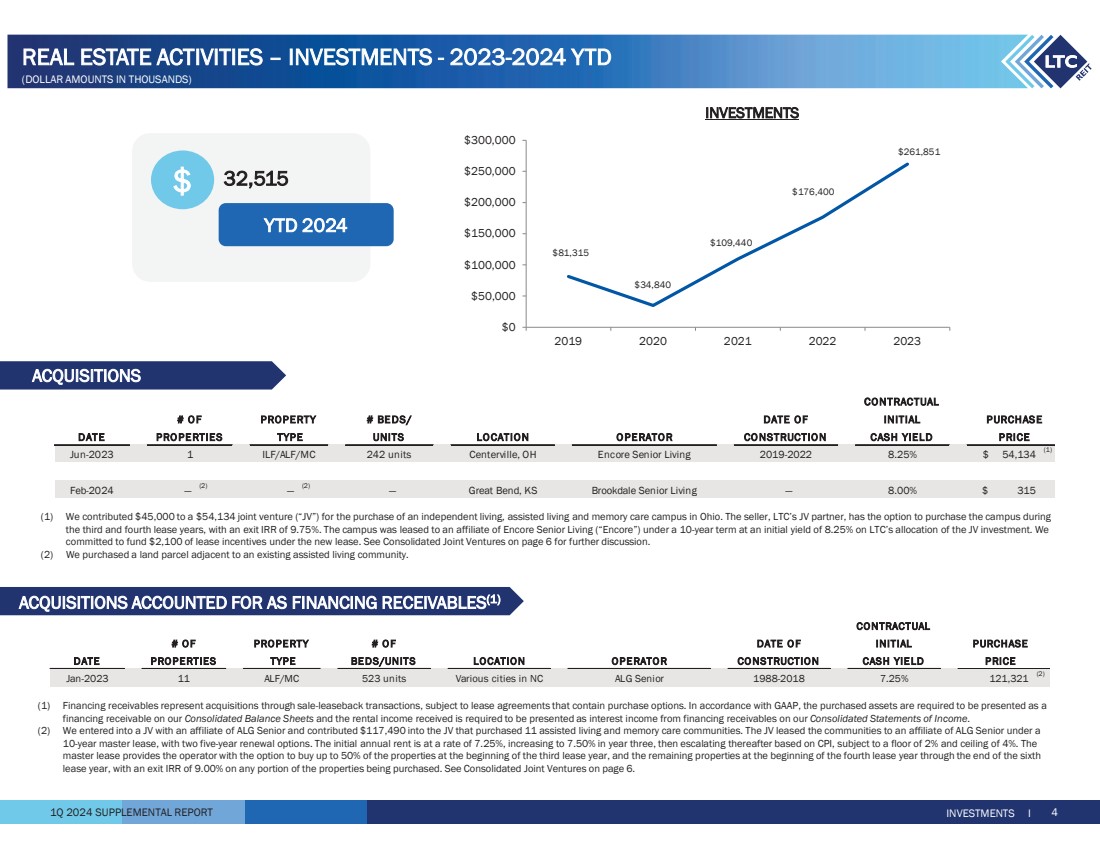
1Q 2024 SUPPLEMENTAL REPORT CONTRACTUAL # OF PROPERTY # BEDS/ DATE OF INITIAL PROPERTIES TYPE UNITS LOCATION OPERATOR CONSTRUCTION CASH YIELD 1 ILF/ALF/MC 242 units Centerville, OH Encore Senior Living 2019-2022 8.25% 54,134 $ (1) — (2) — (2) — Great Bend, KS Brookdale Senior Living — 8.00% 315 $ Jun-2023 Feb-2024 DATE PURCHASE PRICE ACQUISITIONS INVESTMENTS I 4 REAL ESTATE ACTIVITIES – INVESTMENTS - 2023-2024 YTD ACQUISITIONS ACCOUNTED FOR AS FINANCING RECEIVABLES(1) (DOLLAR AMOUNTS IN THOUSANDS) CONTRACTUAL # OF PROPERTY # OF DATE OF INITIAL PURCHASE PROPERTIES TYPE BEDS/UNITS LOCATION OPERATOR CONSTRUCTION CASH YIELD PRICE 11 ALF/MC 523 units Various cities in NC ALG Senior 1988-2018 7.25% 121,321 (2) Jan-2023 DATE (1) Financing receivables represent acquisitions through sale-leaseback transactions, subject to lease agreements that contain purchase options. In accordance with GAAP, the purchased assets are required to be presented as a financing receivable on our Consolidated Balance Sheets and the rental income received is required to be presented as interest income from financing receivables on our Consolidated Statements of Income. (2) We entered into a JV with an affiliate of ALG Senior and contributed $117,490 into the JV that purchased 11 assisted living and memory care communities. The JV leased the communities to an affiliate of ALG Senior under a 10-year master lease, with two five-year renewal options. The initial annual rent is at a rate of 7.25%, increasing to 7.50% in year three, then escalating thereafter based on CPI, subject to a floor of 2% and ceiling of 4%. The master lease provides the operator with the option to buy up to 50% of the properties at the beginning of the third lease year, and the remaining properties at the beginning of the fourth lease year through the end of the sixth lease year, with an exit IRR of 9.00% on any portion of the properties being purchased. See Consolidated Joint Ventures on page 6. (1) We contributed $45,000 to a $54,134 joint venture (“JV”) for the purchase of an independent living, assisted living and memory care campus in Ohio. The seller, LTC’s JV partner, has the option to purchase the campus during the third and fourth lease years, with an exit IRR of 9.75%. The campus was leased to an affiliate of Encore Senior Living (“Encore”) under a 10-year term at an initial yield of 8.25% on LTC’s allocation of the JV investment. We committed to fund $2,100 of lease incentives under the new lease. See Consolidated Joint Ventures on page 6 for further discussion. (2) We purchased a land parcel adjacent to an existing assisted living community. INVESTMENTS $81,315 $34,840 $109,440 $176,400 $261,851 $0 $50,000 $100,000 $150,000 $200,000 $250,000 $300,000 2019 2020 2021 2022 2023 YTD 2024 $ 32,515 |
|
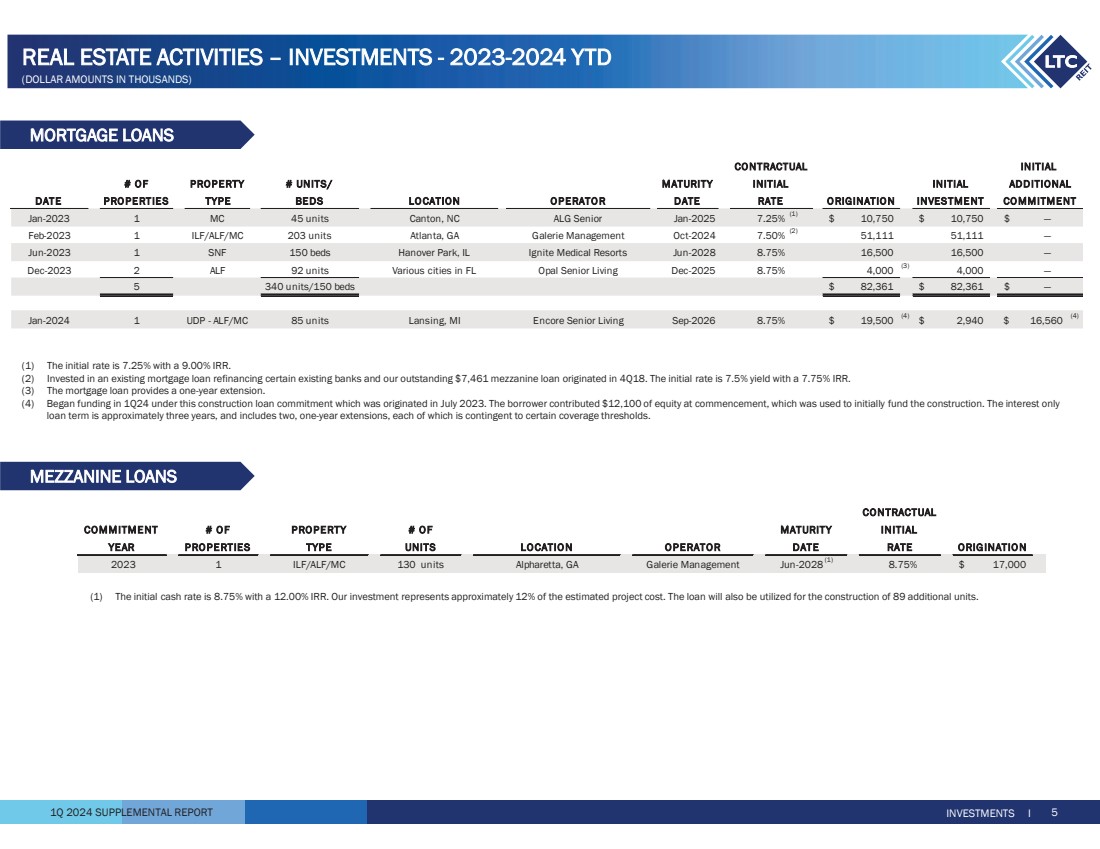
1Q 2024 SUPPLEMENTAL REPORT MORTGAGE LOANS INVESTMENTS I 5 MEZZANINE LOANS (1) The initial cash rate is 8.75% with a 12.00% IRR. Our investment represents approximately 12% of the estimated project cost. The loan will also be utilized for the construction of 89 additional units. # OF PROPERTY # OF MATURITY PROPERTIES TYPE UNITS LOCATION OPERATOR DATE ORIGINATION 2023 1 ILF/ALF/MC 130 units Alpharetta, GA Galerie Management Jun-2028 (1) 8.75% 17,000 $ CONTRACTUAL YEAR RATE COMMITMENT INITIAL # OF PROPERTY # UNITS/ MATURITY INITIAL PROPERTIES TYPE BEDS LOCATION OPERATOR DATE ORIGINATION INVESTMENT 1 MC 45 units Canton, NC ALG Senior Jan-2025 7.25% (1) $ 10,750 10,750 $ — $ 1 ILF/ALF/MC 203 units Atlanta, GA Galerie Management Oct-2024 7.50% (2) 51,111 51,111 — 1 SNF 150 beds Hanover Park, IL Ignite Medical Resorts Jun-2028 8.75% 16,500 16,500 — 2 ALF 92 units Various cities in FL Opal Senior Living Dec-2025 8.75% 4,000 (3) — 4,000 5 340 units/150 beds $ 82,361 82,361 $ — $ 1 UDP - ALF/MC 85 units Lansing, MI Encore Senior Living Sep-2026 8.75% 19,500 $ (4) $ 16,560 2,940 $ (4) Jan-2023 Feb-2023 Jun-2023 Jan-2024 CONTRACTUAL INITIAL Dec-2023 DATE COMMITMENT INITIAL ADDITIONAL RATE (1) The initial rate is 7.25% with a 9.00% IRR. (2) Invested in an existing mortgage loan refinancing certain existing banks and our outstanding $7,461 mezzanine loan originated in 4Q18. The initial rate is 7.5% yield with a 7.75% IRR. (3) The mortgage loan provides a one-year extension. (4) Began funding in 1Q24 under this construction loan commitment which was originated in July 2023. The borrower contributed $12,100 of equity at commencement, which was used to initially fund the construction. The interest only loan term is approximately three years, and includes two, one-year extensions, each of which is contingent to certain coverage thresholds. REAL ESTATE ACTIVITIES – INVESTMENTS - 2023-2024 YTD (DOLLAR AMOUNTS IN THOUSANDS) |
|
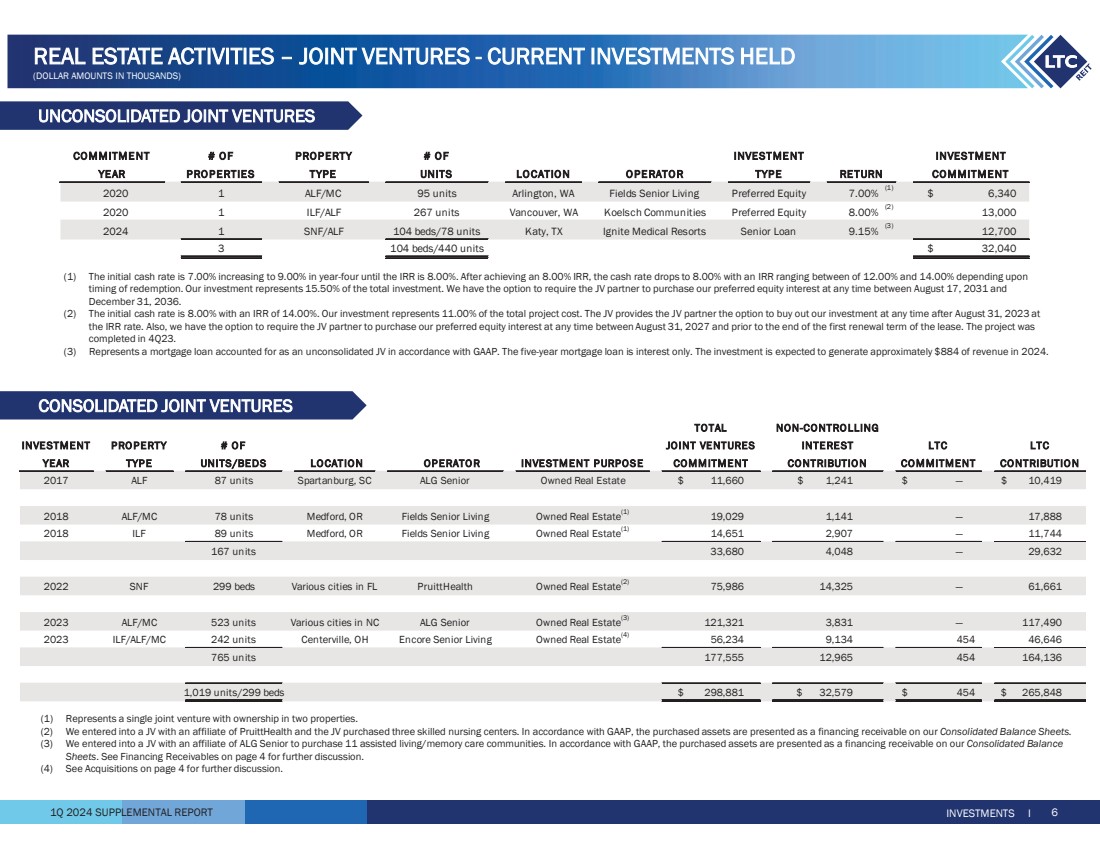
1Q 2024 SUPPLEMENTAL REPORT INVESTMENT PROPERTY # OF LTC YEAR TYPE UNITS/BEDS LOCATION OPERATOR INVESTMENT PURPOSE LTC COMMITMENT 2017 ALF 87 units Spartanburg, SC ALG Senior Owned Real Estate 11,660 $ 1,241 $ — $ 10,419 $ 2018 ALF/MC 78 units Medford, OR Fields Senior Living Owned Real Estate(1) 1,141 19,029 — 17,888 2018 ILF 89 units Medford, OR Fields Senior Living Owned Real Estate(1) 2,907 14,651 — 11,744 167 units 4,048 33,680 — 29,632 2022 SNF 299 beds Various cities in FL PruittHealth Owned Real Estate(2) 14,325 75,986 — 61,661 2023 ALF/MC 523 units Various cities in NC ALG Senior Owned Real Estate(3) 3,831 121,321 — 117,490 2023 ILF/ALF/MC 242 units Centerville, OH Encore Senior Living Owned Real Estate(4) 9,134 56,234 454 46,646 765 units 12,965 177,555 454 164,136 1,019 units/299 beds $ 32,579 298,881 $ 454 $ 265,848 $ CONTRIBUTION JOINT VENTURES INTEREST LTC TOTAL NON-CONTROLLING COMMITMENT CONTRIBUTION (1) The initial cash rate is 7.00% increasing to 9.00% in year-four until the IRR is 8.00%. After achieving an 8.00% IRR, the cash rate drops to 8.00% with an IRR ranging between of 12.00% and 14.00% depending upon timing of redemption. Our investment represents 15.50% of the total investment. We have the option to require the JV partner to purchase our preferred equity interest at any time between August 17, 2031 and December 31, 2036. (2) The initial cash rate is 8.00% with an IRR of 14.00%. Our investment represents 11.00% of the total project cost. The JV provides the JV partner the option to buy out our investment at any time after August 31, 2023 at the IRR rate. Also, we have the option to require the JV partner to purchase our preferred equity interest at any time between August 31, 2027 and prior to the end of the first renewal term of the lease. The project was completed in 4Q23. (3) Represents a mortgage loan accounted for as an unconsolidated JV in accordance with GAAP. The five-year mortgage loan is interest only. The investment is expected to generate approximately $884 of revenue in 2024. CONSOLIDATED JOINT VENTURES UNCONSOLIDATED JOINT VENTURES INVESTMENTS I 6 REAL ESTATE ACTIVITIES – JOINT VENTURES - CURRENT INVESTMENTS HELD (DOLLAR AMOUNTS IN THOUSANDS) # OF PROPERTY # OF INVESTMENT PROPERTIES TYPE UNITS LOCATION OPERATOR TYPE 2020 1 ALF/MC 95 units Arlington, WA Fields Senior Living Preferred Equity 7.00% (1) $ 6,340 2020 1 ILF/ALF 267 units Vancouver, WA Koelsch Communities Preferred Equity 8.00% (2) 13,000 2024 1 SNF/ALF 104 beds/78 units Katy, TX Ignite Medical Resorts Senior Loan 9.15% (3) 12,700 3 104 beds/440 units $ 32,040 COMMITMENT INVESTMENT YEAR RETURN COMMITMENT (1) Represents a single joint venture with ownership in two properties. (2) We entered into a JV with an affiliate of PruittHealth and the JV purchased three skilled nursing centers. In accordance with GAAP, the purchased assets are presented as a financing receivable on our Consolidated Balance Sheets. (3) We entered into a JV with an affiliate of ALG Senior to purchase 11 assisted living/memory care communities. In accordance with GAAP, the purchased assets are presented as a financing receivable on our Consolidated Balance Sheets. See Financing Receivables on page 4 for further discussion. (4) See Acquisitions on page 4 for further discussion. |
|
1Q 2024 SUPPLEMENTAL REPORT CONTRACTUAL TOTAL COMMITMENT # OF PROPERTY PROJECT INITIAL INVESTMENT 1Q24 FUNDED REMAINING YEAR PROPERTIES TYPE TYPE LOCATION OPERATOR CASH YIELD TO DATE COMMITMENT — (1) 2021 13 ILF/ALF/MC Renovation Various cities in NC and SC ALG Senior 7.25% 6,098 $ 188 $ 5,366 $ 732 $ — (2) 2023 1 UDP-ALF/MC Construction Lansing, MI Encore Senior Living 8.75% 19,500 2,940 2,940 16,560 14 $ 3,128 25,598 $ 8,306 $ 17,292 $ INCEPTION DATE COMMITMENT FUNDING INTEREST ESTIMATED (1) This commitment is part of a $59,250 loan commitment secured by 13 properties, (12) North Carolina and (1) South Carolina. Interest payment increases upon each funding. (2) The interest only loan term is approximately three years at a rate of 8.75%, and includes two, one-year extensions, each of which is contingent to certain coverage thresholds. See Mortgage Loans on page 5 for further discussion. RENOVATION & CONSTRUCTION LOANS INVESTMENTS I 7 REAL ESTATE ACTIVITIES – PURCHASE OPTIONS AND RENOVATION & CONSTRUCTION LOANS (DOLLAR AMOUNTS IN THOUSANDS) PURCHASE OPTIONS # OF PROPERTY GROSS OPTION STATE PROPERTIES TYPE INVESTMENTS WINDOW California 2 ALF/MC 38,895 $ 297 $ 2023-2029 Florida 3 SNF 76,669 5,613 2025-2027 (1) North Carolina 11 ALF/MC 121,321 9,706 2025-2028 (1) North Carolina 5 ALF 14,404 3,219 2029 Ohio 1 MC 16,161 230 2024-2025 Ohio 1 ILF/ALF/MC 54,758 3,679 2025-2027 (2) Oklahoma 5 ALF/MC 11,221 910 2027-2029 Tennessee 2 SNF 5,275 986 2023-2024 Texas 4 SNF 52,726 4,310 2027-2029 (3) Texas 1 MC 12,743 — (4) 2026-2028 Various states(5) 17 ALF/MC 58,723 9,248 2029 Various states(6) 2 ALF/MC 31,433 — (6) 2027 Total 54 494,329 $ 38,198 $ ANNUALIZED GAAP REVENUE (1) These properties were acquired through a sale-leaseback transaction, subject to a lease agreement that contains a purchase option. In accordance with GAAP, the purchased properties are required to be presented as a financing receivable on our Consolidated Balance Sheets. (2) See Acquisitions on page 4 for further discussion. (3) The master lease allows the operator to elect either an earn-out payment or purchase option. If neither option is elected within the timeframe defined in the lease, both elections are terminated. (4) Subsequent to March 31, 2024, this property was transitioned to a new operator. The initial rent for the first six months is zero, after which rent will be based on mutually agreed upon fair market rent. (5) Properties are in Colorado, Kansas, Ohio and Texas. (6) In 1Q24, two properties in Georgia and South Carolina were transitioned to a new operator. The initial rent for the first six months is zero, after which rent will be based on mutually agreed upon fair market rent. |
|
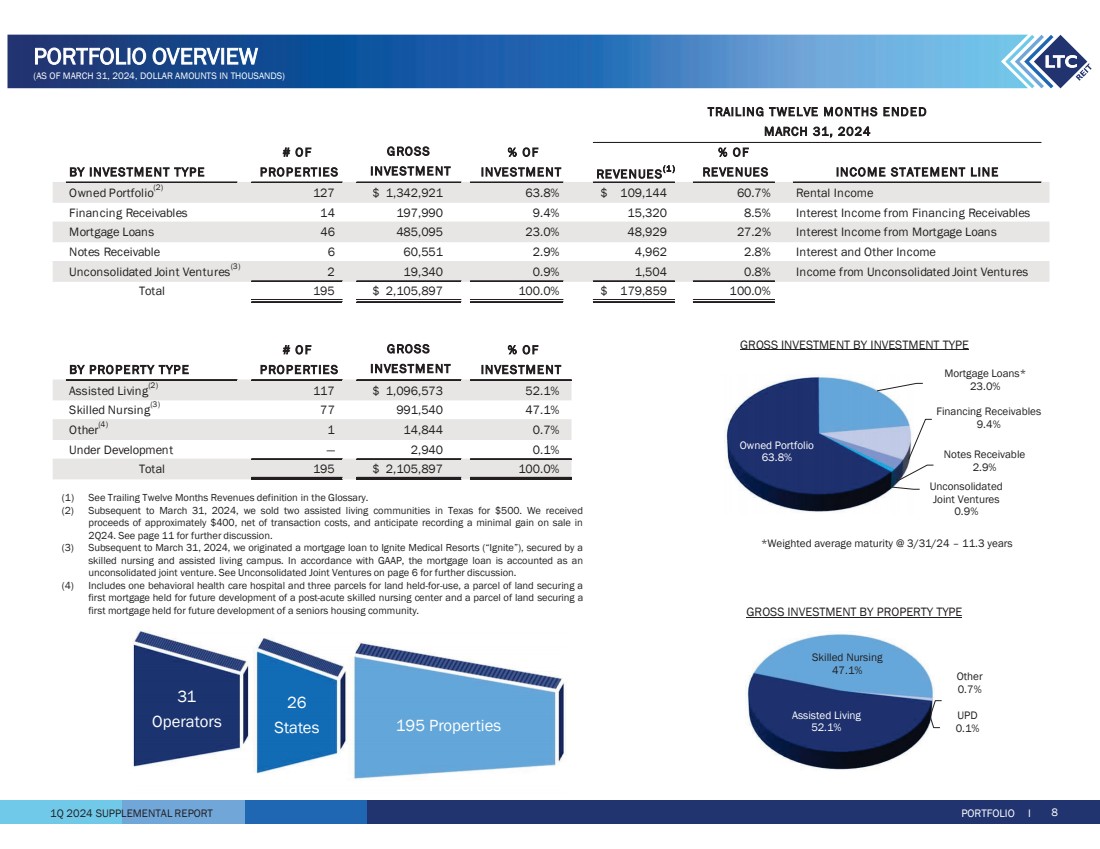
1Q 2024 SUPPLEMENTAL REPORT # OF % OF % OF BY INVESTMENT TYPE PROPERTIES INVESTMENT REVENUES(1 ) REVENUES INCOME STATEMENT LINE Owned Portfolio(2) 1,342,921 127 $ 63.8% 109,144 $ 60.7% Rental Income Financing Receivables 14 197,990 9.4% 15,320 8.5% Interest Income from Financing Receivables Mortgage Loans 46 485,095 23.0% 48,929 27.2% Interest Income from Mortgage Loans Notes Receivable 6 60,551 2.9% 4,962 2.8% Interest and Other Income Unconsolidated Joint Ventures(3) 19,340 2 0.9% 1,504 0.8% Income from Unconsolidated Joint Ventures Total 195 2,105,897 $ 100.0% 179,859 $ 100.0% # OF % OF BY PROPERTY TYPE PROPERTIES INVESTMENT Assisted Living(2) 1,096,573 117 $ 52.1% Skilled Nursing(3) 991,540 77 47.1% Other(4) 14,844 1 0.7% Under Development — 2,940 0.1% Total 195 2,105,897 $ 100.0% INVESTMENT GROSS INVESTMENT TRAILING TWELVE MONTHS ENDED MARCH 31, 2024 GROSS Owned Portfolio 63.8% Mortgage Loans* 23.0% Financing Receivables 9.4% Notes Receivable 2.9% Unconsolidated Joint Ventures 0.9% PORTFOLIO I PORTFOLIO OVERVIEW (AS OF MARCH 31, 2024, DOLLAR AMOUNTS IN THOUSANDS) Assisted Living 52.1% Skilled Nursing 47.1% Other 0.7% UPD 0.1% 31 Operators 26 States 195 Properties *Weighted average maturity @ 3/31/24 – 11.3 years GROSS INVESTMENT BY INVESTMENT TYPE GROSS INVESTMENT BY PROPERTY TYPE (1) See Trailing Twelve Months Revenues definition in the Glossary. (2) Subsequent to March 31, 2024, we sold two assisted living communities in Texas for $500. We received proceeds of approximately $400, net of transaction costs, and anticipate recording a minimal gain on sale in 2Q24. See page 11 for further discussion. (3) Subsequent to March 31, 2024, we originated a mortgage loan to Ignite Medical Resorts (“Ignite”), secured by a skilled nursing and assisted living campus. In accordance with GAAP, the mortgage loan is accounted as an unconsolidated joint venture. See Unconsolidated Joint Ventures on page 6 for further discussion. (4) Includes one behavioral health care hospital and three parcels for land held-for-use, a parcel of land securing a first mortgage held for future development of a post-acute skilled nursing center and a parcel of land securing a first mortgage held for future development of a seniors housing community. 8 |
|
1Q 2024 SUPPLEMENTAL REPORT PORTFOLIO I 9 PORTFOLIO OVERVIEW – DETAIL (AS OF MARCH 31, 2024, DOLLAR AMOUNTS IN THOUSANDS) # OF OWNED PORTFOLIO PROPERTIES RENTAL INCOME(1 ) Assisted Living(2) 733,901 76 $ 34.9% 48,596 $ 27.0% Skilled Nursing 50 597,015 28.3% 59,553 33.1% Other 1 12,005 0.6% 995 0.6% Total 127 1,342,921 $ 63.8% 109,144 $ 60.7% # OF FINANCING RECEIVABLES PROPERTIES FINANCING INCOME(1 ) Assisted Living 11 121,321 $ 5.8% 9,704 $ 5.4% Skilled Nursing 3 76,669 3.6% 5,616 3.1% Total 14 197,990 $ 9.4% 15,320 $ 8.5% # OF MORTGAGE LOANS MORTGAGE LOANS PROPERTIES INTEREST INCOME(1 ) Assisted Living 22 175,129 $ 8.3% 13,527 $ 7.6% Skilled Nursing 24 304,187 14.5% 35,112 19.5% Under Development — 2,940 0.1% 75 0.0% Other — 2,839 0.1% 215 0.1% Total 46 485,095 $ 23.0% 48,929 $ 27.2% REAL ESTATE INVESTMENTS 2,026,006 187 $ 96.2% 173,393 $ 96.4% # OF INTEREST AND NOTES RECEIVABLE PROPERTIES OTHER INCOME(1 ) Assisted Living 6 46,882 $ 2.2% 4,404 $ 2.5% Skilled Nursing — 13,669 0.7% 558 0.3% Total 6 60,551 $ 2.9% 4,962 $ 2.8% # OF UNCONSOLIDATED UNCONSOLIDATED JOINT VENTURES(3 ) PROPERTIES JV INCOME(1 ) Assisted Living 2 19,340 $ 0.9% 1,504 $ 0.8% TOTAL INVESTMENTS 2,105,897 195 $ 100.0% 179,859 $ 100.0% GROSS INVESTMENT % OF GROSS INVESTMENT REVENUES % OF TOTAL REVENUES % OF TOTAL REVENUES % OF TOTAL INVESTMENT TRAILING TWELVE MONTHS ENDED MARCH 31, 2024 GROSS % OF GROSS INVESTMENT REVENUES % OF TOTAL GROSS % OF % OF TOTAL INVESTMENT GROSS INVESTMENT REVENUES INVESTMENT GROSS GROSS INVESTMENT GROSS INVESTMENT % OF GROSS INVESTMENT % OF (1) See Trailing Twelve Months Revenues definition in the Glossary. (2) Subsequent to March 31, 2024, we sold two assisted living communities in Texas for $500. We received proceeds of approximately $400, net of transaction costs, and anticipate recording a minimal gain on sale in 2Q24. See page 11 for further discussion. (3) Subsequent to March 31, 2024, we originated a mortgage loan to Ignite, secured by a skilled nursing and assisted living campus. In accordance with GAAP, the mortgage loan is accounted as an unconsolidated joint venture. See Unconsolidated Joint Ventures on page 6 for further discussion. 27.0% 33.1% 0.6% 0.0% 25.0% 50.0% ALF SNF OTH RENTAL INCOME (AS % OF TOTAL REVENUES) MORTGAGE LOANS INTEREST INCOME (AS % OF TOTAL REVENUES) INTEREST & OTHER INCOME (AS % OF TOTAL REVENUES) UNCONSOLIDATED JV INCOME (AS % OF TOTAL REVENUES) 7.6% 19.5% 0.0% 0.1% 0.0% 15.0% 30.0% ALF SNF UDP OTH 2.5% 0.3% 0.0% 2.5% 5.0% ALF SNF 0.8% 0.0% 0.5% 1.0% ALF 5.4% 3.1% 0.0% 15.0% 30.0% ALF SNF FINANCING RECEIVABLES (AS % OF TOTAL REVENUES) |
|
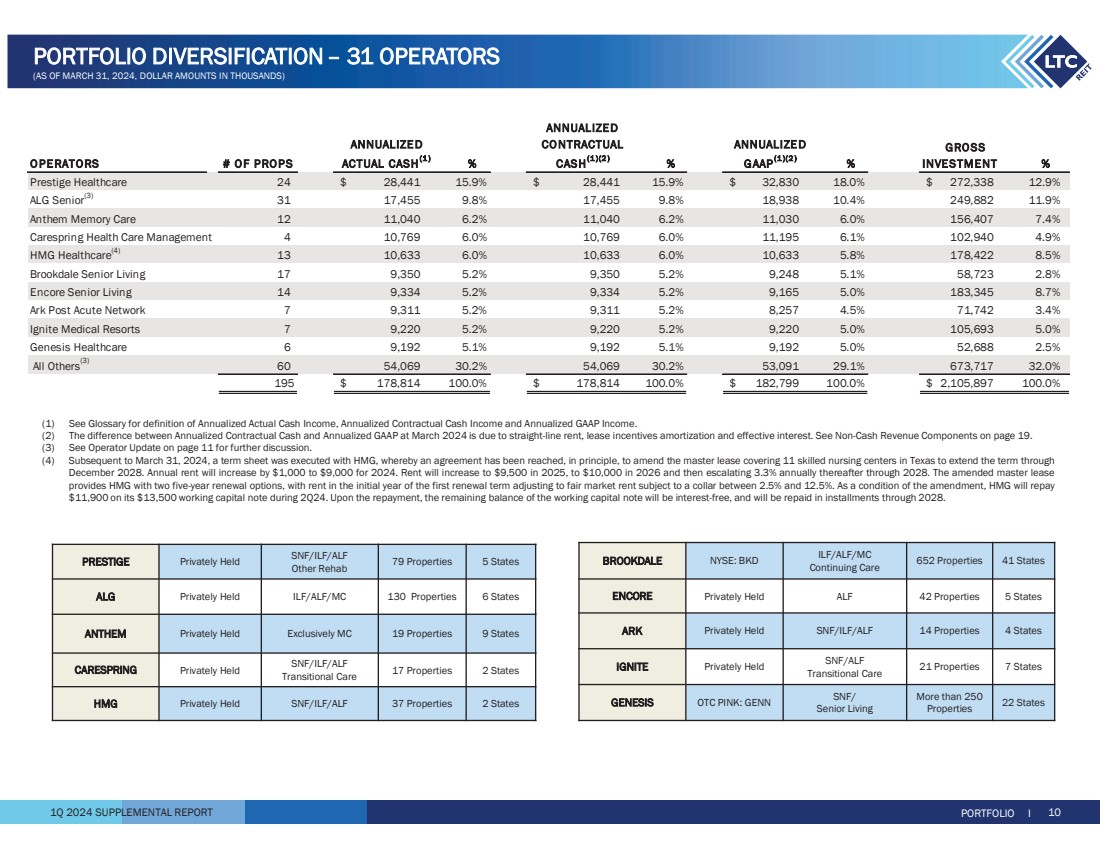
1Q 2024 SUPPLEMENTAL REPORT PORTFOLIO I 10 PORTFOLIO DIVERSIFICATION– 31 OPERATORS (AS OF MARCH 31, 2024, DOLLAR AMOUNTS IN THOUSANDS) 652 Properties 41 States ILF/ALF/MC Continuing Care BROOKDALE NYSE: BKD ENCORE Privately Held ALF 42 Properties 5 States ARK Privately Held SNF/ILF/ALF 14 Properties 4 States 21 Properties 7 States SNF/ALF Transitional Care IGNITE Privately Held 22 States More than 250 Properties SNF/ Senior Living GENESIS OTC PINK: GENN 79 Properties 5 States SNF/ILF/ALF Other Rehab PRESTIGE Privately Held ALG Privately Held ILF/ALF/MC 130 Properties 6 States ANTHEM Privately Held Exclusively MC 19 Properties 9 States 17 Properties 2 States SNF/ILF/ALF Transitional Care CARESPRING Privately Held HMG Privately Held SNF/ILF/ALF 37 Properties 2 States (1) See Glossary for definition of Annualized Actual Cash Income, Annualized Contractual Cash Income and Annualized GAAP Income. (2) The difference between Annualized Contractual Cash and Annualized GAAP at March 2024 is due to straight-line rent, lease incentives amortization and effective interest. See Non-Cash Revenue Components on page 19. (3) See Operator Update on page 11 for further discussion. (4) Subsequent to March 31, 2024, a term sheet was executed with HMG, whereby an agreement has been reached, in principle, to amend the master lease covering 11 skilled nursing centers in Texas to extend the term through December 2028. Annual rent will increase by $1,000 to $9,000 for 2024. Rent will increase to $9,500 in 2025, to $10,000 in 2026 and then escalating 3.3% annually thereafter through 2028. The amended master lease provides HMG with two five-year renewal options, with rent in the initial year of the first renewal term adjusting to fair market rent subject to a collar between 2.5% and 12.5%. As a condition of the amendment, HMG will repay $11,900 on its $13,500 working capital note during 2Q24. Upon the repayment, the remaining balance of the working capital note will be interest-free, and will be repaid in installments through 2028. OPERATORS # OF PROPS % % % GROSS INVESTMENT % Prestige Healthcare 24 28,441 $ 15.9% 28,441 $ 15.9% 32,830 $ 18.0% 272,338 $ 12.9% ALG Senior(3) 17,455 31 9.8% 17,455 9.8% 18,938 10.4% 249,882 11.9% Anthem Memory Care 12 11,040 6.2% 11,040 6.2% 11,030 6.0% 156,407 7.4% Carespring Health Care Management 4 10,769 6.0% 10,769 6.0% 11,195 6.1% 102,940 4.9% HMG Healthcare(4) 10,633 13 6.0% 10,633 6.0% 10,633 5.8% 178,422 8.5% Brookdale Senior Living 17 9,350 5.2% 9,350 5.2% 9,248 5.1% 58,723 2.8% Encore Senior Living 14 9,334 5.2% 9,334 5.2% 9,165 5.0% 183,345 8.7% Ark Post Acute Network 7 9,311 5.2% 9,311 5.2% 8,257 4.5% 71,742 3.4% Ignite Medical Resorts 7 9,220 5.2% 9,220 5.2% 9,220 5.0% 105,693 5.0% Genesis Healthcare 6 9,192 5.1% 9,192 5.1% 9,192 5.0% 52,688 2.5% All Others(3) 54,069 60 30.2% 54,069 30.2% 53,091 29.1% 673,717 32.0% 195 178,814 $ 100.0% 178,814 $ 100.0% 182,799 $ 100.0% 2,105,897 $ 100.0% ANNUALIZED GAAP(1 )(2 ) ANNUALIZED ACTUAL CASH(1 ) ANNUALIZED CONTRACTUAL CASH(1 )(2 ) |
|
1Q 2024 SUPPLEMENTAL REPORT PORTFOLIO I 11 PORTFOLIO DIVERSIFICATION – OPERATOR UPDATE (DOLLAR AMOUNTS IN THOUSANDS) ¾ During 1Q24, we collected 106.0% or $42,115 of contractual rent and mortgage interest income as a result of receiving $2,377 of rent credit repayment in connection with the sale of a 110-unit assisted living community in Wisconsin. ¾ During 4Q23, a mortgage loan with Prestige Healthcare (“Prestige”), secured by 15 skilled nursing centers, was amended to set the minimum mortgage interest payment due to us based on an annual current pay rate of 8.5% on the outstanding loan balance of $183,338. The current contractual interest rate on the loan of 10.8% remains unchanged. The amendment also provides us the right to draw on Prestige’s security to pay the difference between the contractual rate and current pay rate. During 1Q24, we received full contractual cash interest of $4,969 from Prestige related to this mortgage loan through $3,896 of cash receipts and application of $1,074 of Prestige’s security. The following table summarizes the activity of Prestige’s security: ¾ Completed the sale and re-lease process for 10 assisted living communities under the ALG Senior (“ALG”) master lease. These properties, seven of which were built in the 90s, are primarily located in small rural towns, are non-revenue generating, and were temporarily transitioned to ALG following the COVID pandemic in July 2022, allowing us time to find a more permanent solution for the portfolio, as follows: o Transitioned two of the properties located in Georgia and South Carolina to an operator new to us. The lease term is two years with two one-year extension options. The initial rent for the first six months is zero, after which rent will be based on mutually agreed upon fair market rent. The master lease includes a purchase option that can be exercised in 2027, if the two one-year lease extensions are exercised. Additionally, we agreed to fund up to $906 for capital improvements for the first year, and up to $240 for a working capital note, at a rate of 8.25%, maturing on December 31, 2025. o Sold five of the properties located in Texas for $1,600. We received $925 of proceeds, net of transaction costs, and recorded a loss on sale of $356. o In April 2024, transitioned one of the properties located in Texas to an operator new to us. The lease term is for two years with two one-year extension options, each of which is contingent on certain coverage thresholds. The initial rent for the first six months is zero, after which rent will be based on mutually agreed upon fair market rent. The master lease includes a purchase option that can be exercised beginning in 2026, if the one-year lease extension is exercised. Additionally, we agreed to fund up to $570 for capital improvements for the first year of the lease, and up to $290 for a working capital note, at a rate of 9.0%, maturing concurrently with the master lease maturity. o In April 2024, two of the properties located in Texas, that were closed in 2023 and 2024, were sold for $500. We received proceeds of approximately $400, net of transaction costs, and anticipate recording a minimal gain on sale in 2Q24. ¾ Subsequent to March 31, 2024, an operator exercised its renewal option of the master lease for another five years, from March 2025 through February 2030. Annual cash and GAAP rent for 2024 are $8,004 and $7,049, respectively, escalating 2.5% annually. The master lease covers 666 beds across four skilled nursing centers, three in Texas and one in Wisconsin, and a behavioral health care hospital in Nevada. ¾ Subsequent to March 31, 2024, a term sheet was executed with HMG, whereby an agreement has been reached, in principle, to amend the master lease covering 11 skilled nursing centers in Texas to extend the term through December 2028. Annual rent will increase by $1,000 to $9,000 for 2024. Rent will increase to $9,500 in 2025, to $10,000 in 2026 and then escalating 3.3% annually thereafter through 2028. The amended master lease provides HMG with two five-year renewal options, with rent in the initial year of the first renewal term adjusting to fair market rent subject to a collar between 2.5% and 12.5%. As a condition of the amendment, HMG will repay $11,900 on its $13,500 working capital note during 2Q24. Upon the repayment, the remaining balance of the working capital note will be interest-free, and will be repaid in installments through 2028. BALANCE AT DEPOSITS INTEREST BALANCE AT 12/31/2023 RECEIVED APPLICATIONS 3/31/2024 $ 2,674 2,352 $ (1,074) $ 3,952 $ |
|
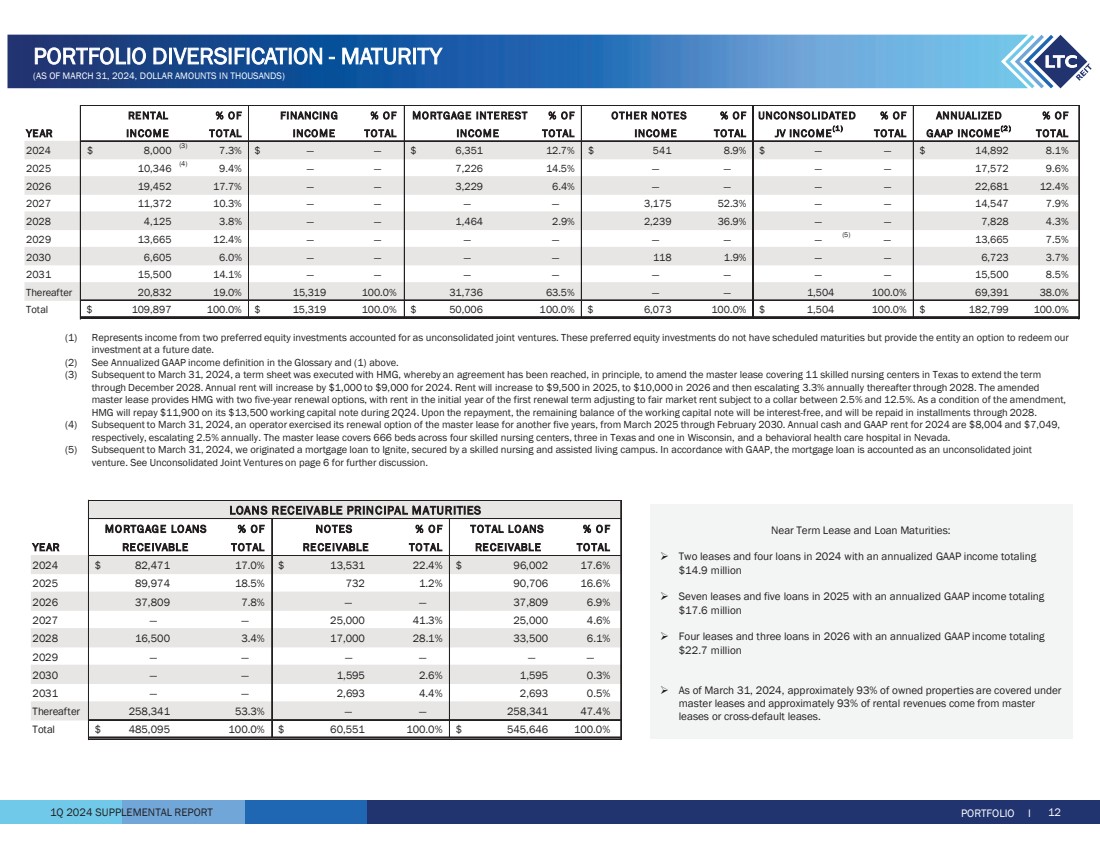
1Q 2024 SUPPLEMENTAL REPORT Near Term Lease and Loan Maturities: ¾ Two leases and four loans in 2024 with an annualized GAAP income totaling $14.9 million ¾ Seven leases and five loans in 2025 with an annualized GAAP income totaling $17.6 million ¾ Four leases and three loans in 2026 with an annualized GAAP income totaling $22.7 million ¾ As of March 31, 2024, approximately 93% of owned properties are covered under master leases and approximately 93% of rental revenues come from master leases or cross-default leases. PORTFOLIO DIVERSIFICATION - MATURITY (AS OF MARCH 31, 2024, DOLLAR AMOUNTS IN THOUSANDS) % OF % OF % OF % OF % OF ANNUALIZED % OF YEAR TOTAL TOTAL TOTAL TOTAL TOTAL TOTAL 2024 8,000 $ (3) 7.3% — $ — 6,351 $ 12.7% 541 $ 8.9% — $ — 14,892 $ 8.1% 2025 10,346 (4) 9.4% — — 7,226 14.5% — — — — 17,572 9.6% 2026 19,452 17.7% — — 3,229 6.4% — — — — 22,681 12.4% 2027 11,372 10.3% — — — — 3,175 52.3% — — 14,547 7.9% 2028 4,125 3.8% — — 1,464 2.9% 2,239 36.9% — — 7,828 4.3% 2029 13,665 12.4% — — — — — — — (5) 13,665 — 7.5% 2030 6,605 6.0% — — — — 118 1.9% — — 6,723 3.7% 2031 15,500 14.1% — — — — — — — — 15,500 8.5% Thereafter 20,832 19.0% 15,319 100.0% 31,736 63.5% — — 1,504 100.0% 69,391 38.0% Total 109,897 $ 100.0% 15,319 $ 100.0% 50,006 $ 100.0% 6,073 $ 100.0% 1,504 $ 100.0% 182,799 $ 100.0% RENTAL UNCONSOLIDATED INCOME FINANCING OTHER NOTES INCOME INCOME MORTGAGE INTEREST INCOME JV INCOME(1 ) GAAP INCOME(2 ) PORTFOLIO I 12 (1) Represents income from two preferred equity investments accounted for as unconsolidated joint ventures. These preferred equity investments do not have scheduled maturities but provide the entity an option to redeem our investment at a future date. (2) See Annualized GAAP income definition in the Glossary and (1) above. (3) Subsequent to March 31, 2024, a term sheet was executed with HMG, whereby an agreement has been reached, in principle, to amend the master lease covering 11 skilled nursing centers in Texas to extend the term through December 2028. Annual rent will increase by $1,000 to $9,000 for 2024. Rent will increase to $9,500 in 2025, to $10,000 in 2026 and then escalating 3.3% annually thereafter through 2028. The amended master lease provides HMG with two five-year renewal options, with rent in the initial year of the first renewal term adjusting to fair market rent subject to a collar between 2.5% and 12.5%. As a condition of the amendment, HMG will repay $11,900 on its $13,500 working capital note during 2Q24. Upon the repayment, the remaining balance of the working capital note will be interest-free, and will be repaid in installments through 2028. (4) Subsequent to March 31, 2024, an operator exercised its renewal option of the master lease for another five years, from March 2025 through February 2030. Annual cash and GAAP rent for 2024 are $8,004 and $7,049, respectively, escalating 2.5% annually. The master lease covers 666 beds across four skilled nursing centers, three in Texas and one in Wisconsin, and a behavioral health care hospital in Nevada. (5) Subsequent to March 31, 2024, we originated a mortgage loan to Ignite, secured by a skilled nursing and assisted living campus. In accordance with GAAP, the mortgage loan is accounted as an unconsolidated joint venture. See Unconsolidated Joint Ventures on page 6 for further discussion. % OF % OF % OF YEAR TOTAL TOTAL TOTAL 2024 82,471 $ 17.0% 13,531 $ 22.4% 96,002 $ 17.6% 2025 89,974 18.5% 732 1.2% 90,706 16.6% 2026 37,809 7.8% — — 37,809 6.9% 2027 — — 25,000 41.3% 25,000 4.6% 2028 16,500 3.4% 17,000 28.1% 33,500 6.1% 2029 — — — — — — 2030 — — 1,595 2.6% 1,595 0.3% 2031 — — 2,693 4.4% 2,693 0.5% Thereafter 258,341 53.3% — — 258,341 47.4% Total 485,095 $ 100.0% 60,551 $ 100.0% 545,646 $ 100.0% RECEIVABLE RECEIVABLE RECEIVABLE TOTAL LOANS LOANS RECEIVABLE PRINCIPAL MATURITIES MORTGAGE LOANS NOTES |
|
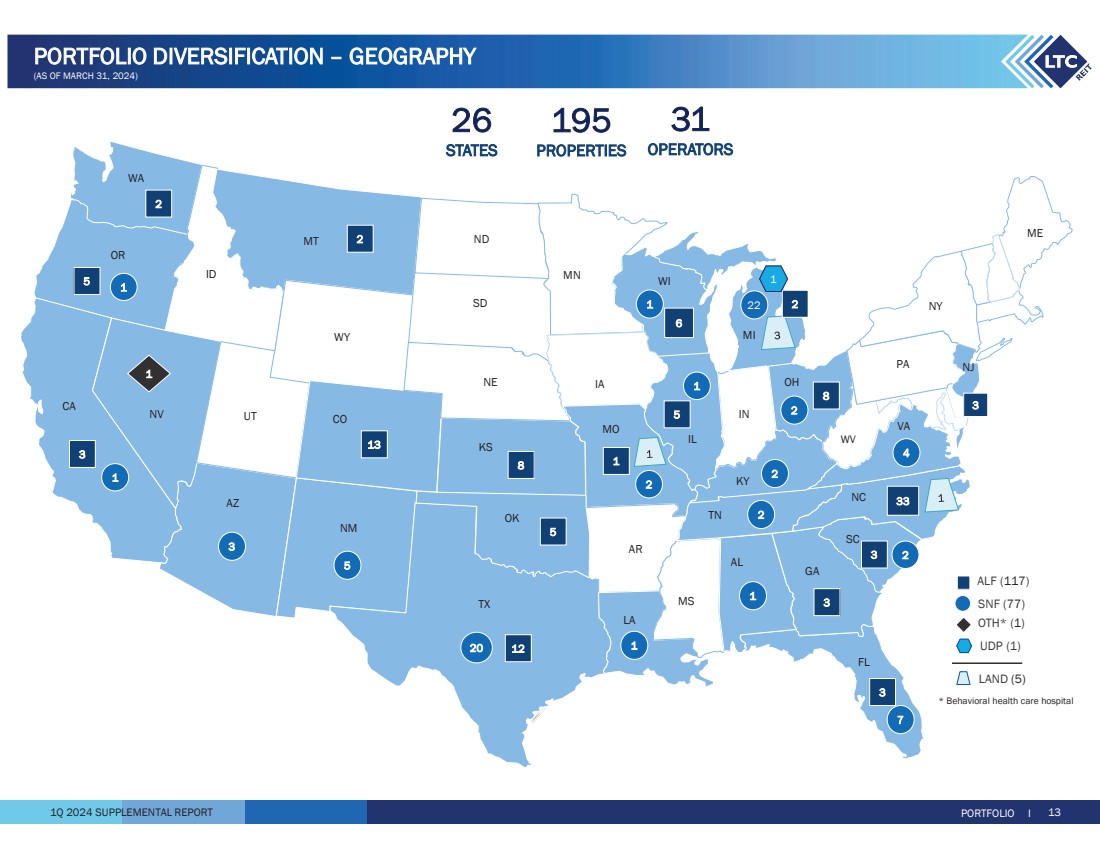
1Q 2024 SUPPLEMENTAL REPORT PORTFOLIO I 13 PORTFOLIO DIVERSIFICATION – GEOGRAPHY (AS OF MARCH 31, 2024) * Behavioral health care hospital SNF (77) ALF (117) OTH* (1) LAND (5) UDP (1) 26 STATES 195 PROPERTIES 31 OPERATORS CA WA ME NV WY IL AR WV ND NY OR AZ NM TX UT ID MT SD NE KS OK MS MN WI FL AL GA SC TN MO IA IN OH PA NJ NC VA CO KY 7 20 1 1 3 1 2 4 2 1 3 5 12 33 3 8 8 13 5 3 22 2 5 6 1 2 2 5 1 LA 3 2 2 1 MI 2 1 1 3 |
|
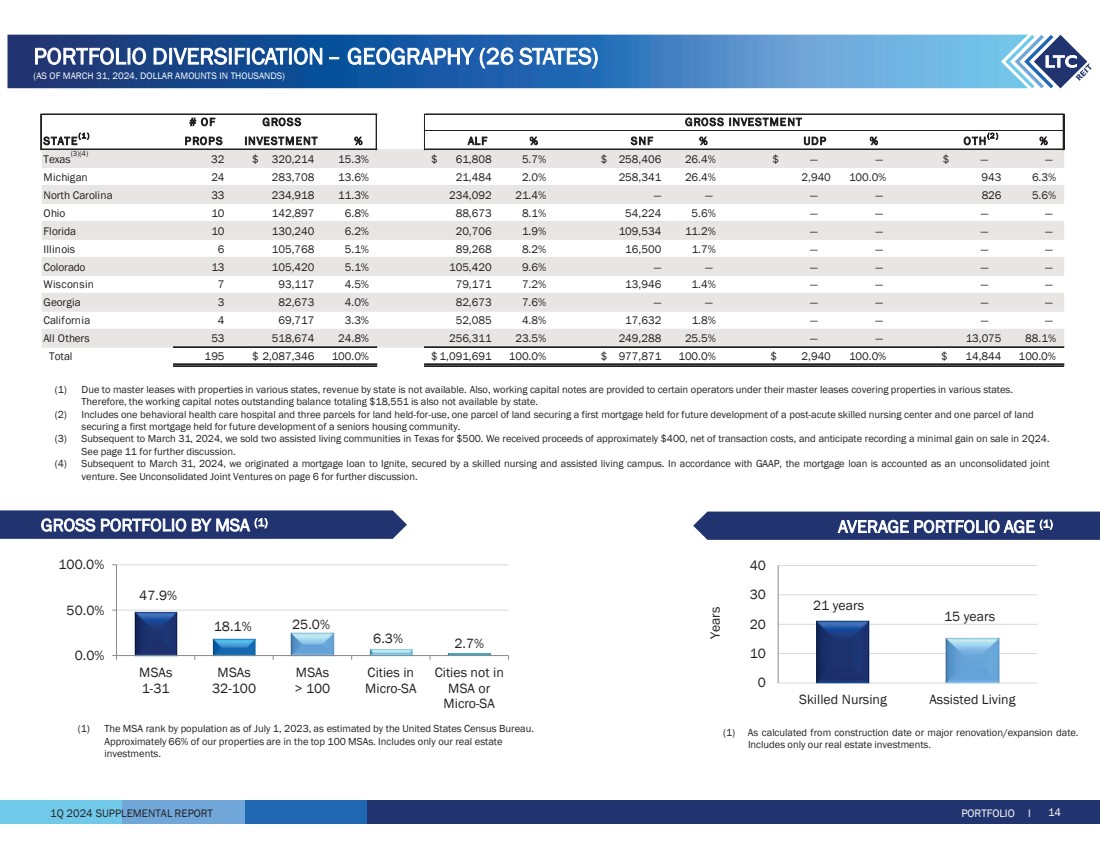
1Q 2024 SUPPLEMENTAL REPORT 47.9% 18.1% 25.0% 6.3% 2.7% 0.0% 50.0% 100.0% MSAs 1-31 MSAs 32-100 MSAs > 100 Cities in Micro-SA Cities not in MSA or Micro-SA 21 years 15 years 0 10 20 30 40 Skilled Nursing Assisted Living Years (1) The MSA rank by population as of July 1, 2023, as estimated by the United States Census Bureau. Approximately 66% of our properties are in the top 100 MSAs. Includes only our real estate investments. (1) As calculated from construction date or major renovation/expansion date. Includes only our real estate investments. GROSS PORTFOLIO BY MSA (1) AVERAGE PORTFOLIO AGE (1) PORTFOLIO I 14 PORTFOLIO DIVERSIFICATION– GEOGRAPHY (26 STATES) (AS OF MARCH 31, 2024, DOLLAR AMOUNTS IN THOUSANDS) # OF STATE(1 ) PROPS % ALF % SNF % UDP % % Texas(3)(4) 320,214 32 $ 15.3% 61,808 $ 5.7% 258,406 $ 26.4% — $ — — $ — Michigan 24 283,708 13.6% 21,484 2.0% 258,341 26.4% 2,940 100.0% 943 6.3% North Carolina 33 234,918 11.3% 234,092 21.4% — — — — 826 5.6% Ohio 10 142,897 6.8% 88,673 8.1% 54,224 5.6% — — — — Florida 10 130,240 6.2% 20,706 1.9% 109,534 11.2% — — — — Illinois 6 105,768 5.1% 89,268 8.2% 16,500 1.7% — — — — Colorado 13 105,420 5.1% 105,420 9.6% — — — — — — Wisconsin 7 93,117 4.5% 79,171 7.2% 13,946 1.4% — — — — Georgia 3 82,673 4.0% 82,673 7.6% — — — — — — California 4 69,717 3.3% 52,085 4.8% 17,632 1.8% — — — — All Others 53 518,674 24.8% 256,311 23.5% 249,288 25.5% — — 13,075 88.1% Total 195 2,087,346 $ 100.0% 1,091,691 $ 100.0% 977,871 $ 100.0% 2,940 $ 100.0% 14,844 $ 100.0% OTH(2 ) INVESTMENT GROSS GROSS INVESTMENT (1) Due to master leases with properties in various states, revenue by state is not available. Also, working capital notes are provided to certain operators under their master leases covering properties in various states. Therefore, the working capital notes outstanding balance totaling $18,551 is also not available by state. (2) Includes one behavioral health care hospital and three parcels for land held-for-use, one parcel of land securing a first mortgage held for future development of a post-acute skilled nursing center and one parcel of land securing a first mortgage held for future development of a seniors housing community. (3) Subsequent to March 31, 2024, we sold two assisted living communities in Texas for $500. We received proceeds of approximately $400, net of transaction costs, and anticipate recording a minimal gain on sale in 2Q24. See page 11 for further discussion. (4) Subsequent to March 31, 2024, we originated a mortgage loan to Ignite, secured by a skilled nursing and assisted living campus. In accordance with GAAP, the mortgage loan is accounted as an unconsolidated joint venture. See Unconsolidated Joint Ventures on page 6 for further discussion. |
|
1Q 2024 SUPPLEMENTAL REPORT (1) Information is from property level operator financial statements which are unaudited and have not been independently verified by LTC. The same store portfolio excludes properties transitioned on or after October 1, 2022 and properties sold. ASSISTED LIVING SKILLED NURSING 1.44 1.34 1.93 1.84 73.9% 74.5% 60.0% 70.0% 80.0% 90.0% 100.0% 0.00x 1.00x 2.00x 3Q23 4Q23 Occupancy % Normalized EBITDAR Normalized EBITDARM Occupancy 1.01 1.07 1.25 1.31 82.5% 83.4% 70.0% 80.0% 90.0% 100.0% 0.00x 1.00x 2.00x 3Q23 4Q23 Occupancy % Normalized EBITDAR Normalized EBITDARM Occupancy SNF metrics include CSF, as allocated/reported by operators. Excluding CSF, the 4Q23 normalized EBITDAR and EBITDARM coverages were 1.21x and 1.71x, respectively, and 1.18x and 1.67x, respectively, for 3Q23. Occupancy represents the average TTM occupancy. For the 87% of the reported SPP SNF, average monthly occupancy was 75% in March 2024, 74% in January 2024 and 72% in September 2023. ALF metrics include Coronavirus Stimulus Funds (“CSF”) as allocated/reported by operators. Excluding CSF, the 4Q23 normalized EBITDAR and EBITDARM coverages were 1.03x and 1.28x, respectively, and 0.92x and 1.16x, respectively, for 3Q23. See definition of Coronavirus Stimulus Funds in the Glossary. Occupancy represents the average TTM occupancy. For the 66% of the reported SPP ALF, spot occupancy was 88% at March 31, 2024, 87% at January 31, 2024 and 87% at September 30, 2023. PORTFOLIO I 15 REAL ESTATE INVESTMENTS METRICS (TRAILING TWELVE MONTHS THROUGH DECEMBER 31, 2023 AND SEPTEMBER 30, 2023) SAME PROPERTY PORTFOLIO (“SPP”) COVERAGE STATISTICS(1) |
|
1Q 2024 SUPPLEMENTAL REPORT MARCH 31, 2024 Revolving line of credit - WA rate 6.5% 277,050 $ Term loans, net of debt issue costs - WA rate 2.7% (1) 99,695 Senior unsecured notes, net of debt issue costs - WA rate 4.2% (2) 483,466 Total debt - WA rate 4.8% 860,211 37.9% No. of shares Closing Price Common stock 43,270,689 32.51 $ (3) 62.1% 1,406,730 Total Market Value 1,406,730 2 ,266,941 100.0% Add: Non-controlling interest 32,593 Less: Cash and cash equivalents (9,010) $ 2 ,290,524 Debt to Enterprise Value 37.6% Debt to Annualized Adjusted EBITDAre (4) 5.5x 3/28/24 CAPITALIZATION DEBT EQUITY TOTAL VALUE ENTERPRISE VALUE (1) Represents outstanding balance of $100,000, net of debt issue costs of $305. (2) Represents outstanding balance of $484,660 net of debt issue costs of $1,194. (3) Closing price of our common stock as reported by the NYSE on March 28, 2024, the last trading day of 1Q24. (4) See page 20 for Reconciliation of Annualized Adjusted EBITDAre. FINANCIAL I 16 ENTERPRISE VALUE (AMOUNTS IN THOUSANDS, EXCEPT PER SHARE AMOUNTS AND NUMBER OF SHARES) |
|
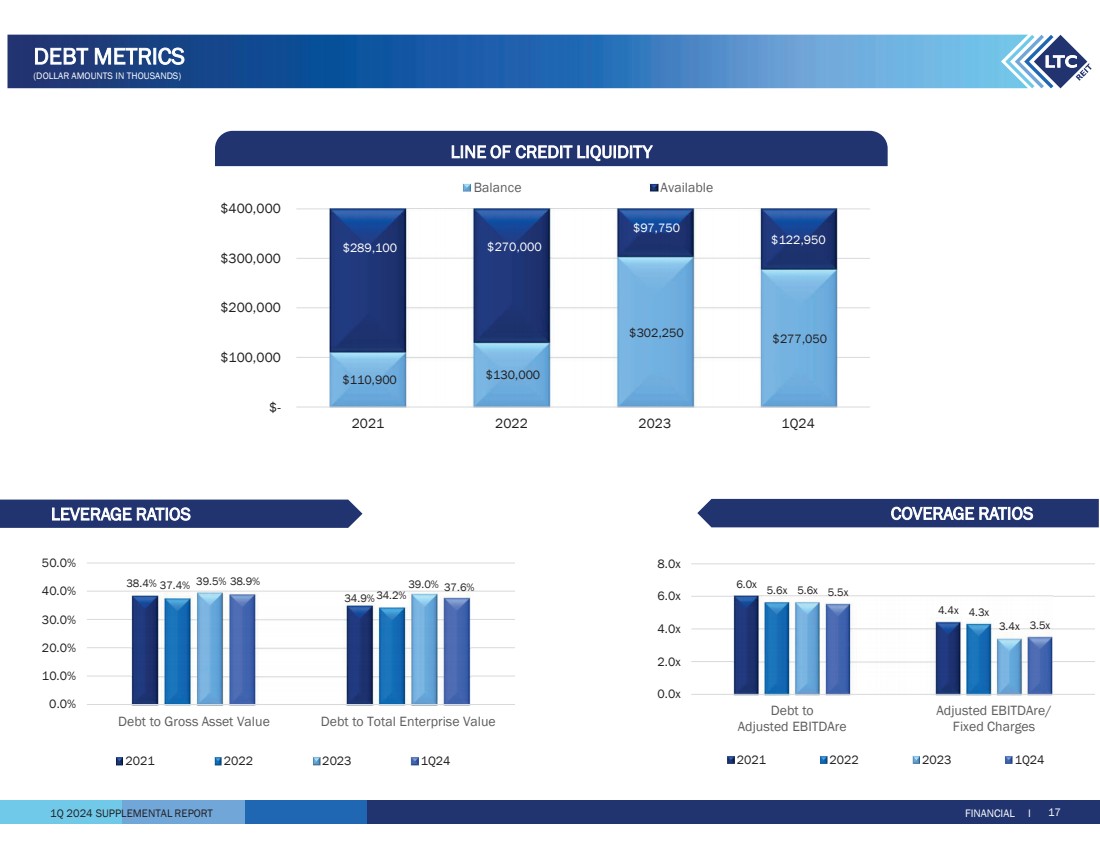
1Q 2024 SUPPLEMENTAL REPORT LEVERAGE RATIOS COVERAGE RATIOS LINE OF CREDIT LIQUIDITY FINANCIAL I 17 DEBT METRICS (DOLLAR AMOUNTS IN THOUSANDS) $110,900 $130,000 $302,250 $277,050 $289,100 $270,000 $97,750 $122,950 $- $100,000 $200,000 $300,000 $400,000 2021 2022 2023 1Q24 Balance Available 38.4% 34.9% 37.4% 34.2% 39.5% 38.9% 39.0% 37.6% 0.0% 10.0% 20.0% 30.0% 40.0% 50.0% Debt to Gross Asset Value Debt to Total Enterprise Value 2021 2022 2023 1Q24 6.0x 4.4x 5.6x 4.3x 5.6x 3.4x 5.5x 3.5x 0.0x 2.0x 4.0x 6.0x 8.0x Debt to Adjusted EBITDAre Adjusted EBITDAre/ Fixed Charges 2021 2022 2023 1Q24 |
|
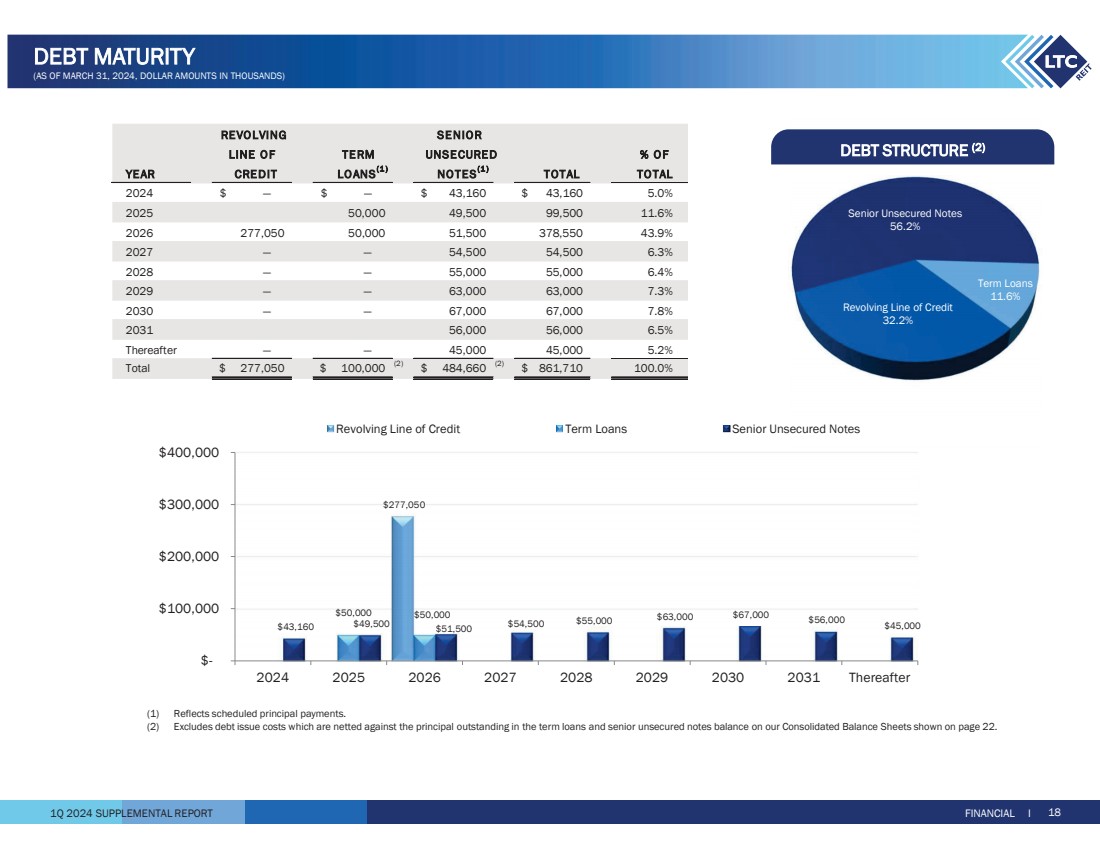
1Q 2024 SUPPLEMENTAL REPORT Senior Unsecured Notes 56.2% Term Loans 11.6% Revolving Line of Credit 32.2% $277,050 $50,000 $50,000 $43,160 $49,500 $51,500 $54,500 $55,000 $63,000 $67,000 $56,000 $45,000 $- $100,000 $200,000 $300,000 $400,000 2024 2025 2026 2027 2028 2029 2030 2031 Thereafter Revolving Line of Credit Term Loans Senior Unsecured Notes DEBT STRUCTURE (2) FINANCIAL I 18 DEBT MATURITY (AS OF MARCH 31, 2024, DOLLAR AMOUNTS IN THOUSANDS) REVOLVING SENIOR LINE OF TERM UNSECURED % OF YEAR CREDIT LOANS(1 ) NOTES(1 ) TOTAL TOTAL 2024 — $ — $ 43,160 $ 43,160 $ 5.0% 2025 50,000 49,500 99,500 11.6% 2026 277,050 50,000 51,500 378,550 43.9% 2027 — — 54,500 54,500 6.3% 2028 — — 55,000 55,000 6.4% 2029 — — 63,000 63,000 7.3% 2030 — — 67,000 67,000 7.8% 2031 56,000 56,000 6.5% Thereafter — — 45,000 45,000 5.2% Total 277,050 $ 100,000 $ (2) $ 484,660 (2) $ 100.0% 861,710 (1) Reflects scheduled principal payments. (2) Excludes debt issue costs which are netted against the principal outstanding in the term loans and senior unsecured notes balance on our Consolidated Balance Sheets shown on page 22. |
|
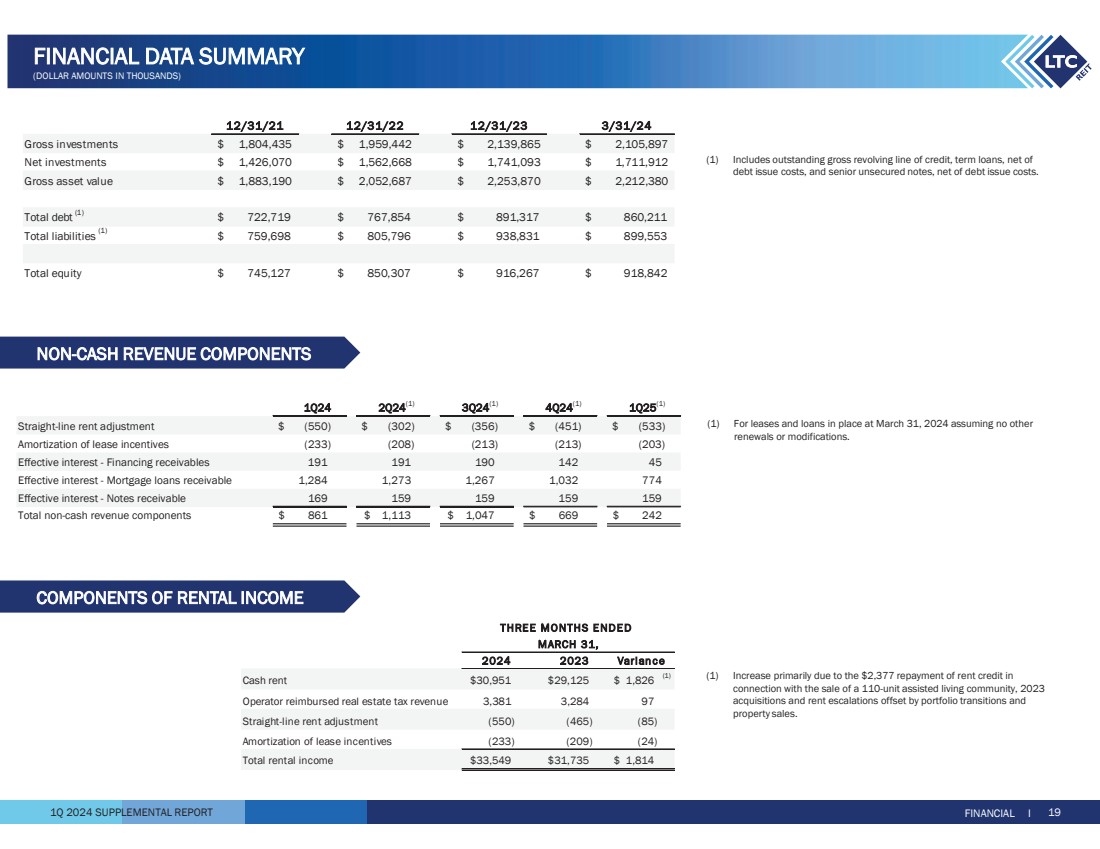
1Q 2024 SUPPLEMENTAL REPORT (1) For leases and loans in place at March 31, 2024 assuming no other renewals or modifications. (1) Increase primarily due to the $2,377 repayment of rent credit in connection with the sale of a 110-unit assisted living community, 2023 acquisitions and rent escalations offset by portfolio transitions and property sales. COMPONENTS OF RENTAL INCOME FINANCIAL I 19 FINANCIAL DATA SUMMARY (DOLLAR AMOUNTS IN THOUSANDS) 12/31/21 12/31/22 12/31/23 3/31/24 Gross investments $ 1,804,435 $ 1,959,442 $ 2,139,865 $ 2,105,897 Net investments $ 1,426,070 $ 1,562,668 $ 1,741,093 $ 1,711,912 Gross asset value $ 1,883,190 $ 2,052,687 $ 2,253,870 $ 2,212,380 Total debt (1) $ 722,719 $ 767,854 $ 891,317 $ 860,211 Total liabilities (1) $ 759,698 $ 805,796 $ 938,831 $ 899,553 Total equity $ 745,127 $ 850,307 $ 916,267 $ 918,842 Cash rent 30,951 $ 29,125 $ 1,826 $ (1) Operator reimbursed real estate tax revenue 3,381 3,284 97 Straight-line rent adjustment (550) (465) (85) Amortization of lease incentives (233) (209) (24) Total rental income 33,549 $ 31,735 $ 1,814 $ THREE MONTHS ENDED MARCH 31, 2024 2023 Variance (1) Includes outstanding gross revolving line of credit, term loans, net of debt issue costs, and senior unsecured notes, net of debt issue costs. NON-CASH REVENUE COMPONENTS 1Q24 2Q24(1) 3Q24(1) 4Q24(1) 1Q25(1) $ (302) (550) $ (356) $ (451) $ (533) $ (208) (233) (213) (213) (203) 191 191 190 142 45 1,273 1,284 1,267 1,032 774 159 169 159 159 159 $ 1,113 861 $ 1,047 $ 669 $ 242 $ Effective interest - Mortgage loans receivable Effective interest - Notes receivable Straight-line rent adjustment Amortization of lease incentives Effective interest - Financing receivables Total non-cash revenue components |
|
1Q 2024 SUPPLEMENTAL REPORT RECONCILIATION OF ANNUALIZED ADJUSTED EBITDAre AND FIXED CHARGES FINANCIAL I 20 FINANCIAL DATA SUMMARY (DOLLAR AMOUNTS IN THOUSANDS) (1) Represents the Senior Care settlement payment ($3,895), a straight-line rent receivable write-off ($758), a provision for credit losses on mortgage loan originations ($869), and the 50% reduction of 2021 rent and interest escalations ($425). (2) Increase due to additional borrowings for investments. (3) Represents a lease incentive balance write-off of $173 related to a closed property, a $1,332 provision for credit losses reserve related to the acquisition of three skilled nursing centers accounted for as a financing receivable, two mortgage loans and a mezzanine loan, and a lease termination fee of $500 paid to a former operator of 12 assisted living communities, partially offset by lease termination fee income of $1,181 received in connection with the sale of an assisted living community. (4) Includes the $3,561 note receivable write-off related to the sale and transition of 10 assisted living communities and $1,832 of provision for credit losses related to the acquisition of 11 assisted living communities accounted for as a financing receivable and two mortgage loan originations, partially offset by the $1,570 exit IRR and prepayment fee received in 2023 in connection to the payoff of two mezzanine loans. (5) Represents the $2,377 repayment of rent credit received in connection with the sale of a 110-unit assisted living community in 1Q24. (6) Given we do not have preferred stock, our fixed charge coverage ratio and interest coverage ratio are the same. 12/31/23 Net income 56,224 $ 100,584 $ 91,462 $ 24,689 $ Less: Gain on sale of real estate, net (7,462) (37,830) (37,296) (3,251) Add: Impairment loss — 3,422 15,775 — Add: Interest expense 27,375 31,437 47,014 11,045 Add: Depreciation and amortization 38,296 37,496 37,416 9,095 EBITDAre 135,109 114,433 154,371 41,578 Add/less: Non-recurring items 5,947 (1) 824 (3) 3,823 (4) (2,377) (5) Adjusted EBITDAre $ 135,933 120,380 $ 158,194 $ 39,201 $ Interest expense 27,375 $ 31,437 $ 47,014 $ 11,045 $ Fixed charges 27,375 $ 31,437 $ 47,014 $ 11,045 $ Annualized Adjusted EBITDAre $ 156,804 Annualized Fixed Charges $ 44,180 Debt (net of debt issue costs) 722,719 $ 767,854 $ 891,317 $ 860,211 $ Debt to Annualized Adjusted EBITDAre 6.0x (2) 5.6x 5.6x 5.5x Annualized Adjusted EBITDAre to Fixed Charges(6) 4.4x 4.3x 3.4x 3.5x FOR THE YEAR ENDED THREE MONTHS ENDED 12/31/21 12/31/22 3/31/24 |
|
1Q 2024 SUPPLEMENTAL REPORT FINANCIAL I 21 CONSOLIDATED STATEMENTS OF INCOME (AMOUNTS IN THOUSANDS, EXCEPT PER SHARE AMOUNTS) 2024 2023 Revenues Rental income 33,549 $ 31,735 $ Interest income from financing receivables(1) 3,830 3,751 Interest income from mortgage loans 12,448 11,244 Interest and other income 1,539 2,770 Total revenues 51,366 49,500 Expenses Interest expense 11,045 10,609 Depreciation and amortization 9,095 9,210 Impairment loss 434 — Provision for credit losses 24 1,731 Transaction costs 266 117 Property tax expense 3,383 3,293 General and administrative expenses 6,491 6,294 Total expenses 30,304 31,688 Other Operating Income Gain on sale of real estate, net 3,251 15,373 Operating Income 24,313 33,185 Income from unconsolidated joint ventures 376 376 Net Income 24,689 33,561 Income allocated to non-controlling interests (459) (427) Net income attributable to LTC Properties, Inc. 24,230 33,134 Income allocated to participating securities (165) (205) Net income available to common stockholders 24,065 $ 32,929 $ Earnings per common share: Basic $0.56 $0.80 Diluted $0.56 $0.80 Weighted average shares used to calculate earnings per common share: Basic 41,082 42,891 Diluted 43,032 41,189 Dividends declared and paid per common share $0.57 $0.57 THREE MONTHS ENDED MARCH 31, (unaudited) (1) Represents rental income from acquisitions through sale-leaseback transactions, subject to leases which contain purchase options. In accordance with GAAP, the properties are required to be presented as financing receivables on our Consolidated Balance Sheets and the rental income to be presented as Interest income from financing receivables on our Consolidated Statements of Income. |
|
1Q 2024 SUPPLEMENTAL REPORT FINANCIAL I 22 CONSOLIDATED BALANCE SHEETS (AMOUNTS IN THOUSANDS, EXCEPT PER SHARE AMOUNTS) ASSETS Investments: Land $ 120,137 $ 121,725 Buildings and improvements 1,219,622 1,235,600 Accumulated depreciation and amortization (383,782) (387,751) Operating real estate property, net 969,574 955,977 Properties held-for-sale, net of accumulated depreciation: 2024—$2,773; 2023—$3,616 389 18,391 Real property investments, net 956,366 987,965 Financing receivables,(1) net of credit loss reserve: 2024—$1,980; 2023—$1,980 196,010 196,032 Mortgage loans receivable, net of credit loss reserve: 2024—$4,845; 2023—$4,814 480,250 477,266 Real estate investments, net 1,632,626 1,661,263 Notes receivable, net of credit loss reserve: 2024—$605; 2023—$611 59,946 60,490 Investments in unconsolidated joint ventures 19,340 19,340 Investments, net 1,711,912 1,741,093 Other assets: Cash and cash equivalents 9,010 20,286 Debt issue costs related to revolving line of credit 1,786 1,557 Interest receivable 55,842 53,960 Straight-line rent receivable 19,075 19,626 Lease incentives 2,607 3,578 Prepaid expenses and other assets 17,192 15,969 Total assets $ 1,818,395 $ 1,855,098 LIABILITIES Revolving line of credit $ 277,050 $ 302,250 Term loans, net of debt issue costs: 2024—$305; 2023—$342 99,658 99,695 Senior unsecured notes, net of debt issue costs: 2024—$1,194; 2023—$1,251 483,466 489,409 Accrued interest 4,861 3,865 Accrued expenses and other liabilities 34,481 43,649 Total liabilities 899,553 938,831 EQUITY Stockholders’ equity: Common stock: $0.01 par value; 60,000 shares authorized; shares issued and outstanding: 2024—43,271; 2023—43,022 433 430 Capital in excess of par value 996,631 991,656 Cumulative net income 1,658,625 1,634,395 Accumulated other comprehensive income 6,110 6,488 Cumulative distributions (1,775,928) (1,751,312) Total LTC Properties, Inc. stockholders’ equity 886,249 881,279 Non-controlling interests 32,593 34,988 Total equity 918,842 916,267 Total liabilities and equity $ 1,818,395 $ 1,855,098 (unaudited) (audited) MARCH 31, 2024 DECEMBER 31, 2023 (1) Represents acquisitions through sale-leaseback transactions, subject to leases which contain purchase options. In accordance with GAAP, the properties are required to be presented as financing receivables on our Consolidated Balance Sheets. |
|
1Q 2024 SUPPLEMENTAL REPORT (1) Represents the repayment of rent credit received in connection with the sale of a 110-unit assisted living community in Wisconsin. The rent credit was provided to the operator during new construction lease-up. (2) Represents the net of (3) and (4) below. (3) Includes $1,832 of provision for credit losses related to the $121,321 acquisition accounted for as a financing receivable and $61,900 of mortgage loan originations. (4) Represents the exit IRR and prepayment fee received in 2023 in connection to the payoff of two mezzanine loans. FINANCIAL I 23 FUNDS FROM OPERATIONS – RECONCILIATION OF FFO AND FAD (UNAUDITED, AMOUNTS IN THOUSANDS, EXCEPT PER SHARE AMOUNTS) 2024 2023 GAAP net income available to common stockholders 24,065 $ 32,929 $ Add: Impairment loss — 434 Add: Depreciation and amortization 9,095 9,210 Less: Gain loss on sale of real estate, net (3,251) (15,373) NAREIT FFO attributable to common stockholders 29,909 $ 27,200 $ $0.69 $0.66 NAREIT FFO attributable to common stockholders 29,909 $ 27,200 $ Add: Non-recurring items (2,377) (1) 262 (2) $ 27,462 27,532 $ NAREIT FFO attributable to common stockholders 29,909 $ 27,200 $ Non-cash income: Add: Straight-line rental adjustment 550 465 Add: Amortization of lease incentives 233 209 Less: Effective interest income (1,644) (1,608) Net non-cash income (861) (934) Non-cash expense: Add: Non-cash compensation charges 2,202 2,088 Add: Provision for credit losses 24 1,731 (3) Net non-cash expense 2,226 3,819 Funds available for distribution (FAD) 31,274 30,085 Less: Non-recurring income (2,377) (1) (1,570) (4) Funds available for distribution (FAD), excluding non-recurring items 28,897 $ 28,515 $ FFO attributable to common stockholders, excluding non-recurring items THREE MONTHS ENDED MARCH 31, NAREIT Diluted FFO attributable to common stockholders per share |
|
1Q 2024 SUPPLEMENTAL REPORT FOR THE THREE MONTHS ENDED MARCH 31, FFO/FAD attributable to common stockholders 29,909 $ 27,200 $ 31,274 $ 30,085 $ Non-recurring one-time items (2,377) (1) 262 (2) (2,377) (1) (1,570) (3) FFO/FAD attributable to common stockholders excluding non-recurring items 27,532 27,462 28,897 28,515 Effect of dilutive securities: Participating securities 165 — 165 — Diluted FFO/FAD excluding non-recurring items 27,697 $ 27,462 $ 29,062 $ 28,515 $ 41,082 42,891 42,891 41,082 Effect of dilutive securities: Performance-based stock units 141 107 141 107 Participating securities 277 — 277 — Shares for diluted FFO/FAD per share 43,309 41,189 43,309 41,189 Shares for basic FFO/FAD per share FFO FAD 2024 2023 2024 2023 FINANCIAL I 24 FUNDS FROM OPERATIONS – RECONCILIATION OF FFO PER SHARE (UNAUDITED, AMOUNTS IN THOUSANDS, EXCEPT PER SHARE AMOUNTS) (1) Represents the repayment of rent credit received in connection with the sale of a 110-unit assisted living community in Wisconsin. The rent credit was provided to the operator during new construction lease-up. (2) Represents $1,832 of provision for credit losses related to the $121,321 acquisition accounted for as a financing receivable and $61,900 of mortgage loan originations, offset by (3) below. (3) Represents the exit IRR and prepayment fee received in 2023 in connection to the payoff of two mezzanine loans. |
|
1Q 2024 SUPPLEMENTAL REPORT Annualized Actual Cash Income: Represents annualized cash rental income includes cash rent and excludes real estate tax reimbursement, interest income from financing receivables, mortgage loans, mezzanine loans and working capital notes, and income from unconsolidated joint ventures received for the month of March 2024 for investments as of March 31, 2024. Annualized Contractual Cash Income: Represents annualized contractual cash rental income prior to abatements & deferred rent repayment and excludes real estate tax reimbursement, interest income from financing receivables, mortgage loans, mezzanine loans and working capital notes, and income from unconsolidated joint ventures for the month of March 2024 for investments as of March 31, 2024. Annualized GAAP Income: Represents annualized GAAP rent which includes contractual cash rent, straight-line rent and amortization of lease incentives and excludes real estate tax reimbursement, GAAP interest income from financing receivables, mortgage loans, mezzanine loans and working capital notes, and income from unconsolidated joint ventures for the month of March 2024 for investments as of March 31, 2024. Assisted Living Communities (“ALF”): The ALF portfolio consists of assisted living, independent living, and/or memory care properties. (See Independent Living and Memory Care) Assisted living properties are seniors housing properties serving elderly persons who require assistance with activities of daily living, but do not require the constant supervision skilled nursing properties provide. Services are usually available 24 hours a day and include personal supervision and assistance with eating, bathing, grooming and administering medication. The facilities provide a combination of housing, supportive services, personalized assistance and health care designed to respond to individual needs. Contractual Lease Rent: Rental revenue as defined by the lease agreement between us and the operator for the lease year. Coronavirus Stimulus Funds (“CSF”): CSF includes funding from various state and federal programs to support healthcare providers in dealing with the challenges of the coronavirus pandemic. Included in CSF are state-specific payments identified by operators as well as federal payments connected to the Paycheck Protection Program and the Provider Relief Fund. CSF is self-reported by operators in unaudited financial statements provided to LTC. Specifically excluded from CSF are the suspension of the Medicare sequestration cut, and increases to the Federal Medical Assistance Percentages (FMAP), both of which are reflected in reported coverage both including and excluding CSF. Earnings Before Interest, Tax, Depreciation and Amortization for Real Estate (“EBITDAre”): As defined by the National Association of Real Estate Investment Trusts (“NAREIT”), EBITDAre is calculated as net income (computed in accordance with GAAP) excluding (i) interest expense, (ii) income tax expense, (iii) real estate depreciation and amortization, (iv) impairment write-downs of depreciable real estate, (v) gains or losses on the sale of depreciable real estate, and (vi) adjustments for unconsolidated partnerships and joint ventures. Financing Receivables: Properties acquired through a sale-leaseback transaction with an operating entity being the same before and after the sale-leaseback, subject to a lease contract that contains a purchase option. In accordance with GAAP, the purchased assets are required to be presented as Financing Receivables on our Consolidated Balance Sheets and the rental income to be presented as Interest income from financing receivables on our Consolidated Statements of Income. Funds Available for Distribution (“FAD”): FFO excluding the effects of straight-line rent, amortization of lease costs, effective interest income, provision for credit losses, non-cash compensation charges and non-cash interest charges. Funds From Operations (“FFO”): As defined by NAREIT, net income available to common stockholders (computed in accordance with U.S. GAAP) excluding gains or losses on the sale of real estate and impairment write-downs of depreciable real estate plus real estate depreciation and amortization, and after adjustments for unconsolidated partnerships and joint ventures. GAAP Lease Yield: GAAP rent divided by the sum of the purchase price and transaction costs. GAAP Rent: Total rent we will receive as a fixed amount over the initial term of the lease and recognized evenly over that term. GAAP rent recorded in the early years of a lease is higher than the cash rent received and during the later years of the lease, the cash rent received is higher than GAAP rent recognized. GAAP rent is commonly referred to as straight-line rental income. Gross Asset Value: The carrying amount of total assets after adding back accumulated depreciation and loan loss reserves, as reported in the company’s consolidated financial statements. Gross Investment: Original price paid for an asset plus capital improvements funded by LTC, without any deductions for depreciation or provision for credit losses. Gross Investment is commonly referred to as undepreciated book value. Independent Living Communities (“ILF”): Seniors housing properties offering a sense of community and numerous levels of service, such as laundry, housekeeping, dining options/meal plans, exercise and wellness programs, transportation, social, cultural and recreational activities, on-site security and emergency response programs. Many offer on-site conveniences like beauty/barber shops, fitness facilities, game rooms, libraries and activity centers. ILFs are also known as retirement communities or seniors apartments. Interest Income: Represents interest income from mortgage loans and other notes. Licensed Beds/Units: The number of beds and/or units that an operator is authorized to operate at seniors housing and long-term care properties. Licensed beds and/or units may differ from the number of beds and/or units in service at any given time. Memory Care Communities (“MC”): Seniors housing properties offering specialized options for seniors with Alzheimer’s disease and other forms of dementia. These facilities offer dedicated care and specialized programming for various conditions relating to memory loss in a secured environment that is typically smaller in scale and more residential in nature than traditional assisted living facilities. These facilities have staff available 24 hours a day to respond to the unique needs of their residents. Metropolitan Statistical Areas (“MSA”): Based on the U.S. Census Bureau, MSA is a geographic entity defined by the Office of Management and Budget (OMB) for use by Federal statistical agencies in collecting, tabulating, and publishing Federal statistics. A metro area contains a core urban area of 50,000 or more population. MSAs 1 to 31 have a population of 19.8M – 2.2M. MSAs 32 to 100 have a population of 2.2M – 0.6M. MSAs greater than 100 have a population of 0.6M – 59K. Cities in a Micro-SA have a population of 223K – 12K. Cities not in a MSA has population of less than 100K. GLOSSARY I 25 GLOSSARY |
|
1Q 2024 SUPPLEMENTAL REPORT Mezzanine: In certain circumstances, the Company strategically allocates a portion of its capital deployment toward mezzanine loans to grow relationships with operating companies that have not typically utilized sale-leaseback financing as a component of their capital structure. Mezzanine financing sits between senior debt and common equity in the capital structure, and typically is used to finance development projects, value-add opportunities on existing operational properties, partnership buy-outs and recapitalization of equity. We seek market-based, risk-adjusted rates of return typically between 9% to 14% with the loan term typically between three to 10 years. Security for mezzanine loans can include all or a portion of the following credit enhancements; secured second mortgage, pledge of equity interests and personal/corporate guarantees. Mezzanine loans can be recorded for GAAP purposes as either a loan or joint venture depending upon specifics of the loan terms and related credit enhancements. Micropolitan Statistical Areas (“Micro-SA”): Based on the U.S. Census Bureau, Micro-SA is a geographic entity defined by the Office of Management and Budget (OMB) for use by Federal statistical agencies in collecting, tabulating, and publishing Federal statistics. A micro area contains an urban core of at least 10,000 population. Mortgage Loan: Mortgage financing is provided on properties based on our established investment underwriting criteria and secured by a first mortgage. Subject to underwriting, additional credit enhancements may be required including, but not limited to, personal/corporate guarantees and debt service reserves. When possible, LTC attempts to negotiate a purchase option to acquire the property at a future time and lease the property back to the borrower. Net Real Estate Assets: Gross real estate investment less accumulated depreciation. Net Real Estate Asset is commonly referred to as Net Book Value (“NBV”). Non-cashRevenue: Straight-line rental income, amortization of lease inducement and effective interest. Non-cashCompensation Charges: Vesting expense relating to stock options and restricted stock. Normalized EBITDAR Coverage: The trailing twelve month’s earnings from the operator financial statements adjusted for non-recurring, infrequent, or unusual items and before interest, taxes, depreciation, amortization, and rent divided by the operator’s contractual lease rent. Management fees are imputed at 5% of revenues. Normalized EBITDARM Coverage: The trailing twelve month’s earnings from the operator financial statements adjusted for non-recurring, infrequent, or unusual items and before interest, taxes, depreciation, amortization, rent, and management fees divided by the operator’s contractual lease rent. Occupancy: The weighted average percentage of all beds and/or units that are occupied at a given time. The calculation uses the trailing twelve months and is based on licensed beds and/or units which may differ from the number of beds and/or units in service at any given time. Operator Financial Statements: Property level operator financial statements which are unaudited and have not been independently verified by us. Payor Source: LTC revenue by operator underlying payor source for the period presented. LTC is not a Medicaid or a Medicare recipient. Statistics represent LTC's rental revenues times operators' underlying payor source revenue percentage. Underlying payor source revenue percentage is calculated from property level operator financial statements which are unaudited and have not been independently verified by us. Private Pay: Private pay includes private insurance, HMO, VA, and other payors. Purchase Price: Represents the fair value price of an asset that is exchanged in an orderly transaction between market participants at the measurement date. An orderly transaction is a transaction that assumes exposure to the market for a period prior to the measurement date to allow for marketing activities that are usual and customary for transactions involving such assets; it is not a forced transaction (for example, a forced liquidation or distress sale). Real Estate Investments: Represents our investments in real property and mortgage loan receivables. Rental Income: Represents GAAP rent net of amortized lease inducement cost. Same Property Portfolio (“SPP”): Same property statistics allow for the comparative evaluation of performance across a consistent population of LTC’s leased property portfolio and the Prestige Healthcare mortgage loan portfolio. Our SPP is comprised of stabilized properties occupied and operated throughout the duration of the quarter-over-quarter comparison periods presented (excluding assets sold and assets held-for-sale). Accordingly, a property must be occupied and stabilized for a minimum of 15 months to be included in our SPP. Each property transitioned to a new operator has been excluded from SPP and will be added back to SPP for the SPP reporting period ending 15 months after the date of the transition. Skilled Nursing Properties (“SNF”): Seniors housing properties providing restorative, rehabilitative and nursing care for people not requiring the more extensive and sophisticated treatment available at acute care hospitals. Many SNFs provide ancillary services that include occupational, speech, physical, respiratory and IV therapies, as well as sub-acute care services which are paid either by the patient, the patient’s family, private health insurance, or through the federal Medicare or state Medicaid programs. Stabilized: Properties are generally considered stabilized upon the earlier of achieving certain occupancy thresholds (e.g. 80% for SNFs and 90% for ALFs) and, as applicable, 12 months from the date of acquisition/lease transition or, in the event of a de novo development, redevelopment, major renovations or addition, 24 months from the date the property is first placed in or returned to service, or properties acquired in lease-up. Trailing Twelve Months Revenues: For the owned portfolio, rental income includes cash rent, straight-line rent and amortization of lease incentives and excludes real estate tax reimbursement and rental income from properties sold during the trailing twelve months. Financing receivables revenue includes cash interest income and effective interest from financing receivables during the trailing twelve months. Mortgage loans revenue includes cash interest income and effective interest from mortgage loans and construction loans during the trailing twelve months. Notes receivables revenue includes cash interest income and effective interest from mezzanine loans and working capital notes and excludes loan payoffs during the trailing twelve months. Unconsolidated JV revenue includes income from our investments in joint ventures during the trailing twelve months. Under Development Properties (“UDP”): Development projects to construct seniors housing properties. GLOSSARY I 26 GLOSSARY |