| Connecticut | 001-36448 | 20-8251355 | ||||||
| (State or other jurisdiction of incorporation) | (Commission File Number) | (IRS Employer Identification No.) | ||||||
| ☐ | Written communications pursuant to Rule 425 under the Securities Act (17 CFR 230.425) | ||||
| ☐ | Soliciting material pursuant to Rule 14a-12 under the Exchange Act (17 CFR 240.14a-12) | ||||
| ☐ | Pre-commencement communications pursuant to Rule 14d-2(b) under the Exchange Act (17 CFR 240.14d-2(b)) | ||||
| ☐ | Pre-commencement communications pursuant to Rule 13e-4(c) under the Exchange Act (17 CFR 240.13e-4(c)) | ||||
| Title of Each Class |
Trading Symbol(s) |
Name of Each Exchange on Which Registered |
||||||
|
Common Stock, no par value per
share
|
BWFG |
NASDAQ Global Market
|
||||||
| Emerging growth company | ☐ |
||||
| If an emerging growth company, indicate by check mark if the registrant has elected not to use the extended transition period for complying with any new or revised financial accounting standards provided pursuant to Section 13(a) of the Exchange Act. | ☐ |
||||
| Item 2.02 | Results of Operations and Financial Condition | ||||
|
On October 25, 2023, Bankwell Financial Group, Inc., the holding company for Bankwell Bank, issued a press release describing its results of operations for the period ended September 30, 2023.
A copy of the press release is included as Exhibit 99.1 to this current report on Form 8-K and is incorporated herein by reference.
|
|||||
| The information furnished under this Item 2.02, including Exhibit 99.1, shall not be deemed “filed” for purposes of Section 18 of the Securities Exchange Act of 1934, as amended, or subject to the liabilities of that section. The information shall not be deemed incorporated by reference into any other filing with the Securities and Exchange Commission made by the Company, regardless of any general incorporation language in such filing. |
|||||
| Item 7.01 | Regulation FD Disclosure | ||||
|
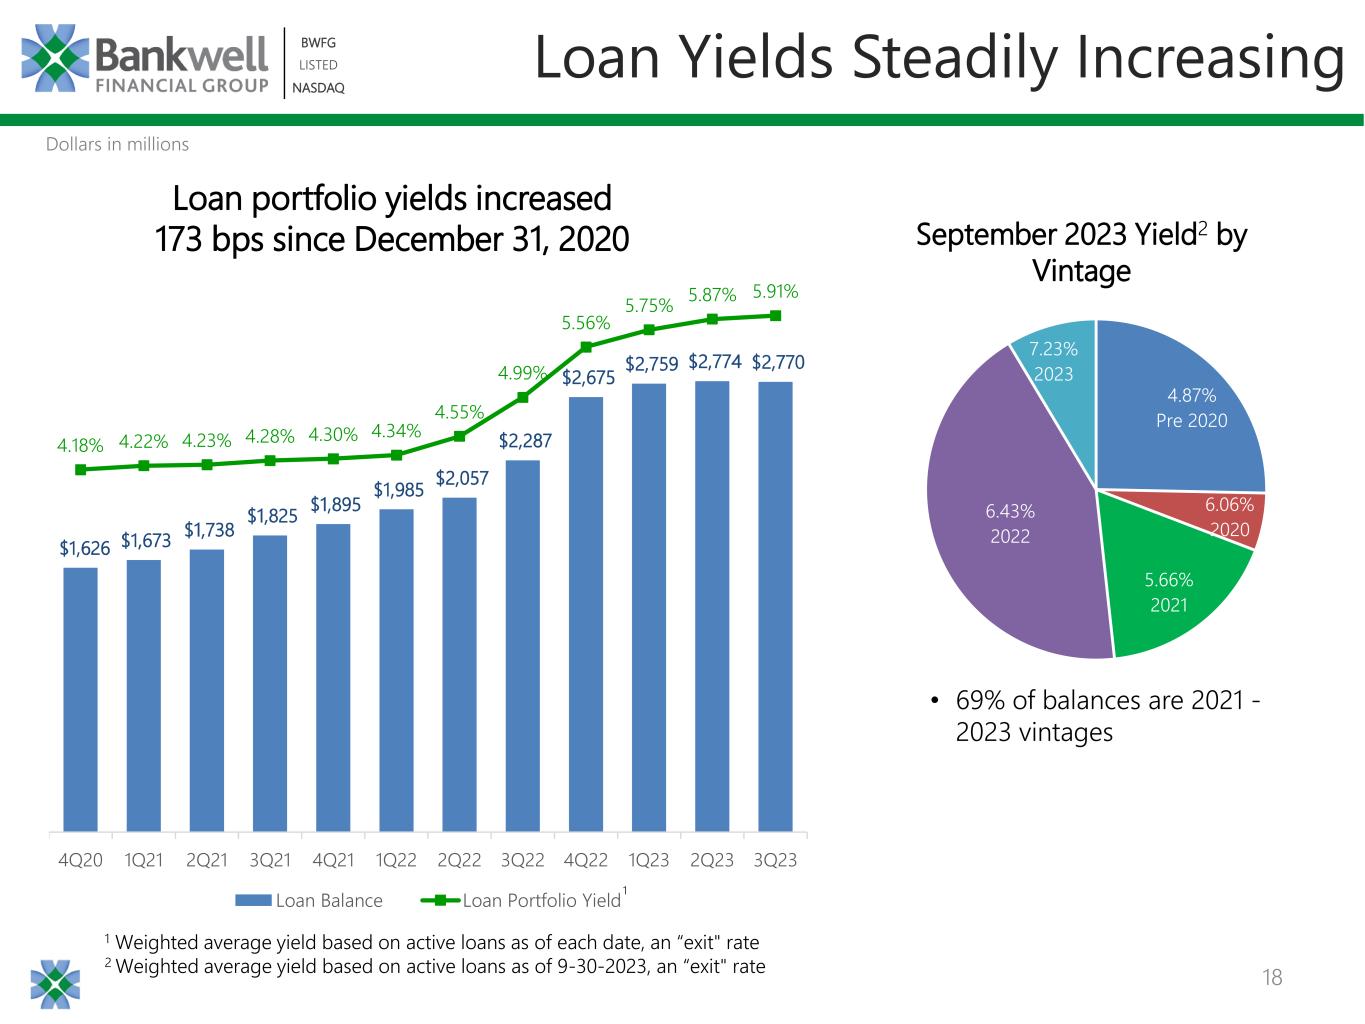
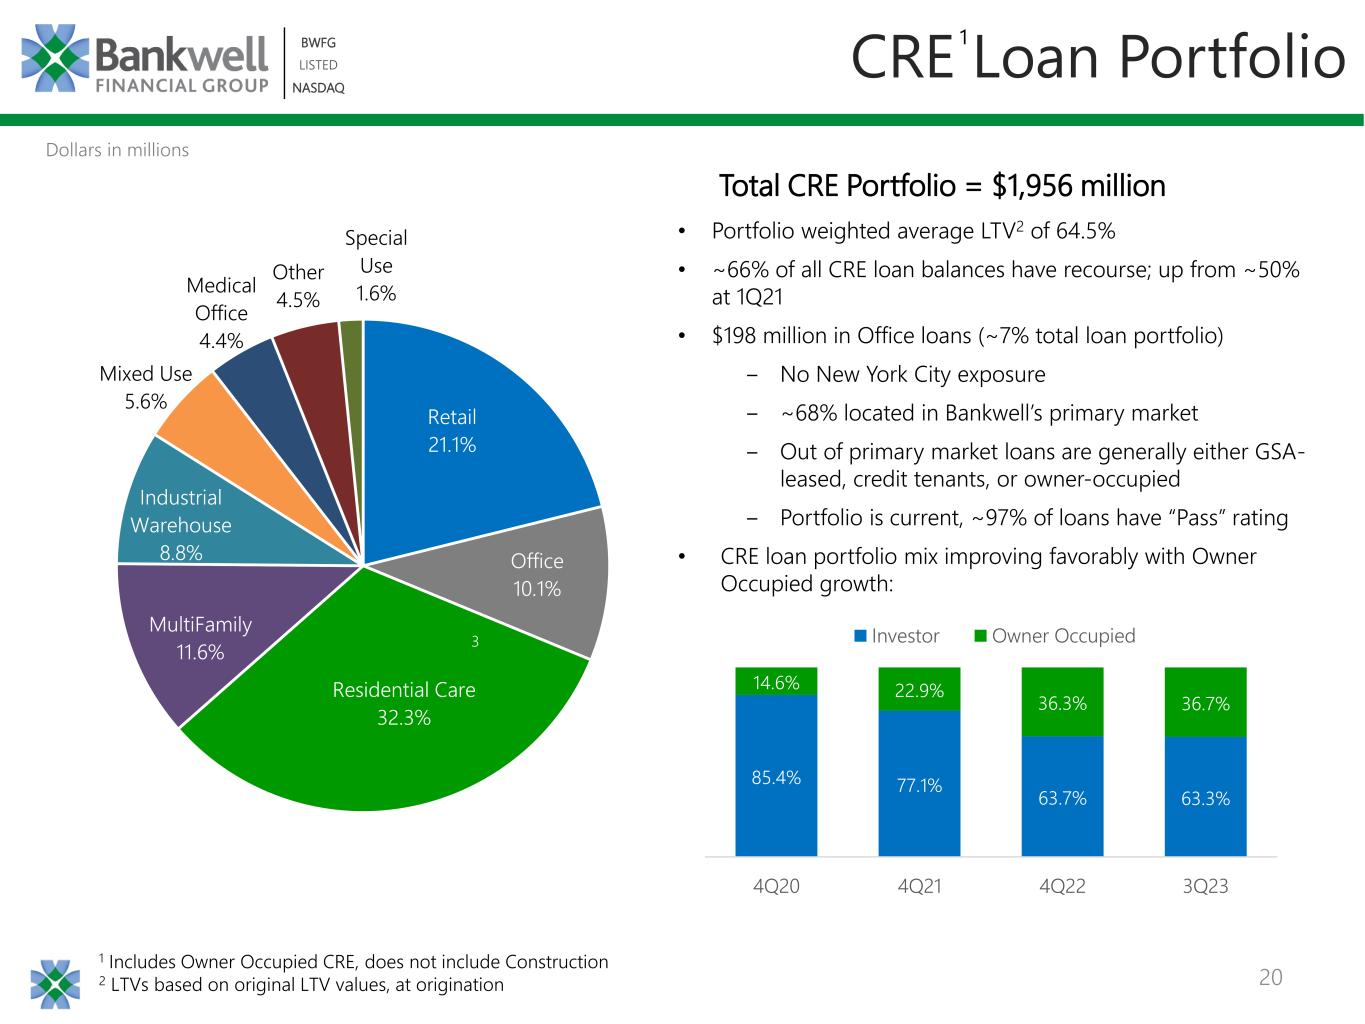
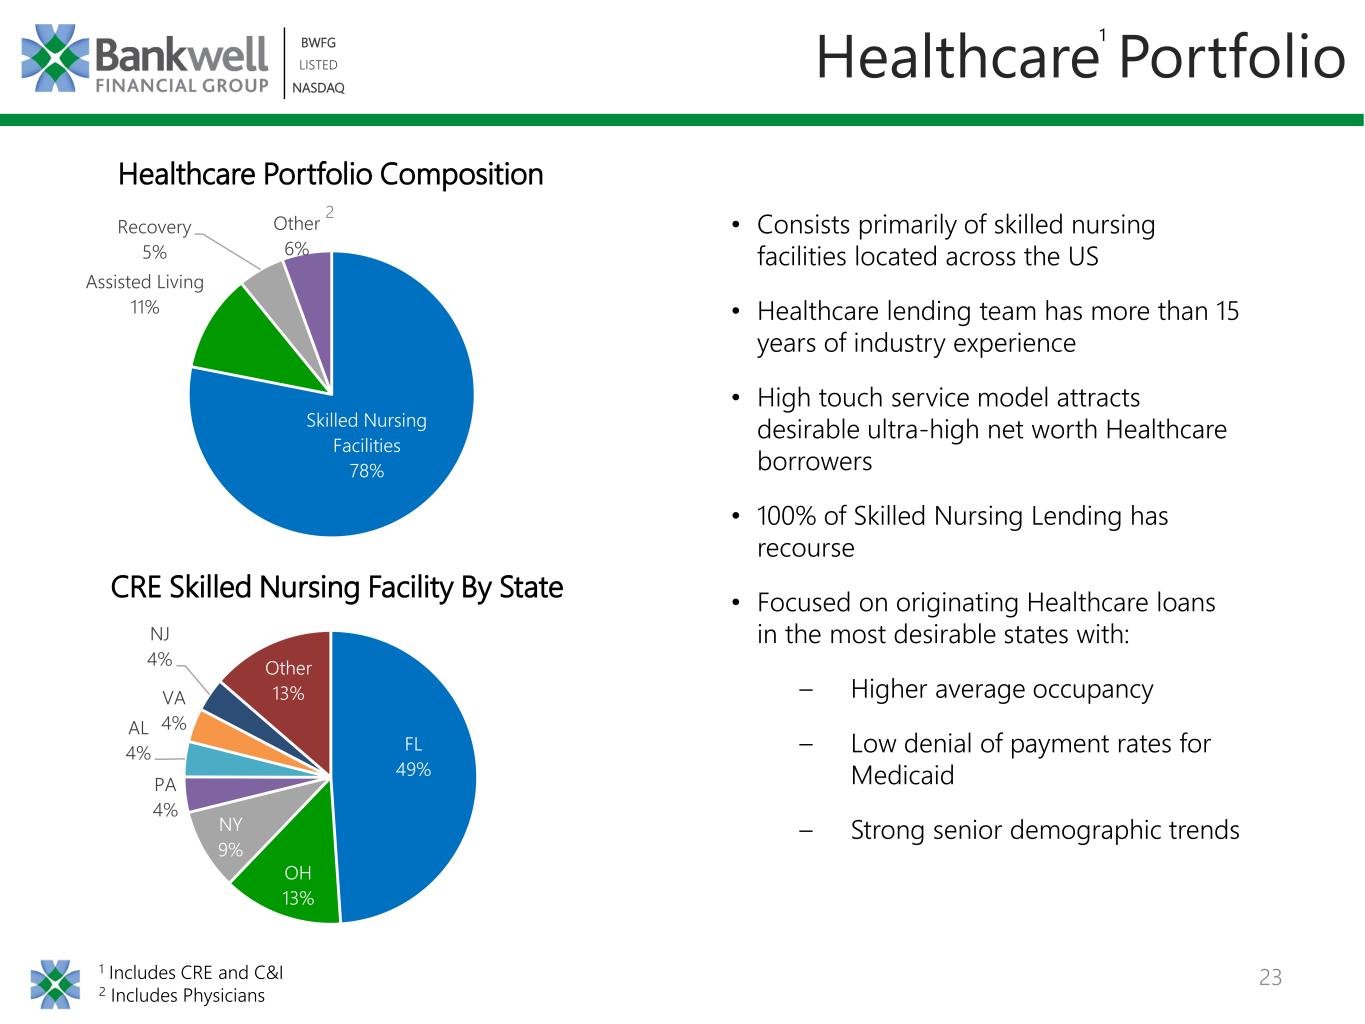
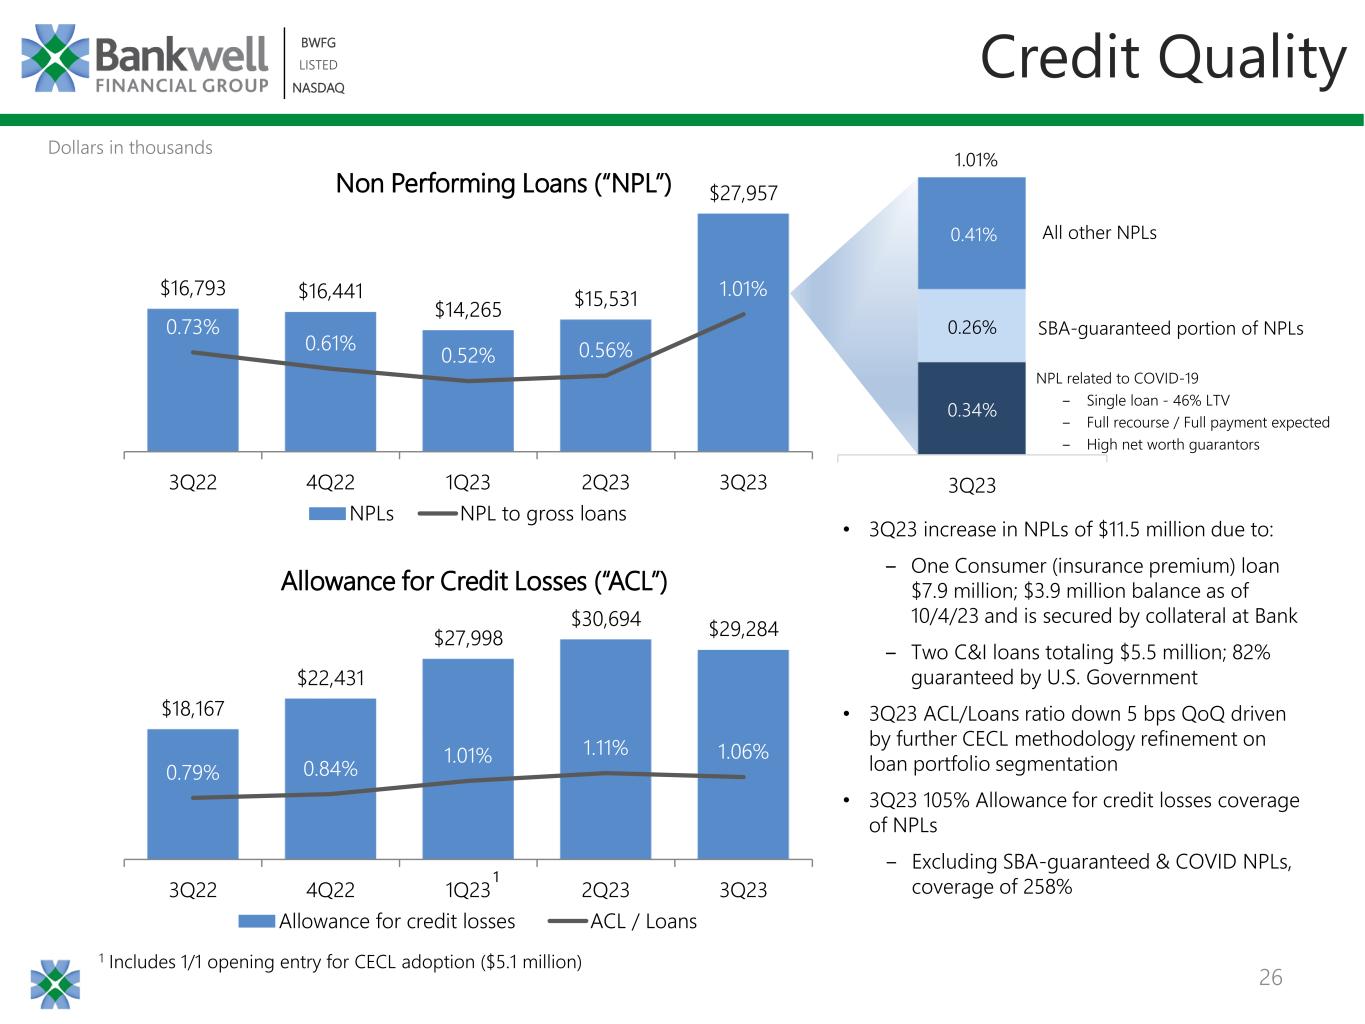
On October 25, 2023, Bankwell Financial Group, Inc., the holding company for Bankwell Bank, issued slide presentation material, which includes among other things, a review of financial results and trends through the period ended September 30, 2023. A copy of the material will also be available on the Company’s website, http://investor.mybankwell.com/CorporateProfile.
A copy of the Presentation Material is included as Exhibit 99.2 to this current report on Form 8-K and is incorporated herein by reference.
|
|||||
| The information furnished under this Item 7.01, including Exhibit 99.2, shall not be deemed “filed” for purposes of Section 18 of the Securities Exchange Act of 1934, as amended, or subject to the liabilities of that section. The information shall not be deemed incorporated by reference into any other filing with the Securities and Exchange Commission made by the Company, regardless of any general incorporation language in such filing. |
|||||
| Item 8.01 | Other Events | ||||
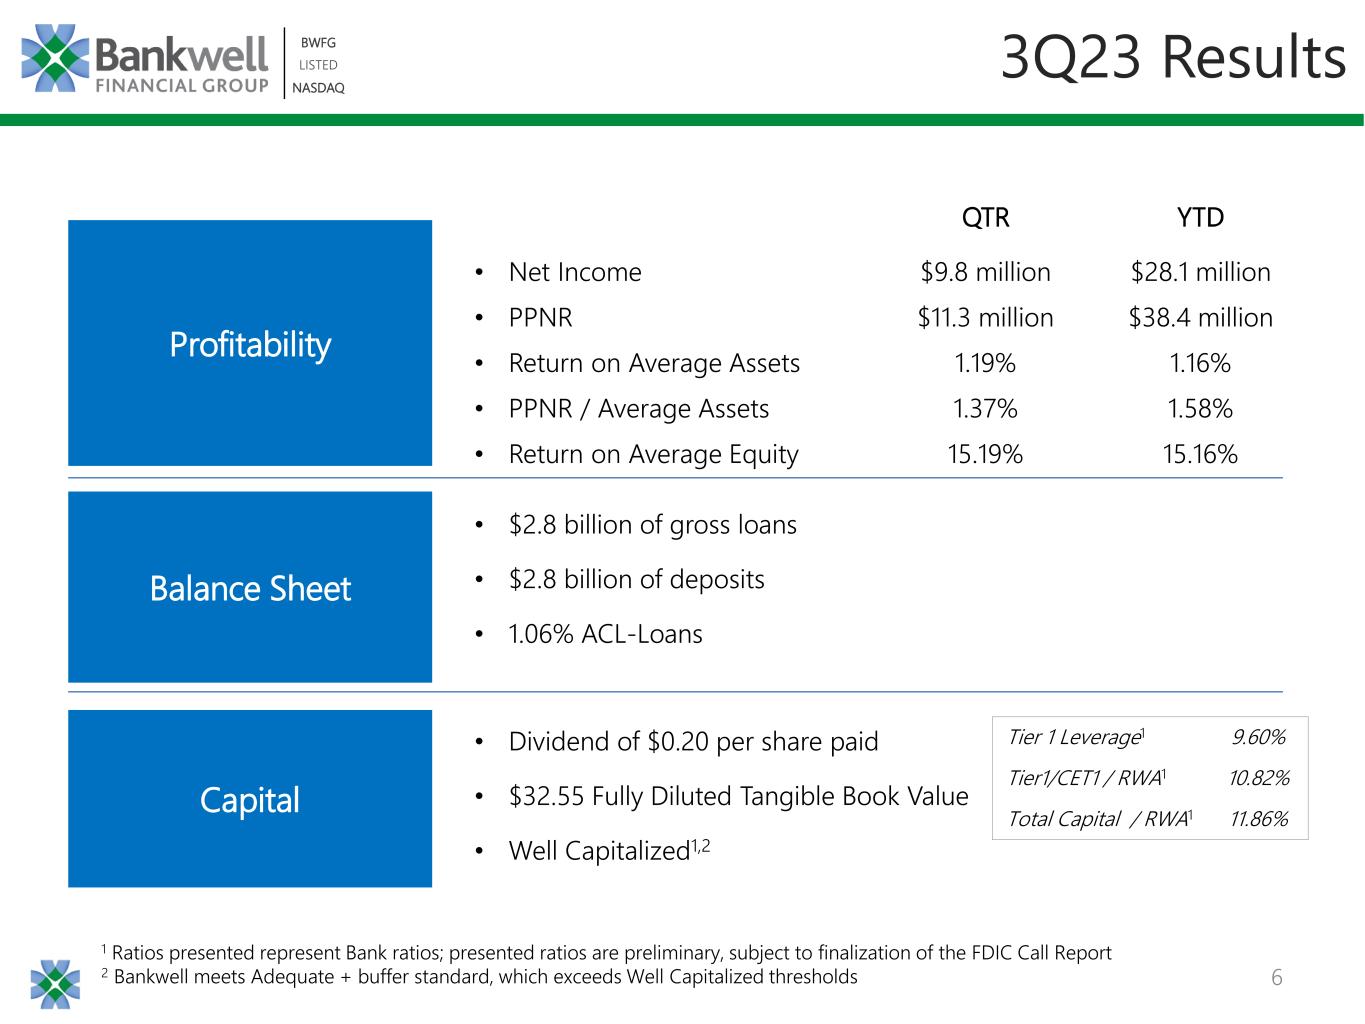
On October 25, 2023, Bankwell Financial Group, Inc., parent company of Bankwell Bank, announced its Board of Directors has voted to pay a quarterly dividend in the amount of $0.20 per share on November 20, 2023 to all shareholders of record as of November 10, 2023. |
|||||
| Item 9.01 | Financial Statements and Exhibits | ||||
| (a) | Not applicable. | ||||
| (b) | Not applicable. | ||||
| (c) | Not applicable. | ||||
| (d) | Exhibits. | ||||
| Exhibit Number | Description | ||||
| 99.1 | |||||
| 99.2 | |||||
| 104 | Cover Page Interactive Data File (embedded within the Inline XBRL document) | ||||
| SIGNATURES | |||||
| Pursuant to the requirements of the Securities Exchange Act of 1934, the Registrant has duly caused this report to be signed on its behalf by the undersigned hereunto duly authorized. | |||||
| BANKWELL FINANCIAL GROUP, INC. | |||||
| Registrant | |||||
October 25, 2023 |
By: /s/ Courtney E. Sacchetti |
||||
| Courtney E. Sacchetti | |||||
| Executive Vice President | |||||
| and Chief Financial Officer | |||||
| September 30, 2023 |
June 30, 2023 |
March 31, 2023 |
December 31, 2022 |
September 30, 2022 |
|||||||||||||||||||||||||
| ASSETS | |||||||||||||||||||||||||||||
| Cash and due from banks | $ | 256,973 | $ | 207,345 | $ | 249,812 | $ | 344,925 | $ | 212,175 | |||||||||||||||||||
| Federal funds sold | 1,122 | 54,706 | 27,370 | 10,754 | 10,947 | ||||||||||||||||||||||||
| Cash and cash equivalents | 258,095 | 262,051 | 277,182 | 355,679 | 223,122 | ||||||||||||||||||||||||
| Investment securities | |||||||||||||||||||||||||||||
| Marketable equity securities, at fair value | 1,975 | 2,017 | 2,028 | 1,988 | 1,973 | ||||||||||||||||||||||||
| Available for sale investment securities, at fair value | 97,907 | 99,938 | 103,171 | 103,663 | 95,095 | ||||||||||||||||||||||||
| Held to maturity investment securities, at amortized cost | 15,885 | 15,884 | 15,931 | 15,983 | 16,027 | ||||||||||||||||||||||||
| Total investment securities | 115,767 | 117,839 | 121,130 | 121,634 | 113,095 | ||||||||||||||||||||||||
| Loans receivable (net of ACL-Loans of $29,284, $30,694, $27,998, $22,431, and $18,167 at September 30, 2023, June 30, 2023, March 31, 2023, December 31, 2022, and September 30, 2022, respectively) | 2,735,242 | 2,736,607 | 2,724,514 | 2,646,384 | 2,263,432 | ||||||||||||||||||||||||
| Accrued interest receivable | 15,648 | 14,208 | 14,261 | 13,070 | 9,552 | ||||||||||||||||||||||||
| Federal Home Loan Bank stock, at cost | 5,696 | 5,696 | 5,234 | 5,216 | 5,039 | ||||||||||||||||||||||||
| Premises and equipment, net | 26,899 | 27,658 | 27,619 | 27,199 | 27,510 | ||||||||||||||||||||||||
| Bank-owned life insurance | 51,119 | 50,816 | 50,524 | 50,243 | 49,970 | ||||||||||||||||||||||||
| Goodwill | 2,589 | 2,589 | 2,589 | 2,589 | 2,589 | ||||||||||||||||||||||||
| Deferred income taxes, net | 9,395 | 10,014 | 8,692 | 7,422 | 5,952 | ||||||||||||||||||||||||
| Other assets | 29,326 | 25,229 | 20,573 | 23,013 | 22,734 | ||||||||||||||||||||||||
| Total assets | $ | 3,249,776 | $ | 3,252,707 | $ | 3,252,318 | $ | 3,252,449 | $ | 2,722,995 | |||||||||||||||||||
| LIABILITIES AND SHAREHOLDERS’ EQUITY | |||||||||||||||||||||||||||||
| Liabilities | |||||||||||||||||||||||||||||
| Deposits | |||||||||||||||||||||||||||||
| Noninterest bearing deposits | $ | 345,433 | $ | 367,635 | $ | 377,667 | $ | 404,559 | $ | 380,365 | |||||||||||||||||||
| Interest bearing deposits | 2,423,193 | 2,421,228 | 2,420,641 | 2,396,259 | 1,906,337 | ||||||||||||||||||||||||
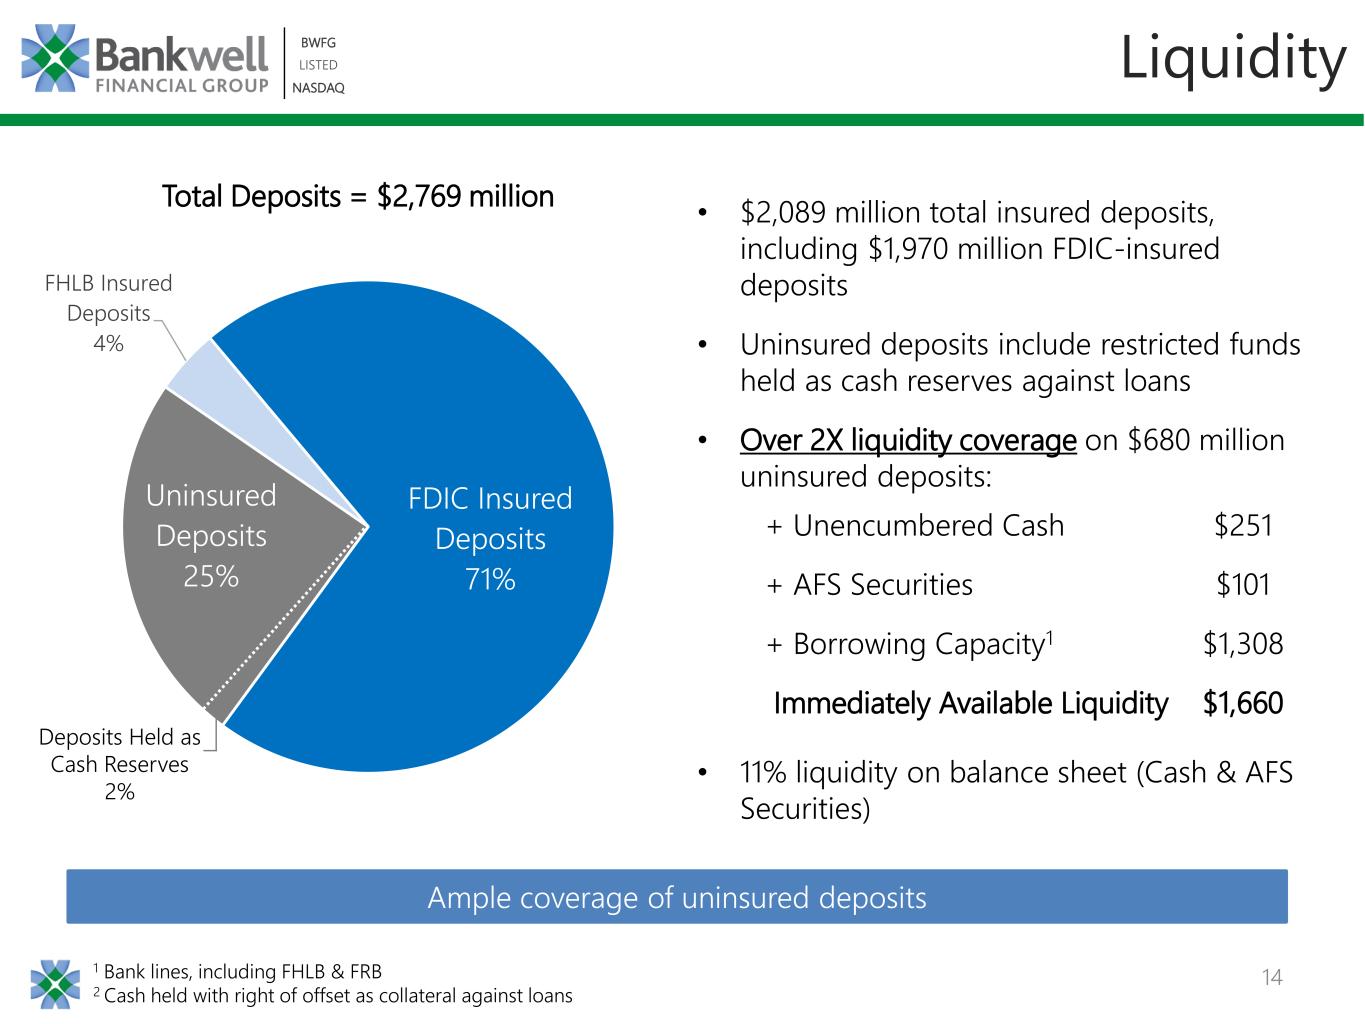
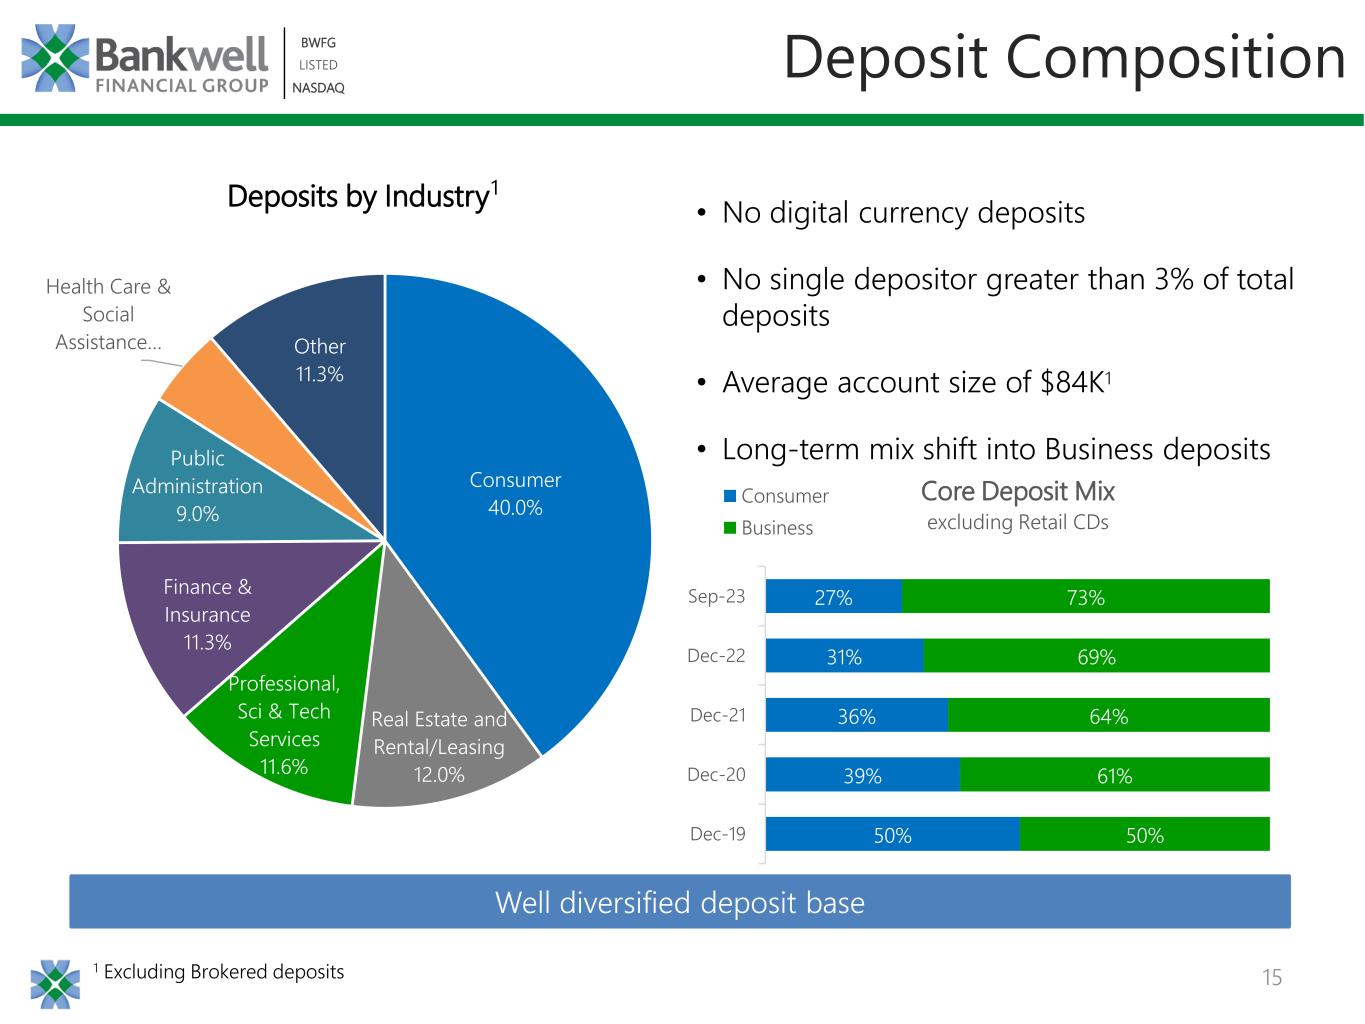
| Total deposits | 2,768,626 | 2,788,863 | 2,798,308 | 2,800,818 | 2,286,702 | ||||||||||||||||||||||||
| Advances from the Federal Home Loan Bank | 90,000 | 90,000 | 90,000 | 90,000 | 90,000 | ||||||||||||||||||||||||
| Subordinated debentures | 69,143 | 69,082 | 69,020 | 68,959 | 68,897 | ||||||||||||||||||||||||
| Accrued expenses and other liabilities | 64,145 | 55,949 | 52,683 | 54,203 | 45,896 | ||||||||||||||||||||||||
| Total liabilities | 2,991,914 | 3,003,894 | 3,010,011 | 3,013,980 | 2,491,495 | ||||||||||||||||||||||||
| Shareholders’ equity | |||||||||||||||||||||||||||||
| Common stock, no par value | 117,181 | 116,541 | 115,875 | 115,018 | 114,548 | ||||||||||||||||||||||||
| Retained earnings | 142,205 | 133,988 | 127,566 | 123,640 | 117,152 | ||||||||||||||||||||||||
| Accumulated other comprehensive (loss) | (1,524) | (1,716) | (1,134) | (189) | (200) | ||||||||||||||||||||||||
| Total shareholders’ equity | 257,862 | 248,813 | 242,307 | 238,469 | 231,500 | ||||||||||||||||||||||||
| Total liabilities and shareholders’ equity | $ | 3,249,776 | $ | 3,252,707 | $ | 3,252,318 | $ | 3,252,449 | $ | 2,722,995 | |||||||||||||||||||
| For the Quarter Ended | For the Nine Months Ended | ||||||||||||||||||||||||||||||||||||||||
| September 30, 2023 |
June 30, 2023 |
March 31, 2023 |
December 31, 2022 |
September 30, 2022 |
September 30, 2023 |
September 30, 2022 |
|||||||||||||||||||||||||||||||||||
| Interest and dividend income | |||||||||||||||||||||||||||||||||||||||||
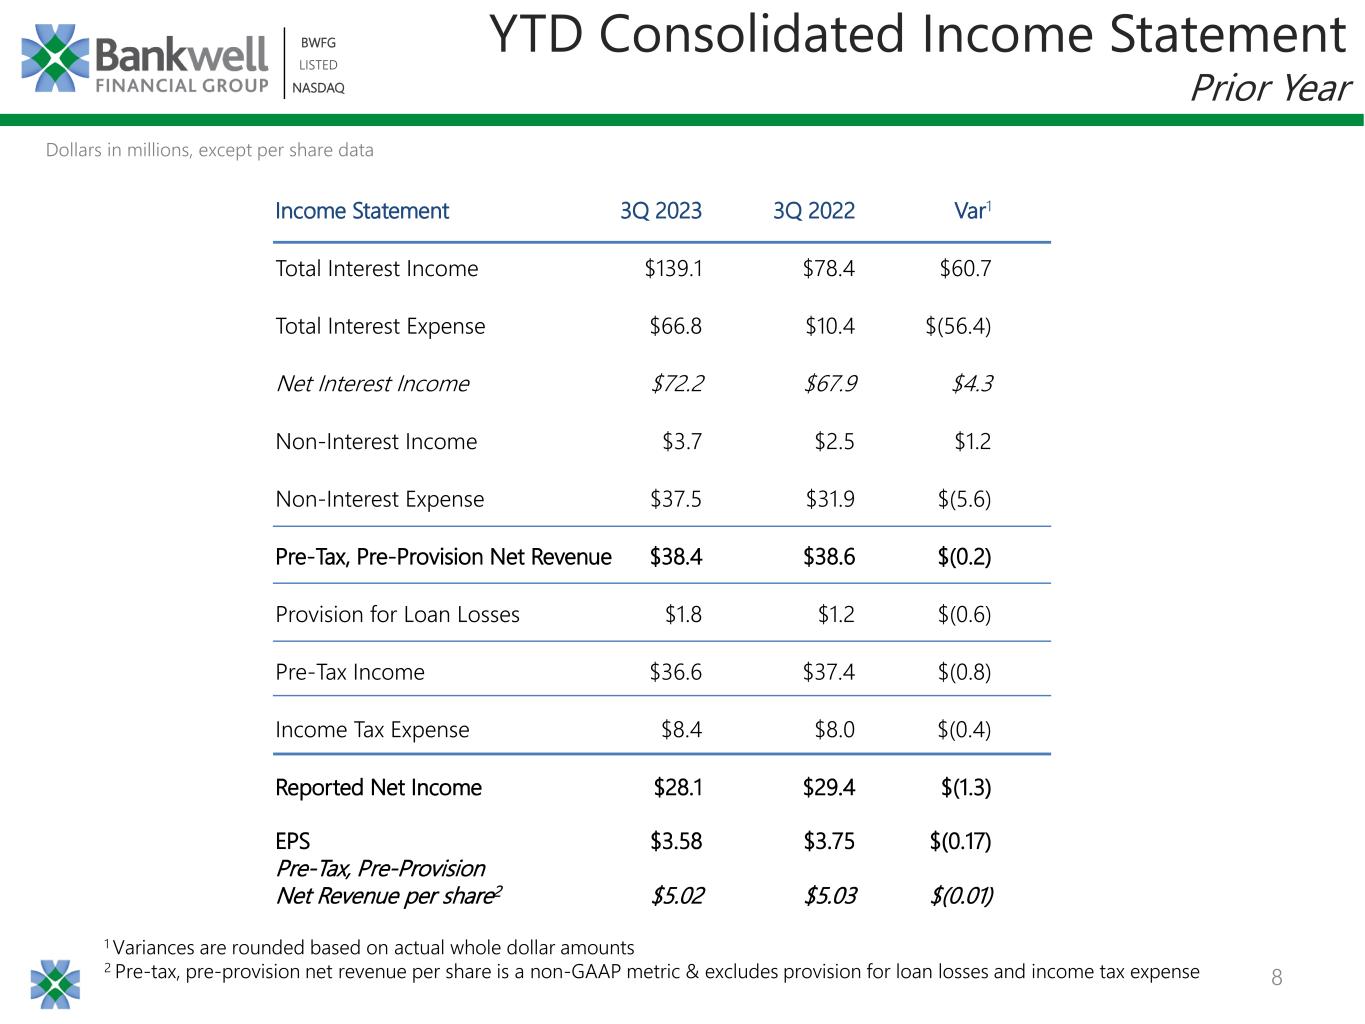
| Interest and fees on loans | $ | 43,854 | $ | 42,482 | $ | 39,723 | $ | 36,545 | $ | 28,128 | $ | 126,059 | $ | 74,697 | |||||||||||||||||||||||||||
| Interest and dividends on securities | 1,016 | 1,002 | 1,000 | 898 | 811 | 3,018 | 2,305 | ||||||||||||||||||||||||||||||||||
| Interest on cash and cash equivalents | 3,393 | 3,022 | 3,568 | 2,150 | 747 | 9,983 | 1,350 | ||||||||||||||||||||||||||||||||||
| Total interest and dividend income | 48,263 | 46,506 | 44,291 | 39,593 | 29,686 | 139,060 | 78,352 | ||||||||||||||||||||||||||||||||||
| Interest expense | |||||||||||||||||||||||||||||||||||||||||
| Interest expense on deposits | 23,789 | 20,777 | 17,033 | 11,083 | 4,092 | 61,599 | 8,281 | ||||||||||||||||||||||||||||||||||
| Interest expense on borrowings | 1,783 | 1,738 | 1,717 | 1,701 | 993 | 5,238 | 2,137 | ||||||||||||||||||||||||||||||||||
| Total interest expense | 25,572 | 22,515 | 18,750 | 12,784 | 5,085 | 66,837 | 10,418 | ||||||||||||||||||||||||||||||||||
| Net interest income | 22,691 | 23,991 | 25,541 | 26,809 | 24,601 | 72,223 | 67,934 | ||||||||||||||||||||||||||||||||||
| (Credit) provision for credit losses | (1,579) | 2,579 | 826 | 4,272 | 2,381 | 1,826 | 1,165 | ||||||||||||||||||||||||||||||||||
| Net interest income after provision for credit losses | 24,270 | 21,412 | 24,715 | 22,537 | 22,220 | 70,397 | 66,769 | ||||||||||||||||||||||||||||||||||
| Noninterest income | |||||||||||||||||||||||||||||||||||||||||
| Bank owned life insurance | 303 | 292 | 281 | 273 | 271 | 876 | 796 | ||||||||||||||||||||||||||||||||||
| Service charges and fees | 294 | 361 | 286 | 343 | 240 | 941 | 729 | ||||||||||||||||||||||||||||||||||
| Gains and fees from sales of loans | 237 | 725 | 931 | 12 | (15) | 1,893 | 1,224 | ||||||||||||||||||||||||||||||||||
| Other | (48) | 23 | 28 | (100) | (94) | 3 | (237) | ||||||||||||||||||||||||||||||||||
| Total noninterest income | 786 | 1,401 | 1,526 | 528 | 402 | 3,713 | 2,512 | ||||||||||||||||||||||||||||||||||
| Noninterest expense | |||||||||||||||||||||||||||||||||||||||||
| Salaries and employee benefits | 6,036 | 6,390 | 6,081 | 5,988 | 5,876 | 18,507 | 16,249 | ||||||||||||||||||||||||||||||||||
| Occupancy and equipment | 2,146 | 2,204 | 2,084 | 1,919 | 2,035 | 6,434 | 6,378 | ||||||||||||||||||||||||||||||||||
| Professional services | 491 | 692 | 1,322 | 912 | 994 | 2,505 | 2,975 | ||||||||||||||||||||||||||||||||||
| Data processing | 741 | 729 | 671 | 663 | 626 | 2,141 | 1,969 | ||||||||||||||||||||||||||||||||||
| Director fees | 362 | 453 | 392 | 378 | 325 | 1,207 | 1,016 | ||||||||||||||||||||||||||||||||||
| FDIC insurance | 1,026 | 1,050 | 1,062 | 898 | 255 | 3,138 | 740 | ||||||||||||||||||||||||||||||||||
| Marketing | 184 | 177 | 151 | 112 | 102 | 512 | 254 | ||||||||||||||||||||||||||||||||||
| Other | 1,219 | 946 | 928 | 1,601 | 818 | 3,093 | 2,311 | ||||||||||||||||||||||||||||||||||
| Total noninterest expense | 12,205 | 12,641 | 12,691 | 12,471 | 11,031 | 37,537 | 31,892 | ||||||||||||||||||||||||||||||||||
| Income before income tax expense | 12,851 | 10,172 | 13,550 | 10,594 | 11,591 | 36,573 | 37,389 | ||||||||||||||||||||||||||||||||||
| Income tax expense | 3,074 | 2,189 | 3,171 | 2,573 | 2,417 | 8,434 | 7,981 | ||||||||||||||||||||||||||||||||||
| Net income | $ | 9,777 | $ | 7,983 | $ | 10,379 | $ | 8,021 | $ | 9,174 | $ | 28,139 | $ | 29,408 | |||||||||||||||||||||||||||
| Earnings Per Common Share: | |||||||||||||||||||||||||||||||||||||||||
| Basic | $ | 1.25 | $ | 1.02 | $ | 1.34 | $ | 1.04 | $ | 1.19 | $ | 3.61 | $ | 3.80 | |||||||||||||||||||||||||||
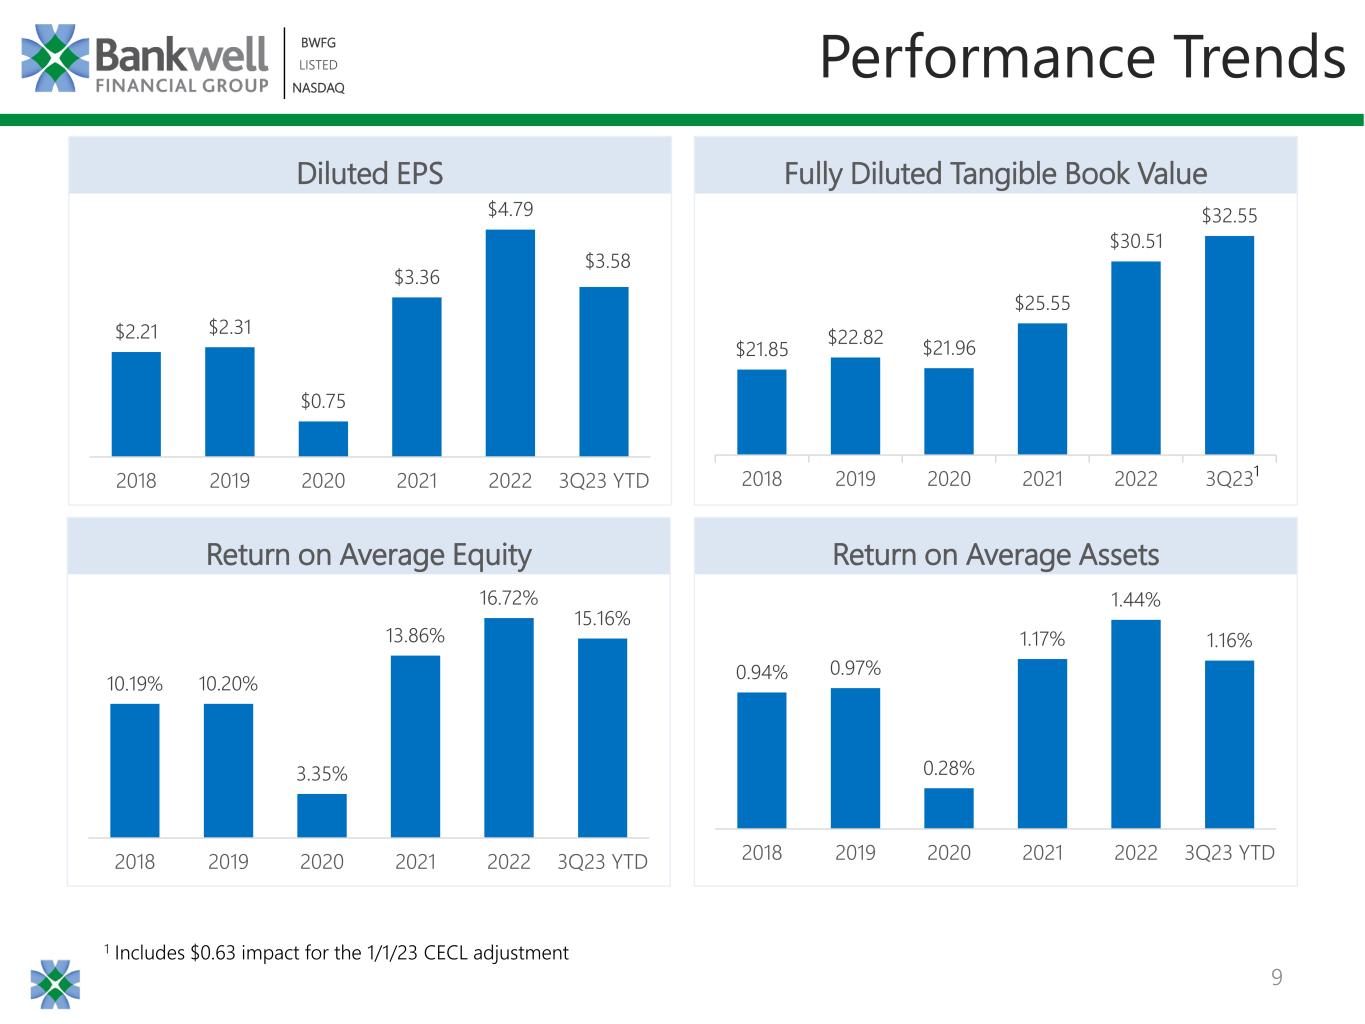
| Diluted | $ | 1.25 | $ | 1.02 | $ | 1.33 | $ | 1.04 | $ | 1.18 | $ | 3.58 | $ | 3.75 | |||||||||||||||||||||||||||
| Weighted Average Common Shares Outstanding: | |||||||||||||||||||||||||||||||||||||||||
| Basic | 7,598,230 | 7,593,417 | 7,554,689 | 7,507,540 | 7,553,718 | 7,582,272 | 7,582,175 | ||||||||||||||||||||||||||||||||||
| Diluted | 7,633,934 | 7,601,562 | 7,616,671 | 7,563,116 | 7,612,421 | 7,646,837 | 7,664,123 | ||||||||||||||||||||||||||||||||||
| Dividends per common share | $ | 0.20 | $ | 0.20 | $ | 0.20 | $ | 0.20 | $ | 0.20 | $ | 0.60 | $ | 0.60 | |||||||||||||||||||||||||||
| For the Quarter Ended | For the Nine Months Ended | ||||||||||||||||||||||||||||||||||||||||
| September 30, 2023 |
June 30, 2023 |
March 31, 2023 |
December 31, 2022 |
September 30, 2022 |
September 30, 2023 |
September 30, 2022 |
|||||||||||||||||||||||||||||||||||
| Performance ratios: | |||||||||||||||||||||||||||||||||||||||||
| Return on average assets | 1.19 | % | 0.99 | % | 1.30 | % | 1.07 | % | 1.47 | % | 1.16 | % | 1.59 | % | |||||||||||||||||||||||||||
| Return on average shareholders' equity | 15.19 | % | 12.91 | % | 17.48 | % | 13.38 | % | 15.73 | % | 15.16 | % | 17.94 | % | |||||||||||||||||||||||||||
| Return on average tangible common equity | 15.35 | % | 13.05 | % | 17.67 | % | 13.52 | % | 15.91 | % | 15.32 | % | 18.16 | % | |||||||||||||||||||||||||||
| Net interest margin | 2.85 | % | 3.07 | % | 3.24 | % | 3.70 | % | 4.12 | % | 3.04 | % | 3.81 | % | |||||||||||||||||||||||||||
Efficiency ratio(1) |
52.0 | % | 49.8 | % | 46.9 | % | 45.6 | % | 44.1 | % | 49.4 | % | 45.3 | % | |||||||||||||||||||||||||||
| Net loan charge-offs as a % of average loans | — | % | — | % | 0.02 | % | — | % | — | % | 0.01 | % | — | % | |||||||||||||||||||||||||||
Dividend payout ratio(2) |
16.00 | % | 19.61 | % | 15.04 | % | 19.23 | % | 16.95 | % | 16.76 | % | 16.00 | % | |||||||||||||||||||||||||||
| As of | |||||||||||||||||||||||||||||
| September 30, 2023 |
June 30, 2023 |
March 31, 2023 |
December 31, 2022 |
September 30, 2022 |
|||||||||||||||||||||||||
| Capital ratios: | |||||||||||||||||||||||||||||
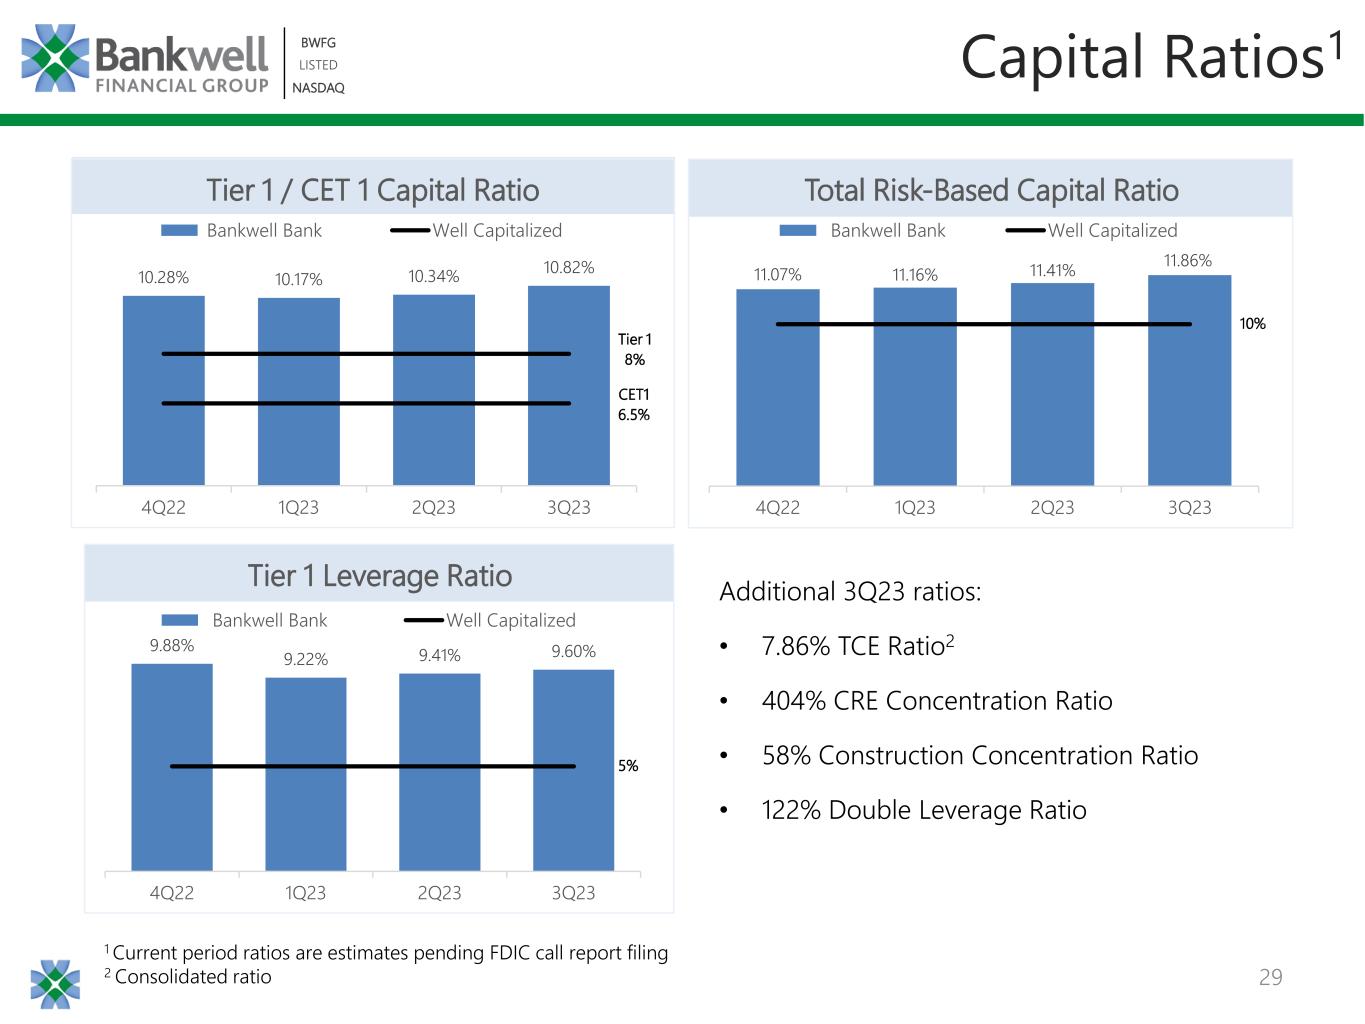
Total Common Equity Tier 1 Capital to Risk-Weighted Assets(1) |
10.82 | % | 10.34 | % | 10.17 | % | 10.28 | % | 11.42 | % | |||||||||||||||||||
Total Capital to Risk-Weighted Assets(1) |
11.86 | % | 11.41 | % | 11.16 | % | 11.07 | % | 12.16 | % | |||||||||||||||||||
Tier I Capital to Risk-Weighted Assets(1) |
10.82 | % | 10.34 | % | 10.17 | % | 10.28 | % | 11.42 | % | |||||||||||||||||||
Tier I Capital to Average Assets(1) |
9.60 | % | 9.41 | % | 9.22 | % | 9.88 | % | 11.31 | % | |||||||||||||||||||
| Tangible common equity to tangible assets | 7.86 | % | 7.58 | % | 7.38 | % | 7.26 | % | 8.41 | % | |||||||||||||||||||
| Fully diluted tangible book value per common share | $ | 32.55 | $ | 31.45 | $ | 30.56 | $ | 30.51 | $ | 29.68 | |||||||||||||||||||
| For the Quarter Ended | |||||||||||||||||||||||||||||
| September 30, 2023 |
June 30, 2023 |
March 31, 2023 |
December 31, 2022 |
September 30, 2022 |
|||||||||||||||||||||||||
| ACL-Loans: | |||||||||||||||||||||||||||||
| Balance at beginning of period | $ | 30,694 | $ | 27,998 | $ | 22,431 | $ | 18,167 | $ | 15,773 | |||||||||||||||||||
| Day 1 CECL Adjustment on January 1, 2023 | — | — | 5,079 | — | — | ||||||||||||||||||||||||
| Beginning balance January 1, 2023 | 30,694 | 27,998 | 27,510 | 18,167 | — | ||||||||||||||||||||||||
| Charge-offs: | |||||||||||||||||||||||||||||
| Commercial business | — | — | (440) | — | — | ||||||||||||||||||||||||
| Consumer | (31) | (25) | (12) | (11) | (8) | ||||||||||||||||||||||||
| Total charge-offs | (31) | (25) | (452) | (11) | (8) | ||||||||||||||||||||||||
| Recoveries: | |||||||||||||||||||||||||||||
| Commercial real estate | — | — | — | — | — | ||||||||||||||||||||||||
| Commercial business | 35 | 32 | — | — | 21 | ||||||||||||||||||||||||
| Consumer | 19 | 10 | 6 | 3 | — | ||||||||||||||||||||||||
| Total recoveries | 54 | 42 | 6 | 3 | 21 | ||||||||||||||||||||||||
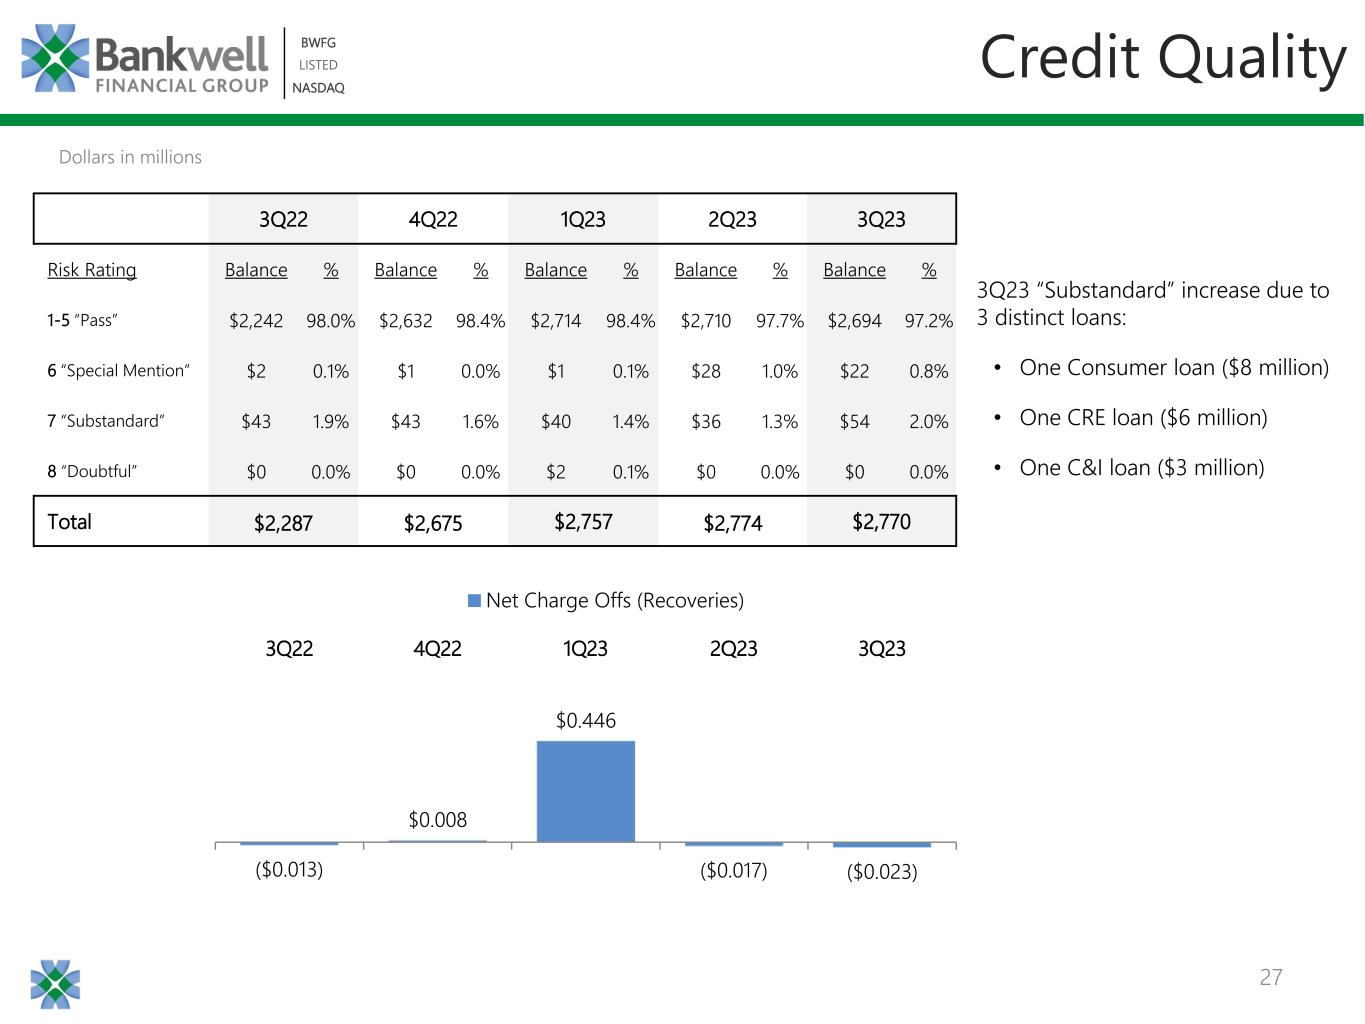
| Net loan recoveries (charge-offs) | 23 | 17 | (446) | (8) | 13 | ||||||||||||||||||||||||
| (Credit) provision for credit losses - loans | (1,433) | 2,679 | 934 | 4,272 | 2,381 | ||||||||||||||||||||||||
| Balance at end of period | $ | 29,284 | $ | 30,694 | $ | 27,998 | $ | 22,431 | $ | 18,167 | |||||||||||||||||||
| As of | |||||||||||||||||||||||||||||
| September 30, 2023 |
June 30, 2023 |
March 31, 2023 |
December 31, 2022 |
September 30, 2022 |
|||||||||||||||||||||||||
| Asset quality: | |||||||||||||||||||||||||||||
| Nonaccrual loans | |||||||||||||||||||||||||||||
| Residential real estate | $ | 1,408 | $ | 1,429 | $ | 1,443 | $ | 2,152 | $ | 2,137 | |||||||||||||||||||
| Commercial real estate | 1,898 | 1,905 | 1,912 | 2,781 | 2,894 | ||||||||||||||||||||||||
| Commercial business | 7,352 | 2,815 | 1,528 | 2,126 | 2,380 | ||||||||||||||||||||||||
| Construction | 9,382 | 9,382 | 9,382 | 9,382 | 9,382 | ||||||||||||||||||||||||
| Consumer | 7,917 | — | — | — | — | ||||||||||||||||||||||||
| Total nonaccrual loans | 27,957 | 15,531 | 14,265 | 16,441 | 16,793 | ||||||||||||||||||||||||
| Other real estate owned | — | — | — | — | — | ||||||||||||||||||||||||
| Total nonperforming assets | $ | 27,957 | $ | 15,531 | $ | 14,265 | $ | 16,441 | $ | 16,793 | |||||||||||||||||||
| Nonperforming loans as a % of total loans | 1.01 | % | 0.56 | % | 0.52 | % | 0.61 | % | 0.73 | % | |||||||||||||||||||
| Nonperforming assets as a % of total assets | 0.86 | % | 0.48 | % | 0.44 | % | 0.51 | % | 0.62 | % | |||||||||||||||||||
| ACL-loans as a % of total loans | 1.06 | % | 1.11 | % | 1.01 | % | 0.84 | % | 0.79 | % | |||||||||||||||||||
| ACL-loans as a % of nonperforming loans | 104.75 | % | 197.63 | % | 196.27 | % | 136.43 | % | 108.18 | % | |||||||||||||||||||
| Total past due loans to total loans | 1.44 | % | 1.30 | % | 0.94 | % | 0.60 | % | 0.78 | % | |||||||||||||||||||
| Period End Loan Composition | September 30, 2023 |
June 30, 2023 |
December 31, 2022 |
Current QTD % Change |
YTD % Change |
||||||||||||||||||||||||
| Residential Real Estate | $ | 52,908 | $ | 54,631 | $ | 60,588 | (3.2) | % | (12.7) | % | |||||||||||||||||||
Commercial Real Estate(1) |
1,955,992 | 1,930,972 | 1,921,252 | 1.3 | 1.8 | ||||||||||||||||||||||||
| Construction | 199,972 | 219,615 | 155,198 | (8.9) | 28.8 | ||||||||||||||||||||||||
| Total Real Estate Loans | 2,208,872 | 2,205,218 | 2,137,038 | 0.2 | 3.4 | ||||||||||||||||||||||||
| Commercial Business | 508,626 | 530,913 | 520,447 | (4.2) | (2.3) | ||||||||||||||||||||||||
| Consumer | 52,612 | 37,475 | 17,963 | 40.4 | 192.9 | ||||||||||||||||||||||||
| Total Loans | $ | 2,770,110 | $ | 2,773,606 | $ | 2,675,448 | (0.1) | % | 3.5 | % | |||||||||||||||||||
| (1) Includes owner occupied commercial real estate. | |||||||||||||||||||||||||||||
| Period End Deposit Composition | September 30, 2023 |
June 30, 2023 |
December 31, 2022 |
Current QTD % Change |
YTD % Change |
||||||||||||||||||||||||
| Noninterest bearing demand | $ | 345,433 | $ | 367,635 | $ | 404,559 | (6.0) | % | (14.6) | % | |||||||||||||||||||
| NOW | 101,719 | 106,189 | 104,057 | (4.2) | (2.2) | ||||||||||||||||||||||||
| Money Market | 879,978 | 879,017 | 913,868 | 0.1 | (3.7) | ||||||||||||||||||||||||
| Savings | 102,207 | 108,625 | 151,944 | (5.9) | (32.7) | ||||||||||||||||||||||||
| Time | 1,339,289 | 1,327,397 | 1,226,390 | 0.9 | 9.2 | ||||||||||||||||||||||||
| Total Deposits | $ | 2,768,626 | $ | 2,788,863 | $ | 2,800,818 | (0.7) | % | (1.1) | % | |||||||||||||||||||
| For the Quarter Ended | |||||||||||||||||||||||||||||
| Noninterest expense | September 30, 2023 |
June 30, 2023 |
September 30, 2022 |
Sep 23 vs. June 23 % Change |
Sep 23 vs. Sep 22 % Change |
||||||||||||||||||||||||
| Salaries and employee benefits | $ | 6,036 | $ | 6,390 | $ | 5,876 | (5.5) | % | 2.7 | % | |||||||||||||||||||
| Occupancy and equipment | 2,146 | 2,204 | 2,035 | (2.6) | 5.5 | ||||||||||||||||||||||||
| Professional services | 491 | 692 | 994 | (29.0) | (50.6) | ||||||||||||||||||||||||
| Data processing | 741 | 729 | 626 | 1.6 | 18.4 | ||||||||||||||||||||||||
| Director fees | 362 | 453 | 325 | (20.1) | 11.4 | ||||||||||||||||||||||||
| FDIC insurance | 1,026 | 1,050 | 255 | (2.3) | 302.4 | ||||||||||||||||||||||||
| Marketing | 184 | 177 | 102 | 4.0 | 80.4 | ||||||||||||||||||||||||
| Other | 1,219 | 946 | 818 | 28.9 | 49.0 | ||||||||||||||||||||||||
| Total noninterest expense | $ | 12,205 | $ | 12,641 | $ | 11,031 | (3.4) | % | 10.6 | % | |||||||||||||||||||
| For the Nine Months Ended | |||||||||||||||||
| Noninterest expense | September 30, 2023 | September 30, 2022 | % Change | ||||||||||||||
| Salaries and employee benefits | $ | 18,507 | $ | 16,249 | 13.9 | % | |||||||||||
| Occupancy and equipment | 6,434 | 6,378 | 0.9 | % | |||||||||||||
| Professional services | 2,505 | 2,975 | (15.8) | % | |||||||||||||
| Data processing | 2,141 | 1,969 | 8.7 | % | |||||||||||||
| Director fees | 1,207 | 1,016 | 18.8 | % | |||||||||||||
| FDIC insurance | 3,138 | 740 | 324.1 | % | |||||||||||||
| Marketing | 512 | 254 | 101.6 | % | |||||||||||||
| Other | 3,093 | 2,311 | 33.8 | % | |||||||||||||
| Total noninterest expense | $ | 37,537 | $ | 31,892 | 17.7 | % | |||||||||||
| As of | |||||||||||||||||||||||||||||
| Computation of Tangible Common Equity to Tangible Assets | September 30, 2023 |
June 30, 2023 |
March 31, 2023 |
December 31, 2022 |
September 30, 2022 |
||||||||||||||||||||||||
| Total Equity | $ | 257,862 | $ | 248,813 | $ | 242,307 | $ | 238,469 | $ | 231,500 | |||||||||||||||||||
| Less: | |||||||||||||||||||||||||||||
| Goodwill | 2,589 | 2,589 | 2,589 | 2,589 | 2,589 | ||||||||||||||||||||||||
| Other intangibles | — | — | — | — | — | ||||||||||||||||||||||||
| Tangible Common Equity | $ | 255,273 | $ | 246,224 | $ | 239,718 | $ | 235,880 | $ | 228,911 | |||||||||||||||||||
| Total Assets | $ | 3,249,776 | $ | 3,252,707 | $ | 3,252,318 | $ | 3,252,449 | $ | 2,722,995 | |||||||||||||||||||
| Less: | |||||||||||||||||||||||||||||
| Goodwill | 2,589 | 2,589 | 2,589 | 2,589 | 2,589 | ||||||||||||||||||||||||
| Other intangibles | — | — | — | — | — | ||||||||||||||||||||||||
| Tangible Assets | $ | 3,247,187 | $ | 3,250,118 | $ | 3,249,729 | $ | 3,249,860 | $ | 2,720,406 | |||||||||||||||||||
| Tangible Common Equity to Tangible Assets | 7.86 | % | 7.58 | % | 7.38 | % | 7.26 | % | 8.41 | % | |||||||||||||||||||
| As of | |||||||||||||||||||||||||||||
| Computation of Fully Diluted Tangible Book Value per Common Share | September 30, 2023 |
June 30, 2023 |
March 31, 2023 |
December 31, 2022 |
September 30, 2022 |
||||||||||||||||||||||||
| Total shareholders' equity | $ | 257,862 | $ | 248,813 | $ | 242,307 | $ | 238,469 | $ | 231,500 | |||||||||||||||||||
| Less: | |||||||||||||||||||||||||||||
| Preferred stock | — | — | — | — | — | ||||||||||||||||||||||||
| Common shareholders' equity | $ | 257,862 | $ | 248,813 | $ | 242,307 | $ | 238,469 | $ | 231,500 | |||||||||||||||||||
| Less: | |||||||||||||||||||||||||||||
| Goodwill | 2,589 | 2,589 | 2,589 | 2,589 | 2,589 | ||||||||||||||||||||||||
| Other intangibles | — | — | — | — | — | ||||||||||||||||||||||||
| Tangible common shareholders' equity | $ | 255,273 | $ | 246,224 | $ | 239,718 | $ | 235,880 | $ | 228,911 | |||||||||||||||||||
| Common shares issued and outstanding | 7,841,616 | 7,829,950 | 7,843,438 | 7,730,699 | 7,711,843 | ||||||||||||||||||||||||
| Fully Diluted Tangible Book Value per Common Share | $ | 32.55 | $ | 31.45 | $ | 30.56 | $ | 30.51 | $ | 29.68 | |||||||||||||||||||
| Three Months Ended September 30, |
Nine Months Ended September 30, |
||||||||||||||||||||||
| 2023 | 2022 | 2023 | 2022 | ||||||||||||||||||||
| (In thousands, except per share data) | |||||||||||||||||||||||
| Net income | $ | 9,777 | $ | 9,174 | $ | 28,140 | $ | 29,408 | |||||||||||||||
Dividends to participating securities(1) |
(41) | (33) | (125) | (101) | |||||||||||||||||||
Undistributed earnings allocated to participating securities(1) |
(209) | (159) | (613) | (529) | |||||||||||||||||||
| Net income for earnings per share calculation | $ | 9,527 | $ | 8,982 | $ | 27,402 | $ | 28,778 | |||||||||||||||
| Weighted average shares outstanding, basic | 7,598 | 7,554 | 7,582 | 7,582 | |||||||||||||||||||
Effect of dilutive equity-based awards(2) |
36 | 58 | 65 | 82 | |||||||||||||||||||
| Weighted average shares outstanding, diluted | 7,634 | 7,612 | 7,647 | 7,664 | |||||||||||||||||||
| Net earnings per common share: | |||||||||||||||||||||||
| Basic earnings per common share | $ | 1.25 | $ | 1.19 | $ | 3.61 | $ | 3.80 | |||||||||||||||
| Diluted earnings per common share | $ | 1.25 | $ | 1.18 | $ | 3.58 | $ | 3.75 | |||||||||||||||
| For the Quarter Ended | |||||||||||||||||||||||||||||
| Noninterest income | September 30, 2023 |
June 30, 2023 |
September 30, 2022 |
Sep 23 vs. June 23 % Change |
Sep 23 vs. Sep 22 % Change |
||||||||||||||||||||||||
| Bank owned life insurance | $ | 303 | $ | 292 | $ | 271 | 3.8 | % | 11.8 | % | |||||||||||||||||||
| Service charges and fees | 294 | 361 | 240 | (18.6) | 22.5 | ||||||||||||||||||||||||
| Gains and fees from sales of loans | 237 | 725 | (15) | (67.3) | Favorable | ||||||||||||||||||||||||
| Other | (48) | 23 | (94) | Unfavorable | Favorable | ||||||||||||||||||||||||
| Total noninterest income | $ | 786 | $ | 1,401 | $ | 402 | (43.9) | % | 95.5 | % | |||||||||||||||||||
| For the Nine Months Ended | |||||||||||||||||
| Noninterest income | September 30, 2023 | September 30, 2022 | % Change | ||||||||||||||
| Bank owned life insurance | $ | 876 | $ | 796 | 10.1 | % | |||||||||||
| Service charges and fees | 941 | 729 | 29.1 | ||||||||||||||
| Gains and fees from sales of loans | 1,893 | 1,224 | 54.7 | ||||||||||||||
| Other | 3 | (237) | Favorable | ||||||||||||||
| Total noninterest income | $ | 3,713 | $ | 2,512 | 47.8 | % | |||||||||||
| For the Quarter Ended | |||||||||||||||||||||||||||||||||||
| September 30, 2023 | September 30, 2022 | ||||||||||||||||||||||||||||||||||
| Average Balance |
Interest |
Yield/
Rate (4)
|
Average Balance |
Interest |
Yield/
Rate (4)
|
||||||||||||||||||||||||||||||
| Assets: | |||||||||||||||||||||||||||||||||||
| Cash and Fed funds sold | $ | 265,115 | $ | 3,393 | 5.08 | % | $ | 130,440 | $ | 747 | 2.27 | % | |||||||||||||||||||||||
Securities(1) |
127,229 | 953 | 3.00 | 120,092 | 829 | 2.76 | |||||||||||||||||||||||||||||
| Loans: | |||||||||||||||||||||||||||||||||||
| Commercial real estate | 1,943,725 | 28,140 | 5.67 | 1,512,381 | 18,830 | 4.87 | |||||||||||||||||||||||||||||
| Residential real estate | 53,966 | 671 | 4.97 | 62,915 | 586 | 3.72 | |||||||||||||||||||||||||||||
| Construction | 209,154 | 3,908 | 7.31 | 116,256 | 1,512 | 5.09 | |||||||||||||||||||||||||||||
| Commercial business | 539,185 | 10,394 | 7.54 | 431,917 | 7,058 | 6.39 | |||||||||||||||||||||||||||||
| Consumer | 44,020 | 740 | 6.66 | 12,145 | 142 | 4.65 | |||||||||||||||||||||||||||||
| Total loans | 2,790,050 | 43,853 | 6.15 | 2,135,614 | 28,128 | 5.15 | |||||||||||||||||||||||||||||
| Federal Home Loan Bank stock | 5,696 | 116 | 8.13 | 5,021 | 31 | 2.51 | |||||||||||||||||||||||||||||
| Total earning assets | 3,188,090 | $ | 48,315 | 5.93 | % | 2,391,167 | $ | 29,735 | 4.87 | % | |||||||||||||||||||||||||
| Other assets | 78,089 | 89,173 | |||||||||||||||||||||||||||||||||
| Total assets | $ | 3,266,179 | $ | 2,480,340 | |||||||||||||||||||||||||||||||
| Liabilities and shareholders' equity: | |||||||||||||||||||||||||||||||||||
| Interest bearing liabilities: | |||||||||||||||||||||||||||||||||||
| NOW | $ | 102,149 | $ | 47 | 0.18 | % | $ | 119,593 | $ | 52 | 0.17 | % | |||||||||||||||||||||||
| Money market | 922,036 | 9,064 | 3.90 | 828,541 | 2,346 | 1.12 | |||||||||||||||||||||||||||||
| Savings | 105,366 | 817 | 3.08 | 189,279 | 474 | 0.99 | |||||||||||||||||||||||||||||
| Time | 1,322,074 | 13,860 | 4.16 | 557,243 | 1,220 | 0.87 | |||||||||||||||||||||||||||||
| Total interest bearing deposits | 2,451,625 | 23,788 | 3.85 | 1,694,656 | 4,092 | 0.96 | |||||||||||||||||||||||||||||
| Borrowed Money | 159,103 | 1,784 | 4.39 | 135,221 | 993 | 2.87 | |||||||||||||||||||||||||||||
| Total interest bearing liabilities | 2,610,728 | $ | 25,572 | 3.89 | % | 1,829,877 | $ | 5,085 | 1.10 | % | |||||||||||||||||||||||||
| Noninterest bearing deposits | 345,988 | 383,048 | |||||||||||||||||||||||||||||||||
| Other liabilities | 54,136 | 36,037 | |||||||||||||||||||||||||||||||||
| Total liabilities | 3,010,852 | 2,248,962 | |||||||||||||||||||||||||||||||||
| Shareholders' equity | 255,327 | 231,378 | |||||||||||||||||||||||||||||||||
| Total liabilities and shareholders' equity | $ | 3,266,179 | $ | 2,480,340 | |||||||||||||||||||||||||||||||
Net interest income(2) |
$ | 22,743 | $ | 24,650 | |||||||||||||||||||||||||||||||
| Interest rate spread | 2.04 | % | 3.77 | % | |||||||||||||||||||||||||||||||
Net interest margin(3) |
2.85 | % | 4.12 | % | |||||||||||||||||||||||||||||||
| For the Nine Months Ended | |||||||||||||||||||||||||||||||||||
| September 30, 2023 | September 30, 2022 | ||||||||||||||||||||||||||||||||||
| Average Balance |
Interest |
Yield/
Rate (4)
|
Average Balance |
Interest |
Yield/
Rate (4)
|
||||||||||||||||||||||||||||||
| Assets: | |||||||||||||||||||||||||||||||||||
| Cash and Fed funds sold | $ | 281,033 | $ | 9,983 | 4.75 | % | $ | 240,252 | $ | 1,350 | 0.75 | % | |||||||||||||||||||||||
Securities(1) |
128,554 | 2,864 | 2.97 | % | 117,008 | 2,392 | 2.73 | % | |||||||||||||||||||||||||||
| Loans: | |||||||||||||||||||||||||||||||||||
| Commercial real estate | 1,932,549 | 79,958 | 5.46 | % | 1,433,642 | 51,104 | 4.70 | % | |||||||||||||||||||||||||||
| Residential real estate | 56,798 | 1,957 | 4.59 | % | 67,705 | 1,810 | 3.56 | % | |||||||||||||||||||||||||||
| Construction | 194,396 | 10,582 | 7.18 | % | 108,249 | 4,482 | 5.46 | % | |||||||||||||||||||||||||||
| Commercial business | 546,329 | 32,073 | 7.74 | % | 402,876 | 17,011 | 5.57 | % | |||||||||||||||||||||||||||
| Consumer | 30,571 | 1,489 | 6.51 | % | 7,844 | 290 | 4.94 | % | |||||||||||||||||||||||||||
| Total loans | 2,760,643 | 126,059 | 6.02 | % | 2,020,316 | 74,697 | 4.88 | % | |||||||||||||||||||||||||||
| Federal Home Loan Bank stock | 5,527 | 308 | 7.46 | % | 3,715 | 61 | 2.19 | % | |||||||||||||||||||||||||||
| Total earning assets | 3,175,757 | $ | 139,214 | 5.78 | % | 2,381,291 | $ | 78,500 | 4.35 | % | |||||||||||||||||||||||||
| Other assets | 66,342 | 89,747 | |||||||||||||||||||||||||||||||||
| Total assets | $ | 3,242,099 | $ | 2,471,038 | |||||||||||||||||||||||||||||||
| Liabilities and shareholders' equity: | |||||||||||||||||||||||||||||||||||
| Interest bearing liabilities: | |||||||||||||||||||||||||||||||||||
| NOW | $ | 97,741 | $ | 127 | 0.17 | % | $ | 122,792 | $ | 158 | 0.17 | % | |||||||||||||||||||||||
| Money market | 910,840 | 23,532 | 3.45 | % | 909,106 | 4,672 | 0.69 | % | |||||||||||||||||||||||||||
| Savings | 117,984 | 2,404 | 2.72 | % | 194,013 | 678 | 0.47 | % | |||||||||||||||||||||||||||
| Time | 1,291,124 | 35,536 | 3.68 | % | 487,792 | 2,773 | 0.76 | % | |||||||||||||||||||||||||||
| Total interest bearing deposits | 2,417,689 | 61,599 | 3.41 | % | 1,713,703 | 8,281 | 0.65 | % | |||||||||||||||||||||||||||
| Borrowed Money | 161,166 | 5,238 | 4.29 | % | 101,685 | 2,137 | 2.77 | % | |||||||||||||||||||||||||||
| Total interest bearing liabilities | 2,578,855 | $ | 66,837 | 3.47 | % | 1,815,388 | $ | 10,418 | 0.77 | % | |||||||||||||||||||||||||
| Noninterest bearing deposits | 374,943 | 398,728 | |||||||||||||||||||||||||||||||||
| Other liabilities | 40,192 | 37,784 | |||||||||||||||||||||||||||||||||
| Total liabilities | 2,993,990 | 2,251,900 | |||||||||||||||||||||||||||||||||
| Shareholders' equity | 248,109 | 219,138 | |||||||||||||||||||||||||||||||||
| Total liabilities and shareholders' equity | $ | 3,242,099 | $ | 2,471,038 | |||||||||||||||||||||||||||||||
Net interest income(2) |
$ | 72,377 | $ | 68,082 | |||||||||||||||||||||||||||||||
| Interest rate spread | 2.31 | % | 3.58 | % | |||||||||||||||||||||||||||||||
Net interest margin(3) |
3.04 | % | 3.81 | % | |||||||||||||||||||||||||||||||
