株探米国株
日本語 英語
エドガーで原本を確認する
0001505732FALSE00015057322023-04-262023-04-26


SECURITIES AND EXCHANGE COMMISSION
Washington, D.C. 20549
FORM 8-K
CURRENT REPORT
PURSUANT TO SECTION 13 OR 15(d) OF
THE SECURITIES EXCHANGE ACT OF 1934
Date of Report (Date of earliest event reported):  April 26, 2023
Bankwell Financial Group, Inc.
(Exact name of registrant as specified in its charter)
Connecticut 001-36448 20-8251355
(State or other jurisdiction of incorporation) (Commission File Number) (IRS Employer Identification No.)

258 Elm Street
New Canaan, Connecticut 06840
(203) 652-0166
(Address of Principal Executive Officers and Telephone Number)

N/A
(Former name or former address, if changed since last report)
 
Check the appropriate box below if the Form 8-K filing is intended to simultaneously satisfy the filing obligation of the registrant under any of the following provisions:
 
Written communications pursuant to Rule 425 under the Securities Act (17 CFR 230.425)
 
Soliciting material pursuant to Rule 14a-12 under the Exchange Act (17 CFR 240.14a-12)
 
Pre-commencement communications pursuant to Rule 14d-2(b) under the Exchange Act (17 CFR 240.14d-2(b))
 
Pre-commencement communications pursuant to Rule 13e-4(c) under the Exchange Act (17 CFR 240.13e-4(c))
 
Securities registered pursuant to Section 12(b) of the Act:
Title of Each Class
Trading Symbol(s)
Name of Each Exchange on Which
Registered
Common Stock, no par value per
share

BWFG
NASDAQ Global Market


Indicate by check mark whether the registrant is an emerging growth company as defined in Rule 405 of the Securities Act of 1933 (17 CFR 230.405) or Rule 12b-2 of the Securities Exchange Act of 1934 (17 CFR 240.12b-2).
Emerging growth company
   
If an emerging growth company, indicate by check mark if the registrant has elected not to use the extended transition period for complying with any new or revised financial accounting standards provided pursuant to Section 13(a) of the Exchange Act.
Item 2.02 Results of Operations and Financial Condition
   
 
On April 26, 2023, Bankwell Financial Group, Inc., the holding company for Bankwell Bank, issued a press release describing its results of operations for the period ended March 31, 2023.
 
A copy of the press release is included as Exhibit 99.1 to this current report on Form 8-K and is incorporated herein by reference.

The information furnished under this Item 2.02, including Exhibit 99.1, shall not be deemed “filed” for purposes of Section 18 of the Securities Exchange Act of 1934, as amended, or subject to the liabilities of that section. The information shall not be deemed incorporated by reference into any other filing with the Securities and Exchange Commission made by the Company, regardless of any general incorporation language in such filing.
   
Item 7.01 Regulation FD Disclosure
   
 
On April 26, 2023, Bankwell Financial Group, Inc., the holding company for Bankwell Bank, issued slide presentation material, which includes among other things, a review of financial results and trends through the period ended March 31, 2023. A copy of the material will also be available on the Company’s website, http://investor.mybankwell.com/CorporateProfile.
 
A copy of the Presentation Material is included as Exhibit 99.2 to this current report on Form 8-K and is incorporated herein by reference.
The information furnished under this Item 7.01, including Exhibit 99.2, shall not be deemed “filed” for purposes of Section 18 of the Securities Exchange Act of 1934, as amended, or subject to the liabilities of that section. The information shall not be deemed incorporated by reference into any other filing with the Securities and Exchange Commission made by the Company, regardless of any general incorporation language in such filing.
   
Item 8.01 Other Events
   
 
On April 26, 2023, Bankwell Financial Group, Inc., parent company of Bankwell Bank, announced its Board of Directors has voted to pay a quarterly dividend in the amount of $0.20 per share on May 23, 2023 to all shareholders of record as of May 12, 2023.
Item 9.01 Financial Statements and Exhibits
(a) Not applicable.
(b) Not applicable.
(c) Not applicable.
(d) Exhibits.
Exhibit Number Description
   
99.1
99.2
104 Cover Page Interactive Data File (embedded within the Inline XBRL document)


SIGNATURES
   
Pursuant to the requirements of the Securities Exchange Act of 1934, the Registrant has duly caused this report to be signed on its behalf by the undersigned hereunto duly authorized.
   
  BANKWELL FINANCIAL GROUP, INC.
  Registrant


April 26, 2023
By:  /s/ Courtney E. Sacchetti
  Courtney E. Sacchetti
  Executive Vice President
  and Chief Financial Officer


EX-99.1 2 ex991q12023earningsrelease.htm EX-99.1 Document


BANKWELL FINANCIAL GROUP REPORTS OPERATING RESULTS FOR THE FIRST QUARTER AND DECLARES SECOND QUARTER DIVIDEND
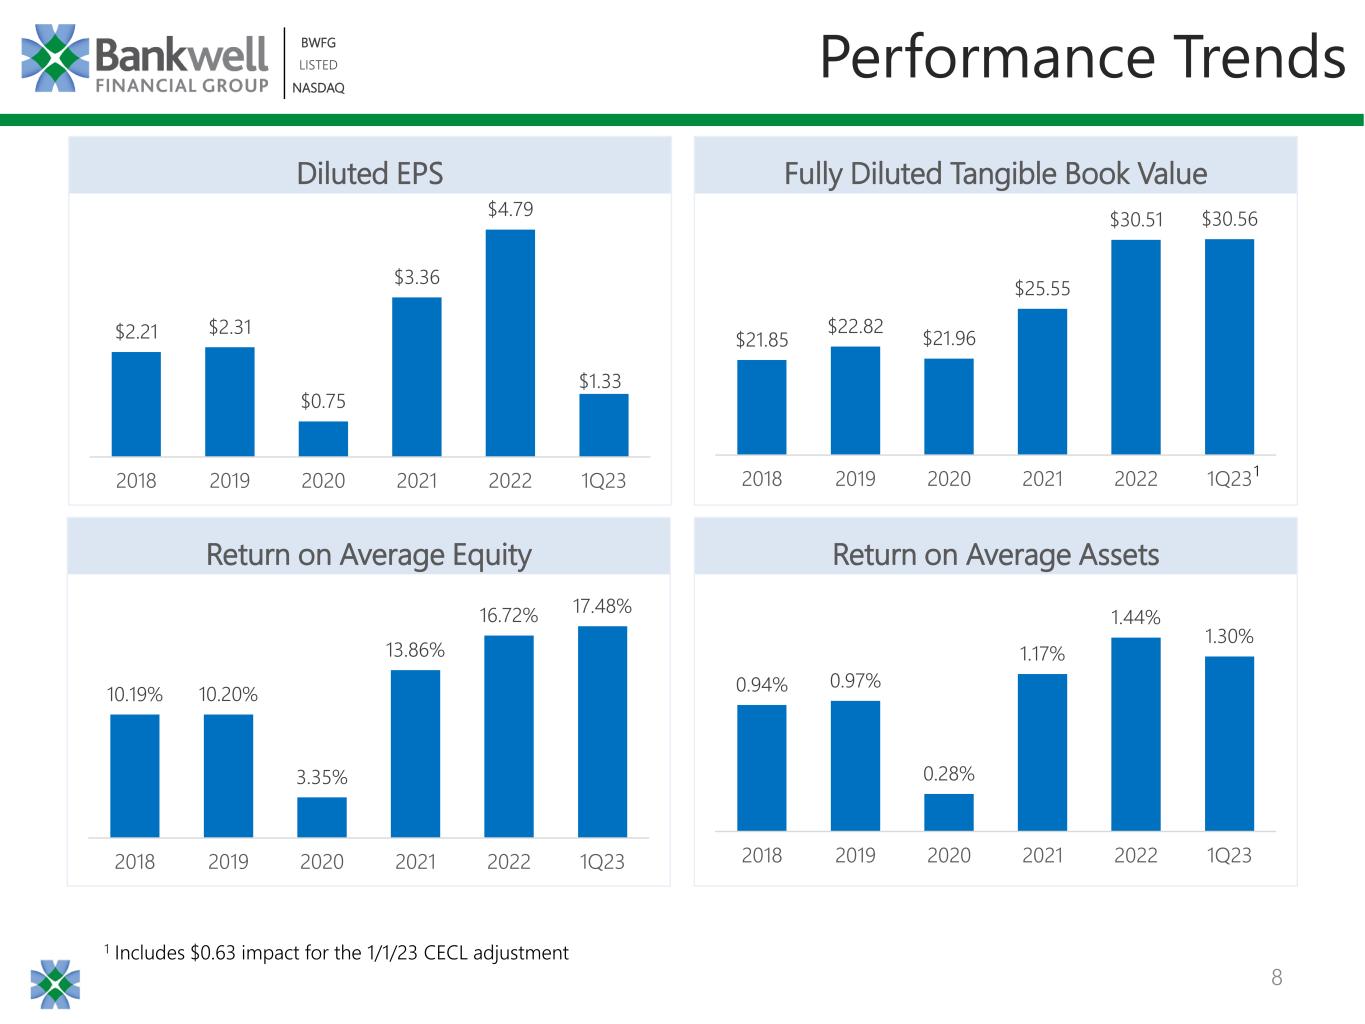
New Canaan, CT – April 26, 2023 – Bankwell Financial Group, Inc. (NASDAQ: BWFG) reported GAAP net income of $10.4 million, or $1.33 per share for the first quarter of 2023, versus $8.2 million, or $1.04 per share, for the same period in 2022.
The Company's Board of Directors declared a $0.20 per share cash dividend, payable May 23, 2023 to shareholders of record on May 12, 2023.
We recommend reading this earnings release in conjunction with the First Quarter 2023 Investor Presentation, located at http://investor.mybankwell.com/Presentations and included as an exhibit to our April 26, 2023 Current Report on Form 8-K.
Notes Bankwell Financial Group President and CEO, Christopher R. Gruseke:
"Bankwell delivered excellent results this quarter. Against the backdrop of a turbulent banking environment, we have maintained strong capital and liquidity levels. Our disciplined risk management practices have maintained outstanding credit quality and have protected the Bank's capital against rising interest rates. We have previously acknowledged and planned for the current environment of increased pressure on deposit costs, and can reiterate prior guidance for a year over year decline in Net Interest Income of approximately 10% for fiscal year 2023."
First Quarter 2023 Highlights:
•Total gross loans were $2.8 billion, growing $83.8 million, or 3.1%, compared to December 31, 2022.
•Deposits of $2.8 billion for the quarter ended March 31, 2023, unchanged from December 31, 2022.
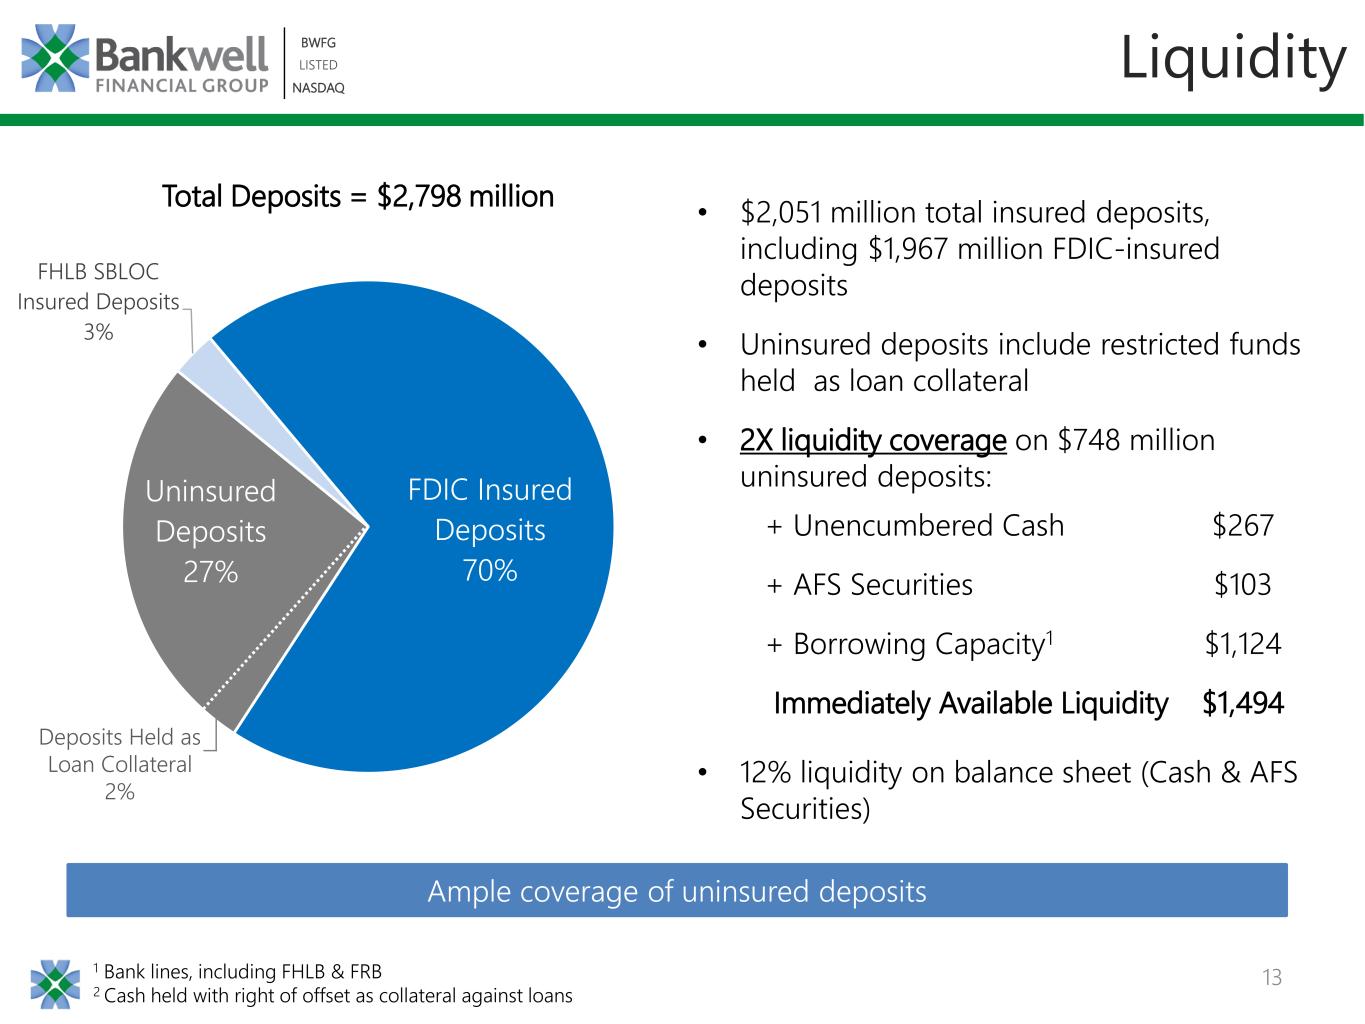
•FDIC-insured deposits totaled $2.0 billion and represent 70.3% of total deposits as of March 31, 2023.
•As of March 31, 2023, the Bank has $1.5 billion immediately available liquidity, comprised of cash, AFS securities and borrowing capacity with the FHLB of Boston and FRB.
•Immediately available liquidity provides 200% coverage of uninsured deposits.
•Average yield on 2023 funded loans was 7.53% for the quarter ended March 31, 2023.
•Return on average assets was 1.30% for the quarter ended March 31, 2023.
•Return on average shareholders' equity was 17.48% for the quarter ended March 31, 2023.
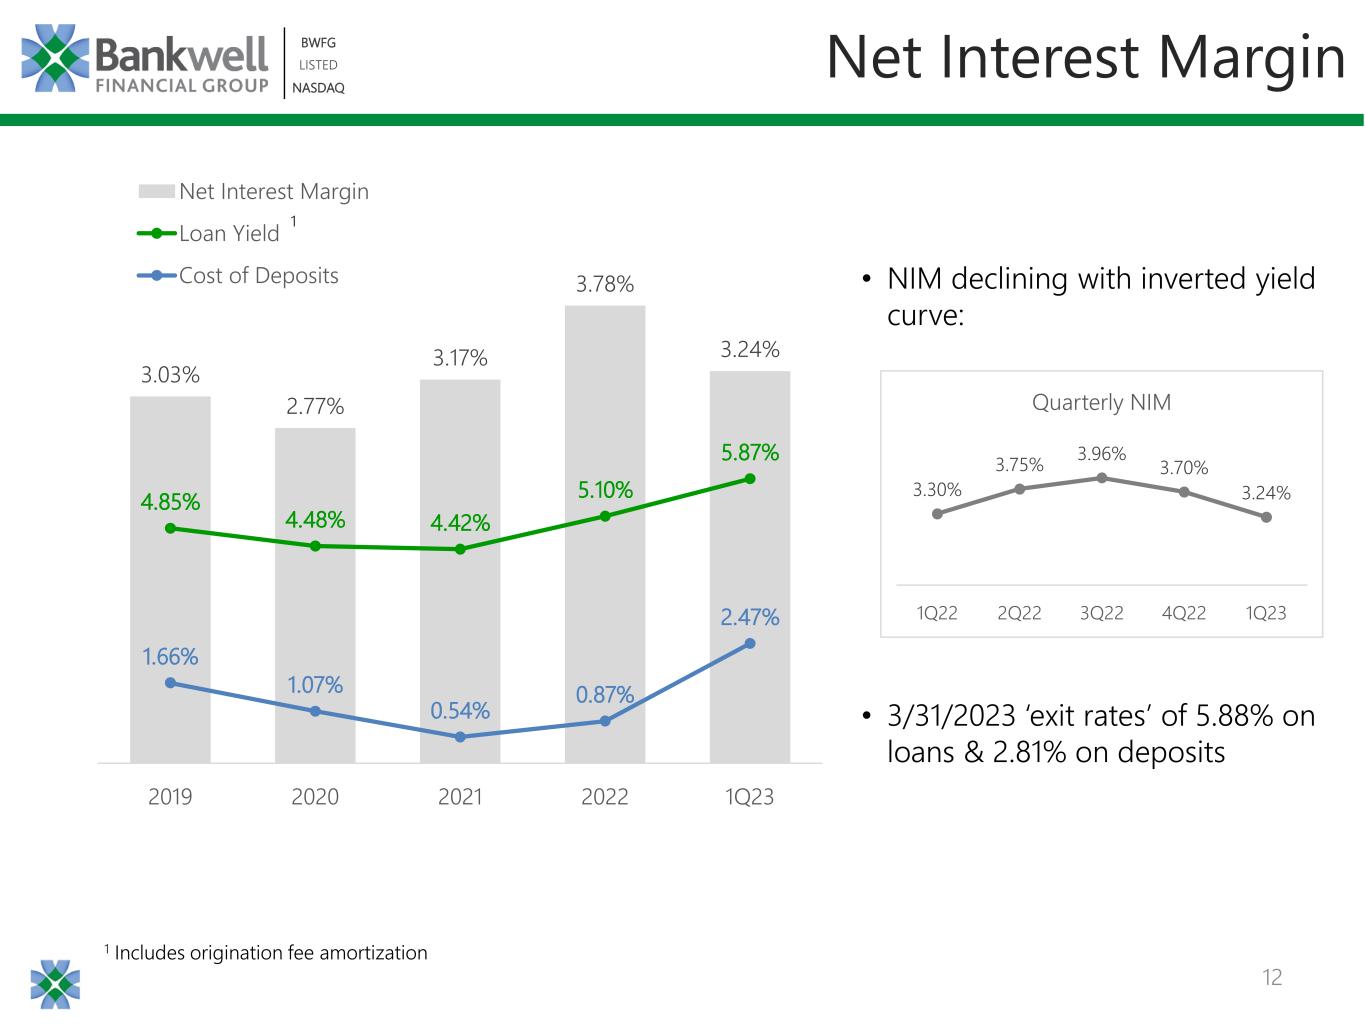
•The net interest margin was 3.24% for the quarter ended March 31, 2023.
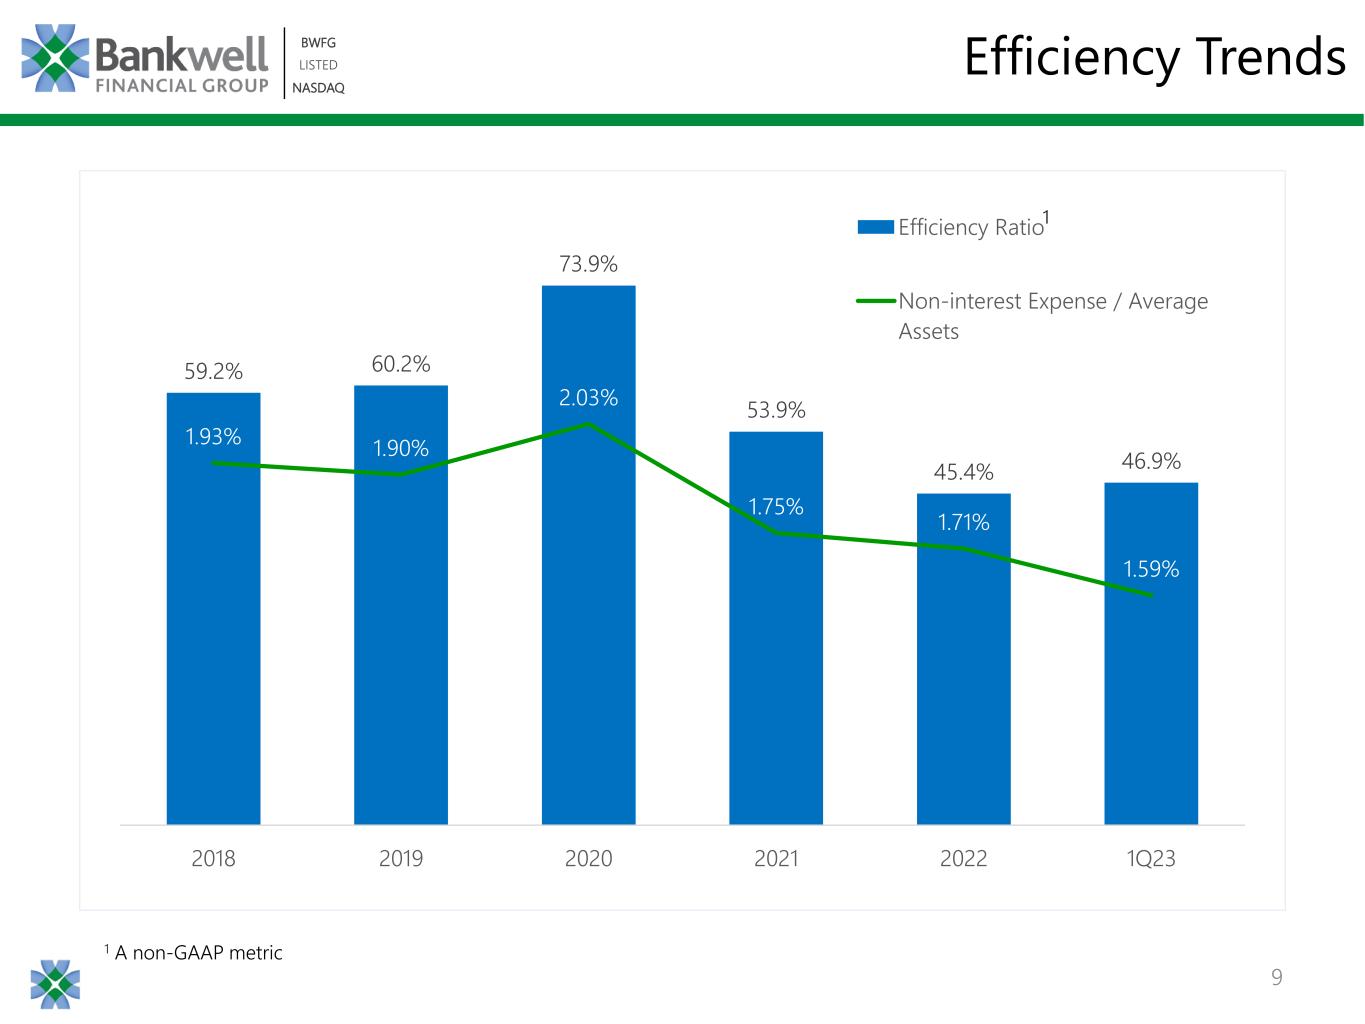
•The efficiency ratio was 46.9% for the quarter ended March 31, 2023.
•Investment securities totaled $121.1 million and represent 3.7% of total assets, with HTM securities totaling $15.9 million, or 0.5% of total assets.
•CECL adopted on January 1, 2023, resulting in a $5.1 million increase to the ACL-Loans and a $1.3 million adjustment to the ACL-Unfunded Commitments.

Earnings and Performance

Revenues (net interest income plus noninterest income) for the quarter ended March 31, 2023 were $27.1 million, versus $20.5 million for the quarter ended March 31, 2022. The increase in revenues was primarily attributable to an increase in interest and fees on loans due to loan growth and higher overall loan yields1 for the quarter ended March 31, 2023 and an increase in noninterest income mainly driven by additional SBA loan sales. The increase in revenues was partially offset by an increase in interest expense.

1 - The increase in overall loan yields was 138 bps for the quarter ended March 31, 2023
1


Net income for the quarter ended March 31, 2023 was $10.4 million, versus $8.2 million for the quarter ended March 31, 2022. The increase in net income was a direct result of the aforementioned increases in revenues. In addition, the increase in net income was partially offset by an increase in the provision for credit losses and an increase in noninterest expense for the quarter ended March 31, 2023.
Basic and diluted earnings per share were $1.34 and $1.33, respectively, for the quarter ended March 31, 2023 compared to basic and diluted earnings per share of $1.05 and $1.04, respectively, for the quarter ended March 31, 2022.
The net interest margin (fully taxable equivalent basis) for the quarters ended March 31, 2023 and March 31, 2022 was 3.24% and 3.30%, respectively. The decrease in the net interest margin was due to an increase in funding costs partially offset by an increase in overall loan yields.
Allowance for Credit Losses
Provision for credit losses was $826 thousand for the quarter ended March 31, 2023, bringing the ACL-Loans as a percentage of total loans to 1.01%. Provision for credit losses was $4.3 million for the quarter ended December 31, 2022. The decrease in the provision for credit losses is attributable to lower loan growth.
On January 1, 2023, the Company adopted ASC 326 Financial Instruments - Credit Losses ("CECL"). Upon adoption of CECL, the Company recorded a one-time cumulative effect, pre-tax adjustment $5.1 million to the ACL-Loans and a corresponding net of tax adjustment to beginning retained earnings. The Company also recorded a one-time cumulative effect, pre-tax adjustment of $1.3 million to the ACL-Unfunded Commitments (which is reflected in Accrued expenses and other liabilities on the Consolidated Balance Sheets) and a corresponding net of tax adjustment to beginning retained earnings.
Financial Condition
Assets totaled $3.25 billion at March 31, 2023 and remained flat compared to December 31, 2022. Gross loans totaled $2.8 billion at March 31, 2023, an increase of $83.8 million or 3.1% compared to December 31, 2022. Deposits totaled $2.8 billion at March 31, 2023, and remained flat compared to December 31, 2022.
Capital
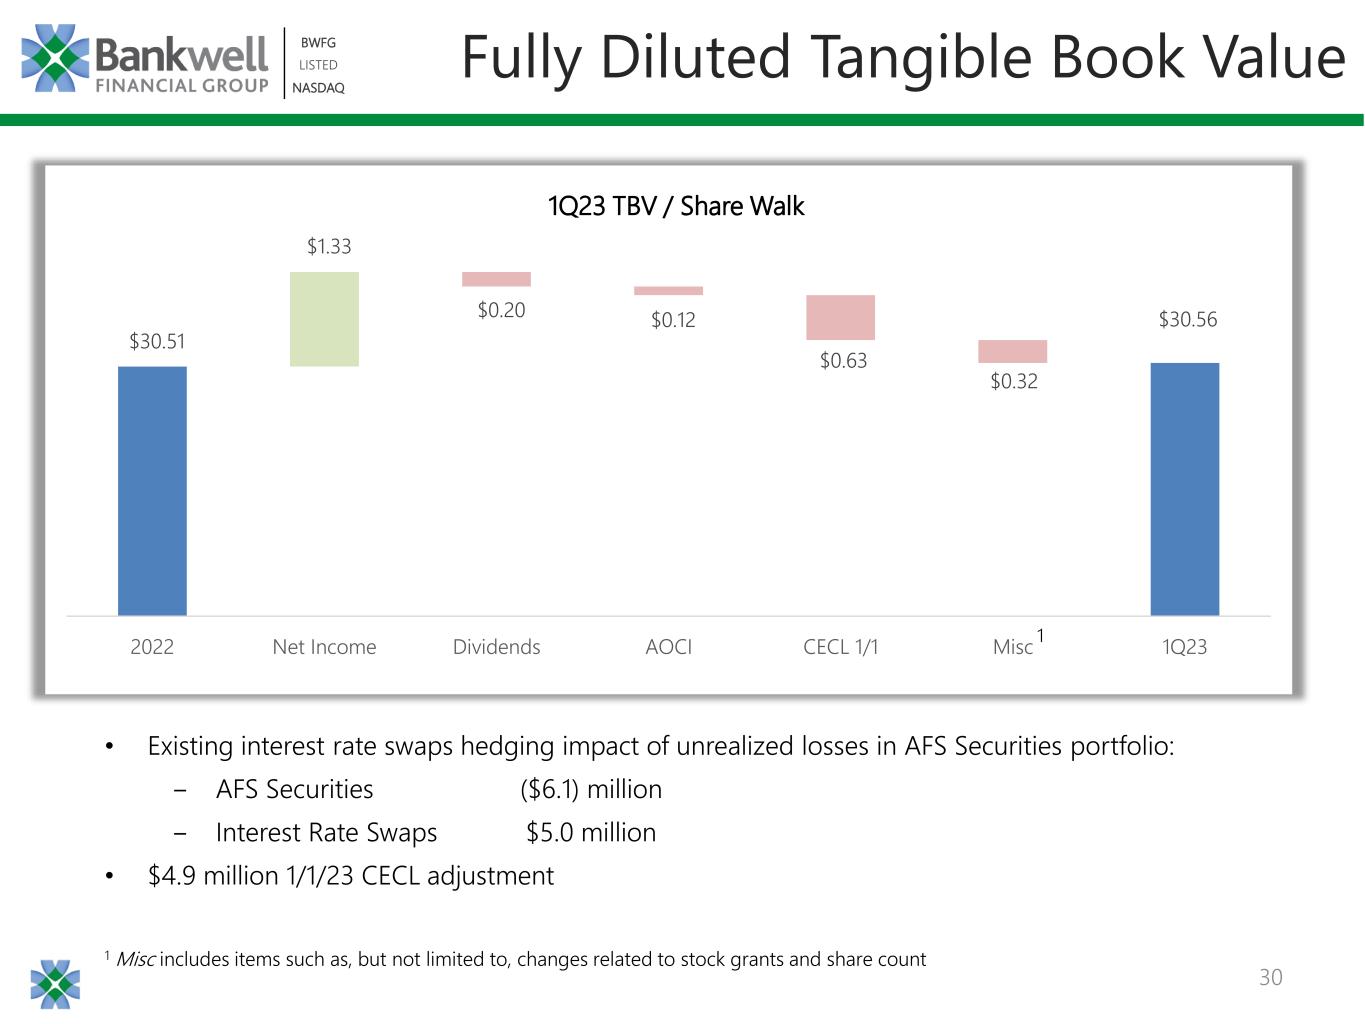
Shareholders’ equity totaled $242.3 million as of March 31, 2023, an increase of $3.8 million compared to December 31, 2022, primarily a result of net income of $10.4 million for the quarter ended March 31, 2023. The increase was partially offset by the Day 1 CECL adoption of $4.9 million, dividends paid of $1.6 million, and a $0.9 million unfavorable impact to accumulated other comprehensive income. The unfavorable impact to accumulated other comprehensive income was driven by fair value marks on the Company's Available for sale investment securities portfolio of $6.1 million partially offset by fair value marks related to hedge positions involving interest rate swaps of $5.0 million. The Company's interest rate swaps are used to hedge interest rate risk.

About Bankwell Financial Group
Bankwell is a commercial bank that serves the banking needs of residents and businesses throughout Fairfield and New Haven Counties, Connecticut. For more information about this press release, interested parties may contact Christopher R. Gruseke, President and Chief Executive Officer or Courtney E. Sacchetti, Executive Vice President and Chief Financial Officer of Bankwell Financial Group at (203) 652-0166.
For more information, visit www.mybankwell.com.


2


This press release may contain certain forward-looking statements about the Company. Forward-looking statements include statements regarding anticipated future events and can be identified by the fact that they do not relate strictly to historical or current facts. They often include words such as “believe,” “expect,” “anticipate,” “estimate,” and “intend” or future or conditional verbs such as “will,” “would,” “should,” “could,” or “may.” Forward-looking statements, by their nature, are subject to risks and uncertainties. Certain factors that could cause actual results to differ materially from expected results include increased competitive pressures, changes in the interest rate environment, general economic conditions or conditions within the banking industry or securities markets, and legislative and regulatory changes that could adversely affect the business in which the Company and its subsidiaries are engaged.

Non-GAAP Financial Measures
In addition to evaluating the Company's financial performance in accordance with U.S. generally accepted accounting principles ("GAAP"), management may evaluate certain non-GAAP financial measures, such as the efficiency ratio. A computation and reconciliation of certain non-GAAP financial measures used for these purposes is contained in the accompanying Reconciliation of GAAP to Non-GAAP Measures tables. We believe that providing certain non-GAAP financial measures provides investors with information useful in understanding our financial performance, our performance trends and financial position. For example, the Company believes that the efficiency ratio is useful in the assessment of financial performance, including noninterest expense control. The Company believes that tangible common equity, tangible assets, tangible common equity to tangible assets, tangible common shareholders' equity, fully diluted tangible book value per common share, adjusted noninterest expense, operating revenue, efficiency ratio, average tangible common equity, annualized return on average tangible common equity, return on average assets, return on average shareholders' equity, and the dividend payout ratio are useful to evaluate the relative strength of the Company's performance and capital position. We utilize these measures for internal planning and forecasting purposes. These non-GAAP financial measures should not be considered a substitute for GAAP basis measures and results, and we strongly encourage investors to review our consolidated financial statements in their entirety and not to rely on any single financial measure.
3


BANKWELL FINANCIAL GROUP, INC.
CONSOLIDATED BALANCE SHEETS (unaudited)
(Dollars in thousands)
March 31,
2023
December 31,
2022
March 31,
2022
ASSETS
Cash and due from banks $ 249,812  $ 344,925  $ 280,471 
Federal funds sold 27,370  10,754  19,022 
Cash and cash equivalents 277,182  355,679  299,493 
Investment securities
Marketable equity securities, at fair value 2,028  1,988  2,090 
Available for sale investment securities, at fair value 103,171  103,663  98,733 
Held to maturity investment securities, at amortized cost 15,931  15,983  15,979 
Total investment securities 121,130  121,634  116,802 
Loans receivable (net of ACL-Loans of $27,998, $22,431, and $17,141 at March 31, 2023, December 31, 2022, and March 31, 2022, respectively) 2,724,514  2,646,384  1,964,567 
Accrued interest receivable 14,261  13,070  7,733 
Federal Home Loan Bank stock, at cost 5,234  5,216  2,870 
Premises and equipment, net 27,619  27,199  25,661 
Bank-owned life insurance 50,524  50,243  49,434 
Goodwill 2,589  2,589  2,589 
Deferred income taxes, net 8,692  7,422  6,879 
Other assets 20,573  23,013  20,849 
Total assets $ 3,252,318  $ 3,252,449  $ 2,496,877 
LIABILITIES AND SHAREHOLDERS’ EQUITY
Liabilities
Deposits
Noninterest bearing deposits $ 377,667  $ 404,559  $ 412,985 
Interest bearing deposits 2,420,641  2,396,259  1,753,219 
Total deposits 2,798,308  2,800,818  2,166,204 
Advances from the Federal Home Loan Bank 90,000  90,000  50,000 
Subordinated debentures 69,020  68,959  34,471 
Accrued expenses and other liabilities 52,683  54,203  35,982 
Total liabilities 3,010,011  3,013,980  2,286,657 
Shareholders’ equity
Common stock, no par value 115,875  115,018  114,882 
Retained earnings 127,566  123,640  99,047 
Accumulated other comprehensive (loss) income (1,134) (189) (3,709)
Total shareholders’ equity 242,307  238,469  210,220 
Total liabilities and shareholders’ equity $ 3,252,318  $ 3,252,449  $ 2,496,877 
4


BANKWELL FINANCIAL GROUP, INC.
CONSOLIDATED STATEMENTS OF INCOME (unaudited)
(Dollars in thousands, except share data)
For the Quarter Ended
March 31,
2023
December 31,
2022
March 31,
2022
Interest and dividend income
Interest and fees on loans $ 39,723  $ 36,545  $ 21,428 
Interest and dividends on securities 1,000  898  720 
Interest on cash and cash equivalents 3,568  2,150  154 
Total interest and dividend income 44,291  39,593  22,302 
Interest expense
Interest expense on deposits 17,033  11,083  2,206 
Interest expense on borrowings 1,717  1,701  586 
Total interest expense 18,750  12,784  2,792 
Net interest income 25,541  26,809  19,510 
Provision for credit losses 826  4,272  229 
Net interest income after provision for credit losses 24,715  22,537  19,281 
Noninterest income
Bank owned life insurance 281  273  260 
Service charges and fees 286  343  240 
Gains and fees from sales of loans 931  12  631 
Other 28  (100) (173)
Total noninterest income 1,526  528  958 
Noninterest expense
Salaries and employee benefits 6,081  5,988  4,940 
Occupancy and equipment 2,084  1,919  2,150 
Professional services 1,322  912  981 
Data processing 671  663  654 
Director fees 392  378  352 
FDIC insurance 1,062  898  223 
Marketing 151  112  45 
Other 928  1,601  580 
Total noninterest expense 12,691  12,471  9,925 
Income before income tax expense 13,550  10,594  10,314 
Income tax expense 3,171  2,573  2,102 
Net income $ 10,379  $ 8,021  $ 8,212 
Earnings Per Common Share:
Basic $ 1.34  $ 1.04  $ 1.05 
Diluted $ 1.33  $ 1.04  $ 1.04 
Weighted Average Common Shares Outstanding:
Basic 7,554,689  7,507,540  7,637,077 
Diluted 7,616,671  7,563,116  7,719,405 
Dividends per common share $ 0.20  $ 0.20  $ 0.20 
5


BANKWELL FINANCIAL GROUP, INC.
CONSOLIDATED FINANCIAL HIGHLIGHTS (unaudited)

For the Quarter Ended
March 31,
2023
December 31,
2022
March 31,
2022
Performance ratios:
Return on average assets 1.30  % 1.07  % 1.35  %
Return on average shareholders' equity 17.48  % 13.38  % 16.05  %
Return on average tangible common equity 17.67  % 13.52  % 16.25  %
Net interest margin 3.24  % 3.70  % 3.30  %
Efficiency ratio(1)
46.9  % 45.6  % 48.5  %
Net loan charge-offs as a % of average loans 0.02  % —  % —  %
Dividend payout ratio(2)
15.04  % 19.23  % 19.23  %
(1)Efficiency ratio is defined as noninterest expense, less other real estate owned expenses and amortization of intangible assets, divided by our operating revenue, which is equal to net interest income plus noninterest income excluding gains and losses on sales of securities and gains and losses on other real estate owned. In our judgment, the adjustments made to operating revenue allow investors and analysts to better assess our operating expenses in relation to our core operating revenue by removing the volatility that is associated with certain one-time items and other discrete items that are unrelated to our core business.
(2)The dividend payout ratio is calculated by dividing dividends per share by earnings per share.

As of
March 31,
2023
December 31,
2022
March 31,
2022
Capital ratios:
Total Common Equity Tier 1 Capital to Risk-Weighted Assets(1)
10.17  % 10.28  % 11.20  %
Total Capital to Risk-Weighted Assets(1)
11.16  % 11.07  % 12.00  %
Tier I Capital to Risk-Weighted Assets(1)
10.17  % 10.28  % 11.20  %
Tier I Capital to Average Assets(1)
9.22  % 9.88  % 9.80  %
Tangible common equity to tangible assets 7.38  % 7.26  % 8.32  %
Fully diluted tangible book value per common share $ 30.56  $ 30.51  $ 26.75 
(1)Represents Bank ratios. Current period capital ratios are preliminary subject to finalization of the FDIC Call Report.

6


BANKWELL FINANCIAL GROUP, INC.
ASSET QUALITY (unaudited)
(Dollars in thousands)
For the Quarter Ended
March 31,
2023
December 31,
2022
March 31,
2022
ACL-Loans:
Balance at beginning of period $ 22,431  $ 18,167  $ 16,902 
Day 1 CECL Adjustment on January 1, 2023 5,079  —  — 
Beginning balance January 1, 2023 27,510  18,167  16,902 
Charge-offs:
Commercial business (440) —  — 
Consumer (12) (11) (4)
Total charge-offs (452) (11) (4)
Recoveries:
Commercial real estate —  —  — 
Commercial business —  —  13 
Consumer
Total recoveries 14 
Net loan (charge-offs) recoveries (446) (8) 10 
Provision for credit losses - loans 934  4,272  229 
Balance at end of period $ 27,998  $ 22,431  $ 17,141 

As of
March 31,
2023
December 31,
2022
March 31,
2022
Asset quality:
Nonaccrual loans
Residential real estate $ 1,443  $ 2,152  $ 2,181 
Commercial real estate 1,912  2,781  3,365 
Commercial business 1,528  2,126  817 
Construction 9,382  9,382  9,382 
Total nonaccrual loans 14,265  16,441  15,745 
Other real estate owned —  —  — 
Total nonperforming assets $ 14,265  $ 16,441  $ 15,745 
Nonperforming loans as a % of total loans 0.52  % 0.61  % 0.79  %
Nonperforming assets as a % of total assets 0.44  % 0.51  % 0.63  %
ACL-loans as a % of total loans 1.01  % 0.84  % 0.86  %
ACL-loans as a % of nonperforming loans 196.27  % 136.43  % 108.87  %
Total past due loans to total loans 0.94  % 0.60  % 0.85  %

Total nonaccrual loans decreased $2.2 million to $14.3 million as of March 31, 2023 when compared to December 31, 2022. Nonperforming assets as a percentage of total assets decreased to 0.44% at March 31, 2023, down from 0.51% at December 31, 2022. The ACL-Loans at March 31, 2023 was $28.0 million, representing 1.01% of total loans.

Past due loans increased to $26.1 million, or 0.94% of total loans, as of March 31, 2023, compared to $16.1 million, or 0.60% of total loans, as of December 31, 2022. Of the March 31, 2023 past due loans, $10.0 million of loans were between 31 - 33 days past due and have subsequently become current. As of April 19, 2023, past due loans were $18.6 million or 0.67% of total loans.
7


BANKWELL FINANCIAL GROUP, INC.
LOAN & DEPOSIT PORTFOLIO (unaudited)
(Dollars in thousands)
Period End Loan Composition March 31,
2023
December 31,
2022
 

% Change
Residential Real Estate $ 58,541  $ 60,588  (3.4) %
Commercial Real Estate(1)
1,960,712  1,921,252  2.1 
Construction 177,115  155,198  14.1 
Total Real Estate Loans 2,196,368  2,137,038  2.8 
Commercial Business 543,457  520,447  4.4 
Consumer 19,464  17,963  8.4 
Total Loans $ 2,759,289  $ 2,675,448  3.1  %
(1) Includes owner occupied commercial real estate.
Gross loans totaled $2.8 billion at March 31, 2023, an increase of $83.8 million or 3.1% compared to December 31, 2022.
Period End Deposit Composition March 31,
2023
December 31,
2022
 

% Change
Noninterest bearing demand $ 377,667  $ 404,559  (6.6) %
NOW 89,896  104,057  (13.6)
Money Market 874,202  913,868  (4.3)
Savings 117,986  151,944  (22.3)
Time 1,338,557  1,226,390  9.1 
Total Deposits $ 2,798,308  $ 2,800,818  (0.1) %

Total deposits were $2.8 billion at March 31, 2023, a decrease of $2.5 million, or 0.1%, when compared to December 31, 2022.
8


BANKWELL FINANCIAL GROUP, INC.
NONINTEREST INCOME (unaudited)
(Dollars in thousands)
For the Quarter Ended
Noninterest income March 31,
2023
December 31,
2022
March 31,
2022
Mar 23 vs. Dec 22
% Change
Mar 23 vs. Mar 22
% Change
Bank owned life insurance $ 281  $ 273  $ 260  2.9  % 8.1  %
Service charges and fees 286  343  240  (16.6) 19.2 
Gains and fees from sales of loans 931  12  631  (7,658.3) 47.5 
Other 28  (100) (173) (128.0) 116.2 
Total noninterest income $ 1,526  $ 528  $ 958  189.0  % 59.3  %
Noninterest income increased by $0.6 million to $1.5 million for the quarter ended March 31, 2023 compared to the quarter ended March 31, 2022. The increase in noninterest income was driven by an increase in SBA loan sales during the first quarter of 2023.
BANKWELL FINANCIAL GROUP, INC.
NONINTEREST EXPENSE (unaudited)
(Dollars in thousands)
For the Quarter Ended
Noninterest expense March 31,
2023
December 31,
2022
March 31,
2022
Mar 23 vs. Dec 22
% Change
Mar 23 vs. Mar 22
% Change
Salaries and employee benefits $ 6,081  $ 5,988  $ 4,940  1.6  % 23.1  %
Occupancy and equipment 2,084  1,919  2,150  8.6  (3.1)
Professional services 1,322  912  981  45.0  34.8 
Data processing 671  663  654  1.2  2.6 
Director fees 392  378  352  3.7  11.4 
FDIC insurance 1,062  898  223  18.3  376.2 
Marketing 151  112  45  34.8  235.6 
Other 928  1,601  580  (42.0) 60.0 
Total noninterest expense $ 12,691  $ 12,471  $ 9,925  1.8  % 27.9  %

Noninterest expense increased by $2.8 million to $12.7 million for the quarter ended March 31, 2023 compared to the quarter ended March 31, 2022. The increase in noninterest expense was primarily driven by an increase in salaries and employee benefits expense, professional services expense, and FDIC insurance.
Salaries and employee benefits expense totaled $6.1 million for the quarter ended March 31, 2023, an increase of $1.1 million when compared to the same period in 2022. The increase in salaries and employee benefits expense was driven by an increase in full time equivalent employees, with full time equivalent employees totaling 135 at March 31, 2023 compared to 126 for the same period in 2022. The increase in salaries and employee benefits expense was also due to lower loan originations, which reduced the amount of the Bank's ability to defer expenses.
Professional services expense totaled $1.3 million for the quarter ended March 31, 2023, an increase of $0.3 million when compared to the same period in 2022. The increase in professional services expense was primarily driven by consulting fees.
FDIC insurance expense totaled $1.1 million for the quarter ended March 31, 2023, an increase of $0.8 million when compared to the same period in 2022. The increase in FDIC insurance expense is attributed to the overall balance sheet growth, increased use of brokered deposits, and an increase in FDIC insurance rates.
9


BANKWELL FINANCIAL GROUP, INC.
RECONCILIATION OF GAAP TO NON-GAAP MEASURES (unaudited)
(Dollars in thousands, except share data)
As of
Computation of Tangible Common Equity to Tangible Assets March 31,
2023
December 31,
2022
March 31,
2022
Total Equity $ 242,307  $ 238,469  $ 210,220 
Less:
Goodwill 2,589  2,589  2,589 
Other intangibles —  —  — 
Tangible Common Equity $ 239,718  $ 235,880  $ 207,631 
Total Assets $ 3,252,318  $ 3,252,449  $ 2,496,877 
Less:
Goodwill 2,589  2,589  2,589 
Other intangibles —  —  — 
Tangible Assets $ 3,249,729  $ 3,249,860  $ 2,494,288 
Tangible Common Equity to Tangible Assets 7.38  % 7.26  % 8.32  %

As of
Computation of Fully Diluted Tangible Book Value per Common Share March 31,
2023
December 31,
2022
March 31,
2022
Total shareholders' equity $ 242,307  $ 238,469  $ 210,220 
Less:
Preferred stock —  —  — 
Common shareholders' equity $ 242,307  $ 238,469  $ 210,220 
Less:
Goodwill 2,589  2,589  2,589 
Other intangibles —  —  — 
Tangible common shareholders' equity $ 239,718  $ 235,880  $ 207,631 
Common shares issued and outstanding 7,843,438  7,730,699  7,761,338 
Fully Diluted Tangible Book Value per Common Share $ 30.56  $ 30.51  $ 26.75 
10


BANKWELL FINANCIAL GROUP, INC.
RECONCILIATION OF GAAP TO NON-GAAP MEASURES (unaudited) - Continued
(Dollars in thousands)
For the Quarter Ended
Computation of Efficiency Ratio March 31,
2023
December 31,
2022
March 31,
2022
Noninterest expense $ 12,691  $ 12,471  $ 9,925 
Less:
Amortization of intangible assets —  —  — 
Other real estate owned expenses —  —  — 
Adjusted noninterest expense $ 12,691  $ 12,471  $ 9,925 
Net interest income $ 25,541  $ 26,809  $ 19,510 
Noninterest income 1,526  528  958 
Less:
Net gain on sale of available for sale securities —  —  — 
Gain on sale of other real estate owned, net —  —  — 
Operating revenue $ 27,067  $ 27,337  $ 20,468 
Efficiency ratio 46.9  % 45.6  % 48.5  %

For the Quarter Ended
Computation of Return on Average Tangible Common Equity March 31,
2023
December 31,
2022
March 31,
2022
Net Income Attributable to Common Shareholders $ 10,379  $ 8,021  $ 8,212 
Total average shareholders' equity $ 240,833  $ 237,922  $ 207,541 
Less:
Average Goodwill 2,589  2,589  2,589 
Average Other intangibles —  —  — 
Average tangible common equity $ 238,244  $ 235,333  $ 204,952 
Annualized Return on Average Tangible Common Equity 17.67  % 13.52  % 16.25  %
11


BANKWELL FINANCIAL GROUP, INC.
NET INTEREST MARGIN ANALYSIS ON A FULLY TAX EQUIVALENT BASIS - QTD (unaudited)
(Dollars in thousands)
For the Quarter Ended
March 31, 2023 March 31, 2022
Average
Balance
Interest
Yield/
Rate (4)
Average
Balance
Interest
Yield/
Rate (4)
Assets:
Cash and Fed funds sold $ 315,566  $ 3,568  4.59  % $ 346,183  $ 154  0.18  %
Securities(1)
129,881  956  2.49  112,337  754  2.69 
Loans:
Commercial real estate 1,918,551  25,585  5.33  1,343,565  14,997  4.46 
Residential real estate 59,444  643  4.33  73,835  671  3.64 
Construction 166,254  2,825  6.80  102,179  1,033  4.04 
Commercial business 542,399  10,421  7.68  383,115  4,625  4.83 
Consumer 18,536  249  5.45  6,054  102  6.85 
Total loans 2,705,184  39,723  5.87  1,908,748  21,428  4.49 
Federal Home Loan Bank stock 5,271  94  7.27  2,835  15  2.10 
Total earning assets 3,155,902  $ 44,341  5.62  % 2,370,103  $ 22,351  3.77  %
Other assets 84,063  100,469 
Total assets $ 3,239,965  $ 2,470,572 
Liabilities and shareholders' equity:
Interest bearing liabilities:
NOW $ 92,918  $ 37  0.16  % $ 112,199  $ 47  0.17  %
Money market 907,739  6,385  2.85  969,527  1,180  0.49 
Savings 136,333  727  2.16  194,463  101  0.21 
Time 1,252,564  9,883  3.20  453,805  878  0.78 
Total interest bearing deposits 2,389,554  17,032  2.89  1,729,994  2,206  0.52 
Borrowed Money 161,202  1,717  4.26  84,452  586  2.77 
Total interest bearing liabilities 2,550,756  $ 18,749  2.98  % 1,814,446  $ 2,792  0.62  %
Noninterest bearing deposits 403,920  405,400 
Other liabilities 44,406  43,185 
Total liabilities 2,999,082  2,263,031 
Shareholders' equity 240,883  207,541 
Total liabilities and shareholders' equity $ 3,239,965  $ 2,470,572 
Net interest income(2)
$ 25,592  $ 19,559 
Interest rate spread 2.64  % 3.15  %
Net interest margin(3)
3.24  % 3.30  %
(1)Average balances and yields for securities are based on amortized cost.
(2)The adjustment for securities and loans taxable equivalency amounted to $51 thousand and $49 thousand for the quarters
ended March 31, 2023 and 2022, respectively.
(3)Annualized net interest income as a percentage of earning assets.
(4)Yields are calculated using the contractual day count convention for each respective product type.
12
EX-99.2 3 a1q2023bwfginvestorprese.htm EX-99.2 a1q2023bwfginvestorprese
BWFG | LISTED | NASDAQ 1Q23 Investor Presentation April 26th, 2023


2 BWFG LISTED NASDAQ BWFG LISTED NASDAQ This presentation may contain certain forward-looking statements about Bankwell Financial Group, Inc. (the “Company”). Forward-looking statements include statements regarding anticipated future events and can be identified by the fact that they do not relate strictly to historical or current facts. They often include words such as “believe,” “expect,” “would,” “should,” “could,” or “may.” Forward-looking statements, by their nature, are subject to risks and uncertainties. Certain factors that could cause actual results to differ materially from expected results include increased competitive pressures, changes in the interest rate environment, general economic conditions or conditions within the banking industry or securities markets, and legislative and regulatory changes that could adversely affect the business in which the Company and its subsidiaries are engaged. Safe Harbor


3 BWFG LISTED NASDAQ BWFG LISTED NASDAQ Table of Contents • 1Q23 Performance • Deposits & Liquidity • Loans • Credit Quality & ALLL • Capital • Bankwell History & Overview


BWFG | LISTED | NASDAQ 1Q23 Performance


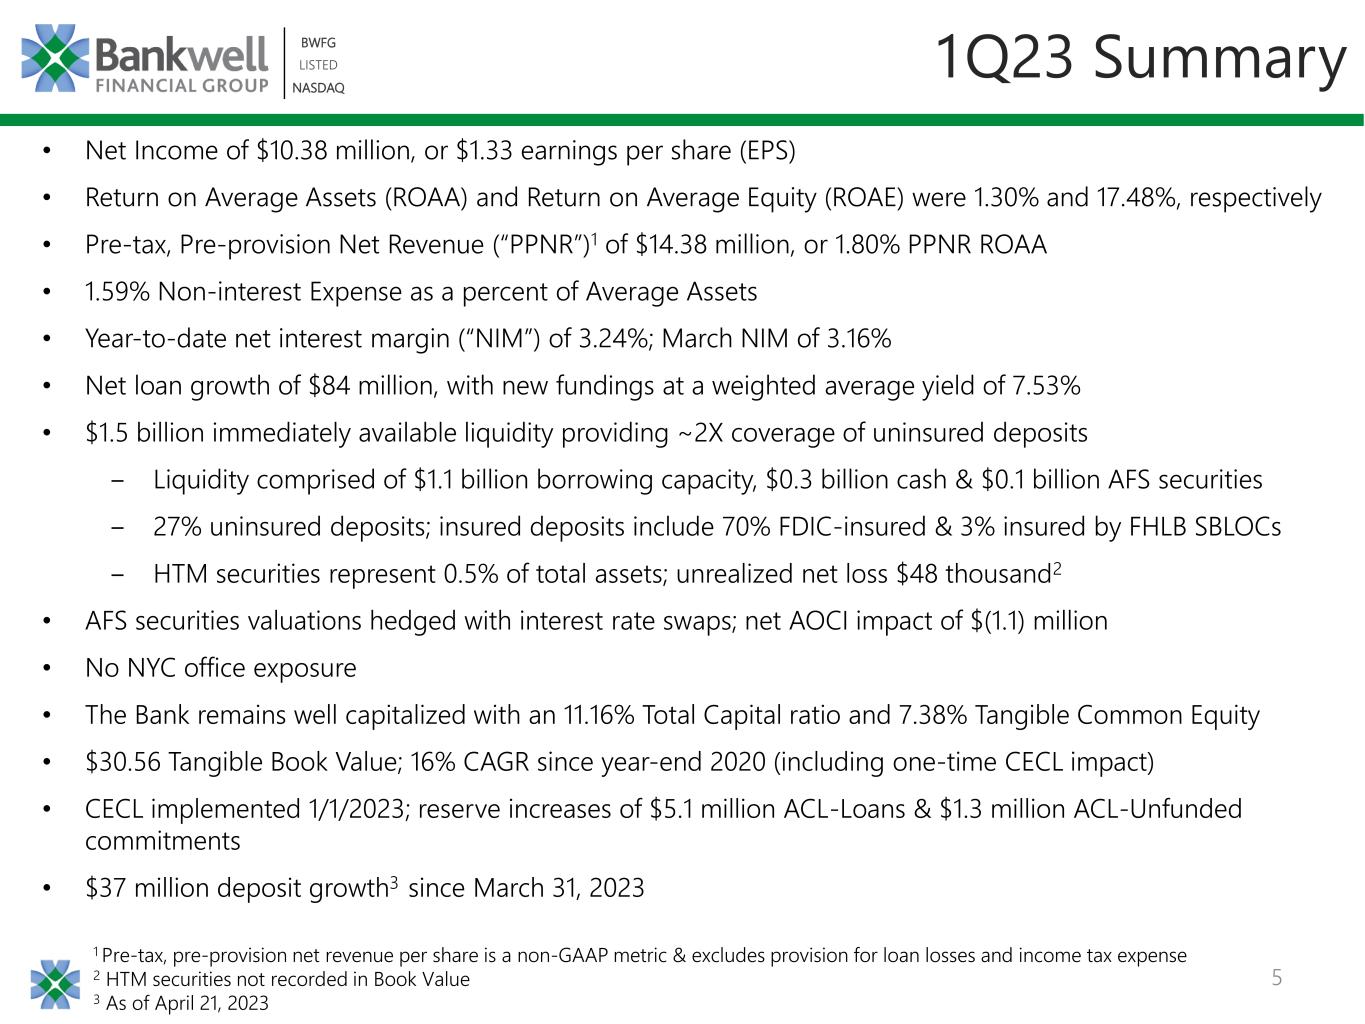
5 BWFG LISTED NASDAQ BWFG LISTED NASDAQ 1Q23 Summary • Net Income of $10.38 million, or $1.33 earnings per share (EPS) • Return on Average Assets (ROAA) and Return on Average Equity (ROAE) were 1.30% and 17.48%, respectively • Pre-tax, Pre-provision Net Revenue (“PPNR”)1 of $14.38 million, or 1.80% PPNR ROAA • 1.59% Non-interest Expense as a percent of Average Assets • Year-to-date net interest margin (“NIM”) of 3.24%; March NIM of 3.16% • Net loan growth of $84 million, with new fundings at a weighted average yield of 7.53% • $1.5 billion immediately available liquidity providing ~2X coverage of uninsured deposits ‒ Liquidity comprised of $1.1 billion borrowing capacity, $0.3 billion cash & $0.1 billion AFS securities ‒ 27% uninsured deposits; insured deposits include 70% FDIC-insured & 3% insured by FHLB SBLOCs ‒ HTM securities represent 0.5% of total assets; unrealized net loss $48 thousand2 • AFS securities valuations hedged with interest rate swaps; net AOCI impact of $(1.1) million • No NYC office exposure • The Bank remains well capitalized with an 11.16% Total Capital ratio and 7.38% Tangible Common Equity • $30.56 Tangible Book Value; 16% CAGR since year-end 2020 (including one-time CECL impact) • CECL implemented 1/1/2023; reserve increases of $5.1 million ACL-Loans & $1.3 million ACL-Unfunded commitments • $37 million deposit growth3 since March 31, 2023 1 Pre-tax, pre-provision net revenue per share is a non-GAAP metric & excludes provision for loan losses and income tax expense 2 HTM securities not recorded in Book Value 3 As of April 21, 2023


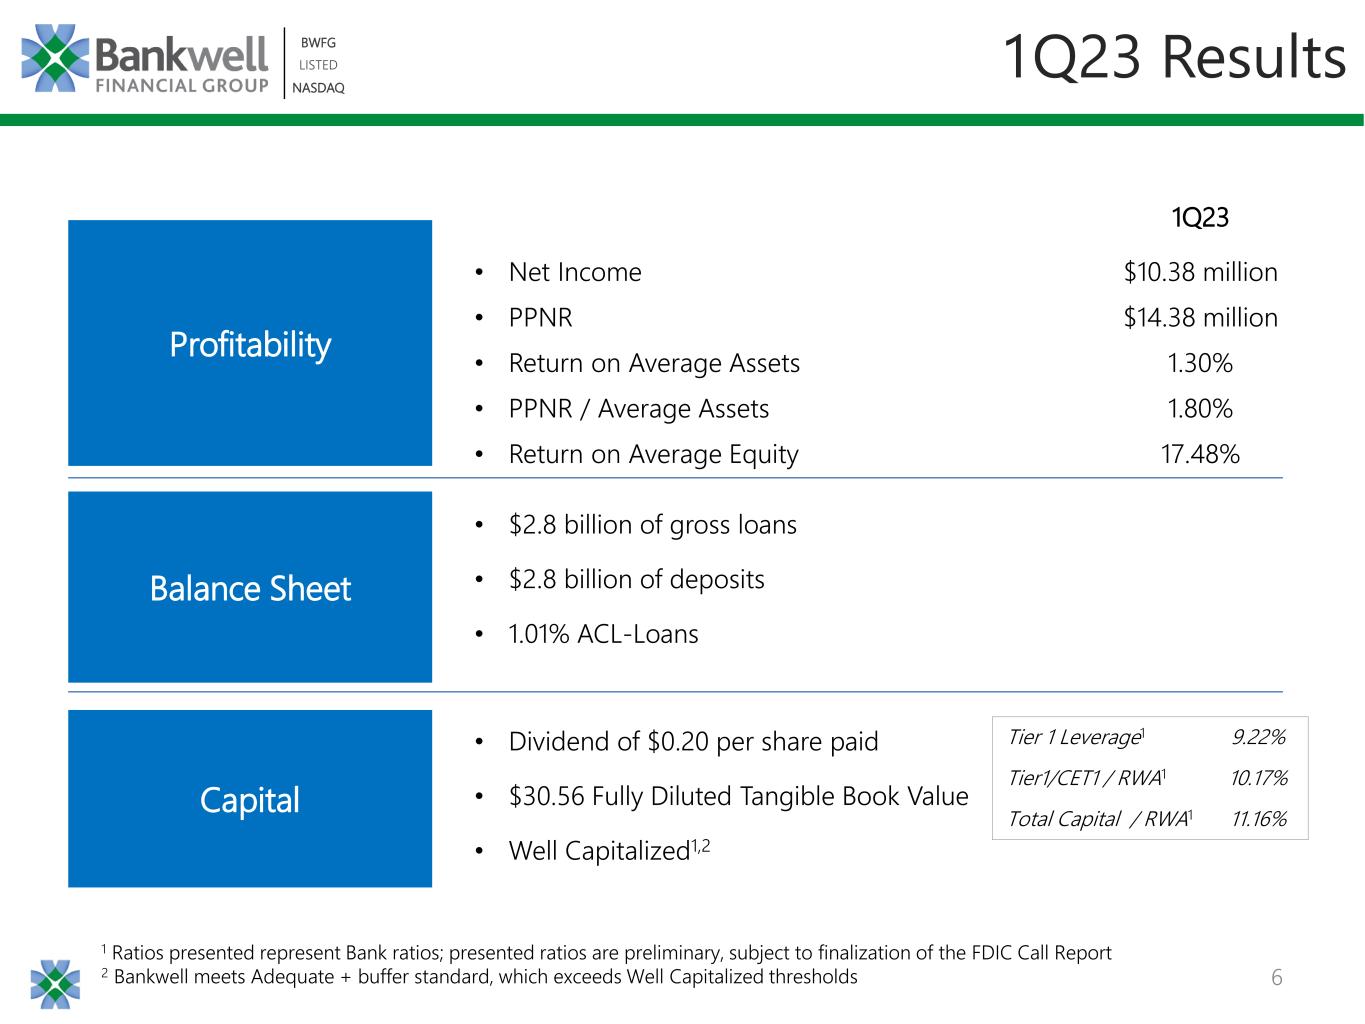
6 BWFG LISTED NASDAQ BWFG LISTED NASDAQ 1Q23 Results 1 Ratios presented represent Bank ratios; presented ratios are preliminary, subject to finalization of the FDIC Call Report 2 Bankwell meets Adequate + buffer standard, which exceeds Well Capitalized thresholds Profitability Balance Sheet Capital • $2.8 billion of gross loans • $2.8 billion of deposits • 1.01% ACL-Loans • Dividend of $0.20 per share paid • $30.56 Fully Diluted Tangible Book Value • Well Capitalized1,2 Tier 1 Leverage1 9.22% Tier1/CET1 / RWA1 10.17% Total Capital / RWA1 11.16% 1Q23 • Net Income $10.38 million • PPNR $14.38 million • Return on Average Assets 1.30% • PPNR / Average Assets 1.80% • Return on Average Equity 17.48%


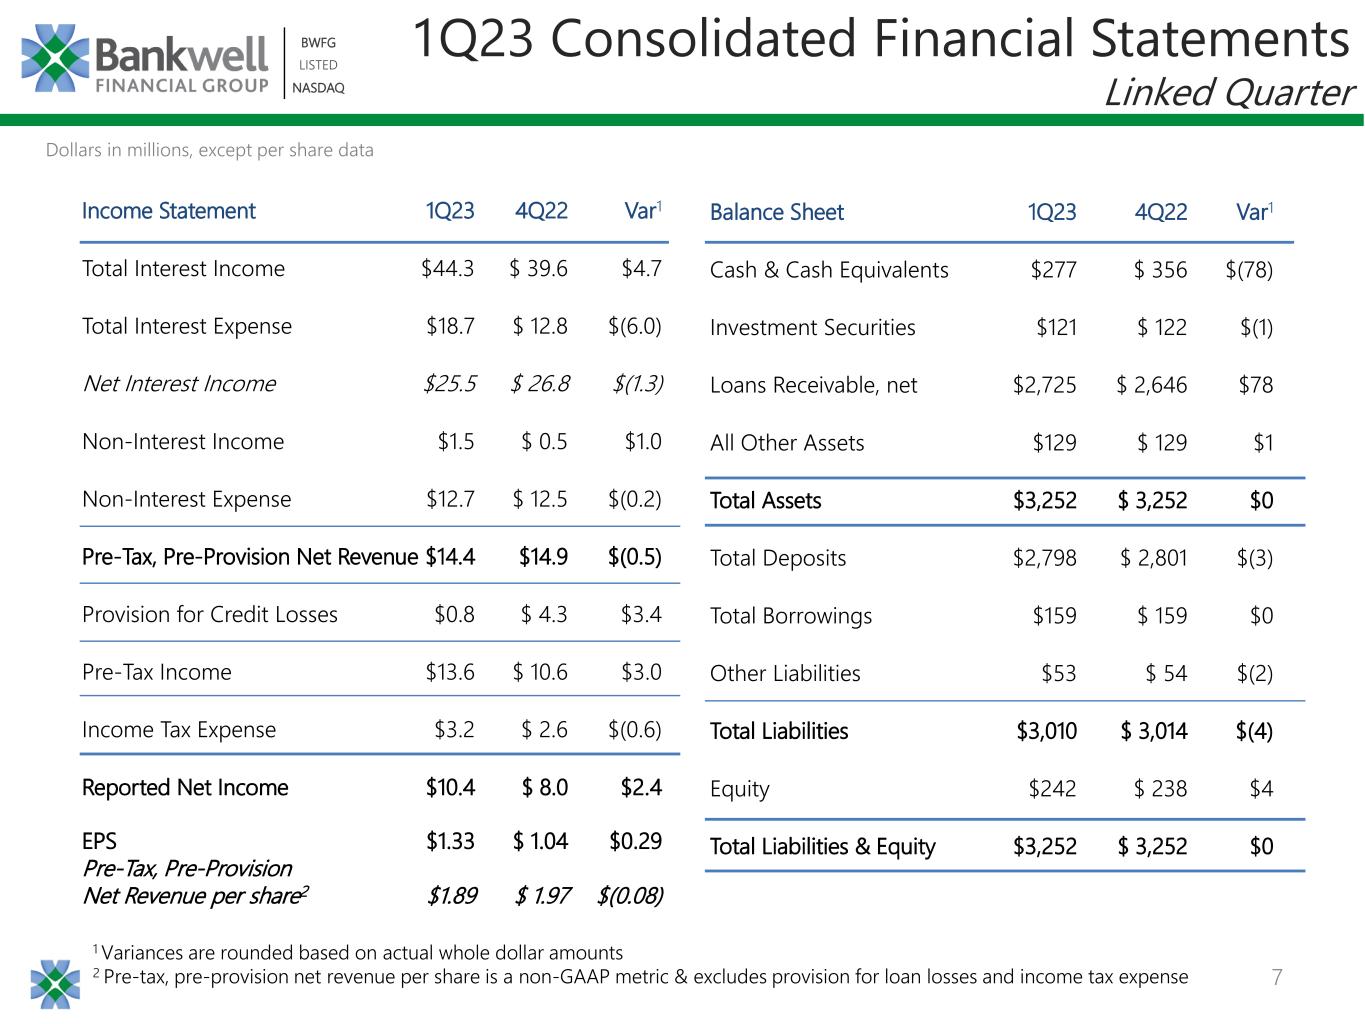
7 BWFG LISTED NASDAQ BWFG LISTED NASDAQ Income Statement 1Q23 4Q22 Var1 Total Interest Income $44.3 $ 39.6 $4.7 Total Interest Expense $18.7 $ 12.8 $(6.0) Net Interest Income $25.5 $ 26.8 $(1.3) Non-Interest Income $1.5 $ 0.5 $1.0 Non-Interest Expense $12.7 $ 12.5 $(0.2) Pre-Tax, Pre-Provision Net Revenue $14.4 $14.9 $(0.5) Provision for Credit Losses $0.8 $ 4.3 $3.4 Pre-Tax Income $13.6 $ 10.6 $3.0 Income Tax Expense $3.2 $ 2.6 $(0.6) Reported Net Income $10.4 $ 8.0 $2.4 EPS $1.33 $ 1.04 $0.29 Pre-Tax, Pre-Provision Net Revenue per share2 $1.89 $ 1.97 $(0.08) 1 Variances are rounded based on actual whole dollar amounts 2 Pre-tax, pre-provision net revenue per share is a non-GAAP metric & excludes provision for loan losses and income tax expense Dollars in millions, except per share data Balance Sheet 1Q23 4Q22 Var1 Cash & Cash Equivalents $277 $ 356 $(78) Investment Securities $121 $ 122 $(1) Loans Receivable, net $2,725 $ 2,646 $78 All Other Assets $129 $ 129 $1 Total Assets $3,252 $ 3,252 $0 Total Deposits $2,798 $ 2,801 $(3) Total Borrowings $159 $ 159 $0 Other Liabilities $53 $ 54 $(2) Total Liabilities $3,010 $ 3,014 $(4) Equity $242 $ 238 $4 Total Liabilities & Equity $3,252 $ 3,252 $0 1Q23 Consolidated Financial Statements Linked Quarter


8 BWFG LISTED NASDAQ BWFG LISTED NASDAQ Performance Trends $2.21 $2.31 $0.75 $3.36 $4.79 $1.33 2018 2019 2020 2021 2022 1Q23 Diluted EPS 0.94% 0.97% 0.28% 1.17% 1.44% 1.30% 2018 2019 2020 2021 2022 1Q23 Return on Average Assets 10.19% 10.20% 3.35% 13.86% 16.72% 17.48% 2018 2019 2020 2021 2022 1Q23 Return on Average Equity $21.85 $22.82 $21.96 $25.55 $30.51 $30.56 2018 2019 2020 2021 2022 1Q23 Fully Diluted Tangible Book Value 1 Includes $0.63 impact for the 1/1/23 CECL adjustment 1


9 BWFG LISTED NASDAQ BWFG LISTED NASDAQ 59.2% 60.2% 73.9% 53.9% 45.4% 46.9% 1.93% 1.90% 2.03% 1.75% 1.71% 1.59% 1.00% 1.20% 1.40% 1.60% 1.80% 2.00% 2.20% 2.40% 0.0% 10.0% 20.0% 30.0% 40.0% 50.0% 60.0% 70.0% 80.0% 2018 2019 2020 2021 2022 1Q23 Efficiency Ratio Non-interest Expense / Average Assets Efficiency Trends 1 A non-GAAP metric 1


BWFG | LISTED | NASDAQ Deposits & Liquidity


11 BWFG LISTED NASDAQ BWFG LISTED NASDAQ 16.2% 15.0% 16.7% 36.7% 36.7% 8.4% 6.1% 2.6% 2.7% 3.9% 75.5% 78.9% 80.6% 60.5% 59.4% $1,492 $1,827 $2,124 $2,801 $2,798 4Q19 4Q20 4Q21 4Q22 1Q23 Deposit Balances Brokered Deposits Retail CDs >$250k Core Deposits Deposit Balances 1 1 Core Deposits include Commercial and Consumer checking, savings and money market accounts, and retail CD under $250k 2 Wholesale Funding ratio defined as brokered deposits and FHLB borrowings to total assets Dollars in millions 20.6% 19.8% 16.4% 34.4% 34.5% Wholesale Funding ratio2 FHLB Borrowings $150 $175 $50 $90 $90


12 BWFG LISTED NASDAQ BWFG LISTED NASDAQ • NIM declining with inverted yield curve: • 3/31/2023 ‘exit rates’ of 5.88% on loans & 2.81% on deposits Net Interest Margin 3.03% 2.77% 3.17% 3.78% 3.24% 4.85% 4.48% 4.42% 5.10% 5.87% 1.66% 1.07% 0.54% 0.87% 2.47% 0.00% 0.50% 1.00% 1.50% 2.00% 2.50% 3.00% 3.50% 4.00% 0.00% 1.00% 2.00% 3.00% 4.00% 5.00% 6.00% 7.00% 8.00% 9.00% 10.00% 2019 2020 2021 2022 1Q23 Net Interest Margin Loan Yield Cost of Deposits 1 Includes origination fee amortization 1 3.30% 3.75% 3.96% 3.70% 3.24% 1Q22 2Q22 3Q22 4Q22 1Q23 Quarterly NIM


13 BWFG LISTED NASDAQ BWFG LISTED NASDAQ FDIC Insured Deposits 70% Uninsured Deposits 27% FHLB SBLOC Insured Deposits 3% Liquidity 1 Bank lines, including FHLB & FRB 2 Cash held with right of offset as collateral against loans Ample coverage of uninsured deposits • $2,051 million total insured deposits, including $1,967 million FDIC-insured deposits • Uninsured deposits include restricted funds held as loan collateral • 2X liquidity coverage on $748 million uninsured deposits: • 12% liquidity on balance sheet (Cash & AFS Securities) + Unencumbered Cash $267 + AFS Securities $103 + Borrowing Capacity1 $1,124 Immediately Available Liquidity $1,494 Total Deposits = $2,798 million Deposits Held as Loan Collateral 2%


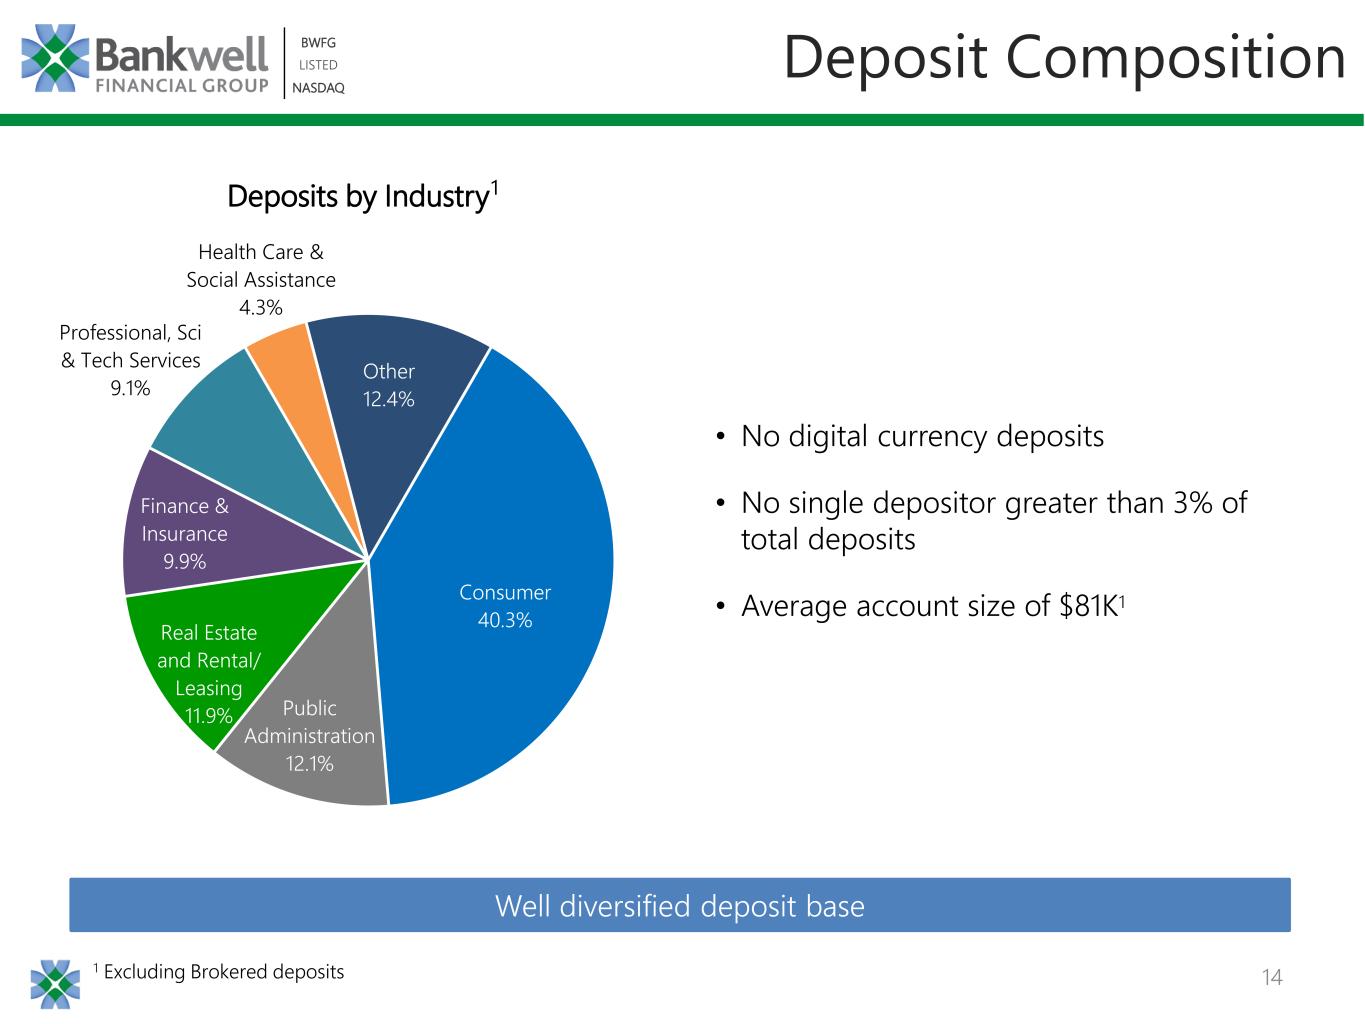
14 BWFG LISTED NASDAQ BWFG LISTED NASDAQ Deposit Composition • No digital currency deposits • No single depositor greater than 3% of total deposits • Average account size of $81K1 Consumer 40.3% Public Administration 12.1% Real Estate and Rental/ Leasing 11.9% Finance & Insurance 9.9% Professional, Sci & Tech Services 9.1% Health Care & Social Assistance 4.3% Other 12.4% Deposits by Industry 1 Excluding Brokered deposits 1 Well diversified deposit base


BWFG | LISTED | NASDAQ Loans


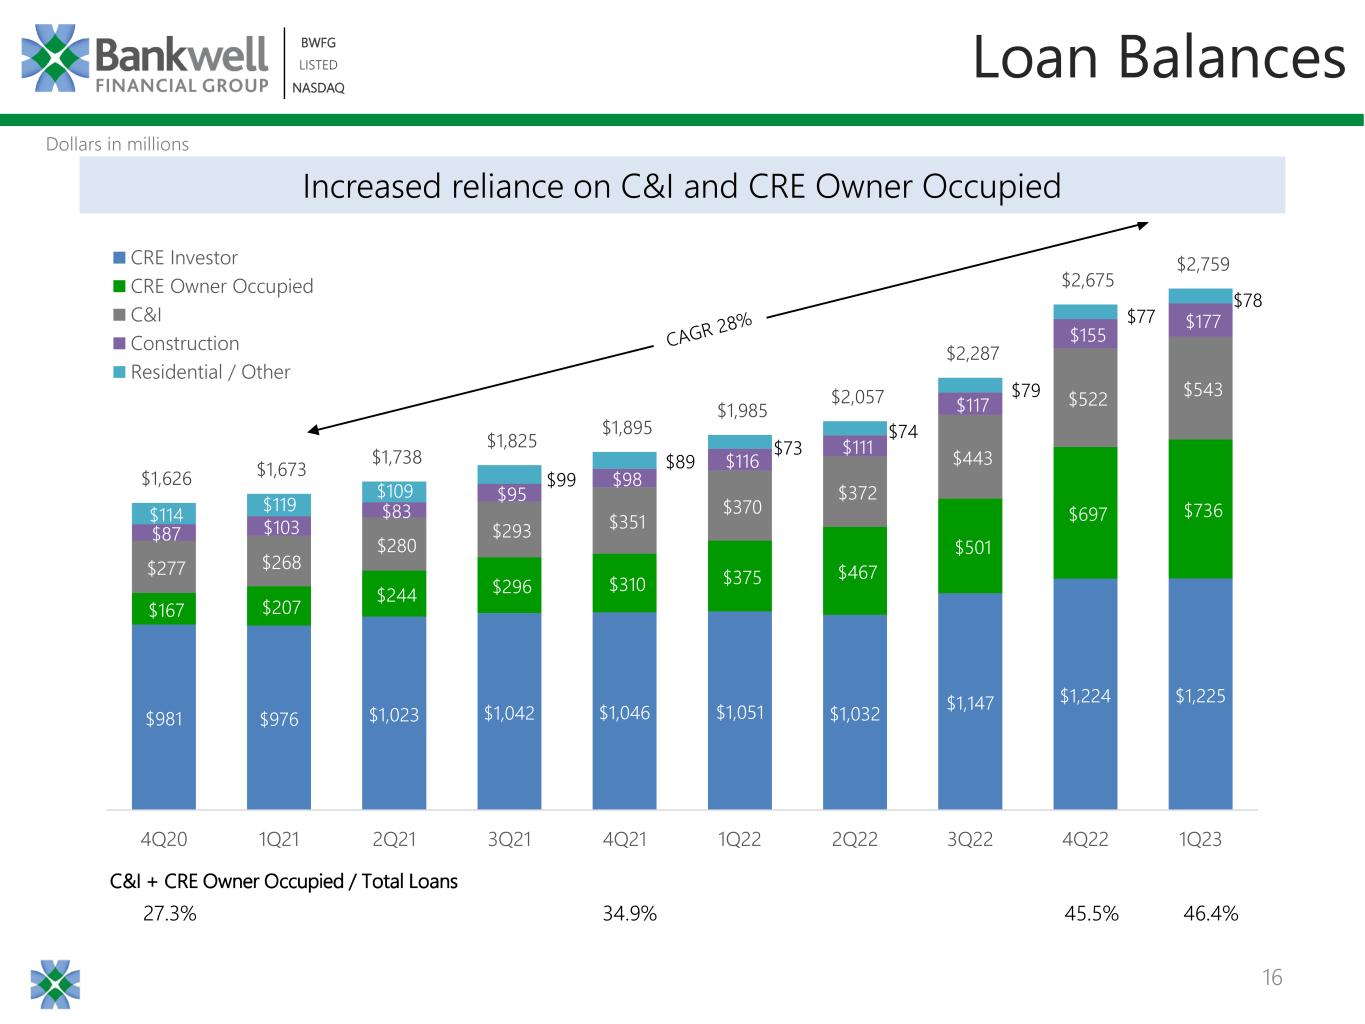
16 BWFG LISTED NASDAQ BWFG LISTED NASDAQ Loan Balances Increased reliance on C&I and CRE Owner Occupied Dollars in millions $981 $976 $1,023 $1,042 $1,046 $1,051 $1,032 $1,147 $1,224 $1,225 $167 $207 $244 $296 $310 $375 $467 $501 $697 $736 $277 $268 $280 $293 $351 $370 $372 $443 $522 $543 $87 $103 $83 $95 $98 $116 $111 $117 $155 $177 $114 $119 $109 $99 $89 $73 $74 $79 $77 $78 $1,626 $1,673 $1,738 $1,825 $1,895 $1,985 $2,057 $2,287 $2,675 $2,759 - 500 1,000 1,500 2,000 2,500 3,000 - 500 1,000 1,500 2,000 2,500 3,000 4Q20 1Q21 2Q21 3Q21 4Q21 1Q22 2Q22 3Q22 4Q22 1Q23 CRE Investor CRE Owner Occupied C&I Construction Residential / Other C&I + CRE Owner Occupied / Total Loans 27.3% 34.9% 45.5% 46.4%


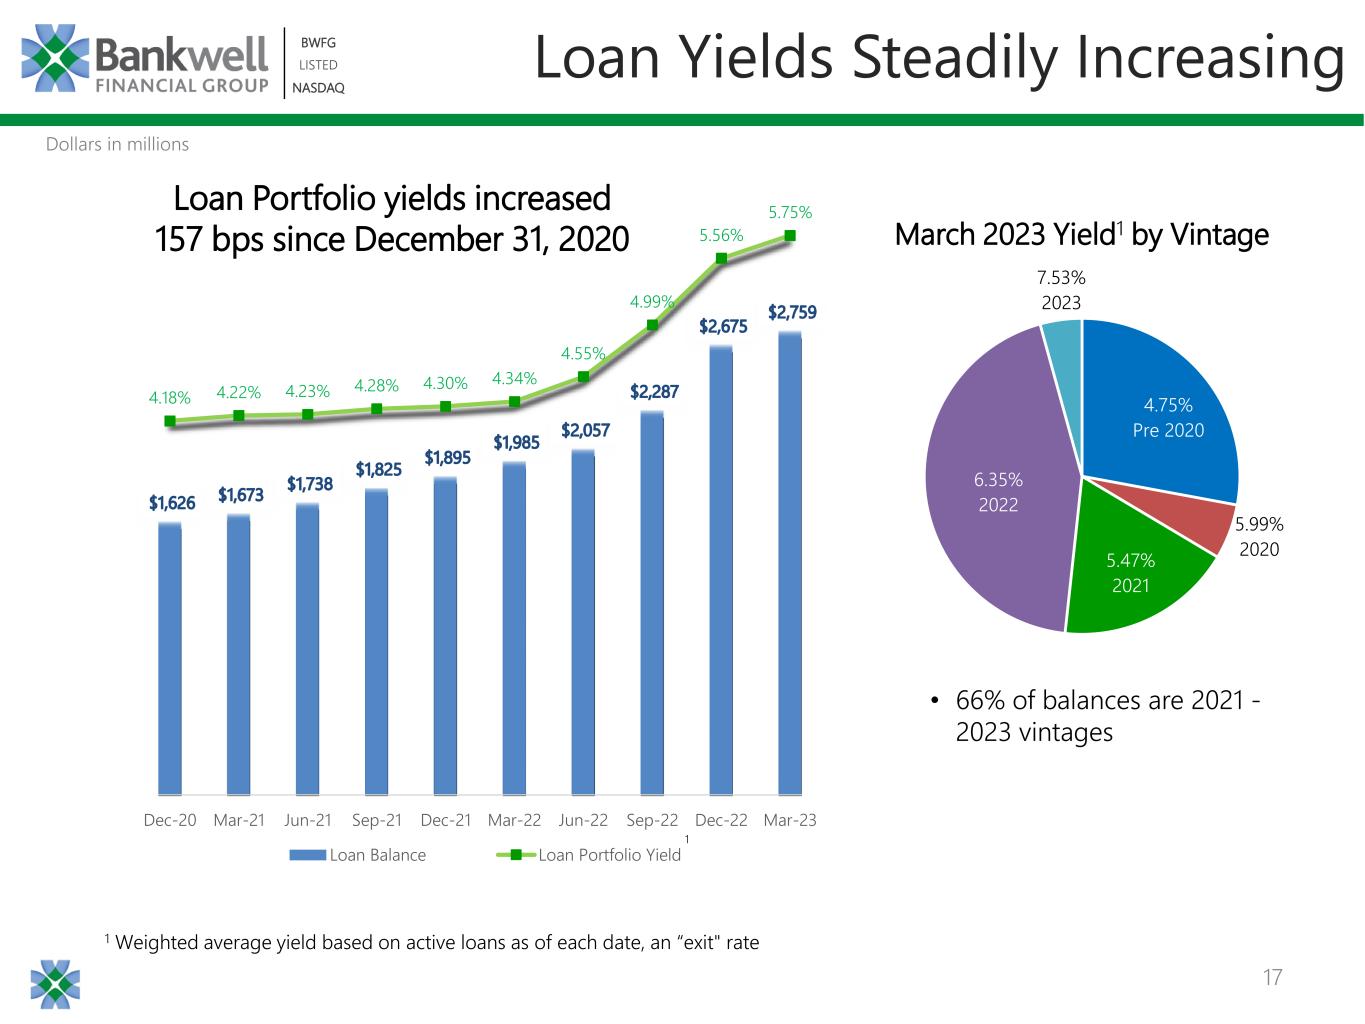
17 BWFG LISTED NASDAQ BWFG LISTED NASDAQ 4.18% 4.22% 4.23% 4.28% 4.30% 4.34% 4.55% 4.99% 5.56% 5.75% 1.00% 2.00% 3.00% 4.00% 5.00% 6.00% - 500 1,000 1,500 2,000 2,500 3,000 3,500 Dec-20 Mar-21 Jun-21 Sep-21 Dec-21 Mar-22 Jun-22 Sep-22 Dec-22 Mar-23 Loan Balance Loan Portfolio Yield Loan Yields Steadily Increasing 1 Weighted average yield based on active loans as of each date, an “exit" rate 1 Dollars in millions Loan Portfolio yields increased 157 bps since December 31, 2020 4.75% Pre 2020 5.99% 2020 5.47% 2021 6.35% 2022 7.53% 2023 • 66% of balances are 2021 - 2023 vintages March 2023 Yield1 by Vintage


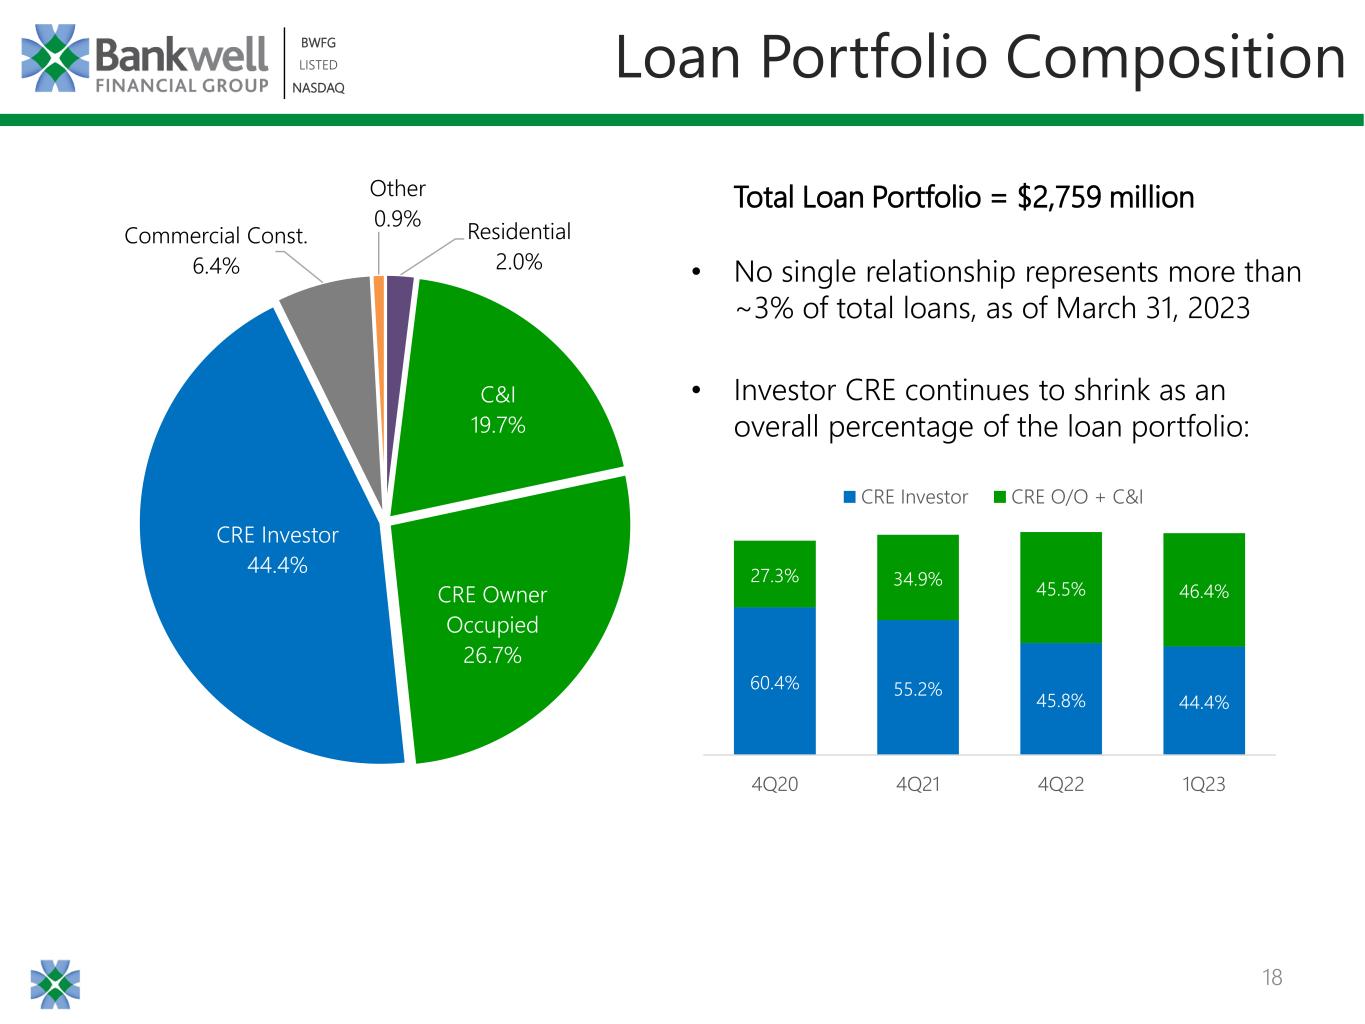
18 BWFG LISTED NASDAQ BWFG LISTED NASDAQ Residential 2.0% C&I 19.7% CRE Owner Occupied 26.7% CRE Investor 44.4% Commercial Const. 6.4% Other 0.9% • No single relationship represents more than ~3% of total loans, as of March 31, 2023 • Investor CRE continues to shrink as an overall percentage of the loan portfolio: Total Loan Portfolio = $2,759 million Loan Portfolio Composition 60.4% 55.2% 45.8% 44.4% 27.3% 34.9% 45.5% 46.4% 4Q20 4Q21 4Q22 1Q23 CRE Investor CRE O/O + C&I


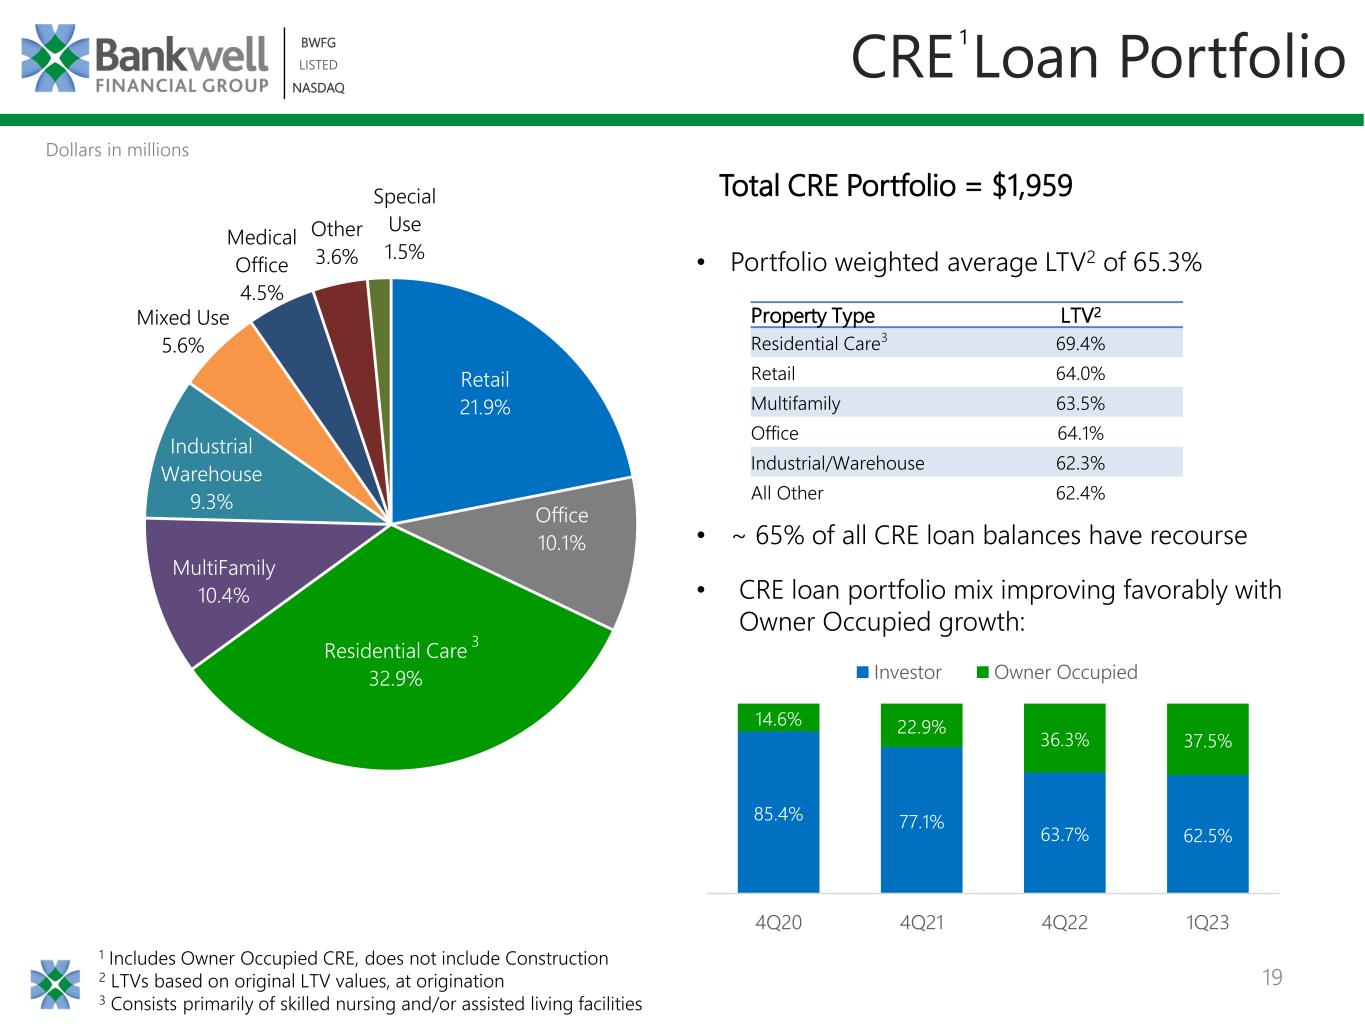
19 BWFG LISTED NASDAQ BWFG LISTED NASDAQ Total CRE Portfolio = $1,959 1 Includes Owner Occupied CRE, does not include Construction 2 LTVs based on original LTV values, at origination 3 Consists primarily of skilled nursing and/or assisted living facilities CRE Loan Portfolio Retail 21.9% Office 10.1% Residential Care 32.9% MultiFamily 10.4% Industrial Warehouse 9.3% Mixed Use 5.6% Medical Office 4.5% Other 3.6% Special Use 1.5% • Portfolio weighted average LTV2 of 65.3% • ~ 65% of all CRE loan balances have recourse • CRE loan portfolio mix improving favorably with Owner Occupied growth: 85.4% 77.1% 63.7% 62.5% 14.6% 22.9% 36.3% 37.5% 4Q20 4Q21 4Q22 1Q23 Investor Owner Occupied 1 Dollars in millions Property Type LTV2 Residential Care3 69.4% Retail 64.0% Multifamily 63.5% Office 64.1% Industrial/Warehouse 62.3% All Other 62.4% 3


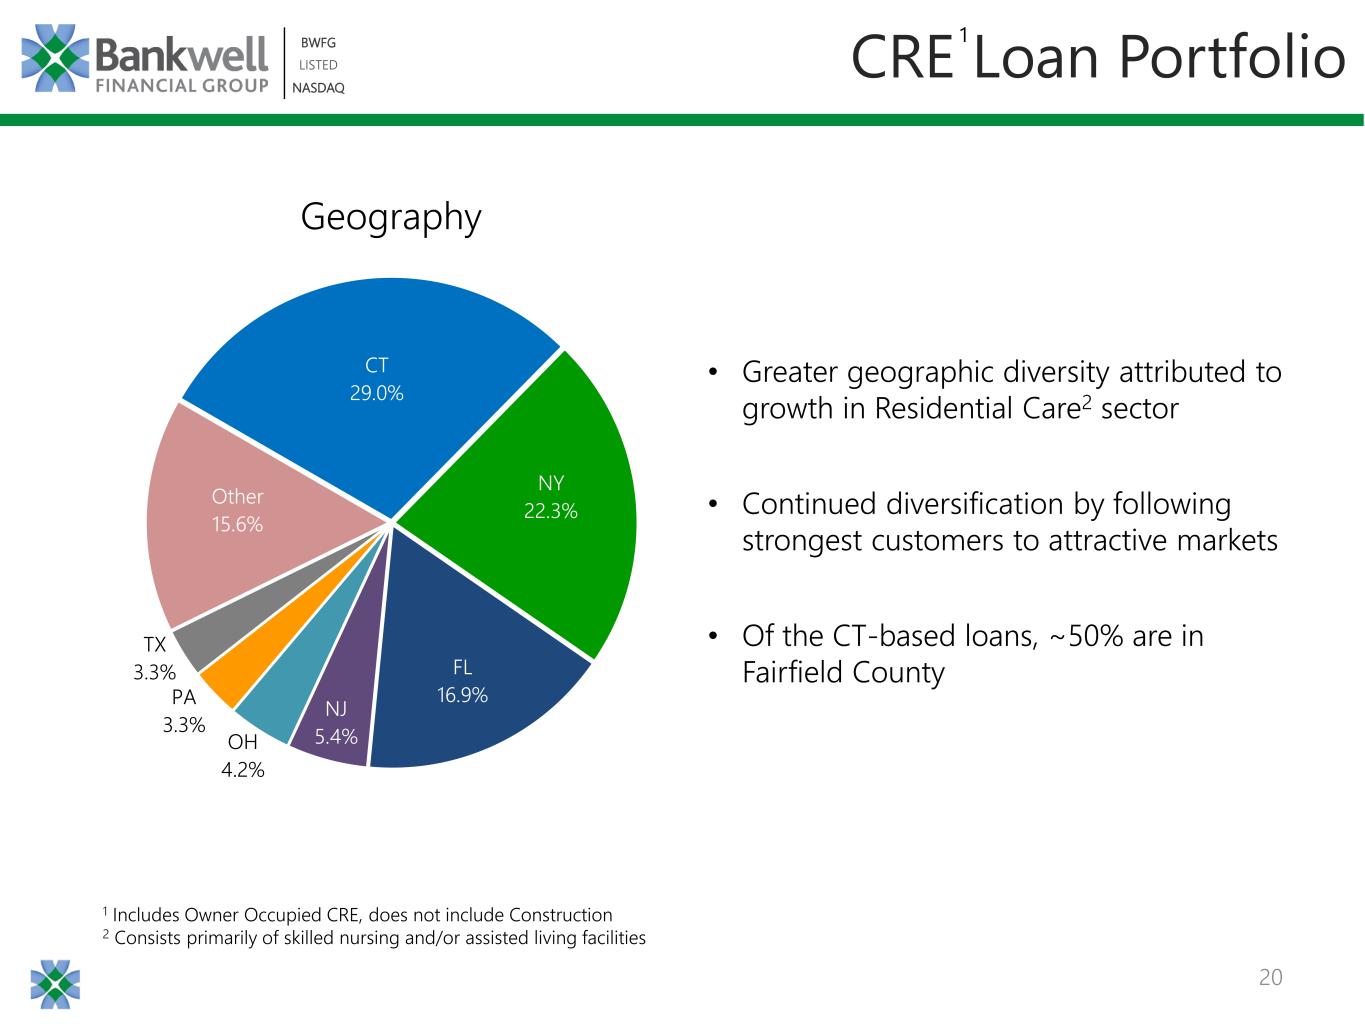
20 BWFG LISTED NASDAQ BWFG LISTED NASDAQ CT 29.0% NY 22.3% FL 16.9% NJ 5.4%OH 4.2% PA 3.3% TX 3.3% Other 15.6% 1 Includes Owner Occupied CRE, does not include Construction 2 Consists primarily of skilled nursing and/or assisted living facilities • Greater geographic diversity attributed to growth in Residential Care2 sector • Continued diversification by following strongest customers to attractive markets • Of the CT-based loans, ~50% are in Fairfield County 1 CRE Loan Portfolio Geography


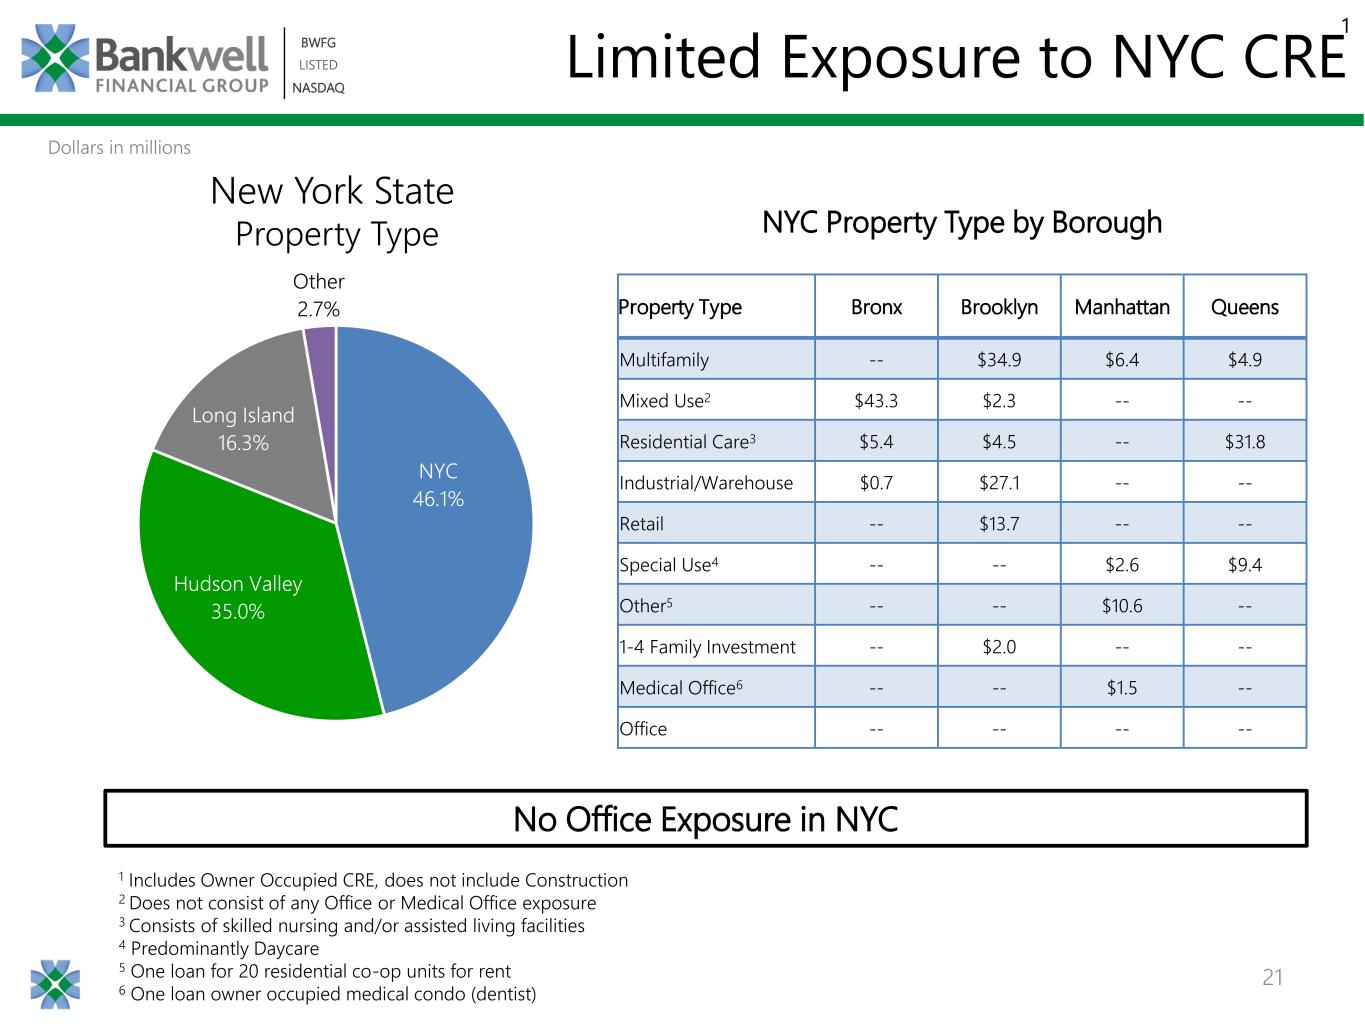
21 BWFG LISTED NASDAQ BWFG LISTED NASDAQ Limited Exposure to NYC CRE New York State Property Type NYC Property Type by Borough Dollars in millions 1 NYC 46.1% Hudson Valley 35.0% Long Island 16.3% Other 2.7% Property Type Bronx Brooklyn Manhattan Queens Multifamily -- $34.9 $6.4 $4.9 Mixed Use2 $43.3 $2.3 -- -- Residential Care3 $5.4 $4.5 -- $31.8 Industrial/Warehouse $0.7 $27.1 -- -- Retail -- $13.7 -- -- Special Use4 -- -- $2.6 $9.4 Other5 -- -- $10.6 -- 1-4 Family Investment -- $2.0 -- -- Medical Office6 -- -- $1.5 -- Office -- -- -- -- 1 Includes Owner Occupied CRE, does not include Construction 2 Does not consist of any Office or Medical Office exposure 3 Consists of skilled nursing and/or assisted living facilities 4 Predominantly Daycare 5 One loan for 20 residential co-op units for rent 6 One loan owner occupied medical condo (dentist) No Office Exposure in NYC


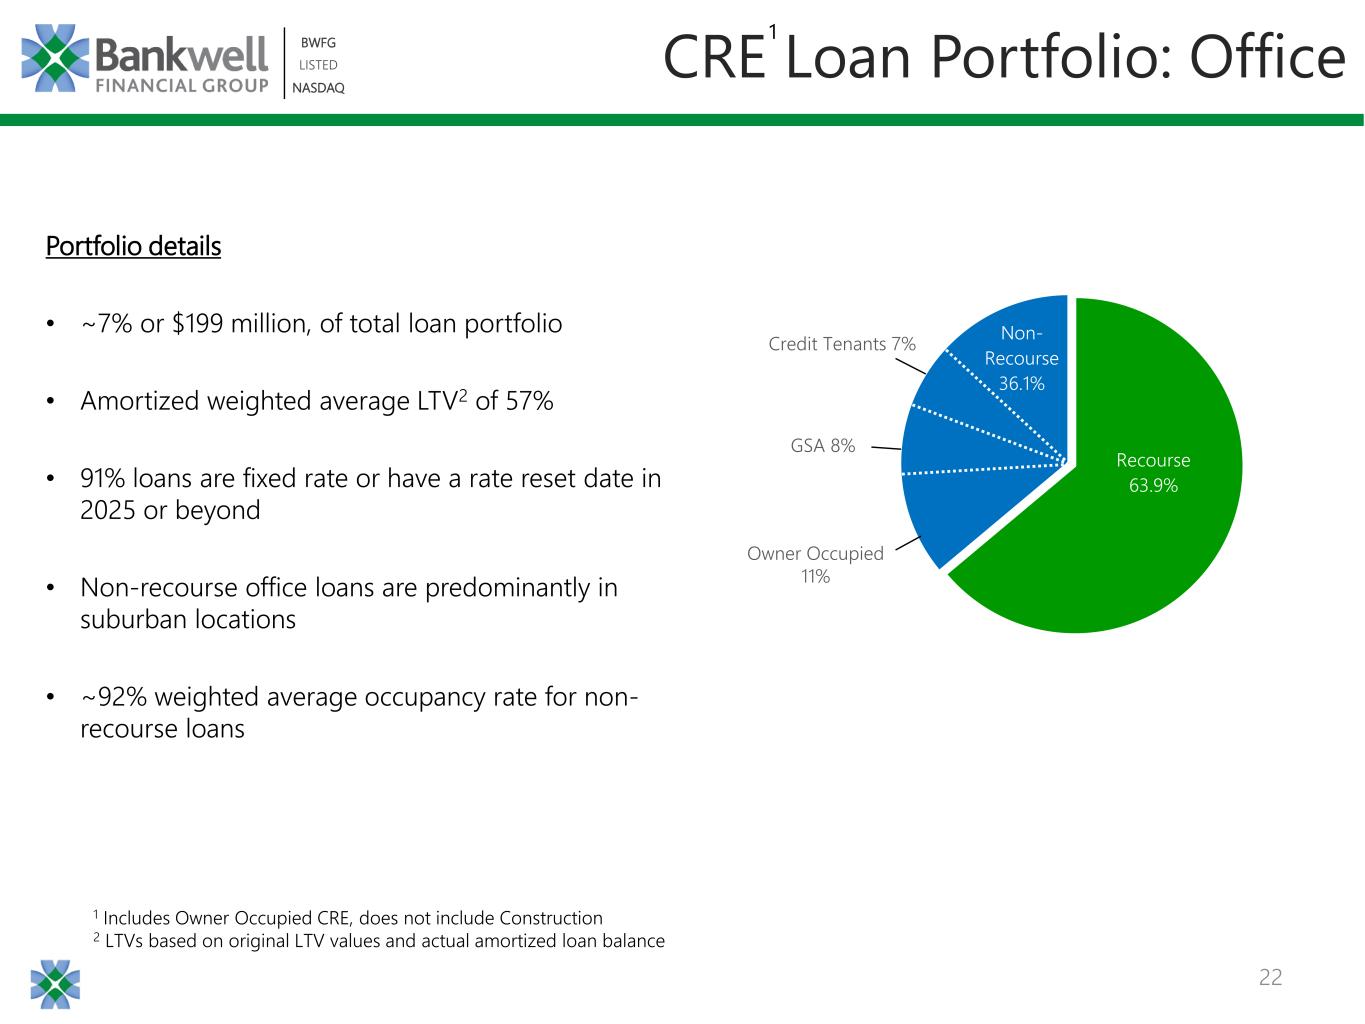
22 BWFG LISTED NASDAQ BWFG LISTED NASDAQ 1 Includes Owner Occupied CRE, does not include Construction 2 LTVs based on original LTV values and actual amortized loan balance CRE Loan Portfolio: Office Portfolio details • ~7% or $199 million, of total loan portfolio • Amortized weighted average LTV2 of 57% • 91% loans are fixed rate or have a rate reset date in 2025 or beyond • Non-recourse office loans are predominantly in suburban locations • ~92% weighted average occupancy rate for non- recourse loans Recourse 63.9% Non- Recourse 36.1% 1 GSA 8% Owner Occupied 11% Credit Tenants 7%


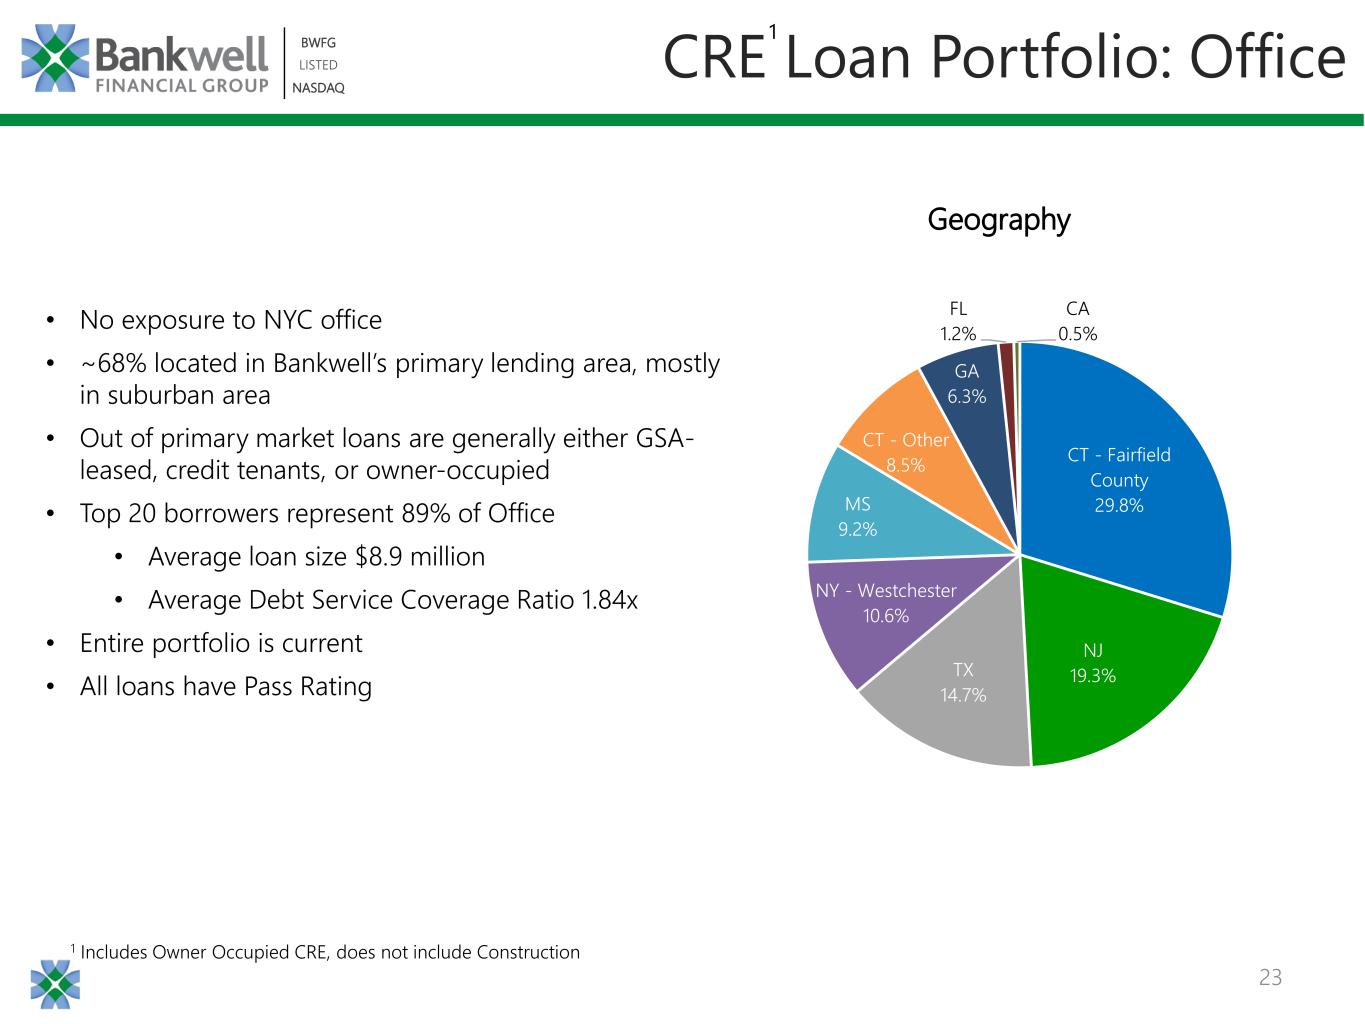
23 BWFG LISTED NASDAQ BWFG LISTED NASDAQ 1 CRE Loan Portfolio: Office • No exposure to NYC office • ~68% located in Bankwell’s primary lending area, mostly in suburban area • Out of primary market loans are generally either GSA- leased, credit tenants, or owner-occupied • Top 20 borrowers represent 89% of Office • Average loan size $8.9 million • Average Debt Service Coverage Ratio 1.84x • Entire portfolio is current • All loans have Pass Rating Geography 1 Includes Owner Occupied CRE, does not include Construction CT - Fairfield County 29.8% NJ 19.3%TX 14.7% NY - Westchester 10.6% MS 9.2% CT - Other 8.5% GA 6.3% FL 1.2% CA 0.5%


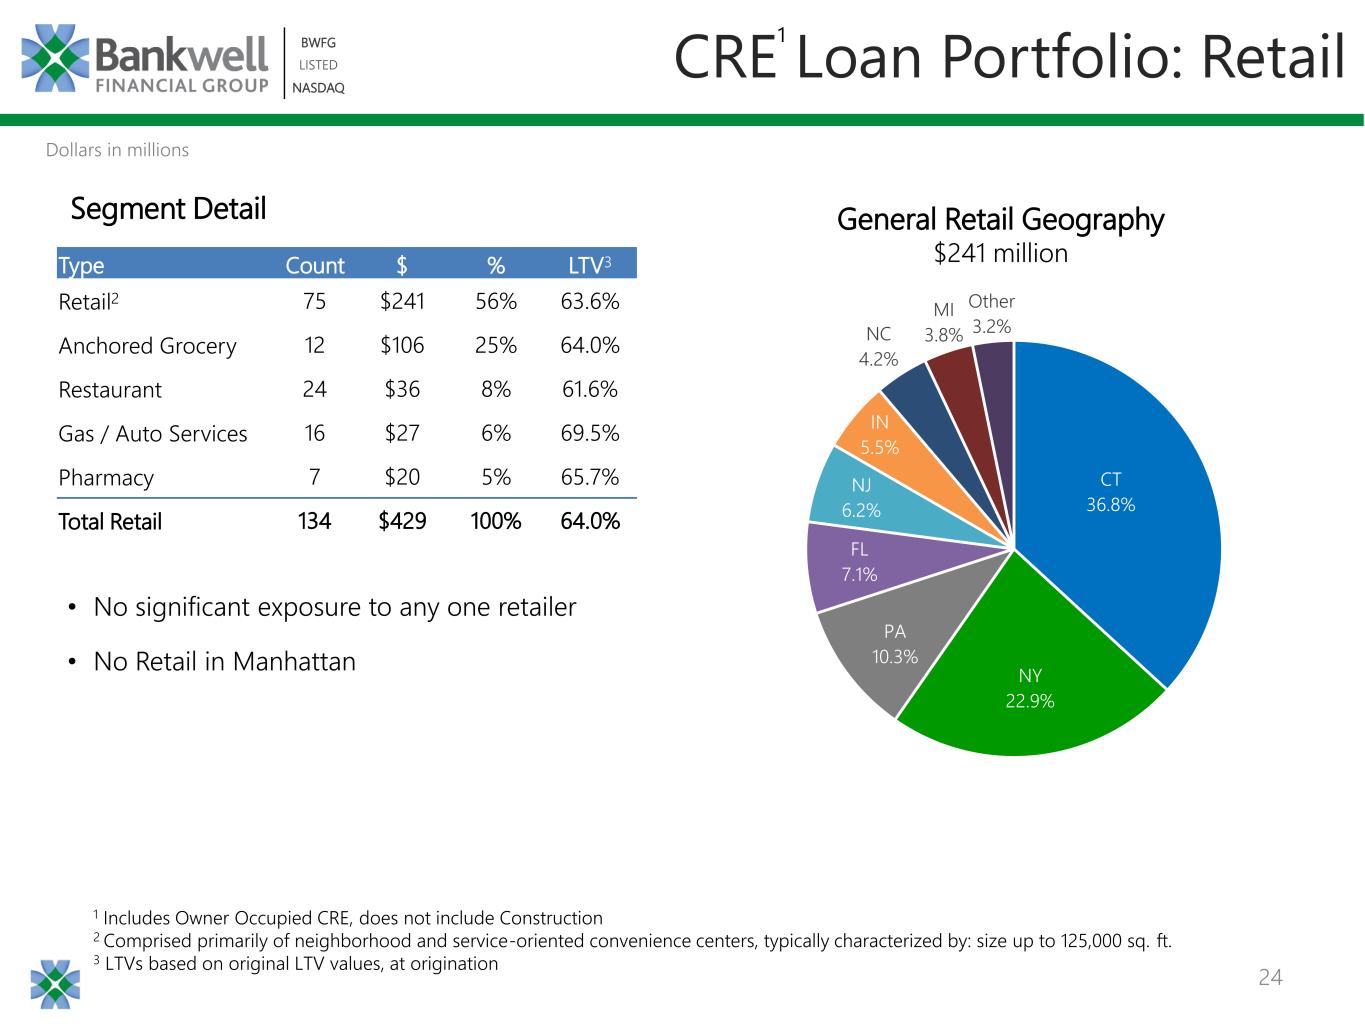
24 BWFG LISTED NASDAQ BWFG LISTED NASDAQ 1 Includes Owner Occupied CRE, does not include Construction 2 Comprised primarily of neighborhood and service-oriented convenience centers, typically characterized by: size up to 125,000 sq. ft. 3 LTVs based on original LTV values, at origination Type Count $ % LTV3 Retail2 75 $241 56% 63.6% Anchored Grocery 12 $106 25% 64.0% Restaurant 24 $36 8% 61.6% Gas / Auto Services 16 $27 6% 69.5% Pharmacy 7 $20 5% 65.7% Total Retail 134 $429 100% 64.0% Segment Detail • No significant exposure to any one retailer • No Retail in Manhattan CRE Loan Portfolio: Retail Dollars in millions 1 CT 36.8% NY 22.9% PA 10.3% FL 7.1% NJ 6.2% IN 5.5% NC 4.2% MI 3.8% Other 3.2% General Retail Geography $241 million


25 BWFG LISTED NASDAQ BWFG LISTED NASDAQ C&I Loan Portfolio Loans by Industry Type Total C&I Portfolio = $543 million Finance 20% Insurance (Primarily Brokers) 26%Health Care & Social Assistance 31% Admin & Support, Waste Mgmt, Remediation Svcs 4% Construction 4% Real Estate and Rental/Leasing 3% Arts, Entertainment & Recreation 3% Manufacturing 2% Other 7% 1 1 Does not Include Owner Occupied CRE • 84% of C&I Portfolio has recourse • 89% of Health Care Loans have recourse - Primarily consists of working capital lines secured by accounts receivable • Insurance lending primarily to brokers of home and auto insurance


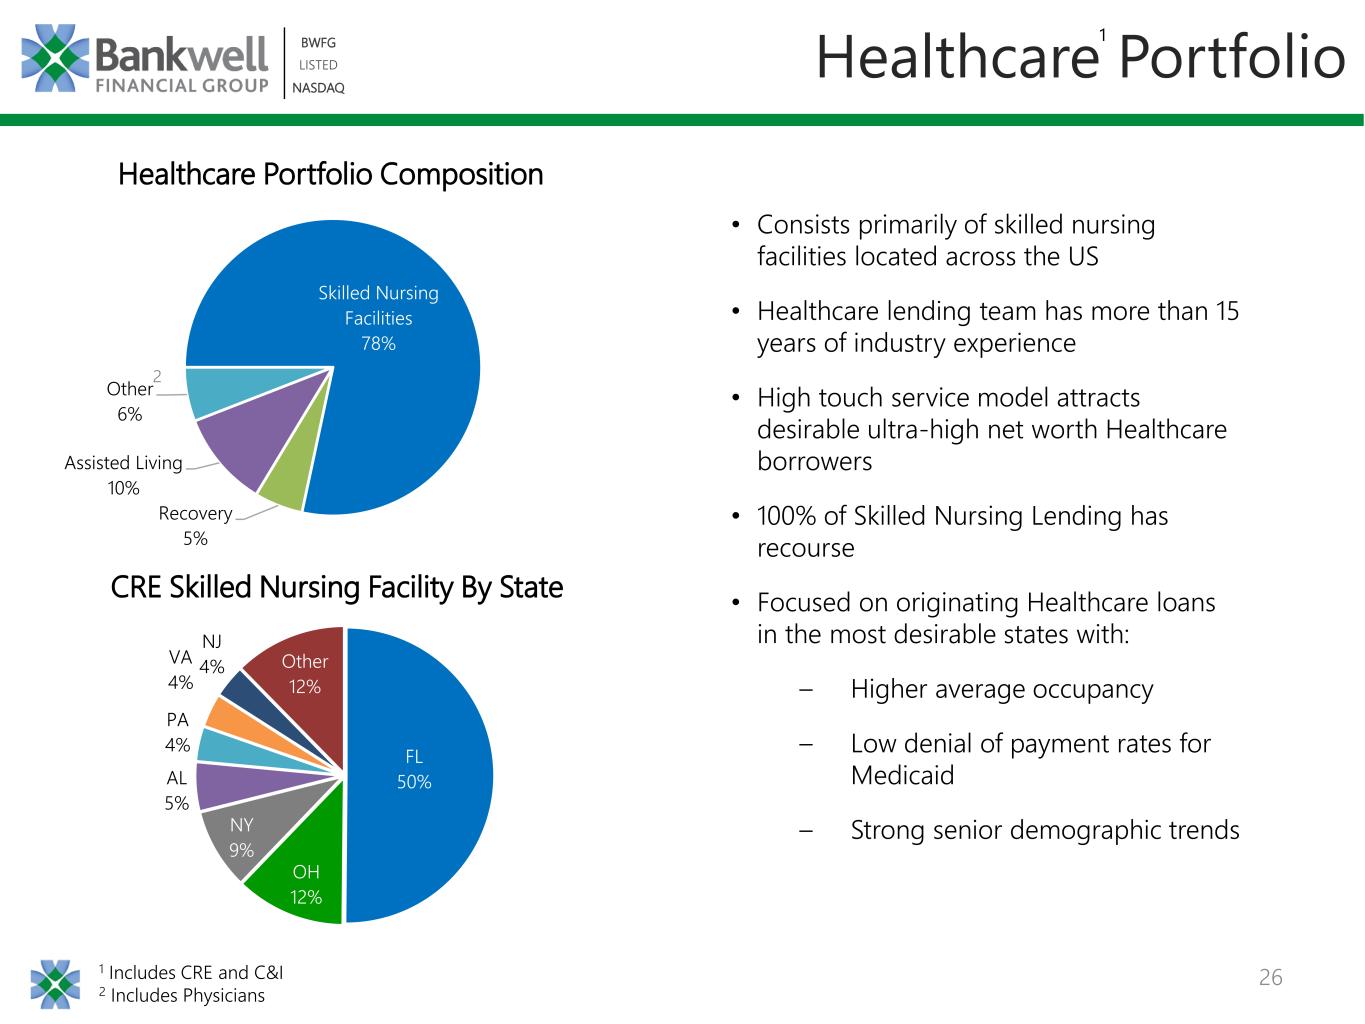
26 BWFG LISTED NASDAQ BWFG LISTED NASDAQ Healthcare Portfolio Healthcare Portfolio Composition CRE Skilled Nursing Facility By State • Consists primarily of skilled nursing facilities located across the US • Healthcare lending team has more than 15 years of industry experience • High touch service model attracts desirable ultra-high net worth Healthcare borrowers • 100% of Skilled Nursing Lending has recourse • Focused on originating Healthcare loans in the most desirable states with: – Higher average occupancy – Low denial of payment rates for Medicaid – Strong senior demographic trends Skilled Nursing Facilities 78% Recovery 5% Assisted Living 10% Other 6% 1 Includes CRE and C&I 2 Includes Physicians 2 FL 50% OH 12% NY 9% AL 5% PA 4% VA 4% NJ 4% Other 12% 1


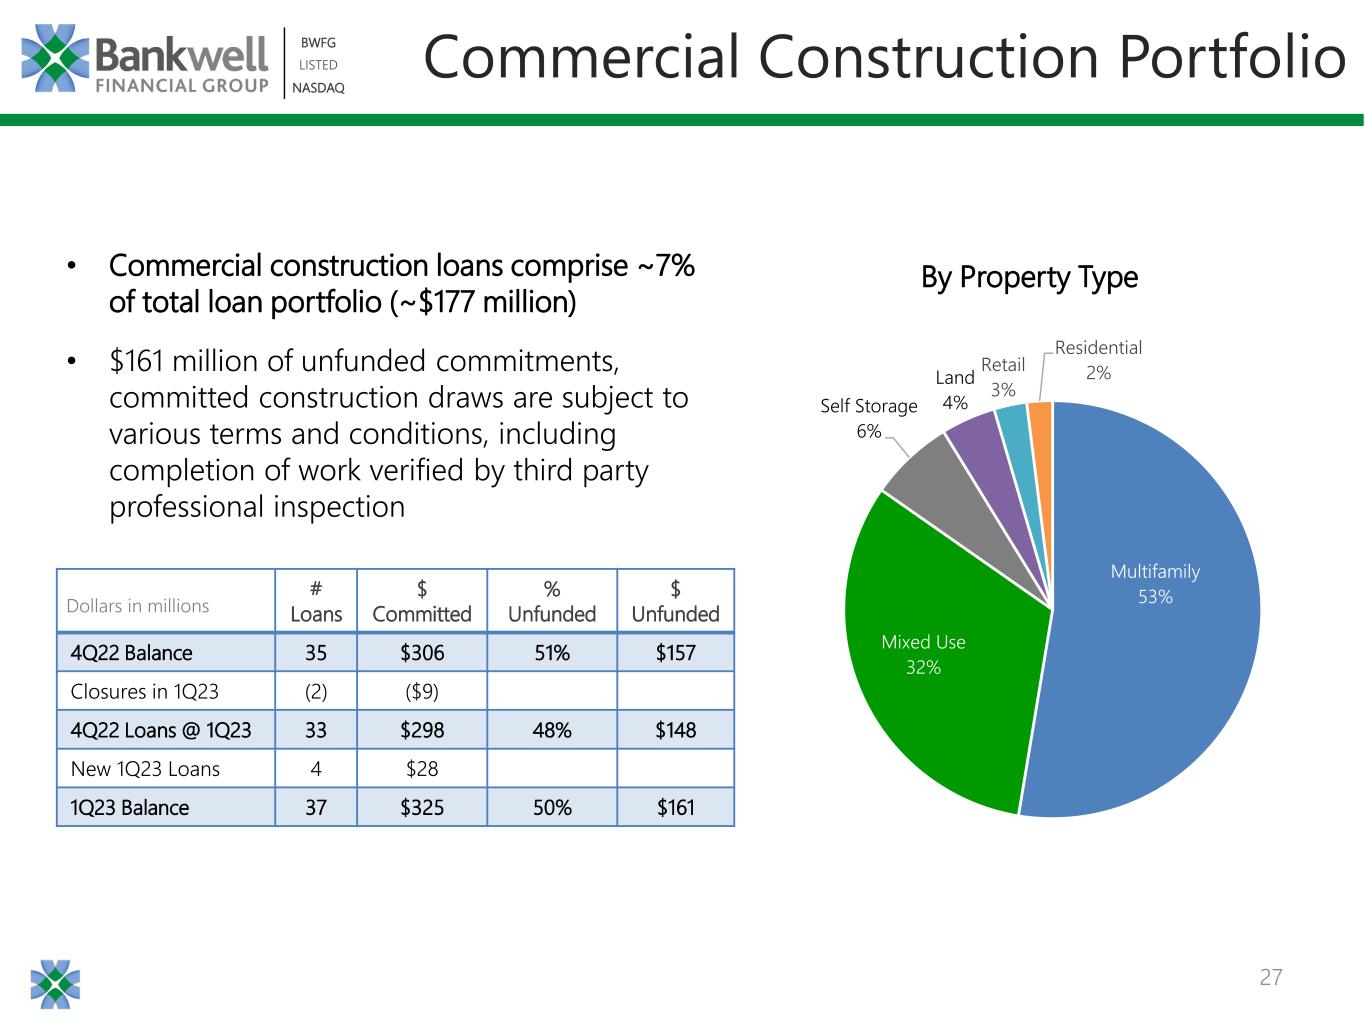
27 BWFG LISTED NASDAQ BWFG LISTED NASDAQ Commercial Construction Portfolio • Commercial construction loans comprise ~7% of total loan portfolio (~$177 million) • $161 million of unfunded commitments, committed construction draws are subject to various terms and conditions, including completion of work verified by third party professional inspection Dollars in millions By Property Type # Loans $ Committed % Unfunded $ Unfunded 4Q22 Balance 35 $306 51% $157 Closures in 1Q23 (2) ($9) 4Q22 Loans @ 1Q23 33 $298 48% $148 New 1Q23 Loans 4 $28 1Q23 Balance 37 $325 50% $161 Multifamily 53% Mixed Use 32% Self Storage 6% Land 4% Retail 3% Residential 2%


BWFG | LISTED | NASDAQ Credit Quality & Capital


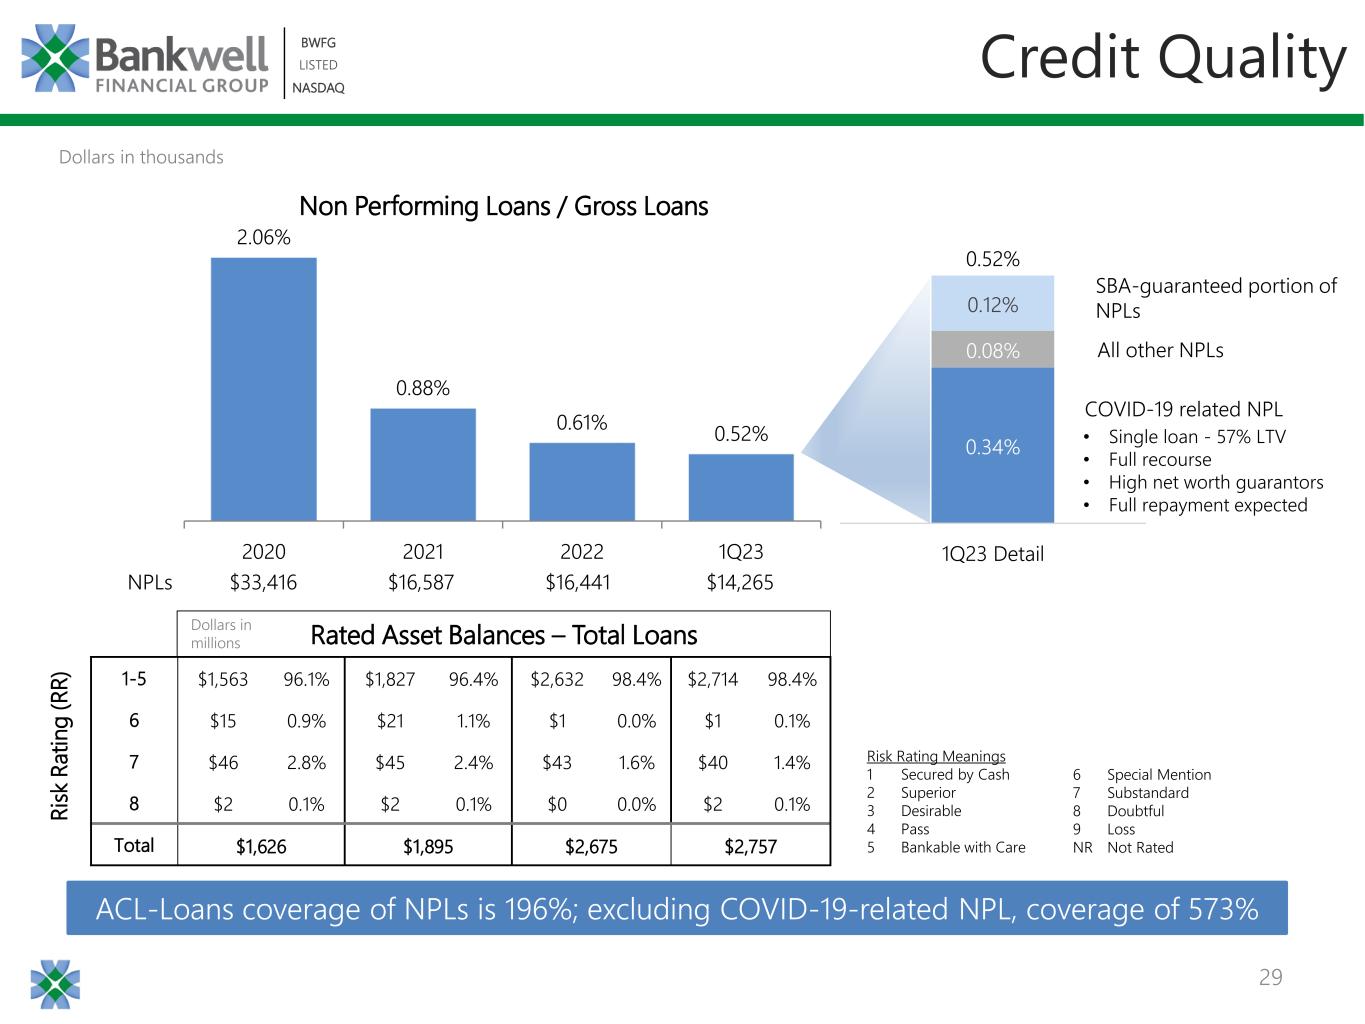
29 BWFG LISTED NASDAQ BWFG LISTED NASDAQ Credit Quality 2.06% 0.88% 0.61% 0.52% 2020 2021 2022 1Q23 Non Performing Loans / Gross Loans NPLs $33,416 $16,587 $16,441 $14,265 0.34% 0.08% 0.12% 1Q23 Detail 0.52% SBA-guaranteed portion of NPLs All other NPLs ACL-Loans coverage of NPLs is 196%; excluding COVID-19-related NPL, coverage of 573% COVID-19 related NPL Dollars in thousands • Single loan - 57% LTV • Full recourse • High net worth guarantors • Full repayment expected 1-5 $1,563 96.1% $1,827 96.4% $2,632 98.4% $2,714 98.4% 6 $15 0.9% $21 1.1% $1 0.0% $1 0.1% 7 $46 2.8% $45 2.4% $43 1.6% $40 1.4% 8 $2 0.1% $2 0.1% $0 0.0% $2 0.1% Total $1,626 $1,895 $2,675 $2,757 R is k R a ti n g ( R R ) Rated Asset Balances – Total Loans Risk Rating Meanings 1 Secured by Cash 2 Superior 3 Desirable 4 Pass 5 Bankable with Care 6 Special Mention 7 Substandard 8 Doubtful 9 Loss NR Not Rated Dollars in millions


30 BWFG LISTED NASDAQ BWFG LISTED NASDAQ Fully Diluted Tangible Book Value 1 Misc includes items such as, but not limited to, changes related to stock grants and share count 1Q23 TBV / Share Walk • Existing interest rate swaps hedging impact of unrealized losses in AFS Securities portfolio: ‒ AFS Securities ($6.1) million ‒ Interest Rate Swaps $5.0 million • $4.9 million 1/1/23 CECL adjustment 1 $30.51 $30.56 $1.33 $0.20 $0.12 $0.63 $0.32 2022 Net Income Dividends AOCI CECL 1/1 Misc 1Q23


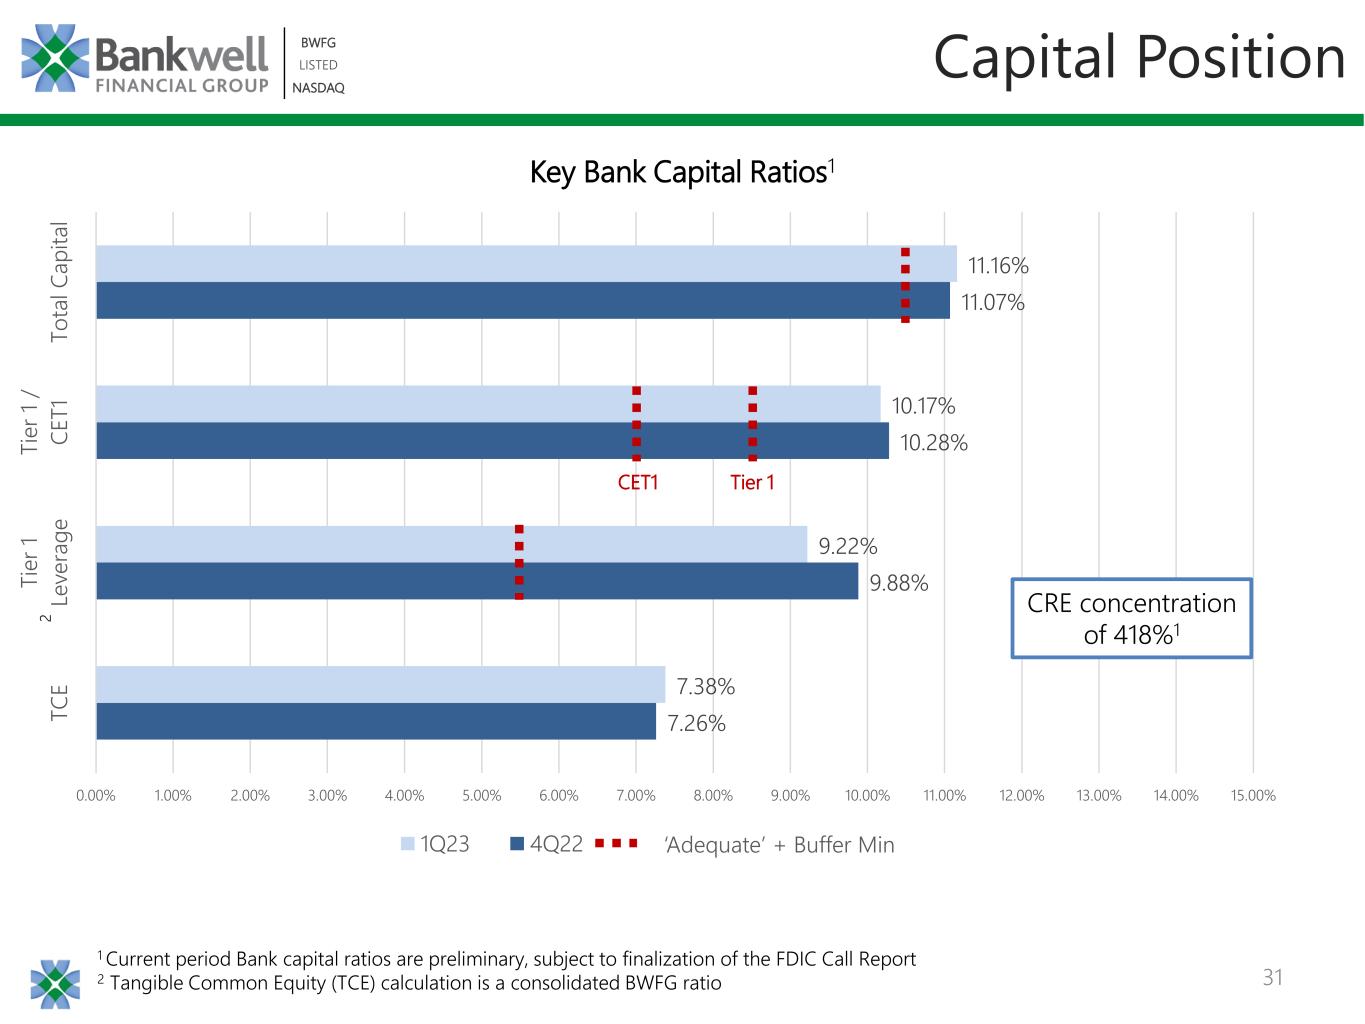
31 BWFG LISTED NASDAQ BWFG LISTED NASDAQ Capital Position 7.26% 9.88% 10.28% 11.07% 7.38% 9.22% 10.17% 11.16% 0.00% 1.00% 2.00% 3.00% 4.00% 5.00% 6.00% 7.00% 8.00% 9.00% 10.00% 11.00% 12.00% 13.00% 14.00% 15.00% T C E T ie r 1 Le ve ra g e T ie r 1 / C E T 1 T o ta l C a p it a l 1Q23 4Q22 ‘Adequate’ + Buffer Min 2 Tier 1CET1 CRE concentration of 418%1 1 Current period Bank capital ratios are preliminary, subject to finalization of the FDIC Call Report 2 Tangible Common Equity (TCE) calculation is a consolidated BWFG ratio Key Bank Capital Ratios1


BWFG | LISTED | NASDAQ History & Overview


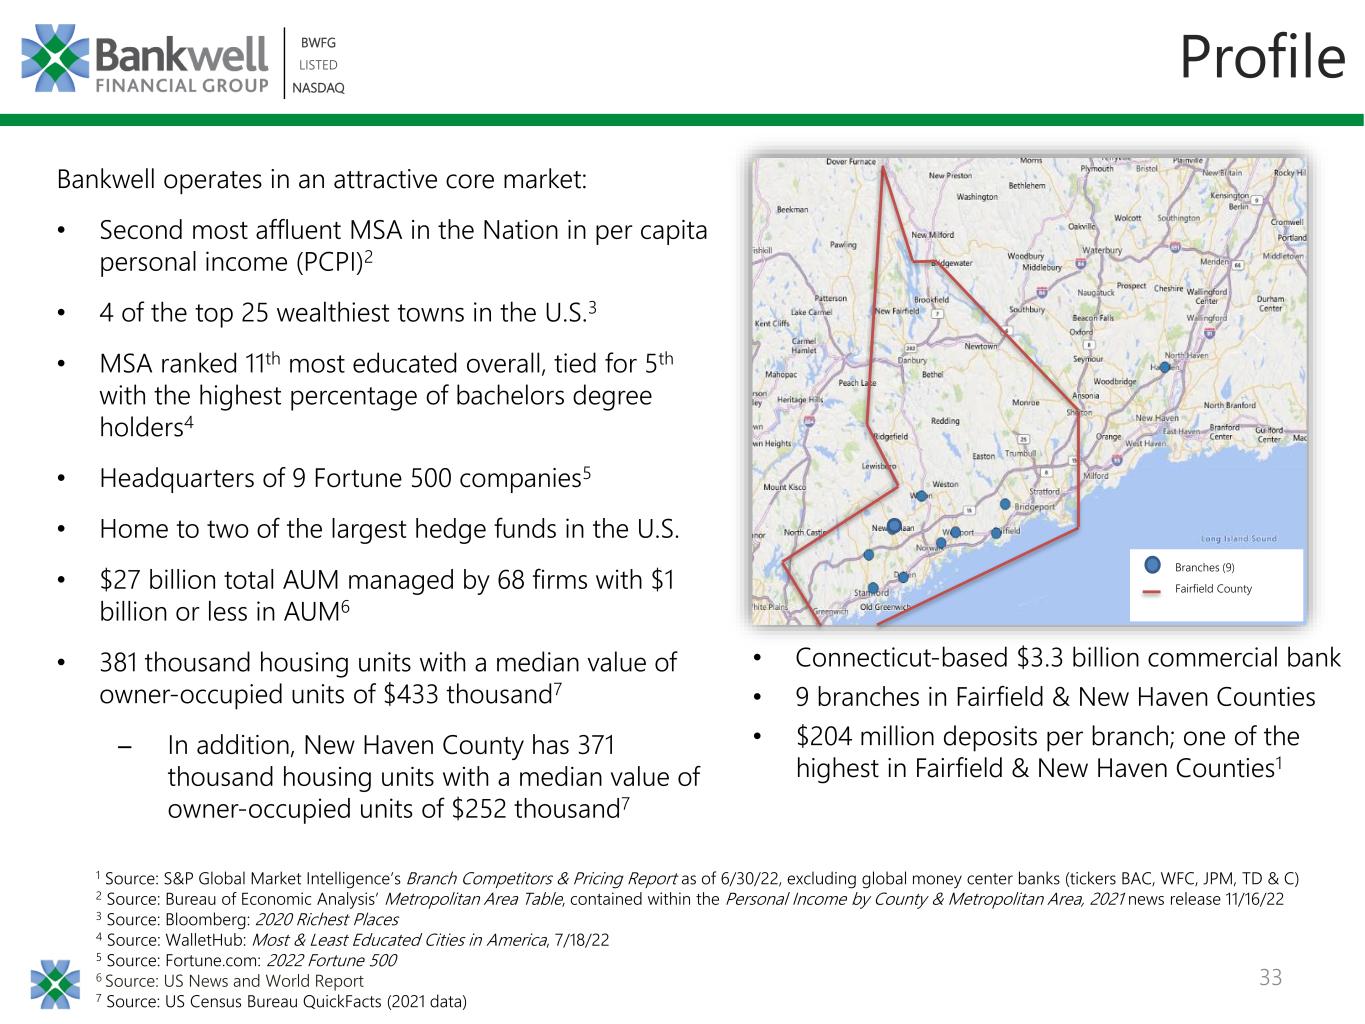
33 BWFG LISTED NASDAQ BWFG LISTED NASDAQ Bankwell operates in an attractive core market: • Second most affluent MSA in the Nation in per capita personal income (PCPI)2 • 4 of the top 25 wealthiest towns in the U.S.3 • MSA ranked 11th most educated overall, tied for 5th with the highest percentage of bachelors degree holders4 • Headquarters of 9 Fortune 500 companies5 • Home to two of the largest hedge funds in the U.S. • $27 billion total AUM managed by 68 firms with $1 billion or less in AUM6 • 381 thousand housing units with a median value of owner-occupied units of $433 thousand7 ̶ In addition, New Haven County has 371 thousand housing units with a median value of owner-occupied units of $252 thousand7 1 Source: S&P Global Market Intelligence’s Branch Competitors & Pricing Report as of 6/30/22, excluding global money center banks (tickers BAC, WFC, JPM, TD & C) 2 Source: Bureau of Economic Analysis’ Metropolitan Area Table, contained within the Personal Income by County & Metropolitan Area, 2021 news release 11/16/22 3 Source: Bloomberg: 2020 Richest Places 4 Source: WalletHub: Most & Least Educated Cities in America, 7/18/22 5 Source: Fortune.com: 2022 Fortune 500 6 Source: US News and World Report 7 Source: US Census Bureau QuickFacts (2021 data) Branches (9) Fairfield County Profile • Connecticut-based $3.3 billion commercial bank • 9 branches in Fairfield & New Haven Counties • $204 million deposits per branch; one of the highest in Fairfield & New Haven Counties1


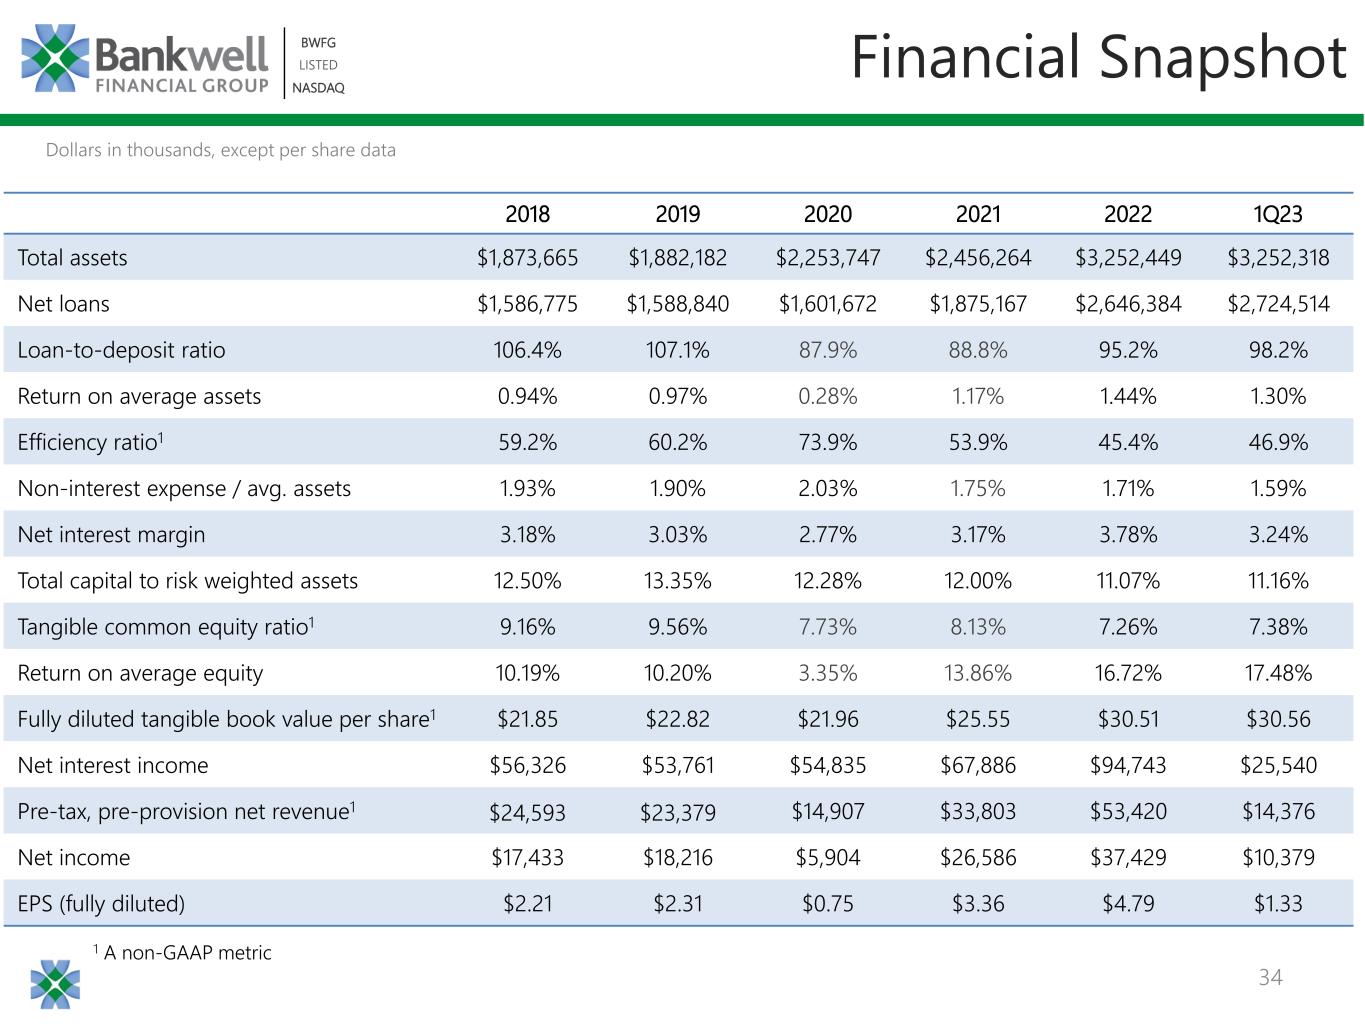
34 BWFG LISTED NASDAQ BWFG LISTED NASDAQ Financial Snapshot 2018 2019 2020 2021 2022 1Q23 Total assets $1,873,665 $1,882,182 $2,253,747 $2,456,264 $3,252,449 $3,252,318 Net loans $1,586,775 $1,588,840 $1,601,672 $1,875,167 $2,646,384 $2,724,514 Loan-to-deposit ratio 106.4% 107.1% 87.9% 88.8% 95.2% 98.2% Return on average assets 0.94% 0.97% 0.28% 1.17% 1.44% 1.30% Efficiency ratio1 59.2% 60.2% 73.9% 53.9% 45.4% 46.9% Non-interest expense / avg. assets 1.93% 1.90% 2.03% 1.75% 1.71% 1.59% Net interest margin 3.18% 3.03% 2.77% 3.17% 3.78% 3.24% Total capital to risk weighted assets 12.50% 13.35% 12.28% 12.00% 11.07% 11.16% Tangible common equity ratio1 9.16% 9.56% 7.73% 8.13% 7.26% 7.38% Return on average equity 10.19% 10.20% 3.35% 13.86% 16.72% 17.48% Fully diluted tangible book value per share1 $21.85 $22.82 $21.96 $25.55 $30.51 $30.56 Net interest income $56,326 $53,761 $54,835 $67,886 $94,743 $25,540 Pre-tax, pre-provision net revenue1 $24,593 $23,379 $14,907 $33,803 $53,420 $14,376 Net income $17,433 $18,216 $5,904 $26,586 $37,429 $10,379 EPS (fully diluted) $2.21 $2.31 $0.75 $3.36 $4.79 $1.33 1 A non-GAAP metric Dollars in thousands, except per share data


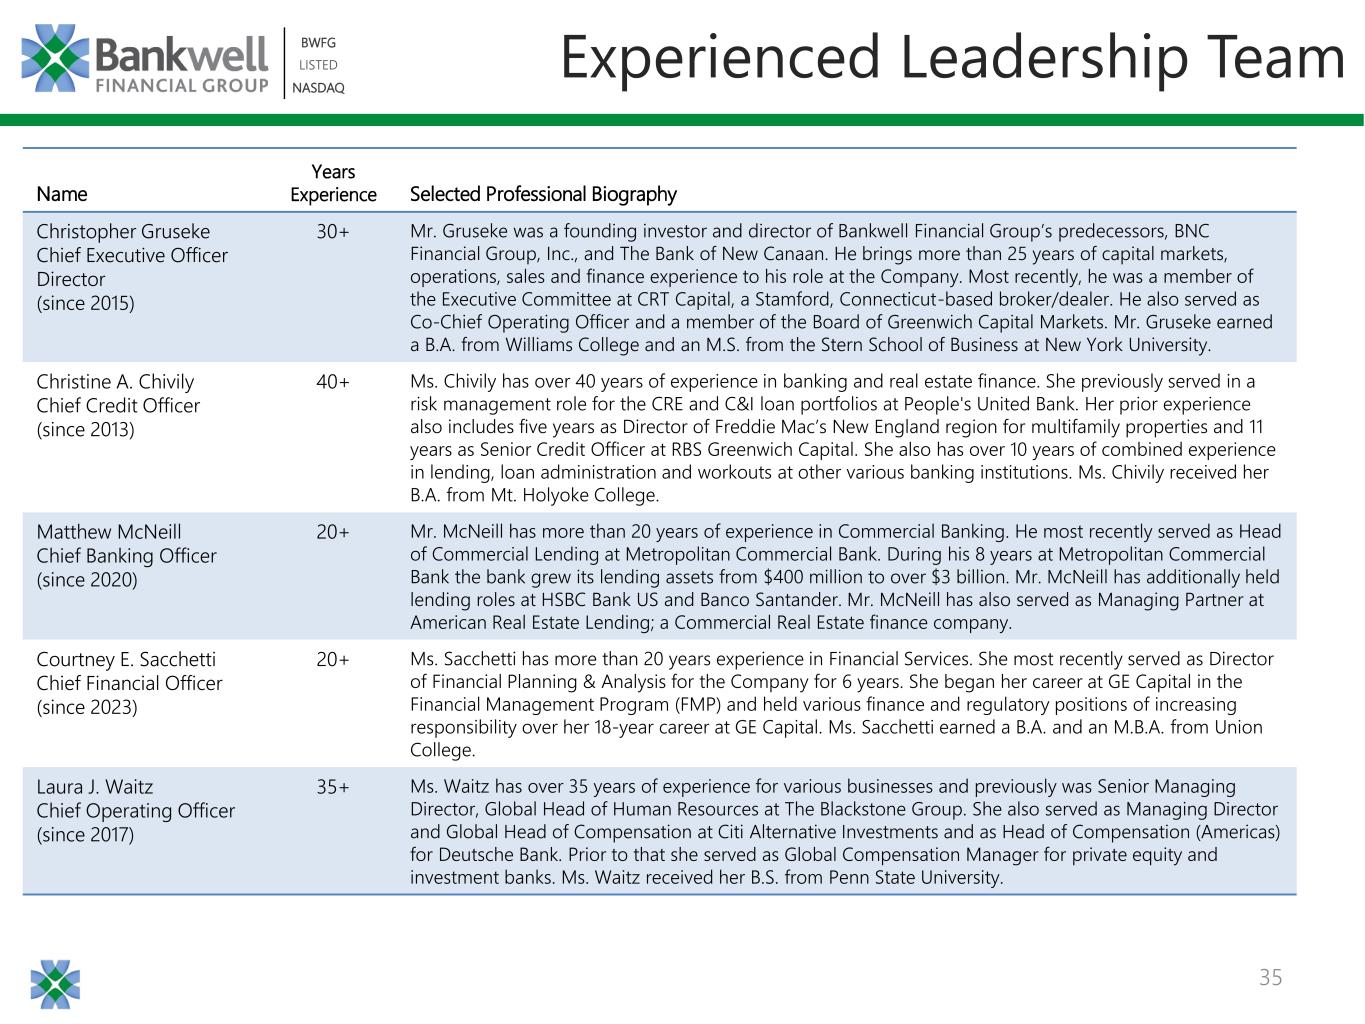
35 BWFG LISTED NASDAQ BWFG LISTED NASDAQ Name Years Experience Selected Professional Biography Christopher Gruseke Chief Executive Officer Director (since 2015) 30+ Mr. Gruseke was a founding investor and director of Bankwell Financial Group’s predecessors, BNC Financial Group, Inc., and The Bank of New Canaan. He brings more than 25 years of capital markets, operations, sales and finance experience to his role at the Company. Most recently, he was a member of the Executive Committee at CRT Capital, a Stamford, Connecticut-based broker/dealer. He also served as Co-Chief Operating Officer and a member of the Board of Greenwich Capital Markets. Mr. Gruseke earned a B.A. from Williams College and an M.S. from the Stern School of Business at New York University. Christine A. Chivily Chief Credit Officer (since 2013) 40+ Ms. Chivily has over 40 years of experience in banking and real estate finance. She previously served in a risk management role for the CRE and C&I loan portfolios at People's United Bank. Her prior experience also includes five years as Director of Freddie Mac’s New England region for multifamily properties and 11 years as Senior Credit Officer at RBS Greenwich Capital. She also has over 10 years of combined experience in lending, loan administration and workouts at other various banking institutions. Ms. Chivily received her B.A. from Mt. Holyoke College. Matthew McNeill Chief Banking Officer (since 2020) 20+ Mr. McNeill has more than 20 years of experience in Commercial Banking. He most recently served as Head of Commercial Lending at Metropolitan Commercial Bank. During his 8 years at Metropolitan Commercial Bank the bank grew its lending assets from $400 million to over $3 billion. Mr. McNeill has additionally held lending roles at HSBC Bank US and Banco Santander. Mr. McNeill has also served as Managing Partner at American Real Estate Lending; a Commercial Real Estate finance company. Courtney E. Sacchetti Chief Financial Officer (since 2023) 20+ Ms. Sacchetti has more than 20 years experience in Financial Services. She most recently served as Director of Financial Planning & Analysis for the Company for 6 years. She began her career at GE Capital in the Financial Management Program (FMP) and held various finance and regulatory positions of increasing responsibility over her 18-year career at GE Capital. Ms. Sacchetti earned a B.A. and an M.B.A. from Union College. Laura J. Waitz Chief Operating Officer (since 2017) 35+ Ms. Waitz has over 35 years of experience for various businesses and previously was Senior Managing Director, Global Head of Human Resources at The Blackstone Group. She also served as Managing Director and Global Head of Compensation at Citi Alternative Investments and as Head of Compensation (Americas) for Deutsche Bank. Prior to that she served as Global Compensation Manager for private equity and investment banks. Ms. Waitz received her B.S. from Penn State University. Experienced Leadership Team


BWFG | LISTED | NASDAQ Thank You & Questions