UNITED STATES
SECURITIES AND EXCHANGE COMMISSION
Washington, D.C. 20549
FORM 8-K
CURRENT REPORT
Pursuant to Section 13 or 15(d) of The Securities Exchange Act of 1934
Date of Report (Date of earliest event reported): February 25, 2026
UMH Properties, Inc.
(Exact name of registrant as specified in its charter)
| Maryland | 001-12690 | 22-1890929 | ||
| (State or other jurisdiction | (Commission | (IRS Employer | ||
| of incorporation) | File Number) | Identification No.) |
| Juniper Business Plaza, 3499 Route 9 North, Suite 3-C, Freehold, NJ | 07728 | |
| (Address of principal executive offices) | (Zip Code) |
Registrant’s telephone number, including area code: (732) 577-9997
Not Applicable
(Former name or former address, if changed since last report.)
Check the appropriate box below if the Form 8-K filing is intended to simultaneously satisfy the filing obligation of the registrant under any of the following provisions (see General Instruction A.2. below):
| ☐ | Written communications pursuant to Rule 425 under the Securities Act (17 CFR 230.425) |
| ☐ | Soliciting material pursuant to Rule 14a- 12 under the Exchange Act (17 CFR 240.14a-12) |
| ☐ | Pre-commencement communications pursuant to Rule 14d-2(b) under the Exchange Act (17 CFR 240.14d-2(b)) |
| ☐ | Pre-commencement communications pursuant to Rule 13e-4(c) under the Exchange Act (17 CFR 240.13e-4(c)) |
Securities registered pursuant to Section 12(b) of the Act:
| Title of each class | Trading Symbol(s) | Name of exchange on which registered | ||
| Common Stock, $0.10 par value | UMH | New York Stock Exchange | ||
| 6.375% Series D Cumulative Redeemable Preferred Stock, $0.10 par value | UMH PD | New York Stock Exchange |
Indicate by check mark whether the registrant is an emerging growth company as defined in Rule 405 of the Securities Act of 1933 (§230.405 of this chapter) or Rule 12b-2 of the Securities Exchange Act of 1934 (§240.12b-2 of this chapter). Emerging growth company ☐
If an emerging growth company, indicate by check mark if the registrant has elected not to use the extended transition period for complying with any new or revised financial accounting standards provided pursuant to Section 13(a) of the Exchange Act. ☐
| Item 2.02 | Results of Operations and Financial Condition. |
| Item 7.01 | Regulation FD Disclosure. |
On February 25, 2026, UMH Properties, Inc. issued a press release announcing the results for the fourth quarter and year ended December 31, 2025 and disclosed a supplemental information package in connection with its earnings conference call for the fourth quarter and year ended December 31, 2025. A copy of the supplemental information package and press release is furnished with this report as Exhibit 99.1 and Exhibit 99.2 and is incorporated herein by reference.
The information in this report and the exhibit attached hereto is being furnished, not filed, for the purposes of Section 18 of the Securities Exchange Act of 1934, as amended, and pursuant to Item 2.02 and Item 7.01 of Form 8-K will not be incorporated by reference into any filing under the Securities Act of 1933, as amended, unless specifically identified therein as being incorporated therein by reference.
Forward-Looking Statements
Statements contained in this report, including the document that is incorporated by reference, that are not historical facts are forward-looking statements within the meaning of Section 27A of the Securities Act of 1933, as amended (the “Securities Act”), and Section 21E of the Securities Exchange Act of 1934, as amended and the Private Securities Litigation Reform Act of 1995 (the “Exchange Act”). All statements, other than statements of historical facts that address activities, events or developments where the Company uses any of the words “anticipates,” “assumes,” “believes,” “estimates,” “expects,” “intends,” or similar expressions, are forward-looking statements. These forward-looking statements are not guaranteed and are based on the Company’s current intentions and on the Company’s current expectations and assumptions. These statements, intentions, expectations and assumptions involve risks and uncertainties, some of which are beyond the Company’s control that could cause actual results or events to differ materially from those that the Company anticipates or projects, such as:
| ● | changes in the real estate market conditions and general economic conditions; | |
| ● | the inherent risks associated with owning real estate, including local real estate market conditions, governing laws and regulations affecting manufactured housing communities and illiquidity of real estate investments; | |
| ● | increased competition in the geographic areas in which we own and operate manufactured housing communities; | |
| ● | our ability to continue to identify, negotiate and acquire manufactured housing communities and/or vacant land which may be developed into manufactured housing communities on terms favorable to us; | |
| ● | our ability to maintain or increase rental rates and occupancy levels; | |
| ● | changes in market rates of interest; | |
| ● | inflation and increases in costs, including personnel, insurance and the cost of purchasing manufactured homes; | |
| ● | our ability to purchase manufactured homes for rental or sale; | |
| ● | our ability to repay debt financing obligations; | |
| ● | our ability to refinance amounts outstanding under our credit facilities at maturity on terms favorable to us; | |
| ● | our ability to comply with certain debt covenants; | |
| ● | our ability to integrate acquired properties and operations into existing operations; | |
| ● | the availability of other debt and equity financing alternatives; | |
| ● | continued ability to access the debt or equity markets; | |
| ● | the loss of any member of our management team; | |
| ● | our ability to maintain internal controls and processes to ensure all transactions are accounted for properly, all relevant disclosures and filings are made in a timely manner in accordance with all rules and regulations, and any potential fraud or embezzlement is thwarted or detected; | |
| ● | the ability of manufactured home buyers to obtain financing; | |
| ● | the level of repossessions by manufactured home lenders; | |
| ● | market conditions affecting our investment securities; | |
| ● | changes in federal or state tax rules or regulations that could have adverse tax consequences; | |
| ● | our ability to qualify as a real estate investment trust for federal income tax purposes; | |
| ● | litigation, judgments or settlements, including costs associated with prosecuting or defending claims and any adverse outcomes; | |
| ● | changes in real estate and zoning laws and regulations; | |
| ● | legislative or regulatory changes, including changes to laws governing the taxation of REITs; | |
| ● | risks and uncertainties related to pandemics or other highly infectious or contagious diseases. |
| Item 9.01 | Financial Statements and Exhibits. |
| (d) | Exhibits. |
| 99.1 | Press Release dated February 25, 2026 |
| 99.2 | Supplemental information package for the fourth quarter and year ended December 31, 2025 |
| 104 | Cover Page Interactive Data File (embedded within the Inline XBRL document) |
|
|
SIGNATURE
Pursuant to the requirements of the Securities Exchange Act of 1934, the registrant has duly caused this report to be signed on its behalf by the undersigned hereunto duly authorized.
| UMH Properties, Inc. | ||
| Date: February 25, 2026 | By: | /s/ Anna T. Chew |
| Name: | Anna T. Chew | |
| Title: | Executive
Vice President and |
|
|
|
Exhibit 99.1
UMH PROPERTIES, INC.
Juniper Business Plaza
3499 Route 9 North, Suite 3-C
Freehold, NJ 07728
(732) 577-9997
Fax: (732) 577-9980
| FOR IMMEDIATE RELEASE | February 25, 2026 |
| Contact: Nelli Madden | |
| 732-577-9997 |
UMH PROPERTIES, INC. REPORTS RESULTS FOR THE FOURTH QUARTER AND YEAR ENDED DECEMBER 31, 2025
FREEHOLD, NJ, February 25, 2026…..... UMH Properties, Inc. (NYSE:UMH) (TASE:UMH) reported Total Income of $261.8 million for the year ended December 31, 2025 as compared to $240.6 million for the year ended December 31, 2024, representing an increase of 9%. Total Income for the quarter ended December 31, 2025 was $67.0 million as compared to $61.9 million for the quarter ended December 31, 2024, representing an increase of 8%. Net Income Attributable to Common Shareholders amounted to $6.0 million or $0.07 per diluted share for the year ended December 31, 2025 as compared to $2.5 million or $0.03 per diluted share for the year ended December 31, 2024. Net Income (Loss) Attributable to Common Shareholders amounted to a loss of $506,000 or $0.01 per diluted share for the quarter ended December 31, 2025 as compared to net income of $28,000 or $0.00 per diluted share for the quarter ended December 31, 2024.
Funds from Operations Attributable to Common Shareholders (“FFO”) was $76.0 million or $0.90 per diluted share for the year ended December 31, 2025 as compared to $66.3 million or $0.88 per diluted share for the year ended December 31, 2024. FFO was $19.3 million or $0.23 per diluted share for the quarter ended December 31, 2025 as compared to $18.4 million or $0.23 per diluted share for the quarter ended December 31, 2024. Normalized Funds from Operations Attributable to Common Shareholders (“Normalized FFO”), was $80.1 million or $0.95 per diluted share for the year ended December 31, 2025, as compared to $69.5 million or $0.93 per diluted share for the year ended December 31, 2024. Normalized FFO was $20.5 million or $0.24 per diluted share for the quarter ended December 31, 2025, as compared to $19.2 million or $0.24 per diluted share for the quarter ended December 31, 2024.
A summary of significant financial information for the three months and year ended December 31, 2025 and 2024 is as follows (in thousands except per share amounts):
| For the Three Months Ended | ||||||||
| December 31, | ||||||||
| 2025 | 2024 | |||||||
| Total Income | $ | 66,968 | $ | 61,873 | ||||
| Total Expenses | $ | 54,175 | $ | 51,466 | ||||
| Net Income (Loss) Attributable to Common Shareholders | $ | (506 | ) | $ | 28 | |||
| Net Income (Loss) Attributable to Common Shareholders per Diluted Common Share | $ | (0.01 | ) | $ | 0.00 | |||
| FFO (1) | $ | 19,349 | $ | 18,369 | ||||
| FFO (1) per Diluted Common Share | $ | 0.23 | $ | 0.23 | ||||
| Normalized FFO (1) | $ | 20,513 | $ | 19,203 | ||||
| Normalized FFO (1) per Diluted Common Share | $ | 0.24 | $ | 0.24 | ||||
| Basic Weighted Average Shares Outstanding | 85,060 | 80,112 | ||||||
| Diluted Weighted Average Shares Outstanding | 85,416 | 81,235 | ||||||
| For the Year Ended | ||||||||
| December 31, | ||||||||
| 2025 | 2024 | |||||||
| Total Income | $ | 261,714 | $ | 240,552 | ||||
| Total Expenses | $ | 213,942 | $ | 198,092 | ||||
| Net Income Attributable to Common Shareholders | $ | 5,966 | $ | 2,472 | ||||
| Net Income Attributable to Common Shareholders per Diluted Common Share | $ | 0.07 | $ | 0.03 | ||||
| FFO (1) | $ | 75,967 | $ | 66,259 | ||||
| FFO (1) per Diluted Common Share | $ | 0.90 | $ | 0.88 | ||||
| Normalized FFO (1) | $ | 80,098 | $ | 69,489 | ||||
| Normalized FFO (1) per Diluted Common Share | $ | 0.95 | $ | 0.93 | ||||
| Basic Weighted Average Shares Outstanding | 84,067 | 74,114 | ||||||
| Diluted Weighted Average Shares Outstanding | 84,694 | 74,912 | ||||||
A summary of significant balance sheet information as of December 31, 2025 and 2024 is as follows (in thousands):
|
December 31, 2025 |
December 31, 2024 |
|||||||
| Gross Real Estate Investments | $ | 1,869,390 | $ | 1,669,114 | ||||
| Marketable Securities at Fair Value | $ | 23,758 | $ | 31,883 | ||||
| Total Assets | $ | 1,699,036 | $ | 1,563,728 | ||||
| Mortgages Payable, net | $ | 556,129 | $ | 485,540 | ||||
| Loans Payable, net | $ | 27,696 | $ | 28,279 | ||||
| Series A Bond Payable, net | $ | 101,751 | $ | 100,903 | ||||
| Series B Bond Payable, net | $ | 75,651 | $ | -0- | ||||
| Total Shareholders’ Equity | $ | 907,196 | $ | 915,909 | ||||
Samuel A. Landy, President and CEO, commented on the 2025 results.
“During 2025, UMH made substantial progress on multiple fronts – generating solid operating results, achieving strong growth and improving our financial position. We have:
| ● | Increased Rental and Related Income by 10%; | |
| ● | Increased Community Net Operating Income (“NOI”) by 9%; | |
| ● | Increased Normalized Funds from Operations (“Normalized FFO”) by 15%; | |
| ● | Increased Normalized FFO per diluted share by 2% from $0.93 per diluted share in 2024 to $0.95 per diluted share in 2025; | |
| ● | Increased Same Property NOI by 9%; | |
| ● | Increased Same Property Occupancy by 80 basis points from 87.5% to 88.3%; | |
| ● | Improved our Same Property expense ratio from 39.7% at yearend 2024 to 39.3% at yearend 2025; | |
| ● | Acquired five communities containing 587 homesites for a total cost of approximately $41.8 million; | |
| ● | Increased Sales of Manufactured Homes by 4%; | |
| ● | In May 2025, completed the addition of ten communities to our Fannie Mae credit facility through Wells Fargo Bank, N.A., for total proceeds of approximately $101.4 million. The interest only loan for these ten communities is at a fixed rate of 5.855% with a 10-year term; | |
| ● | In November 2025, completed the addition of another seven communities to our Fannie Mae credit facility through Wells Fargo Bank, N.A., for total proceeds of approximately $91.8 million. The interest only loan for these seven communities is at a fixed rate of 5.46% with a 9-year term; | |
| ● | Issued approximately $80.2 million aggregate principal amount of 5.85% Series B Bonds due 2030 in an offering to investors in Israel; | |
| ● | Amended our $35 million revolving line of credit with OceanFirst Bank to extend the maturity date to June 1, 2027; |
| ● | Raised our quarterly common stock dividend by $0.01 representing a 4.7% increase to $0.225 per share or $0.90 annualized, representing our fifth consecutive common stock dividend increase within the last five years, resulting in a total increase of $0.18 or 25% over this period; | |
| ● | Issued and sold approximately 2.6 million shares of Common Stock through our At-the-Market Sale Program at a weighted average price of $17.59 per share, generating gross proceeds of $45.1 million and net proceeds of $44.1 million, after offering expenses; | |
| ● | Issued and sold approximately 93,000 shares of Series D Preferred Stock through our At-the-Market Sale Programs at a weighted average price of $22.93 per share, generating gross proceeds of $2.1 million and net proceeds of $2.0 million, after offering expenses; and | |
| ● | Subsequent to year end, issued and sold approximately 66,000 shares of Series D Preferred Stock through our At-the-Market Sale Program at a weighted average price of $22.51 per share, generating gross proceeds and net proceeds, after offering expenses, of $1.5 million.” |
“UMH delivered another solid year of operating results, earnings growth, increased property values and laid the foundation for future growth. Normalized FFO for the year was $0.95 as compared to $0.93 last year. The year was highlighted by a 9% increase in total income to $262 million, same property NOI growth of 9%, a new sales record of $36.4 million, including our sales from Honey Ridge, with record sales profitability of $4.4 million, the acquisition of five communities for $41.8 million and the documented increase in property values through our refinancings. We accomplished all of this while raising capital through our refinancings and our Israeli bond issuance. This capital will allow us to continue to invest in rental homes, expansions and capital improvements driving future growth.”
“Our long-term business plan results in the increased value of our communities as documented by appraisals conducted through our 2025 refinancings. During the year, we refinanced 17 communities for total proceeds of $193.2 million. Our total investment in these communities was approximately $140 million, or $37,000 per site. These communities were valued at approximately $309 million, or $82,000 per site, generating an increase in value of $169 million, representing an increase of 121% in value. In addition to the proceeds from our refinancings, we also raised $80.2 million through the issuance of our 5.85% Series B Israeli Bonds which are due in 2030. This capital was used to repay existing debt, invest in our rental home program, complete capital improvements, acquire new communities and buy back 320,000 shares of our common stock.”
“During the year, we were active on the acquisition front, completing the acquisition of 5 communities containing 587 sites for a total purchase price of $41.8 million. These communities had a 78% occupancy rate at the time of acquisition. We are well positioned to complete additional acquisitions due to our strong balance sheet and available cash on hand.”
“Our past investments in value-added communities, expansions and developments provide us with 3,300 sites to generate increased income from sales and our rental home program. In 2026, we anticipate adding 700-800 new rental homes to our portfolio, growing our sales revenue and profitability and developing 300 or more sites. We anticipate high single digit or low double digit same property growth. At this time, we are announcing full year 2026 guidance of $0.97 - $1.05 normalized FFO per share. This represents an increase of 8% at the mid-point.”
“We look forward to delivering strong operating results and earnings per share growth in 2026.”
UMH Properties, Inc. will host its Fourth Quarter and Year Ended December 31, 2025 Financial Results Webcast and Conference Call. Senior management will discuss the results, current market conditions and future outlook on Thursday, February 26, 2026 at 10:00 a.m. Eastern Time.
The Company’s fourth quarter and year ended December 31, 2025 financial results being released herein will be available on the Company’s website at www.umh.reit in the “Financials” section.
To participate in the webcast, select the microphone icon found on the homepage www.umh.reit to access the call. Interested parties can also participate via conference call by calling toll free 877-513-1898 (domestically) or 412-902-4147 (internationally).
The replay of the conference call will be available at 12:00 p.m. Eastern Time on Thursday, February 26, 2026 and can be accessed by dialing toll free 877-344-7529 (domestically) and 412-317-0088 (internationally) and entering the passcode 1544518. A transcript of the call and the webcast replay will be available at the Company’s website, www.umh.reit.
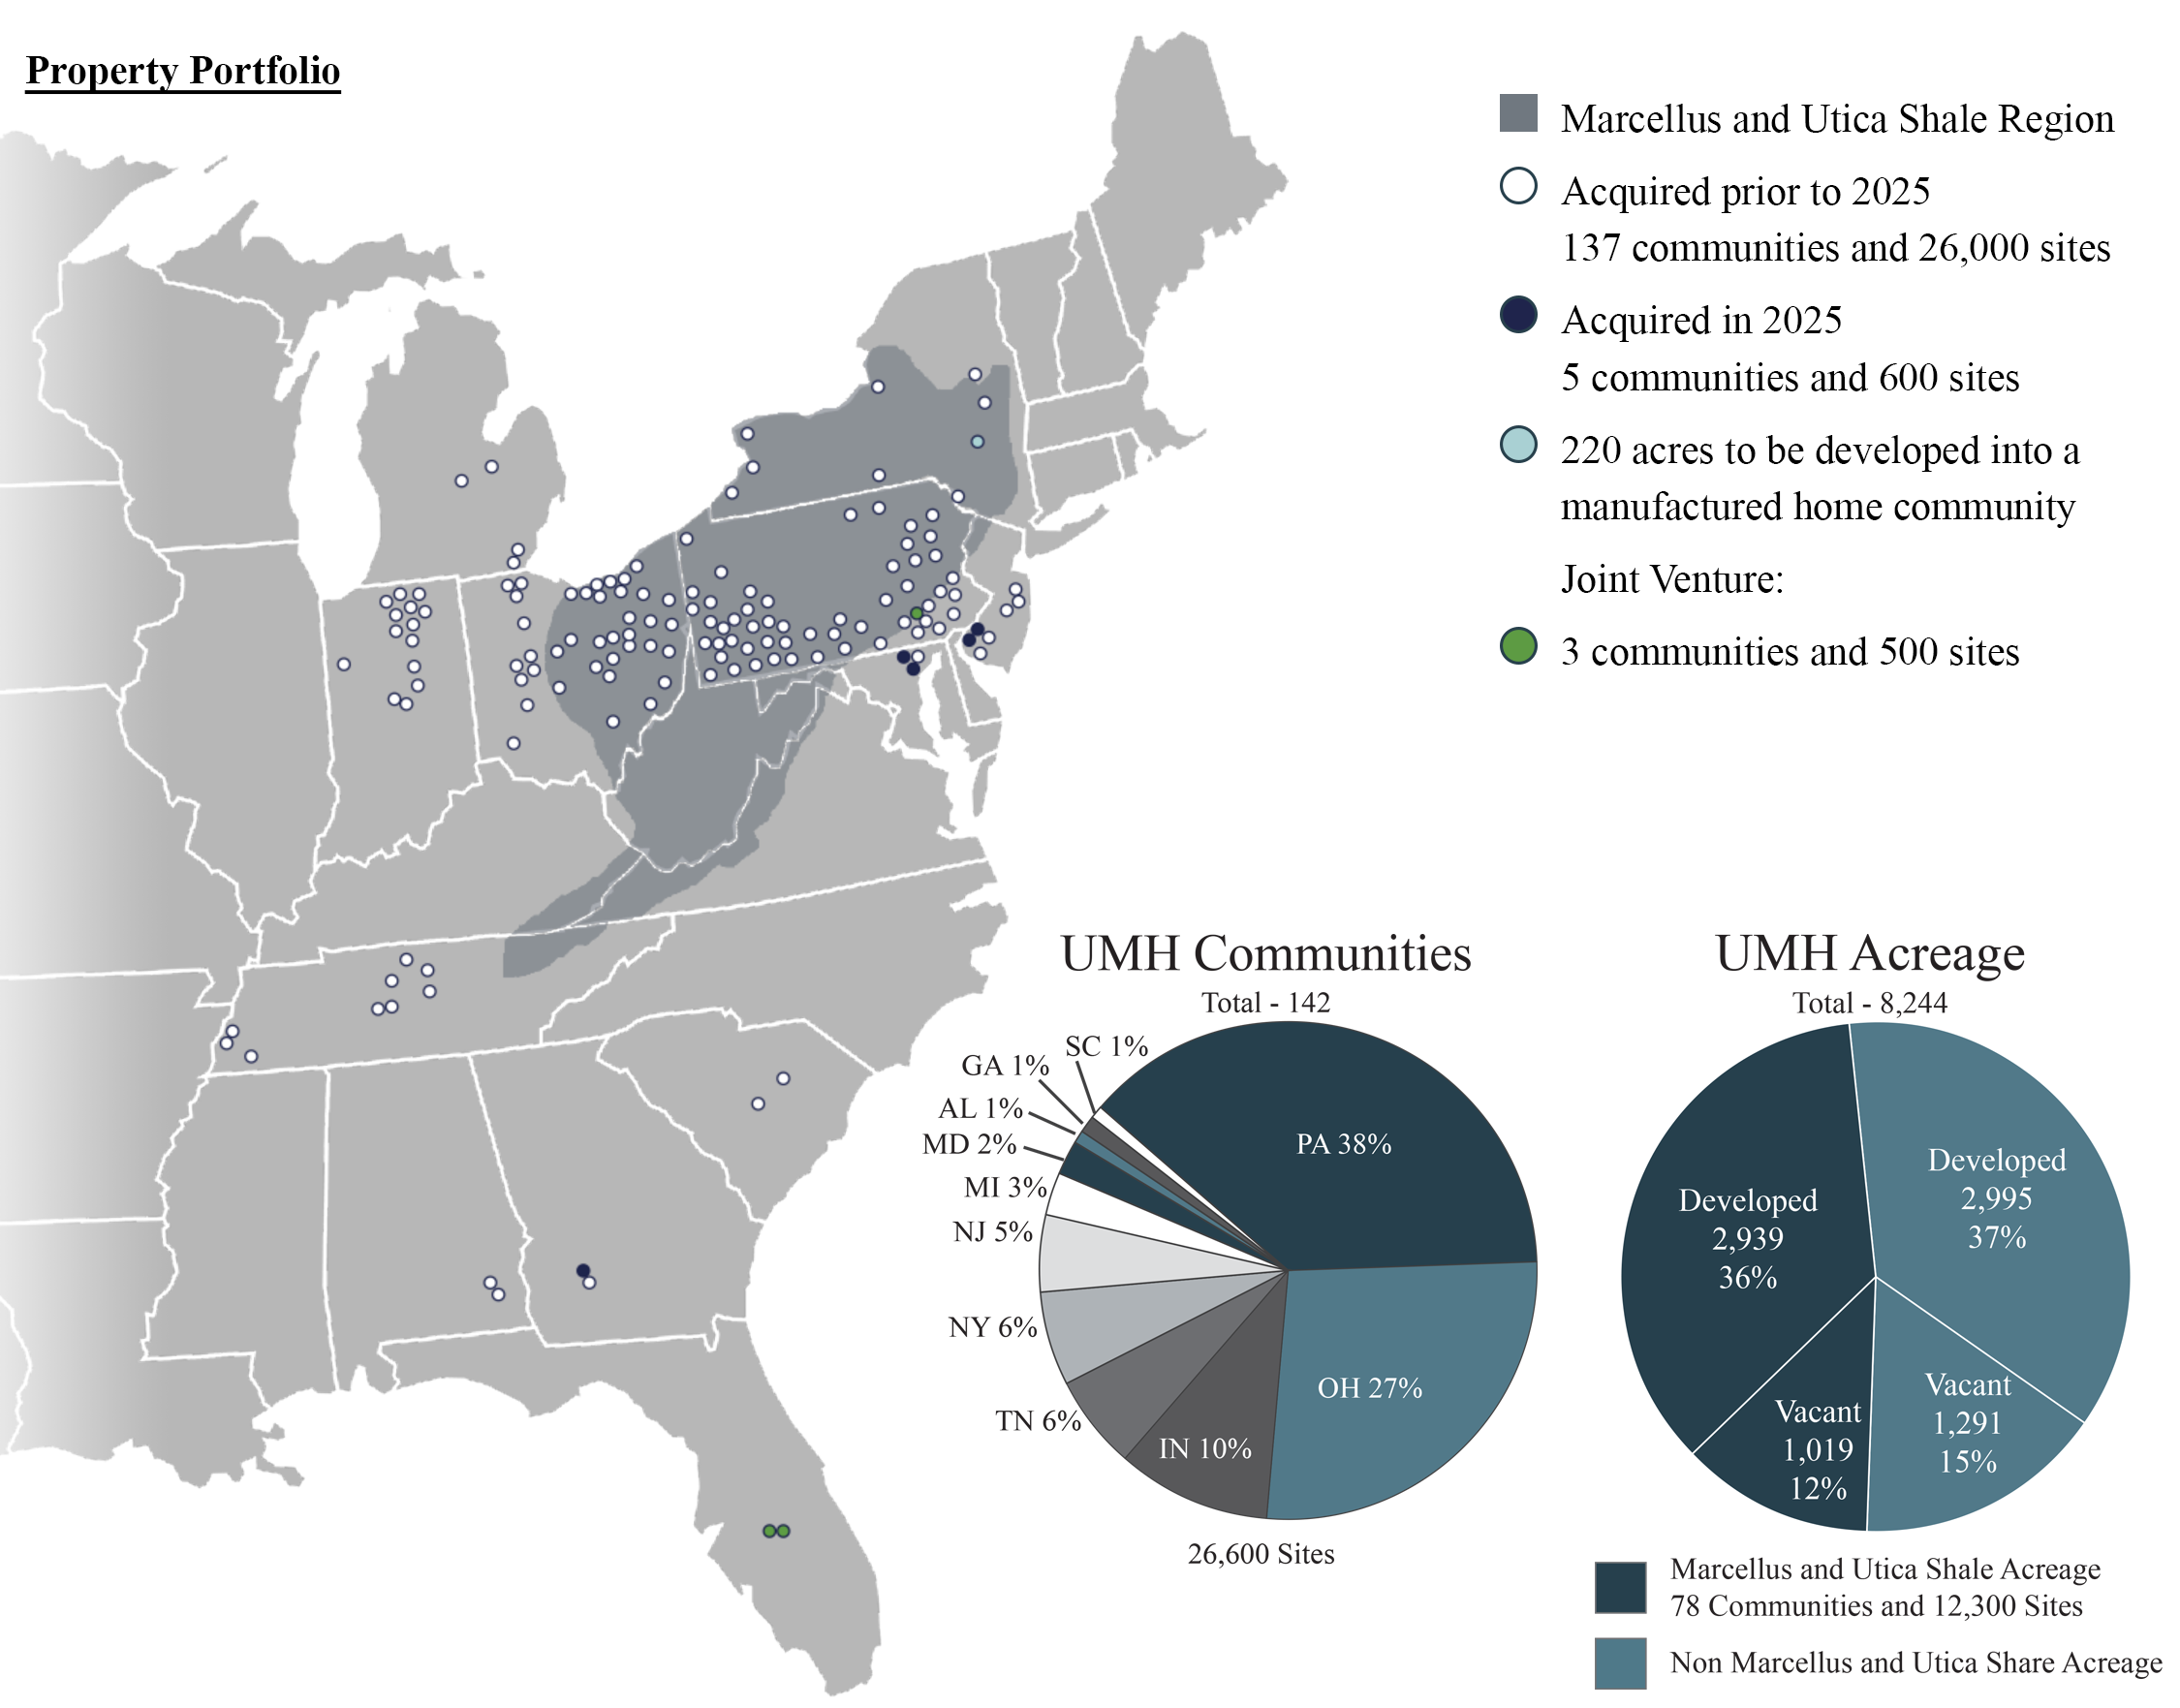
UMH Properties, Inc., which was organized in 1968, is a public equity REIT that currently owns and operates 145 manufactured home communities containing approximately 27,100 developed homesites, of which contain 11,000 contain rental homes, and over 1,000 self-storage units. These communities are located in New Jersey, New York, Ohio, Pennsylvania, Tennessee, Indiana, Maryland, Michigan, Alabama, South Carolina, Florida and Georgia. Included in the 145 communities are two communities in Florida, containing 363 sites, and one community in Pennsylvania, containing 113 sites, that UMH has an ownership interest in and operates through its joint ventures with Nuveen Real Estate.
Certain statements included in this press release which are not historical facts may be deemed forward-looking statements within the meaning of the Private Securities Litigation Reform Act of 1995. Any such forward-looking statements are based on the Company’s current expectations and involve various risks and uncertainties. Although the Company believes the expectations reflected in any forward-looking statements are based on reasonable assumptions, the Company can provide no assurance those expectations will be achieved. The risks and uncertainties that could cause actual results or events to differ materially from expectations are contained in the Company’s annual report on Form 10-K and described from time to time in the Company’s other filings with the SEC. The Company undertakes no obligation to publicly update or revise any forward-looking statements whether as a result of new information, future events, or otherwise.
Note:
| (1) | Non-GAAP Information: We assess and measure our overall operating results based upon an industry performance measure referred to as Funds from Operations Attributable to Common Shareholders (“FFO”), which management believes is a useful indicator of our operating performance. FFO is used by industry analysts and investors as a supplemental operating performance measure of a REIT. FFO, as defined by The National Association of Real Estate Investment Trusts (“Nareit”), represents net income (loss) attributable to common shareholders, as defined by accounting principles generally accepted in the United States of America (“U.S. GAAP”), excluding certain gains or losses from sales of previously depreciated real estate assets, impairment charges related to depreciable real estate assets, the change in the fair value of marketable securities, and the gain or loss on the sale of marketable securities plus certain non-cash items such as real estate asset depreciation and amortization. Included in the Nareit FFO White Paper - 2018 Restatement, is an option pertaining to assets incidental to our main business in the calculation of Nareit FFO to make an election to include or exclude gains and losses on the sale of these assets, such as marketable equity securities, and include or exclude mark-to-market changes in the value recognized on these marketable equity securities. In conjunction with the adoption of the FFO White Paper - 2018 Restatement, for all periods presented, we have elected to exclude the gains and losses realized on marketable securities investments and the change in the fair value of marketable securities from our FFO calculation. Nareit created FFO as a non-U.S. GAAP supplemental measure of REIT operating performance. We define Normalized Funds from Operations Attributable to Common Shareholders (“Normalized FFO”), as FFO excluding certain one-time charges. FFO and Normalized FFO should be considered as supplemental measures of operating performance used by REITs. FFO and Normalized FFO exclude historical cost depreciation as an expense and may facilitate the comparison of REITs which have a different cost basis. However, other REITs may use different methodologies to calculate FFO and Normalized FFO and, accordingly, our FFO and Normalized FFO may not be comparable to all other REITs. The items excluded from FFO and Normalized FFO are significant components in understanding the Company’s financial performance. |
FFO and Normalized FFO (i) do not represent Cash Flow from Operations as defined by U.S. GAAP; (ii) should not be considered as alternatives to net income (loss) as a measure of operating performance or to cash flows from operating, investing and financing activities; and (iii) are not alternatives to cash flow as a measure of liquidity. FFO and Normalized FFO, as calculated by the Company, may not be comparable to similarly titled measures reported by other REITs.
The diluted weighted shares outstanding used in the calculation of FFO per Diluted Common Share and Normalized FFO per Diluted Common Share were 85.4 million and 84.7 million shares for the three months and year ended December 31, 2025, respectively, and 81.2 million and 74.9 million shares for the three months and year ended December 31, 2024, respectively. Common stock equivalents resulting from stock options in the amount of 627,000 for the year ended December 31, 2025, and 1.1 million and 798,000 for the three months and year ended December 31, 2024, respectively, were included in the computation of Diluted Net Income per share. Common stock equivalents resulting from stock options in the amount 356,000 shares for the three months ended December 31, 2025 were excluded from the computation of Diluted Net Income (Loss) per Share as their effect would have been anti-dilutive.
The reconciliation of the Company’s U.S. GAAP net income (loss) to the Company’s FFO and Normalized FFO for the three months and year ended December 31, 2025 and 2024 are calculated as follows (in thousands):
| Three Months Ended | Year Ended | |||||||||||||||
|
December 31, 2025 |
December 31, 2024 |
December 31, 2025 |
December 31, 2024 |
|||||||||||||
| Net Income (Loss) Attributable to Common Shareholders | $ | (506 | ) | $ | 28 | $ | 5,966 | $ | 2,472 | |||||||
| Depreciation Expense | 17,345 | 15,804 | 66,555 | 60,239 | ||||||||||||
| Depreciation Expense from Unconsolidated Joint Ventures | 236 | 214 | 902 | 824 | ||||||||||||
| (Gain) Loss on Sales of Investment Property and Equipment | (45 | ) | 22 | 64 | 113 | |||||||||||
| (Increase) Decrease in Fair Value of Marketable Securities | 2,098 | 2,301 | 2,259 | (1,167 | ) | |||||||||||
| Loss on Sales of Marketable Securities, net | 221 | -0- | 221 | 3,778 | ||||||||||||
| FFO Attributable to Common Shareholders | 19,349 | 18,369 | 75,967 | 66,259 | ||||||||||||
| Amortization of Financing Costs | 869 | 613 | 2,992 | 2,384 | ||||||||||||
| Non-Recurring Other Expense (2) | 295 | 221 | 1,139 | 846 | ||||||||||||
| Normalized FFO Attributable to Common Shareholders | $ | 20,513 | $ | 19,203 | $ | 80,098 | $ | 69,489 | ||||||||
| (2) | Consists of one-time legal and professional fees ($295 and $579, respectively) and costs associated with acquisition not completed ($0 and $560, respectively) for the three months and year ended December 31,2025. Consists of one-time legal and professional fees ($209 and $452, respectively), costs associated with acquisition not completed ($12 and $12, respectively) and costs associated with the liquidation/sale of inventory in a particular sales center ($0 and $382, respectively) for the three months and year ended December 31, 2024. |
The following are the cash flows provided by (used in) operating, investing and financing activities for the year ended December 31, 2025 and 2024 (in thousands):
| 2025 | 2024 | |||||||
| Operating Activities | $ | 81,973 | $ | 81,601 | ||||
| Investing Activities | (209,200 | ) | (139,865 | ) | ||||
| Financing Activities | 99,342 | 102,638 | ||||||
# # # #
Exhibit 99.2
Table of Contents
Certain information in this Supplemental Information Package contains Non-GAAP financial measures. These Non-GAAP financial measures are REIT industry financial measures that are not calculated in accordance with accounting principles generally accepted in the United States of America. Please see page 15 for a definition of these Non-GAAP financial measures and page 7 for the reconciliation of certain captions in the Supplemental Information Package to the statement of operations as reported in the Company’s filings with the SEC on Form 10-K.
| UMH Properties, Inc. | Fourth Quarter FY 2025 Supplemental Information |
|
(dollars in thousands except per share amounts) (unaudited)
| Three Months Ended | Year Ended | |||||||||||||||
| December 31, 2025 |
December 31, 2024 |
December 31, 2025 |
December 31, 2024 |
|||||||||||||
| Operating Information | ||||||||||||||||
| Number of Communities (1) | 145 | 139 | ||||||||||||||
| Total Sites (1) | 27,086 | 26,259 | ||||||||||||||
| Rental and Related Income | $ | 58,203 | $ | 53,259 | $ | 226,713 | $ | 207,019 | ||||||||
| Community Operating Expenses (2) | $ | 24,843 | $ | 22,151 | $ | 95,253 | $ | 87,354 | ||||||||
| Community NOI (2) | $ | 33,360 | $ | 31,108 | $ | 131,460 | $ | 119,665 | ||||||||
| Expense Ratio | 42.7 | % | 41.6 | % | 42.0 | % | 42.2 | % | ||||||||
| Sales of Manufactured Homes | $ | 8,765 | $ | 8,614 | $ | 35,041 | $ | 33,533 | ||||||||
| Number of Homes Sold | 87 | 93 | 360 | 394 | ||||||||||||
| Number of Rentals Added, net | 138 | 80 | 571 | 364 | ||||||||||||
| Net Income | $ | 4,575 | $ | 4,980 | $ | 26,275 | $ | 21,441 | ||||||||
| Net Income (Loss) Attributable to Common Shareholders | $ | (506 | ) | $ | 28 | $ | 5,966 | $ | 2,472 | |||||||
| Adjusted EBITDA excluding Non-Recurring Other Expense | $ | 33,021 | $ | 29,806 | $ | 127,284 | $ | 113,958 | ||||||||
| FFO Attributable to Common Shareholders | $ | 19,349 | $ | 18,369 | $ | 75,967 | $ | 66,259 | ||||||||
| Normalized FFO Attributable to Common Shareholders | $ | 20,513 | $ | 19,203 | $ | 80,098 | $ | 69,489 | ||||||||
| Shares Outstanding and Per Share Data | ||||||||||||||||
| Weighted Average Shares Outstanding | ||||||||||||||||
| Basic | 85,060 | 80,112 | 84,067 | 74,114 | ||||||||||||
| Diluted | 85,416 | 81,235 | 84,694 | 74,912 | ||||||||||||
| Net Income Attributable to Shareholders per Share- | ||||||||||||||||
| Basic and Diluted | $ | (0.01 | ) | $ | 0.00 | $ | 0.07 | $ | 0.03 | |||||||
| FFO per Share- (3) | ||||||||||||||||
| Basic | $ | 0.23 | $ | 0.23 | $ | 0.90 | $ | 0.89 | ||||||||
| Diluted | $ | 0.23 | $ | 0.23 | $ | 0.90 | $ | 0.88 | ||||||||
| Normalized FFO per Share- (3) | ||||||||||||||||
| Basic | $ | 0.24 | $ | 0.24 | $ | 0.95 | $ | 0.94 | ||||||||
| Diluted | $ | 0.24 | $ | 0.24 | $ | 0.95 | $ | 0.93 | ||||||||
| Dividends per Common Share | $ | 0.225 | $ | 0.215 | $ | 0.89 | $ | 0.85 | ||||||||
| Balance Sheet | ||||||||||||||||
| Total Assets | $ | 1,699,036 | $ | 1,563,728 | ||||||||||||
| Total Liabilities | $ | 791,840 | $ | 647,819 | ||||||||||||
| Market Capitalization | ||||||||||||||||
| Total Debt, Net of Unamortized Debt Issuance Costs | $ | 761,227 | $ | 614,722 | ||||||||||||
| Equity Market Capitalization | $ | 1,349,971 | $ | 1,546,449 | ||||||||||||
| Series D Preferred Stock | $ | 322,899 | $ | 320,572 | ||||||||||||
| Total Market Capitalization | $ | 2,434,097 | $ | 2,481,743 | ||||||||||||
| (1) | Includes Sebring Square, Rum Runner and Honey Ridge, three communities owned in joint ventures with Nuveen Real Estate in which the company has a 40% interest. | |
| (2) | Excludes non-recurring legal and professional fees of $64 and $724 for the three months and year ended December 31, 2025, respectively. | |
| (3) | Please see Definitions on page 15. |
| UMH Properties, Inc. | Fourth Quarter FY 2025 Supplemental Information |
|
(in thousands except per share amounts)
| December 31, | December 31, | |||||||
| 2025 | 2024 | |||||||
| ASSETS | ||||||||
| Investment Property and Equipment | ||||||||
| Land | $ | 92,824 | $ | 88,037 | ||||
| Site and Land Improvements | 1,093,424 | 970,053 | ||||||
| Buildings and Improvements | 51,524 | 44,782 | ||||||
| Rental Homes and Accessories | 631,618 | 566,242 | ||||||
| Total Investment Property | 1,869,390 | 1,669,114 | ||||||
| Equipment and Vehicles | 35,889 | 31,488 | ||||||
| Total Investment Property and Equipment | 1,905,279 | 1,700,602 | ||||||
| Accumulated Depreciation | (533,864 | ) | (471,703 | ) | ||||
| Net Investment Property and Equipment | 1,371,415 | 1,228,899 | ||||||
| Other Assets | ||||||||
| Cash and Cash Equivalents | 72,100 | 99,720 | ||||||
| Marketable Securities at Fair Value | 23,758 | 31,883 | ||||||
| Inventory of Manufactured Homes | 42,370 | 34,982 | ||||||
| Notes and Other Receivables, net | 104,587 | 91,668 | ||||||
| Prepaid Expenses and Other Assets | 13,778 | 14,261 | ||||||
| Land Development Costs | 39,898 | 33,868 | ||||||
| Investment in Joint Ventures | 31,130 | 28,447 | ||||||
| Total Other Assets | 327,621 | 334,829 | ||||||
| TOTAL ASSETS | $ | 1,699,036 | $ | 1,563,728 | ||||
| LIABILITIES AND SHAREHOLDERS’ EQUITY | ||||||||
| Liabilities | ||||||||
| Mortgages Payable, net of unamortized debt issuance costs | $ | 556,129 | $ | 485,540 | ||||
| Other Liabilities | ||||||||
| Accounts Payable | 5,663 | 7,979 | ||||||
| Loans Payable, net of unamortized debt issuance costs | 27,696 | 28,279 | ||||||
| Series A Bonds, net of unamortized debt issuance costs | 101,751 | 100,903 | ||||||
| Series B Bonds, net of unamortized debt issuance costs | 75,651 | -0- | ||||||
| Accrued Liabilities and Deposits | 14,115 | 15,091 | ||||||
| Tenant Security Deposits | 10,835 | 10,027 | ||||||
| Total Other Liabilities | 235,711 | 162,279 | ||||||
| Total Liabilities | 791,840 | 647,819 | ||||||
| COMMITMENTS AND CONTINGENCIES | ||||||||
| Shareholders’ Equity: | ||||||||
| Series D- 6.375% Cumulative Redeemable Preferred Stock, $0.10 par value per share: 18,700 and 13,700 shares authorized as of December 31, 2025 and 2024, respectively; 12,916 and 12,823 shares issued and outstanding as of December 31, 2025 and 2024, respectively | 322,899 | 320,572 | ||||||
| Common Stock- $0.10 par value per share: 183,714 and 163,714 shares authorized as of December 31, 2025 and 2024, respectively; 84,850 and 81,909 shares issued and outstanding as of December 31, 2025 and 2024, respectively | 8,485 | 8,191 | ||||||
| Excess Stock- $0.10 par value per share: 3,000 shares authorized; no shares issued or outstanding as of December 31, 2025 and 2024 | -0- | -0- | ||||||
| Additional Paid-In Capital | 599,520 | 610,630 | ||||||
| Accumulated Deficit | (25,364 | ) | (25,364 | ) | ||||
| Total UMH Properties, Inc. Shareholders’ Equity | 905,540 | 914,029 | ||||||
| Non-Controlling Interest in Consolidated Subsidiaries | 1,656 | 1,880 | ||||||
| Total Shareholders’ Equity | 907,196 | 915,909 | ||||||
| TOTAL LIABILITIES AND SHAREHOLDERS’ EQUITY | $ | 1,699,036 | $ | 1,563,728 | ||||
| UMH Properties, Inc. | Fourth Quarter FY 2025 Supplemental Information |
|
Consolidated Statements of Income (Loss)
(in thousands except per share amounts)
| (unaudited) | ||||||||||||||||
| Three Months Ended | Year Ended | |||||||||||||||
| December 31, 2025 | December 31, 2024 | December 31, 2025 | December 31, 2024 | |||||||||||||
| INCOME: | ||||||||||||||||
| Rental and Related Income | $ | 58,203 | $ | 53,259 | $ | 226,713 | $ | 207,019 | ||||||||
| Sales of Manufactured Homes | 8,765 | 8,614 | 35,041 | 33,533 | ||||||||||||
| TOTAL INCOME | 66,968 | 61,873 | 261,754 | 240,552 | ||||||||||||
| EXPENSES: | ||||||||||||||||
| Community Operating Expenses | 24,907 | 22,151 | 95,977 | 87,354 | ||||||||||||
| Cost of Sales of Manufactured Homes | 5,307 | 5,431 | 22,571 | 21,894 | ||||||||||||
| Selling Expenses | 1,617 | 1,656 | 7,302 | 6,833 | ||||||||||||
| General and Administrative Expenses | 4,999 | 6,424 | 21,537 | 21,772 | ||||||||||||
| Depreciation Expense | 17,345 | 15,804 | 66,555 | 60,239 | ||||||||||||
| TOTAL EXPENSES | 54,175 | 51,466 | 213,942 | 198,092 | ||||||||||||
| OTHER INCOME (EXPENSE): | ||||||||||||||||
| Interest Income | 2,063 | 2,238 | 8,740 | 7,122 | ||||||||||||
| Dividend Income | 355 | 373 | 1,477 | 1,452 | ||||||||||||
| Loss on Sales of Marketable Securities, net | (221 | ) | -0- | (221 | ) | (3,778 | ) | |||||||||
| Increase (Decrease) in Fair Value of Marketable Securities | (2,098 | ) | (2,301 | ) | (2,259 | ) | 1,167 | |||||||||
| Other Income | 218 | 280 | 912 | 794 | ||||||||||||
| Loss on Investment in Joint Ventures | (129 | ) | (77 | ) | (439 | ) | (376 | ) | ||||||||
| Interest Expense | (8,451 | ) | (5,918 | ) | (29,683 | ) | (27,287 | ) | ||||||||
| TOTAL OTHER INCOME (EXPENSE) | (8,263 | ) | (5,405 | ) | (21,473 | ) | (20,906 | ) | ||||||||
| Income before Income (Loss) on Sales of Investment Property and Equipment | 4,530 | 5,002 | 26,339 | 21,554 | ||||||||||||
| Income (Loss) on Sales of Investment Property and Equipment | 45 | (22 | ) | (64 | ) | (113 | ) | |||||||||
| NET INCOME | 4,575 | 4,980 | 26,275 | 21,441 | ||||||||||||
| Preferred Dividends | (5,146 | ) | (4,995 | ) | (20,533 | ) | (19,163 | ) | ||||||||
| Loss Attributable to Non-Controlling Interest | 65 | 43 | 224 | 194 | ||||||||||||
| NET INCOME (LOSS) ATTRIBUTABLE TO COMMON SHAREHOLDERS | $ | (506 | ) | $ | 28 | $ | 5,966 | $ | 2,472 | |||||||
| NET INCOME (LOSS) ATTRIBUTABLE TO COMMON SHAREHOLDERS PER SHARE – | ||||||||||||||||
| Basic and Diluted | $ | (0.01 | ) | $ | 0.00 | $ | 0.07 | $ | 0.03 | |||||||
| WEIGHTED AVERAGE COMMON SHARES OUTSTANDING: | ||||||||||||||||
| Basic | 85,060 | 80,112 | 84,067 | 74,114 | ||||||||||||
| Diluted | 85,416 | 81,235 | 84,694 | 74,912 | ||||||||||||
| UMH Properties, Inc. | Fourth Quarter FY 2025 Supplemental Information |
|
Consolidated Statements of Cash Flows
(in thousands)
| Year Ended | ||||||||
| December 31, 2025 |
December 31, 2024 |
|||||||
| CASH FLOWS FROM OPERATING ACTIVITIES: | ||||||||
| Net Income | $ | 26,275 | $ | 21,441 | ||||
| Non-Cash Items Included in Net Income: | ||||||||
| Depreciation | 66,555 | 60,239 | ||||||
| Amortization of Financing Costs | 2,992 | 2,384 | ||||||
| Stock Compensation Expense | 5,364 | 4,784 | ||||||
| Provision for Uncollectible Notes and Other Receivables | 1,603 | 2,079 | ||||||
| Loss on Sales of Marketable Securities, net | 221 | 3,778 | ||||||
| (Increase) Decrease in Fair Value of Marketable Securities | 2,259 | (1,167 | ) | |||||
| Loss on Sales of Investment Property and Equipment | 64 | 113 | ||||||
| Loss on Investment in Joint Ventures | 816 | 895 | ||||||
| Changes in Operating Assets and Liabilities: | ||||||||
| Inventory of Manufactured Homes | (7,388 | ) | (2,042 | ) | ||||
| Notes and Other Receivables, net of notes acquired with acquisitions | (14,522 | ) | (12,676 | ) | ||||
| Prepaid Expenses and Other Assets | 218 | (558 | ) | |||||
| Accounts Payable | (2,316 | ) | 1,873 | |||||
| Accrued Liabilities and Deposits | (976 | ) | (26 | ) | ||||
| Tenant Security Deposits | 808 | 484 | ||||||
| Net Cash Provided by Operating Activities | 81,973 | 81,601 | ||||||
| CASH FLOWS FROM INVESTING ACTIVITIES: | ||||||||
| Purchase of Manufactured Home Communities | (42,791 | ) | -0- | |||||
| Purchase of Investment Property and Equipment | (114,373 | ) | (92,101 | ) | ||||
| Proceeds from Sales of Investment Property and Equipment | 4,060 | 5,282 | ||||||
| Additions to Land Development Costs | (58,242 | ) | (48,567 | ) | ||||
| Purchase of Marketable Securities through automatic reinvestments | (27 | ) | (24 | ) | ||||
| Proceeds from Sales of Marketable Securities | 5,672 | 36 | ||||||
| Investment in Joint Ventures | (3,499 | ) | (4,491 | ) | ||||
| Net Cash Used in Investing Activities | (209,200 | ) | (139,865 | ) | ||||
| CASH FLOWS FROM FINANCING ACTIVITIES: | ||||||||
| Proceeds from Mortgages | 193,235 | -0- | ||||||
| Net Payments from Short-Term Borrowings | (1,048 | ) | (65,170 | ) | ||||
| Principal Payments of Mortgages and Loans | (120,410 | ) | (11,864 | ) | ||||
| Proceeds from Bond Issuance | 80,231 | -0- | ||||||
| Financing Costs on Debt | (8,495 | ) | (645 | ) | ||||
| Proceeds from At-The-Market Preferred Equity Program, net of offering costs | 1,951 | 28,015 | ||||||
| Proceeds from At-The-Market Common Equity Program, net of offering costs | 44,108 | 220,622 | ||||||
| Proceeds from Issuance of Common Stock in the DRIP, net of dividend reinvestments | 5,815 | 6,999 | ||||||
| Repurchase of Common Stock | (4,818 | ) | -0- | |||||
| Proceeds from Exercise of Stock Options | 535 | 2,919 | ||||||
| Preferred Dividends Paid | (20,533 | ) | (19,163 | ) | ||||
| Common Dividends Paid, net of dividend reinvestments | (71,229 | ) | (59,075 | ) | ||||
| Net Cash Provided by Financing Activities | 99,342 | 102,638 | ||||||
| NET INCREASE (DECREASE) IN CASH, CASH EQUIVALENTS AND RESTRICTED CASH | (27,885 | ) | 44,374 | |||||
| CASH, CASH EQUIVALENTS AND RESTRICTED CASH AT BEGINNING OF YEAR | 108,811 | 64,437 | ||||||
| CASH, CASH EQUIVALENTS AND RESTRICTED CASH AT END OF YEAR | $ | 80,926 | $ | 108,811 | ||||
| UMH Properties, Inc. | Fourth Quarter FY 2025 Supplemental Information |
|
Reconciliation of Net Income to Adjusted EBITDA and Net Income (Loss)
Attributable to Common Shareholders to FFO and Normalized FFO
(in thousands) (unaudited)
| Three Months Ended | Year Ended | |||||||||||||||
| December 31, 2025 |
December 31, 2024 |
December 31, 2025 |
December 31, 2024 |
|||||||||||||
| Reconciliation of Net Income to Adjusted EBITDA | ||||||||||||||||
| Net Income | $ | 4,575 | $ | 4,980 | $ | 26,275 | $ | 21,441 | ||||||||
| Interest Expense | 8,451 | 5,918 | 29,683 | 27,287 | ||||||||||||
| Franchise Taxes | (200 | ) | 368 | 250 | 710 | |||||||||||
| Depreciation Expense | 17,345 | 15,804 | 66,555 | 60,239 | ||||||||||||
| Depreciation Expense from Unconsolidated Joint Ventures | 236 | 214 | 902 | 824 | ||||||||||||
| (Increase) Decrease in Fair Value of Marketable Securities | 2,098 | 2,301 | 2,259 | (1,167 | ) | |||||||||||
| Loss on Sales of Marketable Securities, net | 221 | -0- | 221 | 3,778 | ||||||||||||
| Adjusted EBITDA | 32,726 | 29,585 | 126,145 | 113,112 | ||||||||||||
| Non-Recurring Other Expense (1) | 295 | 221 | 1,139 | 846 | ||||||||||||
| Adjusted EBITDA excluding Non-Recurring Other Expense | $ | 33,021 | $ | 29,806 | $ | 127,284 | $ | 113,958 | ||||||||
| Reconciliation of Net Income (Loss) Attributable to Common Shareholders to Funds from Operations | ||||||||||||||||
| Net Income (Loss) Attributable to Common Shareholders | $ | (506 | ) | $ | 28 | $ | 5,966 | $ | 2,472 | |||||||
| Depreciation Expense | 17,345 | 15,804 | 66,555 | 60,239 | ||||||||||||
| Depreciation Expense from Unconsolidated Joint Ventures | 236 | 214 | 902 | 824 | ||||||||||||
| (Gain) Loss on Sales of Investment Property and Equipment | (45 | ) | 22 | 64 | 113 | |||||||||||
| (Increase) Decrease in Fair Value of Marketable Securities | 2,098 | 2,301 | 2,259 | (1,167 | ) | |||||||||||
| Loss on Sales of Marketable Securities, net | 221 | -0- | 221 | 3,778 | ||||||||||||
| Funds from Operations Attributable to Common Shareholders (“FFO”) | 19,349 | 18,369 | 75,967 | 66,259 | ||||||||||||
| Adjustments: | ||||||||||||||||
| Amortization of Financing Costs | 869 | 613 | 2,992 | 2,384 | ||||||||||||
| Non-Recurring Other Expense (1) | 295 | 221 | 1,139 | 846 | ||||||||||||
| Normalized Funds from Operations Attributable to Common Shareholders (“Normalized FFO”) | $ | 20,513 | $ | 19,203 | $ | 80,098 | $ | 69,489 | ||||||||
| (1) | Consists of one-time legal and professional fees ($295 and $579, respectively) and costs associated with acquisition not completed ($0 and $560, respectively) for the three months and year ended December 31,2025. Consists of one-time legal and professional fees ($209 and $452, respectively), costs associated with acquisition not completed ($12 and $12, respectively) and costs associated with the liquidation/sale of inventory in a particular sales center ($0 and $382, respectively) for the three months and year ended December 31, 2024. |
| UMH Properties, Inc. | Fourth Quarter FY 2025 Supplemental Information |
|
Market Capitalization, Debt and Coverage Ratios
(in thousands except per share data) (unaudited)
| Year Ended | ||||||||
| December 31, 2025 | December 31, 2024 | |||||||
| Shares Outstanding | 84,850 | 81,909 | ||||||
| Market Price Per Share | $ | 15.91 | $ | 18.88 | ||||
| Equity Market Capitalization | $ | 1,349,971 | $ | 1,546,449 | ||||
| Total Debt | 761,227 | 614,722 | ||||||
| Preferred | 322,899 | 320,572 | ||||||
| Total Market Capitalization | $ | 2,434,097 | $ | 2,481,743 | ||||
| Total Debt | $ | 761,227 | $ | 614,722 | ||||
| Less: Cash and Cash Equivalents | (72,100 | ) | (99,720 | ) | ||||
| Net Debt | 689,127 | 515,002 | ||||||
| Less: Marketable Securities at Fair Value (“Securities”) | (23,758 | ) | (31,883 | ) | ||||
| Net Debt Less Securities | $ | 665,369 | $ | 483,119 | ||||
| Interest Expense | $ | 29,683 | $ | 27,287 | ||||
| Capitalized Interest | 5,928 | 5,976 | ||||||
| Preferred Dividends | 20,533 | 19,163 | ||||||
| Total Fixed Charges | $ | 56,144 | $ | 52,426 | ||||
| Adjusted EBITDA excluding Non-Recurring Other Expense | $ | 127,284 | $ | 113,958 | ||||
| Debt and Coverage Ratios | ||||||||
| Net Debt / Total Market Capitalization | 28.3 | % | 20.8 | % | ||||
| Net Debt Plus Preferred / Total Market Capitalization | 41.6 | % | 33.7 | % | ||||
| Net Debt Less Securities / Total Market Capitalization | 27.3 | % | 19.5 | % | ||||
| Net Debt Less Securities Plus Preferred / Total Market Capitalization | 40.6 | % | 32.4 | % | ||||
| Interest Coverage | 3.6 | x | 3.4 | x | ||||
| Fixed Charge Coverage | 2.3 | x | 2.2 | x | ||||
| Net Debt / Adjusted EBITDA excluding Non-Recurring Other Expense | 5.4 | x | 4.5 | x | ||||
| Net Debt Less Securities / Adjusted EBITDA excluding Non-Recurring Other Expense | 5.2 | x | 4.3 | x | ||||
| Net Debt Plus Preferred / Adjusted EBITDA excluding Non-Recurring Other Expense | 8.0 | x | 7.4 | x | ||||
| Net Debt Less Securities Plus Preferred / Adjusted EBITDA excluding Non-Recurring Other Expense | 7.8 | x | 7.1 | x | ||||
| UMH Properties, Inc. | Fourth Quarter FY 2025 Supplemental Information |
|
(in thousands) (unaudited)
| Year Ended | ||||||||
| December 31, 2025 |
December 31, 2024 |
|||||||
| Debt Outstanding | ||||||||
| Mortgages Payable: | ||||||||
| Fixed Rate Mortgages | $ | 562,095 | 489,271 | |||||
| Unamortized Debt Issuance Costs | (5,966 | ) | (3,731 | ) | ||||
| Mortgages, Net of Unamortized Debt Issuance Costs | $ | 556,129 | $ | 485,540 | ||||
| Loans Payable: | ||||||||
| Unsecured Line of Credit | $ | -0- | $ | -0- | ||||
| Other Loans Payable | 28,464 | 29,512 | ||||||
| Total Loans Before Unamortized Debt Issuance Costs | 28,464 | 29,512 | ||||||
| Unamortized Debt Issuance Costs | (768 | ) | (1,233 | ) | ||||
| Loans, Net of Unamortized Debt Issuance Costs | $ | 27,696 | $ | 28,279 | ||||
| Series A Bonds Payable: | ||||||||
| Series A Bonds | $ | 102,670 | $ | 102,670 | ||||
| Unamortized Debt Issuance Costs | (919 | ) | (1,767 | ) | ||||
| Series A Bonds, Net of Unamortized Debt Issuance Costs | $ | 101,751 | $ | 100,903 | ||||
| Series B Bonds Payable: | ||||||||
| Series B Bonds | $ | 80,230 | $ | -0- | ||||
| Unamortized Debt Issuance Costs | (4,579 | ) | -0- | |||||
| Series B Bonds, Net of Unamortized Debt Issuance Costs | $ | 75,651 | $ | -0- | ||||
| Total Debt, Net of Unamortized Debt Issuance Costs | $ | 761,227 | $ | 614,722 | ||||
| % Fixed/Floating | ||||||||
| Fixed | 99.3 | % | 99.1 | % | ||||
| Floating | 0.7 | % | 0.9 | % | ||||
| Total | 100.0 | % | 100.0 | % | ||||
| Weighted Average Interest Rates (1) | ||||||||
| Mortgages Payable | 4.73 | % | 4.18 | % | ||||
| Loans Payable | 6.38 | % | 6.54 | % | ||||
| Series A Bonds Payable | 4.72 | % | 4.72 | % | ||||
| Series B Bonds Payable | 5.85 | % | N/A | |||||
| Total Average | 4.90 | % | 4.38 | % | ||||
| Weighted Average Maturity (Years) | ||||||||
| Mortgages Payable | 6.1 | 4.4 | ||||||
| (1) | Weighted average interest rates do not include the effect of unamortized debt issuance costs. |
| UMH Properties, Inc. | Fourth Quarter FY 2025 Supplemental Information |
|
(in thousands) (unaudited)
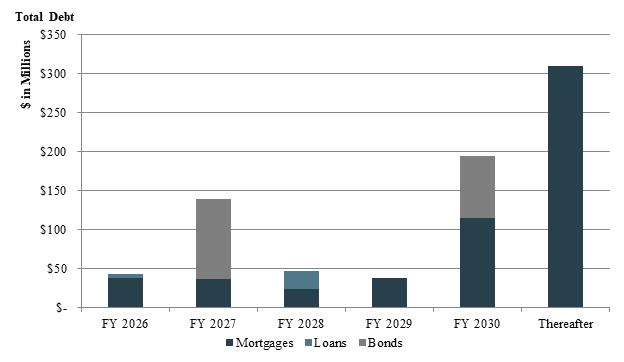
As of December 31, 2025:
| Year Ended | Mortgages | Loans | Bonds | Total | % of Total | |||||||||||||||
| 2026 | $ | 38,179 | $ | 5,128 | $ | -0- | $ | 43,307 | 5.6 | % | ||||||||||
| 2027 | 37,037 | -0- | 102,670 | (1) | 139,707 | 18.1 | % | |||||||||||||
| 2028 | 23,970 | 23,336 | -0- | 47,306 | 6.1 | % | ||||||||||||||
| 2029 | 38,790 | -0- | -0- | 38,790 | 5.0 | % | ||||||||||||||
| 2030 | 114,739 | -0- | 80,230 | (2) | 194,969 | 25.2 | % | |||||||||||||
| Thereafter | 309,380 | -0- | -0- | 309,380 | 40.0 | % | ||||||||||||||
| Total Debt Before Unamortized Debt Issuance Costs | 562,095 | 28,464 | 182,900 | 773,459 | 100.0 | % | ||||||||||||||
| Unamortized Debt Issuance Costs | (5,966 | ) | (768 | ) | (5,498 | ) | (12,232 | ) | ||||||||||||
| Total Debt, Net of Unamortized Debt Issuance Costs | $ | 556,129 | $ | 27,696 | $ | 177,402 | $ | 761,227 | ||||||||||||
| (1) | Represents $102.7 million balance outstanding of the Company’s Series A Bonds due February 28, 2027. |
| (2) | Represents $80.2 million balance outstanding of the Company’s Series B Bonds due June 30, 2030. |
| UMH Properties, Inc. | Fourth Quarter FY 2025 Supplemental Information |
|
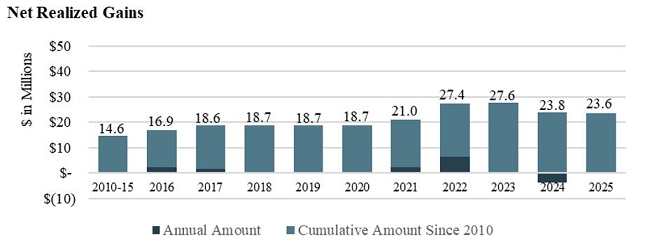
Securities Portfolio Performance
(in thousands) (unaudited)
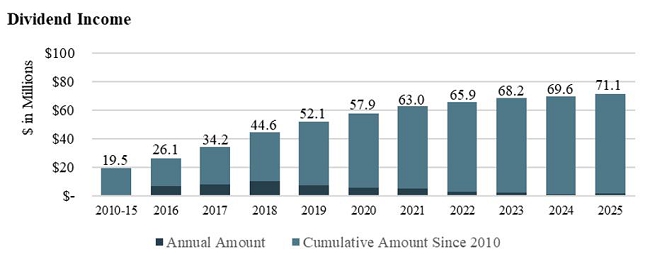
| Year Ended | Securities Available for Sale |
Dividend Income | Net Realized Gain (Loss) on Sale of Securities |
Net Realized Gain (Loss) on Sale of Securities & Dividend Income |
||||||||||||
| 2010-2015 | 75,011 | $ | 19,465 | $ | 14,618 | $ | 34,083 | |||||||||
| 2016 | 108,755 | 6,636 | 2,285 | 8,921 | ||||||||||||
| 2017 | 132,964 | 8,135 | 1,747 | 9,882 | ||||||||||||
| 2018 | 99,596 | 10,367 | 20 | 10,387 | ||||||||||||
| 2019 | 116,186 | 7,535 | -0- | 7,535 | ||||||||||||
| 2020 | 103,172 | 5,729 | -0- | 5,729 | ||||||||||||
| 2021 | 113,748 | 5,098 | 2,342 | 7,440 | ||||||||||||
| 2022 | 42,178 | 2,903 | 6,394 | 9,297 | ||||||||||||
| 2023 | 34,506 | 2,318 | 183 | 2,501 | ||||||||||||
| 2024 | 31,883 | 1,452 | (3,778 | ) | (2,326 | ) | ||||||||||
| 2025 | 23,758 | 1,477 | (221 | ) | 1,256 | |||||||||||
| $ | 71,115 | $ | 23,590 | $ | 94,705 | |||||||||||
| UMH Properties, Inc. | Fourth Quarter FY 2025 Supplemental Information |
|
(unaudited)
| December 31, 2025 | December 31, 2024 | % Change | ||||||||||
| UMH Communities (1) | 142 | 137 | 3.6% | |||||||||
| Total Sites | 26,610 | 25,896 | 2.8% | |||||||||
| Occupied Sites | 23,435 | 22,611 | 824 sites, 3.6% | |||||||||
| Occupancy % | 88.1 | % | 87.3 | % | 80 bps | |||||||
| Total Rentals | 10,904 | 10,333 | 5.5% | |||||||||
| Occupied Rentals | 10,227 | 9,715 | 5.3% | |||||||||
| Rental Occupancy % | 93.8 | % | 94.0 | % | (20 bps) | |||||||
| Monthly Rent Per Site | $ | 572 | $ | 544 | 5.1% | |||||||
| Monthly Rent Per Home Rental Including Site | $ | 1,044 | $ | 990 | 5.5% | |||||||
| State | Number | Total Acreage |
Developed Acreage |
Vacant Acreage |
Total Sites |
Occupied Sites |
Occupancy Percentage |
Monthly Per Site |
Total Rentals |
Occupied Rentals |
Rental Occupancy Percentage |
Monthly Rent Per Home Rental (3) |
||||||||||||||||||||||||||||||||||||
| Pennsylvania | 53 | 2,392 | 1,909 | 483 | 7,994 | 7,033 | 88.0 | % | $ | 595 | 3,322 | 3,097 | 93.2 | % | $ | 1,031 | ||||||||||||||||||||||||||||||||
| Ohio | 38 | 2,069 | 1,557 | 512 | 7,381 | 6,538 | 88.6 | % | $ | 529 | 3,204 | 2,996 | 93.5 | % | $ | 1,000 | ||||||||||||||||||||||||||||||||
| Indiana | 14 | 1,111 | 929 | 182 | 4,091 | 3,662 | 89.5 | % | $ | 532 | 2,049 | 1,926 | 94.0 | % | $ | 1,034 | ||||||||||||||||||||||||||||||||
| Tennessee | 9 | 733 | 419 | 314 | 2,038 | 1,893 | 92.9 | % | $ | 597 | 961 | 928 | 96.6 | % | $ | 1,097 | ||||||||||||||||||||||||||||||||
| New York (2) | 8 | 819 | 327 | 492 | 1,369 | 1,194 | 87.2 | % | $ | 664 | 512 | 469 | 91.6 | % | $ | 1,201 | ||||||||||||||||||||||||||||||||
| New Jersey | 7 | 428 | 264 | 164 | 1,530 | 1,463 | 95.6 | % | $ | 746 | 40 | 36 | 90.0 | % | $ | 1,336 | ||||||||||||||||||||||||||||||||
| Michigan | 4 | 241 | 222 | 19 | 1,090 | 947 | 86.9 | % | $ | 532 | 422 | 402 | 95.3 | % | $ | 1,102 | ||||||||||||||||||||||||||||||||
| Maryland | 3 | 159 | 124 | 35 | 259 | 218 | 84.2 | % | $ | 650 | -0- | -0- | N/A | N/A | ||||||||||||||||||||||||||||||||||
| Alabama | 2 | 69 | 62 | 7 | 292 | 161 | 55.1 | % | $ | 243 | 145 | 137 | 94.5 | % | $ | 1,131 | ||||||||||||||||||||||||||||||||
| South Carolina | 2 | 157 | 55 | 102 | 321 | 243 | 75.7 | % | $ | 312 | 190 | 187 | 98.4 | % | $ | 1,145 | ||||||||||||||||||||||||||||||||
| Georgia | 2 | 66 | 66 | -0- | 245 | 83 | 33.9 | % | $ | 389 | 59 | 49 | 83.1 | % | $ | 1,181 | ||||||||||||||||||||||||||||||||
|
Total UMH as of December 31, 2025 (1) |
142 | 8,244 | 5,934 | 2,310 | 26,610 | 23,435 | 88.1 | % | $ | 572 | 10,904 | 10,227 | 93.8 | % | $ | 1,044 | ||||||||||||||||||||||||||||||||
| (1) | Excludes two Florida communities and one Pennsylvania community owned through joint ventures with Nuveen Real Estate in which the company has a 40% interest for 2025. |
| (2) | Total and Vacant Acreage of 220 acres for Mountain View Estates property is included in the above summary. |
| (3) | Includes home and site rent charges. |
| UMH Properties, Inc. | Fourth Quarter FY 2025 Supplemental Information |
|
(in thousands) (unaudited)
| For Three Months Ended | For the Year Ended | |||||||||||||||||||||||||||||||
| December 31, 2025 |
December 31, 2024 |
Change | % Change | December 31, 2025 |
December 31, 2024 |
Change | % Change | |||||||||||||||||||||||||
| Same Property Community Net Operating Income (“NOI”) | ||||||||||||||||||||||||||||||||
| Rental and Related Income | $ | 56,615 | $ | 52,623 | $ | 3,992 | 7.6 | % | $ | 221,542 | $ | 204,678 | $ | 16,864 | 8.2 | % | ||||||||||||||||
| Community Operating Expenses | 22,496 | 20,370 | 2,126 | 10.4 | % | 87,018 | 81,245 | 5,773 | 7.1 | % | ||||||||||||||||||||||
| Same Property Community NOI | $ | 34,119 | $ | 32,253 | $ | 1,866 | 5.8 | % | $ | 134,524 | $ | 123,433 | $ | 11,091 | 9.0 | % | ||||||||||||||||
| December 31, 2025 | December 31, 2024 | Change | ||||||||||
| Total Sites | 25,765 | 25,619 | 0.6% | |||||||||
| Occupied Sites | 22,759 | 22,405 | 354 sites, 1.6% | |||||||||
| Occupancy % | 88.3 | % | 87.5 | % | 80 bps | |||||||
| Number of Properties | 134 | 134 | N/A | |||||||||
| Total Rentals | 10,731 | 10,183 | 5.4% | |||||||||
| Occupied Rentals | 10,064 | 9,570 | 5.2% | |||||||||
| Rental Occupancy | 93.8 | % | 94.0 | % | (20 bps) | |||||||
| Monthly Rent Per Site | $ | 571 | $ | 544 | 5.0% | |||||||
| Monthly Rent Per Home Rental Including Site | $ | 1,041 | $ | 987 | 5.5% | |||||||
Same Property includes all UMH communities owned as of January 1, 2024, with the exception of Memphis Blues, Duck River Estates and River Bluff Estates.
| UMH Properties, Inc. | Fourth Quarter FY 2025 Supplemental Information |
|
(dollars in thousands)
| Year
of Acquisition |
Number
of Communities |
Sites |
Occupancy % at Acquisition |
Purchase Price |
Price Per Site |
Total Acres | |||||||||||||||||
| 2021 | 3 | 543 | 59 | % | $ | 18,300 | $ | 34 | 113 | ||||||||||||||
| 2022 | 7 | 1,480 | 65 | % | $ | 86,223 | $ | 58 | 461 | ||||||||||||||
| 2023 | 1 | 118 | -0- | % | $ | 3,650 | $ | 31 | 26 | ||||||||||||||
| 2025 | 5 | 587 | 78 | % | $ | 41,825 | $ | 71 | 160 | ||||||||||||||
2025 Acquisitions
| Community | Date of Acquisition | State | Number of Sites | Purchase Price |
Number of Acres |
Occupancy | ||||||||||||||
| Cedar Grove | March 24, 2025 | NJ | 186 | $ | 17,000 | 25 | 100 | % | ||||||||||||
| Maplewood | March 24, 2025 | NJ | 80 | 7,600 | 13 | 100 | % | |||||||||||||
| Conowingo Court | July 2, 2025 | MD | 142 | 9,855 | 54 | 70 | % | |||||||||||||
| Maybelle Manor | July 2, 2025 | MD | 49 | 4,770 | 28 | 100 | % | |||||||||||||
| Albany Dunes | October 7, 2025 | GA | 130 | 2,600 | 40 | 32 | % | |||||||||||||
| Total 2025 | 587 | $ | 41,825 | 160 | 78 | % | ||||||||||||||
| UMH Properties, Inc. | Fourth Quarter FY 2025 Supplemental Information |
|
Investors and analysts following the real estate industry utilize funds from operations available to common shareholders (“FFO”), normalized funds from operations available to common shareholders (“Normalized FFO”), Community NOI, Same Property Community NOI, and earnings before interest, taxes, depreciation, amortization and acquisition costs (“Adjusted EBITDA excluding Non-Recurring Other Expense”), variously defined, as supplemental performance measures. While the Company believes net income (loss) available to common shareholders, as defined by accounting principles generally accepted in the United States of America (U.S. GAAP), is the most appropriate measure, it considers Community NOI, Same Property Community NOI, Adjusted EBITDA excluding Non-Recurring Other Expense, FFO and Normalized FFO, given their wide use by and relevance to investors and analysts, appropriate supplemental performance measures. FFO, reflecting the assumption that real estate asset values rise or fall with market conditions, principally adjusts for the effects of U.S. GAAP depreciation and amortization of real estate assets. FFO also adjusts for the effects of the change in the fair value of marketable securities and gains and losses realized on marketable securities. Normalized FFO reflects the same assumptions as FFO except that it also adjusts for amortization of financing costs and certain one-time charges. Community NOI and Same Property Community NOI provide a measure of rental operations and do not factor in depreciation and amortization and non-property specific expenses such as general and administrative expenses. Adjusted EBITDA excluding Non-Recurring Other Expense provides a tool to further evaluate the ability to incur and service debt and to fund dividends and other cash needs. In addition, Community NOI, Same Property Community NOI, Adjusted EBITDA, excluding Non-Recurring Other Expense, FFO and Normalized FFO are commonly used in various ratios, pricing multiples, yields and returns and valuation of calculations used to measure financial position, performance and value.
FFO, as defined by The National Association of Real Estate Investment Trusts (“Nareit”), is calculated to be equal to net income (loss) applicable to common shareholders, as defined by U.S. GAAP, excluding certain gains or losses from sales of previously depreciated real estate assets, impairment charges related to depreciable real estate assets, the change in the fair value of marketable securities, and the gain or loss on the sale of marketable securities plus certain non-cash items such as real estate asset depreciation and amortization. Included in the Nareit FFO White Paper - 2018 Restatement, is an option pertaining to assets incidental to our main business in the calculation of Nareit FFO to make an election to include or exclude gains and losses on the sale of these assets, such as marketable equity securities, and include or exclude mark-to-market changes in the value recognized on these marketable equity securities. In conjunction with the adoption of the FFO White Paper - 2018 Restatement, for all periods presented, we have elected to exclude the gains and losses realized on marketable securities and change in the fair value of marketable securities from our FFO calculation. Nareit created FFO as a non-GAAP supplemental measure of REIT operating performance.
Normalized FFO is calculated as FFO excluding amortization and certain one-time charges.
Normalized FFO per Diluted Common Share is calculated using diluted weighted shares outstanding of 85.4 million and 84.7 million shares for the three months and year ended December 31, 2025, respectively, and 81.2 million and 74.9 million shares for the three months and year ended December 31, 2024, respectively. Common stock equivalents resulting from stock options in the amount of 627,000 for the year ended December 31, 2025, and 1.1 million and 798,000 for the three months and year ended December 31, 2024, respectively, were included in the computation of Diluted Net Income per share. Common stock equivalents resulting from stock options in the amount 356,000 shares for the three months ended December 31, 2025 were excluded from the computation of Diluted Net Income (Loss) per Share as their effect would have been anti-dilutive.
Community NOI is calculated as rental and related income less community operating expenses such as real estate taxes, repairs and maintenance, community salaries, utilities, insurance and other expenses.
Same Property Community NOI is calculated as Community NOI, using all properties owned as of January 1, 2024, with the exception of Memphis Blues, Duck River Estates and River Bluff Estates.
Adjusted EBITDA excluding Non-Recurring Other Expense is calculated as net income (loss) plus interest expense, franchise taxes, depreciation, the change in the fair value of marketable securities and the gain (loss) on sales of marketable securities, adjusted for non-recurring other expenses.
Community NOI, Same Property Community NOI, Adjusted EBITDA excluding Non-Recurring Other Expense, FFO and Normalized FFO do not represent cash generated from operating activities in accordance with U.S. GAAP and are not necessarily indicative of cash available to fund cash needs, including the repayment of principal on debt and payment of dividends and distributions. Community NOI, Same Property Community NOI, Adjusted EBITDA excluding Non-Recurring Other Expense, FFO and Normalized FFO should not be considered as substitutes for net income (loss) applicable to common shareholders (calculated in accordance with U.S. GAAP) as a measure of results of operations, or cash flows (calculated in accordance with U.S. GAAP) as a measure of liquidity. Community NOI, Same Property Community NOI, Adjusted EBITDA excluding Non-Recurring Other Expense, FFO and Normalized FFO as currently calculated by the Company may not be comparable to similarly titled, but variously calculated, measures of other REITs.
| UMH Properties, Inc. | Fourth Quarter FY 2025 Supplemental Information |
|