UNITED STATES
SECURITIES AND EXCHANGE COMMISSION
WASHINGTON, D.C. 20549
FORM 8-K
CURRENT REPORT
Pursuant to Section 13 or 15(d) of the Securities Exchange Act of 1934
Date of Report (Date of earliest event reported): November 13, 2024
SBC Medical Group Holdings Incorporated
(Exact Name of Registrant as Specified in Its Charter)
| Delaware | 001-41462 | 88-1192288 | ||
|
(State or Other Jurisdiction of Incorporation) |
(Commission File Number) |
(IRS Employer Identification No.) |
|
200 Spectrum Center Dr. STE 300 Irvine, CA |
92618 | |
| (Address of Principal Executive Offices) | (Zip Code) |
949-593-0250
(Registrant’s Telephone Number, Including Area Code)
Pono Capital Two, Inc.
643 Ilalo St. #102
Honolulu, Hawaii 96813
(Former Name or Former Address, if Changed Since Last Report)
Check the appropriate box below if the Form 8-K filing is intended to simultaneously satisfy the filing obligation of the registrant under any of the following provisions:
| ☐ | Written communications pursuant to Rule 425 under the Securities Act (17 CFR 230.425) |
| ☐ | Soliciting material pursuant to Rule 14a-12 under the Exchange Act (17 CFR 240.14a-12) |
| ☐ | Pre-commencement communications pursuant to Rule 14d-2(b) under the Exchange Act (17 CFR 240.14d-2(b)) |
| ☐ | Pre-commencement communications pursuant to Rule 13e-4(c) under the Exchange Act (17 CFR 240.13e-4(c)) |
Securities registered pursuant to Section 12(b) of the Act:
| Title of each class | Trading Symbol(s) | Name of each exchange on which registered | ||
| Common Stock, $0.0001 par value per share | SBC | The Nasdaq Stock Market LLC | ||
| Redeemable Warrants, each whole warrant exercisable for one share of Common Stock at an exercise price of $11.50 per share | SBCWW | The Nasdaq Stock Market LLC |
Indicate by check mark whether the registrant is an emerging growth company as defined in Rule 405 of the Securities Act of 1933 or Rule 12b-2 of the Securities Exchange Act of 1934.
Emerging growth company ☒
If an emerging growth company, indicate by check mark if the registrant has elected not to use the extended transition period for complying with any new or revised financial accounting standards provided pursuant to Section 13(a) of the Exchange Act. ☐
Item 2.02 Results of Operations and Financial Condition.
On November 13, 2024, SBC Medical Group Holdings Incorporated, or the Company, is issuing a press release announcing its results for the quarter ended September 30, 2024. The press release is attached as Exhibit 99.1 and is incorporated herein by reference.
Attached hereto as Exhibit 99.2 and incorporated by reference herein is an investor presentation regarding results for the quarter ended September 30, 2024, or the Investor Presentation. The Investor Presentation will be posted to https://sbc-holdings.com/en/ir/ir-presentation immediately after the filing of this Current Report.
The information contained in this Item 2.02, including Exhibit 99.1 and 99.2, is being “furnished” and shall not be deemed “filed” for purposes of Section 18 of the Securities Exchange Act of 1934, as amended, or otherwise subject to the liability of that Section or Sections 11 and 12(a)(2) of the Securities Act of 1933, as amended. The information in this Current Report, including the exhibits, shall not be incorporated by reference in any filing with the U.S. Securities and Exchange Commission made by the Company, whether made before or after the date hereof, regardless of any general incorporation language in such filing.
Item 9.01 Financial Statement and Exhibits
(d) Exhibits.
| Exhibit No. | Description | |
| 99.1 | Press Release, dated November 13, 2024, entitled “SBC Medical Group Holdings Inc. Reports Third Quarter 2024 Financial Results” | |
| 99.2 | Investor Presentation, entitled “2024 Third Quarter Financial Highlights” | |
| 104 | The cover page of this Current Report on Form 8-K, formatted in inline XBRL (included as Exhibit 101). |
SIGNATURE
Pursuant to the requirements of the Securities Exchange Act of 1934, the registrant has duly caused this report to be signed on its behalf by the undersigned, hereunto duly authorized.
| SBC Medical Group Holdings Incorporated | ||
| Dated: November 13, 2024 | By: | /s/ Ryoji Murata |
| Ryoji Murata | ||
| Chief Financial Officer | ||
Exhibit 99.1
SBC Medical Group Holdings Inc. Reports Third Quarter 2024 Financial Results
Irvine, California, U.S.A., Nov, 13, 2024 (Newswire) – SBC Medical Group Holdings Incorporated (“SBC Medical”, or the “Company”), a global owner, operator and provider of management services and products to cosmetic treatment centers, today announced its unaudited financial results for the third quarter ended September 30, 2024.
Third Quarter 2024 Highlights
| ● | Total revenues for the three months ended September 30, 2024 were $53 million, representing an increase of 12% from $47 million in the same quarter of 2023. | ||
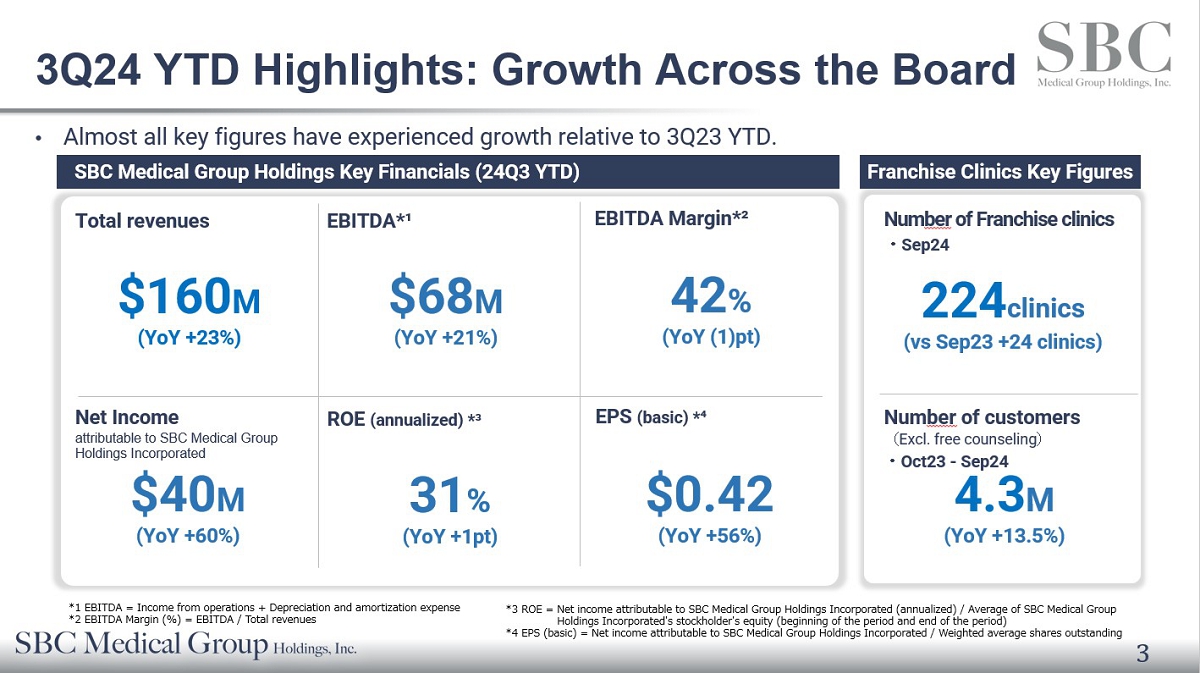
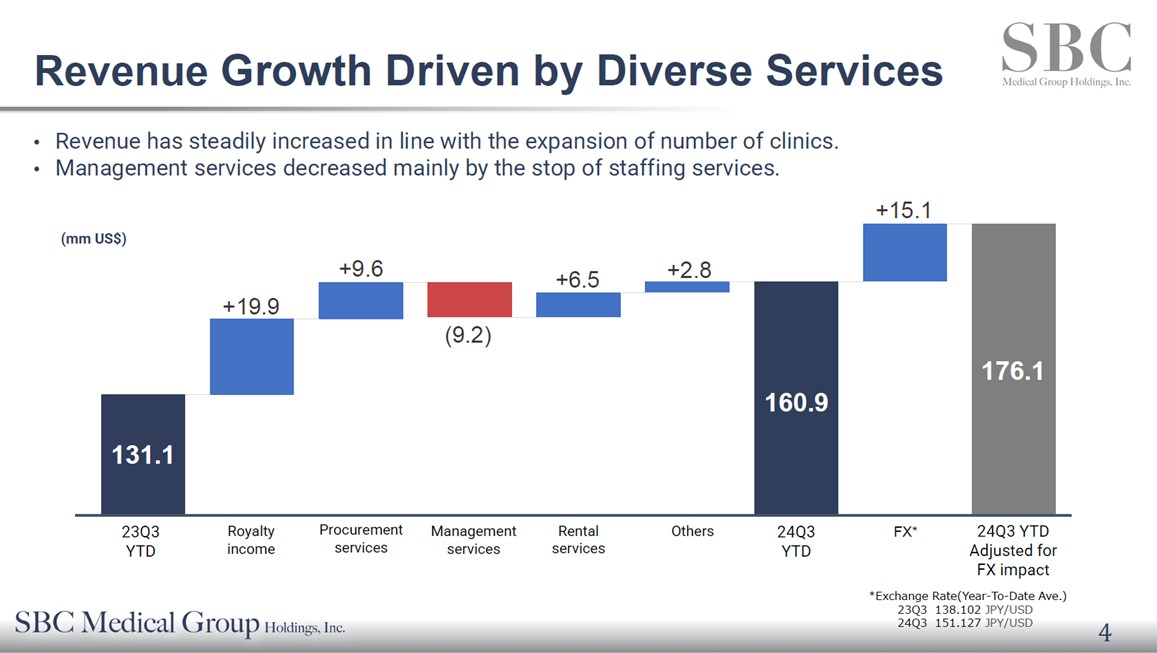
| ● | Total revenues for the nine months ended September 30, 2024 was $160 million, representing an increase of 23% from $131 million in the same period of 2023. | ||
| ● | Income from operations for the three months ended September 30, 2024 was $13 million, representing a decrease by 31% from the same quarter in 2023. | ||
| ○ | This result was impacted by $12.8 million of stock-based compensation expense related to the Company’s listing process. | ||
| ● | Income from operations for the nine months ended September 30, 2024 was $65.5 million, representing an increase of 40.5% from the same period in 2023. | ||
| ○ | This result is impacted by $12.8 million of stock based compensation expense related to the Company’s listing process. | ||
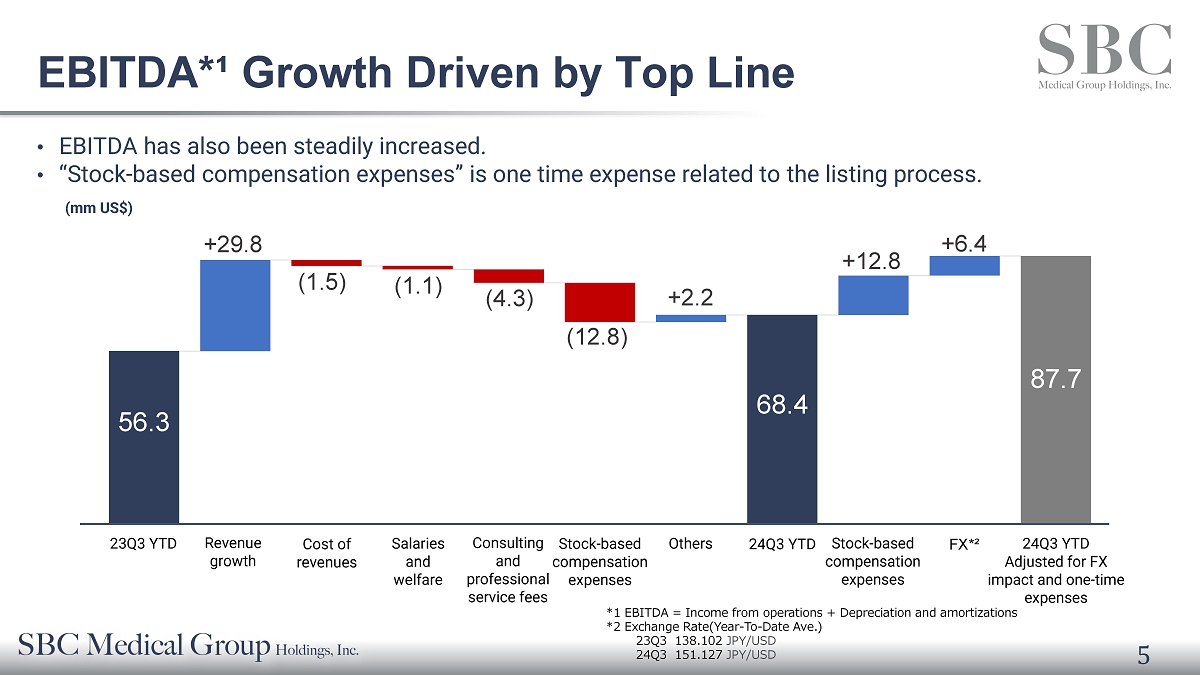
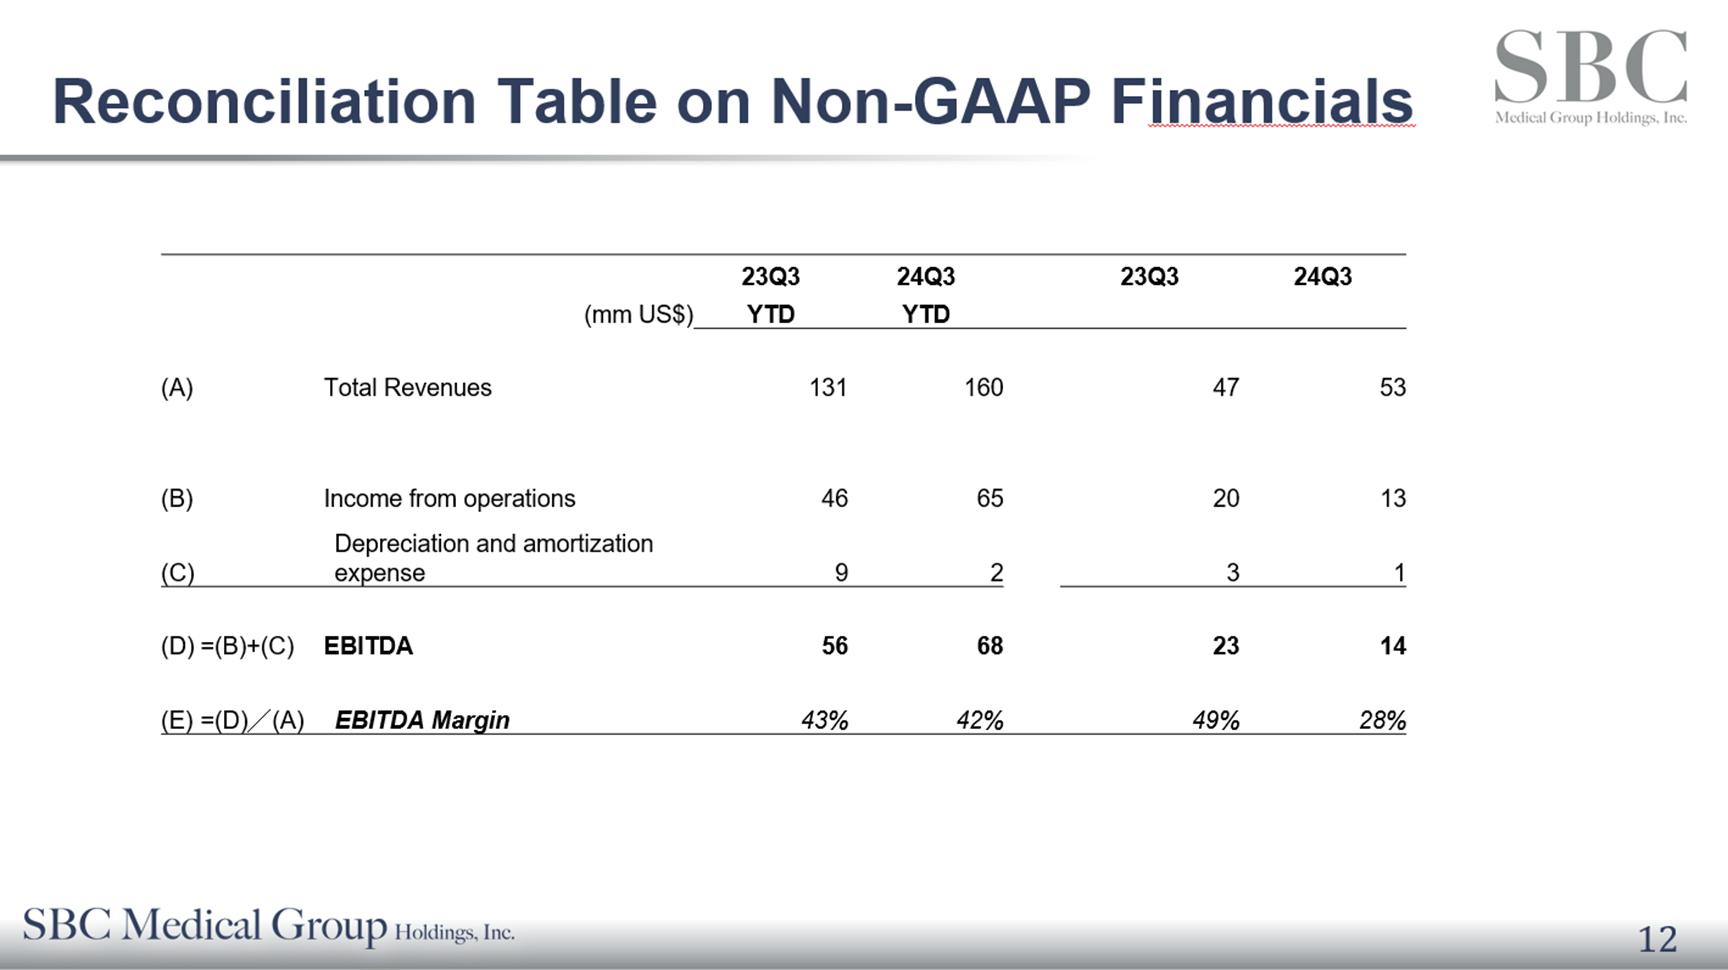
| ● | EBITDA1, which is calculated by adding depreciation and amortization expense to income from operations, for the nine months ended September 30, 2024 was $68 million, representing an increase of 21% from the same period in 2023. EBITDA margin was 42% for the nine months ended September 30, 2024 | ||
| ● | Net income attributable to SBC Medical Group Holdings Incorporated for the three months ended September 30, 2024 was $2 million, compared to $8 million in the same quarter of 2023. |
| ● | Net income attributable to SBC Medical Group Holdings Incorporated for the nine months ended September 30, 2024 was $40 million, an increase of 60% from $25 million in the same period of 2023. |
| ● | Number of partner clinics was 224 as of September 30, 2024, representing an increase by 24 from September 30, 2023. |
1 EBITDA and EBITDA Margin are non-GAAP financial measures. For more information on non-GAAP financial measure, please see the section of “Use of Non-GAAP Financial Measures” and the table captioned “Unaudited Reconciliations of GAAP and Non-GAAP Results.”
| ● | Number of customers in the last twelve months was 4.3 million, representing an year-over-year increase of 13.5%. |
| ● | Return on equity (annualized), which is defined as annualized net income attributable to the Company divided by the average of shareholder’s equity as of December 31, 2023 and September 30, 2024, was 31% for the nine months ended September 30, 2024, representing a year-over-year increase of one percentage points. |
| ● | Earnings per share (basic), which is defined as net income attributable to the Company divided by weighted average number of outstanding shares, was $0.42 for the nine months ended September 30, 2024, representing a year-over-year increase of 56%. |
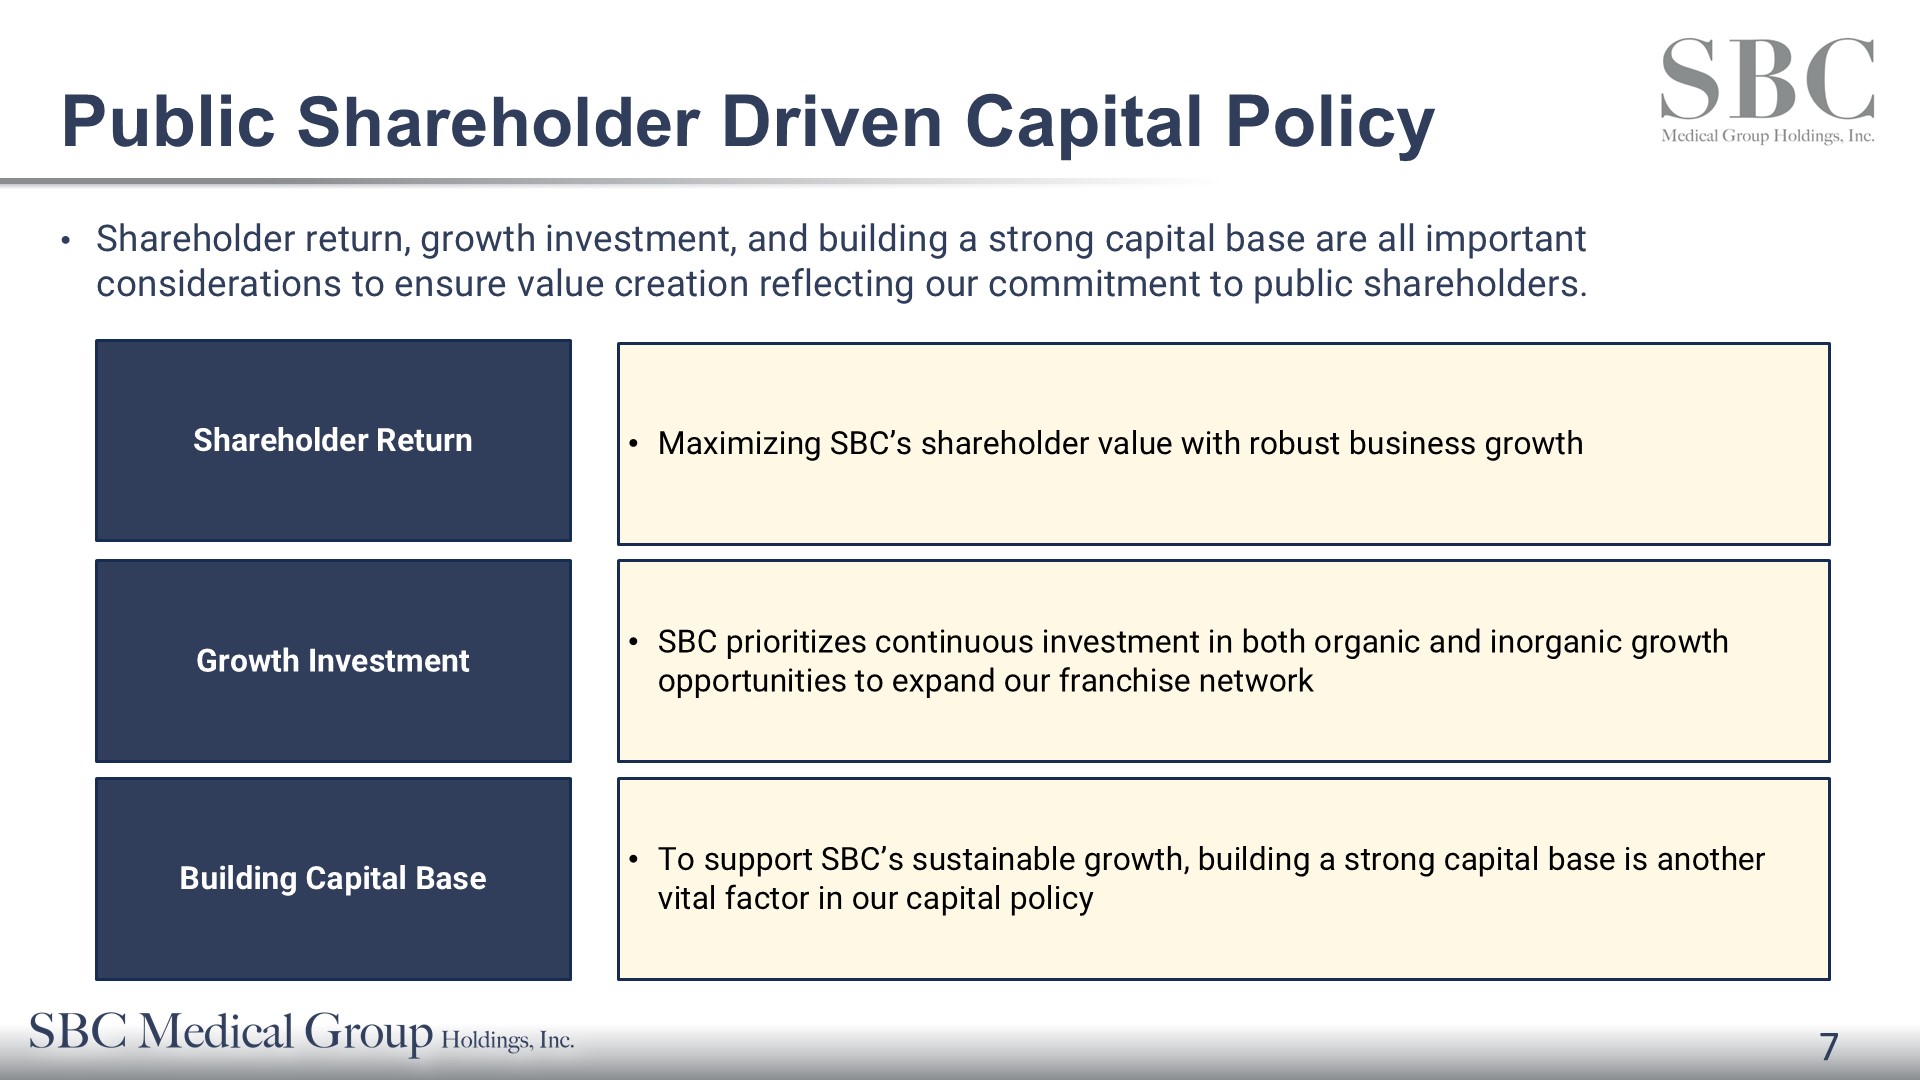
“Our first earnings release as a publicly listed company marks a significant milestone for SBC Medical. After completing a successful business combination with Pono Capital Two, SBC Medical began trading on Nasdaq under the ticker symbol ‘SBC’ on September 18, 2024.” said Yoshiyuki Aikawa, Chairman and Chief Executive Officer of SBC Medical. “This quarter’s strong results, with total revenue reaching USD161 million—an impressive 23% increase year-over-year—and a net income rise of 59%, highlight the positive impact of our strategic initiatives such as restructuring royalty fees and expanding our clinic network. Additionally, with a robust balance sheet supported by USD137 million in cash, we are committed to sustainable growth supported by a clear capital policy. We deeply value our shareholders and our focus on shareholder value will continue through consistent returns with robust business growth, strategic reinvestments, and a strong capital foundation, ensuring that all shareholders, including our minority investors, benefit from our growth and success.”
Third Quarter 2024 Financial Results
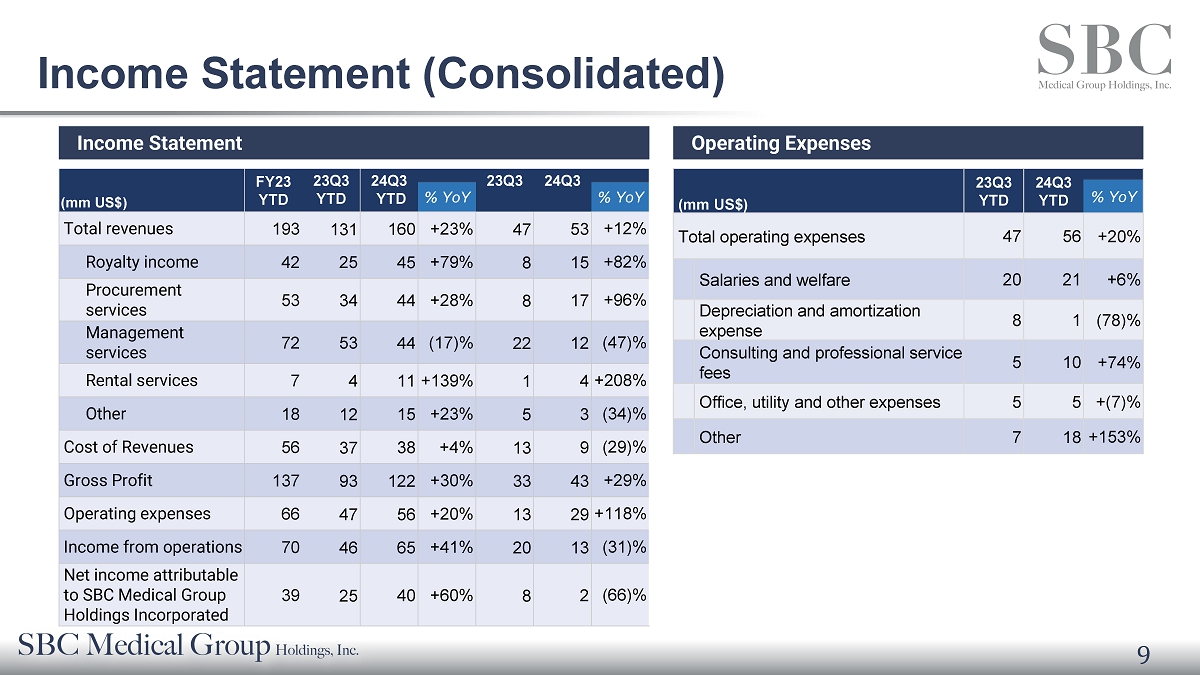
Total revenues for the nine months ended September 30, 2024 were $160 million, representing an increase of 23% from $131 million in the same period of 2023. Total revenues for the three months ended September 30, 2024 were $53 million, representing an increase of 12% from $47 million in the same quarter of 2023. These increases were mainly because the Company started charging patent and trademark fees to our franchisee clinics, and due to the expansion of numbers of our franchisee clinics Total operating expenses for the nine months ended September 30, 2024 were $56 million, representing an increase of 20% from $47 million in the same period of 2023. Total operating expenses for the three months ended September 30, 2024 were $29 million, representing an increase of 118% from $13 million in the same quarter of 2023. The increases in the total operating expenses were primarily due to listing-related consulting and professional fees, stock-based compensation, and higher office expenses.
EBITDA for the nine months ended September 30, 2024 was $68.4 million, representing an increase of 22% from $56.3 million in the same period of 2023, mainly due to revenue growth but partially offset by listing-related consulting and professional fees, stock-based compensations. EBITDA for the three months ended September 30, 2024 was $14.8 million, representing a decrease of 36% from $23.3 million in the same quarter of 2023, primarily due to listing-related consulting and professional fees, stock-based compensation, and higher office expenses.
Net income for the nine months ended September 30, 2024 was $40.1 million, compared to $24.3 million in the same period of 2023. The increase was attributed mainly to total revenue growth but partially offset by increase of total operating expenses. Net income for the three months ended September 30, 2024 was $2.8 million, compared to $8.1 million for the same quarter in 2023. The decrease was attributable mainly to higher operating expenses.
Cash Flow and Liquidity Highlights
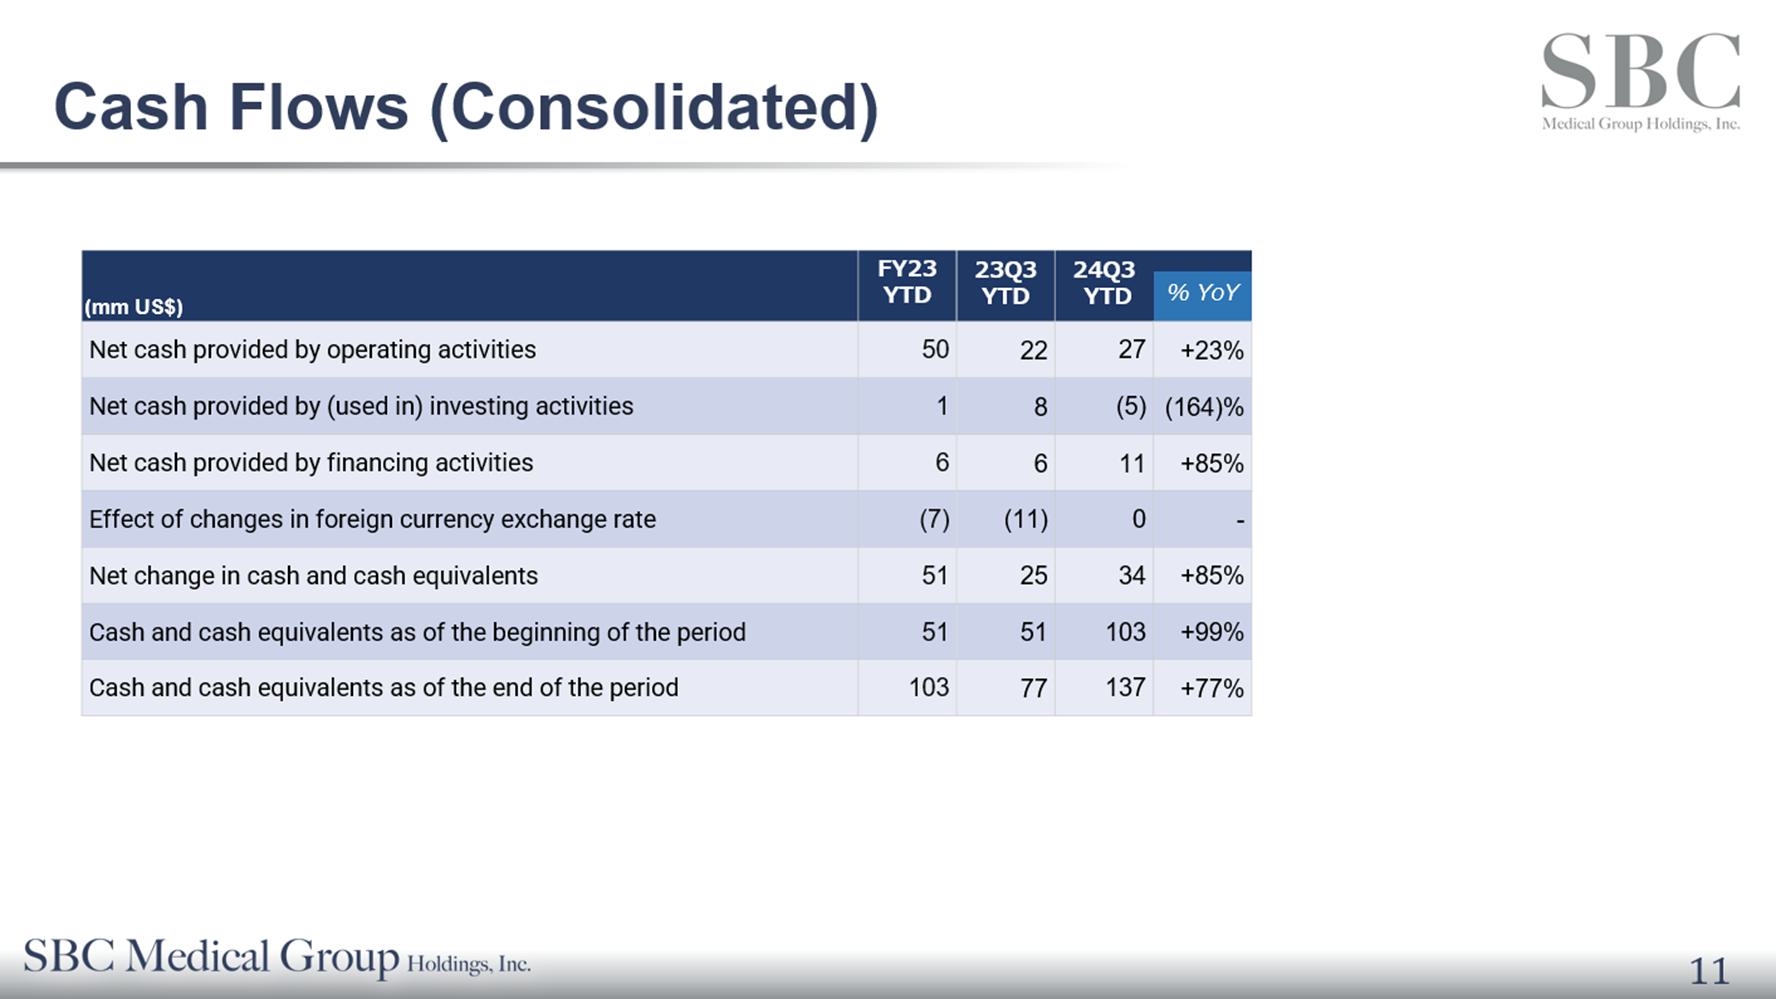
As of September 30, 2024, SBC Medical maintained a strong liquidity position, with cash and cash equivalents totaling $137.4 million, up from $103.0 million as of December 31, 2023. This increase reflects robust cash generation from operating activities, prudent investment management, and disciplined capital allocation strategies.
Operating Cash Flow
Net cash provided by operating activities was $27 million for the nine months ended September 30, 2024, an increase of 23% from $22 million for the same period in 2023. This growth was driven primarily by a $15 million rise in net income, bolstered by stock-based compensation expenses of $12.8 million related to the Company’s recent public listing, and an improvement in collection of accounts receivable. These positive factors were partially offset by changes in accounts payable and tax liabilities, which reflect the Company’s focus on efficiently managing working capital in a growing operational environment.
Investing Cash Flow
Net cash used in investing activities totaled $5 million during the nine months ended September 30, 2024, a decline from $8 million for the same period in 2023. Key contributor to this decrease included payments made on behalf of a related party of $5.2 million. The Company continues to strategically deploy capital towards high-impact assets that align with its long-term growth objectives.
Financing Cash Flow
Net cash provided by financing activities totaled $11 million during the nine months ended September 30, 2024, an increase from $6 million for the same period in 2023. Key contributor to this increase included proceeds from reverse recapitalization, net of transaction costs $11.7 million. The change reflects the Company’s emphasis on self-sustained growth through operating cash flows rather than external financing, with no significant new debt undertaken during the period.
Foreign Currency Impact
SBC Medical’s cash flows were impacted by a $0.5 million currency translation adjustment due to the depreciation of the Japanese yen against the U.S. dollar. The Company continues to monitor foreign currency exposure and employ strategies to mitigate risks associated with currency fluctuations.
With a robust cash reserve and sound operational cash flows, SBC Medical is confident in its ability to meet near-term liquidity requirements and to fund future growth initiatives. Management believes that the current cash position, alongside planned operational cash flow, will be sufficient to support the company’s business operations and strategic investments for the next 12 months.
About SBC Medical
SBC Medical, headquartered in Irvine, California and Tokyo, Japan, owns and provides management services and products to cosmetic treatment centers. The Company is primarily focused on providing comprehensive management services to franchisee clinics, including but not limited to advertising and marketing needs across various platforms (such as social media networks), staff management (such as recruitment and training), booking reservations for franchisee clinic customers, assistance with franchisee employee housing rentals and facility rentals, construction and design of franchisee clinics, medical equipment and medical consumables procurement (resale), the provision of cosmetic products to franchisee clinics for resale to clinic customers, licensure of the use of patent-pending and non-patented medical technologies, trademark and brand use, IT software solutions (including but not limited to remote medical consultations), management of the franchisee clinic’s customer rewards program (customer loyalty point program), and payment tools for the franchisee clinics.
For more information, visit https://sbc-holdings.com/ The Company uses non-GAAP measures, such as EBITDA, in evaluating its operating results and for financial and operational decision-making purposes.
Use of Non-GAAP Financial Measures
The Company believes that the non-GAAP financial measures help identify underlying trends in its business. The Company believes that the non-GAAP financial measures provide useful information about the Company’s results of operations, enhance the overall understanding of the Company’s past performance and future prospects and allow for greater visibility with respect to key metrics used by the Company’s management in its financial and operational decision-making.
The non-GAAP financial measures are not defined under U.S. GAAP and are not presented in accordance with U.S. GAAP. The non-GAAP financial measures have limitations as analytical tools, and when assessing the Company’s operating performance, cash flows or liquidity, investors should not consider them in isolation, or as a substitute for net loss, cash flows provided by operating activities or other consolidated statements of operations and cash flows data prepared in accordance with U.S. GAAP.
The Company mitigates these limitations by reconciling the non-GAAP financial measures to the most comparable U.S. GAAP performance measures, all of which should be considered when evaluating the Company’s performance.
For more information on the non-GAAP financial measures, please see the table captioned “Unaudited Reconciliations of GAAP and Non-GAAP Results.”
Forward Looking Statements
This press release contains forward-looking statements. Forward-looking statements are not historical facts or statements of current conditions, but instead represent only the Company’s beliefs regarding future events and performance, many of which, by their nature, are inherently uncertain and outside of the Company’s control. These forward-looking statements reflect the Company’s current views with respect to, among other things, the Company’s financial performance; growth in revenue and earnings; business prospects and opportunities; and capital deployment plans and liquidity. In some cases, forward-looking statements can be identified by the use of words such as “may,” “should,” “expects,” “anticipates,” “contemplates,” “estimates,” “believes,” “plans,” “projected,” “predicts,” “potential,” or “hopes” or the negative of these or similar terms. The Company cautions readers not to place undue reliance upon any forward-looking statements, which are current only as of the date of this release and are subject to various risks, uncertainties, assumptions, or changes in circumstances that are difficult to predict or quantify. The forward-looking statements are based on management’s current expectations and are not guarantees of future performance. The Company does not undertake or accept any obligation to release publicly any updates or revisions to any forward-looking statements to reflect any change in its expectations or any change in events, conditions, or circumstances on which any such statement is based, except as required by law. Factors that may cause actual results to differ materially from current expectations may emerge from time to time, and it is not possible for the Company to predict all of them; such factors include, among other things, changes in global, regional, or local economic, business, competitive, market and regulatory conditions, and those listed under the heading “Risk Factors” and elsewhere in the Company’s filings with the U.S. Securities and Exchange Commission (the “SEC”), which are accessible on the SEC’s website at www.sec.gov.
Contacts
In Asia:
SBC Medical Group Holdings Incorporated
Hikaru Fukui / Head of Investor Relations
E-mail: ir@sbc-holdings.com
In the US:
ICR LLC
Bill Zima / Managing Partner
Email: bill.zima@icrinc.com
SBC MEDICAL GROUP HOLDINGS INCORPORATED
UNAUDITED CONSOLIDATED BALANCE SHEETS
| September 30, | December 31, | |||||||
| 2024 | 2023 | |||||||
| ASSETS | ||||||||
| Current assets: | ||||||||
| Cash and cash equivalents | $ | 137,393,070 | $ | 103,022,932 | ||||
| Accounts receivable | 1,944,604 | 1,437,077 | ||||||
| Accounts receivable – related parties | 27,835,179 | 33,676,672 | ||||||
| Inventories | 1,985,883 | 3,090,923 | ||||||
| Finance lease receivables, current – related parties | 8,443,338 | 6,143,564 | ||||||
| Customer loans receivable, current | 16,125,086 | 8,484,753 | ||||||
| Prepaid expenses and other current assets | 8,372,668 | 10,050,005 | ||||||
| Total current assets | 202,099,828 | 165,905,926 | ||||||
| Non-current assets: | ||||||||
| Property and equipment, net | 13,194,414 | 13,582,017 | ||||||
| Intangible assets, net | 16,218,233 | 19,739,276 | ||||||
| Long-term investments | 4,905,115 | 849,434 | ||||||
| Goodwill, net | 3,545,391 | 3,590,791 | ||||||
| Finance lease receivables, non-current – related parties | 4,629,047 | 3,420,489 | ||||||
| Operating lease right-of-use assets | 5,251,418 | 5,919,937 | ||||||
| Deferred tax assets | 624,564 | - | ||||||
| Customer loans receivable, non-current | 6,590,301 | 6,444,025 | ||||||
| Long-term prepayments | 4,308,810 | 4,099,763 | ||||||
| Long-term investments in MCs – related parties | 19,561,069 | 19,811,555 | ||||||
| Other assets | 15,550,402 | 15,442,058 | ||||||
| Total non-current assets | 94,378,764 | 92,899,345 | ||||||
| Total assets | $ | 296,478,592 | $ | 258,805,271 | ||||
| LIABILITIES AND STOCKHOLDERS’ EQUITY | ||||||||
| Current liabilities: | ||||||||
| Accounts payable | $ | 14,873,829 | $ | 26,531,944 | ||||
| Current portion of long-term loans | 136,683 | 156,217 | ||||||
| Notes payable, current – related parties | 10,202,360 | 3,369,203 | ||||||
| Advances from customers | 565,495 | 2,074,457 | ||||||
| Advances from customers – related parties | 18,994,015 | 23,058,175 | ||||||
| Income tax payable | 8,000,808 | 8,782,930 | ||||||
| Operating lease liabilities, current | 4,060,844 | 3,885,812 | ||||||
| Accrued liabilities and other current liabilities | 12,054,047 | 21,009,009 | ||||||
| Due to related party | 3,532,453 | 3,583,523 | ||||||
| Total current liabilities | 72,420,534 | 92,451,270 | ||||||
| Non-current liabilities: | ||||||||
| Long-term loans | 686,470 | 1,062,722 | ||||||
| Notes payable, non-current – related parties | 11,659,022 | 11,948,219 | ||||||
| Deferred tax liabilities | 3,515,825 | 6,013,565 | ||||||
| Operating lease liabilities, non-current | 1,528,972 | 2,444,316 | ||||||
| Other liabilities | 1,147,345 | 1,074,930 | ||||||
| Total non-current liabilities | 18,537,634 | 22,543,752 | ||||||
| Total liabilities | 90,958,168 | 114,995,022 | ||||||
| Stockholders’ equity: | ||||||||
| Preferred stock ($0.0001 par value, 20,000,000 shares authorized; no shares issued and outstanding as of September 30, 2024 and December 31, 2023) (1) | - | - | ||||||
| Common stock ($0.0001 par value, 400,000,000 shares authorized, 103,020,816 and 94,192,433 shares issued and outstanding as of September 30, 2024 and December 31, 2023) (1) | 10,302 | 9,419 | ||||||
| Additional paid-in capital (1) | 60,825,115 | 36,879,281 | ||||||
| Treasury stock receivable (270,000 shares of common stock) - related party | (2,700,000 | ) | - | |||||
| Retained earnings | 182,923,786 | 142,848,732 | ||||||
| Accumulated other comprehensive loss | (36,078,149 | ) | (37,578,255 | ) | ||||
| Total SBC Medical Group Holdings Incorporated’s stockholders’ equity | 204,981,054 | 142,159,177 | ||||||
| Non-controlling interests | 539,370 | 1,651,072 | ||||||
| Total stockholders’ equity | 205,520,424 | 143,810,249 | ||||||
| Total liabilities and stockholders’ equity | $ | 296,478,592 | $ | 258,805,271 | ||||
(1) Retrospectively restated for effect of recapitalization on equity due to reverse acquisition effective September 17, 2024.
SBC MEDICAL GROUP HOLDINGS INCORPORATED
UNAUDITED CONSOLIDATED STATEMENTS OF OPERATIONS AND COMPREHENSIVE INCOME
| For the Three Months Ended September 30, | For the Nine Months Ended September 30, | |||||||||||||||
| 2024 | 2023 | 2024 | 2023 | |||||||||||||
| Revenues, net – related parties | $ | 51,209,243 | $ | 45,119,709 | $ | 152,718,488 | $ | 125,336,653 | ||||||||
| Revenues, net | 1,875,640 | 2,158,976 | 8,276,517 | 5,856,076 | ||||||||||||
| Total revenues, net | 53,084,883 | 47,278,685 | 160,995,005 | 131,192,729 | ||||||||||||
| Cost of revenues | 9,845,793 | 13,780,309 | 38,816,865 | 37,256,066 | ||||||||||||
| Gross profit | 43,239,090 | 33,498,376 | 122,178,140 | 93,936,663 | ||||||||||||
| Operating expenses: | ||||||||||||||||
| Selling, general and administrative expenses | 16,597,032 | 13,446,618 | 43,784,637 | 46,885,138 | ||||||||||||
| Stock-based compensation | 12,807,455 | - | 12,807,455 | - | ||||||||||||
| Misappropriation loss | - | 28,516 | - | 380,766 | ||||||||||||
| Total operating expenses | 29,404,487 | 13,475,134 | 56,592,092 | 47,265,904 | ||||||||||||
| Income from operations | 13,834,603 | 20,023,242 | 65,586,048 | 46,670,759 | ||||||||||||
| Other income (expenses): | ||||||||||||||||
| Interest income | 7,950 | 10,234 | 37,283 | 86,345 | ||||||||||||
| Interest expense | (5,466 | ) | (3,978 | ) | (15,898 | ) | (37,380 | ) | ||||||||
| Other income | 65,922 | 1,138,869 | 721,894 | 3,875,723 | ||||||||||||
| Other expenses | (795,158 | ) | (98,314 | ) | (2,746,450 | ) | (581,239 | ) | ||||||||
| Gain on disposal of subsidiary | - | - | 3,813,609 | - | ||||||||||||
| Total other income (expenses) | (726,752 | ) | 1,046,811 | 1,810,438 | 3,343,449 | |||||||||||
| Income before income taxes | 13,107,851 | 21,070,053 | 67,396,486 | 50,014,208 | ||||||||||||
| Income tax expense | 10,273,384 | 13,012,262 | 27,254,478 | 25,683,244 | ||||||||||||
| Net income | 2,834,467 | 8,057,791 | 40,142,008 | 24,330,964 | ||||||||||||
| Less: net income (loss) attributable to non-controlling interests | 1,573 | (298,623 | ) | 66,954 | (696,812 | ) | ||||||||||
| Net income attributable to SBC Medical Group Holdings Incorporated | $ | 2,832,894 | $ | 8,356,414 | $ | 40,075,054 | $ | 25,027,776 | ||||||||
| Other comprehensive income (loss): | ||||||||||||||||
| Foreign currency translation adjustment | 20,783,646 | (974,249 | ) | 1,543,245 | (19,825,222 | ) | ||||||||||
| Reclassification of unrealized gain on available-for-sale debt security to net income when realized, net of tax effect of nil and $(97,856) for the three months ended September 30, 2024 and 2023, respectively; nil and $(97,856) for the nine months ended September 30, 2024 and 2023, respectively | - | (205,383 | ) | - | (8,760 | ) | ||||||||||
| Total comprehensive income | 23,618,113 | 6,878,159 | 41,685,253 | 4,496,982 | ||||||||||||
| Less: comprehensive income (loss) attributable to non-controlling interests | 180,093 | (387,948 | ) | 110,093 | (1,129,475 | ) | ||||||||||
| Comprehensive income attributable to SBC Medical Group Holdings Incorporated | $ | 23,438,020 | $ | 7,266,107 | $ | 41,575,160 | $ | 5,626,457 | ||||||||
| Net income per share attributable to SBC Medical Group Holdings Incorporated (1) | ||||||||||||||||
| Basic and diluted | $ | 0.03 | $ | 0.09 | $ | 0.42 | $ | 0.27 | ||||||||
| Weighted average shares outstanding (1) | ||||||||||||||||
| Basic and diluted | 95,095,144.00 | 94,192,433.00 | 94,495,533.00 | 94,192,433.00 | ||||||||||||
(1) Retrospectively restated for effect of recapitalization on equity due to reverse acquisition effective September 17, 2024.
SBC MEDICAL GROUP HOLDINGS INCORPORATED
UNAUDITED CONSOLIDATED STATEMENTS OF CASH FLOWS
|
For the Nine Months Ended September 30, |
||||||||
| 2024 | 2023 | |||||||
| CASH FLOWS FROM OPERATING ACTIVITIES | ||||||||
| Net income | $ | 40,142,008 | $ | 24,330,964 | ||||
| Adjustments to reconcile net income to net cash provided by operating activities: | ||||||||
| Depreciation and amortization expense | 2,867,781 | 9,688,640 | ||||||
| Non-cash lease expense | 2,908,990 | 2,424,220 | ||||||
| Provision for (reversal of) credit losses | (127,196 | ) | 282,934 | |||||
| Stock-based compensation | 12,807,455 | - | ||||||
| Impairment loss on property and equipment | - | 204,026 | ||||||
| Realized gain on short-term investments | - | (223,164 | ) | |||||
| Fair value change of long-term investments | 1,682,282 | - | ||||||
| Gain on disposal of subsidiary | (3,813,609 | ) | - | |||||
| Loss (gain) on disposal of property and equipment and intangible assets | 185,284 | (249,532 | ) | |||||
| Deferred income taxes | (2,154,837 | ) | (1,379,922 | ) | ||||
| Changes in operating assets and liabilities: | ||||||||
| Accounts receivable | (804,000 | ) | (924,061 | ) | ||||
| Accounts receivable - related parties | 4,971,911 | (19,979,099 | ) | |||||
| Inventories | 763,075 | (4,038,874 | ) | |||||
| Finance lease receivables - related parties | (3,430,267 | ) | 17,241,740 | |||||
| Customer loans receivable | 12,860,220 | - | ||||||
| Prepaid expenses and other current assets | 902,230 | 8,173,153 | ||||||
| Long-term prepayments | 432,380 | (1,991,626 | ) | |||||
| Other assets | (348,178 | ) | (1,884,352 | ) | ||||
| Accounts payable | (10,511,619 | ) | 6,712,977 | |||||
| Notes payable - related parties | (14,030,092 | ) | - | |||||
| Advances from customers | (1,401,437 | ) | (681,973 | ) | ||||
| Advances from customers - related parties | (3,565,778 | ) | (7,430,332 | ) | ||||
| Income tax payable | (549,446 | ) | 16,518,062 | |||||
| Operating lease liabilities | (2,971,946 | ) | (2,335,113 | ) | ||||
| Accrued liabilities and other current liabilities | (9,010,270 | ) | 298,743 | |||||
| Accrued retirement compensation expense - related party | - | (22,082,643 | ) | |||||
| Other liabilities | 81,290 | 79,215 | ||||||
| NET CASH PROVIDED BY OPERATING ACTIVITIES | 27,886,231 | 22,753,983 | ||||||
| CASH FLOWS FROM INVESTING ACTIVITIES | ||||||||
| Purchase of property and equipment | (1,974,285 | ) | (2,299,045 | ) | ||||
| Purchase of intangible assets | - | (1,683,030 | ) | |||||
| Purchase of convertible note | (1,700,000 | ) | (1,000,000 | ) | ||||
| Prepayments for property and equipment | (843,740 | ) | (417,353 | ) | ||||
| Advances to related parties | (617,804 | ) | (1,017,292 | ) | ||||
| Payments made on behalf of a related party | (5,245,990 | ) | - | |||||
| Purchase of short-term investments | - | (2,106,720 | ) | |||||
| Purchase of long-term investments | (331,496 | ) | - | |||||
| Long-term investments in MCs - related parties | - | (26,780 | ) | |||||
| Cash received from acquisition of subsidiary, net of cash received | - | 722,551 | ||||||
| Long-term loans to others | (80,793 | ) | (421,429 | ) | ||||
| Repayments from related parties | 5,990,990 | 734,358 | ||||||
| Repayments from others | 62,927 | 47,356 | ||||||
| Proceeds from sales of short-term investments | - | 4,125,813 | ||||||
| Proceeds from surrender of life insurance policies | - | 3,954,760 | ||||||
| Disposal of subsidiary, net of cash disposed of | (815,819 | ) | - | |||||
| Proceeds from disposal of property and equipment | 1,971 | 8,046,007 | ||||||
| NET CASH PROVIDED BY (USED IN) INVESTING ACTIVITIES | (5,554,039 | ) | 8,659,196 | |||||
| CASH FLOWS FROM FINANCING ACTIVITIES | ||||||||
| Borrowings from related parties | - | 12,310,106 | ||||||
| Proceeds from reverse recapitalization, net of transaction costs | 11,707,417 |
- | ||||||
| Proceeds from issuance of common stock | - | 10 | ||||||
| Proceeds from exercise of stock warrants | 31,374 | - | ||||||
| Repayments of long-term loans | (89,448 | ) | (8,691,462 | ) | ||||
| Repayments to related parties | (65,305 | ) | (7,619,266 | ) | ||||
| Deemed contribution in connection with disposal of property and equipment | - | 9,620,453 | ||||||
| Deemed contribution in connection with reorganization | - | 642,748 | ||||||
| NET CASH PROVIDED BY FINANCING ACTIVITIES | 11,584,038 | 6,262,589 | ||||||
| Effect of changes in foreign currency exchange rate | 453,908 | (11,982,793 | ) | |||||
| NET INCREASE IN CASH AND CASH EQUIVALENTS | 34,370,138 | 25,692,975 | ||||||
| CASH AND CASH EQUIVALENTS AS OF THE BEGINNING OF THE PERIOD | 103,022,932 | 51,737,994 | ||||||
| CASH AND CASH EQUIVALENTS AS OF THE END OF THE PERIOD | $ | 137,393,070 | $ | 77,430,969 | ||||
| SUPPLEMENTAL DISCLOSURE OF CASH FLOW INFORMATION | ||||||||
| Cash paid for interest expense | $ | 15,898 | $ | 37,380 | ||||
| Cash paid for income taxes | $ | 31,332,123 | $ | 12,608,072 | ||||
| NON-CASH INVESTING AND FINANCING ACTIVITIES | ||||||||
| Property and equipment transferred from long-term prepayments | $ | 164,781 | $ | 7,681,830 | ||||
| An intangible asset transferred from long-term prepayments | $ | - | $ | 17,666,115 | ||||
| Settlement of loan payable to a related party in connection with disposal of property and equipment | $ | - | $ | 4,163,604 | ||||
| Operating lease right-of-use assets obtained in exchange for operating lease liabilities | $ | - | $ | 1,029,518 | ||||
| Remeasurement of operating lease liabilities and right-of-use assets due to lease modifications | $ | 2,408,752 | $ | 2,110,079 | ||||
| Issuance of promissory notes to related parties in connection with loan services provided | $ | 20,398,301 | $ | - | ||||
| Issuance of common stock to a related party from conversion of convertible note | $ | 2,700,000 | $ | - | ||||
| Issuance of common stock as incentive shares | $ | 34 | $ | - | ||||
| Settlement of loan payable to a related party in connection with issuance of common stock | $ | - | $ | 795 | ||||
| Non-cash purchase consideration for an asset acquisition | $ | - | $ | 705,528 | ||||
SBC MEDICAL GROUP HOLDINGS INCORPORATED
Unaudited Reconciliations of GAAP and Non-GAAP Results
| For the Three Months Ended September, 30 |
For the Nine Months Ended September, 30 |
|||||||||||||||
| 2024 | 2023 | 2024 | 2023 | |||||||||||||
| Income from operations | 13,834,603 | 20,023,242 | 65,586,048 | 46,670,759 | ||||||||||||
| Depreciation and amortization expense | 1,018,359 | 3,287,809 | 2,867,781 | 9,688,640 | ||||||||||||
| EBITDA | 14,852,962 | 23,311,051 | 68,453,829 | 56,359,399 | ||||||||||||
| EBITDA Margin | 28 | % | 49 | % | 42 | % | 43 | % | ||||||||
Exhibit 99.2