
| Maryland | 000-54691 | 27-1106076 | ||||||||||||
| (State or other jurisdiction of incorporation) |
(Commission File Number) | (IRS Employer Identification No.) |
||||||||||||
|
11501 Northlake Drive
Cincinnati, Ohio
|
45249 | |||||||
| (Address of principal executive offices) | (Zip Code) | |||||||
(513) 554-1110 | ||
| (Registrant’s telephone number, including area code) | ||
| Title of each class | Trading Symbol(s) | Name of each exchange on which registered | ||||||||||||
| Common Stock $0.01 par value per share |
PECO | The Nasdaq Global Select Market | ||||||||||||
| Exhibit Number | Description of Exhibit | |||||||
| 99.1 | ||||||||
| 99.2 | ||||||||
| 104 | Cover Page Interactive Data File (formatted as inline XBRL) | |||||||
| PHILLIPS EDISON & COMPANY, INC. | ||||||||
| Dated: February 8, 2024 | By: | /s/ Jennifer L. Robison | ||||||
| Jennifer L. Robison | ||||||||
| Chief Accounting Officer and Senior Vice President (Principal Accounting Officer) |
||||||||
Updated 2024 Guidance |
Previous 2024 Guidance |
|||||||||||||
| (in thousands, except per share amounts) | ||||||||||||||
| Net income per share | $0.53 - $0.58 | $0.50 - $0.55 | ||||||||||||
| Nareit FFO per share | $2.34 - $2.41 | $2.33 - $2.40 | ||||||||||||
| Core FFO per share | $2.37 - $2.45 | $2.36 - $2.44 | ||||||||||||
| Same-Center NOI growth | 3.25% - 4.25% | 3.25% - 4.25% | ||||||||||||
| Portfolio Activity: | ||||||||||||||
| Acquisitions, net | $200,000 - $300,000 | $200,000 - $300,000 | ||||||||||||
| Other: | ||||||||||||||
| Interest expense, net | $95,000 - $105,000 | $104,000 - $112,000 | ||||||||||||
| G&A expense | $45,000 - $49,000 | $45,000 - $49,000 | ||||||||||||
Non-cash revenue items(1) |
$14,500 - $18,500 | $14,500 - $18,500 | ||||||||||||
| Adjustments for collectibility | $4,000 - 5,000 | $4,000 - 5,000 | ||||||||||||
| (Unaudited) | Low End | High End | |||||||||
| Net income per common share | $ | 0.53 | $ | 0.58 | |||||||
| Depreciation and amortization of real estate assets | 1.79 | 1.81 | |||||||||
Gain on sale of real estate assets |
— | — | |||||||||
| Adjustments related to unconsolidated joint ventures | 0.02 | 0.02 | |||||||||
| Nareit FFO per common share | $ | 2.34 | $ | 2.41 | |||||||
| Depreciation and amortization of corporate assets | 0.01 | 0.01 | |||||||||
| Transaction costs and other | 0.02 | 0.03 | |||||||||
| Core FFO per common share | $ | 2.37 | $ | 2.45 | |||||||
| 2023 | 2022 | ||||||||||
| ASSETS | |||||||||||
| Investment in real estate: | |||||||||||
| Land and improvements | $ | 1,768,487 | $ | 1,674,133 | |||||||
| Building and improvements | 3,818,184 | 3,572,146 | |||||||||
| In-place lease assets | 495,525 | 471,507 | |||||||||
| Above-market lease assets | 74,446 | 71,954 | |||||||||
| Total investment in real estate assets | 6,156,642 | 5,789,740 | |||||||||
| Accumulated depreciation and amortization | (1,540,551) | (1,316,743) | |||||||||
| Net investment in real estate assets | 4,616,091 | 4,472,997 | |||||||||
| Investment in unconsolidated joint ventures | 25,220 | 27,201 | |||||||||
| Total investment in real estate assets, net | 4,641,311 | 4,500,198 | |||||||||
| Cash and cash equivalents | 4,872 | 5,478 | |||||||||
| Restricted cash | 4,006 | 11,871 | |||||||||
| Goodwill | 29,066 | 29,066 | |||||||||
| Other assets, net | 186,411 | 188,879 | |||||||||
| Total assets | $ | 4,865,666 | $ | 4,735,492 | |||||||
| LIABILITIES AND EQUITY | |||||||||||
| Liabilities: | |||||||||||
| Debt obligations, net | $ | 1,969,272 | $ | 1,896,594 | |||||||
| Below-market lease liabilities, net | 108,223 | 109,799 | |||||||||
| Accounts payable and other liabilities | 116,461 | 113,185 | |||||||||
| Deferred income | 18,359 | 18,481 | |||||||||
| Total liabilities | 2,212,315 | 2,138,059 | |||||||||
| Commitments and contingencies | — | — | |||||||||
| Equity: | |||||||||||
Preferred stock, $0.01 par value per share, 10,000 shares authorized, zero shares issued and outstanding at December 31, 2023 and 2022 |
— | — | |||||||||
Common stock, $0.01 par value per share, 1,000,000 shares authorized, 122,024 and 117,126 shares issued and outstanding at December 31, 2023 and 2022, respectively |
1,220 | 1,171 | |||||||||
| Additional paid-in capital | 3,546,838 | 3,383,978 | |||||||||
Accumulated other comprehensive income |
10,523 | 21,003 | |||||||||
| Accumulated deficit | (1,248,273) | (1,169,665) | |||||||||
| Total stockholders’ equity | 2,310,308 | 2,236,487 | |||||||||
| Noncontrolling interests | 343,043 | 360,946 | |||||||||
| Total equity | 2,653,351 | 2,597,433 | |||||||||
| Total liabilities and equity | $ | 4,865,666 | $ | 4,735,492 | |||||||
| Three Months Ended December 31, |
Year Ended December 31, |
||||||||||||||||||||||
| 2023 | 2022 | 2023 | 2022 | ||||||||||||||||||||
| Revenues: | |||||||||||||||||||||||
| Rental income | $ | 151,227 | $ | 141,703 | $ | 597,501 | $ | 560,538 | |||||||||||||||
| Fees and management income | 2,454 | 2,218 | 9,646 | 11,541 | |||||||||||||||||||
| Other property income | 768 | 1,118 | 2,977 | 3,293 | |||||||||||||||||||
| Total revenues | 154,449 | 145,039 | 610,124 | 575,372 | |||||||||||||||||||
| Operating Expenses: | |||||||||||||||||||||||
| Property operating | 28,293 | 26,098 | 102,303 | 95,359 | |||||||||||||||||||
| Real estate taxes | 17,335 | 15,859 | 72,816 | 67,864 | |||||||||||||||||||
| General and administrative | 10,762 | 11,484 | 44,366 | 45,235 | |||||||||||||||||||
| Depreciation and amortization | 59,572 | 58,216 | 236,443 | 236,224 | |||||||||||||||||||
| Impairment of real estate assets | — | 322 | — | 322 | |||||||||||||||||||
| Total operating expenses | 115,962 | 111,979 | 455,928 | 445,004 | |||||||||||||||||||
| Other: | |||||||||||||||||||||||
| Interest expense, net | (22,569) | (18,301) | (84,232) | (71,196) | |||||||||||||||||||
Gain on disposal of property, net |
40 | 3,366 | 1,110 | 7,517 | |||||||||||||||||||
Other expense, net |
(770) | (2,422) | (7,312) | (12,160) | |||||||||||||||||||
Net income |
15,188 | 15,703 | 63,762 | 54,529 | |||||||||||||||||||
Net income attributable to noncontrolling interests |
(1,655) | (2,025) | (6,914) | (6,206) | |||||||||||||||||||
Net income attributable to stockholders |
$ | 13,533 | $ | 13,678 | $ | 56,848 | $ | 48,323 | |||||||||||||||
| Earnings per share of common stock: | |||||||||||||||||||||||
Net income per share attributable to stockholders - basic and diluted |
$ | 0.11 | $ | 0.12 | $ | 0.48 | $ | 0.42 | |||||||||||||||
| Three Months Ended December 31, |
Favorable (Unfavorable) | Year Ended December 31, |
Favorable (Unfavorable) | ||||||||||||||||||||||||||||||||||||||||||||
| 2023 | 2022 | $ Change | % Change | 2023 | 2022 | $ Change | % Change | ||||||||||||||||||||||||||||||||||||||||
| Revenues: | |||||||||||||||||||||||||||||||||||||||||||||||
Rental income(1) |
$ | 104,874 | $ | 100,834 | $ | 4,040 | $ | 415,152 | $ | 398,507 | $ | 16,645 | |||||||||||||||||||||||||||||||||||
| Tenant recovery income | 33,434 | 32,205 | 1,229 | 134,860 | 127,776 | 7,084 | |||||||||||||||||||||||||||||||||||||||||
Reserves for uncollectibility(2) |
(1,351) | (1,328) | (23) | (3,409) | (1,918) | (1,491) | |||||||||||||||||||||||||||||||||||||||||
| Other property income | 711 | 917 | (206) | 2,717 | 2,967 | (250) | |||||||||||||||||||||||||||||||||||||||||
| Total revenues | 137,668 | 132,628 | 5,040 | 3.8 | % | 549,320 | 527,332 | 21,988 | 4.2 | % | |||||||||||||||||||||||||||||||||||||
| Operating expenses: | |||||||||||||||||||||||||||||||||||||||||||||||
| Property operating expenses | 22,041 | 21,407 | (634) | 83,669 | 80,683 | (2,986) | |||||||||||||||||||||||||||||||||||||||||
| Real estate taxes | 16,374 | 15,451 | (923) | 69,035 | 66,184 | (2,851) | |||||||||||||||||||||||||||||||||||||||||
| Total operating expenses | 38,415 | 36,858 | (1,557) | (4.2) | % | 152,704 | 146,867 | (5,837) | (4.0) | % | |||||||||||||||||||||||||||||||||||||
| Total Same-Center NOI | $ | 99,253 | $ | 95,770 | $ | 3,483 | 3.6 | % | $ | 396,616 | $ | 380,465 | $ | 16,151 | 4.2 | % | |||||||||||||||||||||||||||||||
| Three Months Ended December 31, | Year Ended December 31, | ||||||||||||||||||||||
| 2023 | 2022 | 2023 | 2022 | ||||||||||||||||||||
Net income |
$ | 15,188 | $ | 15,703 | $ | 63,762 | $ | 54,529 | |||||||||||||||
| Adjusted to exclude: | |||||||||||||||||||||||
| Fees and management income | (2,454) | (2,218) | (9,646) | (11,541) | |||||||||||||||||||
Straight-line rental income(1) |
(2,056) | (3,205) | (10,185) | (12,265) | |||||||||||||||||||
| Net amortization of above- and below-market leases | (1,394) | (1,163) | (5,178) | (4,324) | |||||||||||||||||||
| Lease buyout income | (206) | (52) | (1,222) | (2,414) | |||||||||||||||||||
| General and administrative expenses | 10,762 | 11,484 | 44,366 | 45,235 | |||||||||||||||||||
| Depreciation and amortization | 59,572 | 58,216 | 236,443 | 236,224 | |||||||||||||||||||
| Impairment of real estate assets | — | 322 | — | 322 | |||||||||||||||||||
| Interest expense, net | 22,569 | 18,301 | 84,232 | 71,196 | |||||||||||||||||||
| Gain on disposal of property, net | (40) | (3,366) | (1,110) | (7,517) | |||||||||||||||||||
| Other expense, net | 770 | 2,422 | 7,312 | 12,160 | |||||||||||||||||||
| Property operating expenses (income) related to fees and management income | 384 | (15) | 2,059 | 3,046 | |||||||||||||||||||
| NOI for real estate investments | 103,095 | 96,429 | 410,833 | 384,651 | |||||||||||||||||||
Less: Non-same-center NOI(2) |
(3,842) | (659) | (14,217) | (4,186) | |||||||||||||||||||
| Total Same-Center NOI | $ | 99,253 | $ | 95,770 | $ | 396,616 | $ | 380,465 | |||||||||||||||
| Three Months Ended December 31, | Year Ended December 31, | ||||||||||||||||||||||
| 2023 | 2022 | 2023 | 2022 | ||||||||||||||||||||
Calculation of Nareit FFO Attributable to Stockholders and OP Unit Holders |
|||||||||||||||||||||||
Net income |
$ | 15,188 | $ | 15,703 | $ | 63,762 | $ | 54,529 | |||||||||||||||
| Adjustments: | |||||||||||||||||||||||
| Depreciation and amortization of real estate assets | 59,048 | 57,266 | 234,260 | 232,571 | |||||||||||||||||||
| Impairment of real estate assets | — | 322 | — | 322 | |||||||||||||||||||
| Gain on disposal of property, net | (40) | (3,366) | (1,110) | (7,517) | |||||||||||||||||||
| Adjustments related to unconsolidated joint ventures | 647 | 661 | 2,636 | 842 | |||||||||||||||||||
| Nareit FFO attributable to stockholders and OP unit holders | $ | 74,843 | $ | 70,586 | $ | 299,548 | $ | 280,747 | |||||||||||||||
| Calculation of Core FFO Attributable to Stockholders and OP Unit Holders | |||||||||||||||||||||||
| Nareit FFO attributable to stockholders and OP unit holders | $ | 74,843 | $ | 70,586 | $ | 299,548 | $ | 280,747 | |||||||||||||||
| Adjustments: | |||||||||||||||||||||||
| Depreciation and amortization of corporate assets | 524 | 950 | 2,183 | 3,653 | |||||||||||||||||||
| Change in fair value of earn-out liability | — | — | — | 1,809 | |||||||||||||||||||
| Impairment of investment in third parties | — | — | 3,000 | — | |||||||||||||||||||
| Transaction and acquisition expenses | 2,496 | 2,731 | 5,675 | 10,551 | |||||||||||||||||||
Loss on extinguishment or modification of debt and other, net |
2 | — | 368 | — | 1,025 | ||||||||||||||||||
| Amortization of unconsolidated joint venture basis differences | 5 | — | 17 | 220 | |||||||||||||||||||
Realized performance income(1) |
— | — | (75) | (2,742) | |||||||||||||||||||
| Core FFO attributable to stockholders and UP unit holders | $ | 77,870 | $ | 74,267 | $ | 310,716 | $ | 295,263 | |||||||||||||||
| Nareit FFO/Core FFO Attributable to Stockholders and OP Unit Holders per diluted share | |||||||||||||||||||||||
| Weighted-average shares of common stock outstanding - diluted | 134,667 | 131,781 | 132,970 | 130,332 | |||||||||||||||||||
| Nareit FFO attributable to stockholders and OP unit holders per share - diluted | $ | 0.56 | $ | 0.54 | $ | 2.25 | $ | 2.15 | |||||||||||||||
| Core FFO attributable to stockholders and OP unit holders per share - diluted | $ | 0.58 | $ | 0.56 | $ | 2.34 | $ | 2.27 | |||||||||||||||
| Three Months Ended December 31, |
Year Ended December 31, |
||||||||||||||||||||||
| 2023 | 2022 | 2023 | 2022 | ||||||||||||||||||||
Calculation of EBITDAre |
|||||||||||||||||||||||
Net income |
$ | 15,188 | $ | 15,703 | $ | 63,762 | $ | 54,529 | |||||||||||||||
| Adjustments: | |||||||||||||||||||||||
| Depreciation and amortization | 59,572 | 58,216 | 236,443 | 236,224 | |||||||||||||||||||
| Interest expense, net | 22,569 | 18,301 | 84,232 | 71,196 | |||||||||||||||||||
| Gain on disposal of property, net | (40) | (3,366) | (1,110) | (7,517) | |||||||||||||||||||
| Impairment of real estate assets | — | 322 | — | 322 | |||||||||||||||||||
| Federal, state, and local tax expense | 81 | 433 | 438 | 806 | |||||||||||||||||||
| Adjustments related to unconsolidated joint ventures | 919 | 926 | 3,721 | 1,987 | |||||||||||||||||||
EBITDAre |
$ | 98,289 | $ | 90,535 | $ | 387,486 | $ | 357,547 | |||||||||||||||
Calculation of Adjusted EBITDAre |
|||||||||||||||||||||||
EBITDAre |
$ | 98,289 | $ | 90,535 | $ | 387,486 | $ | 357,547 | |||||||||||||||
| Adjustments: | |||||||||||||||||||||||
| Impairment of investment in third parties | — | — | 3,000 | — | |||||||||||||||||||
| Change in fair value of earn-out liability | — | — | — | 1,809 | |||||||||||||||||||
| Transaction and acquisition expenses | 2,496 | 2,731 | 5,675 | 10,551 | |||||||||||||||||||
| Amortization of unconsolidated joint venture basis differences | 5 | — | 17 | 220 | |||||||||||||||||||
Realized performance income(1) |
— | — | (75) | (2,742) | |||||||||||||||||||
Adjusted EBITDAre |
$ | 100,790 | $ | 93,266 | $ | 396,103 | $ | 367,385 | |||||||||||||||
| 2023 | 2022 | ||||||||||
| Net debt: | |||||||||||
| Total debt, excluding discounts, market adjustments, and deferred financing expenses | $ | 2,011,093 | $ | 1,937,142 | |||||||
| Less: Cash and cash equivalents | 5,074 | 5,740 | |||||||||
| Total net debt | $ | 2,006,019 | $ | 1,931,402 | |||||||
| Enterprise value: | |||||||||||
| Net debt | $ | 2,006,019 | $ | 1,931,402 | |||||||
Total equity market capitalization(1)(2) |
4,955,480 | 4,178,204 | |||||||||
| Total enterprise value | $ | 6,961,499 | $ | 6,109,606 | |||||||
| 2023 | 2022 | ||||||||||
Net debt to Adjusted EBITDAre - annualized: |
|||||||||||
| Net debt | $ | 2,006,019 | $ | 1,931,402 | |||||||
Adjusted EBITDAre - annualized(1) |
396,103 | 367,385 | |||||||||
Net debt to Adjusted EBITDAre - annualized |
5.1x | 5.3x | |||||||||
| Net debt to total enterprise value: | |||||||||||
| Net debt | $ | 2,006,019 | $ | 1,931,402 | |||||||
| Total enterprise value | 6,961,499 | 6,109,606 | |||||||||
| Net debt to total enterprise value | 28.8% | 31.6% | |||||||||
| Table of Contents | |||||
Consolidated Statements of Operations (Quarterly) |
|||||
FFO, Core FFO, and Adjusted FFO (Quarterly) |
|||||
Joint Venture Summary and Financials |
|||||
Summary of Outstanding Debt
|
|||||
Covenant Disclosures |
|||||
| ABR by Neighbor Category | |||||
| ADDITIONAL INFORMATION | |||||
| INVESTOR INFORMATION | |||||
| Phillips Edison & Company |
2
|
|||||||
| Introductory Notes | ||||||||
SUPPLEMENTAL INFORMATION | ||
| CAUTIONARY NOTE ABOUT FORWARD-LOOKING STATEMENTS | ||
| NOTICE REGARDING NON-GAAP FINANCIAL MEASURES | ||
| Phillips Edison & Company |
3
|
|||||||
| Introductory Notes | ||||||||
PRO RATA FINANCIAL INFORMATION | ||
| Phillips Edison & Company |
4
|
|||||||

| FINANCIAL RESULTS | ||
Quarter Ended December 31, 2023 | ||
|
Earnings Release
Unaudited
| ||
| Phillips Edison & Company |
6
|
|||||||
|
Earnings Release
Unaudited
| ||
| Phillips Edison & Company |
7
|
|||||||
|
Earnings Release
Unaudited
| ||
| Phillips Edison & Company |
8
|
|||||||
|
Earnings Release
Unaudited
| ||
Updated 2024 Guidance |
Previous 2024 Guidance |
|||||||||||||
| (in thousands, except per share amounts) | ||||||||||||||
| Net income per share | $0.53 - $0.58 | $0.50 - $0.55 | ||||||||||||
| Nareit FFO per share | $2.34 - $2.41 | $2.33 - $2.40 | ||||||||||||
| Core FFO per share | $2.37 - $2.45 | $2.36 - $2.44 | ||||||||||||
| Same-Center NOI growth | 3.25% - 4.25% | 3.25% - 4.25% | ||||||||||||
| Portfolio Activity: | ||||||||||||||
| Acquisitions, net | $200,000 - $300,000 | $200,000 - $300,000 | ||||||||||||
| Other: | ||||||||||||||
| Interest expense, net | $95,000 - $105,000 | $104,000 - $112,000 | ||||||||||||
| G&A expense | $45,000 - $49,000 | $45,000 - $49,000 | ||||||||||||
Non-cash revenue items(1) |
$14,500 - $18,500 | $14,500 - $18,500 | ||||||||||||
| Adjustments for collectibility | $4,000 - 5,000 | $4,000 - 5,000 | ||||||||||||
| (Unaudited) | Low End | High End | |||||||||
| Net income per common share | $ | 0.53 | $ | 0.58 | |||||||
| Depreciation and amortization of real estate assets | 1.79 | 1.81 | |||||||||
Gain on sale of real estate assets |
— | — | |||||||||
| Adjustments related to unconsolidated joint ventures | 0.02 | 0.02 | |||||||||
| Nareit FFO per common share | $ | 2.34 | $ | 2.41 | |||||||
| Depreciation and amortization of corporate assets | 0.01 | 0.01 | |||||||||
| Transaction costs and other | 0.02 | 0.03 | |||||||||
| Core FFO per common share | $ | 2.37 | $ | 2.45 | |||||||
| Phillips Edison & Company |
9
|
|||||||
|
Earnings Release
Unaudited
| ||
| Phillips Edison & Company |
10
|
|||||||
|
Overview of Results
Unaudited, in thousands (excluding per share and per square foot amounts)
| |||||||||||||||||||||||
| Three Months Ended December 31, |
Year Ended December 31, |
||||||||||||||||||||||
| 2023 | 2022 | 2023 | 2022 | ||||||||||||||||||||
| SUMMARY FINANCIAL RESULTS | |||||||||||||||||||||||
Total revenues (page 14) |
$ | 154,449 | $ | 145,039 | $ | 610,124 | $ | 575,372 | |||||||||||||||
Net income attributable to stockholders (page 14) |
13,533 | 13,678 | 56,848 | 48,323 | |||||||||||||||||||
Net income per share - basic and diluted (page 14) |
$ | 0.11 | $ | 0.12 | $ | 0.48 | $ | 0.42 | |||||||||||||||
Same-Center NOI (page 20) |
99,253 | 95,770 | 396,616 | 380,465 | |||||||||||||||||||
Adjusted EBITDAre (page 18) |
100,790 | 93,266 | 396,103 | 367,385 | |||||||||||||||||||
Nareit FFO (page 16) |
74,843 | 70,586 | 299,548 | 280,747 | |||||||||||||||||||
Nareit FFO per share - diluted (page 16) |
$ | 0.56 | $ | 0.54 | $ | 2.25 | $ | 2.15 | |||||||||||||||
Core FFO (page 16) |
77,870 | 74,267 | 310,716 | 295,263 | |||||||||||||||||||
Core FFO per share - diluted (page 16) |
$ | 0.58 | $ | 0.56 | $ | 2.34 | $ | 2.27 | |||||||||||||||
| SUMMARY OF FINANCIAL AND OPERATING RATIOS | |||||||||||||||||||||||
Same-Center NOI margin (page 20) |
72.1 | % | 72.2 | % | 72.2 | % | 72.1 | % | |||||||||||||||
Same-Center NOI change (page 20)(1) |
3.6 | % | 2.8 | % | 4.2 | % | 4.5 | % | |||||||||||||||
| LEASING RESULTS | |||||||||||||||||||||||
Comparable rent spreads - new leases (page 40)(2) |
21.9 | % | 36.3 | % | 25.2 | % | 32.2 | % | |||||||||||||||
Comparable rent spreads - renewals (page 40)(2) |
14.2 | % | 13.9 | % | 16.2 | % | 14.6 | % | |||||||||||||||
| Portfolio retention rate | 93.3 | % | 91.7 | % | 93.9 | % | 90.7 | % | |||||||||||||||
| As of December 31, | |||||||||||||||||||||||
| 2023 | 2022 | ||||||||||||||||||||||
| OUTSTANDING STOCK AND PARTNERSHIP UNITS | |||||||||||||||||||||||
| Common stock outstanding | 122,024 | 117,126 | |||||||||||||||||||||
| Operating Partnership (OP) units outstanding | 13,817 | 14,099 | |||||||||||||||||||||
SUMMARY PORTFOLIO STATISTICS(2) |
|||||||||||||||||||||||
| Number of properties | 281 | 271 | |||||||||||||||||||||
GLA (page 42) |
32,153 | 31,093 | |||||||||||||||||||||
Leased occupancy (page 36) |
97.4 | % | 97.4 | % | |||||||||||||||||||
Economic occupancy (page 36) |
97.0 | % | 96.4 | % | |||||||||||||||||||
Leased ABR PSF (page 36) |
$ | 15.03 | $ | 14.39 | |||||||||||||||||||
Leased Anchor ABR PSF (page 36) |
$ | 10.12 | $ | 9.92 | |||||||||||||||||||
Leased Inline ABR PSF (page 36) |
$ | 24.66 | $ | 23.39 | |||||||||||||||||||
| Phillips Edison & Company |
11
|
|||||||
| FINANCIAL SUMMARY | ||
Quarter Ended December 31, 2023 | ||
|
Consolidated Balance Sheets
Condensed and Unaudited, in thousands (excluding per share amounts)
| |||||||||||
| December 31, | |||||||||||
| 2023 | 2022 | ||||||||||
| ASSETS | |||||||||||
| Investment in real estate: | |||||||||||
| Land and improvements | $ | 1,768,487 | $ | 1,674,133 | |||||||
| Building and improvements | 3,818,184 | 3,572,146 | |||||||||
| In-place lease assets | 495,525 | 471,507 | |||||||||
| Above-market lease assets | 74,446 | 71,954 | |||||||||
| Total investment in real estate assets | 6,156,642 | 5,789,740 | |||||||||
| Accumulated depreciation and amortization | (1,540,551) | (1,316,743) | |||||||||
| Net investment in real estate assets | 4,616,091 | 4,472,997 | |||||||||
| Investment in unconsolidated joint ventures | 25,220 | 27,201 | |||||||||
| Total investment in real estate assets, net | 4,641,311 | 4,500,198 | |||||||||
| Cash and cash equivalents | 4,872 | 5,478 | |||||||||
| Restricted cash | 4,006 | 11,871 | |||||||||
| Goodwill | 29,066 | 29,066 | |||||||||
| Other assets, net | 186,411 | 188,879 | |||||||||
| Total assets | $ | 4,865,666 | $ | 4,735,492 | |||||||
| LIABILITIES AND EQUITY | |||||||||||
| Liabilities: | |||||||||||
| Debt obligations, net | $ | 1,969,272 | $ | 1,896,594 | |||||||
| Below-market lease liabilities, net | 108,223 | 109,799 | |||||||||
| Accounts payable and other liabilities | 116,461 | 113,185 | |||||||||
| Deferred income | 18,359 | 18,481 | |||||||||
| Total liabilities | 2,212,315 | 2,138,059 | |||||||||
| Equity: | |||||||||||
Preferred stock, $0.01 par value per share, 10,000 shares authorized |
— | — | |||||||||
Common stock, $0.01 par value per share, 1,000,000 shares authorized as of December 31, 2023 and 2022, respectively |
1,220 | 1,171 | |||||||||
| Additional paid-in capital | 3,546,838 | 3,383,978 | |||||||||
| Accumulated other comprehensive income | 10,523 | 21,003 | |||||||||
| Accumulated deficit | (1,248,273) | (1,169,665) | |||||||||
| Total stockholders’ equity | 2,310,308 | 2,236,487 | |||||||||
| Noncontrolling interests | 343,043 | 360,946 | |||||||||
| Total equity | 2,653,351 | 2,597,433 | |||||||||
| Total liabilities and equity | $ | 4,865,666 | $ | 4,735,492 | |||||||
| Phillips Edison & Company |
13
|
|||||||
|
Consolidated Statements of Operations
Condensed and Unaudited, in thousands (excluding per share amounts)
| |||||||||||||||||||||||
| Three Months Ended December 31, |
Year Ended December 31, |
||||||||||||||||||||||
| 2023 | 2022 | 2023 | 2022 | ||||||||||||||||||||
| REVENUES | |||||||||||||||||||||||
| Rental income | $ | 151,227 | $ | 141,703 | $ | 597,501 | $ | 560,538 | |||||||||||||||
| Fees and management income | 2,454 | 2,218 | 9,646 | 11,541 | |||||||||||||||||||
| Other property income | 768 | 1,118 | 2,977 | 3,293 | |||||||||||||||||||
| Total revenues | 154,449 | 145,039 | 610,124 | 575,372 | |||||||||||||||||||
| OPERATING EXPENSES | |||||||||||||||||||||||
| Property operating | 28,293 | 26,098 | 102,303 | 95,359 | |||||||||||||||||||
| Real estate taxes | 17,335 | 15,859 | 72,816 | 67,864 | |||||||||||||||||||
| General and administrative | 10,762 | 11,484 | 44,366 | 45,235 | |||||||||||||||||||
| Depreciation and amortization | 59,572 | 58,216 | 236,443 | 236,224 | |||||||||||||||||||
| Impairment of real estate assets | — | 322 | — | 322 | |||||||||||||||||||
| Total operating expenses | 115,962 | 111,979 | 455,928 | 445,004 | |||||||||||||||||||
| OTHER | |||||||||||||||||||||||
| Interest expense, net | (22,569) | (18,301) | (84,232) | (71,196) | |||||||||||||||||||
Gain on disposal of property, net |
40 | 3,366 | 1,110 | 7,517 | |||||||||||||||||||
Other expense, net |
(770) | (2,422) | (7,312) | (12,160) | |||||||||||||||||||
Net income |
15,188 | 15,703 | 63,762 | 54,529 | |||||||||||||||||||
Net income attributable to noncontrolling interests |
(1,655) | (2,025) | (6,914) | (6,206) | |||||||||||||||||||
Net income attributable to stockholders |
$ | 13,533 | $ | 13,678 | $ | 56,848 | $ | 48,323 | |||||||||||||||
| EARNINGS PER SHARE OF COMMON STOCK | |||||||||||||||||||||||
|
Net income per share attributable to stockholders -
basic and diluted
|
$ | 0.11 | $ | 0.12 | $ | 0.48 | $ | 0.42 | |||||||||||||||
| Phillips Edison & Company |
14
|
|||||||
|
Consolidated Statements of Operations
Condensed and Unaudited, in thousands (excluding per share amounts)
| |||||||||||||||||||||||||||||
| Three Months Ended | |||||||||||||||||||||||||||||
| December 31, 2023 |
September 30, 2023 |
June 30, 2023 |
March 31, 2023 |
December 31, 2022 |
|||||||||||||||||||||||||
| REVENUES | |||||||||||||||||||||||||||||
| Rental income | $ | 151,227 | $ | 149,566 | $ | 148,980 | $ | 147,728 | $ | 141,703 | |||||||||||||||||||
| Fees and management income | 2,454 | 2,168 | 2,546 | 2,478 | 2,218 | ||||||||||||||||||||||||
| Other property income | 768 | 740 | 611 | 858 | 1,118 | ||||||||||||||||||||||||
| Total revenues | 154,449 | 152,474 | 152,137 | 151,064 | 145,039 | ||||||||||||||||||||||||
| OPERATING EXPENSES | |||||||||||||||||||||||||||||
| Property operating | 28,293 | 24,274 | 24,674 | 25,062 | 26,098 | ||||||||||||||||||||||||
| Real estate taxes | 17,335 | 19,028 | 18,397 | 18,056 | 15,859 | ||||||||||||||||||||||||
| General and administrative | 10,762 | 10,385 | 11,686 | 11,533 | 11,484 | ||||||||||||||||||||||||
| Depreciation and amortization | 59,572 | 58,706 | 59,667 | 58,498 | 58,216 | ||||||||||||||||||||||||
| Impairment of real estate assets | — | — | — | — | 322 | ||||||||||||||||||||||||
| Total operating expenses | 115,962 | 112,393 | 114,424 | 113,149 | 111,979 | ||||||||||||||||||||||||
| OTHER | |||||||||||||||||||||||||||||
| Interest expense, net | (22,569) | (21,522) | (20,675) | (19,466) | (18,301) | ||||||||||||||||||||||||
| Gain on disposal of property, net | 40 | 53 | 75 | 942 | 3,366 | ||||||||||||||||||||||||
| Other expense, net | (770) | (4,883) | (904) | (755) | (2,422) | ||||||||||||||||||||||||
| Net income | 15,188 | 13,729 | 16,209 | 18,636 | 15,703 | ||||||||||||||||||||||||
| Net income attributable to noncontrolling interests | (1,655) | (1,484) | (1,758) | (2,017) | (2,025) | ||||||||||||||||||||||||
| Net income attributable to stockholders | $ | 13,533 | $ | 12,245 | $ | 14,451 | $ | 16,619 | $ | 13,678 | |||||||||||||||||||
| EARNINGS PER SHARE OF COMMON STOCK | |||||||||||||||||||||||||||||
| Net income per share attributable to stockholders - basic and diluted | $ | 0.11 | $ | 0.10 | $ | 0.12 | $ | 0.14 | $ | 0.12 | |||||||||||||||||||
| Phillips Edison & Company |
15
|
|||||||
|
Nareit FFO, Core FFO, and Adjusted FFO
Unaudited, in thousands (excluding per share amounts)
| |||||||||||||||||||||||
| Three Months Ended December 31, |
Year Ended December 31, |
||||||||||||||||||||||
| 2023 | 2022 | 2023 | 2022 | ||||||||||||||||||||
| CALCULATION OF NAREIT FFO ATTRIBUTABLE TO STOCKHOLDERS AND OP UNIT HOLDERS | |||||||||||||||||||||||
Net income |
$ | 15,188 | $ | 15,703 | $ | 63,762 | $ | 54,529 | |||||||||||||||
| Adjustments: | |||||||||||||||||||||||
| Depreciation and amortization of real estate assets | 59,048 | 57,266 | 234,260 | 232,571 | |||||||||||||||||||
| Impairment of real estate assets | — | 322 | — | 322 | |||||||||||||||||||
| Gain on disposal of property, net | (40) | (3,366) | (1,110) | (7,517) | |||||||||||||||||||
| Adjustments related to unconsolidated joint ventures | 647 | 661 | 2,636 | 842 | |||||||||||||||||||
| Nareit FFO attributable to stockholders and OP unit holders |
$ | 74,843 | $ | 70,586 | $ | 299,548 | $ | 280,747 | |||||||||||||||
| CALCULATION OF CORE FFO ATTRIBUTABLE TO STOCKHOLDERS AND OP UNIT HOLDERS | |||||||||||||||||||||||
| Nareit FFO attributable to stockholders and OP unit holders | $ | 74,843 | $ | 70,586 | $ | 299,548 | $ | 280,747 | |||||||||||||||
| Adjustments: | |||||||||||||||||||||||
| Depreciation and amortization of corporate assets | 524 | 950 | 2,183 | 3,653 | |||||||||||||||||||
| Change in fair value of earn-out liability | — | — | — | 1,809 | |||||||||||||||||||
| Impairment of investment in third parties | — | — | 3,000 | — | |||||||||||||||||||
| Transaction and acquisition expenses | 2,496 | 2,731 | 5,675 | 10,551 | |||||||||||||||||||
|
Loss on extinguishment or modification of debt and
other, net
|
2 | — | 368 | 1,025 | |||||||||||||||||||
| Amortization of unconsolidated joint venture basis differences | 5 | — | 17 | 220 | |||||||||||||||||||
Realized performance income(1) |
— | — | (75) | (2,742) | |||||||||||||||||||
| Core FFO attributable to stockholders and OP unit holders |
$ | 77,870 | $ | 74,267 | $ | 310,716 | $ | 295,263 | |||||||||||||||
| CALCULATION OF ADJUSTED FFO ATTRIBUTABLE TO STOCKHOLDERS AND OP UNIT HOLDERS | |||||||||||||||||||||||
| Core FFO attributable to stockholders and OP unit holders | $ | 77,870 | $ | 74,267 | $ | 310,716 | $ | 295,263 | |||||||||||||||
| Adjustments: | |||||||||||||||||||||||
| Straight-line rent and above- and below-market leases and contracts |
(3,575) | (4,377) | (15,822) | (16,625) | |||||||||||||||||||
| Non-cash debt adjustments | 1,934 | 1,529 | 7,121 | 5,884 | |||||||||||||||||||
Capital expenditures and leasing commissions(2) |
(12,691) | (13,512) | (59,862) | (56,482) | |||||||||||||||||||
| Non-cash share-based compensation expense | 2,088 | 2,488 | 7,841 | 9,228 | |||||||||||||||||||
| Adjustments related to unconsolidated joint ventures | (124) | (146) | (662) | (613) | |||||||||||||||||||
| Adjusted FFO attributable to stockholders and OP unit holders |
$ | 65,502 | $ | 60,249 | $ | 249,332 | $ | 236,655 | |||||||||||||||
| NAREIT FFO/CORE FFO ATTRIBUTABLE TO STOCKHOLDERS AND OP UNIT HOLDERS PER DILUTED SHARE | |||||||||||||||||||||||
| Weighted-average shares of common stock outstanding - diluted |
134,667 | 131,781 | 132,970 | 130,332 | |||||||||||||||||||
| Nareit FFO attributable to stockholders and OP unit holders per share - diluted |
$ | 0.56 | $ | 0.54 | $ | 2.25 | $ | 2.15 | |||||||||||||||
| Core FFO attributable to stockholders and OP unit holders per share - diluted |
$ | 0.58 | $ | 0.56 | $ | 2.34 | $ | 2.27 | |||||||||||||||
| Phillips Edison & Company |
16
|
|||||||
|
Nareit FFO, Core FFO, and Adjusted FFO
Unaudited, in thousands (excluding per share amounts)
| |||||||||||||||||||||||||||||
| Three Months Ended | |||||||||||||||||||||||||||||
| December 31, 2023 |
September 30, 2023 |
June 30, 2023 |
March 31, 2023 |
December 31, 2022 |
|||||||||||||||||||||||||
| CALCULATION OF NAREIT FFO ATTRIBUTABLE TO STOCKHOLDERS AND OP UNIT HOLDERS | |||||||||||||||||||||||||||||
| Net income | $ | 15,188 | $ | 13,729 | $ | 16,209 | $ | 18,636 | $ | 15,703 | |||||||||||||||||||
| Adjustments: | |||||||||||||||||||||||||||||
| Depreciation and amortization of real estate assets | 59,048 | 58,144 | 59,115 | 57,953 | 57,266 | ||||||||||||||||||||||||
| Impairment of real estate assets | — | — | — | — | 322 | ||||||||||||||||||||||||
| Gain on disposal of property, net | (40) | (53) | (75) | (942) | (3,366) | ||||||||||||||||||||||||
| Adjustments related to unconsolidated joint ventures | 647 | 646 | 645 | 698 | 661 | ||||||||||||||||||||||||
| Nareit FFO attributable to stockholders and OP unit holders | $ | 74,843 | $ | 72,466 | $ | 75,894 | $ | 76,345 | $ | 70,586 | |||||||||||||||||||
| CALCULATION OF CORE FFO ATTRIBUTABLE TO STOCKHOLDERS AND OP UNIT HOLDERS | |||||||||||||||||||||||||||||
| Nareit FFO attributable to stockholders and OP unit holders | $ | 74,843 | $ | 72,466 | $ | 75,894 | $ | 76,345 | $ | 70,586 | |||||||||||||||||||
| Adjustments: | |||||||||||||||||||||||||||||
| Depreciation and amortization of corporate assets | 524 | 562 | 552 | 545 | 950 | ||||||||||||||||||||||||
| Impairment of investment in third parties | — | 3,000 | — | — | — | ||||||||||||||||||||||||
| Transaction and acquisition expenses | 2,496 | 580 | 1,261 | 1,338 | 2,731 | ||||||||||||||||||||||||
| Loss (gain) on extinguishment or modification of debt and other, net | 2 | 375 | (9) | — | — | ||||||||||||||||||||||||
| Amortization of unconsolidated joint venture basis differences | 5 | 4 | 7 | 1 | — | ||||||||||||||||||||||||
Realized performance income(1) |
— | — | — | (75) | — | ||||||||||||||||||||||||
| Core FFO attributable to stockholders and OP unit holders | $ | 77,870 | $ | 76,987 | $ | 77,705 | $ | 78,154 | $ | 74,267 | |||||||||||||||||||
| CALCULATION OF ADJUSTED FFO ATTRIBUTABLE TO STOCKHOLDERS AND OP UNIT HOLDERS | |||||||||||||||||||||||||||||
| Core FFO attributable to stockholders and OP unit holders | $ | 77,870 | $ | 76,987 | $ | 77,705 | $ | 78,154 | $ | 74,267 | |||||||||||||||||||
| Adjustments: | |||||||||||||||||||||||||||||
| Straight-line rent and above- and below-market leases and contracts | (3,575) | (3,683) | (4,645) | (3,919) | (4,377) | ||||||||||||||||||||||||
| Non-cash debt adjustments | 1,934 | 1,992 | 1,632 | 1,563 | 1,529 | ||||||||||||||||||||||||
Capital expenditures and leasing commissions(2) |
(12,691) | (18,497) | (15,533) | (13,141) | (13,512) | ||||||||||||||||||||||||
| Non-cash share-based compensation expense | 2,088 | 1,048 | 2,700 | 2,005 | 2,488 | ||||||||||||||||||||||||
| Adjustments related to unconsolidated joint ventures | (124) | (144) | (256) | (138) | (146) | ||||||||||||||||||||||||
| Adjusted FFO attributable to stockholders and OP unit holders | $ | 65,502 | $ | 57,703 | $ | 61,603 | $ | 64,524 | $ | 60,249 | |||||||||||||||||||
| NAREIT FFO/CORE FFO ATTRIBUTABLE TO STOCKHOLDERS AND OP UNIT HOLDERS PER DILUTED SHARE | |||||||||||||||||||||||||||||
| Weighted-average shares of common stock outstanding - diluted | 134,667 | 132,800 | 131,887 | 131,943 | 131,781 | ||||||||||||||||||||||||
| Nareit FFO attributable to stockholders and OP unit holders per share - diluted |
$ | 0.56 | $ | 0.55 | $ | 0.58 | $ | 0.58 | $ | 0.54 | |||||||||||||||||||
| Core FFO attributable to stockholders and OP unit holders per share - diluted |
$ | 0.58 | $ | 0.58 | $ | 0.59 | $ | 0.59 | $ | 0.56 | |||||||||||||||||||
| Phillips Edison & Company |
17
|
|||||||
|
EBITDAre Metrics
Unaudited, in thousands
| ||||||||||||||||||||||||||
| Three Months Ended December 31, |
Year Ended December 31, |
|||||||||||||||||||||||||
| 2023 | 2022 | 2023 | 2022 | |||||||||||||||||||||||
CALCULATION OF EBITDAre |
||||||||||||||||||||||||||
Net income |
$ | 15,188 | $ | 15,703 | $ | 63,762 | $ | 54,529 | ||||||||||||||||||
| Adjustments: | ||||||||||||||||||||||||||
| Depreciation and amortization | 59,572 | 58,216 | 236,443 | 236,224 | ||||||||||||||||||||||
| Interest expense, net | 22,569 | 18,301 | 84,232 | 71,196 | ||||||||||||||||||||||
| Gain on disposal of property, net | (40) | (3,366) | (1,110) | (7,517) | ||||||||||||||||||||||
| Impairment of real estate assets | — | 322 | — | 322 | ||||||||||||||||||||||
| Federal, state, and local tax expense | 81 | 433 | 438 | 806 | ||||||||||||||||||||||
| Adjustments related to unconsolidated joint ventures | 919 | 926 | 3,721 | 1,987 | ||||||||||||||||||||||
EBITDAre |
$ | 98,289 | $ | 90,535 | $ | 387,486 | $ | 357,547 | ||||||||||||||||||
CALCULATION OF ADJUSTED EBITDAre |
||||||||||||||||||||||||||
EBITDAre |
$ | 98,289 | $ | 90,535 | $ | 387,486 | $ | 357,547 | ||||||||||||||||||
| Adjustments: | ||||||||||||||||||||||||||
| Impairment of investment in third parties | — | — | 3,000 | — | ||||||||||||||||||||||
| Change in fair value of earn-out liability | — | — | — | 1,809 | ||||||||||||||||||||||
| Transaction and acquisition expenses | 2,496 | 2,731 | 5,675 | 10,551 | ||||||||||||||||||||||
| Amortization of unconsolidated joint venture basis differences | 5 | — | 17 | 220 | ||||||||||||||||||||||
Realized performance income(1) |
— | — | (75) | (2,742) | ||||||||||||||||||||||
Adjusted EBITDAre |
$ | 100,790 | $ | 93,266 | $ | 396,103 | $ | 367,385 | ||||||||||||||||||
| Phillips Edison & Company |
18
|
|||||||
|
EBITDAre Metrics
Unaudited, in thousands
| |||||||||||||||||||||||||||||
| Three Months Ended | |||||||||||||||||||||||||||||
| December 31, 2023 |
September 30, 2023 |
June 30, 2023 |
March 31, 2023 |
December 31, 2022 |
|||||||||||||||||||||||||
CALCULATION OF EBITDAre |
|||||||||||||||||||||||||||||
| Net income | $ | 15,188 | $ | 13,729 | $ | 16,209 | $ | 18,636 | $ | 15,703 | |||||||||||||||||||
| Adjustments: | |||||||||||||||||||||||||||||
| Depreciation and amortization | 59,572 | 58,706 | 59,667 | 58,498 | 58,216 | ||||||||||||||||||||||||
| Interest expense, net | 22,569 | 21,522 | 20,675 | 19,466 | 18,301 | ||||||||||||||||||||||||
| Gain on disposal of property, net | (40) | (53) | (75) | (942) | (3,366) | ||||||||||||||||||||||||
| Impairment of real estate assets | — | — | — | — | 322 | ||||||||||||||||||||||||
| Federal, state, and local tax expense | 81 | 120 | 119 | 118 | 433 | ||||||||||||||||||||||||
| Adjustments related to unconsolidated joint ventures | 919 | 918 | 918 | 966 | 926 | ||||||||||||||||||||||||
EBITDAre |
$ | 98,289 | $ | 94,942 | $ | 97,513 | $ | 96,742 | $ | 90,535 | |||||||||||||||||||
CALCULATION OF ADJUSTED EBITDAre |
|||||||||||||||||||||||||||||
EBITDAre |
$ | 98,289 | $ | 94,942 | $ | 97,513 | $ | 96,742 | $ | 90,535 | |||||||||||||||||||
| Adjustments: | |||||||||||||||||||||||||||||
| Impairment of investment in third parties | — | 3,000 | — | — | — | ||||||||||||||||||||||||
| Transaction and acquisition expenses | 2,496 | 580 | 1,261 | 1,338 | 2,731 | ||||||||||||||||||||||||
| Amortization of unconsolidated joint venture basis differences | 5 | 4 | 7 | 1 | — | ||||||||||||||||||||||||
Realized performance income(1) |
— | — | — | (75) | — | ||||||||||||||||||||||||
Adjusted EBITDAre |
$ | 100,790 | $ | 98,526 | $ | 98,781 | $ | 98,006 | $ | 93,266 | |||||||||||||||||||
| Phillips Edison & Company |
19
|
|||||||
|
Same-Center Net Operating Income
Unaudited, in thousands
| |||||||||||||||||||||||||||||||||||
| Three Months Ended December 31, |
Favorable (Unfavorable) % |
Year Ended December 31, |
Favorable (Unfavorable) % |
||||||||||||||||||||||||||||||||
| 2023 | 2022 | 2023 | 2022 | ||||||||||||||||||||||||||||||||
SAME-CENTER NOI(1) |
|||||||||||||||||||||||||||||||||||
| Revenues: | |||||||||||||||||||||||||||||||||||
Rental income(2) |
$ | 104,874 | $ | 100,834 | $ | 415,152 | $ | 398,507 | |||||||||||||||||||||||||||
| Tenant recovery income | 33,434 | 32,205 | 134,860 | 127,776 | |||||||||||||||||||||||||||||||
Reserves for uncollectibility(3) |
(1,351) | (1,328) | (3,409) | (1,918) | |||||||||||||||||||||||||||||||
| Other property income | 711 | 917 | 2,717 | 2,967 | |||||||||||||||||||||||||||||||
| Total revenues | 137,668 | 132,628 | 3.8 | % | 549,320 | 527,332 | 4.2 | % | |||||||||||||||||||||||||||
| Operating expenses: | |||||||||||||||||||||||||||||||||||
| Property operating expenses | 22,041 | 21,407 | 83,669 | 80,683 | |||||||||||||||||||||||||||||||
| Real estate taxes | 16,374 | 15,451 | 69,035 | 66,184 | |||||||||||||||||||||||||||||||
| Total operating expenses | 38,415 | 36,858 | (4.2) | % | 152,704 | 146,867 | (4.0) | % | |||||||||||||||||||||||||||
| Total Same-Center NOI | $ | 99,253 | $ | 95,770 | 3.6 | % | $ | 396,616 | $ | 380,465 | 4.2 | % | |||||||||||||||||||||||
| Same-Center NOI margin | 72.1% | 72.2% | 72.2% | 72.1% | |||||||||||||||||||||||||||||||
|
(1)Same-Center NOI represents the NOI for the 262 properties that were wholly-owned and operational for the entire portion of all comparable reporting periods.
(2)Excludes straight-line rental income, net amortization of above- and below-market leases, and lease buyout income.
(3)Includes billings that will not be recognized as revenue until cash is collected or the Neighbor resumes regular payments and/or we deem it appropriate to resume recording revenue on an accrual basis, rather than on a cash basis.
| |||||||||||||||||||||||||||||||||||
| Three Months Ended December 31, |
Year Ended December 31, |
||||||||||||||||||||||
| 2023 | 2022 | 2023 | 2022 | ||||||||||||||||||||
RECONCILIATION OF NET INCOME TO NOI AND SAME-CENTER NOI | |||||||||||||||||||||||
Net income |
$ | 15,188 | $ | 15,703 | $ | 63,762 | $ | 54,529 | |||||||||||||||
| Adjusted to exclude: | |||||||||||||||||||||||
| Fees and management income | (2,454) | (2,218) | (9,646) | (11,541) | |||||||||||||||||||
Straight-line rental income(1) |
(2,056) | (3,205) | (10,185) | (12,265) | |||||||||||||||||||
| Net amortization of above- and below-market leases | (1,394) | (1,163) | (5,178) | (4,324) | |||||||||||||||||||
| Lease buyout income | (206) | (52) | (1,222) | (2,414) | |||||||||||||||||||
| General and administrative expenses | 10,762 | 11,484 | 44,366 | 45,235 | |||||||||||||||||||
| Depreciation and amortization | 59,572 | 58,216 | 236,443 | 236,224 | |||||||||||||||||||
| Impairment of real estate assets | — | 322 | — | 322 | |||||||||||||||||||
| Interest expense, net | 22,569 | 18,301 | 84,232 | 71,196 | |||||||||||||||||||
| Gain on disposal of property, net | (40) | (3,366) | (1,110) | (7,517) | |||||||||||||||||||
Other expense, net |
770 | 2,422 | 7,312 | 12,160 | |||||||||||||||||||
| Property operating expenses (income) related to fees and management income |
384 | (15) | 2,059 | 3,046 | |||||||||||||||||||
| NOI for real estate investments | 103,095 | 96,429 | 410,833 | 384,651 | |||||||||||||||||||
Less: Non-same-center NOI(2) |
(3,842) | (659) | (14,217) | (4,186) | |||||||||||||||||||
| Total Same-Center NOI | $ | 99,253 | $ | 95,770 | $ | 396,616 | $ | 380,465 | |||||||||||||||
|
(1)Includes straight-line rent adjustments for Neighbors for whom revenue is being recorded on a cash basis.
(2)Includes operating revenues and expenses from non-same-center properties which includes properties acquired or sold and corporate activities.
| |||||||||||||||||||||||
| Phillips Edison & Company |
20
|
|||||||
|
Joint Venture Portfolio and Financial Summary
Unaudited, dollars and square feet in thousands
| |||||||||||||||||||||||||||||||||||
| UNCONSOLIDATED JOINT VENTURE PORTFOLIO SUMMARY | |||||||||||||||||||||||||||||||||||
| As of December 31, 2023 | |||||||||||||||||
| Joint Venture | Investment Partner | Ownership Percentage | Number of Shopping Centers | ABR | GLA | ||||||||||||
| Grocery Retail Partners I LLC ("GRP I") | The Northwestern Mutual Life Insurance Company | 14% | 20 | $31,908 | 2,213 | ||||||||||||
| UNCONSOLIDATED JOINT VENTURE FINANCIAL SUMMARY | |||||||||||||||||||||||||||||||||||
As of December 31, 2023 |
|||||||||||||||||
| GRP I | NRP(1) |
||||||||||||||||
| Total assets | $ | 363,544 | $ | 613 | |||||||||||||
| Gross debt | 174,026 | — | |||||||||||||||
| Pro rata share of debt | 24,358 | — | |||||||||||||||
| Year Ended December 31, 2023 |
|||||||||||||||||
| GRP I | NRP(1) |
||||||||||||||||
Pro rata share of Nareit FFO(2) |
$ | 2,908 | $ | (16) | |||||||||||||
Pro rata share of NOI(2) |
4,152 | — | |||||||||||||||
| Phillips Edison & Company |
21
|
|||||||
|
Supplemental Balance Sheets Detail
Unaudited, in thousands
| |||||||||||
| As of December 31, | |||||||||||
| 2023 | 2022 | ||||||||||
| OTHER ASSETS, NET | |||||||||||
| Deferred leasing commissions and costs | $ | 53,379 | $ | 49,687 | |||||||
Deferred financing expenses(1) |
8,984 | 8,984 | |||||||||
| Office equipment, capital lease assets, and other | 24,073 | 23,051 | |||||||||
| Corporate intangible assets | 6,686 | 6,692 | |||||||||
| Total depreciable and amortizable assets | 93,122 | 88,414 | |||||||||
| Accumulated depreciation and amortization | (53,205) | (47,483) | |||||||||
| Net depreciable and amortizable assets | 39,917 | 40,931 | |||||||||
Accounts receivable, net(2) |
44,548 | 37,274 | |||||||||
| Accounts receivable - affiliates | 803 | 513 | |||||||||
Deferred rent receivable, net(3) |
62,288 | 52,141 | |||||||||
| Derivative assets | 12,669 | 25,853 | |||||||||
| Prepaid expenses and other | 10,745 | 14,575 | |||||||||
Investment in third parties(4) |
6,875 | 9,800 | |||||||||
| Investment in marketable securities | 8,566 | 7,792 | |||||||||
| Total other assets, net | $ | 186,411 | $ | 188,879 | |||||||
| ACCOUNTS PAYABLE AND OTHER LIABILITIES | |||||||||||
| Accounts payable trade and other accruals | $ | 30,682 | $ | 34,431 | |||||||
| Accrued real estate taxes | 33,379 | 30,979 | |||||||||
| Security deposits | 15,426 | 14,170 | |||||||||
| Distribution accrual | 1,093 | 1,048 | |||||||||
| Accrued compensation | 15,983 | 14,210 | |||||||||
| Accrued interest | 9,684 | 8,192 | |||||||||
| Capital expenditure accrual | 9,892 | 9,834 | |||||||||
| Accrued income taxes and deferred tax liabilities, net | 322 | 321 | |||||||||
| Total accounts payable and other liabilities | $ | 116,461 | $ | 113,185 | |||||||
| Phillips Edison & Company |
22
|
|||||||
|
Supplemental Statements of Operations Detail
Unaudited, in thousands
| |||||||||||||||||||||||
| Three Months Ended December 31, | Year Ended December 31, | ||||||||||||||||||||||
| 2023 | 2022 | 2023 | 2022 | ||||||||||||||||||||
| REVENUES | |||||||||||||||||||||||
Rental income(1) |
$ | 112,723 | $ | 105,193 | $ | 440,771 | $ | 411,820 | |||||||||||||||
Recovery income(1) |
36,544 | 33,620 | 144,496 | 132,361 | |||||||||||||||||||
| Straight-line rent amortization | 1,853 | 3,051 | 9,539 | 11,668 | |||||||||||||||||||
| Amortization of lease assets | 1,380 | 1,153 | 5,126 | 4,266 | |||||||||||||||||||
| Lease buyout income | 206 | 52 | 1,222 | 2,414 | |||||||||||||||||||
Adjustments for collectibility(2)(3) |
(1,479) | (1,366) | (3,653) | (1,991) | |||||||||||||||||||
| Fees and management income | 2,454 | 2,218 | 9,646 | 11,541 | |||||||||||||||||||
| Other property income | 768 | 1,118 | 2,977 | 3,293 | |||||||||||||||||||
| Total revenues | $ | 154,449 | $ | 145,039 | $ | 610,124 | $ | 575,372 | |||||||||||||||
|
(1)Includes income related to lease payments before assessing for collectibility.
(2)Includes revenue adjustments for non-creditworthy Neighbors.
(3)Contains general reserves but excludes reserves for straight-line rent amortization; includes recovery of previous revenue reserved.
| |||||||||||||||||||||||
| INTEREST EXPENSE, NET | |||||||||||||||||||||||
| Interest on unsecured term loans and senior notes, net | $ | 13,757 | $ | 11,055 | $ | 48,803 | $ | 40,975 | |||||||||||||||
| Interest on secured debt | 4,524 | 5,010 | 18,614 | 20,768 | |||||||||||||||||||
| Interest on revolving credit facility, net | 2,249 | 858 | 8,785 | 2,069 | |||||||||||||||||||
Non-cash amortization and other(1) |
2,037 | 1,378 | 7,662 | 6,359 | |||||||||||||||||||
Loss on extinguishment or modification of debt and other, net(2) |
2 | — | 368 | 1,025 | |||||||||||||||||||
| Total interest expense, net | $ | 22,569 | $ | 18,301 | $ | 84,232 | $ | 71,196 | |||||||||||||||
|
(1)Amortization of debt-related items includes items such as deferred financing expenses, assumed market debt, and derivative adjustments, net.
(2)Includes defeasance fees related to early repayments of debt.
| |||||||||||||||||||||||
OTHER EXPENSE, NET |
|||||||||||||||||||||||
| Transaction and acquisition expenses | $ | (2,496) | $ | (2,731) | $ | (5,675) | $ | (10,551) | |||||||||||||||
| Impairment of investment in third parties | — | — | (3,000) | — | |||||||||||||||||||
| Federal, state, and local income tax expense | (81) | (433) | (438) | (806) | |||||||||||||||||||
Equity in net income of unconsolidated investments |
62 | 77 | 372 | 1,280 | |||||||||||||||||||
| Increase in fair value of earn-out liability | — | — | — | (1,809) | |||||||||||||||||||
| Other | 1,745 | 665 | 1,429 | (274) | |||||||||||||||||||
Total other expense, net |
$ | (770) | $ | (2,422) | $ | (7,312) | $ | (12,160) | |||||||||||||||
| Phillips Edison & Company |
23
|
|||||||
|
Capital Expenditures
Unaudited, in thousands
| |||||||||||||||||||||||
| Three Months Ended December 31, |
Year Ended December 31, |
||||||||||||||||||||||
| 2023 | 2022 | 2023 | 2022 | ||||||||||||||||||||
CAPITAL EXPENDITURES FOR REAL ESTATE(1)(2) |
|||||||||||||||||||||||
| Capital improvements | $ | 4,430 | $ | 5,402 | $ | 22,766 | $ | 17,828 | |||||||||||||||
| Tenant improvements | 6,179 | 5,498 | 26,663 | 24,194 | |||||||||||||||||||
| Redevelopment and development | 8,930 | 16,228 | 38,206 | 53,671 | |||||||||||||||||||
| Total capital expenditures for real estate | $ | 19,539 | $ | 27,128 | $ | 87,635 | $ | 95,693 | |||||||||||||||
| Corporate asset capital expenditures | 146 | 535 | 963 | 3,292 | |||||||||||||||||||
Capitalized indirect costs(3) |
1,025 | 404 | 4,103 | 3,430 | |||||||||||||||||||
| Total capital spending activity | $ | 20,710 | $ | 28,067 | $ | 92,701 | $ | 102,415 | |||||||||||||||
| Cash paid for leasing commissions | $ | 2,330 | $ | 2,381 | $ | 8,249 | $ | 8,199 | |||||||||||||||
| Phillips Edison & Company |
24
|
|||||||
|
Active Capital Projects
Unaudited, dollars in thousands
| |||||||||||||||||||||||
Project |
Location |
Description |
Target Stabilization Quarter(1) |
Incurred to Date | Future Spend | Total Estimated Costs | Estimated Project Yield | ||||||||||||||||
GROUND UP EXPANSION DEVELOPMENT |
|||||||||||||||||||||||
| Southern Palms | Tempe, AZ | Construction of a 2K SF single tenant outparcel 100% leased with Starbucks | Q1 2024 | $ | 1,822 | $ | 109 | $ | 1,930 | ||||||||||||||
| Oak Mill Plaza | Niles, IL | Construction of a 5K SF multi-tenant outparcel 74% leased with Starbucks, Buffalo Wild Wings Go | Q1 2024 | 3,374 | 158 | 3,532 | |||||||||||||||||
| Roxborough Marketplace | Littleton, CO | Construction of a 2K SF single tenant outparcel 100% leased with Starbucks | Q3 2024 | 724 | 1,283 | 2,007 | |||||||||||||||||
| Hamilton Ridge | Buford, GA | Construction of a 6K SF multi-tenant outparcel 100% leased and/or leases out with bb.q Chicken, Vitality Bowls, Allcare | Q4 2024 | 2,837 | 641 | 3,478 | |||||||||||||||||
| Northstar Marketplace | Ramsey, MN | Construction of a 7K SF multi-tenant outparcel | Q4 2024 | 2,549 | 586 | 3,135 | |||||||||||||||||
| Total: Ground Up | $ | 11,306 | $ | 2,777 | $ | 14,082 | 6%-8% | ||||||||||||||||
| Phillips Edison & Company |
25
|
|||||||
|
Active Capital Projects
Unaudited, dollars in thousands
| |||||||||||||||||||||||
Project |
Location |
Description |
Target Stabilization Quarter(1) |
Incurred to Date | Future Spend | Total Estimated Costs | Estimated Project Yield | ||||||||||||||||
REDEVELOPMENT |
|||||||||||||||||||||||
| The Oaks | Hudson, FL | First phase of Center Repositioning project with EOS Fitness, Ross Dress for Less, Five Below | Q4 2023 | $ | 7,931 | $ | 2,600 | $ | 10,531 | ||||||||||||||
| Duck Creek Plaza | Bettendorf, IA | Remerchandise former Schnucks and Malibu Jack's | Q1 2024 | 1,664 | 1,900 | 3,564 | |||||||||||||||||
| The Oaks | Hudson, FL | Second phase of Center Repositioning project on multiple units with leases out on Skechers, Bealls and multiple inline units | Q3 2024 | 2,675 | 1,782 | 4,457 | |||||||||||||||||
| Providence Commons | Mt. Juliet, TN | Remerchandise former Tuesday Morning with Five Below | Q4 2024 | 779 | 320 | 1,099 | |||||||||||||||||
| Total: Redevelopment | $ | 13,049 | $ | 6,602 | $ | 19,651 | 11%-20% | ||||||||||||||||
| Active Projects Total | $ | 24,355 | $ | 9,379 | $ | 33,733 | 9%-12% | ||||||||||||||||
2023 STABILIZED PROJECTS |
13 | $35,948 | 9% | ||||||||||||||||||||
| Phillips Edison & Company |
26
|
|||||||
|
Capitalization and Debt Ratios
Unaudited, in thousands (excluding per share amounts and leverage ratios)
| |||||||||||
| December 31, | |||||||||||
| 2023 | 2022 | ||||||||||
| EQUITY CAPITALIZATION | |||||||||||
| Common stock outstanding | 122,024 | 117,126 | |||||||||
| OP units outstanding | 13,817 | 14,099 | |||||||||
| Total shares and units outstanding | 135,841 | 131,225 | |||||||||
Share price |
$ | 36.48 | $ | 31.84 | |||||||
| Total equity market capitalization | $ | 4,955,480 | $ | 4,178,204 | |||||||
| DEBT | |||||||||||
| Debt obligations, net | $ | 1,969,272 | $ | 1,896,594 | |||||||
| Add: Discount on notes payable | 6,302 | 7,001 | |||||||||
| Add: Market debt adjustments, net | 858 | 1,226 | |||||||||
| Add: Deferred financing expenses, net | 10,303 | 7,963 | |||||||||
| Total debt - gross | 1,986,735 | 1,912,784 | |||||||||
| Less: Cash and cash equivalents | 4,872 | 5,478 | |||||||||
| Total net debt - consolidated | 1,981,863 | 1,907,306 | |||||||||
| Add: Prorated share from unconsolidated joint ventures | 24,156 | 24,096 | |||||||||
| Total net debt | $ | 2,006,019 | $ | 1,931,402 | |||||||
| ENTERPRISE VALUE | |||||||||||
| Total net debt | $ | 2,006,019 | $ | 1,931,402 | |||||||
| Total equity market capitalization | 4,955,480 | 4,178,204 | |||||||||
| Total enterprise value | $ | 6,961,499 | $ | 6,109,606 | |||||||
| FINANCIAL LEVERAGE RATIOS | |||||||||||
Net debt to Adjusted EBITDAre - annualized: |
|||||||||||
| Net debt | $ | 2,006,019 | $ | 1,931,402 | |||||||
Adjusted EBITDAre - annualized(1) |
396,103 | 367,385 | |||||||||
Net debt to Adjusted EBITDAre - annualized |
5.1x | 5.3x | |||||||||
| Net debt to total enterprise value: | |||||||||||
| Net debt | $ | 2,006,019 | $ | 1,931,402 | |||||||
| Total enterprise value | 6,961,499 | 6,109,606 | |||||||||
| Net debt to total enterprise value | 28.8% | 31.6% | |||||||||
| Phillips Edison & Company |
27
|
|||||||
|
Summary of Outstanding Debt
Unaudited, dollars in thousands
| |||||||||||||||||
| Outstanding Balance | Contractual Interest Rate |
Maturity Date | Percent of Total Indebtedness | ||||||||||||||
| SECURED DEBT | |||||||||||||||||
| Individual property mortgages | $ | 95,677 | 3.45% - 6.43% | 2024 - 2031 | 5% | ||||||||||||
| Secured pool due 2027 (15 assets) | 195,000 | 3.52% | 2027 | 10% | |||||||||||||
| Secured pool due 2030 (16 assets) | 200,000 | 3.35% | 2030 | 10% | |||||||||||||
| Total secured debt | $ | 490,677 | 25% | ||||||||||||||
| UNSECURED DEBT | |||||||||||||||||
Revolving credit facility(1)(2) |
$ | 181,000 | SOFR + 1.14% | 2026 | 9% | ||||||||||||
Term loan due 2025(1) |
240,000 | SOFR + 1.29% | 2025 | 12% | |||||||||||||
Term loan due 2026(2) |
161,750 | SOFR + 1.35% | 2026 | 8% | |||||||||||||
Term loan due 2026(1) |
240,000 | SOFR+ 1.29% | 2026 | 12% | |||||||||||||
| Term loan due 2027 | 158,000 | SOFR + 1.35% | 2027 | 8% | |||||||||||||
| Term loan due 2027 | 165,000 | SOFR + 1.35% | 2027 | 8% | |||||||||||||
| Senior unsecured note due 2031 | 350,000 | 2.63% | 2031 | 18% | |||||||||||||
| Total unsecured debt | $ | 1,495,750 | 75% | ||||||||||||||
| Finance leases, net | 308 | ||||||||||||||||
| Total debt obligations | $ | 1,986,735 | |||||||||||||||
| Assumed market debt adjustments, net | $ | (858) | |||||||||||||||
| Discount on notes payable | (6,302) | ||||||||||||||||
| Deferred financing expenses, net | (10,303) | ||||||||||||||||
| Debt obligations, net | $ | 1,969,272 | |||||||||||||||
| Notional Amount | Fixed SOFR | ||||||||||
INTEREST RATE SWAPS(3) |
|||||||||||
| Interest rate swap expiring September 2024 | 200,000 | 2.09 | % | ||||||||
| Interest rate swap expiring October 2024 | 175,000 | 2.07 | % | ||||||||
| Interest rate swap expiring November 2025 | 125,000 | 2.84 | % | ||||||||
| Interest rate swap expiring September 2026 | 200,000 | 3.36 | % | ||||||||
| Total notional amount | $ | 700,000 | |||||||||
| Phillips Edison & Company |
28
|
|||||||
|
Debt Overview and Schedule of Maturities
Unaudited, dollars in thousands
| ||||||||||||||||||||||||||||||||||||||||||||||||||
| Secured Debt | Unsecured Debt(2) |
|||||||||||||||||||||||||||||||||||||||||||||||||
| Maturity Year | Scheduled Mortgage Principal Payments | Mortgage Loans | Secured Portfolio Loans | Unsecured Term Loans | Senior Unsecured Notes | Revolving Line of Credit | Total Consolidated Debt | Pro Rata Share of JV Debt | Total Debt | Weighted-Average Interest Rate(1)(2) |
||||||||||||||||||||||||||||||||||||||||
| 2024 | 2,993 | 25,130 | — | — | — | 28,123 | — | 28,123 | 5.1 | % | ||||||||||||||||||||||||||||||||||||||||
| 2025 | 1,956 | 35,680 | — | 240,000 | — | — | 277,636 | — | 277,636 | 3.4 | % | |||||||||||||||||||||||||||||||||||||||
| 2026 | 1,908 | — | — | 240,000 | — | — | 241,908 | 24,358 | 266,266 | 3.6 | % | |||||||||||||||||||||||||||||||||||||||
| 2027 | 1,905 | 3,690 | 195,000 | 323,000 | — | 181,000 | 704,595 | — | 704,595 | 5.0 | % | |||||||||||||||||||||||||||||||||||||||
| 2028 | 767 | 16,600 | — | 161,750 | — | — | 179,117 | — | 179,117 | 6.5 | % | |||||||||||||||||||||||||||||||||||||||
| 2029 | 804 | — | — | — | — | — | 804 | — | 804 | — | % | |||||||||||||||||||||||||||||||||||||||
| 2030 | 844 | — | 200,000 | — | — | — | 200,844 | — | 200,844 | 3.4 | % | |||||||||||||||||||||||||||||||||||||||
| 2031 | 560 | 2,840 | — | — | 350,000 | — | 353,400 | — | 353,400 | 2.7 | % | |||||||||||||||||||||||||||||||||||||||
| Net debt market adjustments / discounts / issuance costs | — | — | — | — | — | — | (17,463) | (546) | (18,009) | N/A | ||||||||||||||||||||||||||||||||||||||||
| Finance leases | — | — | — | — | — | — | 308 | — | 308 | N/A | ||||||||||||||||||||||||||||||||||||||||
| Total | $ | 11,737 | $ | 83,940 | $ | 395,000 | $ | 964,750 | $ | 350,000 | $ | 181,000 | $ | 1,969,272 | $ | 23,812 | $ | 1,993,084 | 4.2 | % | ||||||||||||||||||||||||||||||
| Weighted-Average | |||||||||||||||||||||||||||||
| Total Debt | Percent of Total Indebtedness | Effective Interest Rate(1) |
Years to Maturity(2) |
||||||||||||||||||||||||||
| Fixed rate debt | $ | 1,540,677 | 76.6% | 3.5% | 5.9 | ||||||||||||||||||||||||
| Variable rate debt | 445,750 | 22.2% | 6.6% | 2.8 | |||||||||||||||||||||||||
| Net debt premiums / issuance costs | (17,463) | N/A | N/A | N/A | |||||||||||||||||||||||||
| Finance leases | 308 | N/A | N/A | N/A | |||||||||||||||||||||||||
| Total consolidated debt | $ | 1,969,272 | 98.8% | 4.2% | 4.1 | ||||||||||||||||||||||||
| Pro rata share of JV Debt | 24,358 | 1.2% | 3.6% | 2.8 | |||||||||||||||||||||||||
| Net debt premiums / issuance costs of JV Debt | (546) | N/A | N/A | N/A | |||||||||||||||||||||||||
| Total consolidated + JV debt | $ | 1,993,084 | 100.0% | 4.2% | 4.1 | ||||||||||||||||||||||||
| Phillips Edison & Company |
29
|
|||||||
|
Debt Covenants
Unaudited, dollars in thousands
| |||||||||||||||||
| UNSECURED CREDIT FACILITY AND TERM LOANS DUE 2025, 2026, and 2027 | |||||||||||||||||
| Covenant | December 31, 2023 | ||||||||||||||||
| LEVERAGE RATIO | |||||||||||||||||
| Total Indebtedness | $2,011,968 | ||||||||||||||||
| Total Asset Value | $6,781,787 | ||||||||||||||||
| Leverage Ratio | =<60% | 29.7% | |||||||||||||||
| SECURED LEVERAGE RATIO | |||||||||||||||||
| Total Secured Indebtedness | $515,344 | ||||||||||||||||
| Total Asset Value | $6,781,787 | ||||||||||||||||
| Secured Leverage Ratio | =<35% | 7.6% | |||||||||||||||
| FIXED CHARGE COVERAGE RATIO | |||||||||||||||||
| Adjusted EBITDA | $374,238 | ||||||||||||||||
| Total Fixed Charges | $83,586 | ||||||||||||||||
| Fixed Charge Coverage Ratio | >1.5x | 4.48x | |||||||||||||||
| MAXIMUM UNSECURED INDEBTEDNESS TO UNENCUMBERED ASSET VALUE | |||||||||||||||||
| Total Unsecured Indebtedness | $1,509,293 | ||||||||||||||||
| Unencumbered Asset Value | $5,469,905 | ||||||||||||||||
| Unsecured Indebtedness to Unencumbered Asset Value | =<60% | 27.6% | |||||||||||||||
| MINIMUM UNENCUMBERED NOI TO INTEREST EXPENSE | |||||||||||||||||
| Unencumbered NOI | $357,778 | ||||||||||||||||
| Interest Expense for Unsecured Indebtedness | $59,387 | ||||||||||||||||
| Unencumbered NOI to Interest Expense | >=1.75x | 6.02x | |||||||||||||||
| DIVIDEND PAYOUT RATIO | |||||||||||||||||
| Distributions | $151,745 | ||||||||||||||||
| Funds From Operations | $312,174 | ||||||||||||||||
| Dividend Payout Ratio | <95% | 48.6% | |||||||||||||||
| SENIOR UNSECURED NOTES DUE 2031 | |||||||||||||||||
| Covenant | December 31, 2023 | ||||||||||||||||
| AGGREGATE DEBT TEST | |||||||||||||||||
| Total Indebtedness | $1,999,186 | ||||||||||||||||
| Total Asset Value | $6,079,376 | ||||||||||||||||
| Aggregate Debt Test | <65% | 32.9% | |||||||||||||||
| SECURED DEBT TEST | |||||||||||||||||
| Total Secured Indebtedness | $490,985 | ||||||||||||||||
| Total Asset Value | $6,079,376 | ||||||||||||||||
| Secured Debt Test | <40% | 8.1% | |||||||||||||||
| DEBT SERVICE TEST | |||||||||||||||||
| Consolidated EBITDA | $393,808 | ||||||||||||||||
| Annual Debt Service Charge | $77,443 | ||||||||||||||||
| Debt Service Test | >1.5x | 5.09x | |||||||||||||||
| MAINTENANCE OF TOTAL UNENCUMBERED ASSETS | |||||||||||||||||
| Unencumbered Asset Value | $5,055,910 | ||||||||||||||||
| Total Unsecured Indebtedness | $1,508,200 | ||||||||||||||||
| Maintenance of Total Unencumbered Assets | >150% | 335% | |||||||||||||||
| Note: Calculations are per covenant definitions as set forth in the applicable debt agreements. | |||||||||||||||||
| Phillips Edison & Company |
30
|
|||||||
| TRANSACTIONAL SUMMARY | ||
Quarter Ended December 31, 2023 | ||
|
Acquisition Summary
Unaudited, dollars in thousands
| ||||||||||||||||||||||||||||||||||||||
| Date | Property Name | Location | Total GLA | Contract Price | Leased Occupancy at Acquisition | Grocery Anchor | ||||||||||||||||||||||||||||||||
| 1/19/2023 | Providence Commons | Mt. Juliet, TN | 110,137 | $27,100 | 100.0% | Publix | ||||||||||||||||||||||||||||||||
| 3/16/2023 | Village Shoppes at Windermere | Suwanee, GA | 73,442 | 19,550 | 93.2% | Publix | ||||||||||||||||||||||||||||||||
| 3/27/2023 | Town Center at Jensen Beach | Jensen Beach. FL | 109,326 | 17,200 | 83.8% | Publix | ||||||||||||||||||||||||||||||||
| 3/27/2023 | Shops at Sunset Lakes | Miramar, FL | 70,274 | 14,800 | 96.8% | Publix | ||||||||||||||||||||||||||||||||
| 8/15/2023 | Oconomowoc Development Land | Oconomowoc, WI | N/A | 510 | N/A | N/A | ||||||||||||||||||||||||||||||||
| 8/16/2023 | Lake Pointe Market | Rowlett, TX | 40,608 | 12,900 | 96.5% | Tom Thumb (Shadow) | ||||||||||||||||||||||||||||||||
| 10/19/2023 | Leesburg Bank OP at Shoppes of Lake Village | Leesburg, FL | 4,887 | 3,100 | N/A | N/A | ||||||||||||||||||||||||||||||||
| 10/30/2023 | Mansell Village | Roswell, GA | 89,688 | 16,250 | 93.0% | Kroger | ||||||||||||||||||||||||||||||||
| 11/13/2023 | Riverpark Shopping Center | Sugar Land, TX | 317,331 | 79,000 | 79.1% | H-E-B | ||||||||||||||||||||||||||||||||
| 12/4/2023 | Apache Shoppes | Rochester, MN | 60,665 | 6,400 | 64.2% | Trader Joe's | ||||||||||||||||||||||||||||||||
| 12/4/2023 | Maple View | Grayslake, IL | 114,668 | 23,120 | 89.6% | Jewel-Osco | ||||||||||||||||||||||||||||||||
| 12/5/2023 | Quail Pointe | Fair Oaks, CA | 98,366 | 44,300 | 92.5% | Trader Joe's | ||||||||||||||||||||||||||||||||
| 12/11/2023 | Southampton Village OP | Tyrone, GA | 3,055 | 950 | N/A | N/A | ||||||||||||||||||||||||||||||||
| 12/11/2023 | Glenbrook Marketplace | Chicago, IL | 47,832 | 13,300 | 88.4% | N/A | ||||||||||||||||||||||||||||||||
| Total acquisitions | 1,140,279 | $278,480 | ||||||||||||||||||||||||||||||||||||
Weighted-average cap rate (1) |
6.6 | % | ||||||||||||||||||||||||||||||||||||
(1) Weighted average cap rates exclude non-income producing assets | ||||||||||||||||||||||||||||||||||||||
|
Disposition Summary
Unaudited, dollars in thousands
| ||||||||||||||||||||||||||||||||||||||
| Date | Property Name | Location | Total GLA | Contract Price | Leased Occupancy at Disposition | Grocery Anchor | ||||||||||||||||||||||||||||||||
| 5/9/2023 | Greentree McDonald's | Racine, WI | 4,130 | $1,000 | 100.0% | N/A | ||||||||||||||||||||||||||||||||
| 6/9/2023 | Towne & Country (B&O) | Hamilton, OH | 79,896 | 4,800 | 98.6% | N/A | ||||||||||||||||||||||||||||||||
| 6/16/2023 | Broadway Promenade Condo Unit 2102 | Sarasota, FL | 2,417 | 450 | N/A | N/A | ||||||||||||||||||||||||||||||||
| Total dispositions | 86,443 | $6,250 | ||||||||||||||||||||||||||||||||||||
| Weighted-average cap rate | 8.6 | % | ||||||||||||||||||||||||||||||||||||
| Phillips Edison & Company |
32
|
|||||||
| PORTFOLIO SUMMARY | ||
Quarter Ended December 31, 2023 | ||
|
Wholly-Owned Portfolio Summary
Unaudited, dollars and square feet in thousands (excluding per square foot amounts)
| |||||
| As of December 31, 2023 |
|||||
| PORTFOLIO OVERVIEW: | |||||
| Number of shopping centers | 281 | ||||
| Number of states | 31 | ||||
| Total GLA | 32,153 | ||||
| Average shopping center GLA | 114 | ||||
| Total ABR | $ | 470,819 | |||
Total ABR from necessity-based goods and services(1) |
70.4 | % | |||
| Percent of ABR from non-grocery anchors | 13.4 | % | |||
| Percent of ABR from inline spaces | 55.0 | % | |||
| GROCERY METRICS: | |||||
Percent of ABR from omni-channel grocery-anchored shopping centers |
97.2 | % | |||
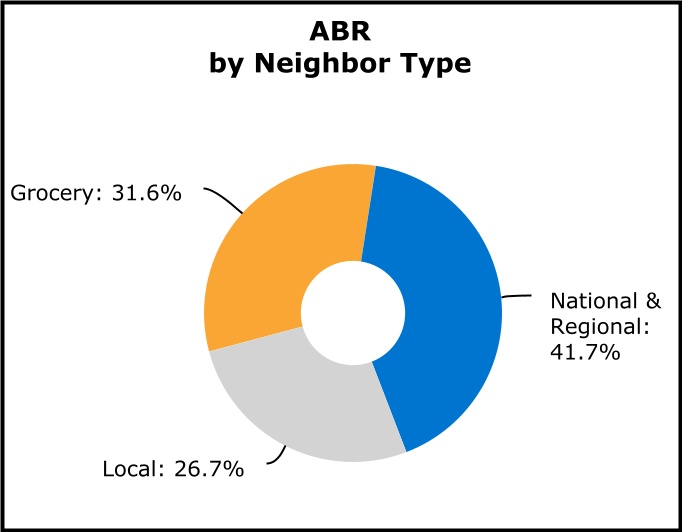
| Percent of ABR from grocery anchors | 31.6 | % | |||
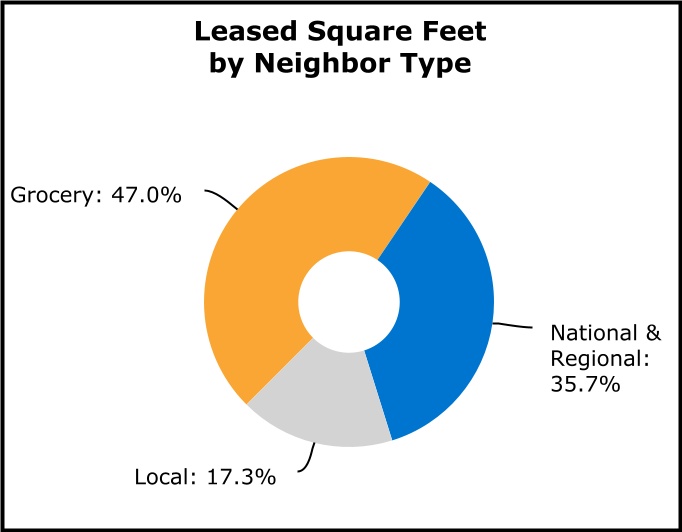
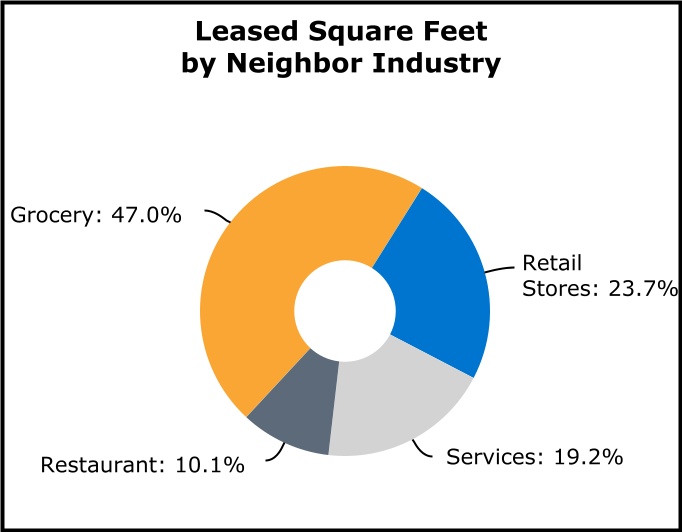
| Percent of occupied GLA leased to grocery Neighbors | 47.0 | % | |||
Grocer health ratio(2) |
2.3 | % | |||
| Percent of ABR from centers with grocery anchors that are #1 or #2 by sales | 85.4 | % | |||
| Average annual sales per square foot of reporting grocers | $ | 681 | |||
| LEASED OCCUPANCY AS A PERCENTAGE OF RENTABLE SQUARE FEET: | |||||
| Total portfolio | 97.4 | % | |||
| Anchor spaces | 98.9 | % | |||
| Inline spaces | 94.7 | % | |||
AVERAGE REMAINING LEASE TERM (IN YEARS):(3) |
|||||
| Total portfolio | 4.4 | ||||
| Grocery anchor spaces | 4.4 | ||||
| Non-grocery anchor spaces | 4.9 | ||||
| Inline spaces | 4.0 | ||||
PORTFOLIO RETENTION RATE:(4) |
|||||
| Total portfolio | 93.3 | % | |||
| Anchor spaces | 98.5 | % | |||
| Inline spaces | 83.1 | % | |||
| AVERAGE ABR PER SQUARE FOOT: | |||||
| Total portfolio | $ | 15.03 | |||
| Anchor spaces | $ | 10.12 | |||
| Inline spaces | $ | 24.66 | |||
| Phillips Edison & Company |
34
|
|||||||
|
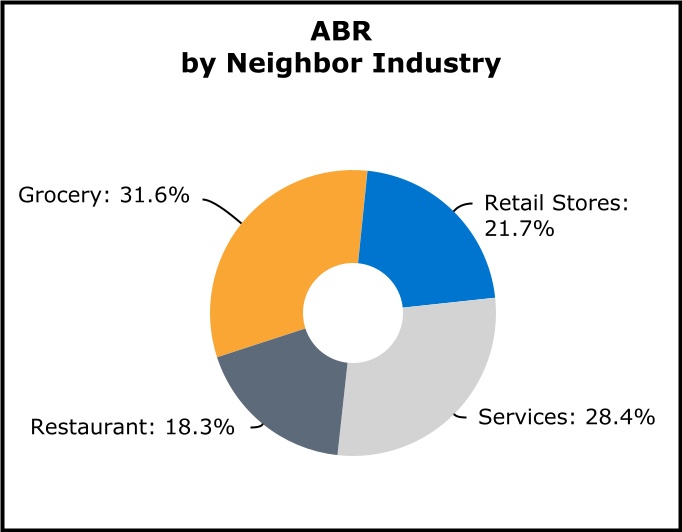
ABR by Neighbor Category
Unaudited
| |||||
| As of December 31, 2023 |
|||||
| NECESSITY RETAIL AND SERVICES | |||||
| Grocery | 31.6 | % | |||
| Quick service - Restaurant | 11.1 | % | |||
| Medical | 6.3 | % | |||
| Beauty & Hair Care | 5.2 | % | |||
| Banks, insurance, and government services | 3.5 | % | |||
| Pet supply | 2.4 | % | |||
| Dollar stores | 1.8 | % | |||
| Education & Training | 1.6 | % | |||
| Hardware/automotive | 1.4 | % | |||
| Telecommunications/cell phone services | 1.4 | % | |||
| Wine, Beer, & Liquor | 1.4 | % | |||
| Pharmacy | 0.8 | % | |||
| Other necessity-based | 1.9 | % | |||
| Total ABR from necessity-based goods and services | 70.4 | % | |||
| OTHER RETAIL STORES | |||||
Soft goods(1) |
12.9 | % | |||
| Full service - restaurant | 7.2 | % | |||
Fitness and lifestyle services(2) |
6.0 | % | |||
Other retail(3) |
3.5 | % | |||
| Total ABR from other retail stores | 29.6 | % | |||
| Total ABR | 100.0 | % | |||
| Phillips Edison & Company |
35
|
|||||||
|
Occupancy and ABR
Unaudited
| |||||||||||||||||||||||||||||
| Quarter Ended | |||||||||||||||||||||||||||||
| December 31, 2023 |
September 30, 2023 |
June 30, 2023 |
March 31, 2023 |
December 31, 2022 |
|||||||||||||||||||||||||
| OCCUPANCY | |||||||||||||||||||||||||||||
| Leased Basis | |||||||||||||||||||||||||||||
| Anchor | 98.9 | % | 99.3 | % | 99.4 | % | 99.3 | % | 99.3 | % | |||||||||||||||||||
| Inline | 94.7 | % | 94.9 | % | 94.8 | % | 94.3 | % | 93.8 | % | |||||||||||||||||||
| Total leased occupancy | 97.4 | % | 97.8 | % | 97.8 | % | 97.5 | % | 97.4 | % | |||||||||||||||||||
| Economic Basis | |||||||||||||||||||||||||||||
| Anchor | 98.5 | % | 99.3 | % | 99.0 | % | 98.4 | % | 98.4 | % | |||||||||||||||||||
| Inline | 94.2 | % | 94.4 | % | 93.8 | % | 93.5 | % | 92.5 | % | |||||||||||||||||||
| Total economic occupancy | 97.0 | % | 97.6 | % | 97.2 | % | 96.7 | % | 96.4 | % | |||||||||||||||||||
| ABR | |||||||||||||||||||||||||||||
| Leased Basis - $ | |||||||||||||||||||||||||||||
| Anchor | $ | 209,985 | $ | 203,904 | $ | 203,645 | $ | 203,525 | $ | 200,926 | |||||||||||||||||||
| Inline | 260,834 | 249,124 | 245,669 | 242,086 | 234,786 | ||||||||||||||||||||||||
| Total ABR | $ | 470,819 | $ | 453,028 | $ | 449,314 | $ | 445,611 | $ | 435,712 | |||||||||||||||||||
| Leased Basis - PSF | |||||||||||||||||||||||||||||
| Anchor | $ | 10.12 | $ | 9.98 | $ | 9.97 | $ | 9.95 | $ | 9.92 | |||||||||||||||||||
| Inline | 24.66 | 24.19 | 23.95 | 23.66 | 23.39 | ||||||||||||||||||||||||
| Total ABR PSF | $ | 15.03 | $ | 14.74 | $ | 14.64 | $ | 14.52 | $ | 14.39 | |||||||||||||||||||
| Phillips Edison & Company |
36
|
|||||||
|
Top 25 Neighbors by ABR
Dollars and square footage amounts in thousands
| |||||||||||||||||||||||
| Number of Locations | |||||||||||||||||||||||
| Neighbor | Banners Leased at PECO Centers | Wholly-Owned | Joint Ventures | ABR(1) |
% ABR(1) |
Leased SF(1) |
|||||||||||||||||
| 1 | Kroger | Kroger, Fry's Food Stores, King Soopers, Pick 'n Save, Smith's, Harris Teeter, Quality Food Centers, Ralphs, Mariano's, Food 4 Less, Metro Market | 57 | 6 | $ | 28,459 | 6.0 | % | 3,474 | ||||||||||||||
| 2 | Publix | Publix | 52 | 9 | 26,570 | 5.6 | % | 2,519 | |||||||||||||||
| 3 | Albertsons | Safeway, Market Street United, Randalls, Tom Thumb, Jewel-Osco, Vons, United Supermarkets, Shaw's Supermarket, Albertsons | 30 | 2 | 19,361 | 4.1 | % | 1,777 | |||||||||||||||
| 4 | Ahold Delhaize | Martin's, Giant, Stop & Shop, Food Lion, Super Stop & Shop | 23 | — | 17,829 | 3.8 | % | 1,249 | |||||||||||||||
| 5 | Walmart | Walmart Neighborhood Market, Walmart | 13 | — | 8,971 | 1.9 | % | 1,770 | |||||||||||||||
| 6 | Giant Eagle | Giant Eagle | 9 | 1 | 7,384 | 1.6 | % | 759 | |||||||||||||||
| 7 | Sprouts Farmers Market | Sprouts Farmers Market | 14 | — | 6,663 | 1.4 | % | 421 | |||||||||||||||
| 8 | TJX Companies | Sierra Trading Co., HomeGoods, T.J.Maxx, Marshalls | 18 | — | 6,262 | 1.3 | % | 516 | |||||||||||||||
| 9 | Raley's | Raley's | 5 | — | 4,599 | 1.0 | % | 288 | |||||||||||||||
| 10 | Dollar Tree | Dollar Tree, Family Dollar, Dollar Tree Family Dollar | 33 | 4 | 3,859 | 0.7 | % | 369 | |||||||||||||||
| 11 | UNFI (SuperValu) | Cub Foods | 5 | — | 3,476 | 0.7 | % | 336 | |||||||||||||||
| 12 | Starbucks Corporation | Starbucks | 35 | — | 2,983 | 0.5 | % | 64 | |||||||||||||||
| 13 | Trader Joe's | Trader Joe's | 9 | — | 2,727 | 0.5 | % | 122 | |||||||||||||||
| 14 | H-E-B | H-E-B | 2 | — | 2,492 | 0.5 | % | 164 | |||||||||||||||
| 15 | Lowe's | Lowe's | 3 | 1 | 2,469 | 0.5 | % | 369 | |||||||||||||||
| 16 | Subway Group | Subway | 59 | 2 | 2,448 | 0.5 | % | 88 | |||||||||||||||
| 17 | Anytime Fitness, Inc. | Anytime Fitness | 27 | 2 | 2,430 | 0.5 | % | 140 | |||||||||||||||
| 18 | Food 4 Less (PAQ) | Food 4 Less | 2 | — | 2,305 | 0.5 | % | 118 | |||||||||||||||
| 19 | United Parcel Service | The UPS Store, WeShip Store | 57 | 8 | 2,304 | 0.5 | % | 82 | |||||||||||||||
| 20 | H&R Block, Inc. | H&R Block | 54 | 2 | 2,284 | 0.5 | % | 97 | |||||||||||||||
| 21 | Office Depot | Office Depot, OfficeMax | 8 | — | 2,263 | 0.5 | % | 179 | |||||||||||||||
| 22 | Pet Supplies Plus | Pet Supplies Plus | 19 | — | 2,253 | 0.5 | % | 148 | |||||||||||||||
| 23 | Kohl's Corporation | Kohl's | 4 | — | 2,241 | 0.5 | % | 365 | |||||||||||||||
| 24 | Great Clips, Inc. | Great Clips | 63 | 7 | 2,233 | 0.5 | % | 81 | |||||||||||||||
| 25 | Save Mart | Lucky Supermarkets, Save Mart Supermarkets, Food Maxx | 5 | — | 2,194 | 0.5 | % | 258 | |||||||||||||||
| Total | 606 | 44 | $ | 167,059 | 35.1 | % | 15,753 | ||||||||||||||||
| Phillips Edison & Company |
37
|
|||||||
|
Neighbors by Type and Industry(1)(2)
Unaudited
| ||
| Phillips Edison & Company |
38
|
|||||||
|
Properties by State(1)
Dollars and square footage amounts in thousands (excluding per square foot amounts)
| |||||||||||||||||||||||
| State | ABR | % ABR | ABR / Leased SF | GLA | % GLA | % Leased | Number of Properties | ||||||||||||||||
| Florida | $ | 58,036 | 12.2 | % | $ | 14.57 | 4,088 | 12.6 | % | 97.4 | % | 51 | |||||||||||
| California | 51,936 | 10.9 | % | 21.52 | 2,504 | 7.7 | % | 96.4 | % | 26 | |||||||||||||
| Texas | 43,072 | 9.1 | % | 18.21 | 2,474 | 7.6 | % | 95.6 | % | 20 | |||||||||||||
| Georgia | 40,979 | 8.6 | % | 13.75 | 3,028 | 9.3 | % | 98.4 | % | 31 | |||||||||||||
| Illinois | 28,540 | 6.0 | % | 16.71 | 1,804 | 5.6 | % | 94.6 | % | 16 | |||||||||||||
| Ohio | 25,316 | 5.3 | % | 11.04 | 2,336 | 7.2 | % | 98.2 | % | 19 | |||||||||||||
| Colorado | 24,850 | 5.2 | % | 18.41 | 1,408 | 4.3 | % | 95.9 | % | 12 | |||||||||||||
| Virginia | 22,724 | 4.8 | % | 17.15 | 1,359 | 4.2 | % | 97.5 | % | 13 | |||||||||||||
| Minnesota | 19,688 | 4.1 | % | 15.55 | 1,325 | 4.1 | % | 95.5 | % | 13 | |||||||||||||
| Massachusetts | 16,944 | 3.6 | % | 15.22 | 1,146 | 3.5 | % | 97.1 | % | 9 | |||||||||||||
| Nevada | 14,824 | 3.1 | % | 24.30 | 623 | 1.9 | % | 97.9 | % | 5 | |||||||||||||
| Pennsylvania | 12,264 | 2.6 | % | 12.45 | 1,001 | 3.1 | % | 98.4 | % | 6 | |||||||||||||
| Wisconsin | 11,990 | 2.5 | % | 11.47 | 1,057 | 3.3 | % | 98.9 | % | 9 | |||||||||||||
| Arizona | 10,741 | 2.3 | % | 14.81 | 735 | 2.3 | % | 98.6 | % | 6 | |||||||||||||
| South Carolina | 10,086 | 2.1 | % | 11.81 | 863 | 2.7 | % | 99.0 | % | 8 | |||||||||||||
| Maryland | 9,568 | 2.0 | % | 21.01 | 463 | 1.4 | % | 98.4 | % | 4 | |||||||||||||
| North Carolina | 8,409 | 1.8 | % | 12.91 | 658 | 2.0 | % | 99.0 | % | 10 | |||||||||||||
| Tennessee | 8,132 | 1.7 | % | 10.20 | 802 | 2.5 | % | 99.4 | % | 5 | |||||||||||||
| Indiana | 7,261 | 1.5 | % | 8.85 | 832 | 2.6 | % | 98.6 | % | 5 | |||||||||||||
| Kentucky | 6,849 | 1.5 | % | 11.18 | 616 | 1.9 | % | 99.5 | % | 4 | |||||||||||||
| Michigan | 6,772 | 1.4 | % | 9.59 | 724 | 2.2 | % | 97.6 | % | 5 | |||||||||||||
| New Mexico | 6,044 | 1.3 | % | 15.02 | 404 | 1.2 | % | 99.6 | % | 3 | |||||||||||||
| Connecticut | 5,982 | 1.3 | % | 14.35 | 421 | 1.3 | % | 99.0 | % | 4 | |||||||||||||
| Oregon | 4,765 | 1.0 | % | 16.14 | 316 | 1.0 | % | 93.4 | % | 4 | |||||||||||||
| Kansas | 4,684 | 1.0 | % | 12.53 | 374 | 1.2 | % | 100.0 | % | 3 | |||||||||||||
| New Jersey | 4,245 | 0.9 | % | 25.05 | 169 | 0.5 | % | 100.0 | % | 1 | |||||||||||||
| Washington | 2,886 | 0.6 | % | 16.69 | 173 | 0.5 | % | 100.0 | % | 2 | |||||||||||||
| Iowa | 2,822 | 0.6 | % | 8.00 | 360 | 1.1 | % | 98.1 | % | 3 | |||||||||||||
| Missouri | 2,589 | 0.5 | % | 11.89 | 222 | 0.7 | % | 98.2 | % | 2 | |||||||||||||
| New York | 1,823 | 0.4 | % | 11.58 | 163 | 0.5 | % | 96.3 | % | 1 | |||||||||||||
| Utah | 461 | 0.1 | % | 31.70 | 15 | — | % | 100.0 | % | 1 | |||||||||||||
| Total | $ | 475,282 | 100.0 | % | $ | 15.03 | 32,463 | 100.0 | % | 97.4 | % | 301 | |||||||||||
| Phillips Edison & Company |
39
|
|||||||
|
New, Renewal, and Option Lease Summary
Unaudited, dollars and square footage amounts in thousands (excluding per square foot amounts)
| ||||||||||||||||||||||||||||||||||||||||||||||||||||||||
| Comparable Only | ||||||||||||||||||||||||||||||||||||||||||||||||||||||||
| Number of Leases Signed | GLA | ABR | ABR PSF(1) |
Weighted-Average Lease Term (Years) | Cost of TI/TIA PSF(2) |
Number of Leases | Increase in ABR PSF | Rent Spread % | ||||||||||||||||||||||||||||||||||||||||||||||||
TOTAL - NEW, RENEWAL, AND OPTION LEASES |
||||||||||||||||||||||||||||||||||||||||||||||||||||||||
| Q4 2023 | 217 | 1,146 | $ | 19,391 | $ | 16.92 | 5.9 | $ | 7.62 | 174 | $ | 1.77 | 12.4 | % | ||||||||||||||||||||||||||||||||||||||||||
| Q3 2023 | 231 | 939 | 18,333 | 19.52 | 6.3 | 6.76 | 192 | 2.37 | 13.9 | % | ||||||||||||||||||||||||||||||||||||||||||||||
| Q2 2023 | 285 | 1,569 | 24,160 | 15.40 | 5.3 | 4.16 | 224 | 1.54 | 11.5 | % | ||||||||||||||||||||||||||||||||||||||||||||||
| Q1 2023 | 263 | 1,065 | 20,060 | 18.83 | 6.0 | 7.16 | 195 | 1.96 | 12.1 | % | ||||||||||||||||||||||||||||||||||||||||||||||
| Total | 996 | 4,719 | $ | 81,944 | $ | 17.36 | 5.8 | $ | 6.2 | 785 | $ | 1.85 | 12.4 | % | ||||||||||||||||||||||||||||||||||||||||||
NEW LEASES |
||||||||||||||||||||||||||||||||||||||||||||||||||||||||
| Q4 2023 | 74 | 248 | $ | 5,882 | $ | 23.73 | 7.9 | $ | 32.94 | 31 | $ | 5.41 | 21.9 | % | ||||||||||||||||||||||||||||||||||||||||||
| Q3 2023 | 82 | 279 | 5,676 | 20.36 | 10.3 | 21.93 | 43 | 4.32 | 26.3 | % | ||||||||||||||||||||||||||||||||||||||||||||||
| Q2 2023 | 94 | 286 | 5,709 | 19.98 | 6.8 | 21.02 | 33 | 4.71 | 25.1 | % | ||||||||||||||||||||||||||||||||||||||||||||||
| Q1 2023 | 98 | 264 | 6,149 | 23.27 | 9.5 | 27.39 | 30 | 6.36 | 27.4 | % | ||||||||||||||||||||||||||||||||||||||||||||||
| Total | 348 | 1,077 | $ | 23,416 | $ | 21.75 | 8.6 | $ | 25.56 | 137 | $ | 4.94 | 25.2 | % | ||||||||||||||||||||||||||||||||||||||||||
RENEWAL LEASES |
||||||||||||||||||||||||||||||||||||||||||||||||||||||||
| Q4 2023 | 107 | 488 | $ | 8,962 | $ | 18.37 | 5.8 | $ | 1.17 | 107 | $ | 2.28 | 14.2 | % | ||||||||||||||||||||||||||||||||||||||||||
| Q3 2023 | 109 | 266 | 6,878 | 25.87 | 3.9 | 0.88 | 109 | 3.75 | 16.9 | % | ||||||||||||||||||||||||||||||||||||||||||||||
| Q2 2023 | 143 | 382 | 8,824 | 23.12 | 4.5 | 1.35 | 143 | 3.48 | 17.7 | % | ||||||||||||||||||||||||||||||||||||||||||||||
| Q1 2023 | 126 | 303 | 7,387 | 24.40 | 4.8 | 1.30 | 126 | 3.38 | 16.1 | % | ||||||||||||||||||||||||||||||||||||||||||||||
| Total | 485 | 1,439 | $ | 32,051 | $ | 22.28 | 4.9 | $ | 1.19 | 485 | $ | 3.10 | 16.2 | % | ||||||||||||||||||||||||||||||||||||||||||
OPTION LEASES |
||||||||||||||||||||||||||||||||||||||||||||||||||||||||
| Q4 2023 | 36 | 410 | $ | 4,547 | $ | 11.08 | 4.9 | $ | — | 36 | $ | 0.63 | 6.0 | % | ||||||||||||||||||||||||||||||||||||||||||
| Q3 2023 | 40 | 394 | 5,779 | 14.65 | 5.0 | — | 40 | 0.75 | 5.4 | % | ||||||||||||||||||||||||||||||||||||||||||||||
| Q2 2023 | 48 | 901 | 9,627 | 10.69 | 5.2 | — | 48 | 0.43 | 4.2 | % | ||||||||||||||||||||||||||||||||||||||||||||||
| Q1 2023 | 39 | 498 | 6,524 | 13.09 | 5.0 | — | 39 | 0.62 | 5.0 | % | ||||||||||||||||||||||||||||||||||||||||||||||
| Total | 163 | 2,203 | $ | 26,477 | $ | 12.02 | 5.1 | $ | — | 163 | $ | 0.57 | 5.0 | % | ||||||||||||||||||||||||||||||||||||||||||
| Phillips Edison & Company |
40
|
|||||||
|
Lease Expirations(1)
Unaudited, square footage amounts in thousands
| |||||||||||||||||||||||||||||
| Number of Leases | GLA Expiring | % of Leased GLA(2) |
ABR PSF | % of ABR | |||||||||||||||||||||||||
| TOTAL LEASES | |||||||||||||||||||||||||||||
| MTM | 65 | 146 | 0.5 | % | $ | 19.21 | 0.6 | % | |||||||||||||||||||||
| 2024 | 670 | 2,843 | 9.0 | % | 15.09 | 9.0 | % | ||||||||||||||||||||||
| 2025 | 768 | 4,679 | 14.8 | % | 13.80 | 13.6 | % | ||||||||||||||||||||||
| 2026 | 915 | 4,697 | 14.8 | % | 15.44 | 15.3 | % | ||||||||||||||||||||||
| 2027 | 844 | 4,327 | 13.7 | % | 15.04 | 13.7 | % | ||||||||||||||||||||||
| 2028 | 810 | 5,001 | 15.8 | % | 15.24 | 16.0 | % | ||||||||||||||||||||||
| 2029 | 425 | 3,247 | 10.3 | % | 14.09 | 9.6 | % | ||||||||||||||||||||||
| 2030 | 192 | 1,301 | 4.1 | % | 16.57 | 4.5 | % | ||||||||||||||||||||||
| 2031 | 215 | 1,298 | 4.1 | % | 16.89 | 4.6 | % | ||||||||||||||||||||||
| 2032 | 186 | 1,472 | 4.6 | % | 14.13 | 4.4 | % | ||||||||||||||||||||||
| 2033 | 170 | 913 | 2.9 | % | 18.09 | 3.5 | % | ||||||||||||||||||||||
| 2034 + | 166 | 1,709 | 5.4 | % | 14.43 | 5.2 | % | ||||||||||||||||||||||
| Total leases | 5,426 | 31,633 | 100.0 | % | $ | 15.03 | 100.0 | % | |||||||||||||||||||||
| ANCHOR LEASES | |||||||||||||||||||||||||||||
| MTM | 2 | 29 | 0.1 | % | $ | 11.39 | 0.1 | % | |||||||||||||||||||||
| 2024 | 47 | 1,527 | 4.8 | % | 9.24 | 3.0 | % | ||||||||||||||||||||||
| 2025 | 83 | 3,325 | 10.5 | % | 9.68 | 6.8 | % | ||||||||||||||||||||||
| 2026 | 77 | 2,937 | 9.3 | % | 10.14 | 6.3 | % | ||||||||||||||||||||||
| 2027 | 80 | 2,698 | 8.5 | % | 9.39 | 5.3 | % | ||||||||||||||||||||||
| 2028 | 82 | 3,414 | 10.8 | % | 10.17 | 7.3 | % | ||||||||||||||||||||||
| 2029 | 63 | 2,371 | 7.5 | % | 10.28 | 5.1 | % | ||||||||||||||||||||||
| 2030 | 22 | 879 | 2.8 | % | 12.56 | 2.3 | % | ||||||||||||||||||||||
| 2031 | 28 | 794 | 2.5 | % | 11.72 | 2.0 | % | ||||||||||||||||||||||
| 2032 | 25 | 1,023 | 3.2 | % | 8.92 | 1.9 | % | ||||||||||||||||||||||
| 2033 | 16 | 540 | 1.7 | % | 11.69 | 1.3 | % | ||||||||||||||||||||||
| 2034 + | 39 | 1,417 | 4.5 | % | 10.87 | 3.2 | % | ||||||||||||||||||||||
| Anchor leases | 564 | 20,954 | 66.2 | % | $ | 10.12 | 44.6 | % | |||||||||||||||||||||
| INLINE LEASES | |||||||||||||||||||||||||||||
| MTM | 63 | 117 | 0.4 | % | $ | 21.18 | 0.5 | % | |||||||||||||||||||||
| 2024 | 623 | 1,316 | 4.2 | % | 21.88 | 6.0 | % | ||||||||||||||||||||||
| 2025 | 685 | 1,354 | 4.3 | % | 23.91 | 6.8 | % | ||||||||||||||||||||||
| 2026 | 838 | 1,760 | 5.5 | % | 24.28 | 9.0 | % | ||||||||||||||||||||||
| 2027 | 764 | 1,629 | 5.2 | % | 24.40 | 8.4 | % | ||||||||||||||||||||||
| 2028 | 728 | 1,587 | 5.0 | % | 26.16 | 8.7 | % | ||||||||||||||||||||||
| 2029 | 362 | 876 | 2.8 | % | 24.39 | 4.5 | % | ||||||||||||||||||||||
| 2030 | 170 | 422 | 1.3 | % | 24.92 | 2.2 | % | ||||||||||||||||||||||
| 2031 | 187 | 504 | 1.6 | % | 25.02 | 2.6 | % | ||||||||||||||||||||||
| 2032 | 161 | 449 | 1.4 | % | 26.02 | 2.5 | % | ||||||||||||||||||||||
| 2033 | 154 | 373 | 1.2 | % | 27.36 | 2.2 | % | ||||||||||||||||||||||
| 2034 + | 127 | 292 | 0.9 | % | 31.71 | 2.0 | % | ||||||||||||||||||||||
| Inline leases | 4,862 | 10,679 | 33.8 | % | $ | 24.65 | 55.4 | % | |||||||||||||||||||||
| Phillips Edison & Company |
41
|
|||||||
|
Property List
Unaudited, dollars in thousands (excluding per square foot amounts; statistics for properties owned through our unconsolidated joint venture have not been prorated)
| |||||||||||||||||||||||||||||||||||||||||
| Property Name | Location | Ownership Percentage | CBSA | Year Constructed/ Renovated | GLA | % Leased | ABR | ABR PSF | Grocery Anchor | Additional Anchors | |||||||||||||||||||||||||||||||
| 51st & Olive Square | Glendale, AZ | 100 % | Phoenix-Mesa-Chandler, AZ | 1975 / 2007 | 88,225 | 100.0 | % | $ | 960 | $ | 10.88 | Fry's Food Stores | N/A | ||||||||||||||||||||||||||||
| Alameda Crossing | Avondale, AZ | 100 % | Phoenix-Mesa-Chandler, AZ | 2006 / 2021 | 141,721 | 100.0 | % | $ | 2,652 | $ | 18.71 | Sprouts Farmers Market | JOANN; Uptown Jungle; Big 5 Sporting Goods | ||||||||||||||||||||||||||||
| Arcadia Plaza | Phoenix, AZ | 100 % | Phoenix-Mesa-Chandler, AZ | 1980 / 2018 | 63,637 | 100.0 | % | $ | 1,491 | $ | 23.43 | Sprouts Farmers Market | N/A | ||||||||||||||||||||||||||||
| Broadway Plaza | Tucson, AZ | 100 % | Tucson, AZ | 1982 / 2003 | 84,298 | 97.3 | % | $ | 1,461 | $ | 17.82 | Sprouts Farmers Market | N/A | ||||||||||||||||||||||||||||
| Southern Palms | Tempe, AZ | 100 % | Phoenix-Mesa-Chandler, AZ | 1982 / 2018 | 257,123 | 97.8 | % | $ | 3,290 | $ | 13.08 | Sprouts Farmers Market | Goodwill; Southwest Institute of Healing Arts; Habitat for Humanity ReStore; Planet Fitness; AutoZone | ||||||||||||||||||||||||||||
| Sunburst Plaza | Glendale, AZ | 100 % | Phoenix-Mesa-Chandler, AZ | 1970 / 2022 | 100,437 | 98.0 | % | $ | 887 | $ | 9.01 | Fry's Food Stores | Daiso Japan | ||||||||||||||||||||||||||||
| Atwater Marketplace | Atwater, CA | 100 % | N/A | 2023 | 2,082 | 100.0 | % | $ | 138 | $ | 66.28 | N/A | N/A | ||||||||||||||||||||||||||||
| Boronda Plaza | Salinas, CA | 100 % | Salinas, CA | 2003 / 2021 | 93,071 | 96.6 | % | $ | 2,248 | $ | 25.01 | Food 4 Less | N/A | ||||||||||||||||||||||||||||
| Broadway Pavilion | Santa Maria, CA | 100 % | Santa Maria-Santa Barbara, CA | 1987 | 142,944 | 89.2 | % | $ | 2,060 | $ | 16.16 | Food Maxx | Idler's Home | ||||||||||||||||||||||||||||
| Central Valley Marketplace | Ceres, CA | 100 % | Modesto, CA | 2005 | 81,897 | 100.0 | % | $ | 1,844 | $ | 22.52 | Food 4 Less | N/A | ||||||||||||||||||||||||||||
| Commonwealth Square | Folsom, CA | 100 % | Sacramento-Roseville-Folsom, CA | 1987 | 141,310 | 99.3 | % | $ | 2,269 | $ | 16.17 | Raley's | N/A | ||||||||||||||||||||||||||||
| Contra Loma Plaza | Antioch, CA | 100 % | San Francisco-Oakland-Berkeley, CA | 1989 / 2022 | 74,616 | 96.1 | % | $ | 886 | $ | 12.35 | Lucky Supermarkets | N/A | ||||||||||||||||||||||||||||
| Del Paso Marketplace | Sacramento, CA | 100 % | Sacramento-Roseville-Folsom, CA | 2006 / 2016 | 59,796 | 100.0 | % | $ | 1,634 | $ | 27.33 | Sprouts Farmers Market | N/A | ||||||||||||||||||||||||||||
| Driftwood Village | Ontario, CA | 100 % | Riverside-San Bernardino-Ontario, CA | 1985 | 95,421 | 98.2 | % | $ | 1,843 | $ | 19.67 | Food 4 Less | N/A | ||||||||||||||||||||||||||||
| Herndon Place | Fresno, CA | 100 % | Fresno, CA | 2005 | 95,370 | 96.5 | % | $ | 1,563 | $ | 16.99 | Save Mart Supermarkets | N/A | ||||||||||||||||||||||||||||
| Laguna 99 Plaza | Elk Grove, CA | 100 % | Sacramento-Roseville-Folsom, CA | 1992 / 2015 | 89,188 | 100.0 | % | $ | 1,908 | $ | 21.39 | Walmart Neighborhood Market | California Backyard | ||||||||||||||||||||||||||||
| North Point Landing | Modesto, CA | 100 % | Modesto, CA | 1964 / 2008 | 152,769 | 96.5 | % | $ | 2,325 | $ | 15.77 | Walmart | N/A | ||||||||||||||||||||||||||||
| Quail Pointe | Fair Oaks, CA | 100 % | Sacramento-Roseville-Folsom, CA | 1987 | 98,366 | 93.8 | % | $ | 2,894 | $ | 31.38 | Trader Joe's | Lamps Plus | ||||||||||||||||||||||||||||
| Quartz Hill Towne Centre | Lancaster, CA | 100 % | Los Angeles-Long Beach-Anaheim, CA | 1991 / 2012 | 110,306 | 100.0 | % | $ | 1,936 | $ | 17.55 | Vons | CVS | ||||||||||||||||||||||||||||
| Red Maple Village | Tracy, CA | 100 % | Stockton, CA | 2009 | 97,591 | 100.0 | % | $ | 2,618 | $ | 26.83 | Raley's | N/A | ||||||||||||||||||||||||||||
| Riverlakes Village | Bakersfield, CA | 100 % | Bakersfield, CA | 1997 / 2022 | 94,012 | 98.6 | % | $ | 1,998 | $ | 21.55 | Vons | N/A | ||||||||||||||||||||||||||||
| Phillips Edison & Company |
42
|
|||||||
|
Property List
Unaudited, dollars in thousands (excluding per square foot amounts; statistics for properties owned through our unconsolidated joint venture have not been prorated)
| |||||||||||||||||||||||||||||||||||||||||
| Property Name | Location | Ownership Percentage | CBSA | Year Constructed/ Renovated | GLA | % Leased | ABR | ABR PSF | Grocery Anchor | Additional Anchors | |||||||||||||||||||||||||||||||
| Rocky Ridge Town Center | Roseville, CA | 100 % | Sacramento-Roseville-Folsom, CA | 1996 / 2015 | 93,337 | 100.0 | % | $ | 2,873 | $ | 30.78 | Sprouts Farmers Market | BevMo! | ||||||||||||||||||||||||||||
| Shasta Crossroads | Redding, CA | 100 % | Redding, CA | 1989 / 2016 | 114,565 | 89.6 | % | $ | 2,100 | $ | 20.45 | Food Maxx | N/A | ||||||||||||||||||||||||||||
| Sierra Del Oro Towne Centre | Corona, CA | 100 % | Riverside-San Bernardino-Ontario, CA | 1991 / 2017 | 110,627 | 100.0 | % | $ | 2,265 | $ | 20.47 | Ralphs | Dollar Tree | ||||||||||||||||||||||||||||
| Sierra Vista Plaza | Murrieta, CA | 100 % | Riverside-San Bernardino-Ontario, CA | 1991 / 2021 | 80,259 | 93.5 | % | $ | 1,972 | $ | 26.28 | Stater Bros Markets (shadow) | CVS | ||||||||||||||||||||||||||||
| Sterling Pointe Center | Lincoln, CA | 100 % | Sacramento-Roseville-Folsom, CA | 2004 / 2017 | 136,020 | 100.0 | % | $ | 3,058 | $ | 22.48 | Raley's | N/A | ||||||||||||||||||||||||||||
| Sunridge Plaza | Rancho Cordova, CA | 100 % | Sacramento-Roseville-Folsom, CA | 2017 | 87,815 | 93.0 | % | $ | 2,624 | $ | 32.12 | Raley's | N/A | ||||||||||||||||||||||||||||
| Town & Country Village | Sacramento, CA | 100 % | Sacramento-Roseville-Folsom, CA | 1950 / 2022 | 215,192 | 87.2 | % | $ | 3,726 | $ | 19.86 | Sprouts Farmers Market; Trader Joe's | Ross Dress for Less; T.J.Maxx; Royal Flooring; Ulta | ||||||||||||||||||||||||||||
| Village One Plaza | Modesto, CA | 100 % | Modesto, CA | 2007 | 105,658 | 100.0 | % | $ | 2,529 | $ | 23.94 | Raley's | N/A | ||||||||||||||||||||||||||||
| Vineyard Center | Templeton, CA | 100 % | San Luis Obispo-Paso Robles, CA | 2007 | 21,117 | 100.0 | % | $ | 682 | $ | 32.30 | Trader Joe's | N/A | ||||||||||||||||||||||||||||
| West Acres Shopping Center | Fresno, CA | 100 % | Fresno, CA | 1990 / 2015 | 83,414 | 100.0 | % | $ | 949 | $ | 11.38 | Food Maxx | N/A | ||||||||||||||||||||||||||||
| Windmill Marketplace | Clovis, CA | 100 % | Fresno, CA | 2001 | 27,486 | 100.0 | % | $ | 994 | $ | 36.16 | Save Mart (shadow) | N/A | ||||||||||||||||||||||||||||
| Arapahoe Marketplace | Greenwood Village, CO | 100 % | Denver-Aurora-Lakewood, CO | 1977 / 2022 | 191,761 | 85.3 | % | $ | 4,070 | $ | 24.88 | Sprouts Farmers Market | The Tile Shop; Molly's Spirits; Office Depot | ||||||||||||||||||||||||||||
| Broadlands Marketplace | Broomfield, CO | 100 % | Denver-Aurora-Lakewood, CO | 2002 | 103,883 | 100.0 | % | $ | 1,427 | $ | 13.74 | Safeway | N/A | ||||||||||||||||||||||||||||
| Fairfield Commons | Lakewood, CO | 100 % | Denver-Aurora-Lakewood, CO | 1985 / 2014 | 143,276 | 98.0 | % | $ | 2,738 | $ | 19.49 | Sprouts Farmers Market | T.J.Maxx; Planet Fitness; Aaron's | ||||||||||||||||||||||||||||
| Foxridge Plaza | Centennial, CO | 100 % | Denver-Aurora-Lakewood, CO | 1983 / 2022 | 53,970 | 96.6 | % | $ | 1,301 | $ | 24.95 | Kings Soopers (shadow) | N/A | ||||||||||||||||||||||||||||
| Golden Town Center | Golden, CO | 100 % | Denver-Aurora-Lakewood, CO | 1993 / 2003 | 117,882 | 97.0 | % | $ | 1,787 | $ | 15.62 | King Soopers | N/A | ||||||||||||||||||||||||||||
| Kipling Marketplace | Littleton, CO | 100 % | Denver-Aurora-Lakewood, CO | 1983 / 2009 | 90,124 | 100.0 | % | $ | 1,358 | $ | 15.07 | Safeway | N/A | ||||||||||||||||||||||||||||
| Meadows on the Parkway | Boulder, CO | 100 % | Boulder, CO | 1989 | 212,985 | 90.4 | % | $ | 3,665 | $ | 19.03 | Safeway | Walgreens; Dollar Tree; Regus | ||||||||||||||||||||||||||||
| Nor'Wood Shopping Center | Colorado Springs, CO | 100 % | Colorado Springs, CO | 2003 / 2007 | 73,082 | 100.0 | % | $ | 1,149 | $ | 15.72 | Safeway | N/A | ||||||||||||||||||||||||||||
| Roxborough Marketplace | Littleton, CO | 100 % | Denver-Aurora-Lakewood, CO | 2005 / 2021 | 101,622 | 100.0 | % | $ | 1,578 | $ | 15.53 | Safeway | N/A | ||||||||||||||||||||||||||||
| Thompson Valley Towne Center | Loveland, CO | 100 % | Fort Collins, CO | 1999 | 125,122 | 98.9 | % | $ | 2,306 | $ | 18.64 | King Soopers | Thompson Valley Liquor | ||||||||||||||||||||||||||||
| Westwoods Shopping Center | Arvada, CO | 100 % | Denver-Aurora-Lakewood, CO | 2003 / 2011 | 90,855 | 100.0 | % | $ | 1,441 | $ | 15.86 | King Soopers | N/A | ||||||||||||||||||||||||||||
| Wheat Ridge Marketplace | Wheat Ridge, CO | 100 % | Denver-Aurora-Lakewood, CO | 1996 / 2019 | 103,438 | 100.0 | % | $ | 2,030 | $ | 19.63 | Safeway | N/A | ||||||||||||||||||||||||||||
| Everybody's Plaza | Cheshire, CT | 100 % | New Haven-Milford, CT | 1960 / 2014 | 49,975 | 100.0 | % | $ | 963 | $ | 19.27 | Big Y | N/A | ||||||||||||||||||||||||||||
| Phillips Edison & Company |
43
|
|||||||
|
Property List
Unaudited, dollars in thousands (excluding per square foot amounts; statistics for properties owned through our unconsolidated joint venture have not been prorated)
| |||||||||||||||||||||||||||||||||||||||||
| Property Name | Location | Ownership Percentage | CBSA | Year Constructed/ Renovated | GLA | % Leased | ABR | ABR PSF | Grocery Anchor | Additional Anchors | |||||||||||||||||||||||||||||||
| Montville Commons | Montville, CT | 100 % | Norwich-New London, CT | 2007 | 116,916 | 96.6 | % | $ | 1,796 | $ | 15.91 | Stop & Shop | N/A | ||||||||||||||||||||||||||||
| Stop & Shop Plaza | Enfield, CT | 100 % | Hartford-East Hartford-Middletown, CT | 1988 / 1998 | 124,218 | 100.0 | % | $ | 2,082 | $ | 16.76 | Stop & Shop | N/A | ||||||||||||||||||||||||||||
| Willimantic Plaza | Willimantic, CT | 100 % | Worcester, MA-CT | 1968 / 2024 | 129,781 | 100.0 | % | $ | 1,141 | $ | 8.79 | BJ's Wholesale Club | N/A | ||||||||||||||||||||||||||||
| Alico Commons | Fort Myers, FL | 100 % | Cape Coral-Fort Myers, FL | 2009 / 2020 | 100,734 | 98.7 | % | $ | 1,769 | $ | 17.79 | Publix | Non Stop Fitness | ||||||||||||||||||||||||||||
| Bloomingdale Hills | Riverview, FL | 100 % | Tampa-St. Petersburg-Clearwater, FL | 2002 / 2012 | 78,442 | 100.0 | % | $ | 796 | $ | 10.15 | Walmart Neighborhood Market | N/A | ||||||||||||||||||||||||||||
| Breakfast Point Marketplace | Panama City Beach, FL | 100 % | Panama City, FL | 2009 / 2010 | 97,938 | 100.0 | % | $ | 1,516 | $ | 15.48 | Publix | Office Depot | ||||||||||||||||||||||||||||
| Broadway Promenade | Sarasota, FL | 100 % | North Port-Sarasota-Bradenton, FL | 2007 | 49,271 | 94.8 | % | $ | 922 | $ | 19.75 | Publix | N/A | ||||||||||||||||||||||||||||
| ChampionsGate Village | Davenport, FL | 100 % | Orlando-Kissimmee-Sanford, FL | 2001 | 62,699 | 100.0 | % | $ | 1,019 | $ | 16.25 | Publix | N/A | ||||||||||||||||||||||||||||
| Cocoa Commons | Cocoa, FL | 100 % | Palm Bay-Melbourne-Titusville, FL | 1986 / 2000 | 90,116 | 98.7 | % | $ | 1,221 | $ | 13.73 | Publix | N/A | ||||||||||||||||||||||||||||
| Colonial Promenade | Winter Haven, FL | 100 % | Lakeland-Winter Haven, FL | 1986 / 2008 | 280,228 | 98.5 | % | $ | 2,518 | $ | 9.12 | Walmart | N/A | ||||||||||||||||||||||||||||
| Coquina Plaza | Southwest Ranches, FL | 100 % | Miami-Fort Lauderdale-Pompano Beach, FL | 1998 | 91,120 | 98.8 | % | $ | 1,914 | $ | 21.25 | Publix | N/A | ||||||||||||||||||||||||||||
| Crosscreek Village | St. Cloud, FL | 100 % | Orlando-Kissimmee-Sanford, FL | 2008 | 69,660 | 100.0 | % | $ | 1,149 | $ | 16.49 | Publix | N/A | ||||||||||||||||||||||||||||
| Crystal Beach Plaza | Palm Harbor, FL | 100 % | Tampa-St. Petersburg-Clearwater, FL | 2010 | 59,015 | 100.0 | % | $ | 1,097 | $ | 18.59 | Publix | N/A | ||||||||||||||||||||||||||||
| Deerwood Lake Commons | Jacksonville, FL | 14 % | Jacksonville, FL | 2003 | 67,528 | 100.0 | % | $ | 1,239 | $ | 18.35 | Publix | N/A | ||||||||||||||||||||||||||||
| French Golden Gate | Bartow, FL | 100 % | Lakeland-Winter Haven, FL | 1960 / 2011 | 140,276 | 100.0 | % | $ | 1,895 | $ | 13.51 | Publix | Bealls Outlet; Walgreens | ||||||||||||||||||||||||||||
| Golden Eagle Village | Clermont, FL | 100 % | Orlando-Kissimmee-Sanford, FL | 2011 | 64,051 | 97.6 | % | $ | 1,033 | $ | 16.52 | Publix | N/A | ||||||||||||||||||||||||||||
| Goolsby Pointe | Riverview, FL | 14 % | Tampa-St. Petersburg-Clearwater, FL | 2000 | 75,525 | 100.0 | % | $ | 1,217 | $ | 16.11 | Publix | N/A | ||||||||||||||||||||||||||||
| Harbour Village | Jacksonville, FL | 100 % | Jacksonville, FL | 2006 / 2021 | 113,069 | 100.0 | % | $ | 2,118 | $ | 18.73 | The Fresh Market | Crunch Fitness; Lionshare Cowork | ||||||||||||||||||||||||||||
| Heath Brook Commons | Ocala, FL | 100 % | Ocala, FL | 2002 | 79,590 | 100.0 | % | $ | 1,089 | $ | 13.68 | Publix | N/A | ||||||||||||||||||||||||||||
| Heron Creek Towne Center | North Port, FL | 100 % | North Port-Sarasota-Bradenton, FL | 2001 | 64,664 | 100.0 | % | $ | 911 | $ | 14.09 | Publix | N/A | ||||||||||||||||||||||||||||
| Phillips Edison & Company |
44
|
|||||||
|
Property List
Unaudited, dollars in thousands (excluding per square foot amounts; statistics for properties owned through our unconsolidated joint venture have not been prorated)
| |||||||||||||||||||||||||||||||||||||||||
| Property Name | Location | Ownership Percentage | CBSA | Year Constructed/ Renovated | GLA | % Leased | ABR | ABR PSF | Grocery Anchor | Additional Anchors | |||||||||||||||||||||||||||||||
| Island Walk Shopping Center | Fernandina Beach, FL | 100 % | Jacksonville, FL | 1987 / 2012 | 213,656 | 98.1 | % | $ | 2,199 | $ | 10.49 | Publix | Bealls; Bealls Outlet/Home Centric; Gretchen's Hallmark Shop; Staples | ||||||||||||||||||||||||||||
| Kings Crossing | Sun City Center, FL | 100 % | Tampa-St. Petersburg-Clearwater, FL | 2000 / 2018 | 75,020 | 100.0 | % | $ | 1,288 | $ | 17.17 | Publix | N/A | ||||||||||||||||||||||||||||
| Lake Washington Crossing | Melbourne, FL | 100 % | Palm Bay-Melbourne-Titusville, FL | 1987 / 2023 | 122,912 | 93.9 | % | $ | 2,139 | $ | 18.53 | Publix | BPC Plasma | ||||||||||||||||||||||||||||
| Lakewood Plaza | Spring Hill, FL | 14 % | Tampa-St. Petersburg-Clearwater, FL | 1993 / 1997 | 106,999 | 100.0 | % | $ | 1,562 | $ | 14.60 | Publix | JOANN | ||||||||||||||||||||||||||||
| Lutz Lake Crossing | Lutz, FL | 100 % | Tampa-St. Petersburg-Clearwater, FL | 2002 | 64,986 | 100.0 | % | $ | 987 | $ | 15.19 | Publix | N/A | ||||||||||||||||||||||||||||
| MetroWest Village | Orlando, FL | 100 % | Orlando-Kissimmee-Sanford, FL | 1990 | 106,857 | 93.4 | % | $ | 1,720 | $ | 17.23 | Publix | N/A | ||||||||||||||||||||||||||||
| Oakhurst Plaza | Seminole, FL | 100 % | Tampa-St. Petersburg-Clearwater, FL | 1974 / 2001 | 51,502 | 94.8 | % | $ | 618 | $ | 12.66 | Publix | N/A | ||||||||||||||||||||||||||||
| Ocean Breeze Plaza | Ocean Breeze, FL | 100 % | Port St. Lucie, FL | 1993 / 2010 | 96,192 | 86.6 | % | $ | 1,544 | $ | 18.53 | Publix | N/A | ||||||||||||||||||||||||||||
| Orange Grove Shopping Center | North Fort Myers, FL | 100 % | Cape Coral-Fort Myers, FL | 1999 | 68,865 | 100.0 | % | $ | 873 | $ | 12.68 | Publix | N/A | ||||||||||||||||||||||||||||
| Ormond Beach Mall | Ormond Beach, FL | 100 % | Deltona-Daytona Beach-Ormond Beach, FL | 1967 / 2018 | 101,552 | 97.4 | % | $ | 1,325 | $ | 13.39 | Publix | Bealls Outlet; Dollar Floor; Dollar Tree | ||||||||||||||||||||||||||||
| Park Place Plaza | Port Orange, FL | 100 % | Deltona-Daytona Beach-Ormond Beach, FL | 1984 / 2012 | 87,056 | 93.6 | % | $ | 1,032 | $ | 12.66 | N/A | Bealls | ||||||||||||||||||||||||||||
| Parsons Village | Seffner, FL | 100 % | Tampa-St. Petersburg-Clearwater, FL | 1983 / 1994 | 78,041 | 100.0 | % | $ | 1,038 | $ | 13.30 | Winn-Dixie (shadow) | City Buffet; Family Dollar | ||||||||||||||||||||||||||||
| Publix at Northridge | Sarasota, FL | 14 % | North Port-Sarasota-Bradenton, FL | 2003 | 65,320 | 100.0 | % | $ | 1,278 | $ | 19.57 | Publix | N/A | ||||||||||||||||||||||||||||
| Publix at Seven Hills | Spring Hill, FL | 100 % | Tampa-St. Petersburg-Clearwater, FL | 1991 / 2006 | 72,590 | 100.0 | % | $ | 975 | $ | 13.43 | Publix | N/A | ||||||||||||||||||||||||||||
| Publix at St. Cloud | St. Cloud, FL | 14 % | Orlando-Kissimmee-Sanford, FL | 2003 | 78,779 | 100.0 | % | $ | 1,267 | $ | 16.08 | Publix | N/A | ||||||||||||||||||||||||||||
| Rockledge Square | Rockledge, FL | 100 % | Palm Bay-Melbourne-Titusville, FL | 1985 / 2022 | 78,879 | 100.0 | % | $ | 1,319 | $ | 16.72 | Publix | Health First Medical Group | ||||||||||||||||||||||||||||
| Sanibel Beach Place | Fort Myers, FL | 100 % | Cape Coral-Fort Myers, FL | 2003 / 2022 | 74,286 | 94.5 | % | $ | 985 | $ | 14.04 | Publix | N/A | ||||||||||||||||||||||||||||
| Shoppes at Avalon | Spring Hill, FL | 100 % | Tampa-St. Petersburg-Clearwater, FL | 2009 / 2022 | 62,786 | 100.0 | % | $ | 1,008 | $ | 16.05 | Publix | N/A | ||||||||||||||||||||||||||||
| Phillips Edison & Company |
45
|
|||||||
|
Property List
Unaudited, dollars in thousands (excluding per square foot amounts; statistics for properties owned through our unconsolidated joint venture have not been prorated)
| |||||||||||||||||||||||||||||||||||||||||
| Property Name | Location | Ownership Percentage | CBSA | Year Constructed/ Renovated | GLA | % Leased | ABR | ABR PSF | Grocery Anchor | Additional Anchors | |||||||||||||||||||||||||||||||
| Shoppes at Glen Lakes | Weeki Wachee, FL | 100 % | Tampa-St. Petersburg-Clearwater, FL | 2008 | 66,601 | 100.0 | % | $ | 986 | $ | 14.80 | Publix | N/A | ||||||||||||||||||||||||||||
| Shoppes of Lake Village | Leesburg, FL | 100 % | Orlando-Kissimmee-Sanford, FL | 1987 / 2021 | 132,927 | 93.5 | % | $ | 1,956 | $ | 15.74 | Publix | Sproutfitters | ||||||||||||||||||||||||||||
| Shoppes of Paradise Lakes | Miami, FL | 100 % | Miami-Fort Lauderdale-Pompano Beach, FL | 1999 | 83,597 | 94.3 | % | $ | 1,302 | $ | 16.52 | Publix | N/A | ||||||||||||||||||||||||||||
| Shops at Sunset Lakes | Miramar, FL | 100 % | Miami-Fort Lauderdale-Pompano Beach, FL | 1999 | 70,274 | 100.0 | % | $ | 1,096 | $ | 15.60 | Publix | N/A | ||||||||||||||||||||||||||||
| South Oaks Shopping Center | Live Oak, FL | 100 % | N/A | 1976 / 2022 | 102,816 | 91.9 | % | $ | 680 | $ | 7.20 | N/A | Big Lots; Bealls Outlet; Farmers Home Furniture | ||||||||||||||||||||||||||||
| St. Charles Plaza | Davenport, FL | 100 % | Lakeland-Winter Haven, FL | 2007 | 65,000 | 100.0 | % | $ | 1,103 | $ | 16.97 | Publix | N/A | ||||||||||||||||||||||||||||
| St. Johns Plaza | Titusville, FL | 14 % | Palm Bay-Melbourne-Titusville, FL | 1985 / 2023 | 119,489 | 91.1 | % | $ | 1,292 | $ | 11.87 | Publix | Bealls Outlet; Dollar Tree | ||||||||||||||||||||||||||||
| The Oaks | Hudson, FL | 100 % | Tampa-St. Petersburg-Clearwater, FL | 1981 / 2022 | 176,494 | 96.0 | % | $ | 1,733 | $ | 10.23 | Save-A-Lot | EoS Fitness; Bealls; Ross Dress for Less; Five Below; Dollar Tree | ||||||||||||||||||||||||||||
| Town Center at Jensen Beach | Jensen Beach, FL | 100 % | Port St. Lucie, FL | 2000 | 109,326 | 90.0 | % | $ | 1,386 | $ | 14.08 | Publix | Party City | ||||||||||||||||||||||||||||
| Towne Centre at Wesley Chapel | Wesley Chapel, FL | 100 % | Tampa-St. Petersburg-Clearwater, FL | 2000 | 69,425 | 100.0 | % | $ | 1,019 | $ | 14.68 | Winn-Dixie | N/A | ||||||||||||||||||||||||||||
| Valrico Commons | Valrico, FL | 100 % | Tampa-St. Petersburg-Clearwater, FL | 1986 / 2021 | 137,316 | 100.0 | % | $ | 2,245 | $ | 16.35 | Publix | Ross Dress for Less; Five Below | ||||||||||||||||||||||||||||
| Vineyard Shopping Center | Tallahassee, FL | 100 % | Tallahassee, FL | 2002 | 62,821 | 100.0 | % | $ | 775 | $ | 12.34 | Publix | N/A | ||||||||||||||||||||||||||||
| West Creek Commons | Coconut Creek, FL | 14 % | Miami-Fort Lauderdale-Pompano Beach, FL | 2003 | 58,537 | 95.8 | % | $ | 861 | $ | 15.35 | Publix | N/A | ||||||||||||||||||||||||||||
| West Creek Plaza | Coconut Creek, FL | 100 % | Miami-Fort Lauderdale-Pompano Beach, FL | 2006 / 2013 | 37,616 | 90.1 | % | $ | 982 | $ | 28.98 | Publix (shadow) | N/A | ||||||||||||||||||||||||||||
| Windover Square | Melbourne, FL | 100 % | Palm Bay-Melbourne-Titusville, FL | 1984 / 2010 | 81,516 | 97.9 | % | $ | 1,242 | $ | 15.56 | Publix | Dollar Tree | ||||||||||||||||||||||||||||
| Winter Springs Town Center | Winter Springs, FL | 14 % | Orlando-Kissimmee-Sanford, FL | 2002 | 117,970 | 98.2 | % | $ | 2,087 | $ | 18.02 | Publix | The Zoo Health Club | ||||||||||||||||||||||||||||
| Bartow Marketplace | Cartersville, GA | 100 % | Atlanta-Sandy Springs-Alpharetta, GA | 1995 | 375,067 | 100.0 | % | $ | 2,807 | $ | 7.48 | Walmart | Lowe's | ||||||||||||||||||||||||||||
| Phillips Edison & Company |
46
|
|||||||
|
Property List
Unaudited, dollars in thousands (excluding per square foot amounts; statistics for properties owned through our unconsolidated joint venture have not been prorated)
| |||||||||||||||||||||||||||||||||||||||||
| Property Name | Location | Ownership Percentage | CBSA | Year Constructed/ Renovated | GLA | % Leased | ABR | ABR PSF | Grocery Anchor | Additional Anchors | |||||||||||||||||||||||||||||||
| Bethany Village | Alpharetta, GA | 100 % | Atlanta-Sandy Springs-Alpharetta, GA | 2001 | 81,674 | 100.0 | % | $ | 1,206 | $ | 14.77 | Publix | N/A | ||||||||||||||||||||||||||||
| Butler Creek | Acworth, GA | 100 % | Atlanta-Sandy Springs-Alpharetta, GA | 1989 / 2021 | 101,597 | 100.0 | % | $ | 1,539 | $ | 15.15 | Kroger | N/A | ||||||||||||||||||||||||||||
| Dean Taylor Crossing | Suwanee, GA | 14 % | Atlanta-Sandy Springs-Alpharetta, GA | 2000 | 92,318 | 100.0 | % | $ | 1,285 | $ | 13.92 | Kroger | N/A | ||||||||||||||||||||||||||||
| Evans Towne Centre | Evans, GA | 100 % | Augusta-Richmond County, GA-SC | 1995 / 2017 | 75,668 | 100.0 | % | $ | 1,088 | $ | 14.38 | Publix | N/A | ||||||||||||||||||||||||||||
| Everson Pointe | Snellville, GA | 100 % | Atlanta-Sandy Springs-Alpharetta, GA | 1999 | 81,428 | 100.0 | % | $ | 1,126 | $ | 13.83 | Kroger | N/A | ||||||||||||||||||||||||||||
| Fairview Oaks | Ellenwood, GA | 100 % | Atlanta-Sandy Springs-Alpharetta, GA | 1996 | 77,052 | 100.0 | % | $ | 1,055 | $ | 13.69 | Kroger | N/A | ||||||||||||||||||||||||||||
| Flynn Crossing | Alpharetta, GA | 14 % | Atlanta-Sandy Springs-Alpharetta, GA | 2004 | 95,002 | 100.0 | % | $ | 1,902 | $ | 20.02 | Publix | N/A | ||||||||||||||||||||||||||||
| Grassland Crossing | Alpharetta, GA | 100 % | Atlanta-Sandy Springs-Alpharetta, GA | 1996 | 90,906 | 96.8 | % | $ | 959 | $ | 10.89 | Kroger | N/A | ||||||||||||||||||||||||||||
| Grayson Village | Loganville, GA | 100 % | Atlanta-Sandy Springs-Alpharetta, GA | 2002 / 2019 | 87,155 | 96.3 | % | $ | 1,258 | $ | 14.99 | Publix | N/A | ||||||||||||||||||||||||||||
| Hamilton Mill Village | Dacula, GA | 100 % | Atlanta-Sandy Springs-Alpharetta, GA | 1996 / 2016 | 88,710 | 100.0 | % | $ | 1,381 | $ | 15.57 | Publix | N/A | ||||||||||||||||||||||||||||
| Hamilton Ridge | Buford, GA | 100 % | Atlanta-Sandy Springs-Alpharetta, GA | 2002 | 90,996 | 93.8 | % | $ | 1,193 | $ | 13.97 | Kroger | N/A | ||||||||||||||||||||||||||||
| Hickory Flat Commons | Canton, GA | 100 % | Atlanta-Sandy Springs-Alpharetta, GA | 2008 / 2020 | 113,995 | 100.0 | % | $ | 1,564 | $ | 13.72 | Kroger | N/A | ||||||||||||||||||||||||||||
| Loganville Town Center | Loganville, GA | 100 % | Atlanta-Sandy Springs-Alpharetta, GA | 1997 / 2023 | 85,078 | 100.0 | % | $ | 1,371 | $ | 16.11 | Publix | N/A | ||||||||||||||||||||||||||||
| Mableton Crossing | Mableton, GA | 100 % | Atlanta-Sandy Springs-Alpharetta, GA | 1997 | 86,819 | 94.1 | % | $ | 1,072 | $ | 13.12 | Kroger | N/A | ||||||||||||||||||||||||||||
| Macland Pointe | Marietta, GA | 100 % | Atlanta-Sandy Springs-Alpharetta, GA | 1992 | 79,699 | 100.0 | % | $ | 996 | $ | 12.50 | Publix | N/A | ||||||||||||||||||||||||||||
| Mansell Village | Roswell, GA | 100 % | Atlanta-Sandy Springs-Alpharetta, GA | 2003 / 2013 | 89,688 | 93.0 | % | $ | 1,125 | $ | 13.49 | Kroger | N/A | ||||||||||||||||||||||||||||
| Market Walk | Savannah, GA | 100 % | Savannah, GA | 2014 / 2022 | 263,829 | 100.0 | % | $ | 4,019 | $ | 15.23 | Kroger | Dick's Sporting Goods; Guitar Center; West Marine | ||||||||||||||||||||||||||||
| Mountain Crossing | Dacula, GA | 100 % | Atlanta-Sandy Springs-Alpharetta, GA | 1997 | 93,396 | 100.0 | % | $ | 1,272 | $ | 13.62 | Kroger | N/A | ||||||||||||||||||||||||||||
| Phillips Edison & Company |
47
|
|||||||
|
Property List
Unaudited, dollars in thousands (excluding per square foot amounts; statistics for properties owned through our unconsolidated joint venture have not been prorated)
| |||||||||||||||||||||||||||||||||||||||||
| Property Name | Location | Ownership Percentage | CBSA | Year Constructed/ Renovated | GLA | % Leased | ABR | ABR PSF | Grocery Anchor | Additional Anchors | |||||||||||||||||||||||||||||||
| Mountain Park Plaza | Roswell, GA | 100 % | Atlanta-Sandy Springs-Alpharetta, GA | 1988 / 2003 | 80,511 | 100.0 | % | $ | 1,090 | $ | 13.54 | Publix | N/A | ||||||||||||||||||||||||||||
| Old Alabama Square | Johns Creek, GA | 100 % | Atlanta-Sandy Springs-Alpharetta, GA | 2000 | 102,867 | 92.4 | % | $ | 2,263 | $ | 23.81 | The Fresh Market | Walgreens | ||||||||||||||||||||||||||||
| Paradise Crossing | Lithia Springs, GA | 100 % | Atlanta-Sandy Springs-Alpharetta, GA | 2000 | 67,470 | 100.0 | % | $ | 970 | $ | 14.38 | Publix | N/A | ||||||||||||||||||||||||||||
| Richmond Plaza | Augusta, GA | 14 % | Augusta-Richmond County, GA-SC | 1979 / 2020 | 174,075 | 93.0 | % | $ | 1,725 | $ | 10.65 | N/A | Ashley HomeStore and Ashley Outlet; JOANN; Harbor Freight Tools; Chuck E. Cheese; Chow Time Buffet & Grill | ||||||||||||||||||||||||||||
| Rivermont Station | Johns Creek, GA | 100 % | Atlanta-Sandy Springs-Alpharetta, GA | 1996 / 2022 | 128,123 | 99.0 | % | $ | 2,010 | $ | 15.85 | Kroger | Kids Empire | ||||||||||||||||||||||||||||
| Shiloh Square Shopping Center | Kennesaw, GA | 100 % | Atlanta-Sandy Springs-Alpharetta, GA | 1996 / 2003 | 136,920 | 97.3 | % | $ | 1,735 | $ | 13.02 | Kroger | You Fit Health Clubs | ||||||||||||||||||||||||||||
| Shops at Westridge | McDonough, GA | 100 % | Atlanta-Sandy Springs-Alpharetta, GA | 2006 / 2020 | 72,420 | 100.0 | % | $ | 1,237 | $ | 17.08 | Publix | N/A | ||||||||||||||||||||||||||||
| Southampton Village | Tyrone, GA | 100 % | Atlanta-Sandy Springs-Alpharetta, GA | 2003 | 80,949 | 91.5 | % | $ | 952 | $ | 12.86 | Publix | N/A | ||||||||||||||||||||||||||||
| Spivey Junction | Stockbridge, GA | 100 % | Atlanta-Sandy Springs-Alpharetta, GA | 1998 | 81,475 | 100.0 | % | $ | 1,113 | $ | 13.66 | Kroger | N/A | ||||||||||||||||||||||||||||
| Village At Glynn Place | Brunswick, GA | 100 % | Brunswick, GA | 1992 / 2009 | 123,437 | 99.0 | % | $ | 1,541 | $ | 12.61 | Publix | Goodwill | ||||||||||||||||||||||||||||
| Villages at Eagles Landing | Stockbridge, GA | 100 % | Atlanta-Sandy Springs-Alpharetta, GA | 1995 | 67,019 | 100.0 | % | $ | 923 | $ | 13.77 | Publix | N/A | ||||||||||||||||||||||||||||
| Village Shoppes at Windermere | Suwanee, GA | 100 % | Atlanta-Sandy Springs-Alpharetta, GA | 2008 | 73,442 | 98.1 | % | $ | 1,428 | $ | 19.82 | Publix | N/A | ||||||||||||||||||||||||||||
| CitiCentre Plaza | Carroll, IA | 100 % | Carroll, IA | 1991 / 2018 | 63,518 | 93.5 | % | $ | 486 | $ | 8.19 | Hy-Vee | N/A | ||||||||||||||||||||||||||||
| Duck Creek Plaza | Bettendorf, IA | 100 % | Davenport-Moline-Rock Island, IA-IL | 2005 / 2022 | 134,229 | 98.0 | % | $ | 1,379 | $ | 10.48 | N/A | Malibu Jack's | ||||||||||||||||||||||||||||
| Southgate Shopping Center | Des Moines, IA | 100 % | Des Moines-West Des Moines, IA | 1972 / 2014 | 161,792 | 100.0 | % | $ | 957 | $ | 5.92 | Hy-Vee | Planet Fitness; Jay's CD & Hobby; BioLife Plasma Services; Dollar General | ||||||||||||||||||||||||||||
| Baker Hill | Glen Ellyn, IL | 100 % | Chicago-Naperville-Elgin, IL-IN-WI | 1998 / 2018 | 135,355 | 97.1 | % | $ | 2,092 | $ | 15.92 | Pete's Fresh Market | N/A | ||||||||||||||||||||||||||||
| Brentwood Commons | Bensenville, IL | 100 % | Chicago-Naperville-Elgin, IL-IN-WI | 1981 / 2015 | 125,497 | 100.0 | % | $ | 1,766 | $ | 14.07 | Jewel-Osco | Dollar Tree | ||||||||||||||||||||||||||||
| Burbank Plaza | Burbank, IL | 100 % | Chicago-Naperville-Elgin, IL-IN-WI | 1972 / 2018 | 99,453 | 100.0 | % | $ | 1,138 | $ | 11.44 | Jewel-Osco | dd's Discounts | ||||||||||||||||||||||||||||
| Phillips Edison & Company |
48
|
|||||||
|
Property List
Unaudited, dollars in thousands (excluding per square foot amounts; statistics for properties owned through our unconsolidated joint venture have not been prorated)
| |||||||||||||||||||||||||||||||||||||||||
| Property Name | Location | Ownership Percentage | CBSA | Year Constructed/ Renovated | GLA | % Leased | ABR | ABR PSF | Grocery Anchor | Additional Anchors | |||||||||||||||||||||||||||||||
| College Plaza | Normal, IL | 100 % | Bloomington, IL | 2002 / 2018 | 175,741 | 82.8 | % | $ | 1,774 | $ | 12.19 | N/A | Ross Dress for Less; Office Depot; Michaels; Shoe Carnival; Sierra Trading Co.; Petco | ||||||||||||||||||||||||||||
| Glenbrook Marketplace | Glenview, IL | 100 % | Chicago-Naperville-Elgin, IL-IN-WI | 1992 / 2014 | 47,832 | 88.4 | % | $ | 1,036 | $ | 24.51 | N/A | N/A | ||||||||||||||||||||||||||||
| Heritage Plaza | Carol Stream, IL | 100 % | Chicago-Naperville-Elgin, IL-IN-WI | 1988 / 2018 | 128,870 | 100.0 | % | $ | 1,856 | $ | 14.40 | Jewel-Osco | Charter Fitness | ||||||||||||||||||||||||||||
| Hilander Village | Roscoe, IL | 100 % | Rockford, IL | 1994 / 2022 | 120,694 | 94.5 | % | $ | 1,257 | $ | 11.02 | Schnucks | N/A | ||||||||||||||||||||||||||||
| Hoffman Village | Hoffman Estates, IL | 14 % | Chicago-Naperville-Elgin, IL-IN-WI | 1987 / 2021 | 159,708 | 98.9 | % | $ | 3,005 | $ | 19.02 | Mariano's | Goodwill; Los Fernandez Taqueria | ||||||||||||||||||||||||||||
| Maple View | Grayslake, IL | 100 % | Chicago-Naperville-Elgin, IL-IN-WI | 1999 | 114,668 | 92.7 | % | $ | 1,971 | $ | 18.55 | Jewel-Osco | N/A | ||||||||||||||||||||||||||||
| Naperville Crossings | Naperville, IL | 100 % | Chicago-Naperville-Elgin, IL-IN-WI | 2007 / 2021 | 151,203 | 100.0 | % | $ | 4,601 | $ | 30.43 | ALDI | N/A | ||||||||||||||||||||||||||||
| Oak Mill Plaza | Niles, IL | 100 % | Chicago-Naperville-Elgin, IL-IN-WI | 1977 / 2023 | 157,386 | 88.0 | % | $ | 2,158 | $ | 15.57 | Jewel-Osco | N/A | ||||||||||||||||||||||||||||
| Rolling Meadows Shopping Center | Rolling Meadows, IL | 14 % | Chicago-Naperville-Elgin, IL-IN-WI | 2010 / 2016 | 130,212 | 99.6 | % | $ | 1,510 | $ | 11.65 | Jewel-Osco | Northwest Community Hospital; Dollar Tree | ||||||||||||||||||||||||||||
| Savoy Plaza | Savoy, IL | 100 % | Champaign-Urbana, IL | 1999 / 2015 | 140,624 | 98.9 | % | $ | 1,797 | $ | 12.93 | Schnucks | Goodwill; Friar Tuck Beverages | ||||||||||||||||||||||||||||
| Shorewood Crossing | Shorewood, IL | 100 % | Chicago-Naperville-Elgin, IL-IN-WI | 2001 / 2020 | 173,981 | 96.2 | % | $ | 2,608 | $ | 15.58 | Mariano's | Marshalls; Staples; Petco; Party City | ||||||||||||||||||||||||||||
| The Shoppes at Windmill Place | Batavia, IL | 100 % | Chicago-Naperville-Elgin, IL-IN-WI | 1991 / 1997 | 122,176 | 96.7 | % | $ | 2,021 | $ | 17.11 | Jewel-Osco | N/A | ||||||||||||||||||||||||||||
| The Shops of Uptown | Park Ridge, IL | 100 % | Chicago-Naperville-Elgin, IL-IN-WI | 2006 | 70,402 | 84.9 | % | $ | 1,835 | $ | 30.72 | Trader Joe's | N/A | ||||||||||||||||||||||||||||
| Dyer Town Center | Dyer, IN | 100 % | Chicago-Naperville-Elgin, IL-IN-WI | 2004 / 2005 | 102,415 | 100.0 | % | $ | 1,908 | $ | 18.63 | Jewel-Osco | N/A | ||||||||||||||||||||||||||||
| Lafayette Square | Lafayette, IN | 100 % | Lafayette-West Lafayette, IN | 1963 / 2022 | 250,506 | 95.2 | % | $ | 1,596 | $ | 6.69 | N/A | Rural King Supply; Big Lots; Humble Home; Dollar Tree Family Dollar; Harvest Chapel | ||||||||||||||||||||||||||||
| Riverplace Centre | Noblesville, IN | 100 % | Indianapolis-Carmel-Anderson, IN | 1992 / 2020 | 74,189 | 100.0 | % | $ | 779 | $ | 10.50 | Kroger | N/A | ||||||||||||||||||||||||||||
| Phillips Edison & Company |
49
|
|||||||
|
Property List
Unaudited, dollars in thousands (excluding per square foot amounts; statistics for properties owned through our unconsolidated joint venture have not been prorated)
| |||||||||||||||||||||||||||||||||||||||||
| Property Name | Location | Ownership Percentage | CBSA | Year Constructed/ Renovated | GLA | % Leased | ABR | ABR PSF | Grocery Anchor | Additional Anchors | |||||||||||||||||||||||||||||||
| The Village Shopping Center | Mooresville, IN | 100 % | Indianapolis-Carmel-Anderson, IN | 1965 / 2019 | 155,502 | 100.0 | % | $ | 971 | $ | 6.24 | Kroger | Black Friday - The Shopping Network; Mooresville Discount Mattress Outlet & More; Family Dollar; Player's Performance Factory | ||||||||||||||||||||||||||||
| Town & Country Shopping Center | Noblesville, IN | 100 % | Indianapolis-Carmel-Anderson, IN | 1998 / 2023 | 249,833 | 100.0 | % | $ | 2,007 | $ | 8.03 | Walmart | Staples; Dollar Tree | ||||||||||||||||||||||||||||
| Falcon Valley | Lenexa, KS | 100 % | Kansas City, MO-KS | 2008 / 2009 | 76,784 | 100.0 | % | $ | 1,054 | $ | 13.73 | Price Chopper | N/A | ||||||||||||||||||||||||||||
| Quivira Crossings | Overland Park, KS | 100 % | Kansas City, MO-KS | 1996 / 2015 | 123,198 | 100.0 | % | $ | 1,596 | $ | 12.95 | Price Chopper | N/A | ||||||||||||||||||||||||||||
| Wyandotte Plaza | Kansas City, KS | 100 % | Kansas City, MO-KS | 1961 / 2015 | 173,757 | 100.0 | % | $ | 2,034 | $ | 11.71 | Price Chopper | Marshalls; PetSmart; Dollar Tree | ||||||||||||||||||||||||||||
| Central Station | Louisville, KY | 100 % | Louisville/Jefferson County, KY-IN | 2005 / 2018 | 152,463 | 99.0 | % | $ | 1,654 | $ | 10.96 | Kroger | Planet Fitness | ||||||||||||||||||||||||||||
| Chinoe Center | Lexington, KY | 100 % | Lexington-Fayette, KY | 1984 / 2023 | 111,781 | 98.5 | % | $ | 1,315 | $ | 11.94 | Kroger | Exceptional Living Centers | ||||||||||||||||||||||||||||
| Meadowthorpe Manor Shoppes | Lexington, KY | 100 % | Lexington-Fayette, KY | 1989 / 2022 | 117,126 | 100.0 | % | $ | 1,196 | $ | 10.21 | Kroger | N/A | ||||||||||||||||||||||||||||
| Town Fair Center | Louisville, KY | 100 % | Louisville/Jefferson County, KY-IN | 1988 / 2019 | 234,291 | 100.0 | % | $ | 2,683 | $ | 11.45 | N/A | Malibu Jack's; Staples; Michaels; Petco; Five Below | ||||||||||||||||||||||||||||
| Atlantic Plaza | North Reading, MA | 100 % | Boston-Cambridge-Newton, MA-NH | 1959 / 2014 | 126,384 | 100.0 | % | $ | 2,378 | $ | 18.82 | Stop & Shop | Cowabungas; One Stop Liquors | ||||||||||||||||||||||||||||
| Carriagetown Marketplace | Amesbury, MA | 100 % | Boston-Cambridge-Newton, MA-NH | 2000 | 96,472 | 96.5 | % | $ | 1,742 | $ | 18.71 | Stop & Shop | N/A | ||||||||||||||||||||||||||||
| Cushing Plaza | Cohasset, MA | 14 % | Boston-Cambridge-Newton, MA-NH | 1997 / 2000 | 71,210 | 100.0 | % | $ | 1,355 | $ | 19.03 | Shaw's Supermarket | Walgreens | ||||||||||||||||||||||||||||
| Five Town Plaza | Springfield, MA | 100 % | Springfield, MA | 1970 / 2019 | 327,303 | 95.8 | % | $ | 4,191 | $ | 13.36 | Big Y | Burlington Coat Factory; Big Lots; Best Fitness | ||||||||||||||||||||||||||||
| Northwoods Crossing | Taunton, MA | 100 % | Providence-Warwick, RI-MA | 2003 / 2022 | 156,478 | 100.0 | % | $ | 2,133 | $ | 13.63 | BJ's Wholesale Club | Tractor Supply; Dollar Tree | ||||||||||||||||||||||||||||
| Shaw's Plaza Easton | Easton, MA | 100 % | Providence-Warwick, RI-MA | 1984 / 2004 | 104,923 | 95.4 | % | $ | 1,286 | $ | 12.84 | Shaw's Supermarket | Walgreens | ||||||||||||||||||||||||||||
| Shaw's Plaza Hanover | Hanover, MA | 100 % | Boston-Cambridge-Newton, MA-NH | 1994 / 2000 | 57,181 | 100.0 | % | $ | 832 | $ | 14.55 | Shaw's Supermarket | N/A | ||||||||||||||||||||||||||||
| Shaw's Plaza Raynham | Raynham, MA | 100 % | Providence-Warwick, RI-MA | 1965 / 2022 | 177,828 | 99.7 | % | $ | 2,851 | $ | 16.08 | Shaw's Supermarket | Marshalls; JOANN; PetSmart; CVS | ||||||||||||||||||||||||||||
| Sudbury Crossing | Sudbury, MA | 100 % | Boston-Cambridge-Newton, MA-NH | 1984 / 2021 | 89,952 | 87.9 | % | $ | 1,342 | $ | 16.97 | Sudbury Farms (shadow) | T.J.Maxx; The Goddard School; Dollar Tree | ||||||||||||||||||||||||||||
| Burwood Village Center | Glen Burnie, MD | 100 % | Baltimore-Columbia-Towson, MD | 1971 | 101,144 | 100.0 | % | $ | 1,847 | $ | 18.26 | Food Lion | Dollar General; CVS | ||||||||||||||||||||||||||||
| Phillips Edison & Company |
50
|
|||||||
|
Property List
Unaudited, dollars in thousands (excluding per square foot amounts; statistics for properties owned through our unconsolidated joint venture have not been prorated)
| |||||||||||||||||||||||||||||||||||||||||
| Property Name | Location | Ownership Percentage | CBSA | Year Constructed/ Renovated | GLA | % Leased | ABR | ABR PSF | Grocery Anchor | Additional Anchors | |||||||||||||||||||||||||||||||
| Collington Plaza | Bowie, MD | 100 % | Washington-Arlington-Alexandria, DC-VA-MD-WV | 1996 | 121,955 | 97.7 | % | $ | 2,614 | $ | 21.94 | Giant | N/A | ||||||||||||||||||||||||||||
| LaPlata Plaza | La Plata, MD | 100 % | Washington-Arlington-Alexandria, DC-VA-MD-WV | 2003 / 2019 | 123,560 | 100.0 | % | $ | 2,705 | $ | 21.89 | Safeway | Petco | ||||||||||||||||||||||||||||
| Rosewick Crossing | La Plata, MD | 100 % | Washington-Arlington-Alexandria, DC-VA-MD-WV | 2008 | 116,057 | 96.1 | % | $ | 2,402 | $ | 21.53 | Giant | N/A | ||||||||||||||||||||||||||||
| Bear Creek Plaza | Petoskey, MI | 100 % | N/A | 1998 / 2018 | 311,920 | 96.2 | % | $ | 1,883 | $ | 6.27 | Walmart | Marshalls; OfficeMax; HomeGoods; JOANN | ||||||||||||||||||||||||||||
| Cherry Hill Marketplace | Westland, MI | 100 % | Detroit-Warren-Dearborn, MI | 1992 / 2017 | 120,568 | 97.7 | % | $ | 1,509 | $ | 12.80 | Kroger | Ace Hardware; CVS | ||||||||||||||||||||||||||||
| Livonia Plaza | Livonia, MI | 100 % | Detroit-Warren-Dearborn, MI | 1988 / 2014 | 137,205 | 100.0 | % | $ | 1,742 | $ | 12.70 | Kroger | T.J.Maxx | ||||||||||||||||||||||||||||
| Milan Plaza | Milan, MI | 100 % | Ann Arbor, MI | 1960 / 2018 | 61,357 | 97.8 | % | $ | 360 | $ | 6.00 | Kroger | Ace Hardware | ||||||||||||||||||||||||||||
| Orchard Square | Washington Township, MI | 100 % | Detroit-Warren-Dearborn, MI | 1999 / 2011 | 92,450 | 98.7 | % | $ | 1,278 | $ | 14.01 | Kroger | N/A | ||||||||||||||||||||||||||||
| 12 West Marketplace | Litchfield, MN | 100 % | N/A | 1989 / 2010 | 82,911 | 100.0 | % | $ | 377 | $ | 4.55 | Family Fare | Running's Farm and Fleet | ||||||||||||||||||||||||||||
| Albertville Crossing | Albertville, MN | 14 % | Minneapolis-St. Paul-Bloomington, MN-WI | 2002 / 2018 | 99,013 | 98.4 | % | $ | 1,429 | $ | 14.67 | Coborn's | N/A | ||||||||||||||||||||||||||||
| Apache Shoppes | Rochester, MN | 100 % | Rochester, MN | 2005 | 60,665 | 64.2 | % | $ | 672 | $ | 17.25 | Trader Joe's | N/A | ||||||||||||||||||||||||||||
| Cahill Plaza | Inver Grove Heights, MN | 100 % | Minneapolis-St. Paul-Bloomington, MN-WI | 1995 / 2020 | 69,000 | 100.0 | % | $ | 723 | $ | 10.48 | Cub Foods | N/A | ||||||||||||||||||||||||||||
| Centennial Lakes Plaza | Edina, MN | 100 % | Minneapolis-St. Paul-Bloomington, MN-WI | 1989 / 2022 | 193,826 | 94.6 | % | $ | 4,311 | $ | 23.50 | Whole Foods Market | HomeGoods; La-Z-Boy Furniture Galleries; Office Depot; JUUT SalonSpa | ||||||||||||||||||||||||||||
| Crossroads of Shakopee | Shakopee, MN | 100 % | Minneapolis-St. Paul-Bloomington, MN-WI | 1998 | 140,949 | 96.3 | % | $ | 2,101 | $ | 15.48 | Cub Foods | N/A | ||||||||||||||||||||||||||||
| Hastings Marketplace | Hastings, MN | 100 % | Minneapolis-St. Paul-Bloomington, MN-WI | 2002 | 97,535 | 98.5 | % | $ | 1,320 | $ | 13.74 | Cub Foods | N/A | ||||||||||||||||||||||||||||
| New Prague Commons | New Prague, MN | 100 % | Minneapolis-St. Paul-Bloomington, MN-WI | 2008 / 2019 | 73,415 | 98.4 | % | $ | 1,212 | $ | 16.78 | Coborn's | N/A | ||||||||||||||||||||||||||||
| Normandale Village | Bloomington, MN | 100 % | Minneapolis-St. Paul-Bloomington, MN-WI | 1973 / 2017 | 140,400 | 98.9 | % | $ | 1,903 | $ | 13.71 | Lunds & Byerlys | Ace Hardware | ||||||||||||||||||||||||||||
| Northstar Marketplace | Ramsey, MN | 100 % | Minneapolis-St. Paul-Bloomington, MN-WI | 2004 / 2023 | 96,356 | 93.9 | % | $ | 1,442 | $ | 15.93 | Coborn's | N/A | ||||||||||||||||||||||||||||
| Savage Town Square | Savage, MN | 100 % | Minneapolis-St. Paul-Bloomington, MN-WI | 2003 | 87,181 | 100.0 | % | $ | 1,343 | $ | 15.40 | Cub Foods | N/A | ||||||||||||||||||||||||||||
| Phillips Edison & Company |
51
|
|||||||
|
Property List
Unaudited, dollars in thousands (excluding per square foot amounts; statistics for properties owned through our unconsolidated joint venture have not been prorated)
| |||||||||||||||||||||||||||||||||||||||||
| Property Name | Location | Ownership Percentage | CBSA | Year Constructed/ Renovated | GLA | % Leased | ABR | ABR PSF | Grocery Anchor | Additional Anchors | |||||||||||||||||||||||||||||||
| Waterford Park Plaza | Plymouth, MN | 100 % | Minneapolis-St. Paul-Bloomington, MN-WI | 1989 / 2023 | 127,572 | 90.9 | % | $ | 1,672 | $ | 14.41 | Cub Foods | N/A | ||||||||||||||||||||||||||||
| West Village Center | Chanhassen, MN | 100 % | Minneapolis-St. Paul-Bloomington, MN-WI | 1994 / 2021 | 141,772 | 100.0 | % | $ | 2,412 | $ | 17.01 | Lunds & Byerlys | OfficeMax | ||||||||||||||||||||||||||||
| South Oaks Plaza | St. Louis, MO | 100 % | St. Louis, MO-IL | 1969 / 2021 | 112,300 | 100.0 | % | $ | 986 | $ | 8.78 | N/A | Kloss Furniture; Michaels; Walgreens | ||||||||||||||||||||||||||||
| Southfield Center | St. Louis, MO | 100 % | St. Louis, MO-IL | 1987 / 2021 | 109,397 | 96.3 | % | $ | 1,603 | $ | 15.21 | Schnucks | N/A | ||||||||||||||||||||||||||||
| Chapel Hill North Center | Chapel Hill, NC | 100 % | Durham-Chapel Hill, NC | 1998 | 96,290 | 100.0 | % | $ | 1,634 | $ | 16.97 | Harris Teeter | N/A | ||||||||||||||||||||||||||||
| Crossroads Plaza | Asheboro, NC | 100 % | Greensboro-High Point, NC | 1984 / 2016 | 51,440 | 100.0 | % | $ | 413 | $ | 8.03 | Food Lion | N/A | ||||||||||||||||||||||||||||
| Cureton Town Center | Waxhaw, NC | 100 % | Charlotte-Concord-Gastonia, NC-SC | 2006 / 2018 | 95,577 | 100.0 | % | $ | 2,055 | $ | 21.50 | Harris Teeter | N/A | ||||||||||||||||||||||||||||
| Edgecombe Square | Tarboro, NC | 100 % | Rocky Mount, NC | 1990 / 2013 | 81,070 | 100.0 | % | $ | 409 | $ | 5.05 | Food Lion | Farmers Home Furniture | ||||||||||||||||||||||||||||
| Harrison Pointe | Cary, NC | 14 % | Raleigh-Cary, NC | 2002 / 2016 | 136,447 | 100.0 | % | $ | 2,108 | $ | 15.45 | Harris Teeter | Staples | ||||||||||||||||||||||||||||
| Lumina Commons | Wilmington, NC | 100 % | Wilmington, NC | 1974 / 2007 | 80,772 | 100.0 | % | $ | 1,320 | $ | 16.34 | Harris Teeter | N/A | ||||||||||||||||||||||||||||
| Northside Plaza | Clinton, NC | 100 % | N/A | 1982 / 2015 | 79,865 | 95.0 | % | $ | 603 | $ | 7.95 | Food Lion | Farmers Home Furniture | ||||||||||||||||||||||||||||
| The Shoppes at Ardrey Kell | Charlotte, NC | 14 % | Charlotte-Concord-Gastonia, NC-SC | 2008 | 82,119 | 100.0 | % | $ | 1,492 | $ | 18.17 | Harris Teeter | N/A | ||||||||||||||||||||||||||||
| Tramway Crossing | Sanford, NC | 100 % | Sanford, NC | 1996 | 62,382 | 100.0 | % | $ | 745 | $ | 11.94 | Food Lion | N/A | ||||||||||||||||||||||||||||
| Windsor Center | Dallas, NC | 100 % | Charlotte-Concord-Gastonia, NC-SC | 1974 / 2015 | 80,540 | 95.8 | % | $ | 727 | $ | 9.42 | N/A | Southern States Cooperative; Desirable Dynamics; CVS | ||||||||||||||||||||||||||||
| Plaza 23 | Pompton Plains, NJ | 100 % | New York-Newark-Jersey City, NY-NJ-PA | 1963 / 2021 | 169,478 | 100.0 | % | $ | 4,245 | $ | 25.05 | Super Stop & Shop | T.J.Maxx; HomeGoods | ||||||||||||||||||||||||||||
| Coronado Center | Santa Fe, NM | 100 % | Santa Fe, NM | 1964 / 2019 | 116,005 | 100.0 | % | $ | 2,064 | $ | 17.79 | Trader Joe's | New Mexico Bike N Sport; Party City; Empire Sushi Buffet; Dollar Tree | ||||||||||||||||||||||||||||
| Pavilions at San Mateo | Albuquerque, NM | 100 % | Albuquerque, NM | 1997 / 2012 | 148,749 | 99.0 | % | $ | 2,522 | $ | 17.12 | Walmart Neighborhood Market | Shoe Dept.; Old Navy; Boofys Best for Pets; Dollar Tree | ||||||||||||||||||||||||||||
| Plaza Farmington | Farmington, NM | 100 % | Farmington, NM | 2004 | 139,063 | 100.0 | % | $ | 1,458 | $ | 10.48 | Safeway | T.J.Maxx; Best Buy; Petco | ||||||||||||||||||||||||||||
| Crossroads Towne Center | North Las Vegas, NV | 100 % | Las Vegas-Henderson-Paradise, NV | 2007 / 2021 | 148,719 | 91.9 | % | $ | 4,401 | $ | 32.20 | Walmart (shadow) | Planet Fitness; Salon Boutique | ||||||||||||||||||||||||||||
| Green Valley Plaza | Henderson, NV | 100 % | Las Vegas-Henderson-Paradise, NV | 1978 / 1982 | 89,332 | 100.0 | % | $ | 1,995 | $ | 22.33 | Trader Joe's | Dollar Tree; Big 5 Sporting Goods | ||||||||||||||||||||||||||||
| Rainbow Plaza | Las Vegas, NV | 100 % | Las Vegas-Henderson-Paradise, NV | 1989 / 2022 | 144,845 | 100.0 | % | $ | 2,567 | $ | 17.72 | Albertsons | Home Depot (shadow); Ross Dress for Less | ||||||||||||||||||||||||||||
| Southwest Marketplace | Las Vegas, NV | 100 % | Las Vegas-Henderson-Paradise, NV | 2008 / 2017 | 127,852 | 100.0 | % | $ | 3,717 | $ | 29.07 | Smith's | N/A | ||||||||||||||||||||||||||||
| Phillips Edison & Company |
52
|
|||||||
|
Property List
Unaudited, dollars in thousands (excluding per square foot amounts; statistics for properties owned through our unconsolidated joint venture have not been prorated)
| |||||||||||||||||||||||||||||||||||||||||
| Property Name | Location | Ownership Percentage | CBSA | Year Constructed/ Renovated | GLA | % Leased | ABR | ABR PSF | Grocery Anchor | Additional Anchors | |||||||||||||||||||||||||||||||
| Sprouts Plaza | Las Vegas, NV | 100 % | Las Vegas-Henderson-Paradise, NV | 1995 / 2022 | 112,580 | 98.8 | % | $ | 2,143 | $ | 19.26 | Sprouts Farmers Market | Home Depot (shadow); Goodwill; Advance Auto Parts | ||||||||||||||||||||||||||||
| University Plaza | Amherst, NY | 100 % | Buffalo-Cheektowaga, NY | 1980 / 2020 | 163,388 | 96.3 | % | $ | 1,823 | $ | 11.58 | Tops Markets | Amherst Theatre; DaVita Dialysis; NAPA Auto Parts | ||||||||||||||||||||||||||||
| Beavercreek Towne Center | Beavercreek, OH | 100 % | Dayton-Kettering, OH | 1994 / 2019 | 366,416 | 99.6 | % | $ | 3,615 | $ | 9.91 | Fresh Thyme | Lowe's; Kohl's; Ashley Furniture HomeStore; T.J.Maxx; JOANN; Shoe Carnival | ||||||||||||||||||||||||||||
| East Side Square | Springfield, OH | 100 % | Springfield, OH | 2007 | 8,400 | 100.0 | % | $ | 163 | $ | 19.40 | Walmart (shadow) | N/A | ||||||||||||||||||||||||||||
| Fairfield Crossing | Beavercreek, OH | 100 % | Dayton-Kettering, OH | 1994 | 71,170 | 100.0 | % | $ | 1,413 | $ | 19.85 | Walmart (shadow) | Office Depot; Pet Supplies Plus | ||||||||||||||||||||||||||||
| Fairlawn Town Centre | Fairlawn, OH | 100 % | Akron, OH | 1962 / 2012 | 339,067 | 95.5 | % | $ | 4,477 | $ | 13.82 | Giant Eagle; Marc's | U.S. Post Office; Ashley Furniture HomeStore; HomeGoods; Lucky Shoes; Chuck E. Cheese; Pet Supplies Plus | ||||||||||||||||||||||||||||
| Flag City Station | Findlay, OH | 100 % | Findlay, OH | 1992 / 2020 | 250,449 | 100.0 | % | $ | 1,465 | $ | 5.85 | Walmart | T.J.Maxx; PetSmart | ||||||||||||||||||||||||||||
| Forest Park Square | Cincinnati, OH | 100 % | Cincinnati, OH-KY-IN | 1988 / 2018 | 92,824 | 100.0 | % | $ | 1,017 | $ | 10.96 | Kroger | N/A | ||||||||||||||||||||||||||||
| Georgesville Square | Columbus, OH | 14 % | Columbus, OH | 1996 / 2017 | 270,045 | 99.3 | % | $ | 2,484 | $ | 9.27 | Kroger | Lowe's | ||||||||||||||||||||||||||||
| Glenwood Crossing | Cincinnati, OH | 100 % | Cincinnati, OH-KY-IN | 1999 / 2015 | 101,021 | 97.6 | % | $ | 709 | $ | 7.19 | Kroger | Dollar Tree | ||||||||||||||||||||||||||||
| Goshen Station | Goshen, OH | 100 % | Cincinnati, OH-KY-IN | 1973 / 2003 | 53,802 | 100.0 | % | $ | 591 | $ | 10.98 | Kroger | N/A | ||||||||||||||||||||||||||||
| Hartville Centre | Hartville, OH | 100 % | Canton-Massillon, OH | 1988 / 2008 | 106,051 | 99.0 | % | $ | 1,295 | $ | 12.34 | Giant Eagle | N/A | ||||||||||||||||||||||||||||
| Harvest Plaza | Akron, OH | 100 % | Akron, OH | 1974 / 2015 | 75,866 | 100.0 | % | $ | 759 | $ | 10.00 | Giant Eagle | N/A | ||||||||||||||||||||||||||||
| Lakewood City Center | Lakewood, OH | 100 % | Cleveland-Elyria, OH | 1991 / 2011 | 67,280 | 100.0 | % | $ | 1,166 | $ | 17.33 | Marc's | Pet Supplies Plus | ||||||||||||||||||||||||||||
| Monfort Heights | Cincinnati, OH | 100 % | Cincinnati, OH-KY-IN | 1987 / 2015 | 54,920 | 100.0 | % | $ | 505 | $ | 9.20 | Kroger | N/A | ||||||||||||||||||||||||||||
| Sheffield Crossing | Sheffield Village, OH | 100 % | Cleveland-Elyria, OH | 1989 / 2013 | 113,688 | 92.3 | % | $ | 1,411 | $ | 13.45 | Giant Eagle | N/A | ||||||||||||||||||||||||||||
| Shoregate Town Center | Willowick, OH | 100 % | Cleveland-Elyria, OH | 1958 / 2022 | 289,431 | 97.4 | % | $ | 2,712 | $ | 9.62 | Giant Eagle; Marc's | Goodwill; Planet Fitness; Ace Hardware; Dollar General; Pet Supplies Plus | ||||||||||||||||||||||||||||
| Sidney Towne Center | Sidney, OH | 100 % | Sidney, OH | 1981 / 2007 | 115,776 | 100.0 | % | $ | 613 | $ | 5.29 | Kroger | N/A | ||||||||||||||||||||||||||||
| Snow View Plaza | Parma, OH | 100 % | Cleveland-Elyria, OH | 1981 | 97,147 | 93.8 | % | $ | 1,246 | $ | 13.67 | Giant Eagle | Kumo Japanese | ||||||||||||||||||||||||||||
| Sulphur Grove | Huber Heights, OH | 100 % | Dayton-Kettering, OH | 2004 | 19,570 | 100.0 | % | $ | 333 | $ | 17.02 | Walmart (shadow) | N/A | ||||||||||||||||||||||||||||
| Trader Joe's Center | Dublin, OH | 100 % | Columbus, OH | 1986 | 75,506 | 100.0 | % | $ | 1,478 | $ | 19.57 | Trader Joe's | N/A | ||||||||||||||||||||||||||||
| East Burnside Plaza | Portland, OR | 100 % | Portland-Vancouver-Hillsboro, OR-WA | 1955 / 1999 | 38,363 | 97.1 | % | $ | 731 | $ | 19.62 | Quality Food Centers | N/A | ||||||||||||||||||||||||||||
| Phillips Edison & Company |
53
|
|||||||
|
Property List
Unaudited, dollars in thousands (excluding per square foot amounts; statistics for properties owned through our unconsolidated joint venture have not been prorated)
| |||||||||||||||||||||||||||||||||||||||||
| Property Name | Location | Ownership Percentage | CBSA | Year Constructed/ Renovated | GLA | % Leased | ABR | ABR PSF | Grocery Anchor | Additional Anchors | |||||||||||||||||||||||||||||||
| Highland Fair | Gresham, OR | 100 % | Portland-Vancouver-Hillsboro, OR-WA | 1984 / 2013 | 72,195 | 100.0 | % | $ | 1,038 | $ | 14.38 | Safeway | N/A | ||||||||||||||||||||||||||||
| Hilfiker Shopping Center | Salem, OR | 100 % | Salem, OR | 1984 / 2011 | 38,558 | 71.5 | % | $ | 569 | $ | 20.63 | Trader Joe's | Petco | ||||||||||||||||||||||||||||
| Sunset Shopping Center | Corvallis, OR | 100 % | Corvallis, OR | 1998 / 2023 | 166,873 | 94.8 | % | $ | 2,427 | $ | 15.35 | Safeway | BI-MART; The Car Pool Car Wash | ||||||||||||||||||||||||||||
| Edgewood Towne Center | Edgewood, PA | 100 % | Pittsburgh, PA | 1990 / 2021 | 342,610 | 95.4 | % | $ | 4,017 | $ | 12.29 | Giant Eagle | Giant Eagle; Planet Fitness; Aaron's; BioLife Plasma Services; Citi Trends; Fox Beauty Supply | ||||||||||||||||||||||||||||
| Fairview Plaza | New Cumberland, PA | 100 % | York-Hanover, PA | 1992 / 1999 | 71,979 | 100.0 | % | $ | 994 | $ | 13.81 | Giant | N/A | ||||||||||||||||||||||||||||
| Northtowne Square | Gibsonia, PA | 14 % | Pittsburgh, PA | 1993 / 2003 | 113,372 | 100.0 | % | $ | 1,060 | $ | 9.35 | Giant Eagle | N/A | ||||||||||||||||||||||||||||
| Palmer Town Center | Easton, PA | 100 % | Allentown-Bethlehem-Easton, PA-NJ | 2005 | 153,085 | 100.0 | % | $ | 2,756 | $ | 18.00 | Giant | Marshalls | ||||||||||||||||||||||||||||
| Townfair Center | Indiana, PA | 100 % | Indiana, PA | 1995 / 2016 | 218,610 | 100.0 | % | $ | 2,130 | $ | 9.74 | Giant Eagle | Lowe's; Michaels | ||||||||||||||||||||||||||||
| Yorktown Centre | Millcreek Township, PA | 100 % | Erie, PA | 1989 / 2020 | 198,418 | 100.0 | % | $ | 2,219 | $ | 11.18 | Giant Eagle | Saint Vincent Hospital; A Bridge to Independence | ||||||||||||||||||||||||||||
| Centerpoint | Easley, SC | 100 % | Greenville-Anderson, SC | 2002 | 72,287 | 100.0 | % | $ | 931 | $ | 12.88 | Publix | N/A | ||||||||||||||||||||||||||||
| Hampton Village | Taylors, SC | 100 % | Greenville-Anderson, SC | 1959 / 2019 | 129,188 | 98.8 | % | $ | 1,732 | $ | 13.57 | Publix | Burkes Outlet | ||||||||||||||||||||||||||||
| Murray Landing | Columbia, SC | 100 % | Columbia, SC | 2003 / 2016 | 68,798 | 93.9 | % | $ | 967 | $ | 14.97 | Publix | N/A | ||||||||||||||||||||||||||||
| North Pointe Plaza | North Charleston, SC | 100 % | Charleston-North Charleston, SC | 1989 / 2022 | 373,520 | 99.3 | % | $ | 3,035 | $ | 8.18 | Walmart | Carpet To Go Flooring; FIT Life Health Clubs; Dollar Tree; Atlantic Bedding & Furniture; Petco; City Gear | ||||||||||||||||||||||||||||
| Palmetto Pavilion | North Charleston, SC | 100 % | Charleston-North Charleston, SC | 2003 | 66,428 | 100.0 | % | $ | 1,011 | $ | 15.22 | Publix | N/A | ||||||||||||||||||||||||||||
| Stockbridge Commons | Fort Mill, SC | 14 % | Charlotte-Concord-Gastonia, NC-SC | 2003 / 2012 | 99,473 | 98.8 | % | $ | 1,751 | $ | 17.82 | Harris Teeter | N/A | ||||||||||||||||||||||||||||
| Summerville Galleria | Summerville, SC | 100 % | Charleston-North Charleston, SC | 1989 / 2014 | 106,390 | 100.0 | % | $ | 1,483 | $ | 13.94 | Food Lion | N/A | ||||||||||||||||||||||||||||
| The Fresh Market Commons | Pawleys Island, SC | 100 % | Georgetown, SC | 2011 / 2014 | 32,325 | 100.0 | % | $ | 683 | $ | 21.13 | The Fresh Market | N/A | ||||||||||||||||||||||||||||
| Hamilton Village | Chattanooga, TN | 100 % | Chattanooga, TN-GA | 1989 / 2021 | 429,325 | 100.0 | % | $ | 3,359 | $ | 7.82 | Walmart; ALDI | Urban Air Adventure Park; Gabe's; Big Lots; JOANN; Boot Barn | ||||||||||||||||||||||||||||
| Hickory Plaza | Nashville, TN | 100 % | Nashville-Davidson--Murfreesboro--Franklin, TN | 1974 / 2020 | 72,136 | 100.0 | % | $ | 883 | $ | 12.24 | Kroger | N/A | ||||||||||||||||||||||||||||
| Lynnwood Place | Jackson, TN | 100 % | Jackson, TN | 1986 / 2013 | 96,666 | 95.2 | % | $ | 847 | $ | 9.20 | Kroger | Fitness 1440 | ||||||||||||||||||||||||||||
| Phillips Edison & Company |
54
|
|||||||
|
Property List
Unaudited, dollars in thousands (excluding per square foot amounts; statistics for properties owned through our unconsolidated joint venture have not been prorated)
| |||||||||||||||||||||||||||||||||||||||||
| Property Name | Location | Ownership Percentage | CBSA | Year Constructed/ Renovated | GLA | % Leased | ABR | ABR PSF | Grocery Anchor | Additional Anchors | |||||||||||||||||||||||||||||||
| Providence Commons | Mt. Juliet, TN | 100 % | Nashville-Davidson--Murfreesboro--Franklin, TN | 2009 | 110,137 | 100.0 | % | $ | 2,039 | $ | 18.51 | Publix | Five Below | ||||||||||||||||||||||||||||
| Willowbrook Commons | Nashville, TN | 100 % | Nashville-Davidson--Murfreesboro--Franklin, TN | 2005 | 93,600 | 100.0 | % | $ | 1,005 | $ | 10.74 | Kroger | N/A | ||||||||||||||||||||||||||||
| Cinco Ranch at Market Center | Katy, TX | 100 % | Houston-The Woodlands-Sugar Land, TX | 2007 / 2023 | 104,794 | 100.0 | % | $ | 2,282 | $ | 21.78 | Super Target (shadow) | HomeGoods; Michaels; OfficeMax | ||||||||||||||||||||||||||||
| Commerce Square | Brownwood, TX | 100 % | Brownwood, TX | 1969 / 2022 | 162,393 | 92.7 | % | $ | 1,459 | $ | 9.70 | ALDI | T.J.Maxx; Burkes Outlet; Boot Barn Western and Work Wear; Harbor Freight Tools | ||||||||||||||||||||||||||||
| Coppell Market Center | Coppell, TX | 100 % | Dallas-Fort Worth-Arlington, TX | 2008 | 90,225 | 100.0 | % | $ | 1,540 | $ | 17.07 | Market Street United | N/A | ||||||||||||||||||||||||||||
| Hickory Creek Plaza | Denton, TX | 100 % | Dallas-Fort Worth-Arlington, TX | 2007 | 28,132 | 84.0 | % | $ | 634 | $ | 26.82 | Kroger (shadow) | N/A | ||||||||||||||||||||||||||||
| Kirkwood Market Place | Houston, TX | 100 % | Houston-The Woodlands-Sugar Land, TX | 1979 / 2012 | 80,220 | 98.5 | % | $ | 1,617 | $ | 20.46 | Sprouts Farmers Market | N/A | ||||||||||||||||||||||||||||
| Kleinwood Center | Spring, TX | 100 % | Houston-The Woodlands-Sugar Land, TX | 2003 | 152,900 | 100.0 | % | $ | 3,377 | $ | 22.09 | H-E-B | N/A | ||||||||||||||||||||||||||||
| Lake Pointe Market | Rowlett, TX | 100 % | Dallas-Fort Worth-Arlington, TX | 2002 | 40,608 | 96.8 | % | $ | 1,026 | $ | 26.11 | Tom Thumb (shadow) | N/A | ||||||||||||||||||||||||||||
| Mansfield Market Center | Mansfield, TX | 100 % | Dallas-Fort Worth-Arlington, TX | 2015 | 55,400 | 100.0 | % | $ | 1,410 | $ | 25.45 | Sprouts Farmers Market | N/A | ||||||||||||||||||||||||||||
| Mayfair Village | Hurst, TX | 100 % | Dallas-Fort Worth-Arlington, TX | 1981 / 2022 | 230,778 | 98.4 | % | $ | 2,718 | $ | 11.97 | Tom Thumb | Ollie's Bargain Outlet; Bealls; Planet Fitness | ||||||||||||||||||||||||||||
| McKinney Market Street | Mckinney, TX | 100 % | Dallas-Fort Worth-Arlington, TX | 2003 / 2017 | 96,830 | 100.0 | % | $ | 2,056 | $ | 21.23 | Market Street United | N/A | ||||||||||||||||||||||||||||
| Murphy Marketplace | Murphy, TX | 100 % | Dallas-Fort Worth-Arlington, TX | 2008 / 2021 | 227,203 | 100.0 | % | $ | 5,335 | $ | 23.48 | Sprouts Farmers Market | 24 Hour Fitness; Michaels | ||||||||||||||||||||||||||||
| Northpark Village | Lubbock, TX | 100 % | Lubbock, TX | 1990 | 70,479 | 98.0 | % | $ | 752 | $ | 10.88 | United Supermarkets | N/A | ||||||||||||||||||||||||||||
| Oak Meadows Marketplace | Georgetown, TX | 100 % | Austin-Round Rock-Georgetown, TX | 2018 | 78,841 | 98.1 | % | $ | 1,543 | $ | 19.94 | Randalls | N/A | ||||||||||||||||||||||||||||
| Plano Market Street | Plano, TX | 100 % | Dallas-Fort Worth-Arlington, TX | 2009 | 166,978 | 100.0 | % | $ | 3,739 | $ | 22.39 | Market Street United | Toni & Guy Academy | ||||||||||||||||||||||||||||
| Riverpark Shopping Center | Sugar Land, TX | 100 % | Houston-The Woodlands-Sugar Land, TX | 2003 | 317,331 | 79.1 | % | $ | 5,375 | $ | 21.42 | H-E-B | LA Fitness; Dollar Tree; Walgreens | ||||||||||||||||||||||||||||
| Seville Commons | Arlington, TX | 100 % | Dallas-Fort Worth-Arlington, TX | 1987 / 2022 | 112,421 | 98.1 | % | $ | 1,628 | $ | 14.76 | Walmart Neighborhood Market | N/A | ||||||||||||||||||||||||||||
| Spring Cypress Village | Houston, TX | 100 % | Houston-The Woodlands-Sugar Land, TX | 1982 / 2012 | 102,758 | 95.2 | % | $ | 1,958 | $ | 20.02 | Sprouts Farmers Market | Spec's Liquor; Lumiere Nail Studios & Salon Park | ||||||||||||||||||||||||||||
| Stone Gate Plaza | Crowley, TX | 100 % | Dallas-Fort Worth-Arlington, TX | 2003 | 90,675 | 98.5 | % | $ | 1,070 | $ | 11.99 | Kroger | N/A | ||||||||||||||||||||||||||||
| Suntree Square | Southlake, TX | 100 % | Dallas-Fort Worth-Arlington, TX | 2000 | 99,269 | 97.1 | % | $ | 1,566 | $ | 16.25 | Tom Thumb | N/A | ||||||||||||||||||||||||||||
| Phillips Edison & Company |
55
|
|||||||
|
Property List
Unaudited, dollars in thousands (excluding per square foot amounts; statistics for properties owned through our unconsolidated joint venture have not been prorated)
| |||||||||||||||||||||||||||||||||||||||||
| Property Name | Location | Ownership Percentage | CBSA | Year Constructed/ Renovated | GLA | % Leased | ABR | ABR PSF | Grocery Anchor | Additional Anchors | |||||||||||||||||||||||||||||||
| Towne Crossing Shopping Center | Mesquite, TX | 100 % | Dallas-Fort Worth-Arlington, TX | 1984 / 2016 | 165,419 | 96.8 | % | $ | 1,986 | $ | 12.40 | Kroger | WSS; Citi Trends; Kids Empire; CSL Plasma | ||||||||||||||||||||||||||||
| Hillside - West | Hillside, UT | 100 % | Salt Lake City, UT | 2006 | 14,550 | 100.0 | % | $ | 461 | $ | 31.68 | N/A | Walgreens | ||||||||||||||||||||||||||||
| Ashburn Farm Market Center | Ashburn, VA | 100 % | Washington-Arlington-Alexandria, DC-VA-MD-WV | 2000 | 91,905 | 97.6 | % | $ | 2,769 | $ | 30.88 | Giant | N/A | ||||||||||||||||||||||||||||
| Birdneck Shopping Center | Virginia Beach, VA | 100 % | Virginia Beach-Norfolk-Newport News, VA-NC | 1987 / 2017 | 65,554 | 100.0 | % | $ | 618 | $ | 9.43 | Food Lion | N/A | ||||||||||||||||||||||||||||
| Cascades Overlook | Sterling, VA | 100 % | Washington-Arlington-Alexandria, DC-VA-MD-WV | 2016 | 150,841 | 95.8 | % | $ | 4,424 | $ | 30.62 | Harris Teeter | N/A | ||||||||||||||||||||||||||||
| Courthouse Marketplace | Virginia Beach, VA | 100 % | Virginia Beach-Norfolk-Newport News, VA-NC | 2005 | 102,563 | 95.1 | % | $ | 1,640 | $ | 16.82 | Harris Teeter | N/A | ||||||||||||||||||||||||||||
| Dunlop Village | Colonial Heights, VA | 100 % | Richmond, VA | 1987 / 2012 | 77,315 | 97.8 | % | $ | 771 | $ | 10.20 | Food Lion | Ace Hardware | ||||||||||||||||||||||||||||
| Lakeside Plaza | Salem, VA | 100 % | Roanoke, VA | 1988 | 82,894 | 92.2 | % | $ | 922 | $ | 12.06 | Kroger | NAPA Auto Parts | ||||||||||||||||||||||||||||
| Nordan Shopping Center | Danville, VA | 100 % | Danville, VA | 1961 / 2015 | 135,358 | 100.0 | % | $ | 1,023 | $ | 7.56 | Walmart Neighborhood Market | Big Lots; It's Fashion Metro; Dept. of Social Services; Virginia Dept. of Corrections | ||||||||||||||||||||||||||||
| Statler Square | Staunton, VA | 100 % | Staunton, VA | 1989 / 1997 | 134,660 | 96.0 | % | $ | 1,252 | $ | 9.68 | Kroger | Staples; Petco | ||||||||||||||||||||||||||||
| Staunton Plaza | Staunton, VA | 100 % | Staunton, VA | 2006 | 80,266 | 100.0 | % | $ | 1,460 | $ | 18.19 | Martin's | N/A | ||||||||||||||||||||||||||||
| Stonewall Plaza | Winchester, VA | 100 % | Winchester, VA-WV | 2007 | 118,584 | 96.1 | % | $ | 2,480 | $ | 21.77 | Martin's | Dollar Tree | ||||||||||||||||||||||||||||
| Village at Waterford | Midlothian, VA | 100 % | Richmond, VA | 1991 / 2016 | 78,611 | 100.0 | % | $ | 840 | $ | 10.69 | Food Lion | N/A | ||||||||||||||||||||||||||||
| Waynesboro Plaza | Waynesboro, VA | 100 % | Staunton, VA | 2005 | 76,534 | 100.0 | % | $ | 1,364 | $ | 17.82 | Martin's | N/A | ||||||||||||||||||||||||||||
| Winchester Gateway | Winchester, VA | 100 % | Winchester, VA-WV | 2006 | 163,585 | 98.8 | % | $ | 3,160 | $ | 19.56 | Martin's | East Coast Gymnastics and Cheer; Ridgeside K9 Winchester | ||||||||||||||||||||||||||||
| Claremont Village | Everett, WA | 100 % | Seattle-Tacoma-Bellevue, WA | 1994 / 2012 | 86,497 | 100.0 | % | $ | 1,532 | $ | 17.71 | Quality Food Centers | Ace Hardware | ||||||||||||||||||||||||||||
| The Orchards | Yakima, WA | 100 % | Yakima, WA | 2002 | 86,407 | 100.0 | % | $ | 1,354 | $ | 15.67 | Rosauers Supermarkets | N/A | ||||||||||||||||||||||||||||
| Fairacres Shopping Center | Oshkosh, WI | 100 % | Oshkosh-Neenah, WI | 1992 / 2016 | 85,523 | 100.0 | % | $ | 1,018 | $ | 11.90 | Pick 'n Save | O-Town Iron | ||||||||||||||||||||||||||||
| Franklin Centre | Franklin, WI | 100 % | Milwaukee-Waukesha, WI | 1994 / 2018 | 120,068 | 100.0 | % | $ | 1,182 | $ | 9.84 | Pick 'n Save | Galleria Furniture | ||||||||||||||||||||||||||||
| Glenwood Crossings | Kenosha, WI | 100 % | Chicago-Naperville-Elgin, IL-IN-WI | 1992 / 2018 | 87,115 | 98.2 | % | $ | 1,079 | $ | 12.62 | Pick 'n Save | Dollar Tree | ||||||||||||||||||||||||||||
| Greentree Centre | Racine, WI | 100 % | Racine, WI | 1989 / 2018 | 78,011 | 100.0 | % | $ | 1,143 | $ | 14.65 | Pick 'n Save | N/A | ||||||||||||||||||||||||||||
| Kohl's Onalaska | Onalaska, WI | 100 % | La Crosse-Onalaska, WI-MN | 1992 / 2021 | 86,432 | 100.0 | % | $ | 581 | $ | 6.72 | N/A | Kohl's | ||||||||||||||||||||||||||||
| Market Place at Pabst Farms | Oconomowoc, WI | 100 % | Milwaukee-Waukesha, WI | 2005 / 2020 | 109,438 | 100.0 | % | $ | 2,088 | $ | 19.08 | Metro Market | N/A | ||||||||||||||||||||||||||||
| Phillips Edison & Company |
56
|
|||||||
|
Property List
Unaudited, dollars in thousands (excluding per square foot amounts; statistics for properties owned through our unconsolidated joint venture have not been prorated)
| |||||||||||||||||||||||||||||||||||||||||
| Property Name | Location | Ownership Percentage | CBSA | Year Constructed/ Renovated | GLA | % Leased | ABR | ABR PSF | Grocery Anchor | Additional Anchors | |||||||||||||||||||||||||||||||
| Point Loomis | Milwaukee, WI | 100 % | Milwaukee-Waukesha, WI | 1965 / 2022 | 167,533 | 100.0 | % | $ | 1,063 | $ | 6.35 | Pick 'n Save | Kohl's | ||||||||||||||||||||||||||||
| Village Center | Racine, WI | 100 % | Racine, WI | 2002 / 2021 | 240,847 | 98.1 | % | $ | 2,637 | $ | 11.16 | Festival Foods | Kohl's; Ulta | ||||||||||||||||||||||||||||
| Village Square of Delafield | Delafield, WI | 100 % | Milwaukee-Waukesha, WI | 2007 / 2017 | 81,639 | 93.4 | % | $ | 1,200 | $ | 15.73 | Pick 'n Save | N/A | ||||||||||||||||||||||||||||
| Total | 34,366,361 | 97.5 | % | $ | 502,727 | $ | 15.00 | ||||||||||||||||||||||||||||||||||
| Phillips Edison & Company |
57
|
|||||||
| ADDITIONAL DISCLOSURES | ||
Quarter Ended December 31, 2023 | ||
| Phillips Edison & Company |
58
|
|||||||
|
Earnings Guidance
Unaudited, in thousands (excluding per share amounts)
| |||||||||||
The following guidance is based upon PECO’s current view of existing market conditions and assumptions for the year ending December 31, 2024. The following statements are forward-looking and actual results could differ materially depending on market conditions and the factors set forth under "Forward-Looking Statements" below. | |||||||||||
| 2023A | 2024E | ||||||||||
| Updated | Previous | ||||||||||
| Net Income / Share | $0.48 | $0.53 - $0.58 | $0.50 - $0.55 | ||||||||
| Nareit FFO / Share | $2.25 | $2.34 - $2.41 | $2.33 - $2.40 | ||||||||
| Core FFO/ Share | $2.34 | $2.37 - $2.45 | $2.36 - $2.44 | ||||||||
Same-Center NOI Growth(1) |
4.2% | 3.25% - 4.25% | 3.25% - 4.25% | ||||||||
| Portfolio Activity | |||||||||||
| Acquisitions, net | $272,230 | $200,000 - $300,000 | $200,000 - $300,000 | ||||||||
| Other | |||||||||||
| Interest expense, net | $84,232 | $95,000 - $105,000 | $104,000 - $112,000 | ||||||||
| G&A expense | $44,366 | $45,000 - $49,000 | $45,000 - $49,000 | ||||||||
Non-cash revenue items(2) |
$15,322 | $14,500 - $18,500 | $14,500 - $18,500 | ||||||||
| Adjustments for collectibility | $3,653 | $4,000 - 5,000 | $4,000 - 5,000 | ||||||||
| 2024E | |||||||||||
| Low End | High End | ||||||||||
Reconciliation |
|||||||||||
| Net income per common share | $ | 0.53 | $ | 0.58 | |||||||
| Depreciation and amortization of real estate assets | 1.79 | 1.81 | |||||||||
| Gain on sale of real estate assets | — | — | |||||||||
| Adjustments related to unconsolidated joint ventures | 0.02 | 0.02 | |||||||||
| Nareit FFO per common share | $ | 2.34 | $ | 2.41 | |||||||
| Depreciation and amortization of corporate assets | 0.01 | 0.01 | |||||||||
| Transaction costs and other | 0.02 | 0.03 | |||||||||
| Core FFO per common share | $ | 2.37 | $ | 2.45 | |||||||
| Phillips Edison & Company |
59
|
|||||||
|
Components of Net Asset Value
Unaudited, dollars and shares in thousands
| ||||||||||||||||||||
| Three Months Ended December 31, 2023 | Supplement Page | As of December 31, 2023 | Supplement Page | |||||||||||||||||
NOI FOR REAL ESTATE INVESTMENTS(1) |
$ | 103,095 | OTHER ASSETS | |||||||||||||||||
| Cash and cash equivalents | $ | 4,872 | ||||||||||||||||||
| ADJUSTMENTS TO NOI | Restricted cash | 4,006 | ||||||||||||||||||
NOI adjustments for Q4 acquisitions/dispositions(2) |
1,988 | Accounts receivable, net | 44,548 | |||||||||||||||||
| Prepaid expenses and other assets | 11,548 | |||||||||||||||||||
Quarterly impact of ABR from leases signed but not yet paying rent as of December 31, 2023 |
2,469 | Derivative assets | 12,669 | |||||||||||||||||
| Investment in third parties | 6,875 | |||||||||||||||||||
| Pro rata NOI from Joint Ventures | 1,033 | Investment in marketable securities | 8,566 | |||||||||||||||||
| Total value of other assets | $ | 93,084 | ||||||||||||||||||
| INVESTMENT MANAGEMENT BUSINESS | ||||||||||||||||||||
| Fees and management income | $ | 2,454 | LIABILITIES | |||||||||||||||||
| Property operating expenses related to fees and management income | 384 | Debt obligations | $ | 1,986,735 | ||||||||||||||||
| Accounts payable and other liabilities | 116,461 | |||||||||||||||||||
| Share of joint venture income recorded in Other Expense, Net | 62 | Total value of liabilities | $ | 2,103,196 | ||||||||||||||||
| EQUITY | ||||||||||||||||||||
| Common shares and OP units outstanding | 135,841 | |||||||||||||||||||
| JOINT VENTURES | ||||||||||||||||||||
| Pro rata share of debt | $ | 24,358 | ||||||||||||||||||
| DEVELOPMENT AND REDEVELOPMENT | ||||||||||||||||||||
| Costs incurred to date | $ | 24,355 | ||||||||||||||||||
| Estimated remaining costs to be incurred | 9,379 | |||||||||||||||||||
| Underwritten incremental unlevered yield | 9%-12% | |||||||||||||||||||
| Phillips Edison & Company |
60
|
|||||||
| Glossary of Terms | |||||
| Term | Definition | ||||
| Anchor space | A space greater than or equal to 10,000 square feet of gross leasable area (GLA). |
||||
| Annualized base rent (ABR) | Refers to the monthly contractual base rent as of the end of the applicable reporting period multiplied by twelve months. | ||||
| ABR Per Square Foot (PSF) | ABR divided by leased GLA. Increases in ABR PSF can be an indication of our ability to create rental rate growth in our centers, as well as an indication of demand for our spaces, which generally provides us with greater leverage during lease negotiations. | ||||
| Cap rate | Estimated in-place NOI for the property divided by the property’s contractual purchase or sale price. | ||||
| Comparable lease | Refers to a lease with consistent terms that is executed for substantially the same space that has been vacant less than twelve months. | ||||
| Comparable rent spread | Calculated as the percentage increase or decrease in first-year ABR (excluding any free rent or escalations) on new, renewal, and option leases where the lease was considered a comparable lease. This metric provides an indication of our ability to generate revenue growth through leasing activity. |
||||
| Cost of executing new leases | Refers to certain costs associated with new leasing, namely, tenant improvement costs and tenant concessions. |
||||
EBITDAre, and Adjusted EBITDAre (collectively, “EBITDAre metrics”)(1) |
Nareit defines EBITDAre as net income (loss) computed in accordance with GAAP before: (i) interest expense; (ii) income tax expense; (iii) depreciation and amortization; (iv) gains or losses from disposition of depreciable property; and (v) impairment write-downs of depreciable property. Adjustments for unconsolidated partnerships and joint ventures are calculated to reflect EBITDAre on the same basis.
To arrive at Adjusted EBITDAre, we exclude certain recurring and non-recurring items from EBITDAre, including, but not limited to: (i) changes in the fair value of the earn-out liability; (ii) other impairment charges; (iii) amortization of basis differences in our investments in our unconsolidated joint ventures; (iv) transaction and acquisition expenses; and (v) realized performance income.
We use EBITDAre and Adjusted EBITDAre as additional measures of operating performance which allow us to compare earnings independent of capital structure and evaluate debt leverage and fixed cost coverage.
|
||||
| Equity market capitalization | The total dollar value of all outstanding shares using the closing price for the applicable date. | ||||
| Grocer health ratio | Amount of annual rent and expense recoveries paid by the Neighbor as a percentage of gross sales. Low grocer health ratios provide us with the knowledge to manage our rents effectively while seeking to ensure the financial stability of our grocery anchors. | ||||
| Gross leasable area (GLA) | The total occupied and unoccupied square footage of a building that is available for Neighbors or other retailers to lease. |
||||
| Inline space | A space containing less than 10,000 square feet of GLA. | ||||
| Leased occupancy | Calculated as the percentage of total GLA for which a lease has been signed regardless of whether the lease has commenced or the Neighbor has taken possession. High occupancy is an indicator of demand for our spaces, which generally provides us with greater leverage during lease negotiations. |
||||
| Nareit | National Association of Real Estate Investment Trusts. | ||||
| Phillips Edison and Company |
61
|
|||||||
| Glossary of Terms | |||||
Nareit Funds from Operations Attributable to Stockholders and OP Unit Holders (Nareit FFO), Core FFO, Attributable to Stockholders and OP Unit Holders (Core FFO), and Adjusted FFO Attributable to Stockholders and OP Unit Holders (Adjusted FFO)(1) |
Nareit defines Funds from Operations ("FFO") as net income (loss) computed in accordance with GAAP, excluding: (i) gains (or losses) from sales of property and gains (or losses) from change in control; (ii) depreciation and amortization related to real estate; (iii) impairment losses on real estate and impairments of in-substance real estate investments in investees that are driven by measurable decreases in the fair value of the depreciable real estate held by the unconsolidated partnerships and joint ventures; and (iv) adjustments for unconsolidated partnerships and joint ventures, calculated to reflect FFO on the same basis. We believe FFO provides insight into our operating performance as it excludes certain items that are not indicative of such performance.
Core FFO is calculated as Nareit FFO adjusted to exclude certain recurring and non-recurring items including, but not limited to: (i) depreciation and amortization of corporate assets; (ii) changes in the fair value of the earn-out liability; (iii) amortization of unconsolidated joint venture basis differences; (iv) gains or losses on the extinguishment or modification of debt and other; (v) other impairment charges; (vi) transaction and acquisition expenses; and (vii) realized performance income. Core FFO provides further insight into the sustainability of our operating performance and provides an additional measure to compare our performance across reporting periods on a consistent basis by excluding items that may cause short-term fluctuations in net income (loss).
Adjusted FFO is calculated as Core FFO adjusted to exclude: (i) straight-line rent and non-cash adjustments, such as amortization of market lease adjustments, debt discounts, deferred financing costs, and market debt adjustments; (ii) recurring capital expenditures, tenant improvement costs, and leasing commissions; (iii) non-cash share-based compensation expenses; and (iv) our prorated share of the aforementioned adjustments for our unconsolidated joint ventures. Adjusted FFO provides further insight into our portfolio performance by focusing on the revenues and expenditures directly involved in our operations and the management of our entire real estate portfolio. Recurring property-related capital expenditures are costs to maintain properties and their common areas, including new roofs, paving of parking lots, and other general upkeep items, and recurring corporate capital expenditures are primarily costs for computer software and equipment.
|
||||
| Neighbor | In reference to one of our tenants. | ||||
| Net debt | Total debt, excluding discounts, market adjustments, and deferred financing expenses, less cash and cash equivalents. | ||||
Net debt to adjusted EBITDAre(1) |
Calculated by dividing net debt by Adjusted EBITDAre (included on an annualized basis within the calculation). It provides insight into our leverage rate based on earnings and is not impacted by fluctuations in our equity price. |
||||
Net debt to total enterprise value(1) |
Ratio is calculated by dividing net debt by total enterprise value. It provides insight into our capital structure and usage of debt. |
||||
Net operating income (NOI)(1) |
Calculated as total operating revenues, adjusted to exclude non-cash revenue items, less property operating expenses and real estate taxes. NOI provides insight about our financial and operating performance because it provides a performance measure of the revenues and expenses directly involved in owning and operating real estate assets and provides a perspective not immediately apparent from net income (loss). | ||||
| Portfolio retention rate | Calculated by dividing (i) the total square feet of retained Neighbors with current period lease expirations by (ii) the total square feet of leases expiring during the period. The portfolio retention rate provides insight into our ability to retain Neighbors at our shopping centers as their leases approach expiration. Generally, the costs to retain an existing Neighbor are lower than costs to replace with a new Neighbor. |
||||
| Recovery rate | Calculated by dividing (i) total recovery income by (ii) total recoverable expenses during the period. A high recovery rate is an indicator of our ability to recover certain property operating expenses and capital costs from our Neighbors. |
||||
| Redevelopment | Larger scale projects that typically involve substantial demolition of a portion of the shopping center to accommodate new retailers. These projects typically are accompanied with new construction and site infrastructure costs. | ||||
| Same-Center | Refers to a property, or portfolio of properties, that has been owned and operational for the entirety of each reporting period (i.e., since January 1, 2022). |
||||
| Total enterprise value | Net debt plus equity market capitalization on a fully diluted basis. | ||||
| Phillips Edison and Company |
62
|
|||||||
| Glossary of Terms | |||||
| Underwritten incremental unlevered yield | Reflects the yield we target to generate from a project upon expected stabilization and is calculated as the estimated incremental NOI for a project at stabilization divided by its estimated net project investment. The estimated incremental NOI is the difference between the estimated annualized NOI we target to generate by a project upon stabilization and the estimated annualized NOI without the planned improvements. Underwritten incremental unlevered yield does not include peripheral impacts, such as lease rollover risk or the impact on the long term value of the property upon sale or disposition. Actual incremental yields may vary from our underwritten incremental yield range based on the actual total cost to complete a project and its actual incremental NOI at stabilization. | ||||
| Phillips Edison and Company |
63
|
|||||||
| Investor Information | |||||||||||||||||
| ANALYST COVERAGE | |||||||||||||||||
| Bank of America | Jeff Spector | jeff.spector@bofa.com | |||||||||||||||
| BMO Capital Markets | Juan Sanabria | juan.sanabria@bmo.com | |||||||||||||||
| Compass Point Research | Floris van Dijkum | fvandijkum@compasspointllc.com | |||||||||||||||
| Deutsche Bank | Omotayo Okusanya | omotayo.okusanya@db.com | |||||||||||||||
| Goldman Sachs | Caitlin Burrows | caitlin.burrows@gs.com | |||||||||||||||
| Green Street Advisors | Paulina Rojas Schmidt | projasschmidt@greenstreet.com | |||||||||||||||
| JPMorgan | Michael Mueller | michael.w.mueller@jpmorgan.com | |||||||||||||||
| KeyBanc | Todd Thomas | tthomas@key.com | |||||||||||||||
| Mizuho | Haendel St. Juste | haendel.st.juste@mizuhogroup.com | |||||||||||||||
| Morgan Stanley | Ronald Kamdem | ronald.kamdem@morganstanley.com | |||||||||||||||
| Wells Fargo | Dori Kesten | dori.kesten@wellsfargo.com | |||||||||||||||
| Wolfe Research | Andrew Rosivach | arosivach@wolferesearch.com | |||||||||||||||
| CONTACT INFORMATION | |||||||||||||||||
| Investor Relations | |||||||||||||||||
| Kimberly Green | |||||||||||||||||
| kgreen@phillipsedison.com | |||||||||||||||||
| (513) 538-4380 | |||||||||||||||||
| Phillips Edison & Company |
64
|
|||||||