Maryland |
001-36041 |
26-4567130 |
||||||
|
(State or other jurisdiction
of incorporation)
|
(Commission
File Number)
|
(I.R.S. Employer
Identification No.)
|
||||||
o |
Written communications pursuant to Rule 425 under the Securities Act (17 CFR 230.425) |
||||
o |
Soliciting material pursuant to Rule 14a-12 under the Exchange Act (17 CFR 240.14a-12) |
||||
o |
Pre-commencement communications pursuant to Rule 14d-2(b) under the Exchange Act (17 CFR 240.14d-2(b)) |
||||
o |
Pre-commencement communications pursuant to Rule 13e-4(c) under the Exchange Act (17 CFR 240.13e-4(c)) |
||||
Title of each class |
Trading Symbol(s) |
Name of each exchange on which registered |
||||||||||||
Common stock |
IRT |
NYSE |
||||||||||||
| 99.1 | ||||||||
| 99.2 | ||||||||
| 104 | Cover Page Interactive Data File (embedded within the Inline XBRL document). | |||||||
| Independence Realty Trust, Inc. | ||||||||
| October 30, 2024 | By: | /s/ James J. Sebra | ||||||
| Name: | James J. Sebra | |||||||
| Title: | President and Chief Financial Officer | |||||||
|
Three Months Ended
September 30, 2024 Compared to Three Months Ended
September 30, 2023 |
Nine Months Ended
September 30, 2024 Compared to
Nine Months Ended September 30, 2023
|
|||||||
| Rental and other property revenue | 2.5% increase | 3.1% increase | ||||||
| Property operating expenses | 2.8% increase | 4.2% increase | ||||||
| NOI | 2.2% increase | 2.5% increase | ||||||
| Portfolio average occupancy | 90 bps increase to 95.4% | 110 bps increase to 95.1% | ||||||
| Portfolio average rental rate | 1.2% increase to $1,566 | 1.4% increase to $1,557 | ||||||
| NOI Margin | 10 bps decrease to 62.3% | 40 bps decrease to 62.2% | ||||||
| 3Q 2024 | Oct 2024(3) |
||||||||||
Same-Store Portfolio(1) |
|||||||||||
| Average Occupancy | 95.4 | % | 95.6 | % | (4) |
||||||
Lease Over Lease Effective Rental Rate Growth:(2) |
|||||||||||
| New Leases | (3.6) | % | (4.2) | % | |||||||
| Renewal Leases | 3.8 | % | 5.0 | % | |||||||
| Blended | 0.8 | % | 0.5 | % | |||||||
| Resident Retention Rate | 57.0 | % | 50.8 | % | |||||||
| Same-Store Portfolio excluding Ongoing Value Add | |||||||||||
| Average Occupancy | 95.9 | % | 95.9 | % | (4) |
||||||
Lease Over Lease Effective Rental Rate Growth:(2) |
|||||||||||
| New Leases | (4.0) | % | (4.4) | % | |||||||
| Renewal Leases | 3.7 | % | 5.1 | % | |||||||
| Blended | 0.6 | % | 0.3 | % | |||||||
| Resident Retention Rate | 57.6 | % | 50.3 | % | |||||||
| Value Add (26 properties with Ongoing Value Add) | |||||||||||
| Average Occupancy | 94.3 | % | 94.7 | % | (4) |
||||||
Lease Over Lease Effective Rental Rate Growth:(2) |
|||||||||||
| New Leases | (2.6) | % | (3.5) | % | |||||||
| Renewal Leases | 3.9 | % | 5.0 | % | |||||||
| Blended | 1.1 | % | 0.9 | % | |||||||
| Resident Retention Rate | 55.6 | % | 52.3 | % | |||||||
| Previous Guidance | Current Guidance | Change at Midpoint | ||||||||||||||||||||||||||||||
2024 Full Year EPS and CFFO Guidance(1)(2) |
Low | High | Low | High | ||||||||||||||||||||||||||||
| Earnings per share | $ | 0.36 | $ | 0.38 | $ | 0.295 | $ | 0.305 | $ | (0.07) | ||||||||||||||||||||||
| Adjustments: | ||||||||||||||||||||||||||||||||
Depreciation and amortization |
0.87 | 0.87 | 0.95 | 0.95 | 0.08 | |||||||||||||||||||||||||||
Gain on sale of real estate assets(3) |
(0.05) | (0.05) | (0.05) | (0.05) | — | — | ||||||||||||||||||||||||||
| FFO per share | 1.18 | 1.20 | 1.195 | 1.205 | 0.01 | |||||||||||||||||||||||||||
| Loan (premium accretion) discount amortization, net | (0.04) | (0.04) | (0.04) | (0.04) | — | |||||||||||||||||||||||||||
| CFFO per share | $ | 1.14 | $ | 1.16 | $ | 1.155 | $ | 1.165 | $ | 0.01 | ||||||||||||||||||||||
| Same-Store Portfolio | Previous 2024 Outlook(1) |
Current 2024 Outlook(1) |
Change at Midpoint | ||||||||
| Number of properties/units | 108 properties / 32,153 units | 108 properties / 32,153 units | — | ||||||||
| Property revenue growth | 3.0% to 3.3% | 3.0% to 3.2% | (0.05)% | ||||||||
| Controllable operating expense growth | 4.0% to 4.5% | 5.4% to 6.2% | 1.55% | ||||||||
| Real estate tax and insurance expense growth | 0.5% to 1.7% | (1.3%) to (0.7%) | (2.1)% | ||||||||
| Total operating expense growth | 2.6% to 3.4% | 2.8% to 3.2% | — | ||||||||
| NOI growth | 2.7% to 3.7% | 2.9% to 3.5% | — | ||||||||
| Corporate Expenses | |||||||||||
| General and administrative & property management expenses |
$52.5 million to $53.5 million | $52.5 million to $53.5 million | — | ||||||||
Interest expense(2) |
$83.0 million to $84.0 million | $83.0 million to $84.0 million | — | ||||||||
Transaction/Investment Volume(3) |
|||||||||||
| Acquisition volume | $80 to $82 million | $264 million to $268 million | $185 million | ||||||||
| Disposition volume | $395 million | $392 million to $396 million | — | ||||||||
| Capital Expenditures | |||||||||||
| Recurring | $21.0 million to $23.0 million | $22.5 million to $23.5 million | $1.0 million | ||||||||
| Value add & non-recurring | $76.0 million to $78.0 million | $76.0 million to $78.0 million | — | ||||||||
| Development | $54.5 million to $55.5 million | $54.5 million to $55.5 million | — | ||||||||
| For the Three Months Ended | |||||||||||||||||||||||||||||
| Sep 30, 2024 | Jun 30, 2024 | Mar 31, 2024 | Dec 31, 2023 | Sep 30, 2023 | |||||||||||||||||||||||||
| Selected Financial Information: | |||||||||||||||||||||||||||||
| Operating Statistics: | |||||||||||||||||||||||||||||
| Net income (loss) available to common shares | $12,365 | $10,354 | $17,577 | $(40,515) | $3,930 | ||||||||||||||||||||||||
| Earnings (loss) per share -- diluted | $0.05 | $0.05 | $0.08 | $(0.18) | $0.02 | ||||||||||||||||||||||||
| Rental and other property revenue | $159,860 | $158,104 | $160,331 | $166,730 | $168,375 | ||||||||||||||||||||||||
| Property operating expenses | $60,538 | $60,883 | $59,971 | $59,703 | $63,300 | ||||||||||||||||||||||||
| NOI | $99,322 | $97,221 | $100,360 | $107,027 | $105,075 | ||||||||||||||||||||||||
| NOI margin | 62.1% | 61.5% | 62.6% | 64.2% | 62.4% | ||||||||||||||||||||||||
| Adjusted EBITDA | $87,453 | $83,609 | $84,683 | $95,640 | $94,415 | ||||||||||||||||||||||||
| FFO per share | $0.30 | $0.28 | $0.27 | $0.31 | $0.31 | ||||||||||||||||||||||||
| CFFO per share | $0.29 | $0.28 | $0.27 | $0.30 | $0.30 | ||||||||||||||||||||||||
| Dividends per share | $0.16 | $0.16 | $0.16 | $0.16 | $0.16 | ||||||||||||||||||||||||
| CFFO payout ratio | 55.2% | 57.1% | 59.3% | 53.3% | 53.3% | ||||||||||||||||||||||||
| Portfolio Data: | |||||||||||||||||||||||||||||
| Total gross assets | $6,733,864 | $6,684,029 | $6,673,589 | $6,960,554 | $7,225,447 | ||||||||||||||||||||||||
| Total number of operating properties (a) | 110 | 110 | 111 | 116 | 120 | ||||||||||||||||||||||||
| Total units (a) | 32,670 | 32,685 | 32,877 | 34,431 | 35,427 | ||||||||||||||||||||||||
| Portfolio period end occupancy (a) | 95.5% | 95.5% | 95.0% | 94.6% | 94.4% | ||||||||||||||||||||||||
| Portfolio average occupancy (a) | 95.4% | 95.3% | 94.4% | 94.4% | 94.6% | ||||||||||||||||||||||||
| Portfolio average effective monthly rent, per unit (a) | $1,572 | $1,554 | $1,550 | $1,558 | $1,556 | ||||||||||||||||||||||||
| Same-store portfolio period end occupancy (b) | 95.5% | 95.5% | 95.0% | 94.7% | 94.4% | ||||||||||||||||||||||||
| Same-store portfolio average occupancy (b) | 95.4% | 95.4% | 94.4% | 94.5% | 94.5% | ||||||||||||||||||||||||
| Same-store portfolio average effective monthly rent, per unit (b) |
$1,566 | $1,555 | $1,551 | $1,555 | $1,548 | ||||||||||||||||||||||||
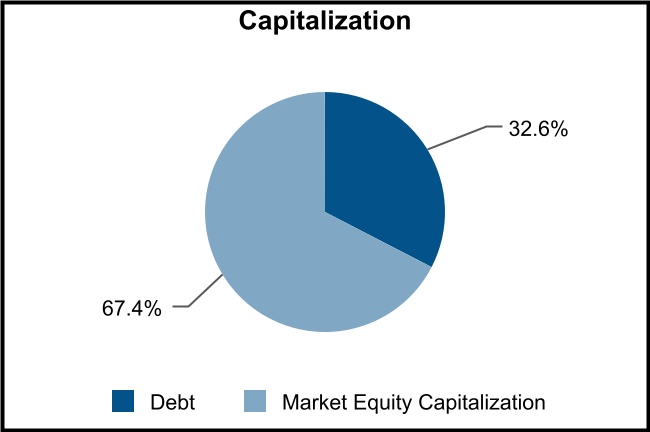
| Capitalization: | |||||||||||||||||||||||||||||
| Total debt (c) | $2,286,694 | $2,252,559 | $2,277,098 | $2,549,409 | $2,715,710 | ||||||||||||||||||||||||
| Common share price, period end | $20.50 | $18.74 | $16.13 | $15.30 | $14.07 | ||||||||||||||||||||||||
| Market equity capitalization | $4,736,212 | $4,330,137 | $3,726,224 | $3,528,996 | $3,245,135 | ||||||||||||||||||||||||
| Total market capitalization | $7,022,906 | $6,582,696 | $6,003,322 | $6,078,405 | $5,960,845 | ||||||||||||||||||||||||
| Total debt/total gross assets | 34.0% | 33.7% | 34.1% | 36.6% | 37.6% | ||||||||||||||||||||||||
| Net debt to Adjusted EBITDA (d) | 6.3x | 6.5x | 6.7x | 6.7x | 7.0x | ||||||||||||||||||||||||
| Interest coverage | 4.8x | 4.8x | 4.1x | 4.1x | 4.3x | ||||||||||||||||||||||||
| Common shares and OP Units: | |||||||||||||||||||||||||||||
| Shares outstanding | 225,093,090 | 225,122,235 | 225,070,396 | 224,706,731 | 224,695,566 | ||||||||||||||||||||||||
| OP units outstanding | 5,941,643 | 5,941,643 | 5,941,643 | 5,946,571 | 5,946,571 | ||||||||||||||||||||||||
| Common shares and OP units outstanding | 231,034,733 | 231,063,878 | 231,012,039 | 230,653,302 | 230,642,137 | ||||||||||||||||||||||||
| Weighted average common shares and OP units | 230,762,299 | 230,734,872 | 230,570,707 | 230,452,570 | 230,444,945 | ||||||||||||||||||||||||
| For the Three Months Ended September 30, | For the Nine Months Ended September 30, |
||||||||||||||||||||||
| 2024 | 2023 | 2024 | 2023 | ||||||||||||||||||||
| Funds From Operations (FFO): | |||||||||||||||||||||||
| Net income | $ | 12,620 | $ | 3,986 | $ | 41,134 | $ | 23,847 | |||||||||||||||
| Add-Back (Deduct): | |||||||||||||||||||||||
| Real estate depreciation and amortization | 54,880 | 55,217 | 162,028 | 162,205 | |||||||||||||||||||
| Our share of real estate depreciation and amortization from investments in unconsolidated real estate entities |
598 | 486 | 1,793 | 1,479 | |||||||||||||||||||
| Loss on impairment (gain on sale) of real estate assets, net, excluding prepayment gains |
160 | 11,268 | (9,113) | 10,954 | |||||||||||||||||||
| FFO | $ | 68,258 | $ | 70,957 | $ | 195,842 | $ | 198,485 | |||||||||||||||
| FFO per share | $ | 0.30 | $ | 0.31 | $ | 0.85 | $ | 0.86 | |||||||||||||||
| CORE Funds From Operations (CFFO): | |||||||||||||||||||||||
| FFO | $ | 68,258 | $ | 70,957 | $ | 195,842 | $ | 198,485 | |||||||||||||||
| Add-Back (Deduct): | |||||||||||||||||||||||
| Other depreciation and amortization | 382 | 329 | 1,083 | 860 | |||||||||||||||||||
| Casualty losses | 1,249 | 35 | 4,015 | 866 | |||||||||||||||||||
| Loan (premium accretion) discount amortization, net | (2,239) | (2,747) | (6,918) | (8,239) | |||||||||||||||||||
| Prepayment (gains) penalties on asset dispositions | (848) | — | (1,953) | (670) | |||||||||||||||||||
| Gain on extinguishment of debt | — | — | (203) | — | |||||||||||||||||||
| Other expense | — | 429 | 1 | 663 | |||||||||||||||||||
| Restructuring costs | — | — | — | 3,213 | |||||||||||||||||||
| CFFO | $ | 66,802 | $ | 69,003 | $ | 191,867 | $ | 195,178 | |||||||||||||||
| CFFO per share | $ | 0.29 | $ | 0.30 | $ | 0.83 | $ | 0.85 | |||||||||||||||
| Weighted-average shares and units outstanding | 230,762,299 | 230,444,945 | 230,689,617 | 230,334,398 | |||||||||||||||||||
| For the Three Months Ended | |||||||||||||||||||||||||||||
| Sep 30, 2024 | Jun 30, 2024 | Mar 31, 2024 | Dec 31, 2023 | Sep 30, 2023 | |||||||||||||||||||||||||
| Net income (loss) | $ | 12,620 | $ | 10,555 | $ | 17,961 | $ | (41,654) | $ | 3,986 | |||||||||||||||||||
| Other revenue | (275) | (298) | (203) | (316) | (232) | ||||||||||||||||||||||||
| Property management expenses | 7,379 | 7,666 | 7,499 | 6,660 | 7,232 | ||||||||||||||||||||||||
| General and administrative expenses |
4,765 | 6,244 | 8,381 | 5,043 | 3,660 | ||||||||||||||||||||||||
| Depreciation and amortization expense |
55,261 | 54,127 | 53,721 | 55,902 | 55,546 | ||||||||||||||||||||||||
| Casualty losses | 1,249 | 465 | 2,301 | 59 | 35 | ||||||||||||||||||||||||
| Interest expense | 18,308 | 17,460 | 20,603 | 23,537 | 22,033 | ||||||||||||||||||||||||
| (Gain on sale) loss on impairment of real estate assets, net |
(688) | 152 | (10,530) | 56,263 | 11,268 | ||||||||||||||||||||||||
| (Gain) loss on extinguishment of debt | — | — | (203) | 124 | — | ||||||||||||||||||||||||
| Other loss | — | — | 1 | 79 | 369 | ||||||||||||||||||||||||
| Loss from investments in unconsolidated real estate entities |
703 | 850 | 829 | 1,330 | 1,178 | ||||||||||||||||||||||||
| NOI | $ | 99,322 | $ | 97,221 | $ | 100,360 | $ | 107,027 | $ | 105,075 | |||||||||||||||||||
| Less: Non same-store portfolio NOI | 2,249 | 2,293 | 5,989 | 9,863 | 10,123 | ||||||||||||||||||||||||
| Same-store portfolio NOI | $ | 97,073 | $ | 94,928 | $ | 94,371 | $ | 97,164 | $ | 94,952 | |||||||||||||||||||
| Three Months Ended | |||||||||||||||||||||||||||||
| Sep 30, 2024 | Jun 30, 2024 | Mar 31, 2024 | Dec 31, 2023 | Sep 30, 2023 | |||||||||||||||||||||||||
| Net income (loss) | $ | 12,620 | $ | 10,555 | $ | 17,961 | $ | (41,654) | $ | 3,986 | |||||||||||||||||||
| Add-Back (Deduct): | |||||||||||||||||||||||||||||
| Interest expense | 18,308 | 17,460 | 20,603 | 23,537 | 22,033 | ||||||||||||||||||||||||
| Depreciation and amortization | 55,261 | 54,127 | 53,721 | 55,902 | 55,546 | ||||||||||||||||||||||||
| Casualty losses | 1,249 | 465 | 2,301 | 59 | 35 | ||||||||||||||||||||||||
| (Gain on sale) loss on impairment of real estate assets, net |
(688) | 152 | (10,530) | 56,263 | 11,268 | ||||||||||||||||||||||||
| (Gain) loss on extinguishment of debt | — | — | (203) | 124 | — | ||||||||||||||||||||||||
| Loss from investments in unconsolidated real estate entities |
703 | 850 | 829 | 1,330 | 1,178 | ||||||||||||||||||||||||
| Other loss | — | — | 1 | 79 | 369 | ||||||||||||||||||||||||
| Adjusted EBITDA | $ | 87,453 | $ | 83,609 | $ | 84,683 | $ | 95,640 | $ | 94,415 | |||||||||||||||||||
| INTEREST COST: | |||||||||||||||||||||||||||||
| Interest expense | $ | 18,308 | $ | 17,460 | $ | 20,603 | $ | 23,537 | $ | 22,033 | |||||||||||||||||||
| INTEREST COVERAGE: | 4.8x | 4.8x | 4.1x | 4.1x | 4.3x | ||||||||||||||||||||||||
| For the Three Months Ended September 30, | For the Nine Months Ended September 30, | ||||||||||||||||||||||
| 2024 | 2023 | 2024 | 2023 | ||||||||||||||||||||
| Net income (loss) | $ | 12,620 | $ | 3,986 | $ | 41,134 | $ | 23,847 | |||||||||||||||
| Add-Back (Deduct): | |||||||||||||||||||||||
| Interest expense | 18,308 | 22,033 | 56,371 | 66,383 | |||||||||||||||||||
| Depreciation and amortization | 55,261 | 55,546 | 163,112 | 163,066 | |||||||||||||||||||
| Casualty losses | 1,249 | 35 | 4,015 | 866 | |||||||||||||||||||
| (Gain on sale) loss on impairment of real estate assets, net | (688) | 11,268 | (11,066) | 10,284 | |||||||||||||||||||
| Gain on extinguishment of debt | — | — | (203) | — | |||||||||||||||||||
| Loss from investments in unconsolidated real estate entities | 703 | 1,178 | 2,382 | 3,159 | |||||||||||||||||||
| Other loss | — | 369 | 1 | 348 | |||||||||||||||||||
| Restructuring costs | — | — | — | 3,213 | |||||||||||||||||||
| Adjusted EBITDA | $ | 87,453 | $ | 94,415 | $ | 255,746 | $ | 271,166 | |||||||||||||||
| INTEREST COST: | |||||||||||||||||||||||
| Interest expense | $ | 18,308 | $ | 22,033 | $ | 56,371 | $ | 66,383 | |||||||||||||||
| INTEREST COVERAGE: | 4.8x | 4.3x | 4.5x | 4.1x | |||||||||||||||||||
| As of | ||||||||||||||||||||||||||||||||
| Sep 30, 2024 | Jun 30, 2024 | Mar 31, 2024 | Dec 31, 2023 | Sep 30, 2023 | ||||||||||||||||||||||||||||
| Total debt | $ | 2,286,694 | $ | 2,252,559 | $ | 2,277,098 | $ | 2,549,409 | $ | 2,715,710 | ||||||||||||||||||||||
| Less: cash and cash equivalents | (17,611) | (21,034) | (21,275) | (22,852) | (17,216) | |||||||||||||||||||||||||||
| Less: loan discounts and premiums, net | (33,970) | (37,253) | (39,804) | (44,483) | (50,772) | |||||||||||||||||||||||||||
| Total net debt | $ | 2,235,113 | $ | 2,194,272 | $ | 2,216,019 | $ | 2,482,074 | $ | 2,647,722 | ||||||||||||||||||||||
| As of | ||||||||||||||||||||||||||||||||
| Sep 30, 2024 | Jun 30, 2024 | Mar 31, 2024 | Dec 31, 2023 | Sep 30, 2023 | ||||||||||||||||||||||||||||
| Total assets | $ | 5,948,204 | $ | 5,940,261 | $ | 5,972,848 | $ | 6,280,175 | $ | 6,577,790 | ||||||||||||||||||||||
Plus: accumulated depreciation (a) |
715,702 | 674,236 | 630,743 | 606,404 | 570,966 | |||||||||||||||||||||||||||
| Plus: accumulated amortization | 69,958 | 69,532 | 69,998 | 73,975 | 76,691 | |||||||||||||||||||||||||||
| Total gross assets | $ | 6,733,864 | $ | 6,684,029 | $ | 6,673,589 | $ | 6,960,554 | $ | 7,225,447 | ||||||||||||||||||||||


| Trailing Five Quarters | |||||
Three and Nine Months Ended September 30, 2024 and 2023 |
|||||
Three and Nine Months Ended September 30, 2024 and 2023 |
|||||
Three and Nine Months Ended September 30, 2024 and 2023 |
|||||
Nine Months Ended September 30, 2024 and 2023 |
|||||
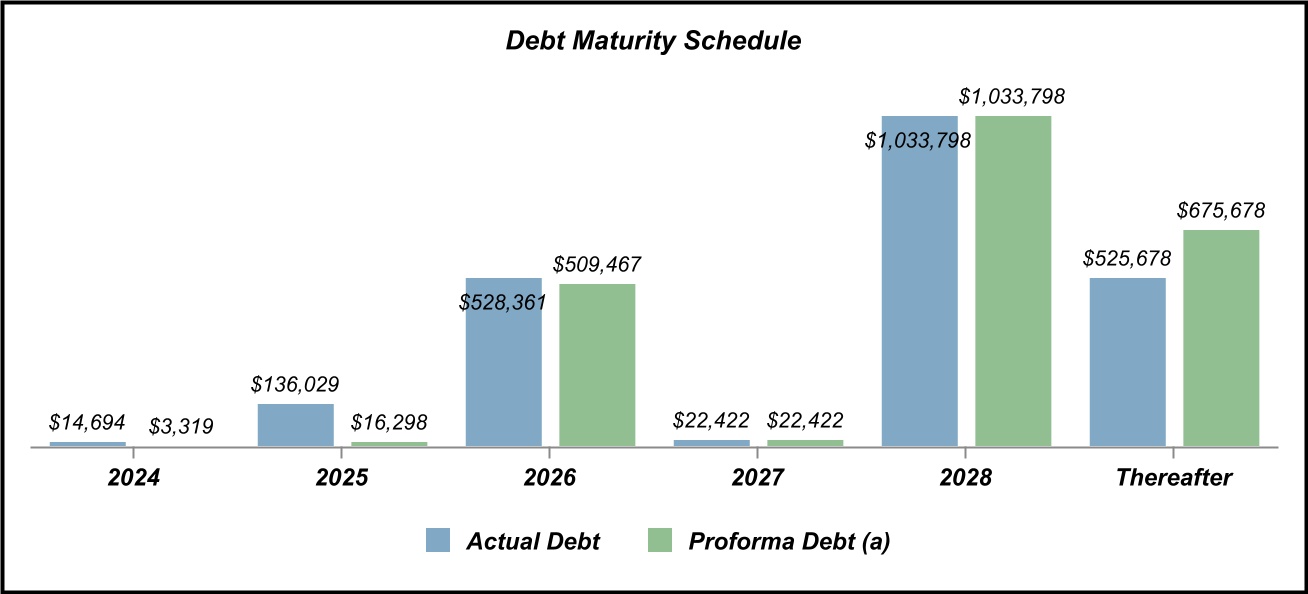
Debt Maturity, Debt Covenant & Unencumbered Asset Statistics |
26 | ||||
| Corporate Headquarters | 1835 Market Street, Suite 2601 | ||||
| Philadelphia, PA 19103 | |||||
| 267.270.4800 | |||||
| Trading Symbol | NYSE: “IRT” | ||||
| Investor Relations Contact | Edelman Smithfield | ||||
| Ted McHugh and Lauren Torres | |||||
| 917-365-7979 | |||||
IRT@edelman.com |
|||||
|
Three Months Ended
September 30, 2024 Compared to Three Months Ended
September 30, 2023 |
Nine Months Ended
September 30, 2024 Compared to
Nine Months Ended September 30, 2023
|
|||||||
| Rental and other property revenue | 2.5% increase | 3.1% increase | ||||||
| Property operating expenses | 2.8% increase | 4.2% increase | ||||||
| NOI | 2.2% increase | 2.5% increase | ||||||
| Portfolio average occupancy | 90 bps increase to 95.4% | 110 bps increase to 95.1% | ||||||
| Portfolio average rental rate | 1.2% increase to $1,566 | 1.4% increase to $1,557 | ||||||
| NOI Margin | 10 bps decrease to 62.3% | 40 bps decrease to 62.2% | ||||||
| 3Q 2024 | Oct 2024(3) |
||||||||||
Same-Store Portfolio(1) |
|||||||||||
| Average Occupancy | 95.4 | % | 95.6 | % | (4) |
||||||
Lease Over Lease Effective Rental Rate Growth:(2) |
|||||||||||
| New Leases | (3.6) | % | (4.2) | % | |||||||
| Renewal Leases | 3.8 | % | 5.0 | % | |||||||
| Blended | 0.8 | % | 0.5 | % | |||||||
| Resident Retention Rate | 57.0 | % | 50.8 | % | |||||||
| Same-Store Portfolio excluding Ongoing Value Add | |||||||||||
| Average Occupancy | 95.9 | % | 95.9 | % | (4) |
||||||
Lease Over Lease Effective Rental Rate Growth:(2) |
|||||||||||
| New Leases | (4.0) | % | (4.4) | % | |||||||
| Renewal Leases | 3.7 | % | 5.1 | % | |||||||
| Blended | 0.6 | % | 0.3 | % | |||||||
| Resident Retention Rate | 57.6 | % | 50.3 | % | |||||||
| Value Add (26 properties with Ongoing Value Add) | |||||||||||
| Average Occupancy | 94.3 | % | 94.7 | % | (4) |
||||||
Lease Over Lease Effective Rental Rate Growth:(2) |
|||||||||||
| New Leases | (2.6) | % | (3.5) | % | |||||||
| Renewal Leases | 3.9 | % | 5.0 | % | |||||||
| Blended | 1.1 | % | 0.9 | % | |||||||
| Resident Retention Rate | 55.6 | % | 52.3 | % | |||||||
| Previous Guidance | Current Guidance | Change at Midpoint | ||||||||||||||||||||||||||||||
2024 Full Year EPS and CFFO Guidance(1)(2) |
Low | High | Low | High | ||||||||||||||||||||||||||||
| Earnings per share | $ | 0.36 | $ | 0.38 | $ | 0.295 | $ | 0.305 | $ | (0.07) | ||||||||||||||||||||||
| Adjustments: | ||||||||||||||||||||||||||||||||
Depreciation and amortization |
0.87 | 0.87 | 0.95 | 0.95 | 0.08 | |||||||||||||||||||||||||||
Gain on sale of real estate assets(3) |
(0.05) | (0.05) | (0.05) | (0.05) | — | — | ||||||||||||||||||||||||||
| FFO per share | 1.18 | 1.20 | 1.195 | 1.205 | 0.01 | |||||||||||||||||||||||||||
| Loan (premium accretion) discount amortization, net | (0.04) | (0.04) | (0.04) | (0.04) | — | |||||||||||||||||||||||||||
| CFFO per share | $ | 1.14 | $ | 1.16 | $ | 1.155 | $ | 1.165 | $ | 0.01 | ||||||||||||||||||||||
| Same-Store Portfolio | Previous 2024 Outlook(1) |
Current 2024 Outlook(1) |
Change at Midpoint | ||||||||
| Number of properties/units | 108 properties / 32,153 units | 108 properties / 32,153 units | — | ||||||||
| Property revenue growth | 3.0% to 3.3% | 3.0% to 3.2% | (0.05)% | ||||||||
| Controllable operating expense growth | 4.0% to 4.5% | 5.4% to 6.2% | 1.55% | ||||||||
| Real estate tax and insurance expense growth | 0.5% to 1.7% | (1.3%) to (0.7%) | (2.1)% | ||||||||
| Total operating expense growth | 2.6% to 3.4% | 2.8% to 3.2% | — | ||||||||
| NOI growth | 2.7% to 3.7% | 2.9% to 3.5% | — | ||||||||
| Corporate Expenses | |||||||||||
| General and administrative & property management expenses |
$52.5 million to $53.5 million | $52.5 million to $53.5 million | — | ||||||||
Interest expense(2) |
$83.0 million to $84.0 million | $83.0 million to $84.0 million | — | ||||||||
Transaction/Investment Volume(3) |
|||||||||||
| Acquisition volume | $80 to $82 million | $264 million to $268 million | $185 million | ||||||||
| Disposition volume | $395 million | $392 million to $396 million | — | ||||||||
| Capital Expenditures | |||||||||||
| Recurring | $21.0 million to $23.0 million | $22.5 million to $23.5 million | $1.0 million | ||||||||
| Value add & non-recurring | $76.0 million to $78.0 million | $76.0 million to $78.0 million | — | ||||||||
| Development | $54.5 million to $55.5 million | $54.5 million to $55.5 million | — | ||||||||
| For the Three Months Ended | |||||||||||||||||||||||||||||
| Sep 30, 2024 | Jun 30, 2024 | Mar 31, 2024 | Dec 31, 2023 | Sep 30, 2023 | |||||||||||||||||||||||||
| Selected Financial Information: | |||||||||||||||||||||||||||||
| Operating Statistics: | |||||||||||||||||||||||||||||
| Net income (loss) available to common shares | $12,365 | $10,354 | $17,577 | $(40,515) | $3,930 | ||||||||||||||||||||||||
| Earnings (loss) per share -- diluted | $0.05 | $0.05 | $0.08 | $(0.18) | $0.02 | ||||||||||||||||||||||||
| Rental and other property revenue | $159,860 | $158,104 | $160,331 | $166,730 | $168,375 | ||||||||||||||||||||||||
| Property operating expenses | $60,538 | $60,883 | $59,971 | $59,703 | $63,300 | ||||||||||||||||||||||||
| NOI | $99,322 | $97,221 | $100,360 | $107,027 | $105,075 | ||||||||||||||||||||||||
| NOI margin | 62.1% | 61.5% | 62.6% | 64.2% | 62.4% | ||||||||||||||||||||||||
| Adjusted EBITDA | $87,453 | $83,609 | $84,683 | $95,640 | $94,415 | ||||||||||||||||||||||||
| FFO per share | $0.30 | $0.28 | $0.27 | $0.31 | $0.31 | ||||||||||||||||||||||||
| CFFO per share | $0.29 | $0.28 | $0.27 | $0.30 | $0.30 | ||||||||||||||||||||||||
| Dividends per share | $0.16 | $0.16 | $0.16 | $0.16 | $0.16 | ||||||||||||||||||||||||
| CFFO payout ratio | 55.2% | 57.1% | 59.3% | 53.3% | 53.3% | ||||||||||||||||||||||||
| Portfolio Data: | |||||||||||||||||||||||||||||
| Total gross assets | $6,733,864 | $6,684,029 | $6,673,589 | $6,960,554 | $7,225,447 | ||||||||||||||||||||||||
| Total number of operating properties (a) | 110 | 110 | 111 | 116 | 120 | ||||||||||||||||||||||||
| Total units (a) | 32,670 | 32,685 | 32,877 | 34,431 | 35,427 | ||||||||||||||||||||||||
| Portfolio period end occupancy (a) | 95.5% | 95.5% | 95.0% | 94.6% | 94.4% | ||||||||||||||||||||||||
| Portfolio average occupancy (a) | 95.4% | 95.3% | 94.4% | 94.4% | 94.6% | ||||||||||||||||||||||||
| Portfolio average effective monthly rent, per unit (a) | $1,572 | $1,554 | $1,550 | $1,558 | $1,556 | ||||||||||||||||||||||||
| Same-store portfolio period end occupancy (b) | 95.5% | 95.5% | 95.0% | 94.7% | 94.4% | ||||||||||||||||||||||||
| Same-store portfolio average occupancy (b) | 95.4% | 95.4% | 94.4% | 94.5% | 94.5% | ||||||||||||||||||||||||
| Same-store portfolio average effective monthly rent, per unit (b) |
$1,566 | $1,555 | $1,551 | $1,555 | $1,548 | ||||||||||||||||||||||||
| Capitalization: | |||||||||||||||||||||||||||||
| Total debt (c) | $2,286,694 | $2,252,559 | $2,277,098 | $2,549,409 | $2,715,710 | ||||||||||||||||||||||||
| Common share price, period end | $20.50 | $18.74 | $16.13 | $15.30 | $14.07 | ||||||||||||||||||||||||
| Market equity capitalization | $4,736,212 | $4,330,137 | $3,726,224 | $3,528,996 | $3,245,135 | ||||||||||||||||||||||||
| Total market capitalization | $7,022,906 | $6,582,696 | $6,003,322 | $6,078,405 | $5,960,845 | ||||||||||||||||||||||||
| Total debt/total gross assets | 34.0% | 33.7% | 34.1% | 36.6% | 37.6% | ||||||||||||||||||||||||
| Net debt to Adjusted EBITDA (d) | 6.3x | 6.5x | 6.7x | 6.7x | 7.0x | ||||||||||||||||||||||||
| Interest coverage | 4.8x | 4.8x | 4.1x | 4.1x | 4.3x | ||||||||||||||||||||||||
| Common shares and OP Units: | |||||||||||||||||||||||||||||
| Shares outstanding | 225,093,090 | 225,122,235 | 225,070,396 | 224,706,731 | 224,695,566 | ||||||||||||||||||||||||
| OP units outstanding | 5,941,643 | 5,941,643 | 5,941,643 | 5,946,571 | 5,946,571 | ||||||||||||||||||||||||
| Common shares and OP units outstanding | 231,034,733 | 231,063,878 | 231,012,039 | 230,653,302 | 230,642,137 | ||||||||||||||||||||||||
| Weighted average common shares and OP units | 230,762,299 | 230,734,872 | 230,570,707 | 230,452,570 | 230,444,945 | ||||||||||||||||||||||||
| As of | |||||||||||||||||||||||||||||
| Sep 30, 2024 | Jun 30, 2024 | Mar 31, 2024 | Dec 31, 2023 | Sep 30, 2023 | |||||||||||||||||||||||||
| Assets: | |||||||||||||||||||||||||||||
| Real estate held for investment, at cost | $ | 6,341,504 | $ | 6,218,019 | $ | 6,183,009 | $ | 6,259,212 | $ | 6,754,022 | |||||||||||||||||||
| Less: accumulated depreciation | (715,702) | (667,681) | (622,713) | (582,760) | (567,200) | ||||||||||||||||||||||||
| Real estate held for investment, net | 5,625,802 | 5,550,338 | 5,560,296 | 5,676,452 | 6,186,822 | ||||||||||||||||||||||||
| Real estate held for sale | — | 69,829 | 98,603 | 296,334 | 75,392 | ||||||||||||||||||||||||
| Real estate under development | 115,221 | 115,196 | 109,338 | 98,365 | 83,547 | ||||||||||||||||||||||||
| Cash and cash equivalents | 17,611 | 21,034 | 21,275 | 22,852 | 17,216 | ||||||||||||||||||||||||
| Restricted cash | 30,632 | 26,364 | 20,625 | 27,880 | 31,772 | ||||||||||||||||||||||||
| Investment in unconsolidated real estate entities | 95,393 | 90,347 | 89,487 | 89,044 | 87,592 | ||||||||||||||||||||||||
| Other assets | 43,566 | 28,731 | 34,379 | 39,245 | 41,926 | ||||||||||||||||||||||||
| Derivative assets | 18,821 | 38,422 | 38,845 | 29,937 | 53,258 | ||||||||||||||||||||||||
| Intangible assets, net | 1,158 | — | — | 66 | 265 | ||||||||||||||||||||||||
| Total assets | $ | 5,948,204 | $ | 5,940,261 | $ | 5,972,848 | $ | 6,280,175 | $ | 6,577,790 | |||||||||||||||||||
| Liabilities and Equity: | |||||||||||||||||||||||||||||
| Indebtedness, net | $ | 2,286,694 | $ | 2,202,961 | $ | 2,212,273 | $ | 2,426,788 | $ | 2,675,117 | |||||||||||||||||||
| Indebtedness associated with real estate held for sale, net |
— | 49,598 | 64,825 | 122,621 | 40,593 | ||||||||||||||||||||||||
| Accounts payable and accrued expenses | 119,286 | 102,040 | 83,678 | 109,074 | 138,549 | ||||||||||||||||||||||||
| Accrued interest payable | 6,858 | 6,795 | 7,145 | 7,917 | 8,275 | ||||||||||||||||||||||||
| Dividends payable | 36,906 | 36,906 | 36,896 | 36,858 | 36,858 | ||||||||||||||||||||||||
| Derivative liabilities | 1,779 | — | — | — | — | ||||||||||||||||||||||||
| Other liabilities | 7,966 | 8,421 | 8,928 | 9,723 | 10,642 | ||||||||||||||||||||||||
| Total liabilities | 2,459,489 | 2,406,721 | 2,413,745 | 2,712,981 | 2,910,034 | ||||||||||||||||||||||||
| Equity: | |||||||||||||||||||||||||||||
| Shareholders' Equity: | |||||||||||||||||||||||||||||
| Preferred shares, $0.01 par value per share | — | — | — | — | — | ||||||||||||||||||||||||
| Common shares, $0.01 par value per share | 2,250 | 2,251 | 2,251 | 2,247 | 2,247 | ||||||||||||||||||||||||
| Additional paid in capital | 3,755,311 | 3,754,756 | 3,753,833 | 3,751,942 | 3,751,001 | ||||||||||||||||||||||||
| Accumulated other comprehensive income | 13,835 | 34,380 | 34,501 | 25,513 | 47,910 | ||||||||||||||||||||||||
| Accumulated deficit | (416,223) | (392,627) | (367,015) | (348,405) | (271,982) | ||||||||||||||||||||||||
| Total shareholders' equity | 3,355,173 | 3,398,760 | 3,423,570 | 3,431,297 | 3,529,176 | ||||||||||||||||||||||||
| Noncontrolling Interests | 133,542 | 134,780 | 135,533 | 135,897 | 138,580 | ||||||||||||||||||||||||
| Total equity | 3,488,715 | 3,533,540 | 3,559,103 | 3,567,194 | 3,667,756 | ||||||||||||||||||||||||
| Total liabilities and equity | $ | 5,948,204 | $ | 5,940,261 | $ | 5,972,848 | $ | 6,280,175 | $ | 6,577,790 | |||||||||||||||||||
| For the Three Months Ended | |||||||||||||||||||||||||||||
| Sep 30, 2024 | Jun 30, 2024 | Mar 31, 2024 | Dec 31, 2023 | Sep 30, 2023 | |||||||||||||||||||||||||
| Revenue: | |||||||||||||||||||||||||||||
| Rental and other property revenue | $ | 159,860 | $ | 158,104 | $ | 160,331 | $ | 166,730 | $ | 168,375 | |||||||||||||||||||
| Other revenue | 275 | 298 | 203 | 316 | 232 | ||||||||||||||||||||||||
| Total revenue | 160,135 | 158,402 | 160,534 | 167,046 | 168,607 | ||||||||||||||||||||||||
| Expenses: | |||||||||||||||||||||||||||||
| Property operating expenses | 60,538 | 60,883 | 59,971 | 59,703 | 63,300 | ||||||||||||||||||||||||
| Property management expenses | 7,379 | 7,666 | 7,499 | 6,660 | 7,232 | ||||||||||||||||||||||||
| General and administrative expenses (a) | 4,765 | 6,244 | 8,381 | 5,043 | 3,660 | ||||||||||||||||||||||||
| Depreciation and amortization expense | 55,261 | 54,127 | 53,721 | 55,902 | 55,546 | ||||||||||||||||||||||||
| Casualty losses | 1,249 | 465 | 2,301 | 59 | 35 | ||||||||||||||||||||||||
| Total expenses | 129,192 | 129,385 | 131,873 | 127,367 | 129,773 | ||||||||||||||||||||||||
| Interest expense | (18,308) | (17,460) | (20,603) | (23,537) | (22,033) | ||||||||||||||||||||||||
| Gain on sale (loss on impairment) of real estate assets, net |
688 | (152) | 10,530 | (56,263) | (11,268) | ||||||||||||||||||||||||
| Gain (loss) on extinguishment of debt | — | — | 203 | (124) | — | ||||||||||||||||||||||||
| Other loss | — | — | (1) | (79) | (369) | ||||||||||||||||||||||||
| (Loss) gain from investments in unconsolidated real estate entities |
(703) | (850) | (829) | (1,330) | (1,178) | ||||||||||||||||||||||||
| Net income (loss) | $ | 12,620 | $ | 10,555 | $ | 17,961 | $ | (41,654) | $ | 3,986 | |||||||||||||||||||
| (Income) loss allocated to noncontrolling interests | (255) | (201) | (384) | 1,139 | (56) | ||||||||||||||||||||||||
| Net income (loss) available to common shares | $ | 12,365 | $ | 10,354 | $ | 17,577 | $ | (40,515) | $ | 3,930 | |||||||||||||||||||
| Earnings (loss) per share - basic | $ | 0.05 | $ | 0.05 | $ | 0.08 | $ | (0.18) | $ | 0.02 | |||||||||||||||||||
| Weighted-average shares outstanding - Basic | 224,820,656 | 224,793,229 | 224,627,115 | 224,505,999 | 224,498,374 | ||||||||||||||||||||||||
| Earnings (loss) per share - diluted | $ | 0.05 | $ | 0.05 | $ | 0.08 | $ | (0.18) | $ | 0.02 | |||||||||||||||||||
| Weighted-average shares outstanding - Diluted | 226,058,400 | 225,418,825 | 225,226,270 | 224,505,999 | 225,140,555 | ||||||||||||||||||||||||
| Funds From Operations (FFO): | |||||||||||||||||||||||||||||
| Net income (loss) | $ | 12,620 | $ | 10,555 | $ | 17,961 | $ | (41,654) | $ | 3,986 | |||||||||||||||||||
| Add-Back (Deduct): | |||||||||||||||||||||||||||||
| Real estate depreciation and amortization | 54,880 | 53,757 | 53,390 | 55,510 | 55,217 | ||||||||||||||||||||||||
| Our share of real estate depreciation and amortization from investments in unconsolidated real estate entities |
598 | 598 | 598 | 636 | 486 | ||||||||||||||||||||||||
| Loss on impairment (gain on sale) of real estate assets, net, excluding prepayment gains |
160 | 336 | (9,609) | 57,492 | 11,268 | ||||||||||||||||||||||||
| FFO | $ | 68,258 | $ | 65,246 | $ | 62,340 | $ | 71,984 | $ | 70,957 | |||||||||||||||||||
| FFO per share | $ | 0.30 | $ | 0.28 | $ | 0.27 | $ | 0.31 | $ | 0.31 | |||||||||||||||||||
| CORE Funds From Operations (CFFO): | |||||||||||||||||||||||||||||
| FFO | $ | 68,258 | $ | 65,246 | $ | 62,340 | $ | 71,984 | $ | 70,957 | |||||||||||||||||||
| Add-Back (Deduct): | |||||||||||||||||||||||||||||
| Other depreciation and amortization | 382 | 370 | 331 | 391 | 329 | ||||||||||||||||||||||||
| Casualty losses | 1,249 | 465 | 2,301 | 59 | 35 | ||||||||||||||||||||||||
| Loan (premium accretion) discount amortization, net |
(2,239) | (2,283) | (2,395) | (2,659) | (2,747) | ||||||||||||||||||||||||
| Prepayment (gains) penalties on asset dispositions | (848) | (184) | (921) | (1,229) | — | ||||||||||||||||||||||||
| (Gain) loss on extinguishment of debt | — | — | (203) | 124 | — | ||||||||||||||||||||||||
| Other expense | — | — | 1 | 79 | 429 | ||||||||||||||||||||||||
| CFFO | $ | 66,802 | $ | 63,614 | $ | 61,454 | $ | 68,749 | $ | 69,003 | |||||||||||||||||||
| CFFO per share | $ | 0.29 | $ | 0.28 | $ | 0.27 | $ | 0.30 | $ | 0.30 | |||||||||||||||||||
| Weighted-average shares and units outstanding |
230,762,299 | 230,734,872 | 230,570,707 | 230,452,570 | 230,444,945 | ||||||||||||||||||||||||
| For the Three Months Ended September 30, | For the Nine Months Ended September 30, |
||||||||||||||||||||||
| 2024 | 2023 | 2024 | 2023 | ||||||||||||||||||||
| Revenue: | |||||||||||||||||||||||
| Rental and other property revenue | $ | 159,860 | $ | 168,375 | $ | 478,296 | $ | 493,111 | |||||||||||||||
| Other revenue | 275 | 232 | 776 | 826 | |||||||||||||||||||
| Total revenue | 160,135 | 168,607 | 479,072 | 493,937 | |||||||||||||||||||
| Expenses: | |||||||||||||||||||||||
| Property operating expenses | 60,538 | 63,300 | 181,393 | 184,627 | |||||||||||||||||||
| Property management expenses | 7,379 | 7,232 | 22,544 | 20,421 | |||||||||||||||||||
| General and administrative expenses | 4,765 | 3,660 | 19,389 | 17,724 | |||||||||||||||||||
| Depreciation and amortization expense | 55,261 | 55,546 | 163,112 | 163,066 | |||||||||||||||||||
| Casualty losses | 1,249 | 35 | 4,015 | 866 | |||||||||||||||||||
| Total expenses | 129,192 | 129,773 | 390,453 | 386,704 | |||||||||||||||||||
| Interest expense | (18,308) | (22,033) | (56,371) | (66,383) | |||||||||||||||||||
| Gain on sale (loss on impairment) of real estate assets, net | 688 | (11,268) | 11,066 | (10,284) | |||||||||||||||||||
| Gain on extinguishment of debt | — | — | 203 | — | |||||||||||||||||||
| Other loss | — | (369) | (1) | (348) | |||||||||||||||||||
| Loss from investments in unconsolidated real estate entities | (703) | (1,178) | (2,382) | (3,158) | |||||||||||||||||||
| Restructuring costs | — | — | — | (3,213) | |||||||||||||||||||
| Net income | 12,620 | 3,986 | 41,134 | 23,847 | |||||||||||||||||||
| Income allocated to noncontrolling interests | (255) | (56) | (840) | (559) | |||||||||||||||||||
| Net income available to common shares | $ | 12,365 | $ | 3,930 | $ | 40,294 | $ | 23,288 | |||||||||||||||
| Earnings per share - basic | $ | 0.05 | $ | 0.02 | $ | 0.18 | $ | 0.10 | |||||||||||||||
| Weighted-average shares outstanding - Basic | 224,820,656 | 224,498,374 | 224,747,327 | 224,383,590 | |||||||||||||||||||
| Earnings per share - diluted | $ | 0.05 | $ | 0.02 | $ | 0.18 | $ | 0.10 | |||||||||||||||
| Weighted-average shares outstanding - Diluted | 226,058,400 | 225,140,555 | 225,530,265 | 225,103,475 | |||||||||||||||||||
| Funds From Operations (FFO): | |||||||||||||||||||||||
| Net income | $ | 12,620 | $ | 3,986 | $ | 41,134 | $ | 23,847 | |||||||||||||||
| Add-Back (Deduct): | |||||||||||||||||||||||
| Real estate depreciation and amortization | 54,880 | 55,217 | 162,028 | 162,205 | |||||||||||||||||||
| Our share of real estate depreciation and amortization from investments in unconsolidated real estate entities |
598 | 486 | 1,793 | 1,479 | |||||||||||||||||||
| Loss on impairment (gain on sale) of real estate assets, net, excluding prepayment gains |
160 | 11,268 | (9,113) | 10,954 | |||||||||||||||||||
| FFO | $ | 68,258 | $ | 70,957 | $ | 195,842 | $ | 198,485 | |||||||||||||||
| FFO per share | $ | 0.30 | $ | 0.31 | $ | 0.85 | $ | 0.86 | |||||||||||||||
| CORE Funds From Operations (CFFO): | |||||||||||||||||||||||
| FFO | $ | 68,258 | $ | 70,957 | $ | 195,842 | $ | 198,485 | |||||||||||||||
| Add-Back (Deduct): | |||||||||||||||||||||||
| Other depreciation and amortization | 382 | 329 | 1,083 | 860 | |||||||||||||||||||
| Casualty losses | 1,249 | 35 | 4,015 | 866 | |||||||||||||||||||
| Loan (premium accretion) discount amortization, net | (2,239) | (2,747) | (6,918) | (8,239) | |||||||||||||||||||
| Prepayment (gains) penalties on asset dispositions | (848) | — | (1,953) | (670) | |||||||||||||||||||
| Gain on extinguishment of debt | — | — | (203) | — | |||||||||||||||||||
| Other expense | — | 429 | 1 | 663 | |||||||||||||||||||
| Restructuring costs | — | — | — | 3,213 | |||||||||||||||||||
| CFFO | $ | 66,802 | $ | 69,003 | $ | 191,867 | $ | 195,178 | |||||||||||||||
| CFFO per share | $ | 0.29 | $ | 0.30 | $ | 0.83 | $ | 0.85 | |||||||||||||||
| Weighted-average shares and units outstanding | 230,762,299 | 230,444,945 | 230,689,617 | 230,334,398 | |||||||||||||||||||
| Three Months Ended | |||||||||||||||||||||||||||||
| Sep 30, 2024 | Jun 30, 2024 | Mar 31, 2024 | Dec 31, 2023 | Sep 30, 2023 | |||||||||||||||||||||||||
| Net income (loss) | $ | 12,620 | $ | 10,555 | $ | 17,961 | $ | (41,654) | $ | 3,986 | |||||||||||||||||||
| Add-Back (Deduct): | |||||||||||||||||||||||||||||
| Interest expense | 18,308 | 17,460 | 20,603 | 23,537 | 22,033 | ||||||||||||||||||||||||
| Depreciation and amortization | 55,261 | 54,127 | 53,721 | 55,902 | 55,546 | ||||||||||||||||||||||||
| Casualty losses | 1,249 | 465 | 2,301 | 59 | 35 | ||||||||||||||||||||||||
| (Gain on sale) loss on impairment of real estate assets, net |
(688) | 152 | (10,530) | 56,263 | 11,268 | ||||||||||||||||||||||||
| (Gain) loss on extinguishment of debt | — | — | (203) | 124 | — | ||||||||||||||||||||||||
| Loss from investments in unconsolidated real estate entities |
703 | 850 | 829 | 1,330 | 1,178 | ||||||||||||||||||||||||
| Other loss | — | — | 1 | 79 | 369 | ||||||||||||||||||||||||
| Adjusted EBITDA | $ | 87,453 | $ | 83,609 | $ | 84,683 | $ | 95,640 | $ | 94,415 | |||||||||||||||||||
| INTEREST COST: | |||||||||||||||||||||||||||||
| Interest expense | $ | 18,308 | $ | 17,460 | $ | 20,603 | $ | 23,537 | $ | 22,033 | |||||||||||||||||||
| INTEREST COVERAGE: | 4.8x | 4.8x | 4.1x | 4.1x | 4.3x | ||||||||||||||||||||||||
| For the Three Months Ended September 30, | For the Nine Months Ended September 30, | ||||||||||||||||||||||
| 2024 | 2023 | 2024 | 2023 | ||||||||||||||||||||
| Net income (loss) | $ | 12,620 | $ | 3,986 | $ | 41,134 | $ | 23,847 | |||||||||||||||
| Add-Back (Deduct): | |||||||||||||||||||||||
| Interest expense | 18,308 | 22,033 | 56,371 | 66,383 | |||||||||||||||||||
| Depreciation and amortization | 55,261 | 55,546 | 163,112 | 163,066 | |||||||||||||||||||
| Casualty losses | 1,249 | 35 | 4,015 | 866 | |||||||||||||||||||
| (Gain on sale) loss on impairment of real estate assets, net | (688) | 11,268 | (11,066) | 10,284 | |||||||||||||||||||
| Gain on extinguishment of debt | — | — | (203) | — | |||||||||||||||||||
| Loss from investments in unconsolidated real estate entities | 703 | 1,178 | 2,382 | 3,159 | |||||||||||||||||||
| Other loss | — | 369 | 1 | 348 | |||||||||||||||||||
| Restructuring costs | — | — | — | 3,213 | |||||||||||||||||||
| Adjusted EBITDA | $ | 87,453 | $ | 94,415 | $ | 255,746 | $ | 271,166 | |||||||||||||||
| INTEREST COST: | |||||||||||||||||||||||
| Interest expense | $ | 18,308 | $ | 22,033 | $ | 56,371 | $ | 66,383 | |||||||||||||||
| INTEREST COVERAGE: | 4.8x | 4.3x | 4.5x | 4.1x | |||||||||||||||||||
| For the Three Months Ended | |||||||||||||||||||||||||||||
| Sep 30, 2024 | Jun 30, 2024 | Mar 31, 2024 | Dec 31, 2023 | Sep 30, 2023 | |||||||||||||||||||||||||
| Revenue: | |||||||||||||||||||||||||||||
| Rental and other property revenue | $ | 155,888 | $ | 153,969 | $ | 150,618 | $ | 150,903 | $ | 152,138 | |||||||||||||||||||
| Property Operating Expenses: | |||||||||||||||||||||||||||||
| Real estate taxes | 16,848 | 18,626 | 18,970 | 18,463 | 18,503 | ||||||||||||||||||||||||
| Property insurance | 3,912 | 4,014 | 4,150 | 4,255 | 4,075 | ||||||||||||||||||||||||
| Personnel expenses | 13,433 | 12,806 | 12,199 | 11,741 | 12,007 | ||||||||||||||||||||||||
| Utilities | 8,300 | 7,460 | 7,713 | 7,419 | 7,719 | ||||||||||||||||||||||||
| Repairs and maintenance | 6,494 | 6,495 | 4,825 | 3,407 | 5,761 | ||||||||||||||||||||||||
| Contract services | 5,872 | 5,886 | 5,101 | 5,254 | 5,608 | ||||||||||||||||||||||||
| Advertising expenses | 2,312 | 2,065 | 1,596 | 1,616 | 1,915 | ||||||||||||||||||||||||
| Other expenses | 1,644 | 1,689 | 1,693 | 1,584 | 1,598 | ||||||||||||||||||||||||
| Total property operating expenses | 58,815 | 59,041 | 56,247 | 53,739 | 57,186 | ||||||||||||||||||||||||
| Same-store portfolio NOI | $ | 97,073 | $ | 94,928 | $ | 94,371 | $ | 97,164 | $ | 94,952 | |||||||||||||||||||
| Same-store portfolio NOI margin | 62.3 | % | 61.7 | % | 62.7 | % | 64.4 | % | 62.4 | % | |||||||||||||||||||
| Average occupancy | 95.4 | % | 95.4 | % | 94.4 | % | 94.5 | % | 94.5 | % | |||||||||||||||||||
| Average effective monthly rent, per unit | $ | 1,566 | $ | 1,555 | $ | 1,551 | $ | 1,555 | $ | 1,548 | |||||||||||||||||||
| For the Three Months Ended | |||||||||||||||||||||||||||||
| Sep 30, 2024 | Jun 30, 2024 | Mar 31, 2024 | Dec 31, 2023 | Sep 30, 2023 | |||||||||||||||||||||||||
| Rental and other property revenue | |||||||||||||||||||||||||||||
| Same-store portfolio | $ | 155,888 | $ | 153,969 | $ | 150,618 | $ | 150,903 | $ | 152,138 | |||||||||||||||||||
| Non same-store portfolio | 3,972 | 4,135 | 9,713 | 15,827 | 16,237 | ||||||||||||||||||||||||
| Total rental and other property revenue | 159,860 | 158,104 | 160,331 | 166,730 | 168,375 | ||||||||||||||||||||||||
| Property operating expenses | |||||||||||||||||||||||||||||
| Same-store portfolio | 58,815 | 59,041 | 56,247 | 53,739 | 57,186 | ||||||||||||||||||||||||
| Non same-store portfolio | 1,723 | 1,842 | 3,724 | 5,964 | 6,114 | ||||||||||||||||||||||||
| Total property operating expenses | 60,538 | 60,883 | 59,971 | 59,703 | 63,300 | ||||||||||||||||||||||||
| NOI | |||||||||||||||||||||||||||||
| Same-store portfolio | 97,073 | 94,928 | 94,371 | 97,164 | 94,952 | ||||||||||||||||||||||||
| Non same-store portfolio | 2,249 | 2,293 | 5,989 | 9,863 | 10,123 | ||||||||||||||||||||||||
| Total property NOI | $ | 99,322 | $ | 97,221 | $ | 100,360 | $ | 107,027 | $ | 105,075 | |||||||||||||||||||
| For the Three Months Ended September 30, |
For the Nine Months Ended September 30, |
||||||||||||||||||||||||||||||||||
| 2024 | 2023 | % change | 2024 | 2023 | % change | ||||||||||||||||||||||||||||||
| Revenue: | |||||||||||||||||||||||||||||||||||
| Rental and other property revenue | $ | 155,888 | $ | 152,138 | 2.5 | % | $ | 460,475 | $ | 446,484 | 3.1 | % | |||||||||||||||||||||||
| Property Operating Expenses: | |||||||||||||||||||||||||||||||||||
| Real estate taxes | 16,848 | 18,503 | (8.9) | % | 54,444 | 55,558 | (2.0) | % | |||||||||||||||||||||||||||
| Property insurance | 3,912 | 4,075 | (4.0) | % | 12,076 | 10,641 | 13.5 | % | |||||||||||||||||||||||||||
| Personnel expenses | 13,433 | 12,007 | 11.9 | % | 38,438 | 34,877 | 10.2 | % | |||||||||||||||||||||||||||
| Utilities | 8,300 | 7,719 | 7.5 | % | 23,473 | 22,135 | 6.0 | % | |||||||||||||||||||||||||||
| Repairs and maintenance | 6,494 | 5,761 | 12.7 | % | 17,814 | 17,204 | 3.5 | % | |||||||||||||||||||||||||||
| Contract services | 5,872 | 5,608 | 4.7 | % | 16,859 | 16,646 | 1.3 | % | |||||||||||||||||||||||||||
| Advertising expenses | 2,312 | 1,915 | 20.7 | % | 5,973 | 4,809 | 24.2 | % | |||||||||||||||||||||||||||
| Other expenses | 1,644 | 1,598 | 2.9 | % | 5,026 | 5,150 | (2.4) | % | |||||||||||||||||||||||||||
| Total property operating expenses | 58,815 | 57,186 | 2.8 | % | 174,103 | 167,020 | 4.2 | % | |||||||||||||||||||||||||||
| Same-store portfolio NOI | $ | 97,073 | $ | 94,952 | 2.2 | % | $ | 286,372 | $ | 279,464 | 2.5 | % | |||||||||||||||||||||||
| Same-store portfolio NOI margin | 62.3 | % | 62.4 | % | (0.1) | % | 62.2 | % | 62.6 | % | (0.4) | % | |||||||||||||||||||||||
| Average occupancy | 95.4 | % | 94.5 | % | 0.9 | % | 95.1 | % | 94.0 | % | 1.1 | % | |||||||||||||||||||||||
| Average effective monthly rent, per unit |
$ | 1,566 | $ | 1,548 | 1.2 | % | $ | 1,557 | $ | 1,536 | 1.4 | % | |||||||||||||||||||||||
| Rental and Other Property Revenue | Property Operating Expenses | Net Operating Income | Average Occupancy | Average Effective Monthly Rent per Unit | ||||||||||||||||||||||||||||||||||||||||||||||||||||||||||||||||||||||||||||||||||||||||||||||||||||
| Market | Number of Properties | Units | 2024 | 2023 | % Change | 2024 | 2023 | % Change | 2024 | 2023 | % Change | 2024 | 2023 | % Change | 2024 | 2023 | % Change | |||||||||||||||||||||||||||||||||||||||||||||||||||||||||||||||||||||||||||||||||||||||
| Dallas, TX | 14 | 4,007 | $ | 22,422 | $ | 21,994 | 1.9 | % | $ | 8,121 | $ | 8,579 | (5.3) | % | $ | 14,302 | $ | 13,415 | 6.6 | % | 95.6 | % | 94.7 | % | 0.9 | % | $ | 1,816 | $ | 1,807 | 0.5 | % | ||||||||||||||||||||||||||||||||||||||||||||||||||||||||||||||||||||||||
| Atlanta, GA | 13 | 5,180 | 24,636 | 24,912 | (1.1) | % | 10,404 | 9,279 | 12.1 | % | 14,228 | 15,635 | (9.0) | % | 94.2 | % | 92.3 | % | 1.9 | % | 1,599 | 1,643 | (2.7) | % | ||||||||||||||||||||||||||||||||||||||||||||||||||||||||||||||||||||||||||||||||
| Columbus, OH | 10 | 2,510 | 11,528 | 10,773 | 7.0 | % | 4,490 | 4,421 | 1.6 | % | 7,039 | 6,352 | 10.8 | % | 95.0 | % | 94.8 | % | 0.2 | % | 1,493 | 1,406 | 6.2 | % | ||||||||||||||||||||||||||||||||||||||||||||||||||||||||||||||||||||||||||||||||
| Indianapolis, IN | 7 | 1,979 | 8,910 | 8,370 | 6.5 | % | 3,110 | 3,551 | (12.4) | % | 5,800 | 4,819 | 20.4 | % | 96.6 | % | 94.0 | % | 2.6 | % | 1,420 | 1,366 | 4.0 | % | ||||||||||||||||||||||||||||||||||||||||||||||||||||||||||||||||||||||||||||||||
| Oklahoma City, OK | 8 | 2,147 | 8,427 | 7,962 | 5.8 | % | 2,936 | 2,836 | 3.5 | % | 5,491 | 5,125 | 7.1 | % | 95.6 | % | 95.0 | % | 0.6 | % | 1,225 | 1,177 | 4.1 | % | ||||||||||||||||||||||||||||||||||||||||||||||||||||||||||||||||||||||||||||||||
| Tampa-St. Petersburg, FL | 5 | 1,452 | 8,449 | 8,117 | 4.1 | % | 2,967 | 2,993 | (0.9) | % | 5,482 | 5,124 | 7.0 | % | 95.3 | % | 94.5 | % | 0.8 | % | 1,871 | 1,825 | 2.5 | % | ||||||||||||||||||||||||||||||||||||||||||||||||||||||||||||||||||||||||||||||||
| Denver, CO | 6 | 1,397 | 7,779 | 7,535 | 3.2 | % | 2,626 | 2,548 | 3.1 | % | 5,153 | 4,986 | 3.3 | % | 96.6 | % | 95.6 | % | 1.0 | % | 1,765 | 1,733 | 1.8 | % | ||||||||||||||||||||||||||||||||||||||||||||||||||||||||||||||||||||||||||||||||
| Nashville, TN | 5 | 1,508 | 7,640 | 7,535 | 1.4 | % | 2,560 | 2,491 | 2.8 | % | 5,079 | 5,044 | 0.7 | % | 95.5 | % | 95.3 | % | 0.2 | % | 1,637 | 1,624 | 0.8 | % | ||||||||||||||||||||||||||||||||||||||||||||||||||||||||||||||||||||||||||||||||
| Raleigh - Durham, NC | 6 | 1,690 | 8,147 | 7,977 | 2.1 | % | 3,073 | 2,811 | 9.3 | % | 5,074 | 5,166 | (1.8) | % | 95.6 | % | 95.1 | % | 0.5 | % | 1,559 | 1,551 | 0.5 | % | ||||||||||||||||||||||||||||||||||||||||||||||||||||||||||||||||||||||||||||||||
| Memphis, TN | 4 | 1,383 | 6,273 | 6,327 | (0.9) | % | 2,259 | 2,196 | 2.9 | % | 4,014 | 4,130 | (2.8) | % | 93.3 | % | 93.6 | % | (0.3) | % | 1,524 | 1,521 | 0.2 | % | ||||||||||||||||||||||||||||||||||||||||||||||||||||||||||||||||||||||||||||||||
| Houston, TX | 5 | 1,308 | 5,987 | 5,831 | 2.7 | % | 2,660 | 2,668 | (0.3) | % | 3,328 | 3,163 | 5.2 | % | 96.8 | % | 96.2 | % | 0.6 | % | 1,439 | 1,400 | 2.8 | % | ||||||||||||||||||||||||||||||||||||||||||||||||||||||||||||||||||||||||||||||||
| Louisville, KY | 4 | 1,150 | 5,021 | 4,626 | 8.5 | % | 2,072 | 1,844 | 12.4 | % | 2,950 | 2,782 | 6.0 | % | 95.9 | % | 94.8 | % | 1.1 | % | 1,345 | 1,275 | 5.5 | % | ||||||||||||||||||||||||||||||||||||||||||||||||||||||||||||||||||||||||||||||||
| Lexington, KY | 3 | 886 | 4,047 | 3,833 | 5.6 | % | 1,223 | 1,194 | 2.4 | % | 2,824 | 2,639 | 7.0 | % | 96.8 | % | 97.6 | % | (0.8) | % | 1,397 | 1,310 | 6.6 | % | ||||||||||||||||||||||||||||||||||||||||||||||||||||||||||||||||||||||||||||||||
| Huntsville, AL | 3 | 873 | 4,129 | 4,151 | (0.5) | % | 1,459 | 1,469 | (0.7) | % | 2,671 | 2,682 | (0.4) | % | 96.1 | % | 96.2 | % | (0.1) | % | 1,500 | 1,522 | (1.4) | % | ||||||||||||||||||||||||||||||||||||||||||||||||||||||||||||||||||||||||||||||||
| Charlotte, NC | 3 | 714 | 3,787 | 3,855 | (1.8) | % | 1,201 | 1,066 | 12.7 | % | 2,586 | 2,789 | (7.3) | % | 95.9 | % | 95.5 | % | 0.4 | % | 1,732 | 1,767 | (2.0) | % | ||||||||||||||||||||||||||||||||||||||||||||||||||||||||||||||||||||||||||||||||
| Cincinnati, OH | 2 | 542 | 2,899 | 2,828 | 2.5 | % | 1,100 | 1,085 | 1.4 | % | 1,798 | 1,742 | 3.2 | % | 97.2 | % | 95.9 | % | 1.3 | % | 1,621 | 1,589 | 2.0 | % | ||||||||||||||||||||||||||||||||||||||||||||||||||||||||||||||||||||||||||||||||
| Myrtle Beach, SC - Wilmington, NC | 3 | 628 | 2,720 | 2,733 | (0.5) | % | 939 | 890 | 5.5 | % | 1,782 | 1,843 | (3.3) | % | 95.6 | % | 94.8 | % | 0.8 | % | 1,410 | 1,420 | (0.7) | % | ||||||||||||||||||||||||||||||||||||||||||||||||||||||||||||||||||||||||||||||||
| Birmingham, AL | 1 | 720 | 3,146 | 3,042 | 3.4 | % | 1,469 | 1,344 | 9.3 | % | 1,677 | 1,699 | (1.3) | % | 95.4 | % | 93.8 | % | 1.6 | % | 1,398 | 1,410 | (0.9) | % | ||||||||||||||||||||||||||||||||||||||||||||||||||||||||||||||||||||||||||||||||
| Greenville, SC | 1 | 702 | 2,663 | 2,607 | 2.1 | % | 1,056 | 941 | 12.2 | % | 1,607 | 1,667 | (3.6) | % | 95.2 | % | 94.3 | % | 0.9 | % | 1,303 | 1,279 | 1.9 | % | ||||||||||||||||||||||||||||||||||||||||||||||||||||||||||||||||||||||||||||||||
| Charleston, SC | 2 | 518 | 2,762 | 2,656 | 4.0 | % | 1,196 | 1,082 | 10.5 | % | 1,566 | 1,574 | (0.5) | % | 96.2 | % | 95.2 | % | 1.0 | % | 1,722 | 1,678 | 2.6 | % | ||||||||||||||||||||||||||||||||||||||||||||||||||||||||||||||||||||||||||||||||
| Orlando, FL | 1 | 297 | 1,690 | 1,636 | 3.3 | % | 686 | 659 | 4.1 | % | 1,004 | 977 | 2.8 | % | 96.0 | % | 93.2 | % | 2.8 | % | 1,785 | 1,816 | (1.7) | % | ||||||||||||||||||||||||||||||||||||||||||||||||||||||||||||||||||||||||||||||||
| Austin, TX | 1 | 256 | 1,406 | 1,373 | 2.4 | % | 596 | 585 | 1.9 | % | 810 | 788 | 2.8 | % | 94.2 | % | 92.3 | % | 1.9 | % | 1,801 | 1,804 | (0.2) | % | ||||||||||||||||||||||||||||||||||||||||||||||||||||||||||||||||||||||||||||||||
| San Antonio, TX | 1 | 306 | 1,420 | 1,465 | (3.1) | % | 612 | 654 | (6.4) | % | 808 | 811 | (0.4) | % | 97.4 | % | 96.6 | % | 0.8 | % | 1,456 | 1,480 | (1.6) | % | ||||||||||||||||||||||||||||||||||||||||||||||||||||||||||||||||||||||||||||||||
| Total / Weighted Average |
108 | 32,153 | $ | 155,888 | $ | 152,138 | 2.5 | % | $ | 58,815 | $ | 57,186 | 2.8 | % | $ | 97,073 | $ | 94,952 | 2.2 | % | 95.4 | % | 94.5 | % | 0.9 | % | $ | 1,566 | $ | 1,548 | 1.2 | % | ||||||||||||||||||||||||||||||||||||||||||||||||||||||||||||||||||||||||
| Rental and Other Property Revenue | Property Operating Expenses | Net Operating Income | Average Occupancy | Average Effective Monthly Rent per Unit | ||||||||||||||||||||||||||||||||||||||||||||||||||||||||||||||||||||||||||||||||||||||||||||||||||||
| Market | Number of Properties | Units | 2024 | 2023 | % Change | 2024 | 2023 | % Change | 2024 | 2023 | % Change | 2024 | 2023 | % Change | 2024 | 2023 | % Change | |||||||||||||||||||||||||||||||||||||||||||||||||||||||||||||||||||||||||||||||||||||||
| Atlanta, GA | 13 | 5,180 | $ | 72,708 | $ | 72,471 | 0.3 | % | $ | 29,216 | $ | 27,007 | 8.2 | % | $ | 43,496 | $ | 45,462 | (4.3) | % | 93.5 | % | 92.1 | % | 1.4 | % | $ | 1,610 | $ | 1,633 | (1.4) | % | ||||||||||||||||||||||||||||||||||||||||||||||||||||||||||||||||||||||||
| Dallas, TX | 14 | 4,007 | 66,628 | 64,949 | 2.6 | % | 25,714 | 25,899 | (0.7) | % | 40,914 | 39,050 | 4.8 | % | 95.2 | % | 94.2 | % | 1.0 | % | 1,816 | 1,794 | 1.2 | % | ||||||||||||||||||||||||||||||||||||||||||||||||||||||||||||||||||||||||||||||||
| Columbus, OH | 10 | 2,510 | 33,553 | 31,581 | 6.2 | % | 12,988 | 12,110 | 7.3 | % | 20,566 | 19,471 | 5.6 | % | 94.9 | % | 94.8 | % | 0.1 | % | 1,458 | 1,380 | 5.7 | % | ||||||||||||||||||||||||||||||||||||||||||||||||||||||||||||||||||||||||||||||||
| Indianapolis, IN | 7 | 1,979 | 26,268 | 24,588 | 6.8 | % | 9,858 | 9,643 | 2.2 | % | 16,410 | 14,945 | 9.8 | % | 96.1 | % | 93.8 | % | 2.3 | % | 1,398 | 1,349 | 3.6 | % | ||||||||||||||||||||||||||||||||||||||||||||||||||||||||||||||||||||||||||||||||
| Oklahoma City, OK | 8 | 2,147 | 24,514 | 23,223 | 5.6 | % | 8,432 | 8,056 | 4.7 | % | 16,082 | 15,167 | 6.0 | % | 95.2 | % | 93.5 | % | 1.7 | % | 1,206 | 1,169 | 3.2 | % | ||||||||||||||||||||||||||||||||||||||||||||||||||||||||||||||||||||||||||||||||
| Tampa-St. Petersburg, FL | 5 | 1,452 | 24,930 | 23,909 | 4.3 | % | 9,134 | 9,151 | (0.2) | % | 15,795 | 14,758 | 7.0 | % | 95.5 | % | 94.4 | % | 1.1 | % | 1,846 | 1,811 | 1.9 | % | ||||||||||||||||||||||||||||||||||||||||||||||||||||||||||||||||||||||||||||||||
| Denver, CO | 6 | 1,397 | 23,003 | 22,437 | 2.5 | % | 7,285 | 7,047 | 3.4 | % | 15,718 | 15,391 | 2.1 | % | 96.4 | % | 95.1 | % | 1.3 | % | 1,738 | 1,719 | 1.1 | % | ||||||||||||||||||||||||||||||||||||||||||||||||||||||||||||||||||||||||||||||||
| Raleigh - Durham, NC | 6 | 1,690 | 24,100 | 23,583 | 2.2 | % | 9,032 | 7,971 | 13.3 | % | 15,068 | 15,613 | (3.5) | % | 94.9 | % | 94.3 | % | 0.6 | % | 1,551 | 1,538 | 0.8 | % | ||||||||||||||||||||||||||||||||||||||||||||||||||||||||||||||||||||||||||||||||
| Nashville, TN | 5 | 1,508 | 22,711 | 21,796 | 4.2 | % | 7,737 | 7,588 | 2.0 | % | 14,974 | 14,209 | 5.4 | % | 95.1 | % | 93.2 | % | 1.9 | % | 1,635 | 1,605 | 1.9 | % | ||||||||||||||||||||||||||||||||||||||||||||||||||||||||||||||||||||||||||||||||
| Memphis, TN | 4 | 1,383 | 18,772 | 18,575 | 1.1 | % | 6,683 | 6,240 | 7.1 | % | 12,089 | 12,335 | (2.0) | % | 93.8 | % | 93.8 | % | — | % | 1,518 | 1,508 | 0.7 | % | ||||||||||||||||||||||||||||||||||||||||||||||||||||||||||||||||||||||||||||||||
| Houston, TX | 5 | 1,308 | 17,673 | 17,121 | 3.2 | % | 7,979 | 8,181 | (2.5) | % | 9,694 | 8,940 | 8.4 | % | 95.7 | % | 95.4 | % | 0.3 | % | 1,433 | 1,394 | 2.8 | % | ||||||||||||||||||||||||||||||||||||||||||||||||||||||||||||||||||||||||||||||||
| Louisville, KY | 4 | 1,150 | 14,706 | 13,544 | 8.6 | % | 6,126 | 5,722 | 7.1 | % | 8,579 | 7,822 | 9.7 | % | 95.8 | % | 93.5 | % | 2.3 | % | 1,319 | 1,277 | 3.3 | % | ||||||||||||||||||||||||||||||||||||||||||||||||||||||||||||||||||||||||||||||||
| Lexington, KY | 3 | 886 | 11,791 | 11,179 | 5.5 | % | 3,659 | 3,441 | 6.3 | % | 8,132 | 7,739 | 5.1 | % | 97.0 | % | 96.8 | % | 0.2 | % | 1,360 | 1,285 | 5.8 | % | ||||||||||||||||||||||||||||||||||||||||||||||||||||||||||||||||||||||||||||||||
| Huntsville, AL | 3 | 873 | 12,206 | 12,250 | (0.4) | % | 4,363 | 4,282 | 1.9 | % | 7,842 | 7,968 | (1.6) | % | 95.7 | % | 95.3 | % | 0.4 | % | 1,498 | 1,538 | (2.6) | % | ||||||||||||||||||||||||||||||||||||||||||||||||||||||||||||||||||||||||||||||||
| Charlotte, NC | 3 | 714 | 11,369 | 11,461 | (0.8) | % | 3,597 | 3,343 | 7.6 | % | 7,772 | 8,117 | (4.3) | % | 95.4 | % | 95.5 | % | (0.1) | % | 1,741 | 1,761 | (1.1) | % | ||||||||||||||||||||||||||||||||||||||||||||||||||||||||||||||||||||||||||||||||
| Myrtle Beach, SC - Wilmington, NC | 3 | 628 | 8,151 | 8,024 | 1.6 | % | 2,721 | 2,508 | 8.5 | % | 5,430 | 5,516 | (1.6) | % | 95.2 | % | 95.0 | % | 0.2 | % | 1,411 | 1,410 | 0.1 | % | ||||||||||||||||||||||||||||||||||||||||||||||||||||||||||||||||||||||||||||||||
| Cincinnati, OH | 2 | 542 | 8,499 | 8,057 | 5.5 | % | 3,204 | 3,042 | 5.3 | % | 5,294 | 5,015 | 5.6 | % | 96.2 | % | 94.3 | % | 1.9 | % | 1,603 | 1,563 | 2.6 | % | ||||||||||||||||||||||||||||||||||||||||||||||||||||||||||||||||||||||||||||||||
| Birmingham, AL | 1 | 720 | 9,216 | 9,087 | 1.4 | % | 4,030 | 3,837 | 5.0 | % | 5,186 | 5,250 | (1.2) | % | 94.8 | % | 93.7 | % | 1.1 | % | 1,401 | 1,406 | (0.4) | % | ||||||||||||||||||||||||||||||||||||||||||||||||||||||||||||||||||||||||||||||||
| Greenville, SC | 1 | 702 | 7,948 | 7,772 | 2.3 | % | 3,104 | 2,898 | 7.1 | % | 4,844 | 4,874 | (0.6) | % | 94.3 | % | 94.0 | % | 0.3 | % | 1,306 | 1,259 | 3.7 | % | ||||||||||||||||||||||||||||||||||||||||||||||||||||||||||||||||||||||||||||||||
| Charleston, SC | 2 | 518 | 8,204 | 7,779 | 5.5 | % | 3,478 | 3,244 | 7.2 | % | 4,725 | 4,535 | 4.2 | % | 96.2 | % | 94.6 | % | 1.6 | % | 1,704 | 1,638 | 4.0 | % | ||||||||||||||||||||||||||||||||||||||||||||||||||||||||||||||||||||||||||||||||
| Orlando, FL | 1 | 297 | 4,993 | 4,705 | 6.1 | % | 2,146 | 1,998 | 7.4 | % | 2,847 | 2,707 | 5.2 | % | 94.6 | % | 93.1 | % | 1.5 | % | 1,794 | 1,801 | (0.4) | % | ||||||||||||||||||||||||||||||||||||||||||||||||||||||||||||||||||||||||||||||||
| San Antonio, TX | 1 | 306 | 4,293 | 4,352 | (1.4) | % | 1,829 | 2,001 | (8.6) | % | 2,464 | 2,350 | 4.9 | % | 96.9 | % | 96.1 | % | 0.8 | % | 1,469 | 1,484 | (1.0) | % | ||||||||||||||||||||||||||||||||||||||||||||||||||||||||||||||||||||||||||||||||
| Austin, TX | 1 | 256 | 4,239 | 4,041 | 4.9 | % | 1,788 | 1,811 | (1.3) | % | 2,451 | 2,230 | 9.9 | % | 94.6 | % | 91.3 | % | 3.3 | % | 1,804 | 1,786 | 1.0 | % | ||||||||||||||||||||||||||||||||||||||||||||||||||||||||||||||||||||||||||||||||
| Total/Weighted Average | 108 | 32,153 | $ | 460,475 | $ | 446,484 | 3.1 | % | $ | 174,103 | $ | 167,020 | 4.2 | % | $ | 286,372 | $ | 279,464 | 2.5 | % | 95.1 | % | 94.0 | % | 1.1 | % | $ | 1,557 | $ | 1,536 | 1.4 | % | ||||||||||||||||||||||||||||||||||||||||||||||||||||||||||||||||||||||||
| For the Three Months Ended September 30, 2024 |
||||||||||||||||||||||||||||||||||||||||||||
| Market | Number of Properties | Units | Gross Real Estate Assets |
Period End Occupancy |
Average Effective Monthly Rent per Unit |
NOI | % of NOI | |||||||||||||||||||||||||||||||||||||
| Dallas, TX | 14 | 4,007 | $ | 878,370 | 95.9 | % | $ | 1,814 | $ | 14,302 | 14.6 | % | ||||||||||||||||||||||||||||||||
| Atlanta, GA | 13 | 5,180 | 1,105,871 | 94.7 | % | 1,611 | 14,230 | 14.5 | % | |||||||||||||||||||||||||||||||||||
| Columbus, OH | 10 | 2,510 | 380,942 | 95.4 | % | 1,493 | 7,038 | 7.2 | % | |||||||||||||||||||||||||||||||||||
| Tampa-St. Petersburg, FL | 6 | 1,791 | 399,952 | 96.0 | % | 1,935 | 6,186 | 6.3 | % | |||||||||||||||||||||||||||||||||||
| Indianapolis, IN | 7 | 1,979 | 294,218 | 96.3 | % | 1,410 | 5,800 | 5.9 | % | |||||||||||||||||||||||||||||||||||
| Oklahoma City, OK | 8 | 2,147 | 336,327 | 95.4 | % | 1,231 | 5,491 | 5.6 | % | |||||||||||||||||||||||||||||||||||
| Denver, CO (a)(b) | 6 | 1,397 | 383,151 | 95.2 | % | 1,758 | 5,153 | 5.2 | % | |||||||||||||||||||||||||||||||||||
| Nashville, TN | 5 | 1,508 | 374,955 | 95.2 | % | 1,637 | 5,079 | 5.2 | % | |||||||||||||||||||||||||||||||||||
| Raleigh - Durham, NC | 6 | 1,690 | 254,852 | 95.8 | % | 1,564 | 5,074 | 5.2 | % | |||||||||||||||||||||||||||||||||||
| Memphis, TN | 4 | 1,383 | 161,612 | 92.7 | % | 1,499 | 4,014 | 4.1 | % | |||||||||||||||||||||||||||||||||||
| Houston, TX | 5 | 1,308 | 214,719 | 96.9 | % | 1,447 | 3,327 | 3.4 | % | |||||||||||||||||||||||||||||||||||
| Huntsville, AL | 4 | 1,051 | 241,911 | 94.7 | % | 1,478 | 3,182 | 3.2 | % | |||||||||||||||||||||||||||||||||||
| Louisville, KY | 4 | 1,150 | 145,676 | 96.6 | % | 1,341 | 2,950 | 3.0 | % | |||||||||||||||||||||||||||||||||||
| Lexington, KY | 3 | 886 | 162,903 | 95.9 | % | 1,390 | 2,823 | 2.9 | % | |||||||||||||||||||||||||||||||||||
| Charlotte, NC | 3 | 714 | 189,924 | 96.8 | % | 1,732 | 2,586 | 2.6 | % | |||||||||||||||||||||||||||||||||||
| Cincinnati, OH | 2 | 542 | 124,467 | 98.3 | % | 1,613 | 1,799 | 1.8 | % | |||||||||||||||||||||||||||||||||||
| Myrtle Beach, SC - Wilmington, NC | 3 | 628 | 68,530 | 94.7 | % | 1,408 | 1,781 | 1.8 | % | |||||||||||||||||||||||||||||||||||
| Birmingham, AL | 1 | 720 | 143,552 | 95.1 | % | 1,411 | 1,677 | 1.7 | % | |||||||||||||||||||||||||||||||||||
| Greenville, SC | 1 | 702 | 125,999 | 95.7 | % | 1,317 | 1,607 | 1.6 | % | |||||||||||||||||||||||||||||||||||
| Charleston, SC | 2 | 518 | 82,185 | 96.3 | % | 1,709 | 1,566 | 1.6 | % | |||||||||||||||||||||||||||||||||||
| Orlando, FL | 1 | 297 | 50,853 | 95.9 | % | 1,831 | 1,004 | 1.0 | % | |||||||||||||||||||||||||||||||||||
| Austin, TX | 1 | 256 | 60,628 | 95.3 | % | 1,795 | 810 | 0.8 | % | |||||||||||||||||||||||||||||||||||
| San Antonio, TX | 1 | 306 | 57,514 | 98.0 | % | 1,468 | 808 | 0.8 | % | |||||||||||||||||||||||||||||||||||
| Total / Weighted Average | 110 | 32,670 | $ | 6,239,111 | 95.5 | % | $ | 1,572 | $ | 98,287 | 100.0 | % | ||||||||||||||||||||||||||||||||
| Renovation Costs per Unit (b) | |||||||||||||||||||||||||||||||||||
| Market | Total Properties | Total Units To Be Renovated |
Units Complete | Units Leased |
Rent Premium (a) | % Rent Increase | Interior | Exterior | Total | ROI - Interior Costs(c) | ROI - Total Costs (c) | ||||||||||||||||||||||||
| Ongoing | |||||||||||||||||||||||||||||||||||
| Atlanta, GA | 5 | 2,344 | 1,108 | 1,105 | $ | 259 | 18.9 | % | $ | 18,539 | $ | 2,283 | $ | 20,822 | 16.8 | % | 14.9 | % | |||||||||||||||||
| Dallas, TX | 5 | 1,462 | 780 | 804 | 278 | 19.3 | % | 19,213 | 2,226 | 21,439 | 17.4 | % | 15.6 | % | |||||||||||||||||||||
| Columbus, OH | 4 | 1,098 | 558 | 557 | 274 | 22.1 | % | 14,803 | 1,431 | 16,234 | 22.2 | % | 20.3 | % | |||||||||||||||||||||
| Oklahoma City, OK | 4 | 1,087 | 609 | 602 | 152 | 16.9 | % | 17,173 | 2,213 | 19,386 | 10.6 | % | 9.4 | % | |||||||||||||||||||||
| Lexington, KY | 1 | 436 | 31 | 26 | 250 | 18.5 | % | 18,121 | 2,038 | 20,159 | 16.6 | % | 14.9 | % | |||||||||||||||||||||
| Nashville, TN | 1 | 418 | 281 | 288 | 166 | 12.1 | % | 16,869 | 1,321 | 18,190 | 11.8 | % | 11.0 | % | |||||||||||||||||||||
| Memphis, TN | 1 | 362 | 301 | 300 | 376 | 34.3 | % | 15,835 | 807 | 16,642 | 28.5 | % | 27.1 | % | |||||||||||||||||||||
| Tampa-St. Petersburg, FL | 1 | 348 | 230 | 232 | 323 | 22.0 | % | 17,224 | 1,875 | 19,099 | 22.5 | % | 20.3 | % | |||||||||||||||||||||
| Raleigh-Durham, NC | 1 | 318 | 251 | 248 | 215 | 17.0 | % | 16,162 | 1,046 | 17,208 | 16.0 | % | 15.0 | % | |||||||||||||||||||||
| Austin, TX | 1 | 256 | 194 | 194 | 257 | 17.8 | % | 18,377 | 1,486 | 19,863 | 16.8 | % | 15.5 | % | |||||||||||||||||||||
| Denver, CO | 1 | 252 | 21 | 17 | 180 | 16.6 | % | 12,181 | 4,048 | 16,229 | 17.7 | % | 13.3 | % | |||||||||||||||||||||
| Indianapolis, IN | 1 | 236 | 195 | 196 | 266 | 24.4 | % | 15,673 | 1,484 | 17,157 | 20.3 | % | 18.6 | % | |||||||||||||||||||||
| Total / Weighted Average | 26 | 8,617 | 4,559 | 4,569 | $ | 253 | 19.9 | % | $17,374 | $ | 1,979 | $ | 19,353 | 17.5 | % | 15.7 | % | ||||||||||||||||||
Completed (d) |
|||||||||||||||||||||||||||||||||||
| Atlanta, GA | 3 | 978 | 903 | 897 | $ | 215 | 20.8 | % | $ | 9,013 | $ | 1,139 | $ | 10,152 | 28.6 | % | 25.4 | % | |||||||||||||||||
| Tampa-St. Petersburg, FL | 3 | 888 | 844 | 842 | 279 | 21.8 | % | 14,107 | 1,327 | 15,434 | 23.8 | % | 21.7 | % | |||||||||||||||||||||
| Columbus, OH | 3 | 763 | 712 | 707 | 206 | 22.5 | % | 10,316 | 666 | 10,982 | 23.9 | % | 22.5 | % | |||||||||||||||||||||
| Louisville, KY | 2 | 728 | 728 | 784 | 215 | 24.1 | % | 15,561 | 2,173 | 17,734 | 16.6 | % | 14.6 | % | |||||||||||||||||||||
| Memphis, TN | 2 | 691 | 688 | 681 | 183 | 18.0 | % | 12,036 | 974 | 13,010 | 18.2 | % | 16.9 | % | |||||||||||||||||||||
| Raleigh-Durham, NC | 1 | 328 | 325 | 323 | 195 | 19.0 | % | 14,648 | 2,108 | 16,756 | 15.9 | % | 13.9 | % | |||||||||||||||||||||
| Wilmington, NC | 1 | 288 | 288 | 287 | 77 | 7.6 | % | 8,120 | 56 | 8,176 | 11.4 | % | 11.3 | % | |||||||||||||||||||||
| Total / Weighted Average | 15 | 4,664 | 4,488 | 4,521 | $ | 210 | 20.5 | % | $ | 12,054 | $ | 1,236 | $ | 13,290 | 21.0 | % | 19.0 | % | |||||||||||||||||
| Grand Total/Weighted Average | 41 | 13,281 | 9,047 | 9,090 | $ | 232 | 20.2 | % | $ | 14,752 | $ | 1,725 | $ | 16,477 | 18.9 | % | 16.9 | % | |||||||||||||||||
2024 ACQUISITIONS | ||||||||||||||
| Property | Market | Units | Acquisition Date | Purchase Price | Price per Unit | Average Rent per Unit at Acquisition | ||||||||||||||||||||||||||||||||
| Gateway at Pinellas | Tampa-St. Petersburg, FL | 288 | 8/13/24 | $ | 82,000 | $ | 285 | $ | 2,228 | |||||||||||||||||||||||||||||
2024 DISPOSITIONS | ||||||||||||||
| Property | Location | Units | Disposition date | Sale price | Price per unit | Average rent per unit at disposition | Gain on sale (loss on impairment) , net (a) | |||||||||||||||||||||||||||||||||||||
| Villas of Kingwood | Houston, TX | 330 | 2/13/24 | $ | 53,700 | $ | 163 | $ | 1,454 | $ | 62 | |||||||||||||||||||||||||||||||||
| Belmar Villas | Denver, CO | 318 | 2/13/24 | 74,300 | 234 | 1,606 | 46 | |||||||||||||||||||||||||||||||||||||
| Hearthstone at City Center | Denver, CO | 360 | 3/12/24 | 74,000 | 206 | 1,690 | 88 | |||||||||||||||||||||||||||||||||||||
| Villas at Huffmeister | Houston, TX | 294 | 3/25/24 | 44,250 | 151 | 1,557 | (415) | |||||||||||||||||||||||||||||||||||||
| Westmont Commons | Asheville, NC | 252 | 3/28/24 | 49,875 | 198 | 1,505 | 25,856 | |||||||||||||||||||||||||||||||||||||
| Reserve at Creekside | Chattanooga, TN | 192 | 4/30/24 | 28,500 | 152 | 1,462 | (152) | |||||||||||||||||||||||||||||||||||||
| Tapestry Park | Birmingham, AL | 354 | 7/17/24 | 70,800 | 200 | 1,644 | (14,419) | |||||||||||||||||||||||||||||||||||||
| Total | 2,100 | $ | 395,425 | $ | 188 | $ | 1,571 | $ | 11,066 | |||||||||||||||||||||||||||||||||||
REAL ESTATE UNDER DEVELOPMENT | ||||||||||||||
| Development | Destination at Arista (a) |
Flatiron Flats | ||||||||||||
| Location | Denver, Colorado | Denver, Colorado | ||||||||||||
| Planned Units | 325 | 296 | ||||||||||||
| Start Date | 3Q 2021 | 4Q 2022 | ||||||||||||
| Projected Initial Occupancy | 2Q 2023 | 4Q 2024 | ||||||||||||
| Projected Completion Date | 4Q 2023 | 4Q 2024 | ||||||||||||
| Projected Stabilization date | 1Q 2025 | 4Q 2026 | ||||||||||||
| Total Estimated Development Costs | $102,920 | $119,800 | ||||||||||||
| % of Development Costs Left to Fund | 0% | 11% | ||||||||||||
| Real Estate Under Development at September 30, 2024 | $9,079 | $106,142 | ||||||||||||
| % of Planned Units Delivered as of September 30, 2024 | 92.0% | 0% | ||||||||||||
Leased % as of October 29, 2024 (b) |
89.5% | N/A | ||||||||||||
Occupancy % as of October 29, 2024 (b) |
85.2% | N/A | ||||||||||||
INVESTMENTS IN UNCONSOLIDATED REAL ESTATE ENTITIES | ||||||||||||||
| Property | Location | Units | Estimated Delivery Date | Total Construction Budget | Total Project Debt | IRT Equity Interest in JV | Remaining Expected IRT Investment | Carrying Value of IRT’s Investment | ||||||||||||||||||||||||||||||||||||||||||
Metropolis at Innsbrook (a) |
Richmond, VA | 402 | — | $ | 85,883 | $ | 59,000 | 84.8 | % | $ | — | $ | 21,081 | |||||||||||||||||||||||||||||||||||||
|
Views of Music City II (b) /
The Crockett (c)
|
Nashville, TN | 408 | — | 66,079 | 43,099 | 50.0 | % | — | 11,846 | |||||||||||||||||||||||||||||||||||||||||
| Lakeline Station | Austin, TX | 378 | Q2 2025 | 110,551 | 76,500 | 90.0 | % | — | 33,794 | |||||||||||||||||||||||||||||||||||||||||
| The Mustang | Dallas, TX | 275 | Q4 2024 | 109,583 | 79,447 | 85.0 | % | — | 28,672 | |||||||||||||||||||||||||||||||||||||||||
| Total | 1,463 | $ | 372,096 | $ | 258,046 | $ | — | $ | 95,393 | |||||||||||||||||||||||||||||||||||||||||
| Amount | Weighted Average Contractual Rate (d) |
Weighted Average Hedged Effective Rate (e) |
Type | Weighted Average Maturity (in years) |
||||||||||||||||||||||||||||
| Debt: | ||||||||||||||||||||||||||||||||
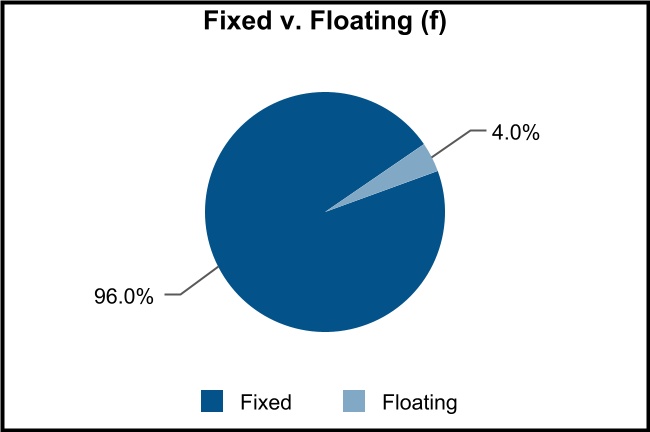
Unsecured revolver (a) |
$ | 191,478 | 6.6 | % | 4.8 | % | Floating | 1.3 | ||||||||||||||||||||||||
Unsecured term loans (b) |
600,000 | 6.5 | % | 4.0 | % | Floating | 2.8 | |||||||||||||||||||||||||
Secured credit facilities (c) |
585,635 | 4.2 | % | 4.4 | % | Fixed | 4.2 | |||||||||||||||||||||||||
| Mortgages | 883,869 | 3.8 | % | 4.0 | % | Fixed | 3.6 | |||||||||||||||||||||||||
| Total Principal | 2,260,982 | 4.9 | % | 4.2 | % | 3.3 | ||||||||||||||||||||||||||
| Loan premiums (discounts), net | 33,970 | |||||||||||||||||||||||||||||||
| Unamortized deferred financing costs | (8,258) | |||||||||||||||||||||||||||||||
| Total Consolidated Debt | 2,286,694 | |||||||||||||||||||||||||||||||
| Market Equity Capitalization, at period end | 4,736,220 | |||||||||||||||||||||||||||||||
| Total Capitalization | $ | 7,022,914 | ||||||||||||||||||||||||||||||
| Hedges: | Notional | Start | End | Swap Rate | Floor Rate | Cap Rate | ||||||||||||||||||||||||||||||||
| Collar | $ | 100,000 | 11/17/2017 | 11/17/2024 | — | 1.25 | % | 2.00 | % | |||||||||||||||||||||||||||||
| Swap | $ | 150,000 | 6/17/2021 | 6/17/2026 | 2.18 | % | — | — | ||||||||||||||||||||||||||||||
| Swap | $ | 150,000 | 5/17/2022 | 5/17/2027 | 0.99 | % | — | — | ||||||||||||||||||||||||||||||
| Swap | $ | 200,000 | 3/17/2023 | 3/17/2030 | 3.39 | % | — | — | ||||||||||||||||||||||||||||||
| Collar | $ | 100,000 | 1/17/2024 | 1/17/2028 | — | 1.50 | % | 2.50 | % | |||||||||||||||||||||||||||||
| Forward starting collar | $ | 100,000 | 11/17/2024 | 1/17/2028 | — | 1.50 | % | 2.50 | % | |||||||||||||||||||||||||||||
| Requirement | Actual | Compliance | ||||||||||||||||||
| Consolidated leverage ratio | ≤ 60% | 31.4% | Yes | |||||||||||||||||
| Consolidated fixed charge coverage ratio | ≥ 1.5x | 2.8x | Yes | |||||||||||||||||
| Unsecured leverage ratio | ≤ 60% | 24.4% | Yes | |||||||||||||||||
| Total Units | % of Total | Gross Assets | % of Total | Q3 2024 NOI | % of Total | |||||||||||||||||||||||||||||||||
| Unencumbered assets | 18,429 | 56.4 | % | $ | 3,698,056 | 54.9 | % | $ | 55,785 | 56.8 | % | |||||||||||||||||||||||||||
| Encumbered assets | 14,241 | 43.6 | % | 3,035,808 | 45.1 | % | 42,506 | 43.2 | % | |||||||||||||||||||||||||||||
| 32,670 | 100.0 | % | $ | 6,733,864 | 100.0 | % | $ | 98,291 | 100.0 | % | ||||||||||||||||||||||||||||
| As of | ||||||||||||||||||||||||||||||||
| Sep 30, 2024 | Jun 30, 2024 | Mar 31, 2024 | Dec 31, 2023 | Sep 30, 2023 | ||||||||||||||||||||||||||||
| Total debt | $ | 2,286,694 | $ | 2,252,559 | $ | 2,277,098 | $ | 2,549,409 | $ | 2,715,710 | ||||||||||||||||||||||
| Less: cash and cash equivalents | (17,611) | (21,034) | (21,275) | (22,852) | (17,216) | |||||||||||||||||||||||||||
| Less: loan discounts and premiums, net | (33,970) | (37,253) | (39,804) | (44,483) | (50,772) | |||||||||||||||||||||||||||
| Total net debt | $ | 2,235,113 | $ | 2,194,272 | $ | 2,216,019 | $ | 2,482,074 | $ | 2,647,722 | ||||||||||||||||||||||
| For the Three Months Ended | |||||||||||||||||||||||||||||
| Sep 30, 2024 | Jun 30, 2024 | Mar 31, 2024 | Dec 31, 2023 | Sep 30, 2023 | |||||||||||||||||||||||||
| Net income (loss) | $ | 12,620 | $ | 10,555 | $ | 17,961 | $ | (41,654) | $ | 3,986 | |||||||||||||||||||
| Other revenue | (275) | (298) | (203) | (316) | (232) | ||||||||||||||||||||||||
| Property management expenses | 7,379 | 7,666 | 7,499 | 6,660 | 7,232 | ||||||||||||||||||||||||
| General and administrative expenses |
4,765 | 6,244 | 8,381 | 5,043 | 3,660 | ||||||||||||||||||||||||
| Depreciation and amortization expense |
55,261 | 54,127 | 53,721 | 55,902 | 55,546 | ||||||||||||||||||||||||
| Casualty losses | 1,249 | 465 | 2,301 | 59 | 35 | ||||||||||||||||||||||||
| Interest expense | 18,308 | 17,460 | 20,603 | 23,537 | 22,033 | ||||||||||||||||||||||||
| (Gain on sale) loss on impairment of real estate assets, net |
(688) | 152 | (10,530) | 56,263 | 11,268 | ||||||||||||||||||||||||
| (Gain) loss on extinguishment of debt | — | — | (203) | 124 | — | ||||||||||||||||||||||||
| Other loss | — | — | 1 | 79 | 369 | ||||||||||||||||||||||||
| Loss from investments in unconsolidated real estate entities |
703 | 850 | 829 | 1,330 | 1,178 | ||||||||||||||||||||||||
| NOI | $ | 99,322 | $ | 97,221 | $ | 100,360 | $ | 107,027 | $ | 105,075 | |||||||||||||||||||
| Less: Non same-store portfolio NOI | 2,249 | 2,293 | 5,989 | 9,863 | 10,123 | ||||||||||||||||||||||||
| Same-store portfolio NOI | $ | 97,073 | $ | 94,928 | $ | 94,371 | $ | 97,164 | $ | 94,952 | |||||||||||||||||||
| As of | ||||||||||||||||||||||||||||||||
| Sep 30, 2024 | Jun 30, 2024 | Mar 31, 2024 | Dec 31, 2023 | Sep 30, 2023 | ||||||||||||||||||||||||||||
| Total assets | $ | 5,948,204 | $ | 5,940,261 | $ | 5,972,848 | $ | 6,280,175 | $ | 6,577,790 | ||||||||||||||||||||||
Plus: accumulated depreciation (a) |
715,702 | 674,236 | 630,743 | 606,404 | 570,966 | |||||||||||||||||||||||||||
| Plus: accumulated amortization | 69,958 | 69,532 | 69,998 | 73,975 | 76,691 | |||||||||||||||||||||||||||
| Total gross assets | $ | 6,733,864 | $ | 6,684,029 | $ | 6,673,589 | $ | 6,960,554 | $ | 7,225,447 | ||||||||||||||||||||||