Maryland |
001-36041 |
26-4567130 |
||||||
|
(State or other jurisdiction
of incorporation)
|
(Commission
File Number)
|
(I.R.S. Employer
Identification No.)
|
||||||
o |
Written communications pursuant to Rule 425 under the Securities Act (17 CFR 230.425) |
||||
o |
Soliciting material pursuant to Rule 14a-12 under the Exchange Act (17 CFR 240.14a-12) |
||||
o |
Pre-commencement communications pursuant to Rule 14d-2(b) under the Exchange Act (17 CFR 240.14d-2(b)) |
||||
o |
Pre-commencement communications pursuant to Rule 13e-4(c) under the Exchange Act (17 CFR 240.13e-4(c)) |
||||
Title of each class |
Trading Symbol(s) |
Name of each exchange on which registered |
||||||||||||
Common stock |
IRT |
NYSE |
||||||||||||
| 99.1 | ||||||||
| 99.2 | ||||||||
| 104 | Cover Page Interactive Data File (embedded within the Inline XBRL document). | |||||||
| Independence Realty Trust, Inc. | ||||||||
| October 30, 2023 | By: | /s/ James J. Sebra | ||||||
| Name: | James J. Sebra | |||||||
| Title: | Chief Financial Officer and Treasurer | |||||||
|
Third Quarter 2023
Compared to
Third Quarter 2022
|
Nine Months Ended September 30, 2023 Compared to Nine Months Ended September 30, 2022 |
|||||||
| Rental and other property revenue | 5.4% increase | 6.3% increase | ||||||
| Property operating expenses | 6.3% increase | 6.2% increase | ||||||
| Net operating income (“NOI”) | 4.8% increase | 6.4% increase | ||||||
| Portfolio average occupancy | 40 bps increase to 94.6% | 120 bps decrease to 93.9% | ||||||
| Portfolio average rental rate | 4.4% increase to $1,549 | 7.7% increase to $1,536 | ||||||
| NOI Margin | 40 bps decrease to 62.4% | No change — 62.6% | ||||||
| 3Q 2023 | 4Q 2023(3) |
||||||||||
Same-Store Portfolio(1) |
|||||||||||
| Average Occupancy | 94.6 | % | 94.3 | % | (4) |
||||||
Lease Over Lease Effective Rental Rate Growth:(2) |
|||||||||||
| New Leases | 0.8 | % | (2.3) | % | |||||||
| Renewal Leases | 4.8 | % | 5.0 | % | |||||||
| Blended | 3.0 | % | 2.3 | % | |||||||
| Resident retention rate | 52.3 | % | 48.4 | % | |||||||
| Same-Store Portfolio excluding Ongoing Value Add | |||||||||||
| Average Occupancy | 95.0 | % | 94.7 | % | (4) |
||||||
Lease Over Lease Effective Rental Rate Growth:(2) |
|||||||||||
| New Leases | 0.3 | % | (2.5) | % | |||||||
| Renewal Leases | 4.6 | % | 4.8 | % | |||||||
| Blended | 2.7 | % | 2.1 | % | |||||||
| Resident retention rate | 52.6 | % | 47.7 | % | |||||||
Value Add (22 properties with Ongoing Value Add) |
|||||||||||
| Average Occupancy | 92.8 | % | 92.8 | % | (4) |
||||||
Lease Over Lease Effective Rental Rate Growth:(2) |
|||||||||||
| New Leases | 2.8 | % | (1.6) | % | |||||||
| Renewal Leases | 5.9 | % | 6.3 | % | |||||||
| Blended | 4.5 | % | 3.0 | % | |||||||
| Resident retention rate | 51.2 | % | 51.3 | % | |||||||
| Previous Guidance | Current Guidance | Change at Midpoint | |||||||||||||||||||||||||||
2023 Full Year EPS and CFFO Guidance(1)(2) |
Low | High | Low | High | |||||||||||||||||||||||||
| Earnings (loss) per share | $ | 0.25 | $ | 0.27 | $ | (0.07) | $ | (0.02) | $ | (0.305) | |||||||||||||||||||
| Adjustments: | |||||||||||||||||||||||||||||
Depreciation and amortization |
0.95 | 0.95 | 0.94 | 0.94 | (0.01) | ||||||||||||||||||||||||
|
(Gain on sale) loss on impairment of
real estate assets(3)
|
(0.01) | (0.01) | 0.32 | 0.28 | 0.31 | ||||||||||||||||||||||||
| FFO per share | 1.19 | 1.21 | 1.19 | 1.20 | (0.005) | ||||||||||||||||||||||||
| Loan (premium accretion) discount amortization, net |
(0.05) | (0.05) | (0.05) | (0.05) | — | ||||||||||||||||||||||||
| Core FFO per share | $ | 1.14 | $ | 1.16 | $ | 1.14 | $ | 1.15 | $ | (0.005) | |||||||||||||||||||
| Same-Store Portfolio | Previous 2023 Outlook |
Current 2023 Outlook(1) |
Change at Midpoint | ||||||||
| Number of properties/units | 115 properties / 34,179 units | 106 properties / 31,829 units | |||||||||
| Property revenue growth | 6.1% to 6.6% | 5.5% to 5.7% | (0.75)% | ||||||||
| Controllable operating expense growth | 4.7% to 5.4% | 6.0% to 7.0% | 1.40% | ||||||||
| Real estate tax and insurance expense growth | 7.5% to 8.1% | 4.2% to 4.8% | (3.30)% | ||||||||
| Total operating expense growth | 5.7% to 6.4% | 5.5% to 5.9% | (0.35)% | ||||||||
| Property NOI growth | 6.0% to 7.0% | 5.3% to 5.7% | (1.00)% | ||||||||
| Corporate Expenses | |||||||||||
| General and administrative & Property management expenses |
$50.5 million to $51.5 million | $50.0 million to $51.0 million | $(0.5) million | ||||||||
Interest expense(2) |
$102.5 million to $103.5 million | $101.0 million to $102.0 million | $(1.5) million | ||||||||
Transaction/Investment Volume(3) |
|||||||||||
| Acquisition volume | None | None | — | ||||||||
| Disposition volume | $122 million to $127 million | $122 million to $127 million | — | ||||||||
| Capital Expenditures | |||||||||||
| Recurring | $20.0 million to $22.0 million | $20.0 million to $21.0 million | $(0.5) million | ||||||||
| Value add & non-recurring | $78.0 million to $82.0 million | $83.0 million to $85.0 million | $4.0 million | ||||||||
| Development | $80.0 million to $90.0 million | $75.0 million to $80.0 million | $(7.5) million | ||||||||
| For the Three Months Ended | |||||||||||||||||||||||||||||
| Sep 30, 2023 | Jun 30, 2023 | Mar 31, 2023 | Dec 31, 2022 | Sep 30, 2022 | |||||||||||||||||||||||||
| Selected Financial Information: | |||||||||||||||||||||||||||||
| Operating Statistics: | |||||||||||||||||||||||||||||
| Net income available to common shares | $3,930 | $10,709 | $8,648 | $33,631 | $16,223 | ||||||||||||||||||||||||
| Earnings per share -- diluted | $0.02 | $0.05 | $0.04 | $0.15 | $0.07 | ||||||||||||||||||||||||
| Rental and other property revenue | $168,375 | $163,601 | $161,135 | $162,493 | $160,300 | ||||||||||||||||||||||||
| Property operating expenses | $63,300 | $62,071 | $59,255 | $57,450 | $59,967 | ||||||||||||||||||||||||
| NOI | $105,075 | $101,530 | $101,880 | $105,043 | $100,333 | ||||||||||||||||||||||||
| NOI margin | 62.4% | 62.1% | 63.2% | 64.6% | 62.6% | ||||||||||||||||||||||||
| Adjusted EBITDA | $94,415 | $89,156 | $87,594 | $93,017 | $89,264 | ||||||||||||||||||||||||
| FFO per share | $0.31 | $0.28 | $0.27 | $0.31 | $0.30 | ||||||||||||||||||||||||
| CORE FFO per share | $0.30 | $0.28 | $0.27 | $0.29 | $0.28 | ||||||||||||||||||||||||
| Dividends per share | $0.16 | $0.16 | $0.14 | $0.14 | $0.14 | ||||||||||||||||||||||||
| CORE FFO payout ratio | 53.3% | 57.1% | 51.9% | 48.3% | 50.0% | ||||||||||||||||||||||||
| Portfolio Data: | |||||||||||||||||||||||||||||
| Total gross assets | $7,225,447 | $7,117,404 | $7,045,306 | $7,034,902 | $7,097,280 | ||||||||||||||||||||||||
| Total number of operating properties (a) | 120 | 119 | 119 | 120 | 122 | ||||||||||||||||||||||||
| Total units (a) | 35,427 | 35,249 | 35,249 | 35,526 | 36,176 | ||||||||||||||||||||||||
| Portfolio period end occupancy (a) | 94.4% | 94.6% | 94.1% | 93.6% | 94.6% | ||||||||||||||||||||||||
| Portfolio average occupancy (a) | 94.6% | 94.1% | 93.1% | 93.9% | 94.2% | ||||||||||||||||||||||||
| Portfolio average effective monthly rent, per unit (a) | $1,556 | $1,538 | $1,535 | $1,522 | $1,484 | ||||||||||||||||||||||||
| Same-store portfolio period end occupancy (b) | 94.5% | 94.6% | 94.1% | 93.6% | 94.6% | ||||||||||||||||||||||||
| Same-store portfolio average occupancy (b) | 94.6% | 94.2% | 93.1% | 93.9% | 94.2% | ||||||||||||||||||||||||
| Same-store portfolio average effective monthly rent, per unit (b) |
$1,549 | $1,531 | $1,528 | $1,517 | $1,484 | ||||||||||||||||||||||||
| Capitalization: | |||||||||||||||||||||||||||||
| Total debt (c) | $2,715,710 | $2,650,805 | $2,628,632 | $2,631,645 | $2,713,625 | ||||||||||||||||||||||||
| Common share price, period end | $14.07 | $18.22 | $16.03 | $16.86 | $16.73 | ||||||||||||||||||||||||
| Market equity capitalization | $3,245,135 | $4,202,342 | $3,694,970 | $3,880,432 | $3,850,365 | ||||||||||||||||||||||||
| Total market capitalization | $5,960,845 | $6,853,147 | $6,323,602 | $6,512,077 | $6,563,990 | ||||||||||||||||||||||||
| Total debt/total gross assets | 37.6% | 37.2% | 37.3% | 37.4% | 38.2% | ||||||||||||||||||||||||
| Net debt to Adjusted EBITDA (d) | 7.0x | 7.2x | 7.3x | 6.9x | 7.2x | ||||||||||||||||||||||||
| Interest coverage | 4.3x | 4.0x | 4.0x | 4.0x | 4.0x | ||||||||||||||||||||||||
| Common shares and OP Units: | |||||||||||||||||||||||||||||
| Shares outstanding | 224,695,566 | 224,697,889 | 224,556,870 | 224,064,940 | 224,056,179 | ||||||||||||||||||||||||
| OP units outstanding | 5,946,571 | 5,946,571 | 5,946,571 | 6,091,171 | 6,091,171 | ||||||||||||||||||||||||
| Common shares and OP units outstanding | 230,642,137 | 230,644,460 | 230,503,441 | 230,156,111 | 230,147,350 | ||||||||||||||||||||||||
| Weighted average common shares and OP units | 230,444,945 | 230,369,086 | 230,186,297 | 229,994,927 | 228,051,780 | ||||||||||||||||||||||||
| For the Three Months Ended September 30, | For the Nine Months Ended September 30, |
||||||||||||||||||||||
| 2023 | 2022 | 2023 | 2022 | ||||||||||||||||||||
| Funds From Operations (FFO): | |||||||||||||||||||||||
| Net income | $ | 3,986 | $ | 16,653 | $ | 23,847 | $ | 86,135 | |||||||||||||||
| Add-Back (Deduct): | |||||||||||||||||||||||
| Real estate depreciation and amortization | 55,217 | 49,347 | 162,205 | 199,588 | |||||||||||||||||||
| Our share of real estate depreciation and amortization from investments in unconsolidated real estate entities |
486 | 1,388 | 1,479 | 1,904 | |||||||||||||||||||
| Loss on impairment (gain on sale) of real estate assets, net, excluding prepayment gains |
11,268 | — | 10,954 | (94,712) | |||||||||||||||||||
| FFO | $ | 70,957 | $ | 67,388 | $ | 198,485 | $ | 192,915 | |||||||||||||||
| FFO per share | $ | 0.31 | $ | 0.30 | $ | 0.86 | $ | 0.85 | |||||||||||||||
| CORE Funds From Operations (CFFO): | |||||||||||||||||||||||
| FFO | $ | 70,957 | $ | 67,388 | $ | 198,485 | $ | 192,915 | |||||||||||||||
| Add-Back (Deduct): | |||||||||||||||||||||||
| Other depreciation and amortization | 329 | 375 | 860 | 1,100 | |||||||||||||||||||
| Casualty losses (gains), net | 35 | (191) | 866 | (7,176) | |||||||||||||||||||
| Loan (premium accretion) discount amortization, net | (2,747) | (2,750) | (8,239) | (8,245) | |||||||||||||||||||
| Prepayment (gains) penalties on asset dispositions | — | — | (670) | — | |||||||||||||||||||
| Other expense (income), net | 429 | (765) | 663 | (1,438) | |||||||||||||||||||
| Merger and integration costs | — | 275 | — | 3,477 | |||||||||||||||||||
| Restructuring costs | — | — | 3,213 | — | |||||||||||||||||||
| CFFO | $ | 69,003 | $ | 64,332 | $ | 195,178 | $ | 180,633 | |||||||||||||||
| CFFO per share | $ | 0.30 | $ | 0.28 | $ | 0.85 | $ | 0.79 | |||||||||||||||
| Weighted-average shares and units outstanding | 230,444,945 | 228,051,780 | 230,334,398 | 227,933,320 | |||||||||||||||||||
| For the Three Months Ended | |||||||||||||||||||||||||||||
| Sep 30, 2023 | Jun 30, 2023 | Mar 31, 2023 | Dec 31, 2022 | Sep 30, 2022 | |||||||||||||||||||||||||
| Net income | $ | 3,986 | $ | 10,988 | $ | 8,872 | $ | 34,524 | $ | 16,653 | |||||||||||||||||||
| Other revenue | (232) | (354) | (239) | (306) | (300) | ||||||||||||||||||||||||
| Property management expenses | 7,232 | 6,818 | 6,371 | 6,593 | 5,744 | ||||||||||||||||||||||||
| General and administrative expenses |
3,660 | 5,910 | 8,154 | 5,739 | 5,625 | ||||||||||||||||||||||||
| Depreciation and amortization expense |
55,546 | 53,984 | 53,536 | 52,161 | 49,722 | ||||||||||||||||||||||||
| Casualty losses (gains), net | 35 | 680 | 151 | (1,690) | (191) | ||||||||||||||||||||||||
| Interest expense | 22,033 | 22,227 | 22,124 | 23,337 | 22,093 | ||||||||||||||||||||||||
| Loss on impairment (gain on sale) of real estate assets, net |
11,268 | — | (985) | (17,044) | — | ||||||||||||||||||||||||
| Other loss (income), net | 369 | 72 | (93) | (57) | (765) | ||||||||||||||||||||||||
| Loss (gain) from investments in unconsolidated real estate entities |
1,178 | 1,205 | 776 | (242) | 1,477 | ||||||||||||||||||||||||
| Merger and integration costs | — | — | — | 2,028 | 275 | ||||||||||||||||||||||||
| Restructuring costs | — | — | 3,213 | — | — | ||||||||||||||||||||||||
| NOI | $ | 105,075 | $ | 101,530 | $ | 101,880 | $ | 105,043 | $ | 100,333 | |||||||||||||||||||
| Less: Non same-store portfolio NOI | 4,063 | 3,400 | 3,804 | 4,866 | 3,937 | ||||||||||||||||||||||||
| Same-store portfolio NOI | $ | 101,012 | $ | 98,130 | $ | 98,076 | $ | 100,177 | $ | 96,396 | |||||||||||||||||||
| Three Months Ended | |||||||||||||||||||||||||||||
| Sep 30, 2023 | Jun 30, 2023 | Mar 31, 2023 | Dec 31, 2022 | Sep 30, 2022 | |||||||||||||||||||||||||
| Net income (loss) | $ | 3,986 | $ | 10,988 | $ | 8,872 | $ | 34,524 | $ | 16,653 | |||||||||||||||||||
| Add-Back (Deduct): | |||||||||||||||||||||||||||||
| Interest expense | 22,033 | 22,227 | 22,124 | 23,337 | 22,093 | ||||||||||||||||||||||||
| Depreciation and amortization | 55,546 | 53,984 | 53,536 | 52,161 | 49,722 | ||||||||||||||||||||||||
| Casualty losses (gains), net | 35 | 680 | 151 | (1,690) | (191) | ||||||||||||||||||||||||
| Loss on impairment (gain on sale) of real estate assets, net |
11,268 | — | (985) | (17,044) | — | ||||||||||||||||||||||||
| Merger and integration costs | — | — | — | 2,028 | 275 | ||||||||||||||||||||||||
| Loss (gain) from investments in unconsolidated real estate entities |
1,178 | 1,205 | 776 | (242) | 1,477 | ||||||||||||||||||||||||
| Other loss (income), net | 369 | 72 | (93) | (57) | (765) | ||||||||||||||||||||||||
| Restructuring costs | — | — | 3,213 | — | — | ||||||||||||||||||||||||
| Adjusted EBITDA | $ | 94,415 | $ | 89,156 | $ | 87,594 | $ | 93,017 | $ | 89,264 | |||||||||||||||||||
| INTEREST COST: | |||||||||||||||||||||||||||||
| Interest expense | $ | 22,033 | $ | 22,227 | $ | 22,124 | $ | 23,337 | $ | 22,093 | |||||||||||||||||||
| INTEREST COVERAGE: | 4.3x | 4.0x | 4.0x | 4.0x | 4.0x | ||||||||||||||||||||||||
| For the Three Months Ended September 30, | For the Nine Months Ended September 30, | ||||||||||||||||||||||
| 2023 | 2022 | 2023 | 2022 | ||||||||||||||||||||
| Net income (loss) | $ | 3,986 | $ | 16,653 | $ | 23,847 | $ | 86,135 | |||||||||||||||
| Add-Back (Deduct): | |||||||||||||||||||||||
| Interest expense | 22,033 | 22,093 | 66,383 | 63,618 | |||||||||||||||||||
| Depreciation and amortization | 55,546 | 49,722 | 163,066 | 200,688 | |||||||||||||||||||
| Casualty losses (gains), net | 35 | (191) | 866 | (7,176) | |||||||||||||||||||
| Loss on impairment (gain on sale) of real estate assets, net |
11,268 | — | 10,284 | (94,712) | |||||||||||||||||||
| Merger and integration costs | — | 275 | — | 3,477 | |||||||||||||||||||
| Loss (gain) from investments in unconsolidated real estate entities |
1,178 | 1,477 | 3,159 | 2,602 | |||||||||||||||||||
| Other loss (income), net | 369 | (765) | 348 | (1,501) | |||||||||||||||||||
| Restructuring costs | — | — | 3,213 | — | |||||||||||||||||||
| Adjusted EBITDA | $ | 94,415 | $ | 89,264 | $ | 271,166 | $ | 253,131 | |||||||||||||||
| INTEREST COST: | |||||||||||||||||||||||
| Interest expense | $ | 22,033 | $ | 22,093 | $ | 66,383 | $ | 63,618 | |||||||||||||||
| INTEREST COVERAGE: | 4.3x | 4.0x | 4.1x | 4.0x | |||||||||||||||||||
| As of | ||||||||||||||||||||||||||||||||
| Sep 30, 2023 | Jun 30, 2023 | Mar 31, 2023 | Dec 31, 2022 | Sep 30, 2022 | ||||||||||||||||||||||||||||
| Total debt | $ | 2,715,710 | $ | 2,650,805 | $ | 2,628,632 | $ | 2,631,645 | $ | 2,713,625 | ||||||||||||||||||||||
| Less: cash and cash equivalents | (17,216) | (14,349) | (12,448) | (16,084) | (23,753) | |||||||||||||||||||||||||||
| Less: loan discounts and premiums, net | (50,772) | (53,520) | (56,256) | (59,937) | (63,340) | |||||||||||||||||||||||||||
| Total net debt | $ | 2,647,722 | $ | 2,582,936 | $ | 2,559,928 | $ | 2,555,624 | $ | 2,626,532 | ||||||||||||||||||||||
| As of | ||||||||||||||||||||||||||||||||
| Sep 30, 2023 | Jun 30, 2023 | Mar 31, 2023 | Dec 31, 2022 | Sep 30, 2022 | ||||||||||||||||||||||||||||
| Total assets | $ | 6,577,790 | $ | 6,517,400 | $ | 6,493,747 | $ | 6,532,095 | $ | 6,633,533 | ||||||||||||||||||||||
Plus: accumulated depreciation (a) |
570,966 | 523,446 | 475,001 | 426,097 | 386,606 | |||||||||||||||||||||||||||
| Plus: accumulated amortization | 76,691 | 76,558 | 76,558 | 76,710 | 77,141 | |||||||||||||||||||||||||||
| Total gross assets | $ | 7,225,447 | $ | 7,117,404 | $ | 7,045,306 | $ | 7,034,902 | $ | 7,097,280 | ||||||||||||||||||||||


Three and Nine Months Ended September 30, 2023 and 2022 |
|||||
Three and Nine Months Ended September 30, 2023 and 2022 |
|||||
Three and Nine Months Ended September 30, 2023 and 2022 |
|||||
Nine Months Ended September 30, 2023 and 2022 |
|||||
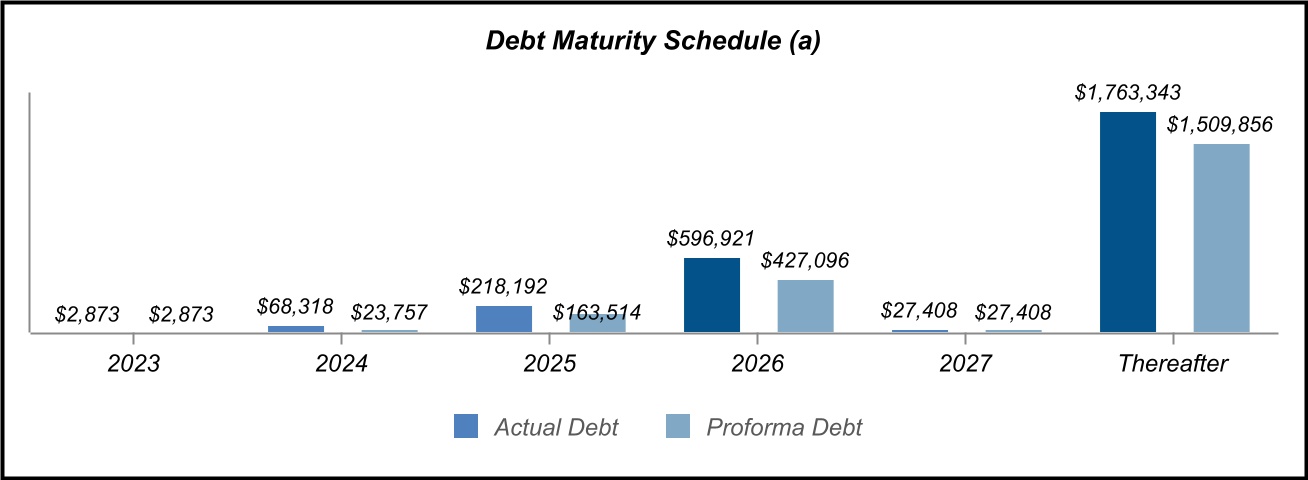
Debt Maturity, Debt Covenant & Unencumbered Asset Statistics |
25 | ||||
| Corporate Headquarters | 1835 Market Street, Suite 2601 | ||||
| Philadelphia, PA 19103 | |||||
| 267.270.4800 | |||||
| Trading Symbol | NYSE: “IRT” | ||||
| Investor Relations Contact | Edelman Smithfield | ||||
| Ted McHugh and Lauren Torres | |||||
| 917-365-7979 | |||||
IRT@edelman.com |
|||||
|
Third Quarter 2023
Compared to
Third Quarter 2022
|
Nine Months Ended September 30, 2023 Compared to Nine Months Ended September 30, 2022 |
|||||||
| Rental and other property revenue | 5.4% increase | 6.3% increase | ||||||
| Property operating expenses | 6.3% increase | 6.2% increase | ||||||
| Net operating income (“NOI”) | 4.8% increase | 6.4% increase | ||||||
| Portfolio average occupancy | 40 bps increase to 94.6% | 120 bps decrease to 93.9% | ||||||
| Portfolio average rental rate | 4.4% increase to $1,549 | 7.7% increase to $1,536 | ||||||
| NOI Margin | 40 bps decrease to 62.4% | No change — 62.6% | ||||||
| 3Q 2023 | 4Q 2023(3) |
||||||||||
Same-Store Portfolio(1) |
|||||||||||
| Average Occupancy | 94.6 | % | 94.3 | % | (4) |
||||||
Lease Over Lease Effective Rental Rate Growth:(2) |
|||||||||||
| New Leases | 0.8 | % | (2.3) | % | |||||||
| Renewal Leases | 4.8 | % | 5.0 | % | |||||||
| Blended | 3.0 | % | 2.3 | % | |||||||
| Resident retention rate | 52.3 | % | 48.4 | % | |||||||
| Same-Store Portfolio excluding Ongoing Value Add | |||||||||||
| Average Occupancy | 95.0 | % | 94.7 | % | (4) |
||||||
Lease Over Lease Effective Rental Rate Growth:(2) |
|||||||||||
| New Leases | 0.3 | % | (2.5) | % | |||||||
| Renewal Leases | 4.6 | % | 4.8 | % | |||||||
| Blended | 2.7 | % | 2.1 | % | |||||||
| Resident retention rate | 52.6 | % | 47.7 | % | |||||||
Value Add (22 properties with Ongoing Value Add) |
|||||||||||
| Average Occupancy | 92.8 | % | 92.8 | % | (4) |
||||||
Lease Over Lease Effective Rental Rate Growth:(2) |
|||||||||||
| New Leases | 2.8 | % | (1.6) | % | |||||||
| Renewal Leases | 5.9 | % | 6.3 | % | |||||||
| Blended | 4.5 | % | 3.0 | % | |||||||
| Resident retention rate | 51.2 | % | 51.3 | % | |||||||
| Previous Guidance | Current Guidance | Change at Midpoint | |||||||||||||||||||||||||||
2023 Full Year EPS and CFFO Guidance(1)(2) |
Low | High | Low | High | |||||||||||||||||||||||||
| Earnings (loss) per share | $ | 0.25 | $ | 0.27 | $ | (0.07) | $ | (0.02) | $ | (0.305) | |||||||||||||||||||
| Adjustments: | |||||||||||||||||||||||||||||
Depreciation and amortization |
0.95 | 0.95 | 0.94 | 0.94 | (0.01) | ||||||||||||||||||||||||
|
(Gain on sale) loss on impairment of
real estate assets(3)
|
(0.01) | (0.01) | 0.32 | 0.28 | 0.31 | ||||||||||||||||||||||||
| FFO per share | 1.19 | 1.21 | 1.19 | 1.20 | (0.005) | ||||||||||||||||||||||||
| Loan (premium accretion) discount amortization, net |
(0.05) | (0.05) | (0.05) | (0.05) | — | ||||||||||||||||||||||||
| Core FFO per share | $ | 1.14 | $ | 1.16 | $ | 1.14 | $ | 1.15 | $ | (0.005) | |||||||||||||||||||
| Same-Store Portfolio | Previous 2023 Outlook |
Current 2023 Outlook(1) |
Change at Midpoint | ||||||||
| Number of properties/units | 115 properties / 34,179 units | 106 properties / 31,829 units | |||||||||
| Property revenue growth | 6.1% to 6.6% | 5.5% to 5.7% | (0.75)% | ||||||||
| Controllable operating expense growth | 4.7% to 5.4% | 6.0% to 7.0% | 1.40% | ||||||||
| Real estate tax and insurance expense growth | 7.5% to 8.1% | 4.2% to 4.8% | (3.30)% | ||||||||
| Total operating expense growth | 5.7% to 6.4% | 5.5% to 5.9% | (0.35)% | ||||||||
| Property NOI growth | 6.0% to 7.0% | 5.3% to 5.7% | (1.00)% | ||||||||
| Corporate Expenses | |||||||||||
| General and administrative & Property management expenses |
$50.5 million to $51.5 million | $50.0 million to $51.0 million | $(0.5) million | ||||||||
Interest expense(2) |
$102.5 million to $103.5 million | $101.0 million to $102.0 million | $(1.5) million | ||||||||
Transaction/Investment Volume(3) |
|||||||||||
| Acquisition volume | None | None | — | ||||||||
| Disposition volume | $122 million to $127 million | $122 million to $127 million | — | ||||||||
| Capital Expenditures | |||||||||||
| Recurring | $20.0 million to $22.0 million | $20.0 million to $21.0 million | $(0.5) million | ||||||||
| Value add & non-recurring | $78.0 million to $82.0 million | $83.0 million to $85.0 million | $4.0 million | ||||||||
| Development | $80.0 million to $90.0 million | $75.0 million to $80.0 million | $(7.5) million | ||||||||
| For the Three Months Ended | |||||||||||||||||||||||||||||
| Sep 30, 2023 | Jun 30, 2023 | Mar 31, 2023 | Dec 31, 2022 | Sep 30, 2022 | |||||||||||||||||||||||||
| Selected Financial Information: | |||||||||||||||||||||||||||||
| Operating Statistics: | |||||||||||||||||||||||||||||
| Net income available to common shares | $3,930 | $10,709 | $8,648 | $33,631 | $16,223 | ||||||||||||||||||||||||
| Earnings per share -- diluted | $0.02 | $0.05 | $0.04 | $0.15 | $0.07 | ||||||||||||||||||||||||
| Rental and other property revenue | $168,375 | $163,601 | $161,135 | $162,493 | $160,300 | ||||||||||||||||||||||||
| Property operating expenses | $63,300 | $62,071 | $59,255 | $57,450 | $59,967 | ||||||||||||||||||||||||
| NOI | $105,075 | $101,530 | $101,880 | $105,043 | $100,333 | ||||||||||||||||||||||||
| NOI margin | 62.4% | 62.1% | 63.2% | 64.6% | 62.6% | ||||||||||||||||||||||||
| Adjusted EBITDA | $94,415 | $89,156 | $87,594 | $93,017 | $89,264 | ||||||||||||||||||||||||
| FFO per share | $0.31 | $0.28 | $0.27 | $0.31 | $0.30 | ||||||||||||||||||||||||
| CORE FFO per share | $0.30 | $0.28 | $0.27 | $0.29 | $0.28 | ||||||||||||||||||||||||
| Dividends per share | $0.16 | $0.16 | $0.14 | $0.14 | $0.14 | ||||||||||||||||||||||||
| CORE FFO payout ratio | 53.3% | 57.1% | 51.9% | 48.3% | 50.0% | ||||||||||||||||||||||||
| Portfolio Data: | |||||||||||||||||||||||||||||
| Total gross assets | $7,225,447 | $7,117,404 | $7,045,306 | $7,034,902 | $7,097,280 | ||||||||||||||||||||||||
| Total number of operating properties (a) | 120 | 119 | 119 | 120 | 122 | ||||||||||||||||||||||||
| Total units (a) | 35,427 | 35,249 | 35,249 | 35,526 | 36,176 | ||||||||||||||||||||||||
| Portfolio period end occupancy (a) | 94.4% | 94.6% | 94.1% | 93.6% | 94.6% | ||||||||||||||||||||||||
| Portfolio average occupancy (a) | 94.6% | 94.1% | 93.1% | 93.9% | 94.2% | ||||||||||||||||||||||||
| Portfolio average effective monthly rent, per unit (a) | $1,556 | $1,538 | $1,535 | $1,522 | $1,484 | ||||||||||||||||||||||||
| Same-store portfolio period end occupancy (b) | 94.5% | 94.6% | 94.1% | 93.6% | 94.6% | ||||||||||||||||||||||||
| Same-store portfolio average occupancy (b) | 94.6% | 94.2% | 93.1% | 93.9% | 94.2% | ||||||||||||||||||||||||
| Same-store portfolio average effective monthly rent, per unit (b) |
$1,549 | $1,531 | $1,528 | $1,517 | $1,484 | ||||||||||||||||||||||||
| Capitalization: | |||||||||||||||||||||||||||||
| Total debt (c) | $2,715,710 | $2,650,805 | $2,628,632 | $2,631,645 | $2,713,625 | ||||||||||||||||||||||||
| Common share price, period end | $14.07 | $18.22 | $16.03 | $16.86 | $16.73 | ||||||||||||||||||||||||
| Market equity capitalization | $3,245,135 | $4,202,342 | $3,694,970 | $3,880,432 | $3,850,365 | ||||||||||||||||||||||||
| Total market capitalization | $5,960,845 | $6,853,147 | $6,323,602 | $6,512,077 | $6,563,990 | ||||||||||||||||||||||||
| Total debt/total gross assets | 37.6% | 37.2% | 37.3% | 37.4% | 38.2% | ||||||||||||||||||||||||
| Net debt to Adjusted EBITDA (d) | 7.0x | 7.2x | 7.3x | 6.9x | 7.2x | ||||||||||||||||||||||||
| Interest coverage | 4.3x | 4.0x | 4.0x | 4.0x | 4.0x | ||||||||||||||||||||||||
| Common shares and OP Units: | |||||||||||||||||||||||||||||
| Shares outstanding | 224,695,566 | 224,697,889 | 224,556,870 | 224,064,940 | 224,056,179 | ||||||||||||||||||||||||
| OP units outstanding | 5,946,571 | 5,946,571 | 5,946,571 | 6,091,171 | 6,091,171 | ||||||||||||||||||||||||
| Common shares and OP units outstanding | 230,642,137 | 230,644,460 | 230,503,441 | 230,156,111 | 230,147,350 | ||||||||||||||||||||||||
| Weighted average common shares and OP units | 230,444,945 | 230,369,086 | 230,186,297 | 229,994,927 | 228,051,780 | ||||||||||||||||||||||||
| As of | |||||||||||||||||||||||||||||
| Sep 30, 2023 | Jun 30, 2023 | Mar 31, 2023 | Dec 31, 2022 | Sep 30, 2022 | |||||||||||||||||||||||||
| Assets: | |||||||||||||||||||||||||||||
| Real estate held for investment, at cost | $ | 6,754,022 | $ | 6,610,233 | $ | 6,648,907 | $ | 6,615,243 | $ | 6,634,087 | |||||||||||||||||||
| Less: accumulated depreciation | (567,200) | (519,680) | (475,001) | (425,034) | (379,171) | ||||||||||||||||||||||||
| Real estate held for investment, net | 6,186,822 | 6,090,553 | 6,173,906 | 6,190,209 | 6,254,916 | ||||||||||||||||||||||||
| Real estate held for sale | 75,392 | 86,576 | — | 35,777 | 82,178 | ||||||||||||||||||||||||
| Real estate under development | 83,547 | 121,733 | 124,983 | 105,518 | 86,763 | ||||||||||||||||||||||||
| Cash and cash equivalents | 17,216 | 14,349 | 12,448 | 16,084 | 23,753 | ||||||||||||||||||||||||
| Restricted cash | 31,772 | 28,163 | 22,385 | 27,933 | 35,829 | ||||||||||||||||||||||||
| Investment in unconsolidated real estate entities | 87,592 | 99,968 | 92,882 | 80,220 | 70,608 | ||||||||||||||||||||||||
| Other assets | 41,926 | 31,799 | 34,360 | 34,846 | 34,480 | ||||||||||||||||||||||||
| Derivative assets | 53,258 | 44,259 | 32,783 | 41,109 | 43,967 | ||||||||||||||||||||||||
| Intangible assets, net | 265 | — | — | 399 | 1,039 | ||||||||||||||||||||||||
| Total assets | $ | 6,577,790 | $ | 6,517,400 | $ | 6,493,747 | $ | 6,532,095 | $ | 6,633,533 | |||||||||||||||||||
| Liabilities and Equity: | |||||||||||||||||||||||||||||
| Indebtedness, net | $ | 2,675,117 | $ | 2,609,903 | $ | 2,628,632 | $ | 2,631,645 | $ | 2,667,183 | |||||||||||||||||||
| Indebtedness associated with real estate held for sale, net |
40,593 | 40,902 | — | — | 46,442 | ||||||||||||||||||||||||
| Accounts payable and accrued expenses | 138,549 | 115,664 | 105,873 | 109,677 | 126,310 | ||||||||||||||||||||||||
| Accrued interest payable | 8,275 | 7,986 | 7,979 | 7,713 | 11,019 | ||||||||||||||||||||||||
| Dividends payable | 36,858 | 36,856 | 32,232 | 32,189 | 32,188 | ||||||||||||||||||||||||
| Derivative liabilities | — | — | 2,283 | — | — | ||||||||||||||||||||||||
| Other liabilities | 10,642 | 11,172 | 11,813 | 13,004 | 13,816 | ||||||||||||||||||||||||
| Total liabilities | 2,910,034 | 2,822,483 | 2,788,812 | 2,794,228 | 2,896,958 | ||||||||||||||||||||||||
| Equity: | |||||||||||||||||||||||||||||
| Shareholders' Equity: | |||||||||||||||||||||||||||||
| Preferred shares, $0.01 par value per share | — | — | — | — | — | ||||||||||||||||||||||||
| Common shares, $0.01 par value per share | 2,247 | 2,247 | 2,246 | 2,241 | 2,241 | ||||||||||||||||||||||||
| Additional paid in capital | 3,751,001 | 3,754,839 | 3,753,074 | 3,751,056 | 3,749,550 | ||||||||||||||||||||||||
| Accumulated other comprehensive income | 47,910 | 38,823 | 25,101 | 35,102 | 37,569 | ||||||||||||||||||||||||
| Accumulated deficit | (271,982) | (239,972) | (214,775) | (191,735) | (194,014) | ||||||||||||||||||||||||
| Total shareholders' equity | 3,529,176 | 3,555,937 | 3,565,646 | 3,596,664 | 3,595,346 | ||||||||||||||||||||||||
| Noncontrolling Interests | 138,580 | 138,980 | 139,289 | 141,203 | 141,229 | ||||||||||||||||||||||||
| Total equity | 3,667,756 | 3,694,917 | 3,704,935 | 3,737,867 | 3,736,575 | ||||||||||||||||||||||||
| Total liabilities and equity | $ | 6,577,790 | $ | 6,517,400 | $ | 6,493,747 | $ | 6,532,095 | $ | 6,633,533 | |||||||||||||||||||
| For the Three Months Ended | |||||||||||||||||||||||||||||
| Sep 30, 2023 | Jun 30, 2023 | Mar 31, 2023 | Dec 31, 2022 | Sep 30, 2022 | |||||||||||||||||||||||||
| Revenue: | |||||||||||||||||||||||||||||
| Rental and other property revenue | $ | 168,375 | $ | 163,601 | $ | 161,135 | $ | 162,493 | $ | 160,300 | |||||||||||||||||||
| Other revenue | 232 | 354 | 239 | 306 | 300 | ||||||||||||||||||||||||
| Total revenue | 168,607 | 163,955 | 161,374 | 162,799 | 160,600 | ||||||||||||||||||||||||
| Expenses: | |||||||||||||||||||||||||||||
| Property operating expenses | 63,300 | 62,071 | 59,255 | 57,450 | 59,967 | ||||||||||||||||||||||||
| Property management expenses | 7,232 | 6,818 | 6,371 | 6,593 | 5,744 | ||||||||||||||||||||||||
| General and administrative expenses (a) | 3,660 | 5,910 | 8,154 | 5,739 | 5,625 | ||||||||||||||||||||||||
| Depreciation and amortization expense | 55,546 | 53,984 | 53,536 | 52,161 | 49,722 | ||||||||||||||||||||||||
| Casualty losses (gains), net | 35 | 680 | 151 | (1,690) | (191) | ||||||||||||||||||||||||
| Total expenses | 129,773 | 129,463 | 127,467 | 120,253 | 120,867 | ||||||||||||||||||||||||
| Interest expense | (22,033) | (22,227) | (22,124) | (23,337) | (22,093) | ||||||||||||||||||||||||
| (Loss on impairment) gain on sale of real estate assets, net |
(11,268) | — | 985 | 17,044 | — | ||||||||||||||||||||||||
| Other (loss) income, net | (369) | (72) | 93 | 57 | 765 | ||||||||||||||||||||||||
| (Loss) gain from investments in unconsolidated real estate entities |
(1,178) | (1,205) | (776) | 242 | (1,477) | ||||||||||||||||||||||||
| Merger and integration costs | — | — | — | (2,028) | (275) | ||||||||||||||||||||||||
| Restructuring costs | — | — | (3,213) | — | — | ||||||||||||||||||||||||
| Net income | $ | 3,986 | $ | 10,988 | $ | 8,872 | $ | 34,524 | $ | 16,653 | |||||||||||||||||||
| Income allocated to noncontrolling interests | (56) | (279) | (224) | (893) | (430) | ||||||||||||||||||||||||
| Net income available to common shares | $ | 3,930 | $ | 10,709 | $ | 8,648 | $ | 33,631 | $ | 16,223 | |||||||||||||||||||
| EPS - basic | $ | 0.02 | $ | 0.05 | $ | 0.04 | $ | 0.15 | $ | 0.07 | |||||||||||||||||||
| Weighted-average shares outstanding - Basic | 224,498,374 | 224,422,515 | 224,226,873 | 223,903,756 | 221,960,609 | ||||||||||||||||||||||||
| EPS - diluted | $ | 0.02 | $ | 0.05 | $ | 0.04 | $ | 0.15 | $ | 0.07 | |||||||||||||||||||
| Weighted-average shares outstanding - Diluted | 225,140,555 | 225,073,890 | 225,088,659 | 224,915,128 | 222,867,546 | ||||||||||||||||||||||||
| Funds From Operations (FFO): | |||||||||||||||||||||||||||||
| Net income | $ | 3,986 | $ | 10,988 | $ | 8,872 | $ | 34,524 | $ | 16,653 | |||||||||||||||||||
| Add-Back (Deduct): | |||||||||||||||||||||||||||||
| Real estate depreciation and amortization | 55,217 | 53,701 | 53,287 | 51,957 | 49,347 | ||||||||||||||||||||||||
| Our share of real estate depreciation and amortization from investments in unconsolidated real estate entities |
486 | 575 | 418 | 416 | 1,388 | ||||||||||||||||||||||||
| Loss on impairment (gain on sale) of real estate assets, net, excluding prepayment gains |
11,268 | — | (314) | (16,635) | — | ||||||||||||||||||||||||
| FFO | $ | 70,957 | $ | 65,264 | $ | 62,263 | $ | 70,262 | $ | 67,388 | |||||||||||||||||||
| FFO per share | $ | 0.31 | $ | 0.28 | $ | 0.27 | $ | 0.31 | $ | 0.30 | |||||||||||||||||||
| CORE Funds From Operations (CFFO): | |||||||||||||||||||||||||||||
| FFO | $ | 70,957 | $ | 65,264 | $ | 62,263 | $ | 70,262 | $ | 67,388 | |||||||||||||||||||
| Add-Back (Deduct): | |||||||||||||||||||||||||||||
| Other depreciation and amortization | 329 | 283 | 249 | 204 | 375 | ||||||||||||||||||||||||
| Casualty losses (gains), net | 35 | 680 | 151 | (1,690) | (191) | ||||||||||||||||||||||||
| Loan (premium accretion) discount amortization, net |
(2,747) | (2,737) | (2,755) | (2,760) | (2,750) | ||||||||||||||||||||||||
| Prepayment (gains) penalties on asset dispositions | — | — | (670) | (409) | — | ||||||||||||||||||||||||
| Other expense (income), net | 429 | 192 | 42 | (860) | (765) | ||||||||||||||||||||||||
| Merger and integration costs | — | — | — | 2,028 | 275 | ||||||||||||||||||||||||
| Restructuring costs | — | — | 3,213 | — | — | ||||||||||||||||||||||||
| CFFO | $ | 69,003 | $ | 63,682 | $ | 62,493 | $ | 66,775 | $ | 64,332 | |||||||||||||||||||
| CFFO per share | $ | 0.30 | $ | 0.28 | $ | 0.27 | $ | 0.29 | $ | 0.28 | |||||||||||||||||||
| Weighted-average shares and units outstanding | 230,444,945 | 230,369,086 | 230,186,297 | 229,994,927 | 228,051,780 | ||||||||||||||||||||||||
| For the Three Months Ended September 30, | For the Nine Months Ended September 30, |
||||||||||||||||||||||
| 2023 | 2022 | 2023 | 2022 | ||||||||||||||||||||
| Revenue: | |||||||||||||||||||||||
| Rental and other property revenue | $ | 168,375 | $ | 160,300 | $ | 493,111 | $ | 464,921 | |||||||||||||||
| Other revenue | 232 | 300 | 826 | 805 | |||||||||||||||||||
| Total revenue | 168,607 | 160,600 | 493,937 | 465,726 | |||||||||||||||||||
| Expenses: | |||||||||||||||||||||||
| Property operating expenses | 63,300 | 59,967 | 184,627 | 174,825 | |||||||||||||||||||
| Property management expenses | 7,232 | 5,744 | 20,421 | 17,440 | |||||||||||||||||||
| General and administrative expenses | 3,660 | 5,625 | 17,724 | 20,521 | |||||||||||||||||||
| Depreciation and amortization expense | 55,546 | 49,722 | 163,066 | 200,688 | |||||||||||||||||||
| Casualty losses (gains), net | 35 | (191) | 866 | (7,176) | |||||||||||||||||||
| Total expenses | 129,773 | 120,867 | 386,704 | 406,298 | |||||||||||||||||||
| Interest expense | (22,033) | (22,093) | (66,383) | (63,618) | |||||||||||||||||||
| (Loss on impairment) gain on sale of real estate assets, net |
(11,268) | — | (10,284) | 94,712 | |||||||||||||||||||
| Other (loss) income, net | (369) | 765 | (348) | 1,501 | |||||||||||||||||||
| Loss from investments in unconsolidated real estate entities | (1,178) | (1,477) | (3,158) | (2,411) | |||||||||||||||||||
| Merger and integration costs | — | (275) | — | (3,477) | |||||||||||||||||||
| Restructuring costs | — | — | (3,213) | — | |||||||||||||||||||
| Net income | 3,986 | 16,653 | 23,847 | 86,135 | |||||||||||||||||||
| Income allocated to noncontrolling interests | (56) | (430) | (559) | (2,517) | |||||||||||||||||||
| Net income available to common shares | $ | 3,930 | $ | 16,223 | $ | 23,288 | $ | 83,618 | |||||||||||||||
| EPS - basic | $ | 0.02 | $ | 0.07 | $ | 0.10 | $ | 0.38 | |||||||||||||||
| Weighted-average shares outstanding - Basic | 224,498,374 | 221,960,609 | 224,383,590 | 221,312,261 | |||||||||||||||||||
| EPS - diluted | $ | 0.02 | $ | 0.07 | $ | 0.10 | $ | 0.38 | |||||||||||||||
| Weighted-average shares outstanding - Diluted | 225,140,555 | 222,867,546 | 225,103,475 | 222,359,585 | |||||||||||||||||||
| Funds From Operations (FFO): | |||||||||||||||||||||||
| Net income | $ | 3,986 | $ | 16,653 | $ | 23,847 | $ | 86,135 | |||||||||||||||
| Add-Back (Deduct): | |||||||||||||||||||||||
| Real estate depreciation and amortization | 55,217 | 49,347 | 162,205 | 199,588 | |||||||||||||||||||
| Our share of real estate depreciation and amortization from investments in unconsolidated real estate entities |
486 | 1,388 | 1,479 | 1,904 | |||||||||||||||||||
| Loss on impairment (gain on sale) of real estate assets, net, excluding prepayment gains |
11,268 | — | 10,954 | (94,712) | |||||||||||||||||||
| FFO | $ | 70,957 | $ | 67,388 | $ | 198,485 | $ | 192,915 | |||||||||||||||
| FFO per share | $ | 0.31 | $ | 0.30 | $ | 0.86 | $ | 0.85 | |||||||||||||||
| CORE Funds From Operations (CFFO): | |||||||||||||||||||||||
| FFO | $ | 70,957 | $ | 67,388 | $ | 198,485 | $ | 192,915 | |||||||||||||||
| Add-Back (Deduct): | |||||||||||||||||||||||
| Other depreciation and amortization | 329 | 375 | 860 | 1,100 | |||||||||||||||||||
| Casualty losses (gains), net | 35 | (191) | 866 | (7,176) | |||||||||||||||||||
| Loan (premium accretion) discount amortization, net | (2,747) | (2,750) | (8,239) | (8,245) | |||||||||||||||||||
| Prepayment (gains) penalties on asset dispositions | — | — | (670) | — | |||||||||||||||||||
| Other expense (income), net | 429 | (765) | 663 | (1,438) | |||||||||||||||||||
| Merger and integration costs | — | 275 | — | 3,477 | |||||||||||||||||||
| Restructuring costs | — | — | 3,213 | — | |||||||||||||||||||
| CFFO | $ | 69,003 | $ | 64,332 | $ | 195,178 | $ | 180,633 | |||||||||||||||
| CFFO per share | $ | 0.30 | $ | 0.28 | $ | 0.85 | $ | 0.79 | |||||||||||||||
| Weighted-average shares and units outstanding | 230,444,945 | 228,051,780 | 230,334,398 | 227,933,320 | |||||||||||||||||||
| Three Months Ended | |||||||||||||||||||||||||||||
| Sep 30, 2023 | Jun 30, 2023 | Mar 31, 2023 | Dec 31, 2022 | Sep 30, 2022 | |||||||||||||||||||||||||
| Net income (loss) | $ | 3,986 | $ | 10,988 | $ | 8,872 | $ | 34,524 | $ | 16,653 | |||||||||||||||||||
| Add-Back (Deduct): | |||||||||||||||||||||||||||||
| Interest expense | 22,033 | 22,227 | 22,124 | 23,337 | 22,093 | ||||||||||||||||||||||||
| Depreciation and amortization | 55,546 | 53,984 | 53,536 | 52,161 | 49,722 | ||||||||||||||||||||||||
| Casualty losses (gains), net | 35 | 680 | 151 | (1,690) | (191) | ||||||||||||||||||||||||
| Loss on impairment (gain on sale) of real estate assets, net |
11,268 | — | (985) | (17,044) | — | ||||||||||||||||||||||||
| Merger and integration costs | — | — | — | 2,028 | 275 | ||||||||||||||||||||||||
| Loss (gain) from investments in unconsolidated real estate entities |
1,178 | 1,205 | 776 | (242) | 1,477 | ||||||||||||||||||||||||
| Other loss (income), net | 369 | 72 | (93) | (57) | (765) | ||||||||||||||||||||||||
| Restructuring costs | — | — | 3,213 | — | — | ||||||||||||||||||||||||
| Adjusted EBITDA | $ | 94,415 | $ | 89,156 | $ | 87,594 | $ | 93,017 | $ | 89,264 | |||||||||||||||||||
| INTEREST COST: | |||||||||||||||||||||||||||||
| Interest expense | $ | 22,033 | $ | 22,227 | $ | 22,124 | $ | 23,337 | $ | 22,093 | |||||||||||||||||||
| INTEREST COVERAGE: | 4.3x | 4.0x | 4.0x | 4.0x | 4.0x | ||||||||||||||||||||||||
| For the Three Months Ended September 30, | For the Nine Months Ended September 30, | ||||||||||||||||||||||
| 2023 | 2022 | 2023 | 2022 | ||||||||||||||||||||
| Net income (loss) | $ | 3,986 | $ | 16,653 | $ | 23,847 | $ | 86,135 | |||||||||||||||
| Add-Back (Deduct): | |||||||||||||||||||||||
| Interest expense | 22,033 | 22,093 | 66,383 | 63,618 | |||||||||||||||||||
| Depreciation and amortization | 55,546 | 49,722 | 163,066 | 200,688 | |||||||||||||||||||
| Casualty losses (gains), net | 35 | (191) | 866 | (7,176) | |||||||||||||||||||
| Loss on impairment (gain on sale) of real estate assets, net |
11,268 | — | 10,284 | (94,712) | |||||||||||||||||||
| Merger and integration costs | — | 275 | — | 3,477 | |||||||||||||||||||
| Loss (gain) from investments in unconsolidated real estate entities |
1,178 | 1,477 | 3,159 | 2,602 | |||||||||||||||||||
| Other loss (income), net | 369 | (765) | 348 | (1,501) | |||||||||||||||||||
| Restructuring costs | — | — | 3,213 | — | |||||||||||||||||||
| Adjusted EBITDA | $ | 94,415 | $ | 89,264 | $ | 271,166 | $ | 253,131 | |||||||||||||||
| INTEREST COST: | |||||||||||||||||||||||
| Interest expense | $ | 22,033 | $ | 22,093 | $ | 66,383 | $ | 63,618 | |||||||||||||||
| INTEREST COVERAGE: | 4.3x | 4.0x | 4.1x | 4.0x | |||||||||||||||||||
| For the Three Months Ended | |||||||||||||||||||||||||||||
| Sep 30, 2023 | Jun 30, 2023 | Mar 31, 2023 | Dec 31, 2022 | Sep 30, 2022 | |||||||||||||||||||||||||
| Rental and other property revenue | |||||||||||||||||||||||||||||
| Same-store portfolio | $ | 161,811 | $ | 158,124 | $ | 154,816 | $ | 154,919 | $ | 153,584 | |||||||||||||||||||
| Non same-store portfolio | 6,564 | 5,477 | 6,319 | 7,574 | 6,716 | ||||||||||||||||||||||||
| Total rental and other property revenue | 168,375 | 163,601 | 161,135 | 162,493 | 160,300 | ||||||||||||||||||||||||
| Property operating expenses | |||||||||||||||||||||||||||||
| Same-store portfolio | 60,799 | 59,994 | 56,740 | 54,742 | 57,188 | ||||||||||||||||||||||||
| Non same-store portfolio | 2,501 | 2,077 | 2,515 | 2,708 | 2,779 | ||||||||||||||||||||||||
| Total property operating expenses | 63,300 | 62,071 | 59,255 | 57,450 | 59,967 | ||||||||||||||||||||||||
| NOI | |||||||||||||||||||||||||||||
| Same-store portfolio | 101,012 | 98,130 | 98,076 | 100,177 | 96,396 | ||||||||||||||||||||||||
| Non same-store portfolio | 4,063 | 3,400 | 3,804 | 4,866 | 3,937 | ||||||||||||||||||||||||
| Total property NOI | $ | 105,075 | $ | 101,530 | $ | 101,880 | $ | 105,043 | $ | 100,333 | |||||||||||||||||||
| For the Three-Months Ended | |||||||||||||||||||||||||||||
| Sep 30, 2023 | Jun 30, 2023 | Mar 31, 2023 | Dec 31, 2022 | Sep 30, 2022 | |||||||||||||||||||||||||
| Revenue: | |||||||||||||||||||||||||||||
| Rental and other property revenue | $ | 161,811 | $ | 158,124 | $ | 154,816 | $ | 154,919 | $ | 153,584 | |||||||||||||||||||
| Property Operating Expenses: | |||||||||||||||||||||||||||||
| Real estate taxes | 19,381 | 19,584 | 19,360 | 19,312 | 18,727 | ||||||||||||||||||||||||
| Property insurance | 4,344 | 3,857 | 3,150 | 3,316 | 3,536 | ||||||||||||||||||||||||
| Personnel expenses | 12,828 | 12,609 | 11,876 | 12,088 | 12,103 | ||||||||||||||||||||||||
| Utilities | 8,165 | 7,523 | 7,888 | 7,812 | 8,021 | ||||||||||||||||||||||||
| Repairs and maintenance | 6,389 | 6,536 | 5,801 | 3,887 | 6,013 | ||||||||||||||||||||||||
| Contract services | 5,936 | 6,303 | 5,391 | 5,057 | 5,391 | ||||||||||||||||||||||||
| Advertising expenses | 2,042 | 1,688 | 1,357 | 1,198 | 1,487 | ||||||||||||||||||||||||
| Other expenses | 1,714 | 1,894 | 1,917 | 2,072 | 1,910 | ||||||||||||||||||||||||
| Total property operating expenses | 60,799 | 59,994 | 56,740 | 54,742 | 57,188 | ||||||||||||||||||||||||
| Same-store portfolio NOI | $ | 101,012 | $ | 98,130 | $ | 98,076 | $ | 100,177 | $ | 96,396 | |||||||||||||||||||
| Same-store portfolio NOI margin | 62.4 | % | 62.1 | % | 63.4 | % | 64.7 | % | 62.8 | % | |||||||||||||||||||
| Average occupancy | 94.6 | % | 94.2 | % | 93.1 | % | 93.9 | % | 94.2 | % | |||||||||||||||||||
| Average effective monthly rent, per unit | $ | 1,549 | $ | 1,531 | $ | 1,528 | $ | 1,517 | $ | 1,484 | |||||||||||||||||||
| For the Three Months Ended September 30, | For the Nine Months Ended September 30, | ||||||||||||||||||||||||||||||||||
| 2023 | 2022 | % change | 2023 | 2022 | % change | ||||||||||||||||||||||||||||||
| Revenue: | |||||||||||||||||||||||||||||||||||
| Rental and other property revenue | $ | 161,811 | $ | 153,584 | 5.4 | % | $ | 474,751 | $ | 446,460 | 6.3 | % | |||||||||||||||||||||||
| Property Operating Expenses: | |||||||||||||||||||||||||||||||||||
| Real estate taxes | 19,381 | 18,727 | 3.5 | % | 58,325 | 57,630 | 1.2 | % | |||||||||||||||||||||||||||
| Property insurance | 4,344 | 3,536 | 22.9 | % | 11,351 | 9,343 | 21.5 | % | |||||||||||||||||||||||||||
| Personnel expenses | 12,828 | 12,103 | 6.0 | % | 37,313 | 36,752 | 1.5 | % | |||||||||||||||||||||||||||
| Utilities | 8,165 | 8,021 | 1.8 | % | 23,576 | 22,419 | 5.2 | % | |||||||||||||||||||||||||||
| Repairs and maintenance | 6,389 | 6,013 | 6.3 | % | 18,726 | 16,315 | 14.8 | % | |||||||||||||||||||||||||||
| Contract services | 5,936 | 5,391 | 10.1 | % | 17,630 | 15,362 | 14.8 | % | |||||||||||||||||||||||||||
| Advertising expenses | 2,042 | 1,487 | 37.3 | % | 5,087 | 3,947 | 28.9 | % | |||||||||||||||||||||||||||
| Other expenses | 1,714 | 1,910 | (10.3) | % | 5,525 | 5,355 | 3.2 | % | |||||||||||||||||||||||||||
| Total property operating expenses | 60,799 | 57,188 | 6.3 | % | 177,533 | 167,123 | 6.2 | % | |||||||||||||||||||||||||||
| Same-store portfolio NOI | $ | 101,012 | $ | 96,396 | 4.8 | % | $ | 297,218 | $ | 279,337 | 6.4 | % | |||||||||||||||||||||||
| Same-store portfolio NOI margin | 62.4 | % | 62.8 | % | (0.4) | % | 62.6 | % | 62.6 | % | — | % | |||||||||||||||||||||||
| Average occupancy | 94.6 | % | 94.2 | % | 0.4 | % | 93.9 | % | 95.1 | % | (1.2) | % | |||||||||||||||||||||||
| Average effective monthly rent, per unit |
$ | 1,549 | $ | 1,484 | 4.4 | % | $ | 1,536 | $ | 1,426 | 7.7 | % | |||||||||||||||||||||||
| Rental and Other Property Revenue | Property Operating Expenses | Net Operating Income | Average Occupancy | Average Effective Monthly Rent per Unit | ||||||||||||||||||||||||||||||||||||||||||||||||||||||||||||||||||||||||||||||||||||||||||||||||||||
| Market | Number of Properties | Units | 2023 | 2022 | % Change | 2023 | 2022 | % Change | 2023 | 2022 | % Change | 2023 | 2022 | % Change | 2023 | 2022 | % Change | |||||||||||||||||||||||||||||||||||||||||||||||||||||||||||||||||||||||||||||||||||||||
| Atlanta, GA | 13 | 5,180 | $ | 24,914 | $ | 23,681 | 5.2 | % | $ | 9,278 | $ | 9,124 | 1.7 | % | $ | 15,635 | $ | 14,554 | 7.4 | % | 92.3 | % | 93.5 | % | (1.2) | % | $ | 1,643 | $ | 1,579 | 4.1 | % | ||||||||||||||||||||||||||||||||||||||||||||||||||||||||||||||||||||||||
| Dallas, TX | 14 | 4,007 | 21,994 | 20,906 | 5.2 | % | 8,579 | 8,577 | — | % | 13,415 | 12,329 | 8.8 | % | 94.7 | % | 94.8 | % | (0.1) | % | 1,807 | 1,722 | 4.9 | % | ||||||||||||||||||||||||||||||||||||||||||||||||||||||||||||||||||||||||||||||||
Denver, CO (a) |
9 | 2,292 | 12,175 | 11,677 | 4.3 | % | 4,263 | 3,737 | 14.1 | % | 7,912 | 7,940 | (0.4) | % | 95.7 | % | 94.9 | % | 0.8 | % | 1,716 | 1,655 | 3.7 | % | ||||||||||||||||||||||||||||||||||||||||||||||||||||||||||||||||||||||||||||||||
| Columbus, OH | 10 | 2,510 | 10,773 | 10,056 | 7.1 | % | 4,421 | 3,759 | 17.6 | % | 6,352 | 6,297 | 0.9 | % | 94.8 | % | 93.8 | % | 1.0 | % | 1,406 | 1,324 | 6.2 | % | ||||||||||||||||||||||||||||||||||||||||||||||||||||||||||||||||||||||||||||||||
| Raleigh - Durham, NC | 6 | 1,690 | 7,977 | 7,461 | 6.9 | % | 2,811 | 2,433 | 15.5 | % | 5,166 | 5,028 | 2.7 | % | 95.1 | % | 94.1 | % | 1.0 | % | 1,551 | 1,462 | 6.1 | % | ||||||||||||||||||||||||||||||||||||||||||||||||||||||||||||||||||||||||||||||||
| Oklahoma City, OK | 8 | 2,147 | 7,962 | 7,613 | 4.6 | % | 2,836 | 2,658 | 6.7 | % | 5,125 | 4,955 | 3.4 | % | 95.0 | % | 94.6 | % | 0.4 | % | 1,177 | 1,131 | 4.1 | % | ||||||||||||||||||||||||||||||||||||||||||||||||||||||||||||||||||||||||||||||||
Houston, TX (a) |
7 | 1,932 | 8,719 | 8,098 | 7.7 | % | 3,888 | 3,721 | 4.5 | % | 4,830 | 4,378 | 10.3 | % | 95.7 | % | 93.9 | % | 1.8 | % | 1,444 | 1,410 | 2.4 | % | ||||||||||||||||||||||||||||||||||||||||||||||||||||||||||||||||||||||||||||||||
| Indianapolis, IN | 7 | 1,979 | 8,370 | 7,791 | 7.4 | % | 3,551 | 3,024 | 17.4 | % | 4,819 | 4,767 | 1.1 | % | 94.0 | % | 94.6 | % | (0.6) | % | 1,366 | 1,281 | 6.6 | % | ||||||||||||||||||||||||||||||||||||||||||||||||||||||||||||||||||||||||||||||||
| Nashville, TN | 4 | 1,412 | 7,079 | 6,742 | 5.0 | % | 2,345 | 2,234 | 5.0 | % | 4,734 | 4,507 | 5.0 | % | 95.0 | % | 94.9 | % | 0.1 | % | 1,633 | 1,565 | 4.3 | % | ||||||||||||||||||||||||||||||||||||||||||||||||||||||||||||||||||||||||||||||||
| Memphis, TN | 4 | 1,383 | 6,327 | 6,193 | 2.2 | % | 2,196 | 2,115 | 3.8 | % | 4,130 | 4,077 | 1.3 | % | 93.6 | % | 92.0 | % | 1.6 | % | 1,521 | 1,520 | 0.1 | % | ||||||||||||||||||||||||||||||||||||||||||||||||||||||||||||||||||||||||||||||||
| Tampa-St. Petersburg, FL | 4 | 1,104 | 6,247 | 5,703 | 9.5 | % | 2,218 | 2,070 | 7.1 | % | 4,029 | 3,633 | 10.9 | % | 95.3 | % | 94.1 | % | 1.2 | % | 1,827 | 1,719 | 6.3 | % | ||||||||||||||||||||||||||||||||||||||||||||||||||||||||||||||||||||||||||||||||
| Birmingham, AL | 2 | 1,074 | 4,707 | 4,619 | 1.9 | % | 1,910 | 1,720 | 11.0 | % | 2,798 | 2,899 | (3.5) | % | 93.4 | % | 93.1 | % | 0.3 | % | 1,469 | 1,441 | 1.9 | % | ||||||||||||||||||||||||||||||||||||||||||||||||||||||||||||||||||||||||||||||||
| Louisville, KY | 4 | 1,150 | 4,626 | 4,419 | 4.7 | % | 1,844 | 1,884 | (2.1) | % | 2,782 | 2,536 | 9.7 | % | 94.8 | % | 93.2 | % | 1.6 | % | 1,275 | 1,225 | 4.1 | % | ||||||||||||||||||||||||||||||||||||||||||||||||||||||||||||||||||||||||||||||||
| Huntsville, AL | 3 | 873 | 4,151 | 4,106 | 1.1 | % | 1,469 | 1,331 | 10.4 | % | 2,682 | 2,775 | (3.4) | % | 96.2 | % | 95.0 | % | 1.2 | % | 1,522 | 1,494 | 1.9 | % | ||||||||||||||||||||||||||||||||||||||||||||||||||||||||||||||||||||||||||||||||
| Lexington, KY | 3 | 886 | 3,833 | 3,555 | 7.8 | % | 1,194 | 1,192 | 0.2 | % | 2,639 | 2,363 | 11.7 | % | 97.6 | % | 96.4 | % | 1.2 | % | 1,310 | 1,242 | 5.5 | % | ||||||||||||||||||||||||||||||||||||||||||||||||||||||||||||||||||||||||||||||||
| Charlotte, NC | 2 | 480 | 2,645 | 2,524 | 4.8 | % | 726 | 737 | (1.5) | % | 1,920 | 1,787 | 7.4 | % | 95.7 | % | 95.8 | % | (0.1) | % | 1,779 | 1,689 | 5.3 | % | ||||||||||||||||||||||||||||||||||||||||||||||||||||||||||||||||||||||||||||||||
| Myrtle Beach, SC - Wilmington, NC | 3 | 628 | 2,733 | 2,632 | 3.8 | % | 890 | 756 | 17.7 | % | 1,843 | 1,876 | (1.8) | % | 94.8 | % | 93.9 | % | 0.9 | % | 1,420 | 1,380 | 2.9 | % | ||||||||||||||||||||||||||||||||||||||||||||||||||||||||||||||||||||||||||||||||
| Cincinnati, OH | 2 | 542 | 2,828 | 2,593 | 9.1 | % | 1,085 | 886 | 22.5 | % | 1,742 | 1,708 | 2.0 | % | 95.9 | % | 96.1 | % | (0.2) | % | 1,589 | 1,495 | 6.3 | % | ||||||||||||||||||||||||||||||||||||||||||||||||||||||||||||||||||||||||||||||||
| Greenville, SC | 1 | 702 | 2,607 | 2,528 | 3.1 | % | 941 | 928 | 1.4 | % | 1,667 | 1,601 | 4.1 | % | 94.3 | % | 94.6 | % | (0.3) | % | 1,279 | 1,213 | 5.4 | % | ||||||||||||||||||||||||||||||||||||||||||||||||||||||||||||||||||||||||||||||||
| Charleston, SC | 2 | 518 | 2,656 | 2,513 | 5.7 | % | 1,082 | 1,142 | (5.3) | % | 1,574 | 1,370 | 14.9 | % | 95.2 | % | 93.9 | % | 1.3 | % | 1,678 | 1,572 | 6.7 | % | ||||||||||||||||||||||||||||||||||||||||||||||||||||||||||||||||||||||||||||||||
| Orlando, FL | 1 | 297 | 1,636 | 1,468 | 11.4 | % | 659 | 610 | 8.0 | % | 977 | 859 | 13.7 | % | 93.2 | % | 91.4 | % | 1.8 | % | 1,816 | 1,713 | 6.0 | % | ||||||||||||||||||||||||||||||||||||||||||||||||||||||||||||||||||||||||||||||||
Asheville, NC (a) |
1 | 252 | 1,170 | 1,097 | 6.7 | % | 334 | 323 | 3.4 | % | 837 | 773 | 8.3 | % | 96.4 | % | 95.9 | % | 0.5 | % | 1,553 | 1,423 | 9.1 | % | ||||||||||||||||||||||||||||||||||||||||||||||||||||||||||||||||||||||||||||||||
| San Antonio, TX | 1 | 306 | 1,465 | 1,460 | 0.3 | % | 654 | 556 | 17.6 | % | 811 | 904 | (10.3) | % | 96.6 | % | 97.1 | % | (0.5) | % | 1,480 | 1,495 | (1.0) | % | ||||||||||||||||||||||||||||||||||||||||||||||||||||||||||||||||||||||||||||||||
| Austin, TX | 1 | 256 | 1,373 | 1,311 | 4.7 | % | 585 | 667 | (12.3) | % | 788 | 644 | 22.4 | % | 92.3 | % | 93.6 | % | (1.3) | % | 1,804 | 1,690 | 6.7 | % | ||||||||||||||||||||||||||||||||||||||||||||||||||||||||||||||||||||||||||||||||
Norfolk, VA (a) |
1 | 183 | 1,040 | 1,018 | 2.2 | % | 374 | 342 | 9.4 | % | 666 | 676 | (1.5) | % | 96.8 | % | 96.2 | % | 0.6 | % | 1,913 | 1,840 | 4.0 | % | ||||||||||||||||||||||||||||||||||||||||||||||||||||||||||||||||||||||||||||||||
Fort Wayne, IN (a) |
1 | 222 | 986 | 967 | 2.0 | % | 329 | 322 | 2.2 | % | 658 | 646 | 1.9 | % | 94.9 | % | 95.8 | % | (0.9) | % | 1,428 | 1,392 | 2.6 | % | ||||||||||||||||||||||||||||||||||||||||||||||||||||||||||||||||||||||||||||||||
Chattanooga, TN (a) |
1 | 192 | 818 | 853 | (4.1) | % | 337 | 340 | (0.9) | % | 481 | 514 | (6.4) | % | 93.9 | % | 96.0 | % | (2.1) | % | 1,412 | 1,412 | — | % | ||||||||||||||||||||||||||||||||||||||||||||||||||||||||||||||||||||||||||||||||
| Total / Weighted Average |
115 | 34,197 | $ | 161,811 | $ | 153,584 | 5.4 | % | $ | 60,799 | $ | 57,188 | 6.3 | % | $ | 101,012 | $ | 96,396 | 4.8 | % | 94.6 | % | 94.2 | % | 0.4 | % | $ | 1,549 | $ | 1,484 | 4.4 | % | ||||||||||||||||||||||||||||||||||||||||||||||||||||||||||||||||||||||||
| Rental and Other Property Revenue | Property Operating Expenses | Net Operating Income | Average Occupancy | Average Effective Monthly Rent per Unit | ||||||||||||||||||||||||||||||||||||||||||||||||||||||||||||||||||||||||||||||||||||||||||||||||||||
| Market | Number of Properties | Units | 2023 | 2022 | % Change | 2023 | 2022 | % Change | 2023 | 2022 | % Change | 2023 | 2022 | % Change | 2023 | 2022 | % Change | |||||||||||||||||||||||||||||||||||||||||||||||||||||||||||||||||||||||||||||||||||||||
| Atlanta, GA | 13 | 5,180 | $ | 72,470 | $ | 69,152 | 4.8 | % | $ | 27,006 | $ | 25,501 | 5.9 | % | $ | 45,463 | $ | 43,649 | 4.2 | % | 92.1 | % | 94.3 | % | (2.2) | % | $ | 1,633 | $ | 1,513 | 7.9 | % | ||||||||||||||||||||||||||||||||||||||||||||||||||||||||||||||||||||||||
| Dallas, TX | 14 | 4,007 | 64,949 | 60,960 | 6.5 | % | 25,899 | 26,224 | (1.2) | % | 39,050 | 34,736 | 12.4 | % | 94.2 | % | 95.5 | % | (1.3) | % | 1,794 | 1,660 | 8.1 | % | ||||||||||||||||||||||||||||||||||||||||||||||||||||||||||||||||||||||||||||||||
Denver, CO (a) |
9 | 2,292 | 36,071 | 33,729 | 6.9 | % | 11,739 | 10,566 | 11.1 | % | 24,332 | 23,163 | 5.0 | % | 94.7 | % | 95.4 | % | (0.7) | % | 1,706 | 1,601 | 6.6 | % | ||||||||||||||||||||||||||||||||||||||||||||||||||||||||||||||||||||||||||||||||
| Columbus, OH | 10 | 2,510 | 31,581 | 29,368 | 7.5 | % | 12,110 | 11,275 | 7.4 | % | 19,471 | 18,093 | 7.6 | % | 94.8 | % | 95.0 | % | (0.2) | % | 1,380 | 1,273 | 8.4 | % | ||||||||||||||||||||||||||||||||||||||||||||||||||||||||||||||||||||||||||||||||
| Raleigh - Durham, NC | 6 | 1,690 | 23,583 | 21,412 | 10.1 | % | 7,971 | 7,271 | 9.6 | % | 15,613 | 14,141 | 10.4 | % | 94.3 | % | 95.1 | % | (0.8) | % | 1,538 | 1,383 | 11.2 | % | ||||||||||||||||||||||||||||||||||||||||||||||||||||||||||||||||||||||||||||||||
| Oklahoma City, OK | 8 | 2,147 | 23,223 | 22,067 | 5.2 | % | 8,056 | 7,623 | 5.7 | % | 15,167 | 14,444 | 5.0 | % | 93.5 | % | 95.5 | % | (2.0) | % | 1,169 | 1,087 | 7.5 | % | ||||||||||||||||||||||||||||||||||||||||||||||||||||||||||||||||||||||||||||||||
| Indianapolis, IN | 7 | 1,979 | 24,588 | 22,651 | 8.6 | % | 9,643 | 8,849 | 9.0 | % | 14,945 | 13,802 | 8.3 | % | 93.8 | % | 95.1 | % | (1.3) | % | 1,349 | 1,237 | 9.1 | % | ||||||||||||||||||||||||||||||||||||||||||||||||||||||||||||||||||||||||||||||||
Houston, TX (a) |
7 | 1,932 | 25,724 | 24,054 | 6.9 | % | 11,988 | 11,424 | 4.9 | % | 13,735 | 12,630 | 8.7 | % | 95.2 | % | 94.5 | % | 0.7 | % | 1,434 | 1,374 | 4.4 | % | ||||||||||||||||||||||||||||||||||||||||||||||||||||||||||||||||||||||||||||||||
| Nashville, TN | 4 | 1,412 | 20,460 | 19,705 | 3.8 | % | 7,075 | 6,742 | 4.9 | % | 13,385 | 12,963 | 3.3 | % | 93.1 | % | 95.6 | % | (2.5) | % | 1,611 | 1,505 | 7.0 | % | ||||||||||||||||||||||||||||||||||||||||||||||||||||||||||||||||||||||||||||||||
| Memphis, TN | 4 | 1,383 | 18,575 | 17,646 | 5.3 | % | 6,240 | 6,019 | 3.7 | % | 12,335 | 11,627 | 6.1 | % | 93.8 | % | 93.5 | % | 0.3 | % | 1,508 | 1,442 | 4.6 | % | ||||||||||||||||||||||||||||||||||||||||||||||||||||||||||||||||||||||||||||||||
| Tampa-St. Petersburg, FL | 4 | 1,104 | 18,216 | 16,192 | 12.5 | % | 6,833 | 6,119 | 11.7 | % | 11,383 | 10,074 | 13.0 | % | 95.0 | % | 94.4 | % | 0.6 | % | 1,803 | 1,621 | 11.2 | % | ||||||||||||||||||||||||||||||||||||||||||||||||||||||||||||||||||||||||||||||||
| Birmingham, AL | 2 | 1,074 | 13,836 | 13,911 | (0.5) | % | 5,666 | 5,268 | 7.6 | % | 8,171 | 8,642 | (5.5) | % | 91.1 | % | 94.3 | % | (3.2) | % | 1,469 | 1,410 | 4.2 | % | ||||||||||||||||||||||||||||||||||||||||||||||||||||||||||||||||||||||||||||||||
| Huntsville, AL | 3 | 873 | 12,250 | 11,941 | 2.6 | % | 4,282 | 3,853 | 11.1 | % | 7,968 | 8,088 | (1.5) | % | 95.3 | % | 95.4 | % | (0.1) | % | 1,538 | 1,462 | 5.2 | % | ||||||||||||||||||||||||||||||||||||||||||||||||||||||||||||||||||||||||||||||||
| Louisville, KY | 4 | 1,150 | 13,544 | 13,025 | 4.0 | % | 5,722 | 5,479 | 4.4 | % | 7,822 | 7,546 | 3.7 | % | 93.5 | % | 94.3 | % | (0.8) | % | 1,277 | 1,185 | 7.8 | % | ||||||||||||||||||||||||||||||||||||||||||||||||||||||||||||||||||||||||||||||||
| Lexington, KY | 3 | 886 | 11,179 | 10,381 | 7.7 | % | 3,441 | 3,443 | (0.1) | % | 7,739 | 6,938 | 11.5 | % | 96.8 | % | 96.3 | % | 0.5 | % | 1,285 | 1,201 | 7.0 | % | ||||||||||||||||||||||||||||||||||||||||||||||||||||||||||||||||||||||||||||||||
| Charlotte, NC | 2 | 480 | 7,921 | 7,179 | 10.3 | % | 2,354 | 2,251 | 4.6 | % | 5,567 | 4,928 | 13.0 | % | 95.8 | % | 96.0 | % | (0.2) | % | 1,766 | 1,597 | 10.6 | % | ||||||||||||||||||||||||||||||||||||||||||||||||||||||||||||||||||||||||||||||||
| Myrtle Beach, SC - Wilmington, NC | 3 | 628 | 8,024 | 7,344 | 9.3 | % | 2,508 | 2,259 | 11.0 | % | 5,516 | 5,085 | 8.5 | % | 95.0 | % | 95.6 | % | (0.6) | % | 1,410 | 1,270 | 11.0 | % | ||||||||||||||||||||||||||||||||||||||||||||||||||||||||||||||||||||||||||||||||
| Cincinnati, OH | 2 | 542 | 8,057 | 7,568 | 6.5 | % | 3,042 | 2,444 | 24.5 | % | 5,015 | 5,124 | (2.1) | % | 94.3 | % | 96.6 | % | (2.3) | % | 1,563 | 1,450 | 7.8 | % | ||||||||||||||||||||||||||||||||||||||||||||||||||||||||||||||||||||||||||||||||
| Greenville, SC | 1 | 702 | 7,772 | 7,276 | 6.8 | % | 2,898 | 2,693 | 7.6 | % | 4,874 | 4,583 | 6.3 | % | 94.0 | % | 94.9 | % | (0.9) | % | 1,259 | 1,168 | 7.8 | % | ||||||||||||||||||||||||||||||||||||||||||||||||||||||||||||||||||||||||||||||||
| Charleston, SC | 2 | 518 | 7,779 | 7,181 | 8.3 | % | 3,244 | 2,815 | 15.2 | % | 4,535 | 4,366 | 3.9 | % | 94.6 | % | 95.7 | % | (1.1) | % | 1,638 | 1,486 | 10.2 | % | ||||||||||||||||||||||||||||||||||||||||||||||||||||||||||||||||||||||||||||||||
| Orlando, FL | 1 | 297 | 4,705 | 4,254 | 10.6 | % | 1,998 | 1,760 | 13.5 | % | 2,707 | 2,494 | 8.5 | % | 93.1 | % | 94.5 | % | (1.4) | % | 1,801 | 1,617 | 11.4 | % | ||||||||||||||||||||||||||||||||||||||||||||||||||||||||||||||||||||||||||||||||
Asheville, NC (a) |
1 | 252 | 3,460 | 3,083 | 12.2 | % | 960 | 883 | 8.7 | % | 2,500 | 2,200 | 13.6 | % | 96.5 | % | 96.7 | % | (0.2) | % | 1,518 | 1,338 | 13.5 | % | ||||||||||||||||||||||||||||||||||||||||||||||||||||||||||||||||||||||||||||||||
| San Antonio, TX | 1 | 306 | 4,352 | 4,334 | 0.4 | % | 2,001 | 1,815 | 10.2 | % | 2,350 | 2,519 | (6.7) | % | 96.1 | % | 96.5 | % | (0.4) | % | 1,484 | 1,472 | 0.8 | % | ||||||||||||||||||||||||||||||||||||||||||||||||||||||||||||||||||||||||||||||||
| Austin, TX | 1 | 256 | 4,041 | 3,849 | 5.0 | % | 1,811 | 1,740 | 4.1 | % | 2,230 | 2,109 | 5.7 | % | 91.3 | % | 95.6 | % | (4.3) | % | 1,786 | 1,620 | 10.2 | % | ||||||||||||||||||||||||||||||||||||||||||||||||||||||||||||||||||||||||||||||||
Fort Wayne, IN (a) |
1 | 222 | 2,964 | 2,823 | 5.0 | % | 955 | 928 | 2.9 | % | 2,009 | 1,896 | 6.0 | % | 94.1 | % | 95.4 | % | (1.3) | % | 1,430 | 1,351 | 5.8 | % | ||||||||||||||||||||||||||||||||||||||||||||||||||||||||||||||||||||||||||||||||
Norfolk, VA (a) |
1 | 183 | 3,049 | 2,893 | 5.4 | % | 1,085 | 918 | 18.2 | % | 1,964 | 1,976 | (0.6) | % | 95.7 | % | 95.4 | % | 0.3 | % | 1,896 | 1,782 | 6.4 | % | ||||||||||||||||||||||||||||||||||||||||||||||||||||||||||||||||||||||||||||||||
Chattanooga, TN (a) |
1 | 192 | 2,378 | 2,482 | (4.2) | % | 1,006 | 961 | 4.7 | % | 1,372 | 1,521 | (9.8) | % | 92.8 | % | 96.6 | % | (3.8) | % | 1,390 | 1,367 | 1.7 | % | ||||||||||||||||||||||||||||||||||||||||||||||||||||||||||||||||||||||||||||||||
| Total/Weighted Average | 115 | 34,197 | $ | 474,751 | $ | 446,460 | 6.3 | % | $ | 177,533 | $ | 167,123 | 6.2 | % | $ | 297,218 | $ | 279,337 | 6.4 | % | 93.9 | % | 95.1 | % | (1.2) | % | $ | 1,536 | $ | 1,426 | 7.7 | % | ||||||||||||||||||||||||||||||||||||||||||||||||||||||||||||||||||||||||
| For the Three Months Ended September 30, 2023 |
||||||||||||||||||||||||||||||||||||||||||||
| Market | Number of Properties | Units | Gross Real Estate Assets |
Period End Occupancy |
Average Effective Monthly Rent per Unit |
NOI | % of NOI | |||||||||||||||||||||||||||||||||||||
| Atlanta, GA | 13 | 5,180 | $ | 1,086,056 | 92.3 | % | $ | 1,643 | $ | 15,635 | 14.9 | % | ||||||||||||||||||||||||||||||||
| Dallas, TX | 14 | 4,007 | 863,869 | 94.3 | % | 1,807 | 13,415 | 12.8 | % | |||||||||||||||||||||||||||||||||||
Denver, CO (b) (c) |
9 | 2,292 | 610,637 | 95.4 | % | 1,716 | 7,912 | 7.3 | % | |||||||||||||||||||||||||||||||||||
| Columbus, OH | 10 | 2,510 | 373,832 | 94.4 | % | 1,406 | 6,352 | 6.1 | % | |||||||||||||||||||||||||||||||||||
| Raleigh - Durham, NC | 6 | 1,690 | 255,277 | 95.4 | % | 1,551 | 5,166 | 4.9 | % | |||||||||||||||||||||||||||||||||||
| Oklahoma City, OK | 8 | 2,147 | 327,074 | 95.3 | % | 1,177 | 5,125 | 4.9 | % | |||||||||||||||||||||||||||||||||||
| Tampa-St. Petersburg, FL | 5 | 1,452 | 307,400 | 95.4 | % | 1,825 | 5,124 | 4.9 | % | |||||||||||||||||||||||||||||||||||
| Nashville, TN | 5 | 1,508 | 370,731 | 94.3 | % | 1,624 | 5,044 | 4.8 | % | |||||||||||||||||||||||||||||||||||
Houston, TX (c) |
7 | 1,932 | 324,821 | 95.3 | % | 1,444 | 4,830 | 4.6 | % | |||||||||||||||||||||||||||||||||||
| Indianapolis, IN | 7 | 1,979 | 293,011 | 93.7 | % | 1,366 | 4,819 | 4.6 | % | |||||||||||||||||||||||||||||||||||
| Memphis, TN | 4 | 1,383 | 162,123 | 92.8 | % | 1,521 | 4,130 | 3.9 | % | |||||||||||||||||||||||||||||||||||
Huntsville, AL (d) |
4 | 1,051 | 241,013 | 94.5 | % | 1,529 | 3,057 | 2.9 | % | |||||||||||||||||||||||||||||||||||
| Birmingham, AL | 2 | 1,074 | 233,604 | 93.7 | % | 1,469 | 2,798 | 2.7 | % | |||||||||||||||||||||||||||||||||||
| Charlotte, NC | 3 | 714 | 189,550 | 95.8 | % | 1,767 | 2,789 | 2.7 | % | |||||||||||||||||||||||||||||||||||
| Louisville, KY | 4 | 1,150 | 147,848 | 95.6 | % | 1,275 | 2,782 | 2.7 | % | |||||||||||||||||||||||||||||||||||
| Lexington, KY | 3 | 886 | 160,777 | 96.7 | % | 1,310 | 2,639 | 2.5 | % | |||||||||||||||||||||||||||||||||||
| Myrtle Beach, SC - Wilmington, NC | 3 | 628 | 68,543 | 95.8 | % | 1,420 | 1,843 | 1.8 | % | |||||||||||||||||||||||||||||||||||
| Cincinnati, OH | 2 | 542 | 123,081 | 95.6 | % | 1,589 | 1,742 | 1.7 | % | |||||||||||||||||||||||||||||||||||
| Greenville, SC | 1 | 702 | 124,027 | 93.9 | % | 1,279 | 1,667 | 1.6 | % | |||||||||||||||||||||||||||||||||||
| Charleston, SC | 2 | 518 | 81,529 | 94.4 | % | 1,678 | 1,574 | 1.5 | % | |||||||||||||||||||||||||||||||||||
Chicago, IL (e) |
1 | 374 | 79,158 | 93.6 | % | 1,847 | 1,282 | 1.2 | % | |||||||||||||||||||||||||||||||||||
| Orlando, FL | 1 | 297 | 50,306 | 96.3 | % | 1,816 | 977 | 0.9 | % | |||||||||||||||||||||||||||||||||||
Asheville, NC (c) |
1 | 252 | 29,349 | 96.4 | % | 1,553 | 837 | 0.8 | % | |||||||||||||||||||||||||||||||||||
| San Antonio, TX | 1 | 306 | 57,269 | 97.7 | % | 1,480 | 811 | 0.8 | % | |||||||||||||||||||||||||||||||||||
| Austin, TX | 1 | 256 | 58,568 | 92.9 | % | 1,804 | 788 | 0.8 | % | |||||||||||||||||||||||||||||||||||
Norfolk, VA (c) |
1 | 183 | 54,297 | 97.3 | % | 1,913 | 666 | 0.6 | % | |||||||||||||||||||||||||||||||||||
Fort Wayne, IN (c) |
1 | 222 | 44,506 | 95.5 | % | 1,428 | 658 | 0.6 | % | |||||||||||||||||||||||||||||||||||
Chattanooga, TN (c) |
1 | 192 | 37,336 | 91.1 | % | 1,412 | 481 | 0.5 | % | |||||||||||||||||||||||||||||||||||
| Total / Weighted Average | 120 | 35,427 | $ | 6,755,592 | 94.4 | % | $ | 1,556 | $ | 104,943 | 100.0 | % | ||||||||||||||||||||||||||||||||
| Renovation Costs per Unit (b) | |||||||||||||||||||||||||||||||||||
| Market | Total Properties | Total Units To Be Renovated |
Units Complete | Units Leased |
Rent Premium (a) | % Rent Increase | Interior | Exterior | Total | ROI - Interior Costs(c) | ROI - Total Costs (d) | ||||||||||||||||||||||||
| Ongoing | |||||||||||||||||||||||||||||||||||
| Memphis, TN | 1 | 362 | 265 | 271 | $ | 373 | 34.1 | % | $ | 15,281 | $ | 807 | $ | 16,088 | 29.3 | % | 27.8 | % | |||||||||||||||||
| Indianapolis, IN | 1 | 236 | 167 | 168 | 254 | 23.4 | % | 15,451 | 805 | 16,256 | 19.7 | % | 18.7 | % | |||||||||||||||||||||
| Raleigh-Durham, NC | 1 | 318 | 213 | 214 | 192 | 15.2 | % | 15,648 | 1,046 | 16,694 | 14.7 | % | 13.8 | % | |||||||||||||||||||||
| Tampa-St. Petersburg, FL | 2 | 612 | 315 | 325 | 362 | 24.7 | % | 15,922 | 943 | 16,865 | 27.2 | % | 25.7 | % | |||||||||||||||||||||
Atlanta, GA (e) |
5 | 2,180 | 1,220 | 1,238 | 238 | 19.2 | % | 14,839 | 1,235 | 16,074 | 19.3 | % | 17.8 | % | |||||||||||||||||||||
| Austin, TX | 1 | 256 | 139 | 135 | 219 | 14.7 | % | 17,466 | 1,104 | 18,570 | 15.0 | % | 14.1 | % | |||||||||||||||||||||
| Oklahoma City, OK | 3 | 793 | 386 | 386 | 137 | 15.9 | % | 17,180 | 1,025 | 18,205 | 9.6 | % | 9.0 | % | |||||||||||||||||||||
| Columbus, OH | 3 | 786 | 300 | 295 | 270 | 21.8 | % | 14,045 | 880 | 14,925 | 23.1 | % | 21.7 | % | |||||||||||||||||||||
| Dallas, TX | 4 | 1,199 | 400 | 394 | 279 | 19.4 | % | 18,905 | 1,879 | 20,784 | 17.7 | % | 16.1 | % | |||||||||||||||||||||
| Nashville, TN | 1 | 724 | 213 | 203 | 151 | 10.7 | % | 16,199 | 1,664 | 17,863 | 11.2 | % | 10.1 | % | |||||||||||||||||||||
| Total / Weighted Average | 22 | 7,466 | 3,618 | 3,629 | $ | 248 | 20.0 | % | $15,856 | $ | 1,250 | $ | 17,106 | 20.0 | % | 18.7 | % | ||||||||||||||||||
| Future (f) | |||||||||||||||||||||||||||||||||||
| Atlanta, GA | 1 | 180 | — | — | — | — | — | — | — | — | — | ||||||||||||||||||||||||
| Oklahoma City, OK | 1 | 294 | — | — | — | — | — | — | — | — | — | ||||||||||||||||||||||||
| Total / Weighted Average | 2 | 474 | — | — | — | — | — | — | — | — | — | ||||||||||||||||||||||||
| Completed (g) | |||||||||||||||||||||||||||||||||||
| Wilmington, NC | 1 | 288 | 288 | 287 | $ | 72 | 7.2 | % | $ | 8,076 | $ | 56 | $ | 8,132 | 10.8 | % | 10.7 | % | |||||||||||||||||
| Raleigh-Durham, NC | 1 | 328 | 325 | 323 | 184 | 18.0 | % | 14,648 | 2,108 | 16,756 | 15.1 | % | 13.2 | % | |||||||||||||||||||||
| Louisville, KY | 2 | 728 | 717 | 771 | 212 | 23.8 | % | 15,445 | 2,173 | 17,618 | 16.5 | % | 14.5 | % | |||||||||||||||||||||
| Memphis, TN | 2 | 691 | 638 | 639 | 189 | 18.7 | % | 11,659 | 974 | 12,633 | 19.5 | % | 18.0 | % | |||||||||||||||||||||
| Atlanta, GA | 1 | 494 | 455 | 454 | 176 | 17.5 | % | 9,122 | 1,773 | 10,895 | 23.1 | % | 19.3 | % | |||||||||||||||||||||
| Columbus, OH | 3 | 763 | 690 | 685 | 204 | 22.5 | % | 10,142 | 666 | 10,808 | 24.1 | % | 22.7 | % | |||||||||||||||||||||
| Tampa-St. Petersburg, FL | 2 | 624 | 554 | 553 | 226 | 19.2 | % | 13,220 | 1,482 | 14,702 | 20.5 | % | 18.4 | % | |||||||||||||||||||||
| Total / Weighted Average | 12 | 3,916 | 3,667 | 3,712 | $ | 191 | 19.5 | % | $ | 12,018 | $ | 1,346 | $ | 13,364 | 19.2 | % | 17.2 | % | |||||||||||||||||
| Grand Total/Weighted Average | 36 | 11,856 | 7,285 | 7,341 | $ | 213 | 19.7 | % | $ | 13,927 | $ | 1,262 | $ | 15,189 | 19.5 | % | 17.9 | % | |||||||||||||||||
2023 DISPOSITIONS | ||||||||||||||
| Property | Location | Units | Disposition Date | Sale Price | Price per Unit | Average Rent Per Unit at Disposition | Gain on Sale of Real Estate, Net | |||||||||||||||||||||||||||||||||||||
| Eagle Lake Landing | Indianapolis, IN | 277 | February 28, 2023 | $ | 37,300 | $ | 135 | $ | 1,184 | $ | 985 | |||||||||||||||||||||||||||||||||
ASSETS HELD FOR SALE AS OF SEPTEMBER 30, 2023 | ||||||||||||||
| Property | Location | Units | ||||||||||||
| The Meadows at River Run | Chicago, Illinois | 374 | ||||||||||||
REAL ESTATE UNDER DEVELOPMENT | ||||||||||||||
| Development | Destination at Arista (a) |
Flatirons Apartments | ||||||||||||
| Location | Denver, Colorado | Denver, Colorado | ||||||||||||
| Planned Units | 325 | 296 | ||||||||||||
| Start Date | 3Q 2021 | 4Q 2022 | ||||||||||||
| Projected Initial Occupancy | 2Q 2023 | 4Q 2024 | ||||||||||||
| Projected Completion Date | 4Q 2023 | 4Q 2024 | ||||||||||||
| Projected Stabilization date | 1Q 2025 | 1Q 2026 | ||||||||||||
| Total Estimated Development Costs | $102,800 | $119,800 | ||||||||||||
| Total Development Costs through September 30, 2023 | $107,143 | $53,924 | ||||||||||||
| % of Development Costs Left to Fund | 2% | 56% | ||||||||||||
| Real Estate Under Development at September 30, 2023 | $29,623 | $53,924 | ||||||||||||
| % of Planned Units Delivered as of October 27, 2023 | 73.5% | N/A | ||||||||||||
Leased % as of October 27, 2023 (b) |
38.9% | N/A | ||||||||||||
Occupancy % as of October 27, 2023 (b) |
38.1% | N/A | ||||||||||||
INVESTMENTS IN UNCONSOLIDATED REAL ESTATE ENTITIES (a) | ||||||||||||||
| Property | Location | Units | Estimated Delivery Date | Total Construction Budget | Total Project Debt | IRT Equity Interest in JV | Remaining Expected IRT Investment | Carrying Value of IRT’s Investment | ||||||||||||||||||||||||||||||||||||||||||
Metropolis at Innsbrook (b) |
Richmond, VA | 402 | — | $ | 85,883 | $ | 64,000 | 84.8 | % | $ | — | $ | 17,576 | |||||||||||||||||||||||||||||||||||||
|
Views of Music City II /
The Crockett (c)
|
Nashville, TN | 408 | Q3 2023 | 66,079 | 43,275 | 50.0 | % | — | 11,632 | |||||||||||||||||||||||||||||||||||||||||
| Lakeline Station | Austin, TX | 378 | Q3 2024 | 109,524 | 76,500 | 90.0 | % | — | 31,585 | |||||||||||||||||||||||||||||||||||||||||
| The Mustang | Dallas, TX | 275 | Q4 2024 | 109,583 | 79,447 | 85.0 | % | — | 26,799 | |||||||||||||||||||||||||||||||||||||||||
| Total | 1,463 | $ | 371,069 | $ | 263,222 | $ | — | $ | 87,592 | |||||||||||||||||||||||||||||||||||||||||
| Amount | Weighted Average Rate (d) |
Type | Weighted Average Maturity (in years) |
|||||||||||||||||||||||
| Debt: | ||||||||||||||||||||||||||
Unsecured revolver (a) |
$ | 241,479 | 6.6 | % | Floating | 2.3 | ||||||||||||||||||||
Unsecured term loans (b) |
600,000 | 6.5 | % | Floating | 3.8 | |||||||||||||||||||||
Secured credit facilities (c) |
617,114 | 4.3 | % | Floating/Fixed | 5.2 | |||||||||||||||||||||
| Mortgages | 1,218,462 | 4.0 | % | Fixed | 4.4 | |||||||||||||||||||||
| Total Principal | 2,677,055 | 4.9 | % | 4.3 | ||||||||||||||||||||||
| Loan premiums (discounts), net | 50,772 | |||||||||||||||||||||||||
| Unamortized deferred financing costs | (12,117) | |||||||||||||||||||||||||
| Total Consolidated Debt | 2,715,710 | |||||||||||||||||||||||||
| Market Equity Capitalization, at period end | 3,245,135 | |||||||||||||||||||||||||
| Total Capitalization | $ | 5,960,845 | ||||||||||||||||||||||||


| Hedges: | Notional | Start | End | Swap Rate | Floor Rate | Cap Rate | ||||||||||||||||||||||||||||||||
| Collar | $ | 100,000 | 11/17/2017 | 11/17/2024 | — | 1.25 | % | 2.00 | % | |||||||||||||||||||||||||||||
| Collar | $ | 150,000 | 10/17/2018 | 1/17/2024 | — | 2.25 | % | 2.50 | % | |||||||||||||||||||||||||||||
| Swap | $ | 150,000 | 6/17/2021 | 6/17/2026 | 2.18 | % | — | — | ||||||||||||||||||||||||||||||
| Swap | $ | 150,000 | 5/17/2022 | 5/17/2027 | 0.99 | % | — | — | ||||||||||||||||||||||||||||||
| Swap | $ | 200,000 | 3/17/2023 | 3/17/2030 | 3.39 | % | — | — | ||||||||||||||||||||||||||||||
| Forward starting collar | $ | 100,000 | 1/17/2024 | 1/17/2028 | — | 1.50 | % | 2.50 | % | |||||||||||||||||||||||||||||
| Forward starting collar | $ | 100,000 | 11/17/2024 | 1/17/2028 | — | 1.50 | % | 2.50 | % | |||||||||||||||||||||||||||||
| Requirement | Actual | Compliance | ||||||||||||||||||
| Consolidated leverage ratio | ≤ 60% | 36.3% | Yes | |||||||||||||||||
| Consolidated fixed charge coverage ratio | ≥ 1.5x | 2.68x | Yes | |||||||||||||||||
| Unsecured leverage ratio | ≤ 60% | 26.4% | Yes | |||||||||||||||||
| Total Units | % of Total | Gross Assets | % of Total | Q3 2023 NOI | % of Total | |||||||||||||||||||||||||||||||||
| Unencumbered assets | 18,164 | 51.3 | % | $ | 3,537,086 | 49.0 | % | $ | 53,775 | 51.2 | % | |||||||||||||||||||||||||||
| Encumbered assets | 17,263 | 48.7 | % | 3,688,361 | 51.0 | % | 51,168 | 48.8 | % | |||||||||||||||||||||||||||||
| 35,427 | 100.0 | % | $ | 7,225,447 | 100.0 | % | $ | 104,943 | 100.0 | % | ||||||||||||||||||||||||||||
| As of | ||||||||||||||||||||||||||||||||
| Sep 30, 2023 | Jun 30, 2023 | Mar 31, 2023 | Dec 31, 2022 | Sep 30, 2022 | ||||||||||||||||||||||||||||
| Total debt | $ | 2,715,710 | $ | 2,650,805 | $ | 2,628,632 | $ | 2,631,645 | $ | 2,713,625 | ||||||||||||||||||||||
| Less: cash and cash equivalents | (17,216) | (14,349) | (12,448) | (16,084) | (23,753) | |||||||||||||||||||||||||||
| Less: loan discounts and premiums, net | (50,772) | (53,520) | (56,256) | (59,937) | (63,340) | |||||||||||||||||||||||||||
| Total net debt | $ | 2,647,722 | $ | 2,582,936 | $ | 2,559,928 | $ | 2,555,624 | $ | 2,626,532 | ||||||||||||||||||||||
| For the Three Months Ended | |||||||||||||||||||||||||||||
| Sep 30, 2023 | Jun 30, 2023 | Mar 31, 2023 | Dec 31, 2022 | Sep 30, 2022 | |||||||||||||||||||||||||
| Net income | $ | 3,986 | $ | 10,988 | $ | 8,872 | $ | 34,524 | $ | 16,653 | |||||||||||||||||||
| Other revenue | (232) | (354) | (239) | (306) | (300) | ||||||||||||||||||||||||
| Property management expenses | 7,232 | 6,818 | 6,371 | 6,593 | 5,744 | ||||||||||||||||||||||||
| General and administrative expenses |
3,660 | 5,910 | 8,154 | 5,739 | 5,625 | ||||||||||||||||||||||||
| Depreciation and amortization expense |
55,546 | 53,984 | 53,536 | 52,161 | 49,722 | ||||||||||||||||||||||||
| Casualty losses (gains), net | 35 | 680 | 151 | (1,690) | (191) | ||||||||||||||||||||||||
| Interest expense | 22,033 | 22,227 | 22,124 | 23,337 | 22,093 | ||||||||||||||||||||||||
| Loss on impairment (gain on sale) of real estate assets, net |
11,268 | — | (985) | (17,044) | — | ||||||||||||||||||||||||
| Other loss (income), net | 369 | 72 | (93) | (57) | (765) | ||||||||||||||||||||||||
| Loss (gain) from investments in unconsolidated real estate entities |
1,178 | 1,205 | 776 | (242) | 1,477 | ||||||||||||||||||||||||
| Merger and integration costs | — | — | — | 2,028 | 275 | ||||||||||||||||||||||||
| Restructuring costs | — | — | 3,213 | — | — | ||||||||||||||||||||||||
| NOI | $ | 105,075 | $ | 101,530 | $ | 101,880 | $ | 105,043 | $ | 100,333 | |||||||||||||||||||
| Less: Non same-store portfolio NOI | 4,063 | 3,400 | 3,804 | 4,866 | 3,937 | ||||||||||||||||||||||||
| Same-store portfolio NOI | $ | 101,012 | $ | 98,130 | $ | 98,076 | $ | 100,177 | $ | 96,396 | |||||||||||||||||||
| As of | ||||||||||||||||||||||||||||||||
| Sep 30, 2023 | Jun 30, 2023 | Mar 31, 2023 | Dec 31, 2022 | Sep 30, 2022 | ||||||||||||||||||||||||||||
| Total assets | $ | 6,577,790 | $ | 6,517,400 | $ | 6,493,747 | $ | 6,532,095 | $ | 6,633,533 | ||||||||||||||||||||||
Plus: accumulated depreciation (a) |
570,966 | 523,446 | 475,001 | 426,097 | 386,606 | |||||||||||||||||||||||||||
| Plus: accumulated amortization | 76,691 | 76,558 | 76,558 | 76,710 | 77,141 | |||||||||||||||||||||||||||
| Total gross assets | $ | 7,225,447 | $ | 7,117,404 | $ | 7,045,306 | $ | 7,034,902 | $ | 7,097,280 | ||||||||||||||||||||||