| Illinois | 001-35272 | 37-1233196 | ||||||||||||
| (State or Other Jurisdiction of Incorporation) | (Commission File Number) | (IRS Employer Identification No.) | ||||||||||||
1201 Network Centre Drive | ||
Effingham, Illinois 62401 | ||
| (Address of Principal Executive Offices) (Zip Code) | ||
| ☐ | Written communications pursuant to Rule 425 under the Securities Act (17 CFR 230.425) | ||||
| ☐ | Soliciting material pursuant to Rule 14a-12 under the Exchange Act (17 CFR 240.14a-12) | ||||
| ☐ | Pre-commencement communications pursuant to Rule 14d-2(b) under the Exchange Act (17 CFR 240.14d-2(b)) | ||||
| ☐ | Pre-commencement communications pursuant to Rule 13e-4(c) under the Exchange Act (17 CFR 240.13e-4(c)) | ||||
| Title of each class | Trading symbol(s) | Name of each exchange on which registered | ||||||
| Common Stock, $0.01 par value | MSBI | The Nasdaq Market LLC | ||||||
| Depositary Shares, each representing a 1/40th interest in a share of 7.75% fixed rate reset non-cumulative perpetual preferred stock, Series A, $2.00 par value | MSBIP | The Nasdaq Market LLC | ||||||
| Exhibit No. | Description | ||||||||||
Press Release of Midland States Bancorp, Inc., dated July 27, 2023 |
|||||||||||
Slide Presentation of Midland States Bancorp, Inc. regarding second quarter 2023 financial results |
|||||||||||
| 104 | Cover Page Interactive Data File (embedded within the Inline XBRL document) | ||||||||||
Date: July 27, 2023 |
By: | /s/ Eric T. Lemke | ||||||
| Eric T. Lemke | ||||||||
| Chief Financial Officer | ||||||||
| As of | ||||||||||||||||||||||||||||||||
| June 30, | March 31, | December 31, | September 30, | June 30, | ||||||||||||||||||||||||||||
| (in thousands) | 2023 | 2023 | 2022 | 2022 | 2022 | |||||||||||||||||||||||||||
| Loan Portfolio | ||||||||||||||||||||||||||||||||
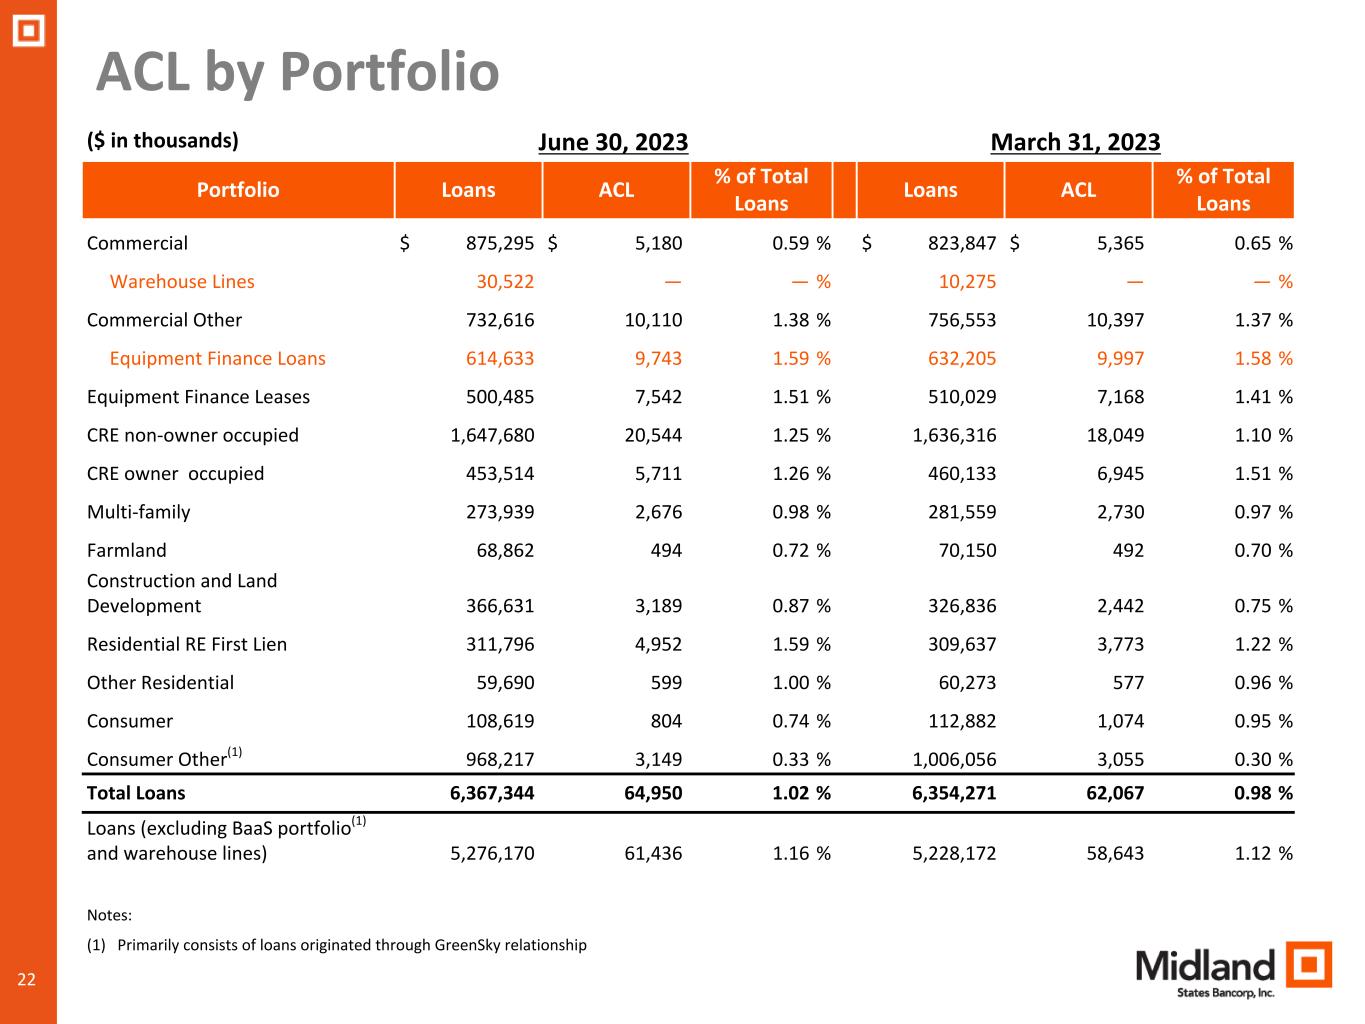
| Commercial loans | $ | 962,756 | $ | 937,920 | $ | 872,794 | $ | 907,651 | $ | 821,119 | ||||||||||||||||||||||
| Equipment finance loans | 614,633 | 632,205 | 616,751 | 577,323 | 546,267 | |||||||||||||||||||||||||||
| Equipment finance leases | 500,485 | 510,029 | 491,744 | 457,611 | 439,202 | |||||||||||||||||||||||||||
| Commercial FHA warehouse lines | 30,522 | 10,275 | 25,029 | 51,309 | 23,872 | |||||||||||||||||||||||||||
| Total commercial loans and leases | 2,108,396 | 2,090,429 | 2,006,318 | 1,993,894 | 1,830,460 | |||||||||||||||||||||||||||
| Commercial real estate | 2,443,995 | 2,448,158 | 2,433,159 | 2,466,303 | 2,335,655 | |||||||||||||||||||||||||||
| Construction and land development | 366,631 | 326,836 | 320,882 | 225,549 | 203,955 | |||||||||||||||||||||||||||
| Residential real estate | 371,486 | 369,910 | 366,094 | 356,225 | 340,103 | |||||||||||||||||||||||||||
| Consumer | 1,076,836 | 1,118,938 | 1,180,014 | 1,156,480 | 1,085,371 | |||||||||||||||||||||||||||
| Total loans | $ | 6,367,344 | $ | 6,354,271 | $ | 6,306,467 | $ | 6,198,451 | $ | 5,795,544 | ||||||||||||||||||||||
| As of and for the Three Months Ended | ||||||||||||||||||||||||||||||||
| (in thousands) | June 30, | March 31, | December 31, | September 30, | June 30, | |||||||||||||||||||||||||||
| 2023 | 2023 | 2022 | 2022 | 2022 | ||||||||||||||||||||||||||||
| Asset Quality | ||||||||||||||||||||||||||||||||
| Loans 30-89 days past due | $ | 44,161 | $ | 30,895 | $ | 32,372 | $ | 28,275 | $ | 16,212 | ||||||||||||||||||||||
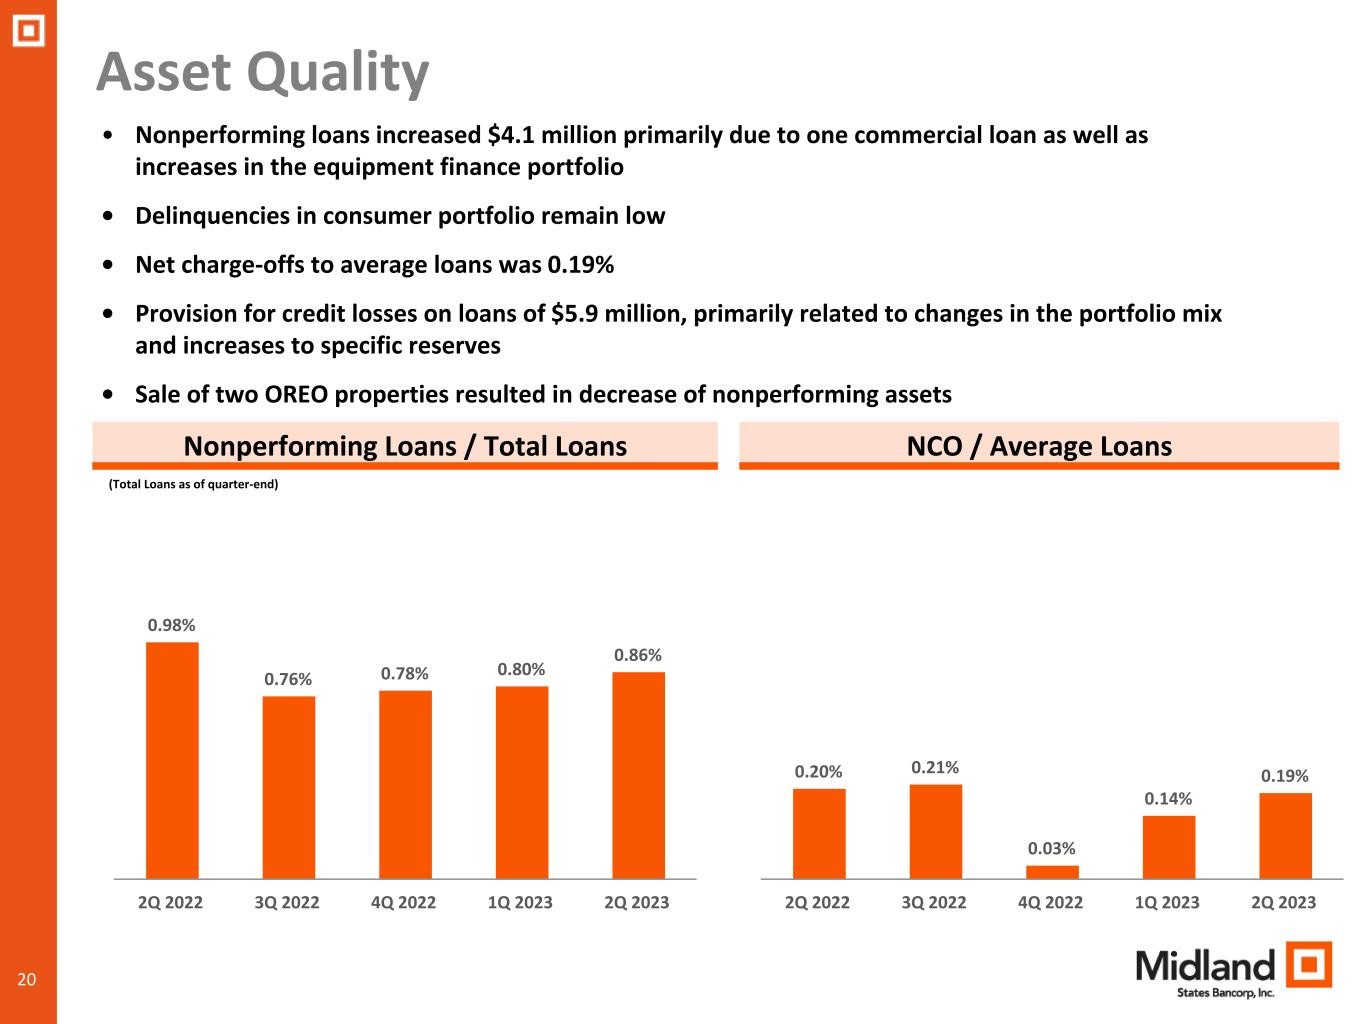
| Nonperforming loans | 54,844 | 50,713 | 49,423 | 46,882 | 56,883 | |||||||||||||||||||||||||||
| Nonperforming assets | 57,688 | 58,806 | 57,824 | 59,524 | 69,344 | |||||||||||||||||||||||||||
| Substandard loans | 130,707 | 99,819 | 101,044 | 98,517 | 114,820 | |||||||||||||||||||||||||||
| Net charge-offs | 2,996 | 2,119 | 538 | 3,233 | 2,781 | |||||||||||||||||||||||||||
| Loans 30-89 days past due to total loans | 0.69 | % | 0.49 | % | 0.51 | % | 0.46 | % | 0.28 | % | ||||||||||||||||||||||
| Nonperforming loans to total loans | 0.86 | % | 0.80 | % | 0.78 | % | 0.76 | % | 0.98 | % | ||||||||||||||||||||||
| Nonperforming assets to total assets | 0.72 | % | 0.74 | % | 0.74 | % | 0.76 | % | 0.93 | % | ||||||||||||||||||||||
| Allowance for credit losses to total loans | 1.02 | % | 0.98 | % | 0.97 | % | 0.95 | % | 0.95 | % | ||||||||||||||||||||||
| Allowance for credit losses to nonperforming loans | 118.43 | % | 122.39 | % | 123.53 | % | 125.08 | % | 96.51 | % | ||||||||||||||||||||||
| Net charge-offs to average loans | 0.19 | % | 0.14 | % | 0.03 | % | 0.21 | % | 0.20 | % | ||||||||||||||||||||||
| As of | ||||||||||||||||||||||||||||||||
| June 30, | March 31, | December 31, | September 30, | June 30, | ||||||||||||||||||||||||||||
| (in thousands) | 2023 | 2023 | 2022 | 2022 | 2022 | |||||||||||||||||||||||||||
| Deposit Portfolio | ||||||||||||||||||||||||||||||||
| Noninterest-bearing demand | $ | 1,162,909 | $ | 1,215,758 | $ | 1,362,158 | $ | 1,362,481 | $ | 1,403,386 | ||||||||||||||||||||||
| Interest-bearing: | ||||||||||||||||||||||||||||||||
| Checking | 2,499,693 | 2,502,827 | 2,494,073 | 2,568,195 | 2,377,760 | |||||||||||||||||||||||||||
| Money market | 1,226,470 | 1,263,813 | 1,184,101 | 1,125,333 | 1,027,547 | |||||||||||||||||||||||||||
| Savings | 624,005 | 636,832 | 661,932 | 704,245 | 740,364 | |||||||||||||||||||||||||||
| Time | 840,734 | 766,884 | 649,552 | 620,960 | 620,363 | |||||||||||||||||||||||||||
| Brokered time | 72,737 | 39,087 | 12,836 | 14,038 | 15,018 | |||||||||||||||||||||||||||
| Total deposits | $ | 6,426,548 | $ | 6,425,201 | $ | 6,364,652 | $ | 6,395,252 | $ | 6,184,438 | ||||||||||||||||||||||
| For the Three Months Ended | ||||||||||||||||||||||||||||||||||||||||||||||||||||||||
| June 30, | March 31, | June 30, | ||||||||||||||||||||||||||||||||||||||||||||||||||||||
| (dollars in thousands) | 2023 | 2023 | 2022 | |||||||||||||||||||||||||||||||||||||||||||||||||||||
| Interest-earning assets | Average Balance | Interest & Fees | Yield/Rate | Average Balance | Interest & Fees | Yield/Rate | Average Balance | Interest & Fees | Yield/Rate | |||||||||||||||||||||||||||||||||||||||||||||||
| Cash and cash equivalents | $ | 67,377 | $ | 852 | 5.07 | % | $ | 85,123 | $ | 980 | 4.67 | % | $ | 226,517 | $ | 468 | 0.83 | % | ||||||||||||||||||||||||||||||||||||||
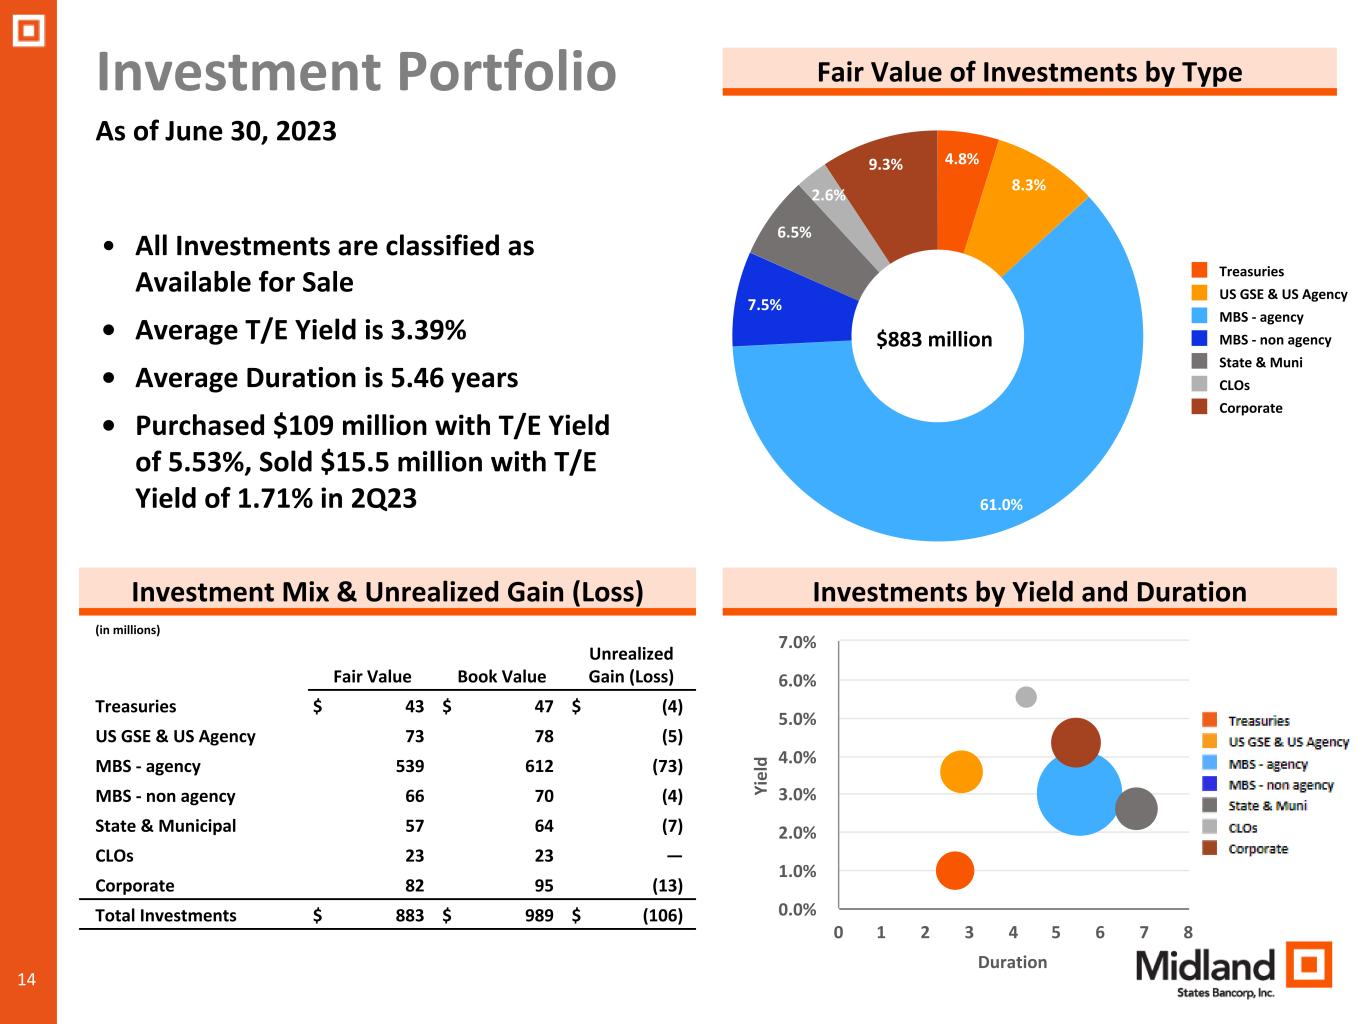
| Investment securities | 861,409 | 7,286 | 3.39 | % | 809,848 | 5,995 | 3.00 | % | 818,927 | 4,931 | 2.41 | % | ||||||||||||||||||||||||||||||||||||||||||||
| Loans | 6,356,012 | 91,890 | 5.80 | % | 6,320,402 | 87,997 | 5.65 | % | 5,677,791 | 63,594 | 4.49 | % | ||||||||||||||||||||||||||||||||||||||||||||
| Loans held for sale | 4,067 | 59 | 5.79 | % | 1,506 | 16 | 4.41 | % | 9,865 | 77 | 3.15 | % | ||||||||||||||||||||||||||||||||||||||||||||
| Nonmarketable equity securities | 45,028 | 599 | 5.33 | % | 47,819 | 795 | 6.75 | % | 36,338 | 487 | 5.38 | % | ||||||||||||||||||||||||||||||||||||||||||||
| Total interest-earning assets | $ | 7,333,893 | $ | 100,686 | 5.51 | % | $ | 7,264,698 | $ | 95,783 | 5.35 | % | $ | 6,769,438 | $ | 69,557 | 4.12 | % | ||||||||||||||||||||||||||||||||||||||
| Noninterest-earning assets | 612,238 | 610,811 | 615,348 | |||||||||||||||||||||||||||||||||||||||||||||||||||||
| Total assets | $ | 7,946,131 | $ | 7,875,509 | $ | 7,384,786 | ||||||||||||||||||||||||||||||||||||||||||||||||||
| Interest-Bearing Liabilities | ||||||||||||||||||||||||||||||||||||||||||||||||||||||||
| Interest-bearing deposits | $ | 5,259,188 | $ | 33,617 | 2.56 | % | $ | 5,053,941 | $ | 26,405 | 2.12 | % | $ | 4,718,759 | $ | 3,810 | 0.32 | % | ||||||||||||||||||||||||||||||||||||||
| Short-term borrowings | 22,018 | 14 | 0.26 | % | 38,655 | 25 | 0.26 | % | 59,301 | 22 | 0.15 | % | ||||||||||||||||||||||||||||||||||||||||||||
| FHLB advances & other borrowings | 471,989 | 5,396 | 4.59 | % | 540,278 | 6,006 | 4.51 | % | 307,611 | 1,435 | 1.87 | % | ||||||||||||||||||||||||||||||||||||||||||||
| Subordinated debt | 97,278 | 1,335 | 5.51 | % | 99,812 | 1,370 | 5.57 | % | 139,232 | 2,011 | 5.78 | % | ||||||||||||||||||||||||||||||||||||||||||||
| Trust preferred debentures | 50,218 | 1,289 | 10.29 | % | 50,047 | 1,229 | 9.96 | % | 49,602 | 624 | 5.05 | % | ||||||||||||||||||||||||||||||||||||||||||||
| Total interest-bearing liabilities | $ | 5,900,691 | $ | 41,651 | 2.83 | % | $ | 5,782,733 | $ | 35,035 | 2.46 | % | $ | 5,274,505 | $ | 7,902 | 0.60 | % | ||||||||||||||||||||||||||||||||||||||
| Noninterest-bearing deposits | 1,187,584 | 1,250,899 | 1,401,268 | |||||||||||||||||||||||||||||||||||||||||||||||||||||
| Other noninterest-bearing liabilities | 81,065 | 74,691 | 66,009 | |||||||||||||||||||||||||||||||||||||||||||||||||||||
| Shareholders’ equity | 776,791 | 767,186 | 643,004 | |||||||||||||||||||||||||||||||||||||||||||||||||||||
| Total liabilities and shareholder’s equity | $ | 7,946,131 | $ | 7,875,509 | $ | 7,384,786 | ||||||||||||||||||||||||||||||||||||||||||||||||||
| Net Interest Margin | $ | 59,035 | 3.23 | % | $ | 60,748 | 3.39 | % | $ | 61,655 | 3.65 | % | ||||||||||||||||||||||||||||||||||||||||||||
| Cost of Deposits | 2.09 | % | 1.70 | % | 0.25 | % | ||||||||||||||||||||||||||||||||||||||||||||||||||
| For the Six Months Ended | ||||||||||||||||||||||||||||||||||||||
| June 30, | June 30, | |||||||||||||||||||||||||||||||||||||
| (dollars in thousands) | 2023 | 2022 | ||||||||||||||||||||||||||||||||||||
| Interest-earning assets | Average Balance | Interest & Fees | Yield/Rate | Average Balance | Interest & Fees | Yield/Rate | ||||||||||||||||||||||||||||||||
| Cash and cash equivalents | $ | 76,201 | $ | 1,832 | 4.85 | % | $ | 304,938 | $ | 639 | 0.42 | % | ||||||||||||||||||||||||||
| Investment securities | 835,771 | 13,281 | 3.18 | % | 856,571 | 9,894 | 2.31 | % | ||||||||||||||||||||||||||||||
| Loans | 6,338,305 | 179,887 | 5.72 | % | 5,477,037 | 120,873 | 4.45 | % | ||||||||||||||||||||||||||||||
| Loans held for sale | 2,794 | 75 | 5.42 | % | 20,501 | 297 | 2.93 | % | ||||||||||||||||||||||||||||||
| Nonmarketable equity securities | 46,416 | 1,394 | 6.05 | % | 36,358 | 971 | 5.39 | % | ||||||||||||||||||||||||||||||
| Total interest-earning assets | $ | 7,299,487 | $ | 196,469 | 5.43 | % | $ | 6,695,405 | $ | 132,674 | 4.00 | % | ||||||||||||||||||||||||||
| Noninterest-earning assets | 611,528 | 623,224 | ||||||||||||||||||||||||||||||||||||
| Total assets | $ | 7,911,015 | $ | 7,318,629 | ||||||||||||||||||||||||||||||||||
| Interest-Bearing Liabilities | ||||||||||||||||||||||||||||||||||||||
| Interest-bearing deposits | $ | 5,157,148 | $ | 60,022 | 2.35 | % | $ | 4,613,751 | $ | 5,971 | 0.26 | % | ||||||||||||||||||||||||||
| Short-term borrowings | 30,291 | 39 | 0.26 | % | 64,642 | 45 | 0.14 | % | ||||||||||||||||||||||||||||||
| FHLB advances & other borrowings | 505,945 | 11,402 | 4.54 | % | 309,436 | 2,647 | 1.72 | % | ||||||||||||||||||||||||||||||
| Subordinated debt | 98,538 | 2,705 | 5.54 | % | 139,186 | 4,022 | 5.78 | % | ||||||||||||||||||||||||||||||
| Trust preferred debentures | 50,133 | 2,518 | 10.13 | % | 49,527 | 1,138 | 4.64 | % | ||||||||||||||||||||||||||||||
| Total interest-bearing liabilities | $ | 5,842,055 | $ | 76,686 | 2.65 | % | $ | 5,176,542 | $ | 13,823 | 0.54 | % | ||||||||||||||||||||||||||
| Noninterest-bearing deposits | 1,219,050 | 1,418,083 | ||||||||||||||||||||||||||||||||||||
| Other noninterest-bearing liabilities | 77,895 | 73,878 | ||||||||||||||||||||||||||||||||||||
| Shareholders’ equity | 772,015 | 650,126 | ||||||||||||||||||||||||||||||||||||
| Total liabilities and shareholder’s equity | $ | 7,911,015 | $ | 7,318,629 | ||||||||||||||||||||||||||||||||||
| Net Interest Margin | $ | 119,783 | 3.31 | % | $ | 118,851 | 3.58 | % | ||||||||||||||||||||||||||||||
| Cost of Deposits | 1.90 | % | 0.20 | % | ||||||||||||||||||||||||||||||||||
| For the Three Months Ended | For the Six Months Ended | |||||||||||||||||||||||||||||||
| June 30, | March 31, | June 30, | June 30, | June 30, | ||||||||||||||||||||||||||||
| (in thousands) | 2023 | 2023 | 2022 | 2023 | 2022 | |||||||||||||||||||||||||||
| Noninterest income | ||||||||||||||||||||||||||||||||
| Wealth management revenue | $ | 6,269 | $ | 6,411 | $ | 6,143 | $ | 12,680 | $ | 13,282 | ||||||||||||||||||||||
| Residential mortgage banking revenue | 540 | 405 | 384 | 945 | 983 | |||||||||||||||||||||||||||
| Service charges on deposit accounts | 2,677 | 2,568 | 2,304 | 5,245 | 4,372 | |||||||||||||||||||||||||||
| Interchange revenue | 3,696 | 3,412 | 3,590 | 7,108 | 6,870 | |||||||||||||||||||||||||||
| Loss on sales of investment securities, net | (869) | (648) | (101) | (1,517) | (101) | |||||||||||||||||||||||||||
| Gain on repurchase of subordinated debt, net | 676 | — | — | 676 | — | |||||||||||||||||||||||||||
| Gain (loss) on sales of other real estate owned, net | 819 | — | (162) | 819 | (121) | |||||||||||||||||||||||||||
| Impairment on commercial mortgage servicing rights | — | — | (869) | — | (1,263) | |||||||||||||||||||||||||||
| Company-owned life insurance | 891 | 876 | 840 | 1,767 | 1,859 | |||||||||||||||||||||||||||
| Other income | 4,054 | 2,755 | 2,484 | 6,809 | 4,345 | |||||||||||||||||||||||||||
| Total noninterest income | $ | 18,753 | $ | 15,779 | $ | 14,613 | $ | 34,532 | $ | 30,226 | ||||||||||||||||||||||
| For the Three Months Ended | For the Six Months Ended | |||||||||||||||||||||||||||||||
| June 30, | March 31, | June 30, | June 30, | June 30, | ||||||||||||||||||||||||||||
| (in thousands) | 2023 | 2023 | 2022 | 2023 | 2022 | |||||||||||||||||||||||||||
| Noninterest expense | ||||||||||||||||||||||||||||||||
| Salaries and employee benefits | $ | 22,857 | $ | 24,243 | $ | 22,645 | $ | 47,100 | $ | 44,515 | ||||||||||||||||||||||
| Occupancy and equipment | 3,879 | 4,443 | 3,489 | 8,322 | 7,244 | |||||||||||||||||||||||||||
| Data processing | 6,544 | 6,311 | 6,082 | 12,855 | 11,955 | |||||||||||||||||||||||||||
| Professional | 1,663 | 1,760 | 1,516 | 3,423 | 3,488 | |||||||||||||||||||||||||||
| Amortization of intangible assets | 1,208 | 1,291 | 1,318 | 2,499 | 2,716 | |||||||||||||||||||||||||||
| FDIC insurance | 1,196 | 1,329 | 826 | 2,525 | 1,656 | |||||||||||||||||||||||||||
| Other expense | 5,547 | 5,105 | 5,463 | 10,652 | 10,649 | |||||||||||||||||||||||||||
| Total noninterest expense | $ | 42,894 | $ | 44,482 | $ | 41,339 | $ | 87,376 | $ | 82,223 | ||||||||||||||||||||||
As of June 30, 2023 |
|||||||||||||||||
| Midland States Bank | Midland States Bancorp, Inc. | Minimum Regulatory Requirements (2) |
|||||||||||||||
| Total capital to risk-weighted assets | 11.89% | 12.65% | 10.50% | ||||||||||||||
| Tier 1 capital to risk-weighted assets | 11.01% | 10.47% | 8.50% | ||||||||||||||
| Tier 1 leverage ratio | 10.07% | 9.57% | 4.00% | ||||||||||||||
| Common equity Tier 1 capital | 11.01% | 8.03% | 7.00% | ||||||||||||||
Tangible common equity to tangible assets (1) |
N/A | 6.19% | N/A | ||||||||||||||
| MIDLAND STATES BANCORP, INC. | ||||||||||||||||||||||||||||||||
| CONSOLIDATED FINANCIAL SUMMARY (unaudited) | ||||||||||||||||||||||||||||||||
| As of and for the Three Months Ended |
As of and
for the Six Months Ended
|
|||||||||||||||||||||||||||||||
| June 30, | March 31, | June 30, | June 30, | June 30, | ||||||||||||||||||||||||||||
| (dollars in thousands, except per share data) | 2023 | 2023 | 2022 | 2023 | 2022 | |||||||||||||||||||||||||||
| Earnings Summary | ||||||||||||||||||||||||||||||||
| Net interest income | $ | 58,840 | $ | 60,504 | $ | 61,334 | $ | 119,344 | $ | 118,161 | ||||||||||||||||||||||
| Provision for credit losses | 5,879 | 3,135 | 5,441 | 9,014 | 9,608 | |||||||||||||||||||||||||||
| Noninterest income | 18,753 | 15,779 | 14,613 | 34,532 | 30,226 | |||||||||||||||||||||||||||
| Noninterest expense | 42,894 | 44,482 | 41,339 | 87,376 | 82,223 | |||||||||||||||||||||||||||
| Income before income taxes | 28,820 | 28,666 | 29,167 | 57,486 | 56,556 | |||||||||||||||||||||||||||
| Income taxes | 7,245 | 6,894 | 7,284 | 14,139 | 13,924 | |||||||||||||||||||||||||||
| Net income | 21,575 | 21,772 | 21,883 | 43,347 | 42,632 | |||||||||||||||||||||||||||
| Preferred dividends | 2,228 | 2,228 | — | 4,456 | — | |||||||||||||||||||||||||||
| Net income available to common shareholders | $ | 19,347 | $ | 19,544 | $ | 21,883 | $ | 38,891 | $ | 42,632 | ||||||||||||||||||||||
| Diluted earnings per common share | $ | 0.86 | $ | 0.86 | $ | 0.97 | $ | 1.72 | $ | 1.89 | ||||||||||||||||||||||
| Weighted average common shares outstanding - diluted | 22,205,079 | 22,501,970 | 22,360,819 | 22,348,981 | 22,355,936 | |||||||||||||||||||||||||||
| Return on average assets | 1.09 | % | 1.12 | % | 1.19 | % | 1.10 | % | 1.17 | % | ||||||||||||||||||||||
| Return on average shareholders' equity | 11.14 | % | 11.51 | % | 13.65 | % | 11.32 | % | 13.22 | % | ||||||||||||||||||||||
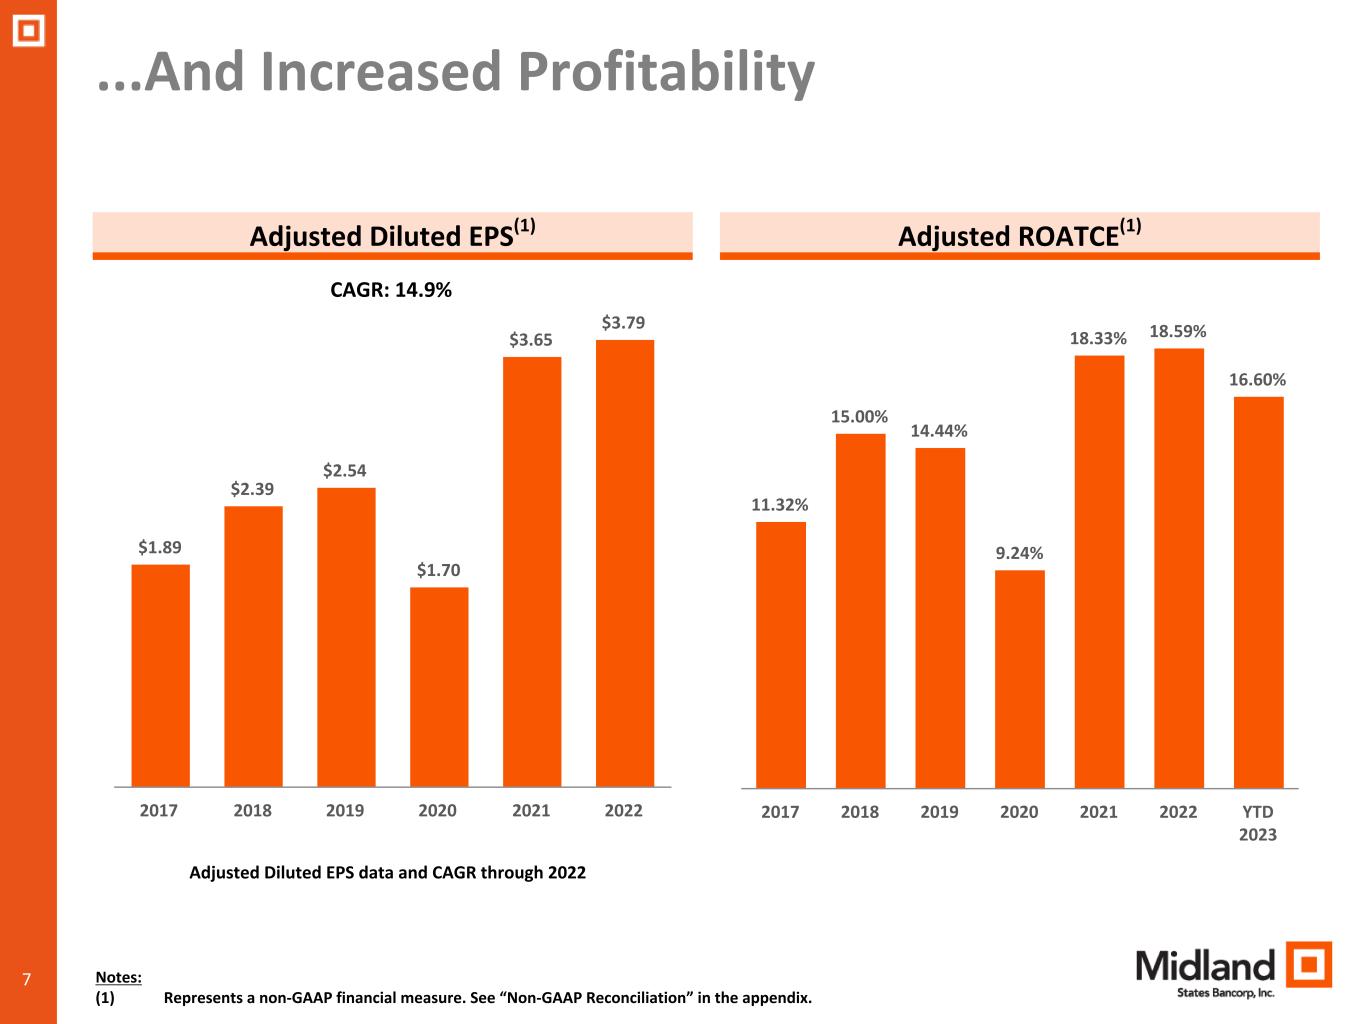
Return on average tangible common equity (1) |
15.99 | % | 16.70 | % | 19.14 | % | 16.34 | % | 18.48 | % | ||||||||||||||||||||||
| Net interest margin | 3.23 | % | 3.39 | % | 3.65 | % | 3.31 | % | 3.58 | % | ||||||||||||||||||||||
Efficiency ratio (1) |
55.01 | % | 57.64 | % | 53.10 | % | 56.32 | % | 54.38 | % | ||||||||||||||||||||||
Adjusted Earnings Performance Summary (1) |
||||||||||||||||||||||||||||||||
| Adjusted earnings available to common shareholders | $ | 19,488 | $ | 20,017 | $ | 22,191 | $ | 39,505 | $ | 43,006 | ||||||||||||||||||||||
| Adjusted diluted earnings per common share | $ | 0.87 | $ | 0.88 | $ | 0.98 | $ | 1.75 | $ | 1.90 | ||||||||||||||||||||||
| Adjusted return on average assets | 1.10 | % | 1.15 | % | 1.21 | % | 1.12 | % | 1.18 | % | ||||||||||||||||||||||
| Adjusted return on average shareholders' equity | 11.21 | % | 11.76 | % | 13.84 | % | 11.48 | % | 13.34 | % | ||||||||||||||||||||||
| Adjusted return on average tangible common equity | 16.10 | % | 17.11 | % | 19.41 | % | 16.60 | % | 18.65 | % | ||||||||||||||||||||||
| Adjusted pre-tax, pre-provision earnings | $ | 34,892 | $ | 32,449 | $ | 35,902 | $ | 67,341 | $ | 67,943 | ||||||||||||||||||||||
| Adjusted pre-tax, pre-provision return on average assets | 1.76 | % | 1.67 | % | 1.95 | % | 1.72 | % | 1.87 | % | ||||||||||||||||||||||
| Market Data | ||||||||||||||||||||||||||||||||
| Book value per share at period end | $ | 30.49 | $ | 30.08 | $ | 28.84 | ||||||||||||||||||||||||||
Tangible book value per share at period end (1) |
$ | 22.24 | $ | 21.87 | $ | 20.43 | ||||||||||||||||||||||||||
Tangible book value per share excluding accumulated other comprehensive income at period end (1) |
$ | 26.11 | $ | 25.39 | $ | 22.84 | ||||||||||||||||||||||||||
| Market price at period end | $ | 19.91 | $ | 21.42 | $ | 24.04 | ||||||||||||||||||||||||||
| Common shares outstanding at period end | 21,854,800 | 22,111,454 | 22,060,255 | |||||||||||||||||||||||||||||
| Capital | ||||||||||||||||||||||||||||||||
| Total capital to risk-weighted assets | 12.65 | % | 12.46 | % | 11.44 | % | ||||||||||||||||||||||||||
| Tier 1 capital to risk-weighted assets | 10.47 | % | 10.25 | % | 8.63 | % | ||||||||||||||||||||||||||
| Tier 1 common capital to risk-weighted assets | 8.03 | % | 7.84 | % | 7.66 | % | ||||||||||||||||||||||||||
| Tier 1 leverage ratio | 9.57 | % | 9.54 | % | 7.98 | % | ||||||||||||||||||||||||||
Tangible common equity to tangible assets (1) |
6.19 | % | 6.24 | % | 6.22 | % | ||||||||||||||||||||||||||
| Wealth Management | ||||||||||||||||||||||||||||||||
| Trust assets under administration | $ | 3,594,727 | $ | 3,502,635 | $ | 3,503,227 | ||||||||||||||||||||||||||
| MIDLAND STATES BANCORP, INC. | ||||||||||||||||||||||||||||||||
| CONSOLIDATED FINANCIAL SUMMARY (unaudited) (continued) | ||||||||||||||||||||||||||||||||
| As of | ||||||||||||||||||||||||||||||||
| June 30, | March 31, | December 31, | September 30, | June 30, | ||||||||||||||||||||||||||||
| (in thousands) | 2023 | 2023 | 2022 | 2022 | 2022 | |||||||||||||||||||||||||||
| Assets | ||||||||||||||||||||||||||||||||
| Cash and cash equivalents | $ | 160,695 | $ | 138,310 | $ | 160,631 | $ | 313,188 | $ | 270,117 | ||||||||||||||||||||||
| Investment securities | 887,003 | 821,005 | 776,860 | 690,504 | 769,278 | |||||||||||||||||||||||||||
| Loans | 6,367,344 | 6,354,271 | 6,306,467 | 6,198,451 | 5,795,544 | |||||||||||||||||||||||||||
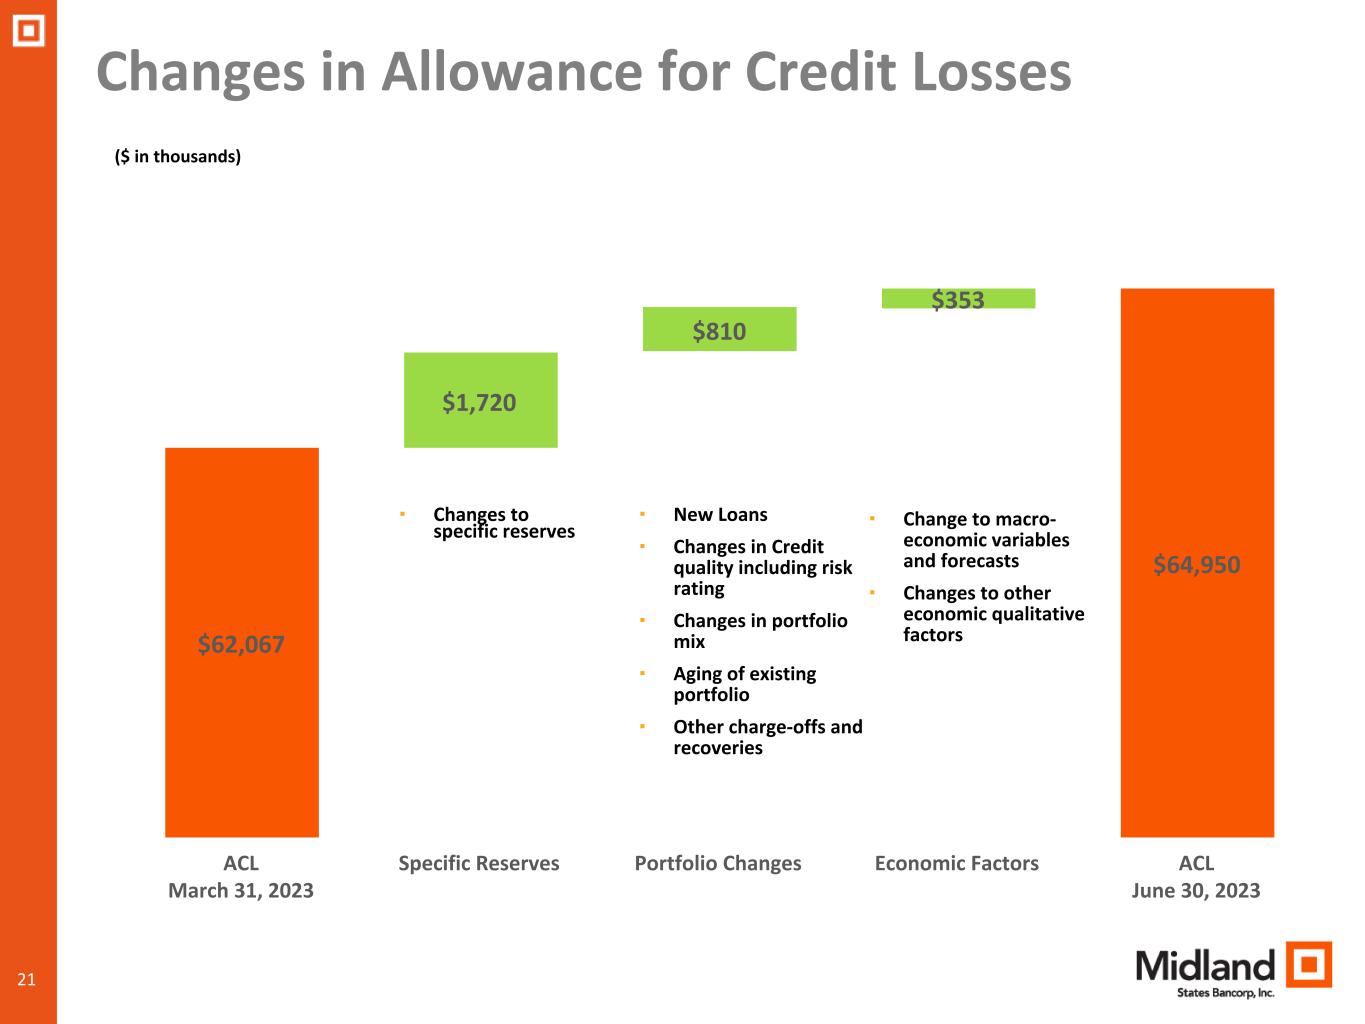
| Allowance for credit losses on loans | (64,950) | (62,067) | (61,051) | (58,639) | (54,898) | |||||||||||||||||||||||||||
| Total loans, net | 6,302,394 | 6,292,204 | 6,245,416 | 6,139,812 | 5,740,646 | |||||||||||||||||||||||||||
| Loans held for sale | 5,632 | 2,747 | 1,286 | 4,338 | 5,298 | |||||||||||||||||||||||||||
| Premises and equipment, net | 81,006 | 80,582 | 78,293 | 77,519 | 77,668 | |||||||||||||||||||||||||||
| Other real estate owned | 202 | 6,729 | 6,729 | 11,141 | 11,131 | |||||||||||||||||||||||||||
| Loan servicing rights, at lower of cost or fair value | 21,611 | 1,117 | 1,205 | 1,297 | 25,879 | |||||||||||||||||||||||||||
| Commercial FHA mortgage loan servicing rights held for sale | — | 20,745 | 20,745 | 23,995 | — | |||||||||||||||||||||||||||
| Goodwill | 161,904 | 161,904 | 161,904 | 161,904 | 161,904 | |||||||||||||||||||||||||||
| Other intangible assets, net | 18,367 | 19,575 | 20,866 | 22,198 | 23,559 | |||||||||||||||||||||||||||
| Company-owned life insurance | 152,210 | 151,319 | 150,443 | 149,648 | 148,900 | |||||||||||||||||||||||||||
| Other assets | 243,697 | 233,937 | 231,123 | 226,333 | 201,432 | |||||||||||||||||||||||||||
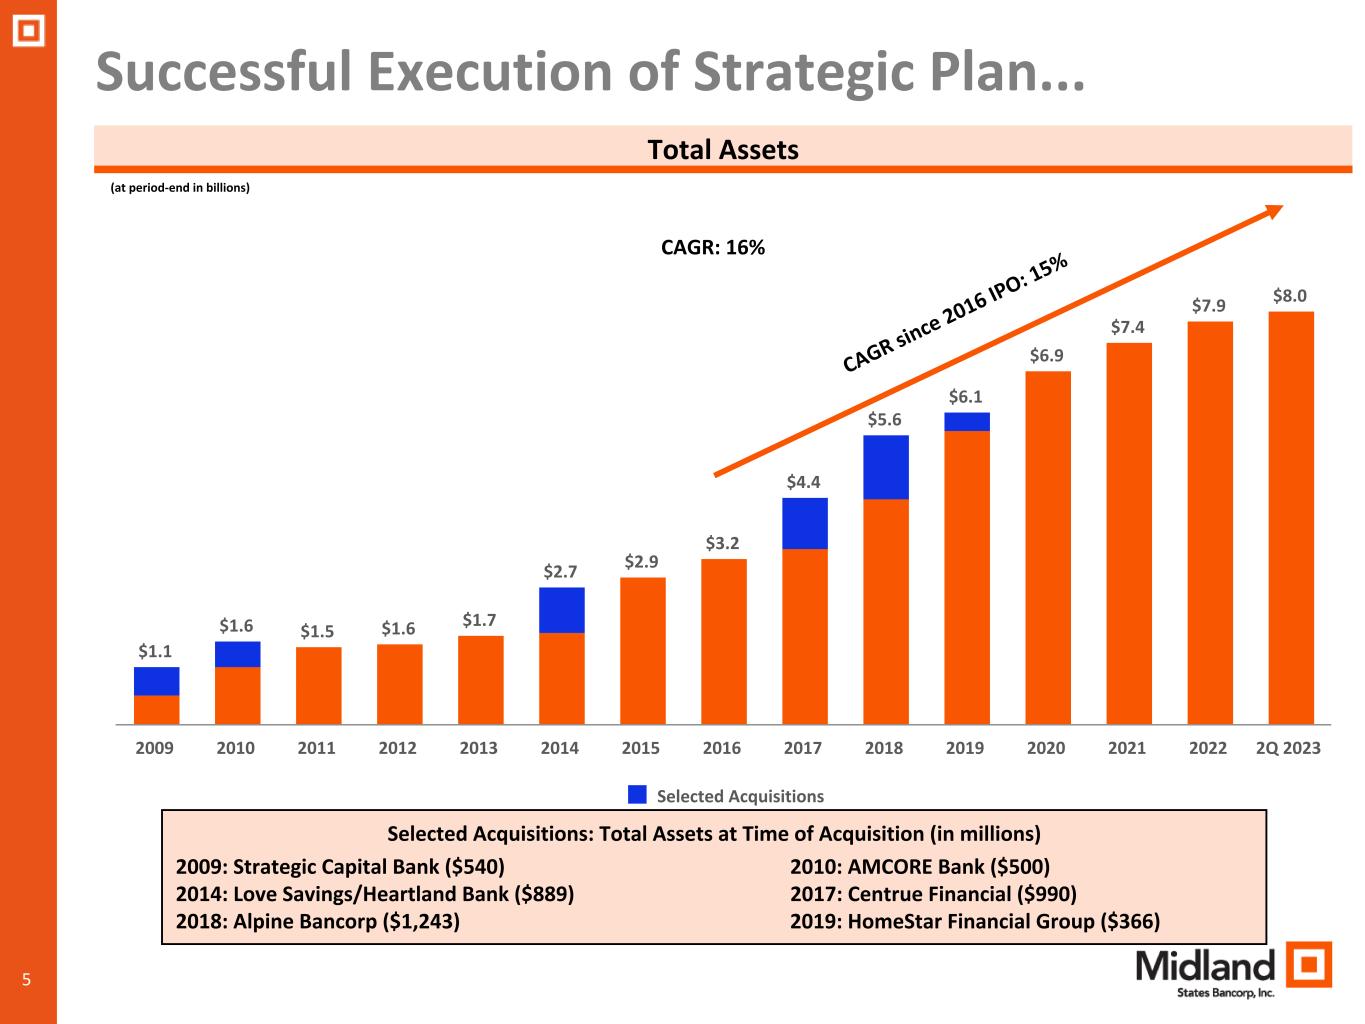
| Total assets | $ | 8,034,721 | $ | 7,930,174 | $ | 7,855,501 | $ | 7,821,877 | $ | 7,435,812 | ||||||||||||||||||||||
| Liabilities and Shareholders' Equity | ||||||||||||||||||||||||||||||||
| Noninterest-bearing demand deposits | $ | 1,162,909 | $ | 1,215,758 | $ | 1,362,158 | $ | 1,362,481 | $ | 1,403,386 | ||||||||||||||||||||||
| Interest-bearing deposits | 5,263,639 | 5,209,443 | 5,002,494 | 5,032,771 | 4,781,052 | |||||||||||||||||||||||||||
| Total deposits | 6,426,548 | 6,425,201 | 6,364,652 | 6,395,252 | 6,184,438 | |||||||||||||||||||||||||||
| Short-term borrowings | 21,783 | 31,173 | 42,311 | 58,518 | 67,689 | |||||||||||||||||||||||||||
| FHLB advances and other borrowings | 575,000 | 482,000 | 460,000 | 360,000 | 285,000 | |||||||||||||||||||||||||||
| Subordinated debt | 93,404 | 99,849 | 99,772 | 139,370 | 139,277 | |||||||||||||||||||||||||||
| Trust preferred debentures | 50,296 | 50,135 | 49,975 | 49,824 | 49,674 | |||||||||||||||||||||||||||
| Other liabilities | 90,869 | 66,173 | 80,217 | 79,634 | 73,546 | |||||||||||||||||||||||||||
| Total liabilities | 7,257,900 | 7,154,531 | 7,096,927 | 7,082,598 | 6,799,624 | |||||||||||||||||||||||||||
| Total shareholders’ equity | 776,821 | 775,643 | 758,574 | 739,279 | 636,188 | |||||||||||||||||||||||||||
| Total liabilities and shareholders’ equity | $ | 8,034,721 | $ | 7,930,174 | $ | 7,855,501 | $ | 7,821,877 | $ | 7,435,812 | ||||||||||||||||||||||
| MIDLAND STATES BANCORP, INC. | ||||||||||||||||||||||||||||||||
| CONSOLIDATED FINANCIAL SUMMARY (unaudited) (continued) | ||||||||||||||||||||||||||||||||
| For the Three Months Ended | For the Six Months Ended | |||||||||||||||||||||||||||||||
| June 30, | March 31, | June 30, | June 30, | June 30, | ||||||||||||||||||||||||||||
| (in thousands, except per share data) | 2023 | 2023 | 2022 | 2023 | 2022 | |||||||||||||||||||||||||||
| Net interest income: | ||||||||||||||||||||||||||||||||
| Interest income | $ | 100,491 | $ | 95,539 | $ | 69,236 | $ | 196,030 | $ | 131,984 | ||||||||||||||||||||||
| Interest expense | 41,651 | 35,035 | 7,902 | 76,686 | 13,823 | |||||||||||||||||||||||||||
| Net interest income | 58,840 | 60,504 | 61,334 | 119,344 | 118,161 | |||||||||||||||||||||||||||
| Provision for credit losses: | ||||||||||||||||||||||||||||||||
| Provision for credit losses on loans | 5,879 | 3,135 | 4,741 | 9,014 | 8,873 | |||||||||||||||||||||||||||
| Provision for credit losses on unfunded commitments | — | — | 700 | — | 956 | |||||||||||||||||||||||||||
| Provision for other credit losses | — | — | — | — | (221) | |||||||||||||||||||||||||||
| Total provision for credit losses | 5,879 | 3,135 | 5,441 | 9,014 | 9,608 | |||||||||||||||||||||||||||
| Net interest income after provision for credit losses | 52,961 | 57,369 | 55,893 | 110,330 | 108,553 | |||||||||||||||||||||||||||
| Noninterest income: | ||||||||||||||||||||||||||||||||
| Wealth management revenue | 6,269 | 6,411 | 6,143 | 12,680 | 13,282 | |||||||||||||||||||||||||||
| Residential mortgage banking revenue | 540 | 405 | 384 | 945 | 983 | |||||||||||||||||||||||||||
| Service charges on deposit accounts | 2,677 | 2,568 | 2,304 | 5,245 | 4,372 | |||||||||||||||||||||||||||
| Interchange revenue | 3,696 | 3,412 | 3,590 | 7,108 | 6,870 | |||||||||||||||||||||||||||
| Loss on sales of investment securities, net | (869) | (648) | (101) | (1,517) | (101) | |||||||||||||||||||||||||||
| Gain on repurchase of subordinated debt, net | 676 | — | — | 676 | — | |||||||||||||||||||||||||||
| Gain (loss) on sales of other real estate owned, net | 819 | — | (162) | 819 | (121) | |||||||||||||||||||||||||||
| Impairment on commercial mortgage servicing rights | — | — | (869) | — | (1,263) | |||||||||||||||||||||||||||
| Company-owned life insurance | 891 | 876 | 840 | 1,767 | 1,859 | |||||||||||||||||||||||||||
| Other income | 4,054 | 2,755 | 2,484 | 6,809 | 4,345 | |||||||||||||||||||||||||||
| Total noninterest income | 18,753 | 15,779 | 14,613 | 34,532 | 30,226 | |||||||||||||||||||||||||||
| Noninterest expense: | ||||||||||||||||||||||||||||||||
| Salaries and employee benefits | 22,857 | 24,243 | 22,645 | 47,100 | 44,515 | |||||||||||||||||||||||||||
| Occupancy and equipment | 3,879 | 4,443 | 3,489 | 8,322 | 7,244 | |||||||||||||||||||||||||||
| Data processing | 6,544 | 6,311 | 6,082 | 12,855 | 11,955 | |||||||||||||||||||||||||||
| Professional | 1,663 | 1,760 | 1,516 | 3,423 | 3,488 | |||||||||||||||||||||||||||
| Amortization of intangible assets | 1,208 | 1,291 | 1,318 | 2,499 | 2,716 | |||||||||||||||||||||||||||
| FDIC insurance | 1,196 | 1,329 | 826 | 2,525 | 1,656 | |||||||||||||||||||||||||||
| Other expense | 5,547 | 5,105 | 5,463 | 10,652 | 10,649 | |||||||||||||||||||||||||||
| Total noninterest expense | 42,894 | 44,482 | 41,339 | 87,376 | 82,223 | |||||||||||||||||||||||||||
| Income before income taxes | 28,820 | 28,666 | 29,167 | 57,486 | 56,556 | |||||||||||||||||||||||||||
| Income taxes | 7,245 | 6,894 | 7,284 | 14,139 | 13,924 | |||||||||||||||||||||||||||
| Net income | 21,575 | 21,772 | 21,883 | 43,347 | 42,632 | |||||||||||||||||||||||||||
| Preferred stock dividends | 2,228 | 2,228 | — | 4,456 | — | |||||||||||||||||||||||||||
| Net income available to common shareholders | $ | 19,347 | $ | 19,544 | $ | 21,883 | $ | 38,891 | $ | 42,632 | ||||||||||||||||||||||
| Basic earnings per common share | $ | 0.86 | $ | 0.86 | $ | 0.97 | $ | 1.72 | $ | 1.89 | ||||||||||||||||||||||
| Diluted earnings per common share | $ | 0.86 | $ | 0.86 | $ | 0.97 | $ | 1.72 | $ | 1.89 | ||||||||||||||||||||||
| MIDLAND STATES BANCORP, INC. | ||||||||||||||||||||||||||||||||
| RECONCILIATIONS OF NON-GAAP FINANCIAL MEASURES (unaudited) | ||||||||||||||||||||||||||||||||
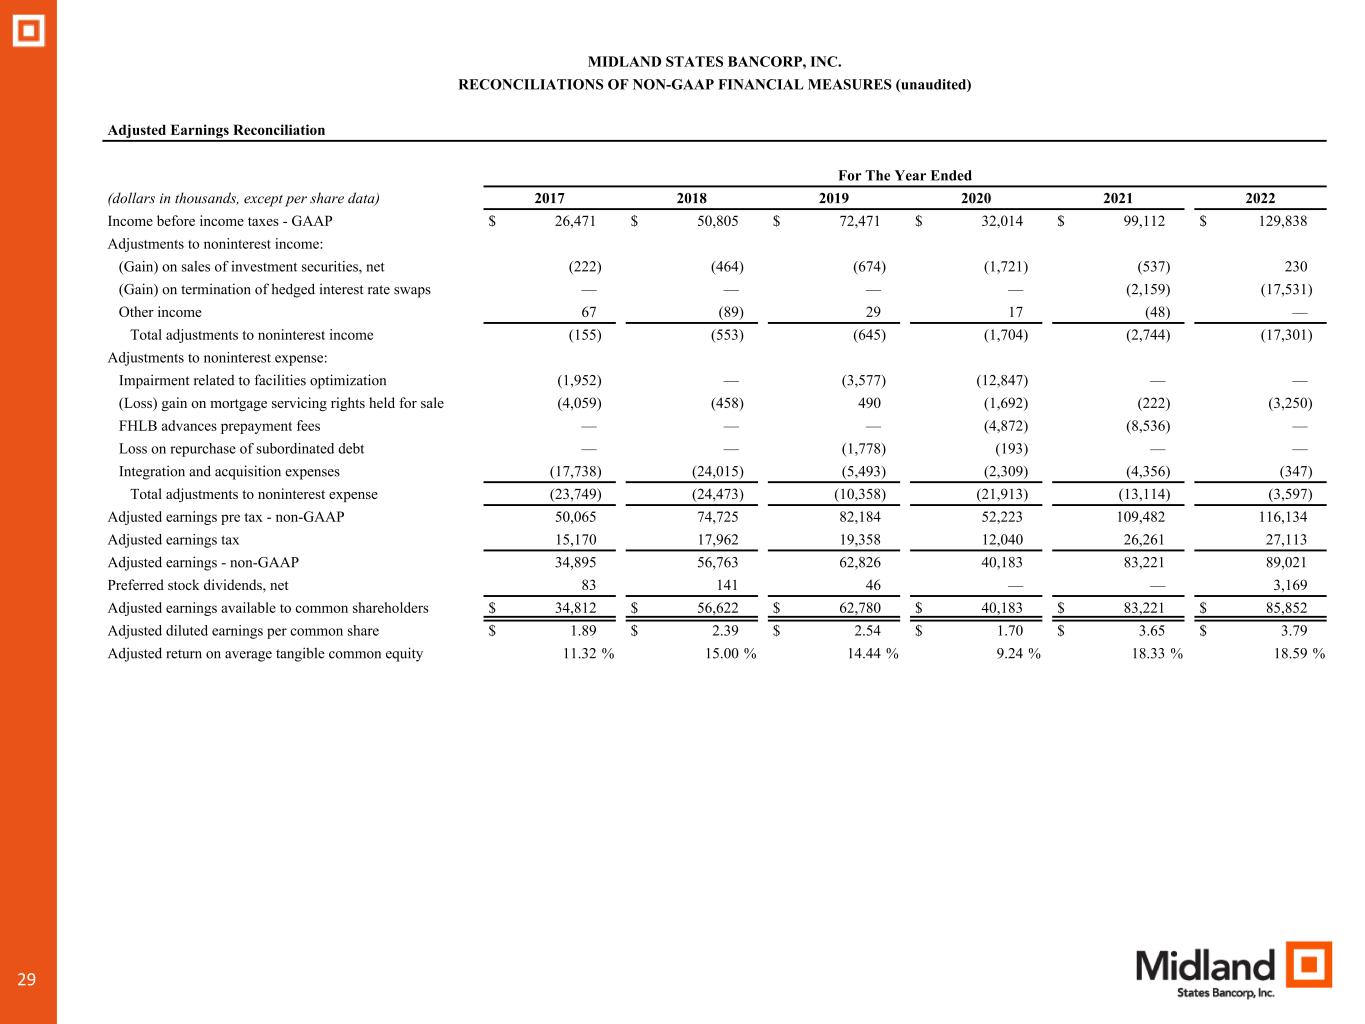
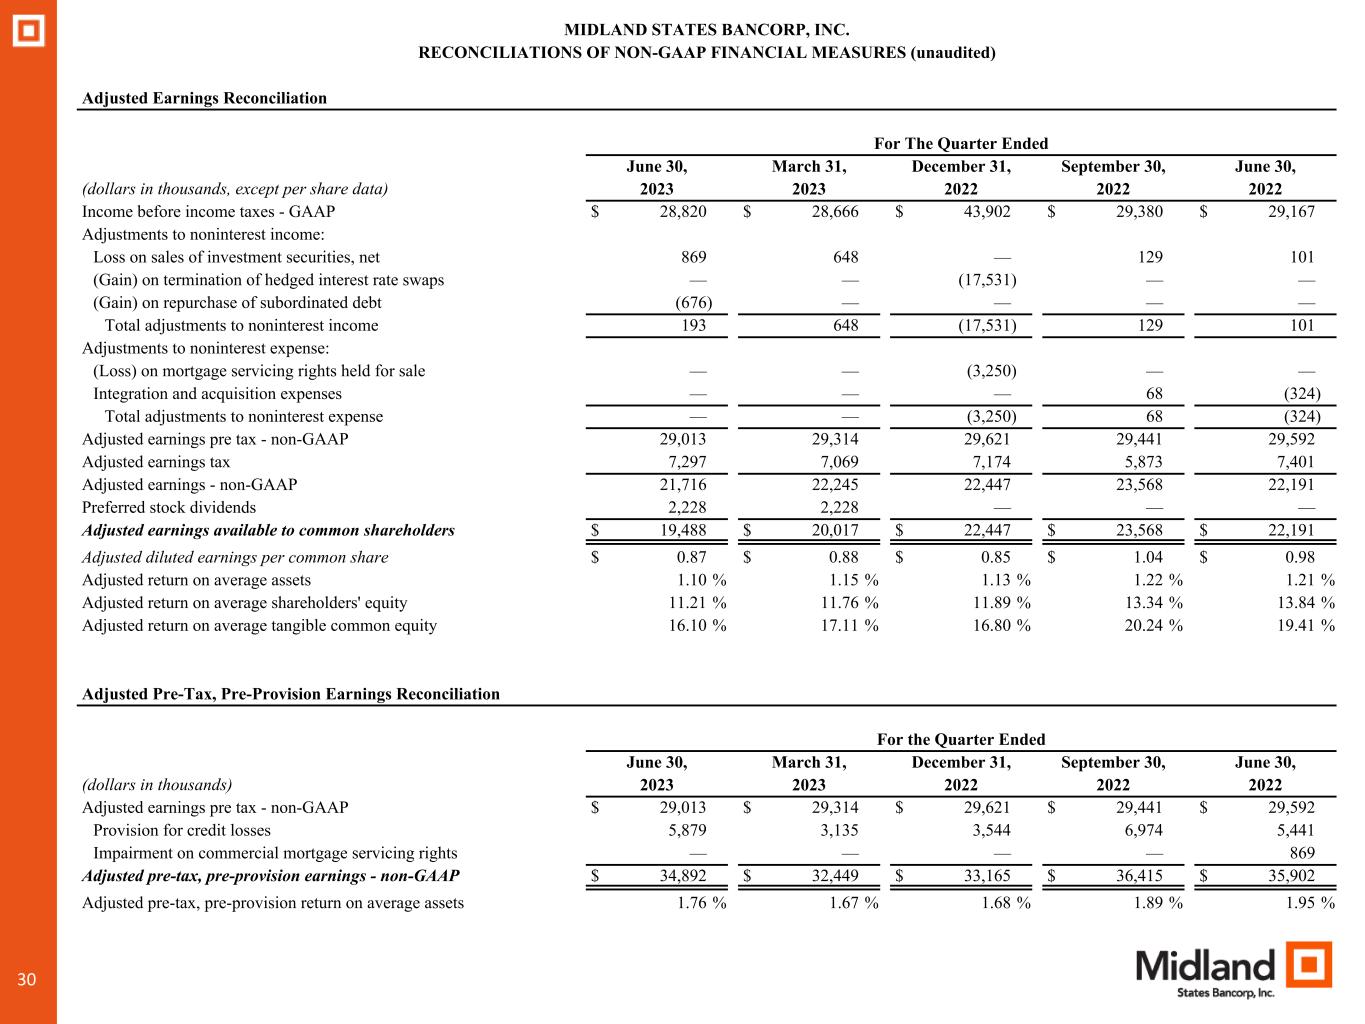
| Adjusted Earnings Reconciliation | ||||||||||||||||||||||||||||||||
| For the Three Months Ended | For the Six Months Ended | |||||||||||||||||||||||||||||||
| June 30, | March 31, | June 30, | June 30, | June 30, | ||||||||||||||||||||||||||||
| (dollars in thousands, except per share data) | 2023 | 2023 | 2022 | 2023 | 2022 | |||||||||||||||||||||||||||
| Income before income taxes - GAAP | $ | 28,820 | $ | 28,666 | $ | 29,167 | $ | 57,486 | $ | 56,556 | ||||||||||||||||||||||
| Adjustments to noninterest income: | ||||||||||||||||||||||||||||||||
| Loss on sales of investment securities, net | 869 | 648 | 101 | 1,517 | 101 | |||||||||||||||||||||||||||
| (Gain) on repurchase of subordinated debt | (676) | — | — | (676) | — | |||||||||||||||||||||||||||
| Total adjustments to noninterest income | 193 | 648 | 101 | 841 | 101 | |||||||||||||||||||||||||||
| Adjustments to noninterest expense: | ||||||||||||||||||||||||||||||||
| Integration and acquisition expenses | — | — | (324) | — | (415) | |||||||||||||||||||||||||||
| Total adjustments to noninterest expense | — | — | (324) | — | (415) | |||||||||||||||||||||||||||
| Adjusted earnings pre tax - non-GAAP | 29,013 | 29,314 | 29,592 | 58,327 | 57,072 | |||||||||||||||||||||||||||
| Adjusted earnings tax | 7,297 | 7,069 | 7,401 | 14,366 | 14,066 | |||||||||||||||||||||||||||
| Adjusted earnings - non-GAAP | 21,716 | 22,245 | 22,191 | 43,961 | 43,006 | |||||||||||||||||||||||||||
| Preferred stock dividends | 2,228 | 2,228 | — | 4,456 | — | |||||||||||||||||||||||||||
| Adjusted earnings available to common shareholders | $ | 19,488 | $ | 20,017 | $ | 22,191 | $ | 39,505 | $ | 43,006 | ||||||||||||||||||||||
| Adjusted diluted earnings per common share | $ | 0.87 | $ | 0.88 | $ | 0.98 | $ | 1.75 | $ | 1.90 | ||||||||||||||||||||||
| Adjusted return on average assets | 1.10 | % | 1.15 | % | 1.21 | % | 1.12 | % | 1.18 | % | ||||||||||||||||||||||
| Adjusted return on average shareholders' equity | 11.21 | % | 11.76 | % | 13.84 | % | 11.48 | % | 13.34 | % | ||||||||||||||||||||||
| Adjusted return on average tangible common equity | 16.10 | % | 17.11 | % | 19.41 | % | 16.60 | % | 18.65 | % | ||||||||||||||||||||||
| Adjusted Pre-Tax, Pre-Provision Earnings Reconciliation | ||||||||||||||||||||||||||||||||
| For the Three Months Ended | For the Six Months Ended | |||||||||||||||||||||||||||||||
| June 30, | March 31, | June 30, | June 30, | June 30, | ||||||||||||||||||||||||||||
| (dollars in thousands) | 2023 | 2023 | 2022 | 2023 | 2022 | |||||||||||||||||||||||||||
| Adjusted earnings pre tax - non-GAAP | $ | 29,013 | $ | 29,314 | $ | 29,592 | $ | 58,327 | $ | 57,072 | ||||||||||||||||||||||
| Provision for credit losses | 5,879 | 3,135 | 5,441 | 9,014 | 9,608 | |||||||||||||||||||||||||||
| Impairment on commercial mortgage servicing rights | — | — | 869 | — | 1,263 | |||||||||||||||||||||||||||
| Adjusted pre-tax, pre-provision earnings - non-GAAP | $ | 34,892 | $ | 32,449 | $ | 35,902 | $ | 67,341 | $ | 67,943 | ||||||||||||||||||||||
| Adjusted pre-tax, pre-provision return on average assets | 1.76 | % | 1.67 | % | 1.95 | % | 1.72 | % | 1.87 | % | ||||||||||||||||||||||
| MIDLAND STATES BANCORP, INC. | ||||||||||||||||||||||||||||||||
| RECONCILIATIONS OF NON-GAAP FINANCIAL MEASURES (unaudited) (continued) | ||||||||||||||||||||||||||||||||
| Efficiency Ratio Reconciliation | ||||||||||||||||||||||||||||||||
| For the Three Months Ended | For the Six Months Ended | |||||||||||||||||||||||||||||||
| June 30, | March 31, | June 30, | June 30, | June 30, | ||||||||||||||||||||||||||||
| (dollars in thousands) | 2023 | 2023 | 2022 | 2023 | 2022 | |||||||||||||||||||||||||||
| Noninterest expense - GAAP | $ | 42,894 | $ | 44,482 | $ | 41,339 | $ | 87,376 | $ | 82,223 | ||||||||||||||||||||||
| Integration and acquisition expenses | — | — | (324) | — | (415) | |||||||||||||||||||||||||||
| Adjusted noninterest expense | $ | 42,894 | $ | 44,482 | $ | 41,015 | $ | 87,376 | $ | 81,808 | ||||||||||||||||||||||
| Net interest income - GAAP | $ | 58,840 | $ | 60,504 | $ | 61,334 | $ | 119,344 | $ | 118,161 | ||||||||||||||||||||||
| Effect of tax-exempt income | 195 | 244 | 321 | 439 | 690 | |||||||||||||||||||||||||||
| Adjusted net interest income | 59,035 | 60,748 | 61,655 | 119,783 | 118,851 | |||||||||||||||||||||||||||
| Noninterest income - GAAP | 18,753 | 15,779 | 14,613 | 34,532 | 30,226 | |||||||||||||||||||||||||||
| Impairment on commercial mortgage servicing rights | — | — | 869 | — | 1,263 | |||||||||||||||||||||||||||
| Loss on sales of investment securities, net | 869 | 648 | 101 | 1,517 | 101 | |||||||||||||||||||||||||||
| (Gain) on repurchase of subordinated debt | (676) | — | — | (676) | — | |||||||||||||||||||||||||||
| Adjusted noninterest income | 18,946 | 16,427 | 15,583 | 35,373 | 31,590 | |||||||||||||||||||||||||||
| Adjusted total revenue | $ | 77,980 | $ | 77,175 | $ | 77,238 | $ | 155,156 | $ | 150,441 | ||||||||||||||||||||||
| Efficiency ratio | 55.01 | % | 57.64 | % | 53.10 | % | 56.32 | % | 54.38 | % | ||||||||||||||||||||||
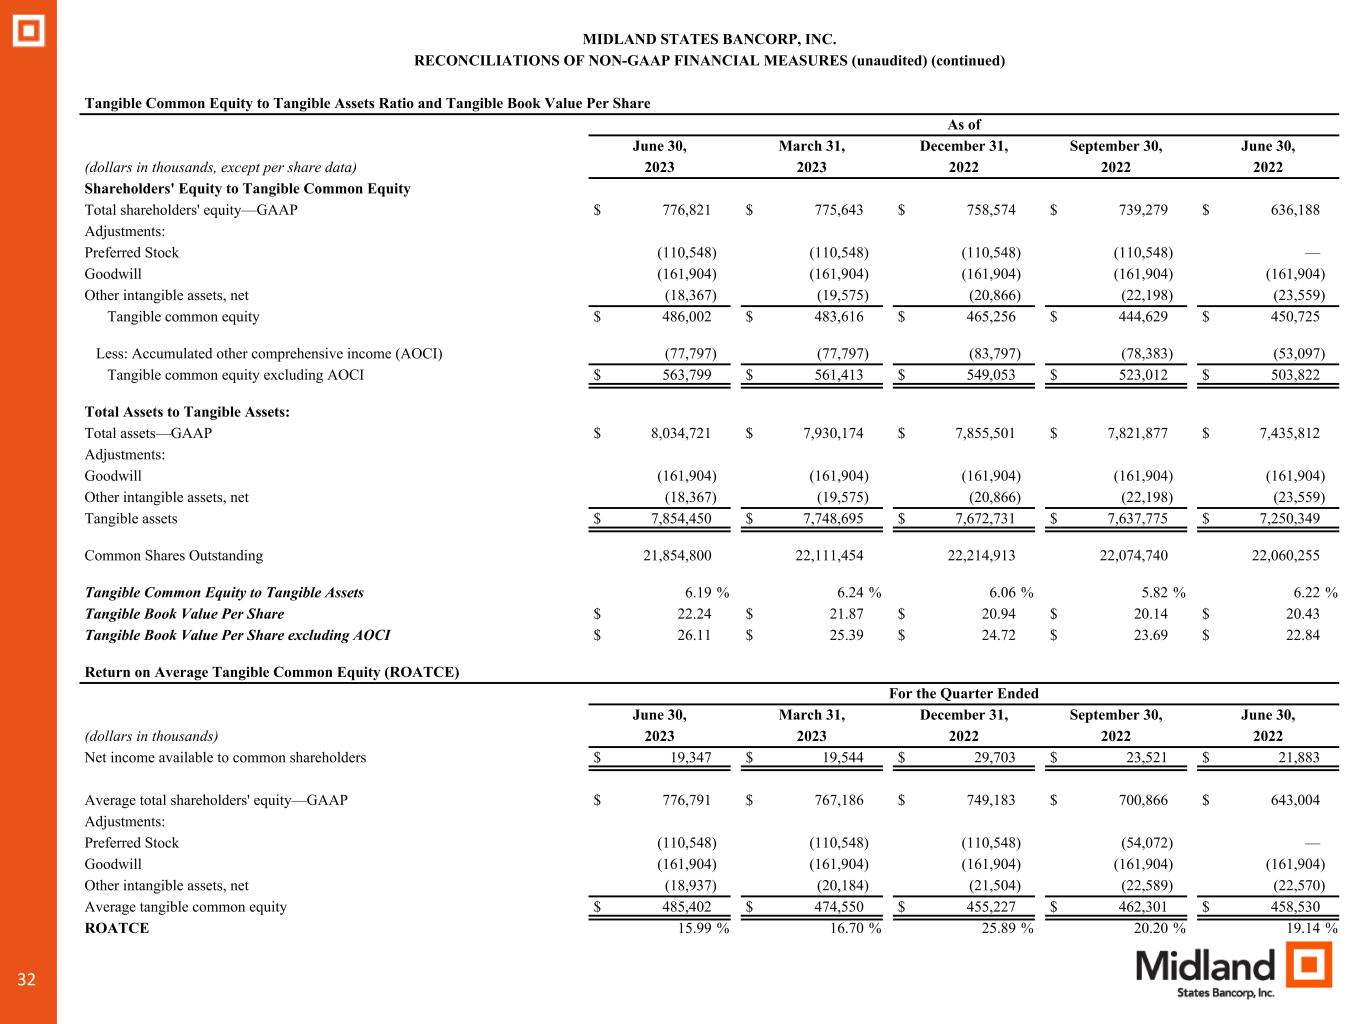
| Return on Average Tangible Common Equity (ROATCE) | ||||||||||||||||||||||||||||||||
| For the Three Months Ended | For the Six Months Ended | |||||||||||||||||||||||||||||||
| June 30, | March 31, | June 30, | June 30, | June 30, | ||||||||||||||||||||||||||||
| (dollars in thousands) | 2023 | 2023 | 2022 | 2023 | 2022 | |||||||||||||||||||||||||||
| Net income available to common shareholders | $ | 19,347 | $ | 19,544 | $ | 21,883 | $ | 38,891 | $ | 42,632 | ||||||||||||||||||||||
| Average total shareholders' equity—GAAP | $ | 776,791 | $ | 767,186 | $ | 643,004 | $ | 772,015 | $ | 650,126 | ||||||||||||||||||||||
| Adjustments: | ||||||||||||||||||||||||||||||||
| Preferred Stock | (110,548) | (110,548) | — | (110,548) | — | |||||||||||||||||||||||||||
| Goodwill | (161,904) | (161,904) | (161,904) | (161,904) | (161,904) | |||||||||||||||||||||||||||
| Other intangible assets, net | (18,937) | (20,184) | (22,570) | (19,557) | (23,101) | |||||||||||||||||||||||||||
| Average tangible common equity | $ | 485,402 | $ | 474,550 | $ | 458,530 | $ | 480,006 | $ | 465,121 | ||||||||||||||||||||||
| ROATCE | 15.99 | % | 16.70 | % | 19.14 | % | 16.34 | % | 18.48 | % | ||||||||||||||||||||||
| MIDLAND STATES BANCORP, INC. | ||||||||||||||||||||||||||||||||
| RECONCILIATIONS OF NON-GAAP FINANCIAL MEASURES (unaudited) (continued) | ||||||||||||||||||||||||||||||||
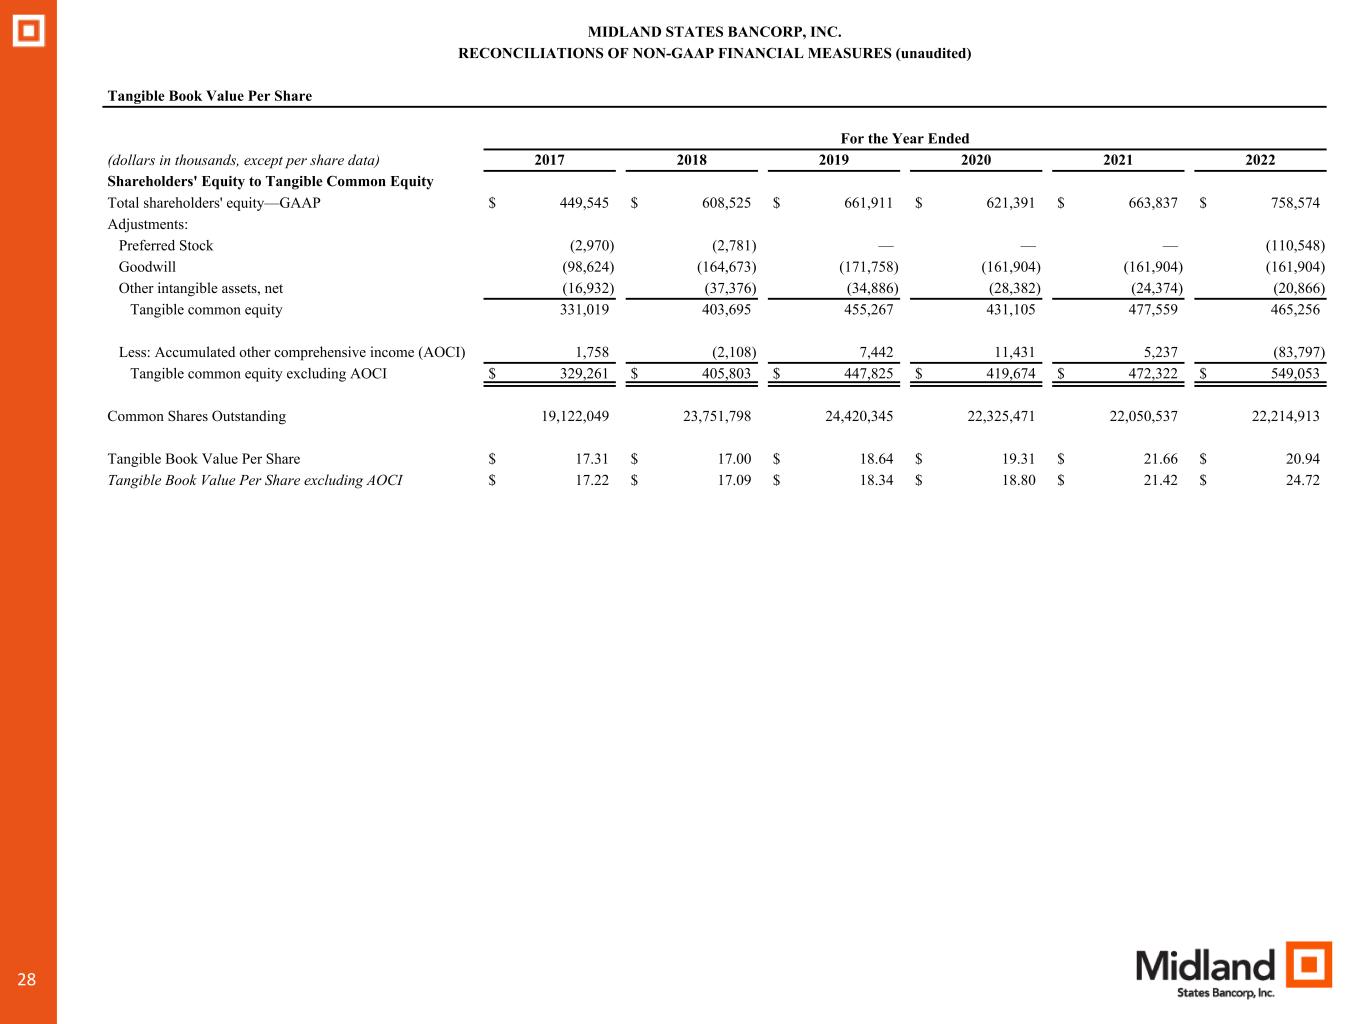
| Tangible Common Equity to Tangible Assets Ratio and Tangible Book Value Per Share | ||||||||||||||||||||||||||||||||
| As of | ||||||||||||||||||||||||||||||||
| June 30, | March 31, | December 31, | September 30, | June 30, | ||||||||||||||||||||||||||||
| (dollars in thousands, except per share data) | 2023 | 2023 | 2022 | 2022 | 2022 | |||||||||||||||||||||||||||
| Shareholders' Equity to Tangible Common Equity | ||||||||||||||||||||||||||||||||
| Total shareholders' equity—GAAP | $ | 776,821 | $ | 775,643 | $ | 758,574 | $ | 739,279 | $ | 636,188 | ||||||||||||||||||||||
| Adjustments: | ||||||||||||||||||||||||||||||||
| Preferred Stock | (110,548) | (110,548) | (110,548) | (110,548) | — | |||||||||||||||||||||||||||
| Goodwill | (161,904) | (161,904) | (161,904) | (161,904) | (161,904) | |||||||||||||||||||||||||||
| Other intangible assets, net | (18,367) | (19,575) | (20,866) | (22,198) | (23,559) | |||||||||||||||||||||||||||
| Tangible common equity | $ | 486,002 | $ | 483,616 | $ | 465,256 | $ | 444,629 | $ | 450,725 | ||||||||||||||||||||||
| Less: Accumulated other comprehensive income (AOCI) | (84,719) | (77,797) | (83,797) | (78,383) | (53,097) | |||||||||||||||||||||||||||
| Tangible common equity excluding AOCI | 570,721 | 561,413 | 549,053 | 523,012 | 503,822 | |||||||||||||||||||||||||||
| Total Assets to Tangible Assets: | ||||||||||||||||||||||||||||||||
| Total assets—GAAP | $ | 8,034,721 | $ | 7,930,174 | $ | 7,855,501 | $ | 7,821,877 | $ | 7,435,812 | ||||||||||||||||||||||
| Adjustments: | ||||||||||||||||||||||||||||||||
| Goodwill | (161,904) | (161,904) | (161,904) | (161,904) | (161,904) | |||||||||||||||||||||||||||
| Other intangible assets, net | (18,367) | (19,575) | (20,866) | (22,198) | (23,559) | |||||||||||||||||||||||||||
| Tangible assets | $ | 7,854,450 | $ | 7,748,695 | $ | 7,672,731 | $ | 7,637,775 | $ | 7,250,349 | ||||||||||||||||||||||
| Common Shares Outstanding | 21,854,800 | 22,111,454 | 22,214,913 | 22,074,740 | 22,060,255 | |||||||||||||||||||||||||||
| Tangible Common Equity to Tangible Assets | 6.19 | % | 6.24 | % | 6.06 | % | 5.82 | % | 6.22 | % | ||||||||||||||||||||||
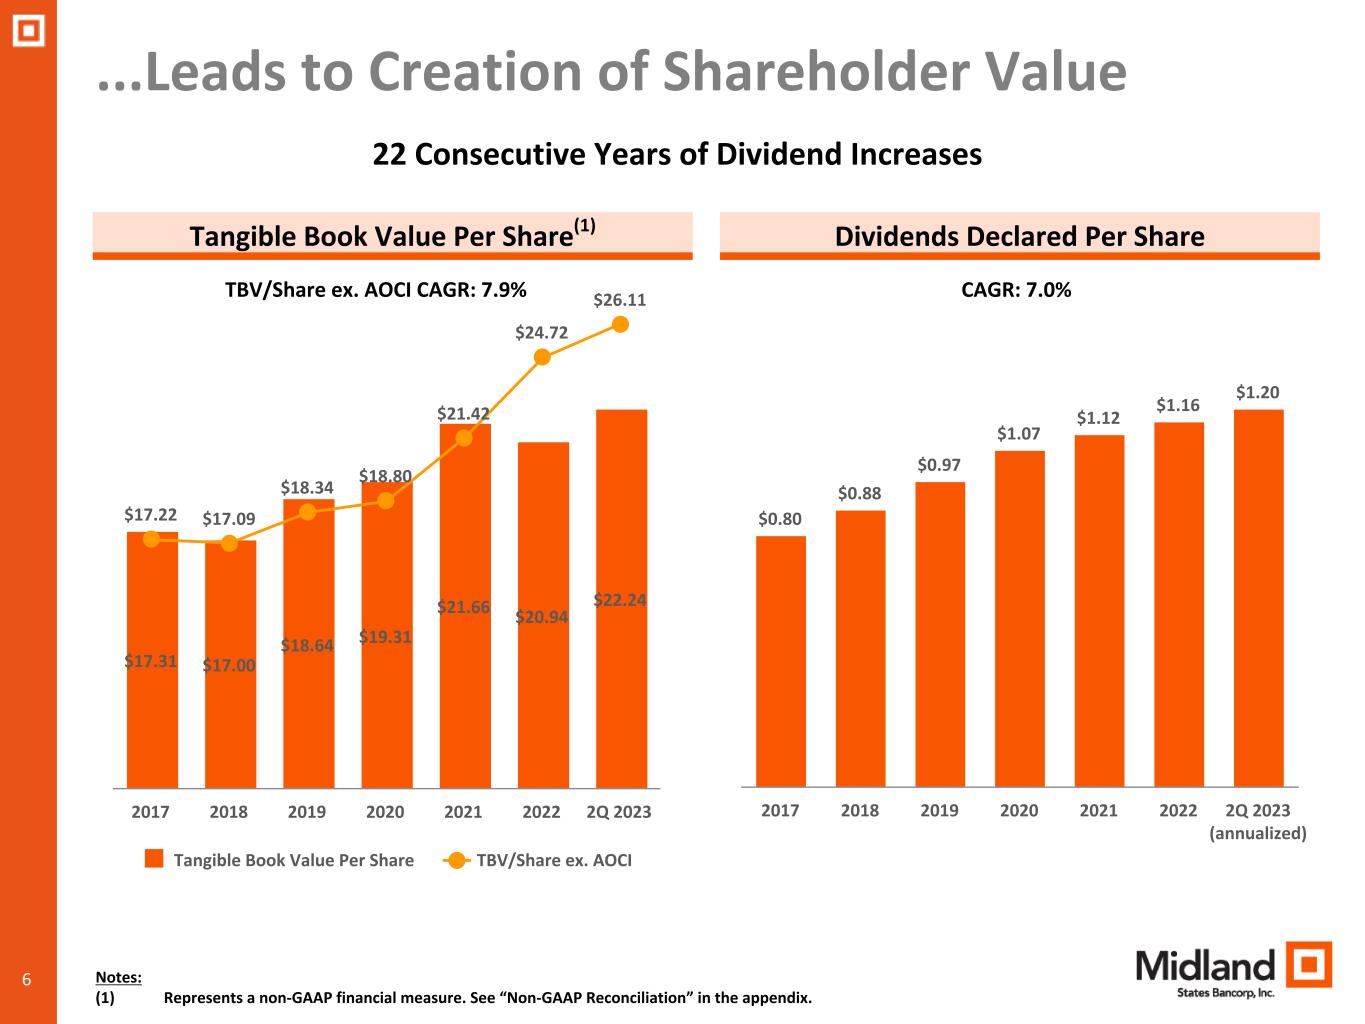
| Tangible Book Value Per Share | $ | 22.24 | $ | 21.87 | $ | 20.94 | $ | 20.14 | $ | 20.43 | ||||||||||||||||||||||
| Tangible Book Value Per Share excluding AOCI | $ | 26.11 | $ | 25.39 | $ | 24.72 | $ | 23.69 | $ | 22.84 | ||||||||||||||||||||||
