Document
Exhibit 99.2
April 22, 2024
Fellow Calix stockholders:
The first quarter of fiscal 2024 represented another quarter of deliberate and disciplined execution, highlighted by the continued strength in our platform, clouds and managed services. This execution produced record gross margin as our broadband service provider (BSP) customers continued to deliver value to their subscribers.
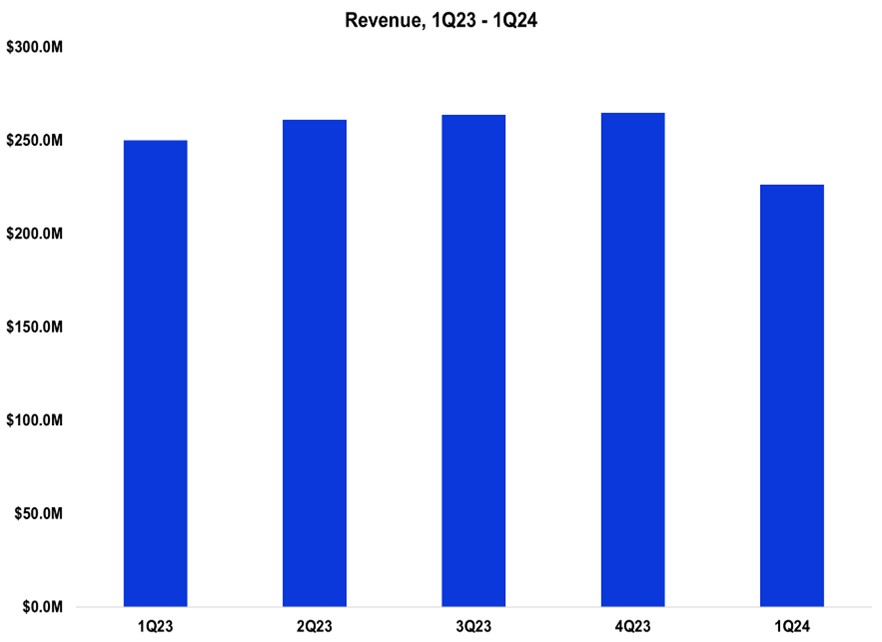
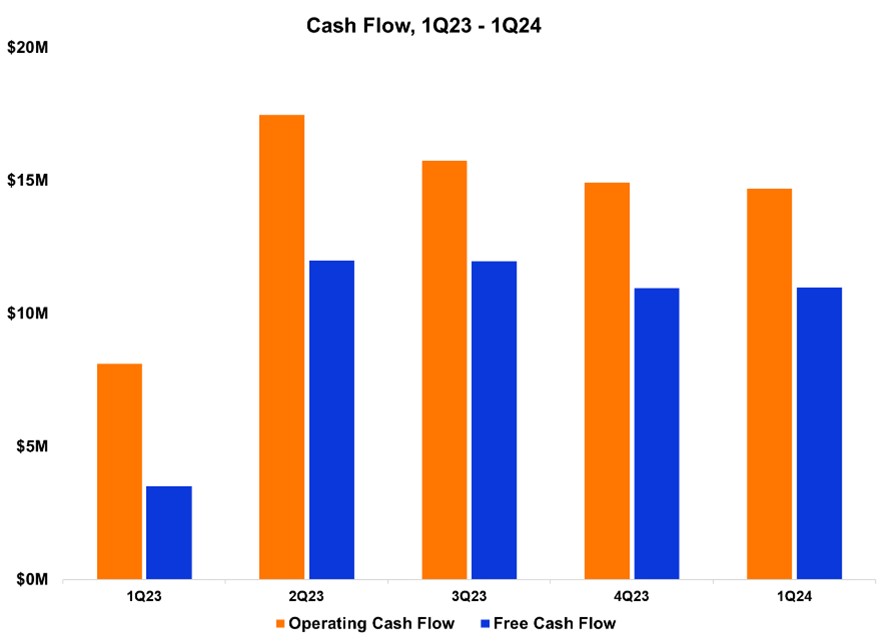
Against the current crosswinds that are still prevalent across our industry, we generated revenue of $226.3 million, which was within the guidance range provided in January, and produced our fourth consecutive quarter of double-digit free cash flow, further strengthening our already strong balance sheet.
Over several years, we have developed a highly predictable platform, cloud and manages services operating model that is growing at a strong clip. This is demonstrated most acutely by the success our customers are having with their subscribers through higher Net Promoter ScoresSM and a growing subscriber base. Our new BSP customer additions continued with 10 new BSPs partnering with Calix in the first quarter of 2024. Unlike in times past when many new customers were startups, our new customer additions are currently coming from existing service providers that are served by legacy equipment manufacturers. The success we are achieving is led by the strength of our unique platform, cloud and managed services model that our BSP customers leverage to simplify their operations, engagement and service, innovate for their consumer, business and municipal subscribers and grow their value for members, investors and the communities they serve.
At the same time, the appliance (hardware systems) portion of our business continues to be challenged by three main factors. The first is the continued indecision by our customers regarding whether they apply for BEAD or other governmental funding sources. The second is the shortening of lead times to our customers, which has the effect of reducing the amount of customers’ inventory while at the same time limiting our visibility. Third, there is a set of customers that have extended the evaluation of their spending plans into the second quarter of 2024 or have changed their investment priorities for 2024 to concentrate on adding new subscribers in existing network builds versus continuing to aggressively build new networks. We believe each of these factors will resolve themselves over the course of this year.
Even with these crosswinds, our customers are expanding their existing networks and continue to add new subscribers, demonstrating that our platform, cloud and managed services growth is strong despite delays in new network build decisions. With the continued evolution of our sales mix, we again maintain our expectation that non-GAAP gross margin for the year will expand at the high end of our Target Financial Model of 100 to 200 basis point improvement.
We plan to remain very disciplined with our operating expenses in 2024. This was evidenced by operating expenses declining from the prior quarter and reverting back to similar levels seen in the second quarter of 2023. While our goal is to align operating expenses with our Target Financial Model, we plan to maintain our current level of investments in 2024 as we believe this year represents a great opportunity to grow our footprint ahead of the anticipated U.S. government broadband investment.
At Calix, “better, better, never best” is ingrained in our company culture. The industry continues to acknowledge our appliance-based model driven by the power of our platform, cloud and managed services through recent awards including:
•Calix achieves an AA rating from environmental, social and governance rating agency MSCI
•Glassdoor – Best Place to Work in the U.S. Calix was rated 25/100 for large companies
•Calix has been recognized by Comparably for Best HR Teams, Best Engineering Teams, Best Global Culture and Best Company Outlook in 2024
•Calix outperforms on standards with the world’s only systems portfolio that is both TR-369 and TR-398 certified
•TMC Cloud Computing Magazine – Engagement Cloud has won Customer Product of the Year
•Broadband Multimedia Marketing Association – Best in Class Call Center and Best in Class Vendor Marketing
Our leadership team is focused on continuing to improve our financial performance over the long-term across four measurable objectives:
•Deliberate revenue growth
•Gross margin expansion
•Disciplined operating expense investment
•Ongoing predictability
In conclusion, we are confident in our plan and foresee the opportunity for years of robust growth when the current crosswinds abate. In the meantime, we are taking advantage of this unique opportunity to land new footprint, which will put us in an enviable position when the market turns. As the only end-to-end platform company enabling BSPs to maximize the disruption of the legacy broadband industry, we remain focused on expanding our platform, cloud and managed services business. With our debt free balance sheet and experienced team that is redefining the BSP marketplace, we are confident in our ability to enable the success of our customers, thereby positioning us for long-term success.
First Quarter 2024 Financial Results
|
|
|
|
|
|
|
|
|
|
|
|
|
Actual GAAP |
Actual Non-GAAP |
Guidance Non-GAAP 1 |
| Revenue |
$226.3m |
$226.3m |
$225.0m – $231.0m |
| Gross margin |
54.2% |
54.9% 2 |
53.5% – 55.5% 1 |
| Operating expenses |
$124.6m |
$108.4m 2 |
$107.0m – $110.0m 1 |
| Net income per diluted common share |
$0.00 |
$0.21 2 |
$0.17 – $0.23 1 |
|
|
|
|
|
|
|
|
1 |
Non-GAAP guidance provided on January 30, 2024. |
|
|
2 |
Non-GAAP excludes stock-based compensation and intangible asset amortization as well as the income tax impact of these items. See GAAP to non-GAAP reconciliations beginning on page 15. |
|
|
|
|
|
|
|
|
|
|
|
|
|
|
|
|
|
|
|
|
|
|
|
|
|
|
|
|
|
|
|
|
|
|
For the first quarter of 2024, revenue was $226.3 million, representing a decrease of 15% from the prior quarter and 9% compared with the same quarter a year ago.
Revenue EDGE revenue decreased by 21% from the prior quarter due to lower appliance shipments primarily as a customer slowed deliveries as it reevaluates its capital allocations and was up 7% compared with the year ago quarter as both new and existing customers continued to add subscribers.
Intelligent Access EDGE revenue was down 16% from the prior quarter primarily due to the lower shipments to a large customer accepting final deliveries for their current capital expenditure cycle as they plan for new network builds and continuing indecision by customers on new network builds as they pursue government stimulus and declined 13% compared with the year ago quarter. The market continues to be driven by the technology upgrade cycle to consolidated networks and 10 Gigabit PON.
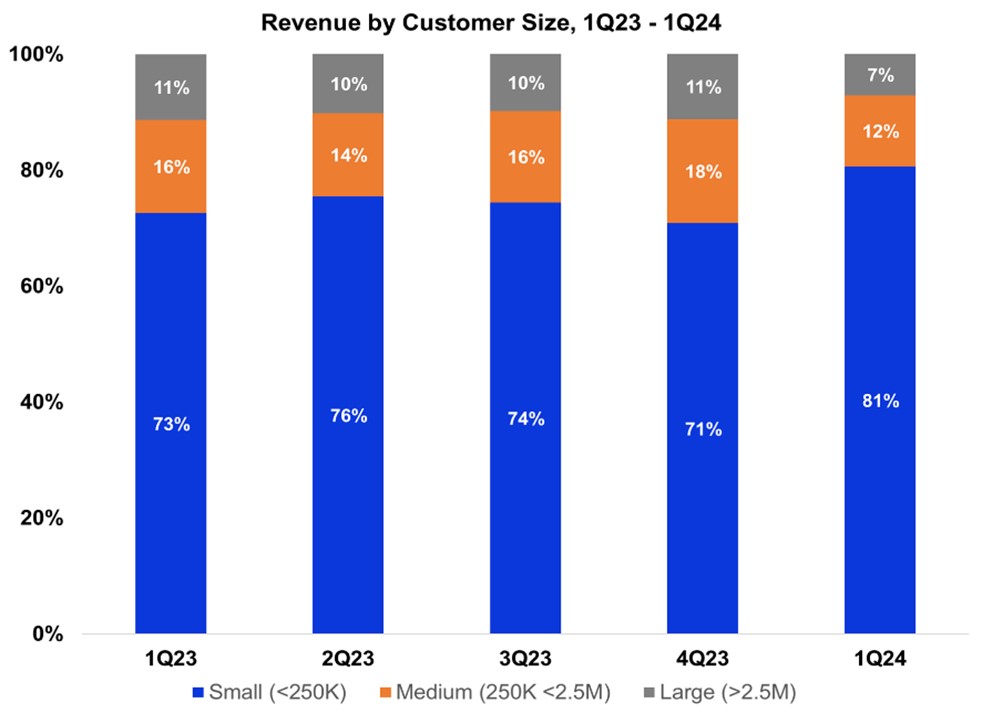
As we have discussed previously, technology disruptions start with small customers and eventually work their way up to large customers. However, as we noted in our January call, we have a few customers in the large and medium category that paused their purchasing as they moved into 2024 while they reevaluate their near-term purchase and build decisions. While new network builds at our small customers slowed due to indecision around government stimulus, additions to existing networks combined with subscriber additions meant revenue from these customers remained relatively stable. As a result, revenue from small customers accounted for 81% of revenue for the first quarter of 2024, up from 71% for the prior quarter, and decreased 3% in absolute dollars. Revenue from medium-sized customers was 12% of revenue in the first quarter of 2024, down from 18% in the prior quarter, and decreased 41% in absolute dollars due primarily to a couple of significant customers in this category reducing their purchases.
Revenue from large customers was 7% of revenue for the first quarter of 2024, down from 11% in the prior quarter, and down 46% in absolute dollars from the fourth quarter of 2023. The decrease was primarily due to a customer continuing to evaluate their purchase plans for new network builds.
U.S. revenue was 93% of total revenue for the first quarter of 2024, down from 94% in the fourth quarter of 2023, and up from 91% of revenue for the year ago quarter. U.S. revenue declined 16% in absolute dollars sequentially, and 8% compared with the year ago quarter. International revenue was 7% of revenue in the first quarter of 2024, up by 1% in absolute dollars from the prior quarter. Higher shipments to Americas customers outside the U.S. and Middle East/Africa customers were mostly offset by lower shipments to Europe. International revenue was down 26% compared with the year ago period primarily due to lower shipments to Europe.
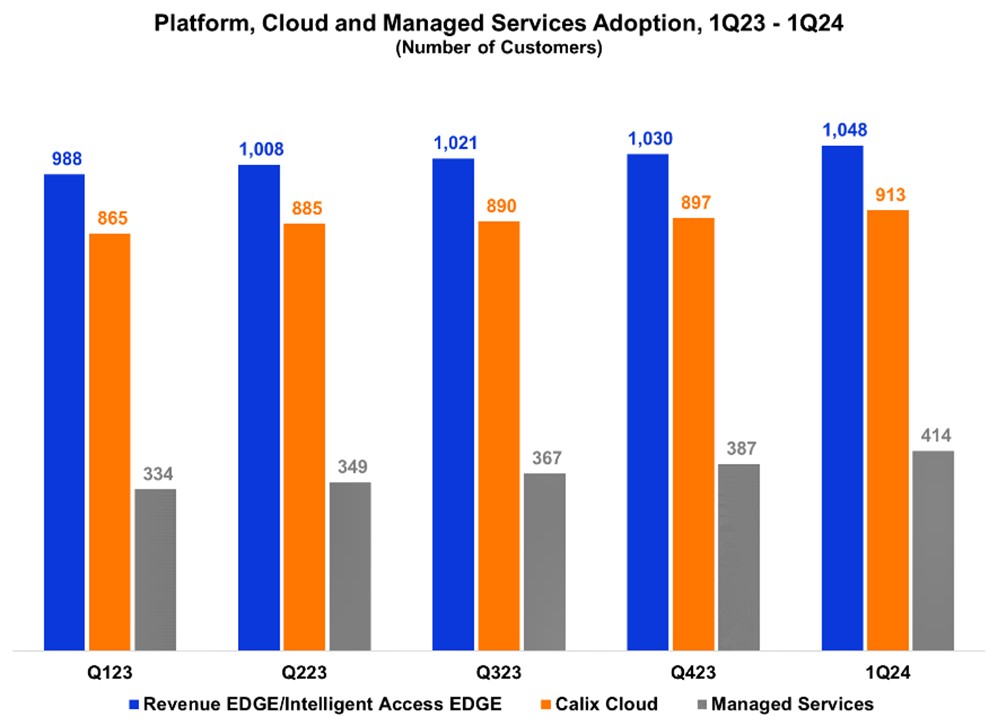
Expanded customer adoption of our platform, cloud and managed services was again evidenced by the
strong increase in all three metrics compared with the prior quarter. As we have noted previously, our platform, cloud and managed services monetize based on subscriber count, and the growth in subscribers and on-going adoption of our platform, cloud and managed services form the “expand” in our “land and expand” strategy. Over time, we expect the recurring revenue from continued platform, cloud and managed services adoption will drive higher gross margin.
Our platform consists of Revenue EDGE, Intelligent Access EDGE and Calix Cloud. We added 18 new Revenue EDGE and/or Intelligent Access EDGE customer deployments in the first quarter of 2024. By deploying the Revenue EDGE, BSPs can quickly implement and sell managed services, thereby enabling them to improve their average revenue per user at high margins with the greatest levels of subscriber satisfaction.
We added 16 new Calix Cloud deployments, which include Engagement Cloud, Service Cloud and/or Operations Cloud in the first quarter of 2024. Calix Cloud allows our BSPs to benefit from the power of data-driven insights to drive best-in-class Net Promoter ScoresSM.
Our managed services showed continued growth as 27 additional customers began deploying a managed service. We currently offer 9 managed services consisting of Wi-FiIQ, CommandIQ, ProtectIQ, ExperienceIQ, Arlo Secure, Bark, Servify, SmartBiz and SmartTown.
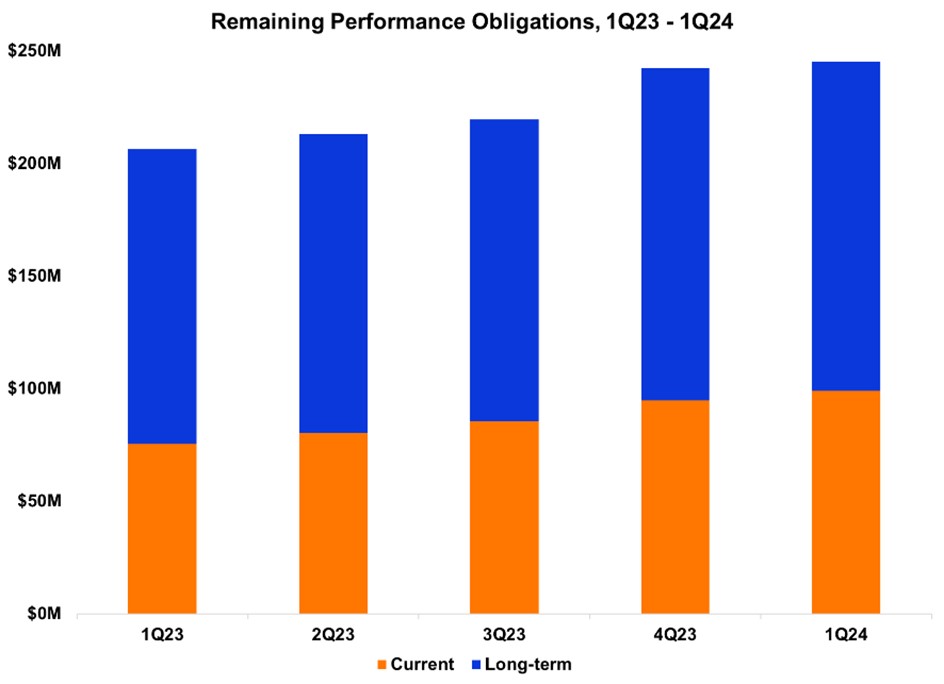
Remaining performance obligations, or RPOs, result from long-term commitments made by our customers and consist mainly of Calix Cloud, managed services, extended warranties and support/ maintenance agreements, while excluding platform licenses, month-to-month usage-based models and true-ups. These commitments generally have an initial term of three years. As of the end of the first quarter of 2024, our RPOs were $245.2 million, which is an increase of $2.7 million, or 1%, from the prior quarter and an increase of $39.0 million, or 19%, from the same quarter a year ago. Meanwhile, current RPO was $99.1 million, up 5% from $94.7 million at the end of the prior quarter end and up 31% from $75.3 million at the quarter end a year ago. The increases reflect the continued adoption of our platform offerings by our BSP customers. We expect to see quarterly RPO growth for the foreseeable future.
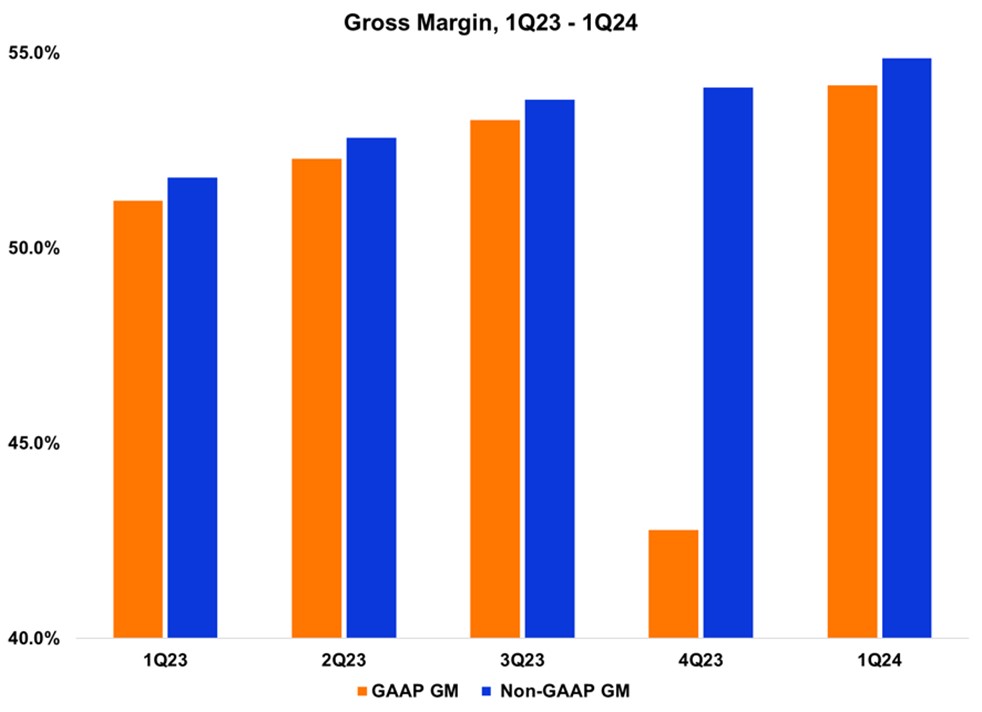
Our GAAP gross margin for the first quarter of 2024 was a record 54.2%, an increase of 1,140 basis points sequentially and 300 basis points year-over-year. As a reminder, in the fourth quarter of 2023, we took one-time charges of $28.7 million to write down inventory and accrued liabilities related to excess components at suppliers, primarily related to the wind down of our legacy product set. Also included in GAAP gross margin for the first quarter of 2024 is stock-based compensation and intangible asset amortization. Excluding these items, our non-GAAP gross margin for the first quarter of 2024 was a record 54.9%, representing an increase of 80 basis points sequentially and 310 basis points from the year ago period. The continued improvement is primarily due to higher platform, cloud and managed services revenue as it continues to grow as well as being a greater mix of total revenue as our appliance revenue was down in the first quarter of 2024. Our expectation is the long-term trend for gross margin on an annual basis will continue to increase with varied rates on a quarterly basis.
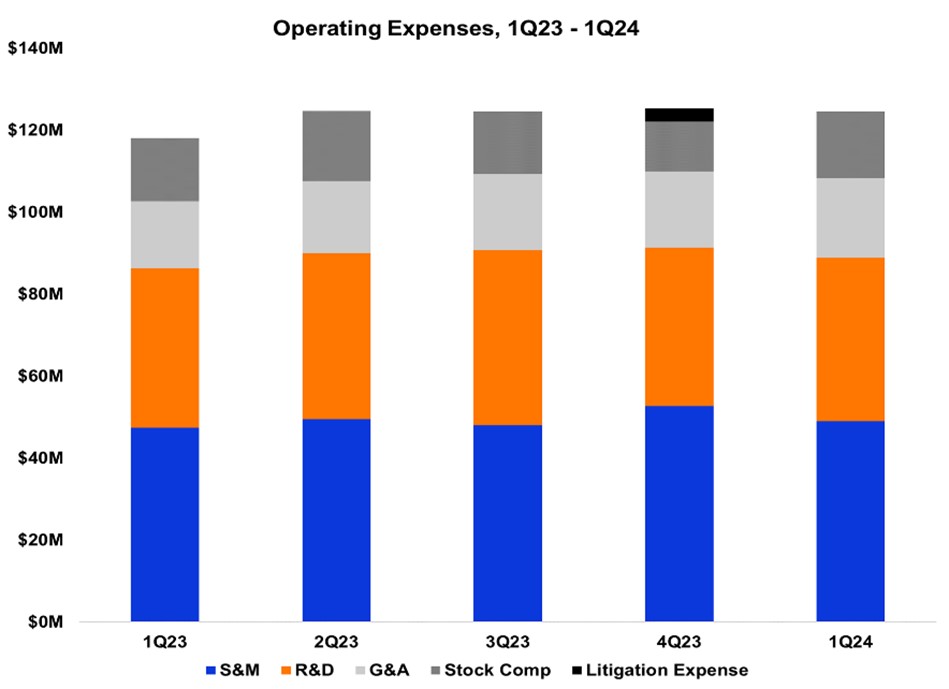
Our GAAP and non-GAAP operating expenses for the first quarter of 2024 were $124.6 million and $108.4 million, representing 55.1% and 47.9% of revenue, respectively. Sequentially, GAAP operating expenses decreased by $0.7 million primarily due to the ConneXions event and litigation settlement that occurred in the fourth quarter of 2023 partially offset by higher stock-based compensation. Excluding the stock-based compensation and litigation settlement, non-GAAP operating expenses decreased by $1.6 million from the prior quarter. Non-GAAP operating expenses decreased primarily from the ConneXions event that was reflected in the fourth quarter of 2023. Compared with the year ago quarter, GAAP and non-GAAP operating expenses increased by 5.5% primarily due to ongoing investments in headcount across our organization. We believe these investments will support the current and future demand for our platform offerings as we focus on our BSP customers’ success and landing new footprint during this transition period ahead of government stimulus. Non-GAAP sales and marketing investments were 21.7% of revenue, which is above our Target Financial Model range of 18% to 20%. Non-GAAP research and development investments were 32.1% of gross profit, which is above our Target Financial Model of 29%. Non-GAAP general and administrative investments were 8.6% of revenue, which is above our Target Financial Model of 7%. As we noted above, we plan to maintain our current level of operating expense investments in 2024 as we believe this year represents a great opportunity to grow our footprint ahead of the U.S. government broadband investment.
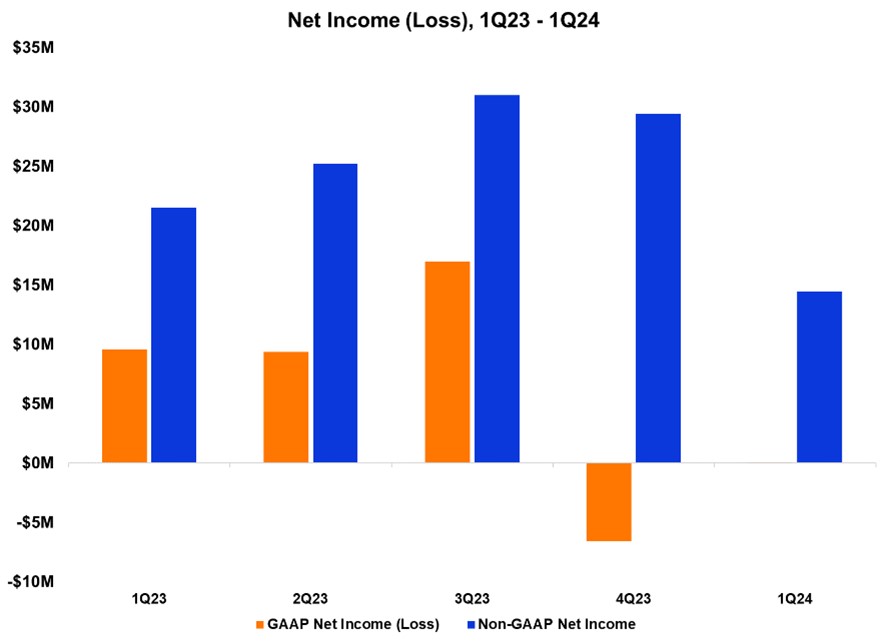
GAAP net income of $0.1 million for the first quarter of 2024 increased from a GAAP net loss by approximately $6.7 million sequentially and decreased approximately $9.5 million compared with the same quarter a year ago. The sequential improvement was primarily related to the one-time inventory and component liability charges we took in the fourth quarter of 2023. The decline from the same quarter a year ago was the result of lower revenue.
GAAP net income for the first quarter of 2024 also included stock-based compensation of $16.9 million and intangible asset amortization of $1.0 million, partially offset by the income tax effect for these items of $3.5 million. Our non-GAAP net income for the first quarter of 2024 was $14.4 million, a decrease of $15.0 million when compared with $29.4 million in the prior quarter. The change was mainly due to the lower revenue partially offset by higher gross margin and lower operating expenses and income taxes. Non-GAAP net income decreased approximately $7.1 million when compared with $21.5 million last year primarily due to lower revenue and higher operating expenses partially offset by higher gross margin and lower income taxes.
Balance Sheet and Cash Flow
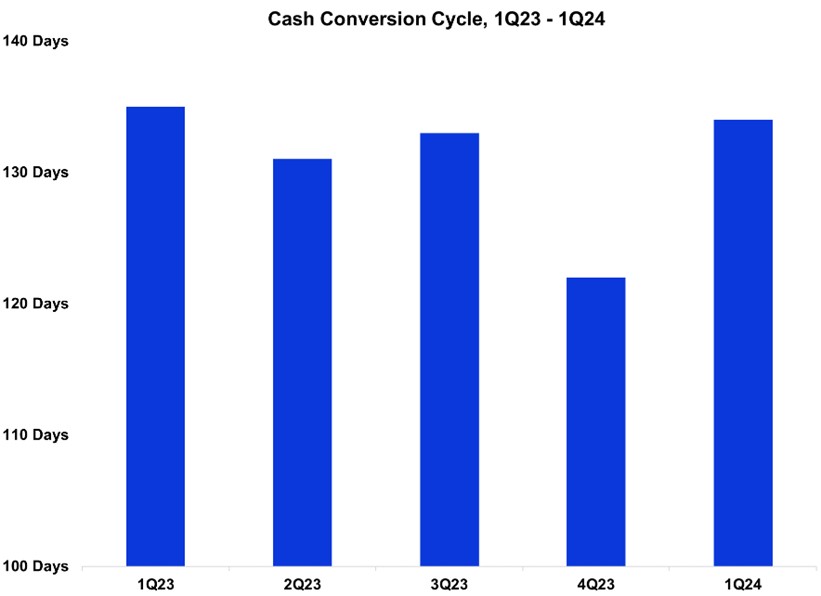
Our balance sheet remains strong. Our Days Sales Outstanding (DSO) at the end of the first quarter 2024 was 40 days, down 4 days from the prior quarter and up 6 days from the same quarter a year ago. Our Target Financial Model for DSO remains between 35 and 45 days. Inventory turns were 3.1, down from 3.3 in the prior quarter as our component inventory increased and up from 2.9 in the same quarter a year ago. Inventory turns for the first quarter of 2024 were within our Target Financial Model of 3 to 4 turns. In the first quarter of 2024, our inventory deposits declined by $2.0 million, bringing our total inventory deposits to $76.1 million. With supplier lead times normalizing, we expect over the next year that our inventory turns will adjust toward the middle of the Target Financial Model range and the suppliers’ inventory deposits will diminish in the coming quarters. Days payable outstanding (DPO) at the end of the first quarter was 22 days, down 9 days from the prior quarter and down 3 days from the year ago quarter. Our Target Financial Model for DPO is to be between 25 and 35 days. Our cash conversion cycle was 134 days compared with 122 days in the prior quarter and 135 days in the same quarter last year. Our Target Financial Model remains for our cash conversion cycle to be between 100 and 130 days.
We ended the first quarter of 2024 with cash and investments of $239.5 million, which was a sequential increase of $19.1 million. The increase was primarily due to positive non-GAAP free cash flow of $11.0 million and proceeds from equity-based employee benefit plans of $10.8 million, partially offset by common stock repurchases of $3.7 million at an average price of $32.87. Compared with the first quarter a year ago, our cash and investments decreased by $17.6 million primarily due to our common stock repurchases of $88.9 million partially offset by positive non-GAAP free cash flow of $45.9 million and proceeds from equity-based employee benefit plans of $30.5 million. At the end of the first quarter of 2024, we had $109.9 million available under our stock repurchase program. We continue to expect both GAAP operating and non-GAAP free cash flow to remain strong due to continued non-GAAP profitability and as our cash conversion cycle improves.
Second Quarter 2024 Guidance
|
|
|
|
|
|
|
|
|
|
Guidance Non-GAAP |
Guidance Reconciled to GAAP |
| Revenue |
$197.0m – $203.0m |
$197.0m – $203.0m |
| Gross margin |
54.25% – 56.25% 1 |
53.55% – 55.55% |
| Operating expenses |
$106.0m – $109.0m 1 |
$122.0m – $125.0m |
Net income (loss) per diluted common share 2 |
$0.03 – $0.09 1 |
$(0.19) – $(0.13) |
|
|
|
|
|
|
|
|
1 |
Non-GAAP excludes stock-based compensation and intangible asset amortization as well as the income tax impact of these items. See GAAP to non-GAAP reconciliation on page 17. |
|
|
2 |
Based on 68.5 million weighted-average diluted common shares outstanding. |
|
|
|
|
|
|
|
|
|
|
|
|
|
|
|
|
|
|
|
|
|
|
|
|
|
|
|
|
|
|
|
|
|
|
Our guidance for the second quarter of 2024, ending June 29, 2024, reflects our expectations as of the date of this letter.
Our revenue guidance for the second quarter of 2024 is for revenue to be between $197 million and $203 million. As we discussed above, we expect 2024 to be a year of decision making for our U.S. customers as they are in the process of evaluating and finalizing their plans to apply for the billions of available government stimulus dollars. While we expect this will reduce our appliance shipments in the second quarter, our platform, cloud and managed services will continue to grow.
Due to the continued expansion of our platform, cloud and managed services and the lower appliance revenue outlook, our non-GAAP gross margin guidance for the second quarter of 2024 of 55.25% (at the midpoint) represents an increase of 35 basis points compared with the prior quarter.
Our non-GAAP operating expense guidance for the second quarter of 2024 remains higher than our Target Financial Model as a percentage of revenue due to the current revenue outlook. Throughout 2024 we plan to keep our operating expenses relatively constant with the prior year as we execute on the opportunity to land new footprint prior to the anticipated arrival of the U.S. government stimulus starting in 2025.
We expect our 2024 non-GAAP effective tax rate for 2024 will be within a range of 21% to 23%.
Summary
For many years, we have said that the once-in-a-generation disruption of the broadband industry is just getting started. While the current conditions are producing some crosswinds in the appliance side of our business, the platform, cloud and managed services business continues to ride the wave of disruption. This part of our business helps our customers win, and with that our success will be reflected in continued gross margin expansion.
The foundation for our long-term growth continues to be based on three vectors:
•New subscribers: BSP customers leverage our platform, cloud and managed services to differentiate themselves in their markets thereby adding subscribers.
•Existing subscribers: BSP customers adopt additional platform extensions, clouds and managed services to reduce their operational costs and grow revenue per subscriber.
•New BSPs: We continue to sign new strategically aligned service providers who recognize that our unique platform, cloud and managed services model enables their team to transform their business as they simplify their operations, engagement and service, innovate for their consumer, business and municipal subscribers and grow their value for members, investors and the communities they serve.
With a growing footprint, supported by our strong balance sheet, we remain enthusiastic about the long-term growth potential for Calix and our strategically aligned BSP customers. We see 2024 as an opportunity to grow our customer base and expand the reach of our platform, cloud and managed services across a larger number of customers and the communities they serve. When the market upturn resumes, and the broadband stimulus funds make their way to our BSP customers, we will be in an enviable position to maximize our position in the marketplace.
We sincerely thank our employees, customers, partners, vendors and stockholders for their continued support.
Sincerely,
|
|
|
|
|
|
|
|
|
|
Michael Weening
President and CEO
|
|
Cory Sindelar
CFO
|
Conference Call
In conjunction with this announcement, Calix will host a conference call tomorrow, April 23, 2024, at 5:30 a.m. Pacific Time / 8:30 a.m. Eastern Time to answer questions regarding our first quarter 2024 financial results. A live audio webcast and replay of the call will be available in the Investor Relations section of the Calix website at http://investor-relations.calix.com.
Live call access information: Dial-in number: (877) 407-4019 (U.S.) or (201) 689-8337 (outside the U.S.) ID# 13745128.
The conference call and webcast will include forward-looking information.
Investor Inquiries
Jim Fanucchi
VP, Investor Relations
InvestorRelations@calix.com
(408) 404-5400
About Calix
Calix, Inc. (NYSE: CALX) — Calix is a cloud and appliance-based platform and managed services company. Broadband service providers leverage the Calix broadband platform, cloud, and managed services to simplify operations, engagement, and service; innovate for their consumer, business, and municipal subscribers; and grow their business and the communities they serve.
Our end-to-end platform and managed services democratize the use of data—enabling our customers of any size to operate efficiently, acquire subscribers, and deliver exceptional experiences. Calix is dedicated to driving continuous improvement in partnership with our growing ecosystem to support the transformation of our customers and their communities.
Forward-Looking Statements
Statements made in this stockholder letter and the earnings call referencing the stockholder letter that are not statements of historical fact are forward-looking statements. Forward-looking statements are subject to the “safe harbor” provisions of the Private Securities Litigation Reform Act of 1995. Forward-looking statements relate to, but are not limited to, component and logistics costs, potential customer or market opportunities, growth and future opportunities, customer demand or the sustainability of continued demand, anticipated customer purchase trends, anticipated government funding, expected customer and product mix or anticipated adoption or deployment of our appliances, platform, cloud or managed services, industry, market and customer trends, opportunities with existing and prospective customers, the timing of BEAD/BABA shipments, free cash flow and liquidity, continuation of our stock repurchase program and future financial performance (including the outlook for the second quarter of 2024, full year and future periods and performance against our Target Financial Model). Forward-looking statements are subject to risks and uncertainties that could cause actual results to differ materially from expectations, including but not limited to fluctuations in our financial and operating results, the capital spending decisions of our customers, changes and disruptions in the market and industry, availability of capital in the market, potential for growth in our business driven by government funds, changes in and impacts of regulations and/or government sponsored programs, competition, our ability to achieve market acceptance of our appliances, platform, cloud or managed services, our ability to grow our customer base, fluctuations in costs associated with our appliances and services including higher costs, dependence on third-parties for production and resource management associated with our global supply chain that may cause delays in production, inventory write-offs or component liabilities, cost overruns, disruptions in global trade and relations, social unrest and political uncertainties and other unanticipated factors, as well as the risks and uncertainties described in our annual reports on Form 10-K and our quarterly reports on Form 10-Q, each as filed with the SEC and available at www.sec.gov, particularly in the sections titled “Risk Factors.” Forward-looking statements speak only as of the date the statements are made and are based on information available to us at the time those statements are made and/or management’s good faith belief as of that time with respect to future events.
Calix assumes no obligation to update forward-looking statements to reflect actual performance or results, changes in assumptions or changes in other factors affecting forward-looking information, except to the extent required by applicable securities laws. Accordingly, investors should not place undue reliance on any forward-looking statements.
Use of Non-GAAP Financial Information
The Company uses certain non-GAAP financial measures in this stockholder letter to supplement its consolidated financial statements, which are presented in accordance with U.S. GAAP. These non-GAAP measures include non-GAAP gross margin, non-GAAP operating expenses, non-GAAP sales and marketing investments, non-GAAP research and development investments, non-GAAP general and administrative investments, non-GAAP effective income tax rate, non-GAAP net income, non-GAAP net income per diluted common share and non-GAAP free cash flow. These non-GAAP measures are provided to enhance the reader’s understanding of the Company’s operating performance as they primarily exclude non-cash stock-based compensation, inventory and component liability charges, intangible asset amortization, litigation settlement and the impact from changes in income taxes, which the Company believes are not indicative of its core operating results. Management believes that the non-GAAP measures used in this stockholder letter provide investors with important perspectives into the Company’s ongoing business performance and management uses these non-GAAP measures to evaluate financial results and to establish operational goals. The presentation of these non-GAAP measures is not meant to be a substitute for results presented in accordance with GAAP, but rather should be evaluated in conjunction with those GAAP results. A reconciliation of the non-GAAP results to the most directly comparable GAAP results is provided in this stockholder letter. The non-GAAP financial measures used by the Company may be calculated differently from, and therefore may not be comparable to, similarly titled measures used by other companies.
Net Promoter®, NPS®, NPS Prism® and the NPS-related emoticons are registered trademarks of Bain & Company, Inc., Satmetrix Systems, Inc. and Fred Reichheld. Net Promoter Score℠ and Net Promoter System℠ are service marks of Bain & Company, Inc., Satmetrix Systems, Inc. and Fred Reichheld.
|
|
|
|
|
|
|
|
|
|
|
|
|
|
|
|
|
|
|
|
|
|
|
|
|
| Calix, Inc. |
| Condensed Consolidated Statements of Income |
| (Unaudited, in thousands, except per share data) |
|
|
|
|
|
|
|
|
|
|
|
|
|
|
|
Three Months Ended |
|
|
|
|
|
|
March 30, |
|
April 1, |
|
|
|
|
|
|
|
|
2024 |
|
2023 |
|
|
|
|
|
|
|
|
|
|
|
| Revenue |
|
$ |
226,310 |
|
|
$ |
250,008 |
|
|
|
|
|
| Cost of revenue |
|
103,733 |
|
|
121,957 |
|
|
|
|
|
|
Gross profit |
|
122,577 |
|
|
128,051 |
|
|
|
|
|
| Operating expenses: |
|
|
|
|
|
|
|
|
|
Sales and marketing |
|
53,897 |
|
|
51,865 |
|
|
|
|
|
|
Research and development |
|
44,422 |
|
|
43,173 |
|
|
|
|
|
|
General and administrative |
|
26,290 |
|
|
23,077 |
|
|
|
|
|
|
|
Total operating expenses |
|
124,609 |
|
|
118,115 |
|
|
|
|
|
| Operating income (loss) |
|
(2,032) |
|
|
9,936 |
|
|
|
|
|
| Interest income and other expense, net: |
|
|
|
|
|
|
|
|
|
Interest income, net |
|
2,635 |
|
|
1,640 |
|
|
|
|
|
|
Other expense, net |
|
(135) |
|
|
(167) |
|
|
|
|
|
|
|
Total interest income and other expense, net |
|
2,500 |
|
|
1,473 |
|
|
|
|
|
| Income before income taxes |
|
468 |
|
|
11,409 |
|
|
|
|
|
|
Income taxes |
|
365 |
|
|
1,811 |
|
|
|
|
|
| Net income |
|
$ |
103 |
|
|
$ |
9,598 |
|
|
|
|
|
| Net income per common share: |
|
|
|
|
|
|
|
|
|
|
Basic |
|
$ |
0.00 |
|
|
$ |
0.15 |
|
|
|
|
|
|
|
Diluted |
|
$ |
0.00 |
|
|
$ |
0.14 |
|
|
|
|
|
| Weighted average number of shares used to compute net income per common share: |
|
|
|
|
|
|
|
|
|
Basic |
|
65,338 |
|
|
65,558 |
|
|
|
|
|
|
|
Diluted |
|
68,119 |
|
|
69,857 |
|
|
|
|
|
|
|
|
|
|
|
|
|
|
|
|
|
|
|
|
|
|
|
|
|
|
|
|
|
|
|
| Calix, Inc. |
| Condensed Consolidated Balance Sheets |
| (Unaudited, in thousands) |
|
|
|
|
|
|
|
March 30, |
|
December 31, |
|
|
2024 |
|
2023 |
| ASSETS |
| Current assets: |
|
|
|
|
| Cash and cash equivalents |
|
$ |
88,418 |
|
|
$ |
63,409 |
|
| Marketable securities |
|
151,064 |
|
|
156,937 |
|
| Accounts receivable, net |
|
100,307 |
|
|
126,027 |
|
| Inventory |
|
119,782 |
|
|
132,985 |
|
| Prepaid expenses and other current assets |
|
119,214 |
|
|
118,598 |
|
| Total current assets |
|
578,785 |
|
|
597,956 |
|
| Property and equipment, net |
|
28,876 |
|
|
29,461 |
|
| Right-of-use operating leases |
|
9,065 |
|
|
9,262 |
|
| Deferred tax assets |
|
170,213 |
|
|
167,691 |
|
| Goodwill |
|
116,175 |
|
|
116,175 |
|
| Other assets |
|
19,674 |
|
|
21,320 |
|
|
|
$ |
922,788 |
|
|
$ |
941,865 |
|
LIABILITIES AND STOCKHOLDERS’ EQUITY |
| Current liabilities: |
|
|
|
|
| Accounts payable |
|
$ |
19,026 |
|
|
$ |
34,746 |
|
| Accrued liabilities |
|
87,605 |
|
|
116,227 |
|
| Deferred revenue |
|
39,448 |
|
|
36,669 |
|
| Total current liabilities |
|
146,079 |
|
|
187,642 |
|
| Long-term portion of deferred revenue |
|
24,434 |
|
|
24,864 |
|
| Operating leases |
|
6,925 |
|
|
7,421 |
|
| Other long-term liabilities |
|
2,657 |
|
|
2,956 |
|
| Total liabilities |
|
180,095 |
|
|
222,883 |
|
| Stockholders’ equity: |
|
|
|
|
| Common stock |
|
1,638 |
|
|
1,627 |
|
| Additional paid-in capital |
|
1,102,314 |
|
|
1,078,393 |
|
| Accumulated other comprehensive loss |
|
(983) |
|
|
(659) |
|
| Accumulated deficit |
|
(360,276) |
|
|
(360,379) |
|
| Total stockholders’ equity |
|
742,693 |
|
|
718,982 |
|
|
|
$ |
922,788 |
|
|
$ |
941,865 |
|
|
|
|
|
|
|
|
|
|
|
|
|
|
|
|
| Calix, Inc. |
| Condensed Consolidated Statements of Cash Flows |
| (Unaudited, in thousands) |
|
|
|
|
|
|
|
Three Months Ended |
|
|
March 30, |
|
April 1, |
|
|
2024 |
|
2023 |
| Operating activities: |
|
|
|
|
| Net income |
|
$ |
103 |
|
|
$ |
9,598 |
|
| Adjustments to reconcile net income to net cash provided by operating activities: |
|
|
|
|
| Stock-based compensation |
|
16,856 |
|
|
16,220 |
|
| Depreciation and amortization |
|
4,867 |
|
|
3,723 |
|
| Deferred income taxes |
|
(1,406) |
|
|
(681) |
|
| Net accretion of available-for-sale securities |
|
(2,448) |
|
|
(708) |
|
| Changes in operating assets and liabilities: |
|
|
|
|
| Accounts receivable, net |
|
25,719 |
|
|
1,595 |
|
| Inventory |
|
13,203 |
|
|
(7,353) |
|
| Prepaid expenses and other assets |
|
272 |
|
|
(7,083) |
|
| Accounts payable |
|
(15,973) |
|
|
(5,899) |
|
| Accrued liabilities |
|
(28,056) |
|
|
(8,688) |
|
| Deferred revenue |
|
2,348 |
|
|
11,005 |
|
| Other long-term liabilities |
|
(794) |
|
|
(3,617) |
|
| Net cash provided by operating activities |
|
14,691 |
|
|
8,112 |
|
Investing activities: |
|
|
|
|
| Purchases of property and equipment |
|
(3,709) |
|
|
(4,618) |
|
| Purchases of marketable securities |
|
(35,575) |
|
|
(54,908) |
|
| Maturities of marketable securities |
|
42,565 |
|
|
56,248 |
|
| Net cash provided by (used in) investing activities |
|
3,281 |
|
|
(3,278) |
|
| Financing activities: |
|
|
|
|
| Proceeds from common stock issuances related to employee benefit plans |
|
10,814 |
|
|
12,471 |
|
| Repurchases of common stock |
|
(3,738) |
|
|
(1,066) |
|
| Payments related to financing arrangements |
|
— |
|
|
(1,183) |
|
| Net cash provided by financing activities |
|
7,076 |
|
|
10,222 |
|
| Effect of exchange rate changes on cash and cash equivalents |
|
(39) |
|
|
57 |
|
| Net increase in cash and cash equivalents |
|
25,009 |
|
|
15,113 |
|
| Cash and cash equivalents at beginning of period |
|
63,409 |
|
|
79,073 |
|
| Cash and cash equivalents at end of period |
|
$ |
88,418 |
|
|
$ |
94,186 |
|
|
|
|
|
|
|
|
|
|
|
|
|
|
|
|
|
|
|
|
|
|
|
|
|
|
|
|
|
|
|
|
|
|
| Calix, Inc. |
| Reconciliation of GAAP to Non-GAAP Gross Margin |
| (Unaudited) |
|
|
Three Months Ended |
|
|
March 30,
2024 |
|
December 31,
2023 |
|
September 30,
2023 |
|
July 1,
2023 |
|
April 1,
2023 |
| GAAP gross margin |
|
54.2 |
% |
|
42.8 |
% |
|
53.3 |
% |
|
52.3 |
% |
|
51.2 |
% |
| Adjustments to GAAP amount: |
|
|
|
|
|
|
|
|
|
|
| Stock-based compensation |
|
0.3 |
|
|
0.2 |
|
|
0.3 |
|
|
0.3 |
|
|
0.3 |
|
| Intangible asset amortization |
|
0.4 |
|
|
0.3 |
|
|
0.2 |
|
|
0.2 |
|
|
0.3 |
|
| Inventory and component liability charges |
|
— |
|
|
10.8 |
|
|
— |
|
|
— |
|
|
— |
|
| Non-GAAP gross margin |
|
54.9 |
% |
|
54.1 |
% |
|
53.8 |
% |
|
52.8 |
% |
|
51.8 |
% |
|
|
|
|
|
|
|
|
|
|
|
|
|
|
|
|
|
|
|
|
|
|
|
|
|
|
|
|
|
|
|
|
|
| Calix, Inc. |
| Reconciliation of GAAP to Non-GAAP Operating Expenses |
| (Unaudited, in thousands) |
|
|
Three Months Ended |
|
|
March 30, |
|
December 31, |
|
Sept. 30, |
|
July 1, |
|
April 1, |
|
|
2024 |
|
2023 |
|
2023 |
|
2023 |
|
2023 |
| GAAP operating expenses: |
|
|
|
|
|
|
|
|
|
|
| Sales and marketing |
|
$ |
53,897 |
|
|
$ |
55,747 |
|
|
$ |
52,356 |
|
|
$ |
54,596 |
|
|
$ |
51,865 |
|
| Research and development |
|
44,422 |
|
|
42,295 |
|
|
46,963 |
|
|
45,341 |
|
|
43,173 |
|
| General and administrative |
|
26,290 |
|
|
27,295 |
|
|
25,301 |
|
|
24,722 |
|
|
23,077 |
|
|
|
124,609 |
|
|
125,337 |
|
|
124,620 |
|
|
124,659 |
|
|
118,115 |
|
| Stock-based compensation: |
|
|
|
|
|
|
|
|
|
|
| Sales and marketing |
|
(4,850) |
|
|
(3,075) |
|
|
(4,333) |
|
|
(5,053) |
|
|
(4,432) |
|
| Research and development |
|
(4,515) |
|
|
(3,583) |
|
|
(4,245) |
|
|
(4,860) |
|
|
(4,312) |
|
| General and administrative |
|
(6,855) |
|
|
(5,424) |
|
|
(6,714) |
|
|
(7,151) |
|
|
(6,676) |
|
|
|
(16,220) |
|
|
(12,082) |
|
|
(15,292) |
|
|
(17,064) |
|
|
(15,420) |
|
|
|
|
|
|
|
|
|
|
|
|
| Litigation settlement – General and administrative |
|
— |
|
|
(3,250) |
|
|
— |
|
|
— |
|
|
— |
|
|
|
|
|
|
|
|
|
|
|
|
| Non-GAAP operating expenses: |
|
|
|
|
|
|
|
|
|
|
| Sales and marketing |
|
49,047 |
|
|
52,672 |
|
|
48,023 |
|
|
49,543 |
|
|
47,433 |
|
| Research and development |
|
39,907 |
|
|
38,712 |
|
|
42,718 |
|
|
40,481 |
|
|
38,861 |
|
| General and administrative |
|
19,435 |
|
|
18,621 |
|
|
18,587 |
|
|
17,571 |
|
|
16,401 |
|
|
|
$ |
108,389 |
|
|
$ |
110,005 |
|
|
$ |
109,328 |
|
|
$ |
107,595 |
|
|
$ |
102,695 |
|
|
|
|
|
|
|
|
|
|
|
|
|
|
|
|
|
|
|
|
|
|
|
|
|
|
|
|
|
|
|
|
|
|
|
|
|
| Calix, Inc. |
| Reconciliation of GAAP Net Income (Loss) to Non-GAAP Net Income |
| (Unaudited, in thousands) |
|
|
Three Months Ended |
|
|
|
March 30, |
|
December 31, |
|
September 30, |
|
July 1, |
|
April 1, |
|
|
|
2024 |
|
2023 |
|
2023 |
|
2023 |
|
2023 |
|
| GAAP net income (loss) |
|
$ |
103 |
|
|
$ |
(6,599) |
|
|
$ |
16,953 |
|
|
$ |
9,373 |
|
|
$ |
9,598 |
|
|
| Adjustments to GAAP amount: |
|
|
|
|
|
|
|
|
|
|
|
| Stock-based compensation |
|
16,856 |
|
|
12,681 |
|
|
16,026 |
|
|
17,844 |
|
|
16,220 |
|
|
| Intangible asset amortization |
|
956 |
|
|
757 |
|
|
658 |
|
|
658 |
|
|
658 |
|
|
| Inventory and component liability charges |
|
— |
|
|
28,675 |
|
|
— |
|
|
— |
|
|
— |
|
|
| Litigation settlement |
|
— |
|
|
3,250 |
|
|
— |
|
|
— |
|
|
— |
|
|
Income tax effect of non-GAAP adjustments |
|
(3,474) |
|
|
(9,329) |
|
|
(2,641) |
|
|
(2,672) |
|
|
(4,978) |
|
|
| Non-GAAP net income |
|
$ |
14,441 |
|
|
$ |
29,435 |
|
|
$ |
30,996 |
|
|
$ |
25,203 |
|
|
$ |
21,498 |
|
|
|
|
|
|
|
|
|
|
|
|
|
|
|
|
|
|
|
|
|
|
|
|
|
|
|
|
|
|
|
|
|
|
|
|
|
|
|
|
|
|
|
|
|
|
|
| Calix, Inc. |
| Non-GAAP Free Cash Flow Reconciliation |
| (Unaudited, in thousands) |
|
|
Three Months Ended |
|
|
March 30, |
|
December 31, |
|
September 30, |
|
July 1, |
|
April 1, |
|
|
2024 |
|
2023 |
|
2023 |
|
2023 |
|
2023 |
| Net cash provided by operating activities |
|
$ |
14,691 |
|
|
$ |
14,924 |
|
|
$ |
15,751 |
|
|
$ |
17,464 |
|
|
$ |
8,112 |
|
| Purchases of property and equipment |
|
(3,709) |
|
|
(3,972) |
|
|
(3,776) |
|
|
(5,489) |
|
|
(4,618) |
|
| Non-GAAP free cash flow |
|
$ |
10,982 |
|
|
$ |
10,952 |
|
|
$ |
11,975 |
|
|
$ |
11,975 |
|
|
$ |
3,494 |
|
|
|
|
|
|
|
|
|
|
| Calix, Inc. |
Reconciliation of GAAP to Non-GAAP Net Income Per Diluted Common Share 1 |
| (Unaudited) |
|
|
Three Months Ended
March 30, 2024 |
| GAAP net income per diluted common share |
|
$ |
0.00 |
|
| Adjustments to GAAP amount: |
|
|
| Stock-based compensation |
|
0.25 |
|
| Intangible asset amortization |
|
0.01 |
|
Income tax effect of non-GAAP adjustments |
|
(0.05) |
|
| Non-GAAP net income per diluted common share |
|
$ |
0.21 |
|
|
|
|
|
|
|
|
|
1 |
Based on 68.1 million weighted-average diluted common shares outstanding. |
|
|
|
|
|
|
|
|
|
|
|
|
|
|
|
|
|
|
|
|
|
|
|
|
|
|
|
|
|
|
|
|
|
|
|
|
|
|
|
|
|
|
|
|
|
|
|
|
|
|
|
|
|
|
|
|
|
|
|
|
|
| Calix, Inc. |
| Reconciliation of GAAP to Non-GAAP Guidance |
| (Unaudited, dollars in thousands, except per share data) |
| Three Months Ending June 29, 2024 |
|
|
GAAP |
|
Stock-Based Compensation |
|
Intangible
Asset Amortization |
|
Non-GAAP |
| Gross margin |
|
53.55% - 55.55% |
|
0.3% |
|
0.4% |
|
54.25% - 56.25% |
| Operating expenses |
|
$122,000 - $125,000 |
|
$(16,000) |
|
$ — |
|
$106,000 - $109,000 |
Net income (loss) per diluted common share 1 |
|
$(0.19) - $(0.13) |
|
$0.21 2 |
|
$0.01 2 |
|
$0.03 - $0.09 |
|
|
|
|
|
|
|
|
1 |
Based on 68.5 million weighted-average diluted common shares outstanding. |
|
|
2 |
Net of income taxes. |
|
|
|
|
|
|
|
|
|
|
|
|
|
|
|
|
|
|
|
|
|
|
|
|
|
|
|
|
|
|
|
|
|
|