Q3 2022 Letter to Shareholders November 3, 2022 | yelp-ir.com
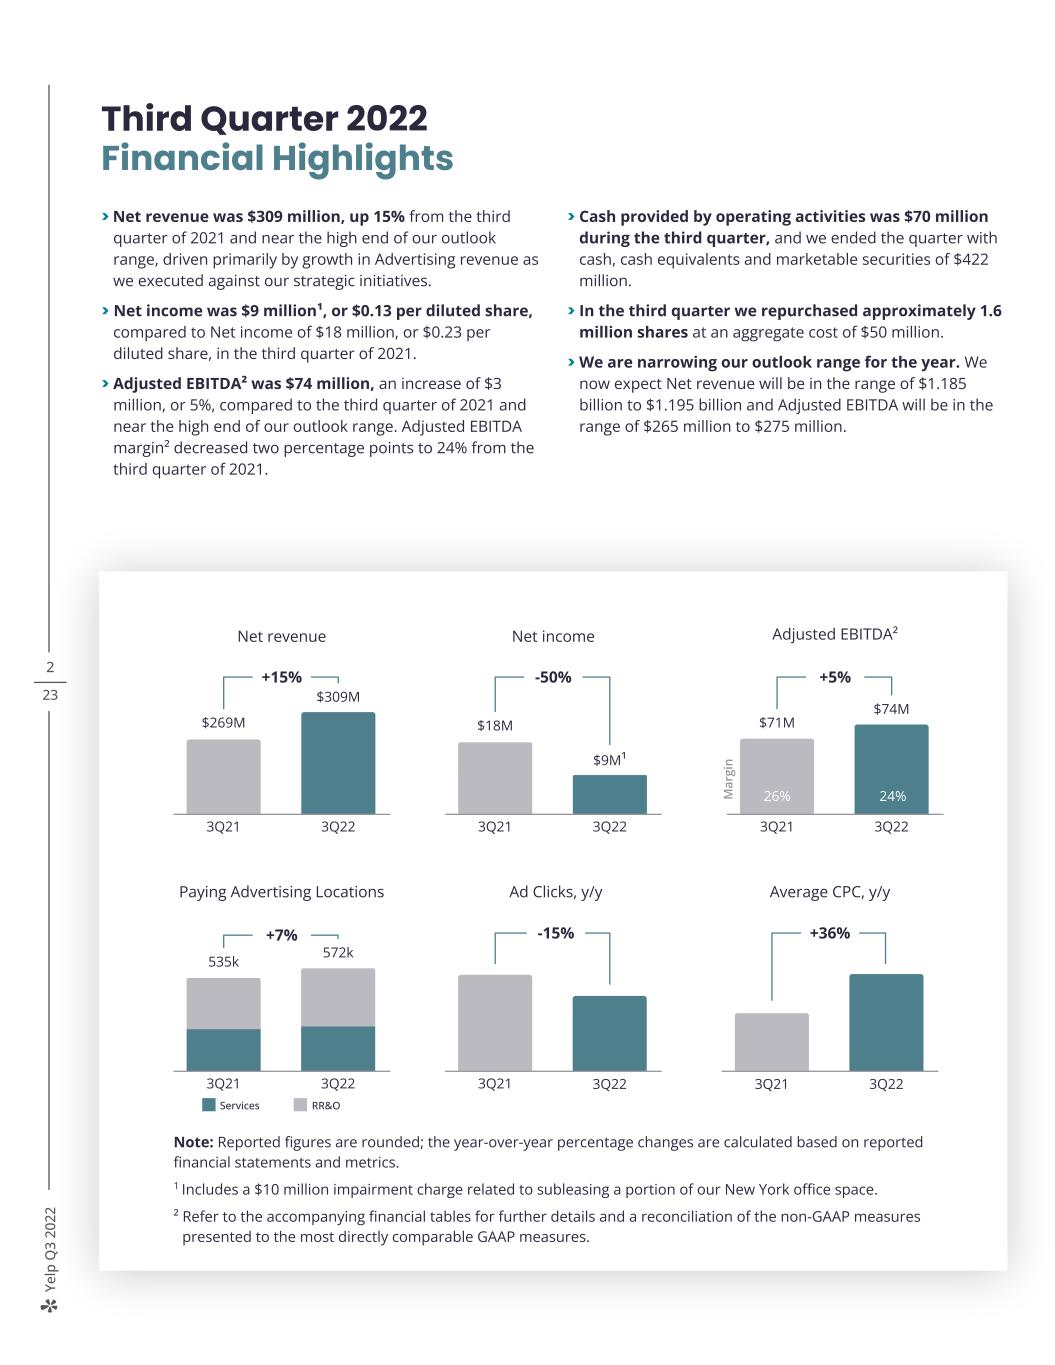
Ye lp Q 3 20 22 2 23 Note: Reported figures are rounded; the year-over-year percentage changes are calculated based on reported financial statements and metrics. 1 Includes a $10 million impairment charge related to subleasing a portion of our New York office space. ² Refer to the accompanying financial tables for further details and a reconciliation of the non-GAAP measures presented to the most directly comparable GAAP measures. Third Quarter 2022 Financial Highlights > Net revenue was $309 million, up 15% from the third quarter of 2021 and near the high end of our outlook range, driven primarily by growth in Advertising revenue as we executed against our strategic initiatives. > Net income was $9 million¹, or $0.13 per diluted share, compared to Net income of $18 million, or $0.23 per diluted share, in the third quarter of 2021. > Adjusted EBITDA² was $74 million, an increase of $3 million, or 5%, compared to the third quarter of 2021 and near the high end of our outlook range. Adjusted EBITDA margin² decreased two percentage points to 24% from the third quarter of 2021. > Cash provided by operating activities was $70 million during the third quarter, and we ended the quarter with cash, cash equivalents and marketable securities of $422 million. > In the third quarter we repurchased approximately 1.6 million shares at an aggregate cost of $50 million. > We are narrowing our outlook range for the year. We now expect Net revenue will be in the range of $1.185 billion to $1.195 billion and Adjusted EBITDA will be in the range of $265 million to $275 million. 19% 17% Net revenue +15% $269M $309M 3Q21 3Q22 Ad Clicks, y/y -15% 3Q21 3Q22 Average CPC, y/y +36% 3Q21 3Q22 Paying Advertising Locations +7% 535k 572k 3Q21 3Q22 Services RR&O Adjusted EBITDA² +5% $71M $74M 3Q21 3Q22 M ar gi n 26% 24% Net income -50% $18M $9M¹ 3Q21 3Q22
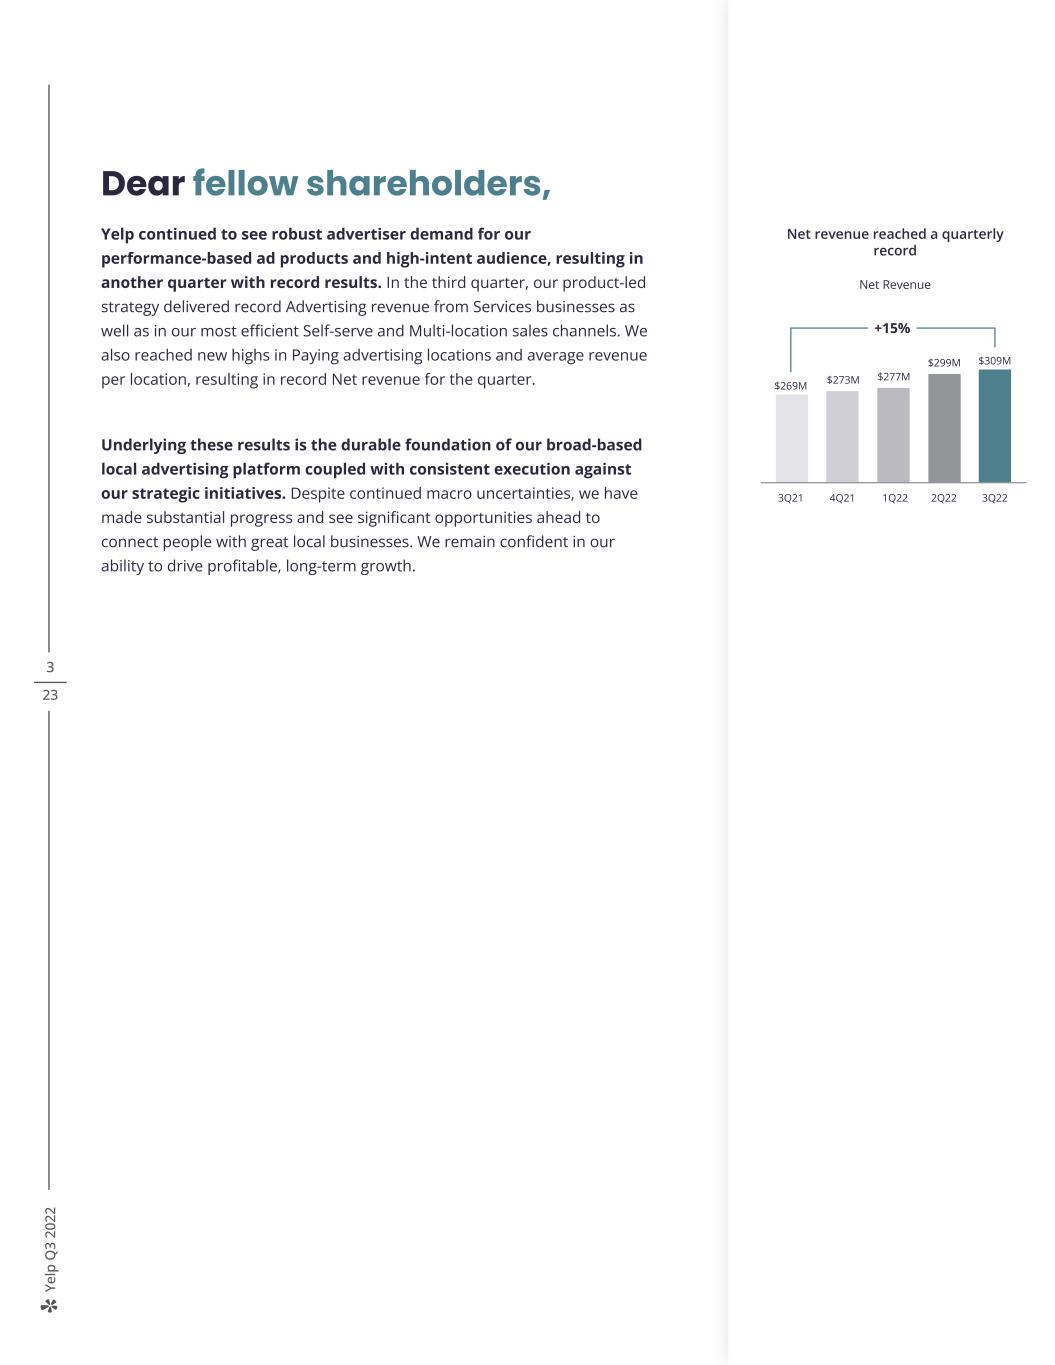
Ye lp Q 3 20 22 3 23 Dear fellow shareholders, Yelp continued to see robust advertiser demand for our performance-based ad products and high-intent audience, resulting in another quarter with record results. In the third quarter, our product-led strategy delivered record Advertising revenue from Services businesses as well as in our most efficient Self-serve and Multi-location sales channels. We also reached new highs in Paying advertising locations and average revenue per location, resulting in record Net revenue for the quarter. Underlying these results is the durable foundation of our broad-based local advertising platform coupled with consistent execution against our strategic initiatives. Despite continued macro uncertainties, we have made substantial progress and see significant opportunities ahead to connect people with great local businesses. We remain confident in our ability to drive profitable, long-term growth. +15% $269M 3Q21 4Q21 1Q22 2Q22 3Q22 $277M $299M $309M $273M Net revenue reached a quarterly record Net Revenue
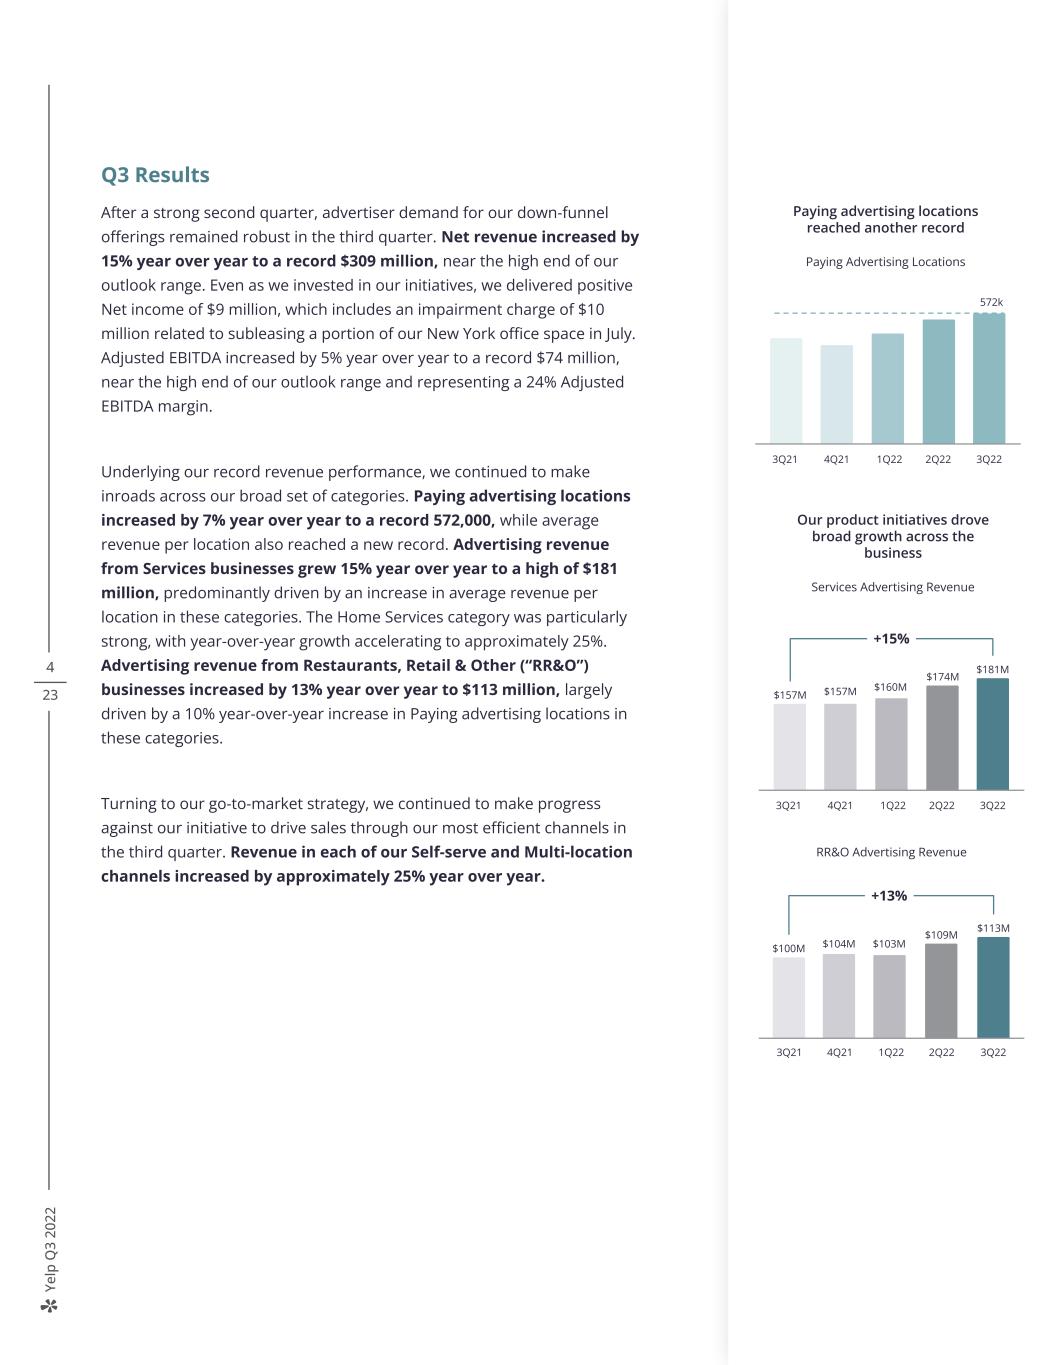
Ye lp Q 3 20 22 4 23 Q3 Results After a strong second quarter, advertiser demand for our down-funnel offerings remained robust in the third quarter. Net revenue increased by 15% year over year to a record $309 million, near the high end of our outlook range. Even as we invested in our initiatives, we delivered positive Net income of $9 million, which includes an impairment charge of $10 million related to subleasing a portion of our New York office space in July. Adjusted EBITDA increased by 5% year over year to a record $74 million, near the high end of our outlook range and representing a 24% Adjusted EBITDA margin. Underlying our record revenue performance, we continued to make inroads across our broad set of categories. Paying advertising locations increased by 7% year over year to a record 572,000, while average revenue per location also reached a new record. Advertising revenue from Services businesses grew 15% year over year to a high of $181 million, predominantly driven by an increase in average revenue per location in these categories. The Home Services category was particularly strong, with year-over-year growth accelerating to approximately 25%. Advertising revenue from Restaurants, Retail & Other (“RR&O”) businesses increased by 13% year over year to $113 million, largely driven by a 10% year-over-year increase in Paying advertising locations in these categories. Turning to our go-to-market strategy, we continued to make progress against our initiative to drive sales through our most efficient channels in the third quarter. Revenue in each of our Self-serve and Multi-location channels increased by approximately 25% year over year. Our product initiatives drove broad growth across the business Services Advertising Revenue +15% $157M 3Q21 4Q21 1Q22 2Q22 3Q22 $160M $174M $181M $157M 2Q221Q224Q213Q21 +13% $100M 3Q22 $113M $104M $103M $109M RR&O Advertising Revenue Paying advertising locations reached another record Paying Advertising Locations 3Q21 4Q21 1Q22 2Q22 3Q22 572k
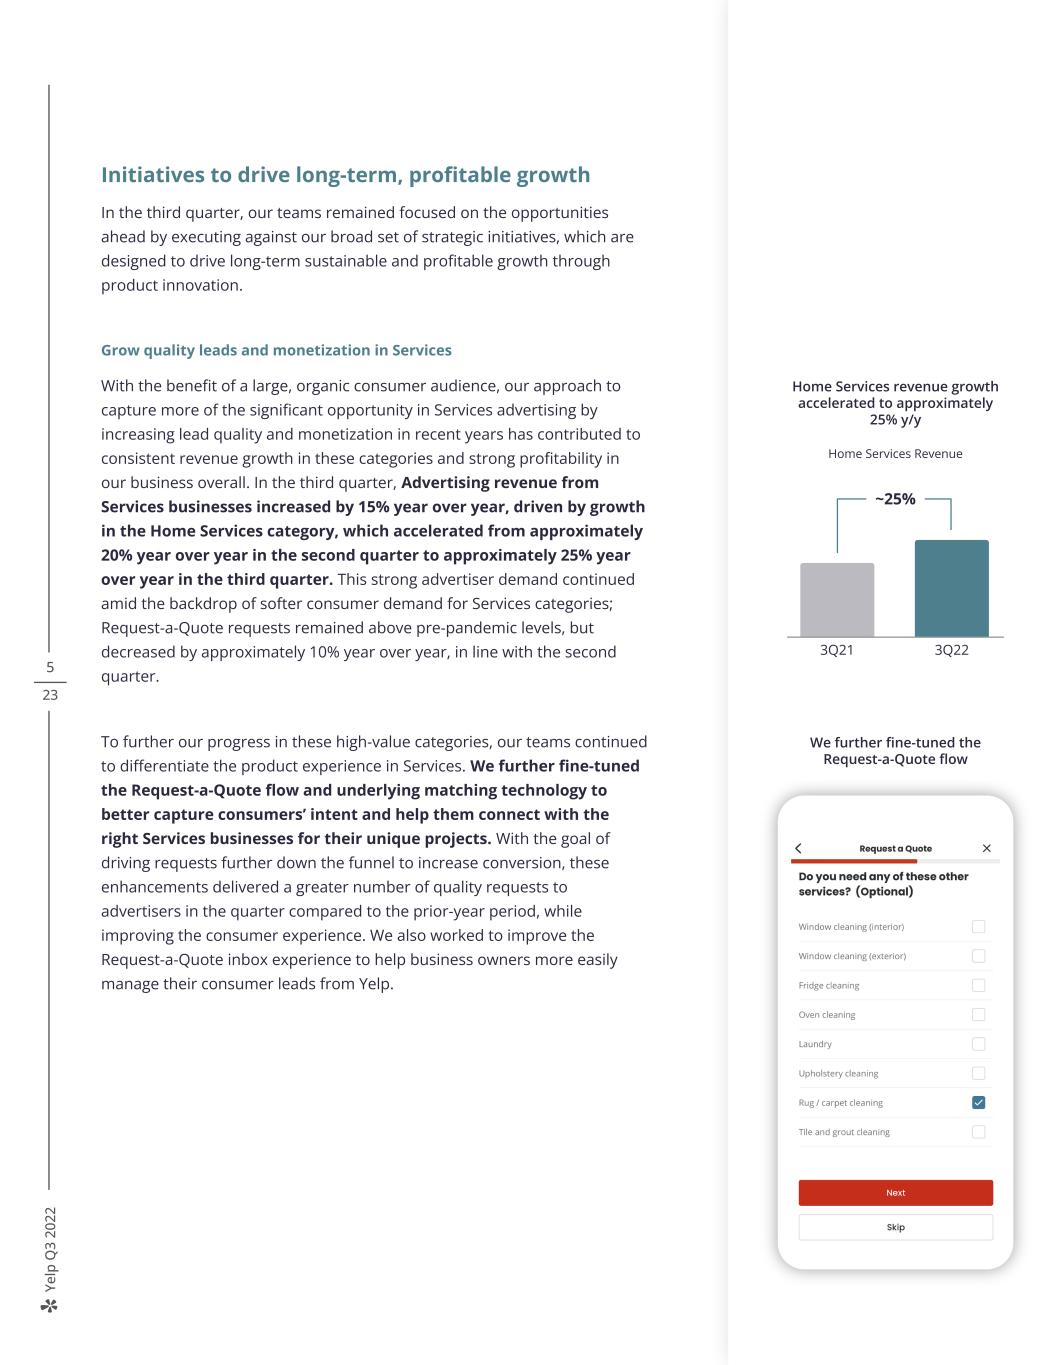
Ye lp Q 3 20 22 5 23 Initiatives to drive long-term, profitable growth In the third quarter, our teams remained focused on the opportunities ahead by executing against our broad set of strategic initiatives, which are designed to drive long-term sustainable and profitable growth through product innovation. Grow quality leads and monetization in Services With the benefit of a large, organic consumer audience, our approach to capture more of the significant opportunity in Services advertising by increasing lead quality and monetization in recent years has contributed to consistent revenue growth in these categories and strong profitability in our business overall. In the third quarter, Advertising revenue from Services businesses increased by 15% year over year, driven by growth in the Home Services category, which accelerated from approximately 20% year over year in the second quarter to approximately 25% year over year in the third quarter. This strong advertiser demand continued amid the backdrop of softer consumer demand for Services categories; Request-a-Quote requests remained above pre-pandemic levels, but decreased by approximately 10% year over year, in line with the second quarter. To further our progress in these high-value categories, our teams continued to differentiate the product experience in Services. We further fine-tuned the Request-a-Quote flow and underlying matching technology to better capture consumers’ intent and help them connect with the right Services businesses for their unique projects. With the goal of driving requests further down the funnel to increase conversion, these enhancements delivered a greater number of quality requests to advertisers in the quarter compared to the prior-year period, while improving the consumer experience. We also worked to improve the Request-a-Quote inbox experience to help business owners more easily manage their consumer leads from Yelp. We further fine-tuned the Request-a-Quote flow ~25% 3Q21 3Q22 Home Services revenue growth accelerated to approximately 25% y/y Home Services Revenue
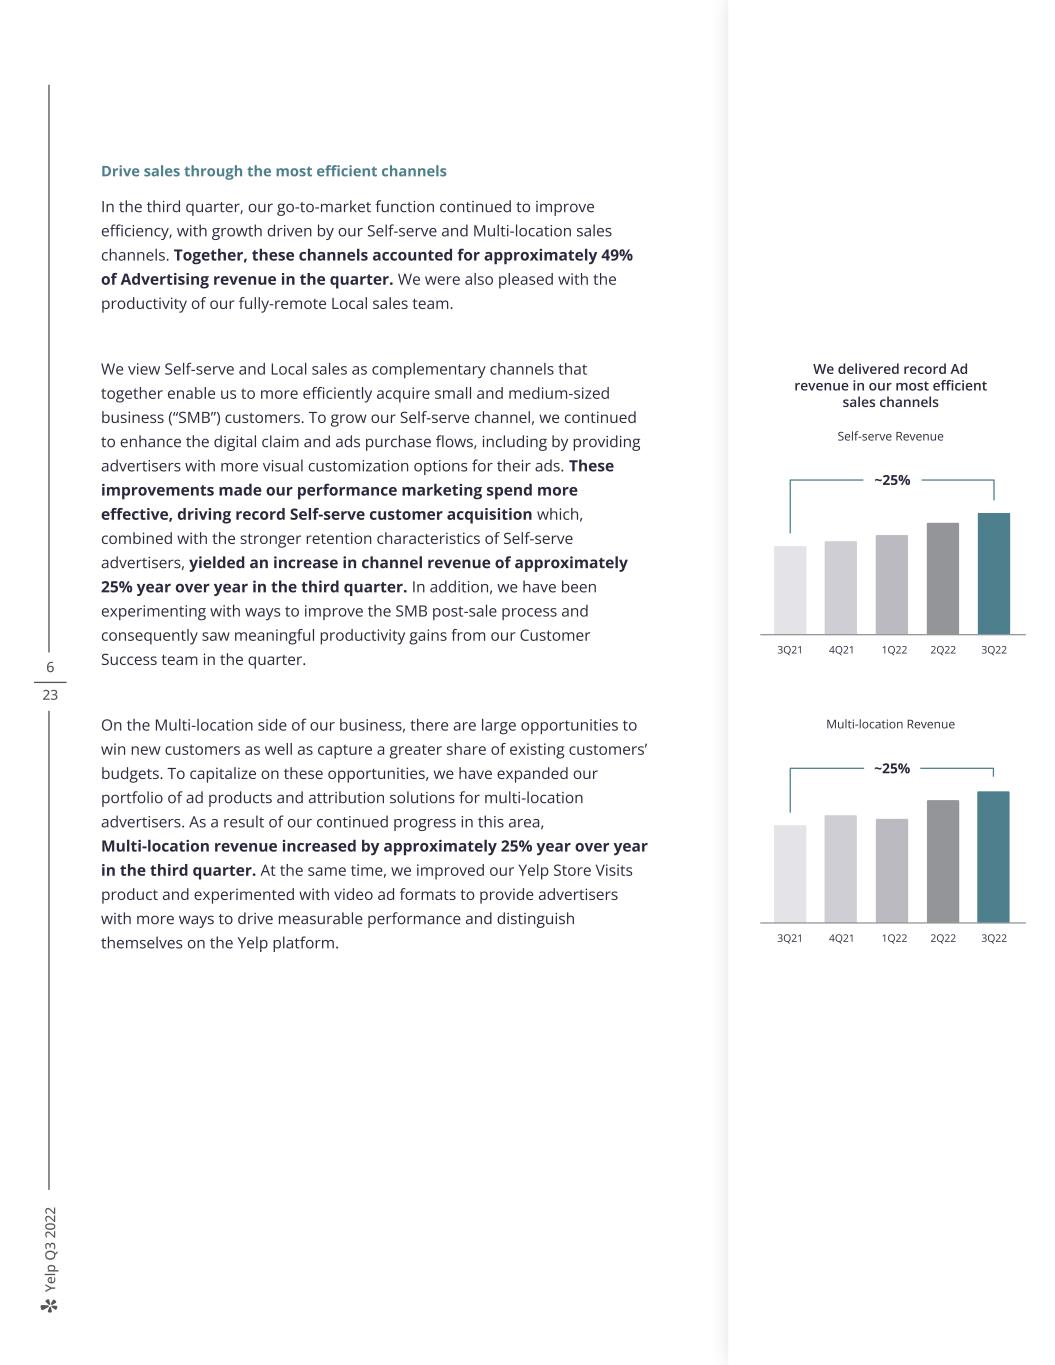
Ye lp Q 3 20 22 6 23 Drive sales through the most efficient channels In the third quarter, our go-to-market function continued to improve efficiency, with growth driven by our Self-serve and Multi-location sales channels. Together, these channels accounted for approximately 49% of Advertising revenue in the quarter. We were also pleased with the productivity of our fully-remote Local sales team. We view Self-serve and Local sales as complementary channels that together enable us to more efficiently acquire small and medium-sized business (“SMB”) customers. To grow our Self-serve channel, we continued to enhance the digital claim and ads purchase flows, including by providing advertisers with more visual customization options for their ads. These improvements made our performance marketing spend more effective, driving record Self-serve customer acquisition which, combined with the stronger retention characteristics of Self-serve advertisers, yielded an increase in channel revenue of approximately 25% year over year in the third quarter. In addition, we have been experimenting with ways to improve the SMB post-sale process and consequently saw meaningful productivity gains from our Customer Success team in the quarter. On the Multi-location side of our business, there are large opportunities to win new customers as well as capture a greater share of existing customers’ budgets. To capitalize on these opportunities, we have expanded our portfolio of ad products and attribution solutions for multi-location advertisers. As a result of our continued progress in this area, Multi-location revenue increased by approximately 25% year over year in the third quarter. At the same time, we improved our Yelp Store Visits product and experimented with video ad formats to provide advertisers with more ways to drive measurable performance and distinguish themselves on the Yelp platform. We delivered record Ad revenue in our most efficient sales channels Self-serve Revenue ~25% 3Q21 4Q21 1Q22 2Q22 3Q22 Multi-location Revenue ~25% 3Q21 4Q21 1Q22 2Q22 3Q22
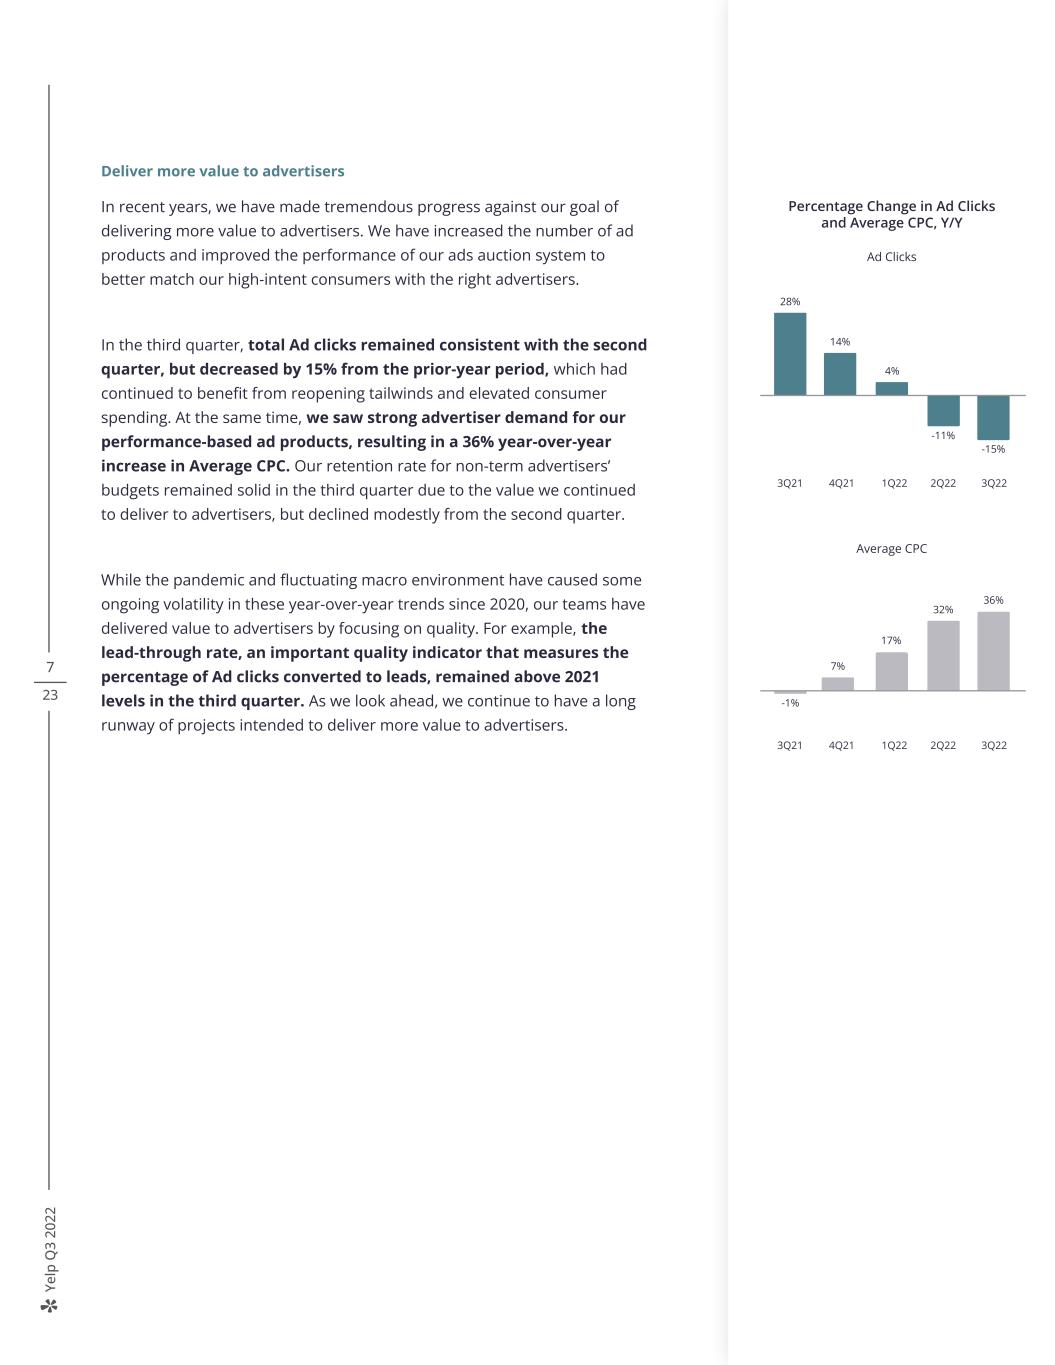
Ye lp Q 3 20 22 7 23 Deliver more value to advertisers In recent years, we have made tremendous progress against our goal of delivering more value to advertisers. We have increased the number of ad products and improved the performance of our ads auction system to better match our high-intent consumers with the right advertisers. In the third quarter, total Ad clicks remained consistent with the second quarter, but decreased by 15% from the prior-year period, which had continued to benefit from reopening tailwinds and elevated consumer spending. At the same time, we saw strong advertiser demand for our performance-based ad products, resulting in a 36% year-over-year increase in Average CPC. Our retention rate for non-term advertisers’ budgets remained solid in the third quarter due to the value we continued to deliver to advertisers, but declined modestly from the second quarter. While the pandemic and fluctuating macro environment have caused some ongoing volatility in these year-over-year trends since 2020, our teams have delivered value to advertisers by focusing on quality. For example, the lead-through rate, an important quality indicator that measures the percentage of Ad clicks converted to leads, remained above 2021 levels in the third quarter. As we look ahead, we continue to have a long runway of projects intended to deliver more value to advertisers. Percentage Change in Ad Clicks and Average CPC, Y/Y Ad Clicks 28% 3Q21 4Q21 1Q22 2Q22 3Q22 -15% 14% 4% -11% Average CPC -1% 3Q21 4Q21 1Q22 2Q22 3Q22 32% 7% 36% 17%
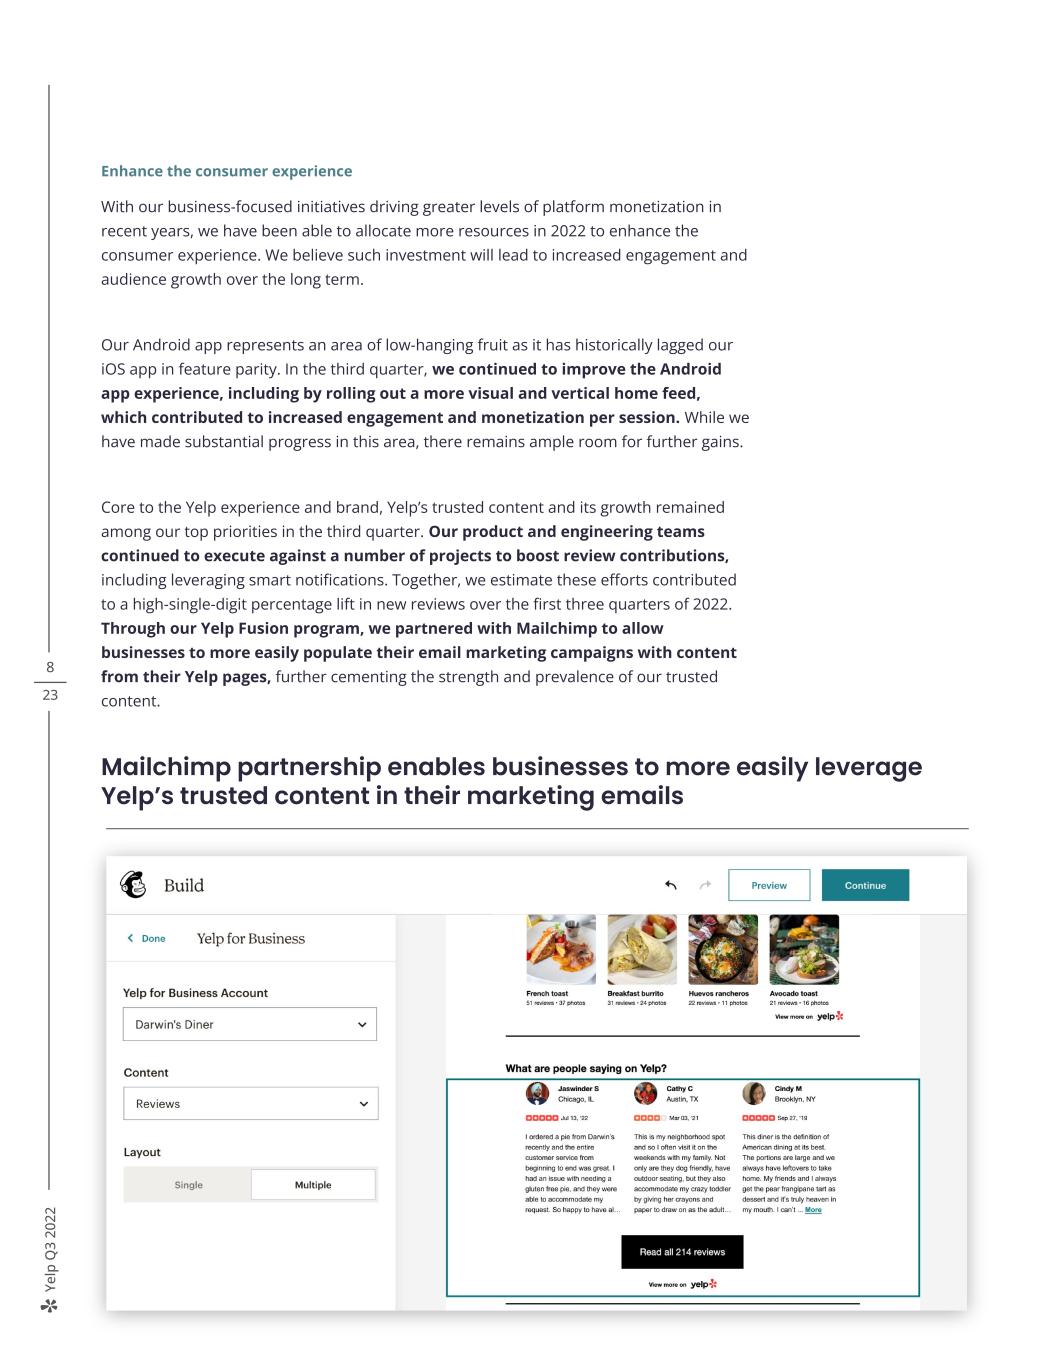
Ye lp Q 3 20 22 Enhance the consumer experience With our business-focused initiatives driving greater levels of platform monetization in recent years, we have been able to allocate more resources in 2022 to enhance the consumer experience. We believe such investment will lead to increased engagement and audience growth over the long term. Our Android app represents an area of low-hanging fruit as it has historically lagged our iOS app in feature parity. In the third quarter, we continued to improve the Android app experience, including by rolling out a more visual and vertical home feed, which contributed to increased engagement and monetization per session. While we have made substantial progress in this area, there remains ample room for further gains. Core to the Yelp experience and brand, Yelp’s trusted content and its growth remained among our top priorities in the third quarter. Our product and engineering teams continued to execute against a number of projects to boost review contributions, including leveraging smart notifications. Together, we estimate these efforts contributed to a high-single-digit percentage lift in new reviews over the first three quarters of 2022. Through our Yelp Fusion program, we partnered with Mailchimp to allow businesses to more easily populate their email marketing campaigns with content from their Yelp pages, further cementing the strength and prevalence of our trusted content. 8 23 Mailchimp partnership enables businesses to more easily leverage Yelp’s trusted content in their marketing emails
Ye lp Q 3 20 22 9 23 Investing for growth In 2022, we have focused our strategic investments in areas we believe will drive profitable growth over the long term, such as product and engineering, marketing, and Multi-location sales. As a result of these investments, we drove a number of record highs across the business in the third quarter, including Net revenue, Services advertising revenue, Multi-location and Self-serve channel revenue, Paying advertising locations and Adjusted EBITDA. As we work through our plans for next year, we continue to have a strong portfolio of opportunities to drive long-term, profitable growth. In addition to leverage from our growth strategy, our shift to operating as a remote-first company has enabled us to further invest in our initiatives by decreasing our workplace operating costs, while also providing us with access to a wider and more diverse talent pool. Additionally, we are evolving our approach to compensation, which we believe will reduce stock-based compensation as a percentage of revenue over time.
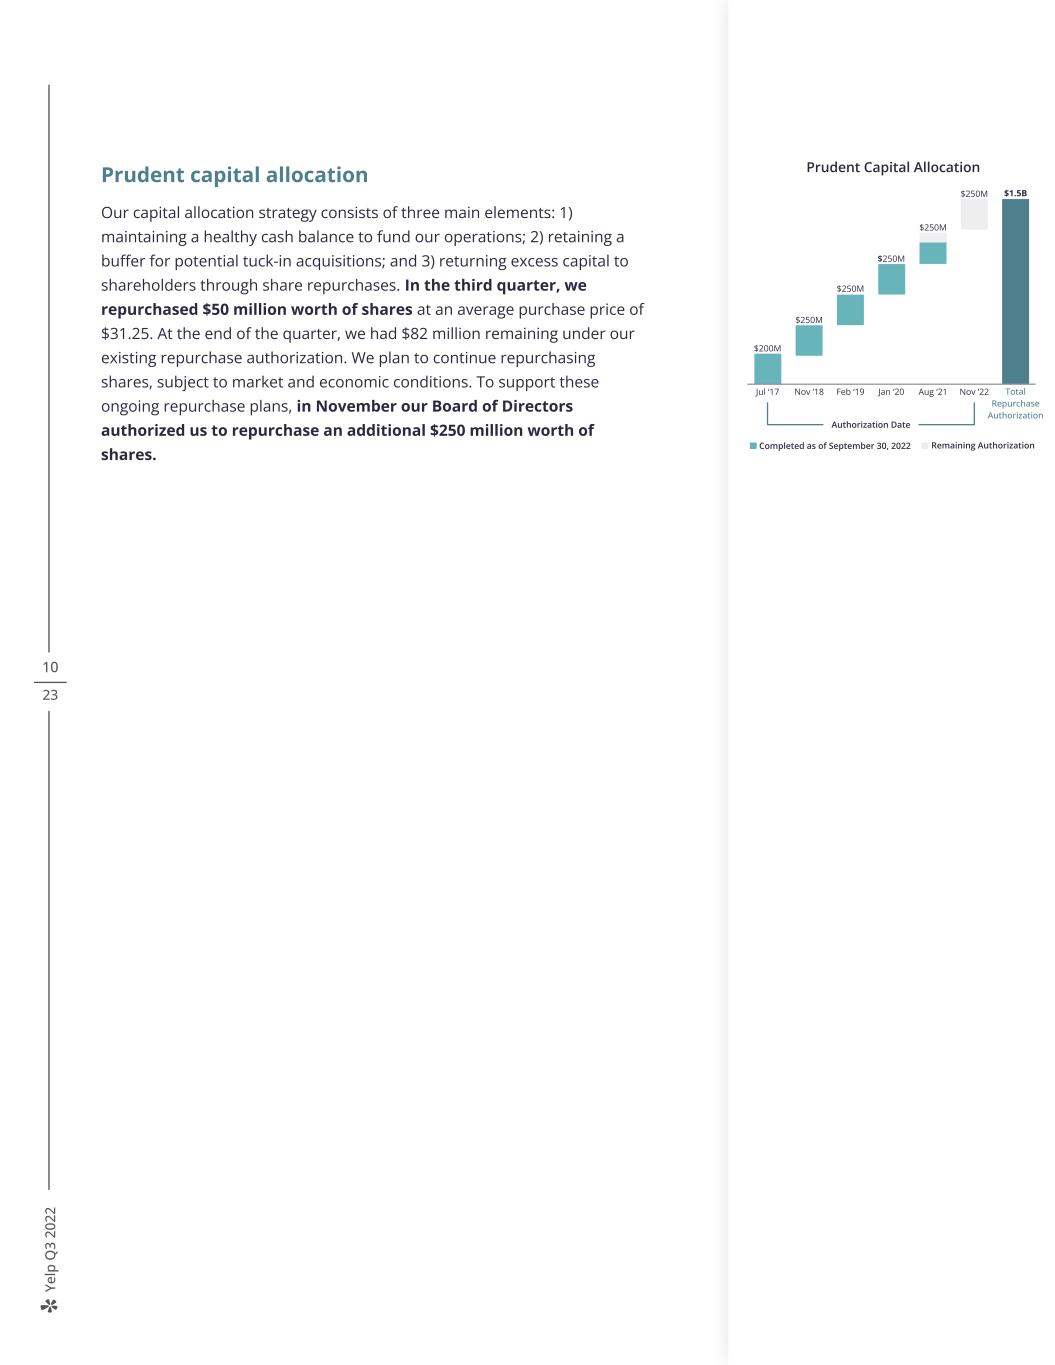
Ye lp Q 3 20 22 Total Repurchase Authorization Nov ‘22 10 23 Prudent capital allocation Our capital allocation strategy consists of three main elements: 1) maintaining a healthy cash balance to fund our operations; 2) retaining a buffer for potential tuck-in acquisitions; and 3) returning excess capital to shareholders through share repurchases. In the third quarter, we repurchased $50 million worth of shares at an average purchase price of $31.25. At the end of the quarter, we had $82 million remaining under our existing repurchase authorization. We plan to continue repurchasing shares, subject to market and economic conditions. To support these ongoing repurchase plans, in November our Board of Directors authorized us to repurchase an additional $250 million worth of shares. Authorization Date Prudent Capital Allocation $1.5B Completed as of September 30, 2022 Remaining Authorization $200M Jul ‘17 Nov ‘18 Feb ‘19 Jan ‘20 $250M $250M $250M $250M Aug ‘21 $250M
Ye lp Q 3 20 22 11 23 In summary, Our third quarter results underscore the strength of our strategy and the consistent execution of our teams, providing us with continued confidence in our ability to drive long-term, profitable growth. At the same time, in a volatile macro environment, we believe our mission of connecting people with great local businesses is even more relevant. As we look to the fourth quarter and the year ahead, our portfolio of initiatives remains robust, and we remain committed to driving long-term shareholder value. Sincerely, Jeremy Stoppelman David Schwarzbach
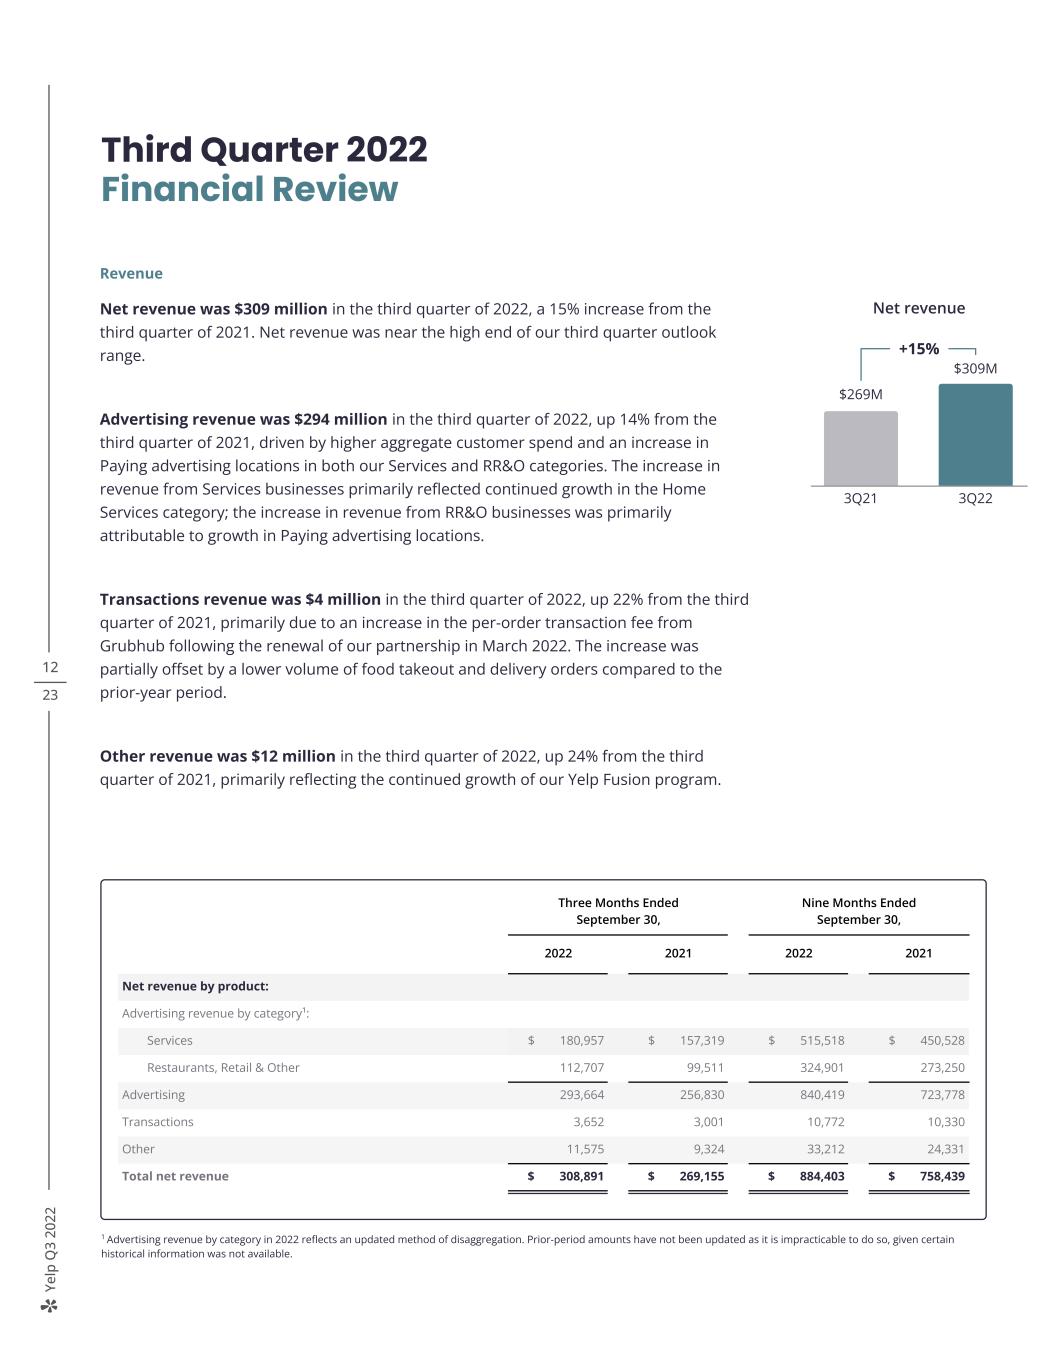
Ye lp Q 3 20 22 12 23 Revenue Net revenue was $309 million in the third quarter of 2022, a 15% increase from the third quarter of 2021. Net revenue was near the high end of our third quarter outlook range. Advertising revenue was $294 million in the third quarter of 2022, up 14% from the third quarter of 2021, driven by higher aggregate customer spend and an increase in Paying advertising locations in both our Services and RR&O categories. The increase in revenue from Services businesses primarily reflected continued growth in the Home Services category; the increase in revenue from RR&O businesses was primarily attributable to growth in Paying advertising locations. Transactions revenue was $4 million in the third quarter of 2022, up 22% from the third quarter of 2021, primarily due to an increase in the per-order transaction fee from Grubhub following the renewal of our partnership in March 2022. The increase was partially offset by a lower volume of food takeout and delivery orders compared to the prior-year period. Other revenue was $12 million in the third quarter of 2022, up 24% from the third quarter of 2021, primarily reflecting the continued growth of our Yelp Fusion program. Third Quarter 2022 Financial Review 1 Advertising revenue by category in 2022 reflects an updated method of disaggregation. Prior-period amounts have not been updated as it is impracticable to do so, given certain historical information was not available. Three Months Ended September 30, Nine Months Ended September 30, 2022 2021 2022 2021 Net revenue by product: Advertising revenue by category¹: Services $ 180,957 $ 157,319 $ 515,518 $ 450,528 Restaurants, Retail & Other 112,707 99,511 324,901 273,250 Advertising 293,664 256,830 840,419 723,778 Transactions 3,652 3,001 10,772 10,330 Other 11,575 9,324 33,212 24,331 Total net revenue $ 308,891 $ 269,155 $ 884,403 $ 758,439 Net revenue +15% $269M $309M 3Q21 3Q22
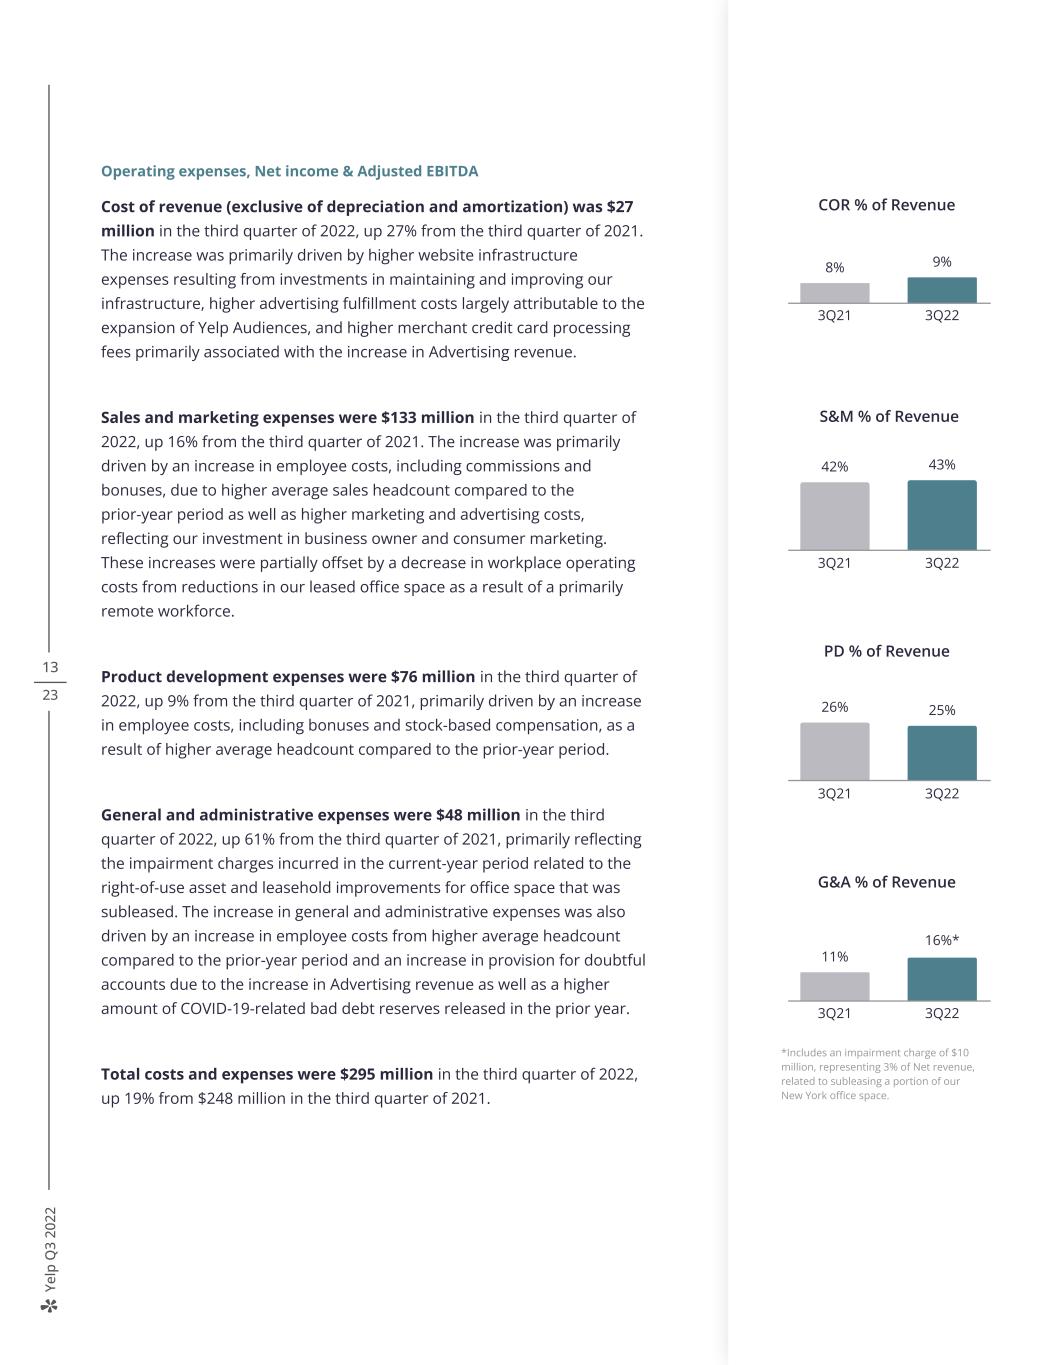
Ye lp Q 3 20 22 13 23 Operating expenses, Net income & Adjusted EBITDA Cost of revenue (exclusive of depreciation and amortization) was $27 million in the third quarter of 2022, up 27% from the third quarter of 2021. The increase was primarily driven by higher website infrastructure expenses resulting from investments in maintaining and improving our infrastructure, higher advertising fulfillment costs largely attributable to the expansion of Yelp Audiences, and higher merchant credit card processing fees primarily associated with the increase in Advertising revenue. Sales and marketing expenses were $133 million in the third quarter of 2022, up 16% from the third quarter of 2021. The increase was primarily driven by an increase in employee costs, including commissions and bonuses, due to higher average sales headcount compared to the prior-year period as well as higher marketing and advertising costs, reflecting our investment in business owner and consumer marketing. These increases were partially offset by a decrease in workplace operating costs from reductions in our leased office space as a result of a primarily remote workforce. Product development expenses were $76 million in the third quarter of 2022, up 9% from the third quarter of 2021, primarily driven by an increase in employee costs, including bonuses and stock-based compensation, as a result of higher average headcount compared to the prior-year period. General and administrative expenses were $48 million in the third quarter of 2022, up 61% from the third quarter of 2021, primarily reflecting the impairment charges incurred in the current-year period related to the right-of-use asset and leasehold improvements for office space that was subleased. The increase in general and administrative expenses was also driven by an increase in employee costs from higher average headcount compared to the prior-year period and an increase in provision for doubtful accounts due to the increase in Advertising revenue as well as a higher amount of COVID-19-related bad debt reserves released in the prior year. Total costs and expenses were $295 million in the third quarter of 2022, up 19% from $248 million in the third quarter of 2021. COR % of Revenue 8% 9% 3Q21 3Q22 S&M % of Revenue 42% 43% 3Q21 3Q22 PD % of Revenue 26% 25% 3Q21 3Q22 G&A % of Revenue 11% 16%* 3Q21 3Q22 *Includes an impairment charge of $10 million, representing 3% of Net revenue, related to subleasing a portion of our New York office space.
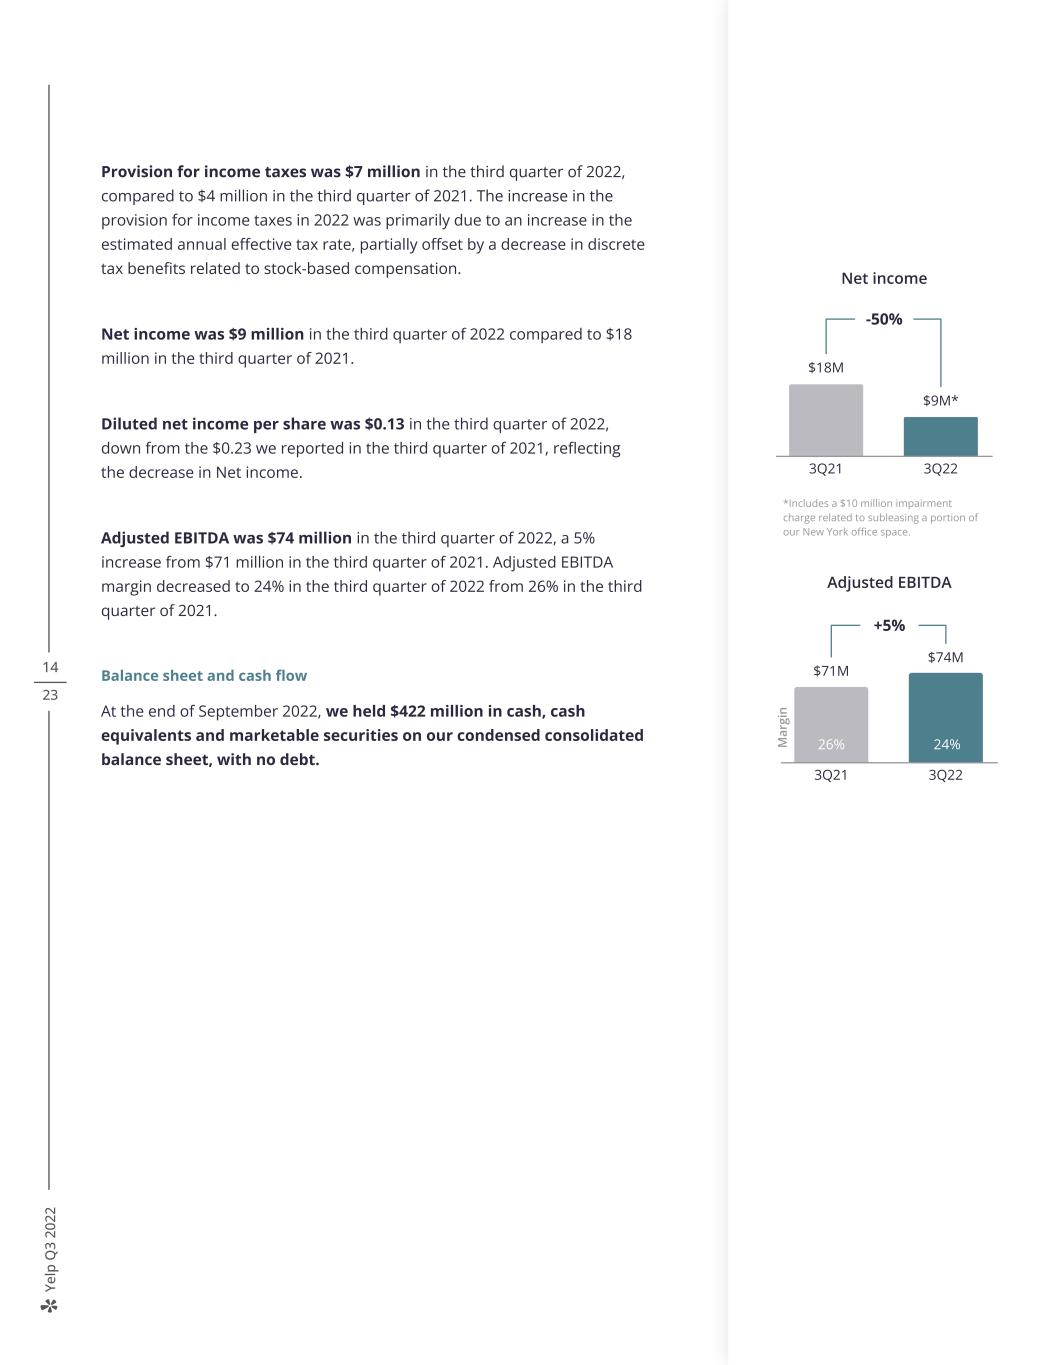
Ye lp Q 3 20 22 14 23 Provision for income taxes was $7 million in the third quarter of 2022, compared to $4 million in the third quarter of 2021. The increase in the provision for income taxes in 2022 was primarily due to an increase in the estimated annual effective tax rate, partially offset by a decrease in discrete tax benefits related to stock-based compensation. Net income was $9 million in the third quarter of 2022 compared to $18 million in the third quarter of 2021. Diluted net income per share was $0.13 in the third quarter of 2022, down from the $0.23 we reported in the third quarter of 2021, reflecting the decrease in Net income. Adjusted EBITDA was $74 million in the third quarter of 2022, a 5% increase from $71 million in the third quarter of 2021. Adjusted EBITDA margin decreased to 24% in the third quarter of 2022 from 26% in the third quarter of 2021. Balance sheet and cash flow At the end of September 2022, we held $422 million in cash, cash equivalents and marketable securities on our condensed consolidated balance sheet, with no debt. Net income -50% $18M $9M* 3Q21 3Q22 Adjusted EBITDA +5% $71M $74M 3Q21 3Q22 M ar gi n 26% 24% *Includes a $10 million impairment charge related to subleasing a portion of our New York office space.
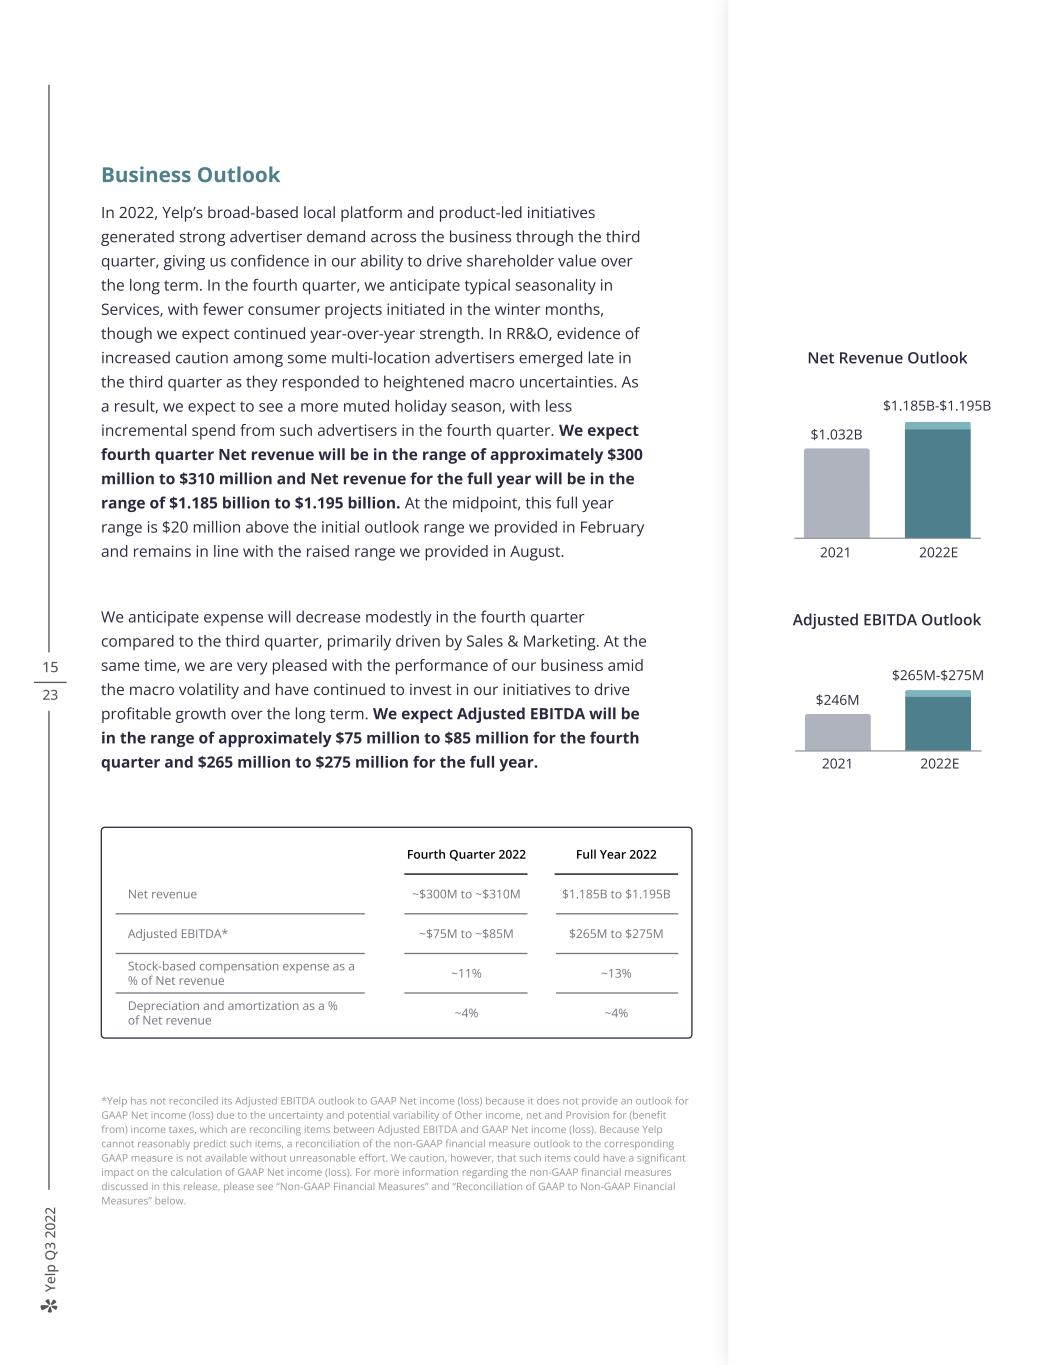
Ye lp Q 3 20 22 15 23 Business Outlook In 2022, Yelp’s broad-based local platform and product-led initiatives generated strong advertiser demand across the business through the third quarter, giving us confidence in our ability to drive shareholder value over the long term. In the fourth quarter, we anticipate typical seasonality in Services, with fewer consumer projects initiated in the winter months, though we expect continued year-over-year strength. In RR&O, evidence of increased caution among some multi-location advertisers emerged late in the third quarter as they responded to heightened macro uncertainties. As a result, we expect to see a more muted holiday season, with less incremental spend from such advertisers in the fourth quarter. We expect fourth quarter Net revenue will be in the range of approximately $300 million to $310 million and Net revenue for the full year will be in the range of $1.185 billion to $1.195 billion. At the midpoint, this full year range is $20 million above the initial outlook range we provided in February and remains in line with the raised range we provided in August. We anticipate expense will decrease modestly in the fourth quarter compared to the third quarter, primarily driven by Sales & Marketing. At the same time, we are very pleased with the performance of our business amid the macro volatility and have continued to invest in our initiatives to drive profitable growth over the long term. We expect Adjusted EBITDA will be in the range of approximately $75 million to $85 million for the fourth quarter and $265 million to $275 million for the full year. $246M Adjusted EBITDA Outlook 2021 2022E $265M-$275M Fourth Quarter 2022 Full Year 2022 Net revenue ~$300M to ~$310M $1.185B to $1.195B Adjusted EBITDA* ~$75M to ~$85M $265M to $275M Stock-based compensation expense as a % of Net revenue ~11% ~13% Depreciation and amortization as a % of Net revenue ~4% ~4% *Yelp has not reconciled its Adjusted EBITDA outlook to GAAP Net income (loss) because it does not provide an outlook for GAAP Net income (loss) due to the uncertainty and potential variability of Other income, net and Provision for (benefit from) income taxes, which are reconciling items between Adjusted EBITDA and GAAP Net income (loss). Because Yelp cannot reasonably predict such items, a reconciliation of the non-GAAP financial measure outlook to the corresponding GAAP measure is not available without unreasonable effort. We caution, however, that such items could have a significant impact on the calculation of GAAP Net income (loss). For more information regarding the non-GAAP financial measures discussed in this release, please see “Non-GAAP Financial Measures” and “Reconciliation of GAAP to Non-GAAP Financial Measures” below. Net Revenue Outlook 2021 2022E $1.032B $1.185B-$1.195B
Ye lp Q 3 20 22 16 23 Quarterly Earnings Webcast Yelp will host a live webcast today at 2:00 p.m. PDT to discuss the third quarter 2022 financial results and outlook for the fourth quarter of and full year 2022. The webcast can be accessed on the Yelp Investor Relations website at yelp-ir.com. A replay of the webcast will be available at the same website. About Yelp Yelp Inc. (www.yelp.com) connects people with great local businesses. With trusted local business information, photos and review content, Yelp provides a one-stop local platform for consumers to discover, connect, and transact with local businesses of all sizes by making it easy to request a quote, join a waitlist, and make a reservation, appointment, or purchase. Yelp was founded in San Francisco in July 2004.
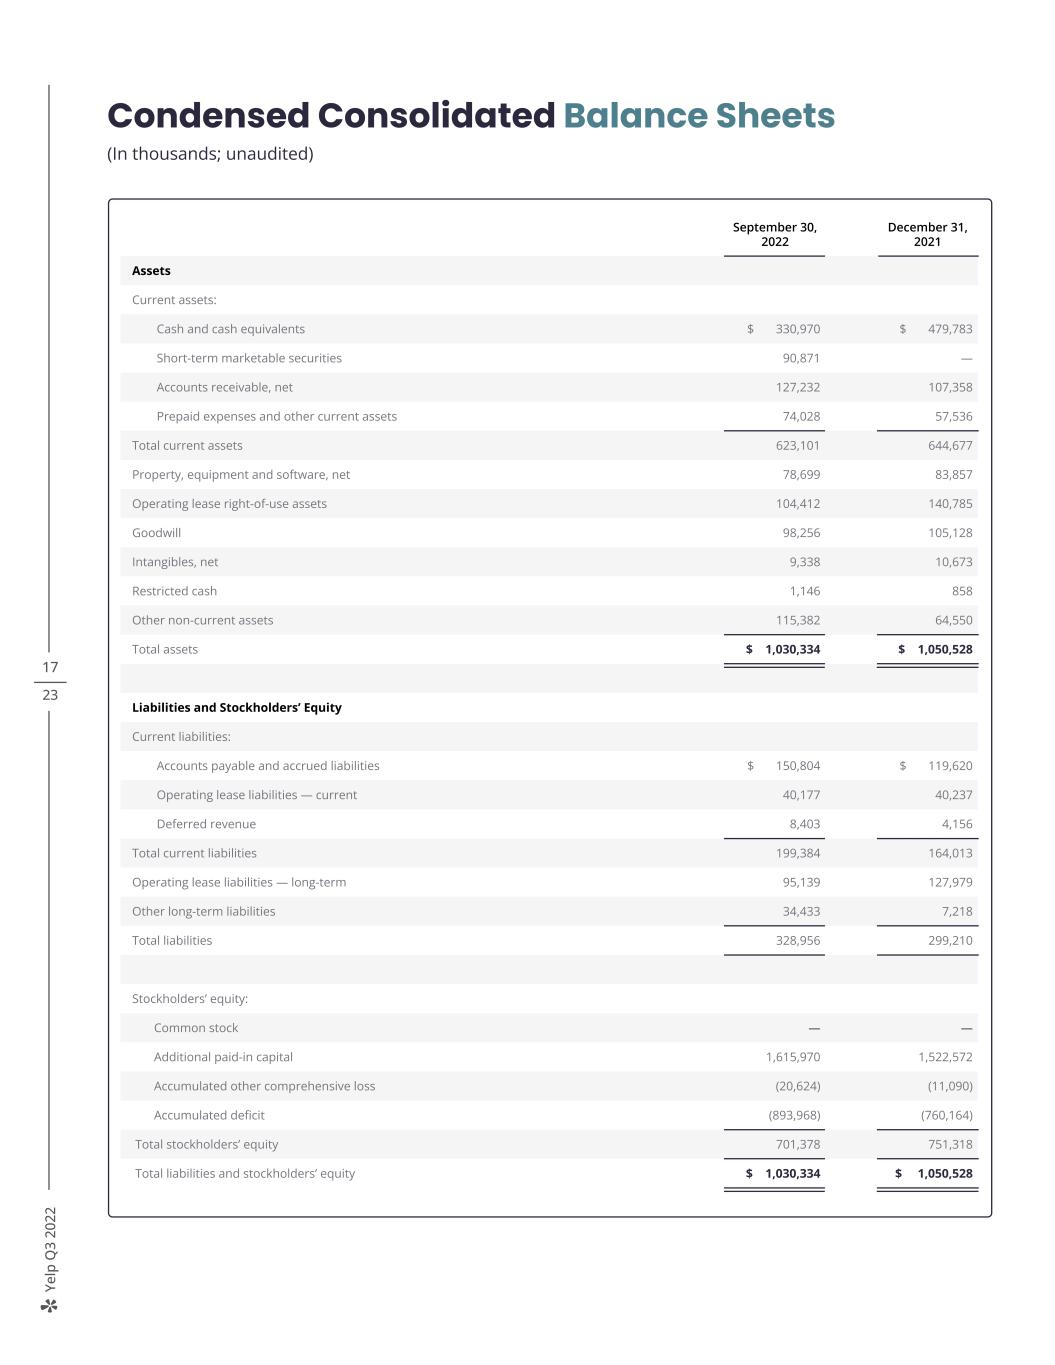
Ye lp Q 3 20 22 17 23 Condensed Consolidated Balance Sheets (In thousands; unaudited) September 30, 2022 December 31, 2021 Assets Current assets: Cash and cash equivalents $ 330,970 $ 479,783 Short-term marketable securities 90,871 — Accounts receivable, net 127,232 107,358 Prepaid expenses and other current assets 74,028 57,536 Total current assets 623,101 644,677 Property, equipment and software, net 78,699 83,857 Operating lease right-of-use assets 104,412 140,785 Goodwill 98,256 105,128 Intangibles, net 9,338 10,673 Restricted cash 1,146 858 Other non-current assets 115,382 64,550 Total assets $ 1,030,334 $ 1,050,528 Liabilities and Stockholders’ Equity Current liabilities: Accounts payable and accrued liabilities $ 150,804 $ 119,620 Operating lease liabilities — current 40,177 40,237 Deferred revenue 8,403 4,156 Total current liabilities 199,384 164,013 Operating lease liabilities — long-term 95,139 127,979 Other long-term liabilities 34,433 7,218 Total liabilities 328,956 299,210 Stockholders’ equity: Common stock — — Additional paid-in capital 1,615,970 1,522,572 Accumulated other comprehensive loss (20,624) (11,090) Accumulated deficit (893,968) (760,164) Total stockholders’ equity 701,378 751,318 Total liabilities and stockholders’ equity $ 1,030,334 $ 1,050,528
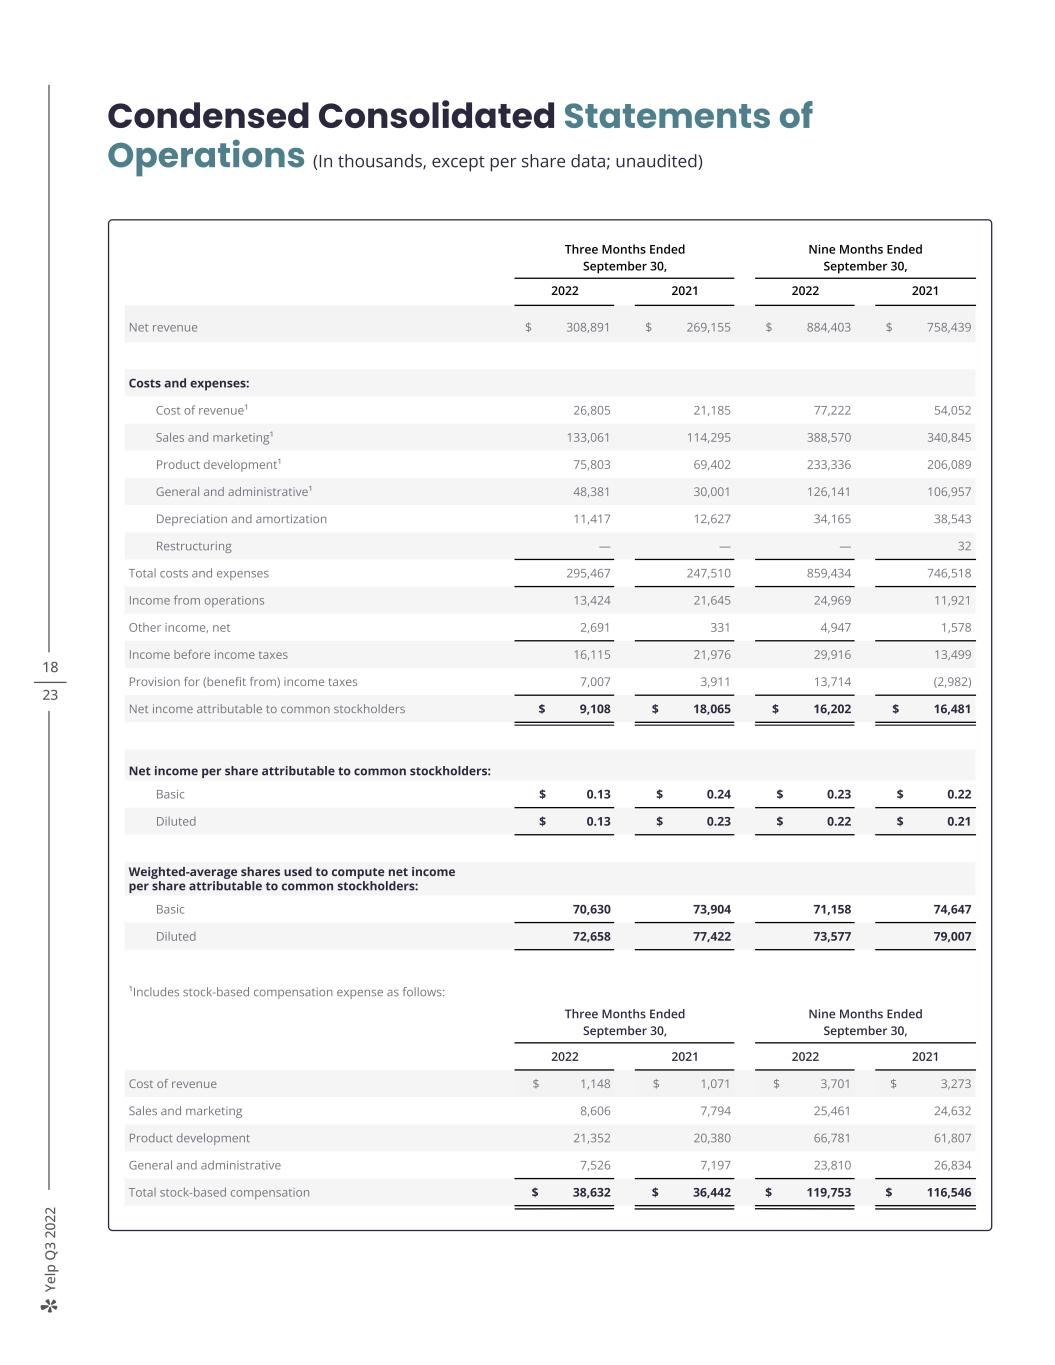
Ye lp Q 3 20 22 18 23 Condensed Consolidated Statements of Operations (In thousands, except per share data; unaudited) Three Months Ended September 30, Nine Months Ended September 30, 2022 2021 2022 2021 Net revenue $ 308,891 $ 269,155 $ 884,403 $ 758,439 Costs and expenses: Cost of revenue¹ 26,805 21,185 77,222 54,052 Sales and marketing¹ 133,061 114,295 388,570 340,845 Product development¹ 75,803 69,402 233,336 206,089 General and administrative¹ 48,381 30,001 126,141 106,957 Depreciation and amortization 11,417 12,627 34,165 38,543 Restructuring — — — 32 Total costs and expenses 295,467 247,510 859,434 746,518 Income from operations 13,424 21,645 24,969 11,921 Other income, net 2,691 331 4,947 1,578 Income before income taxes 16,115 21,976 29,916 13,499 Provision for (benefit from) income taxes 7,007 3,911 13,714 (2,982) Net income attributable to common stockholders $ 9,108 $ 18,065 $ 16,202 $ 16,481 Net income per share attributable to common stockholders: Basic $ 0.13 $ 0.24 $ 0.23 $ 0.22 Diluted $ 0.13 $ 0.23 $ 0.22 $ 0.21 Weighted-average shares used to compute net income per share attributable to common stockholders: Basic 70,630 73,904 71,158 74,647 Diluted 72,658 77,422 73,577 79,007 ¹Includes stock-based compensation expense as follows: Three Months Ended September 30, Nine Months Ended September 30, 2022 2021 2022 2021 Cost of revenue $ 1,148 $ 1,071 $ 3,701 $ 3,273 Sales and marketing 8,606 7,794 25,461 24,632 Product development 21,352 20,380 66,781 61,807 General and administrative 7,526 7,197 23,810 26,834 Total stock-based compensation $ 38,632 $ 36,442 $ 119,753 $ 116,546
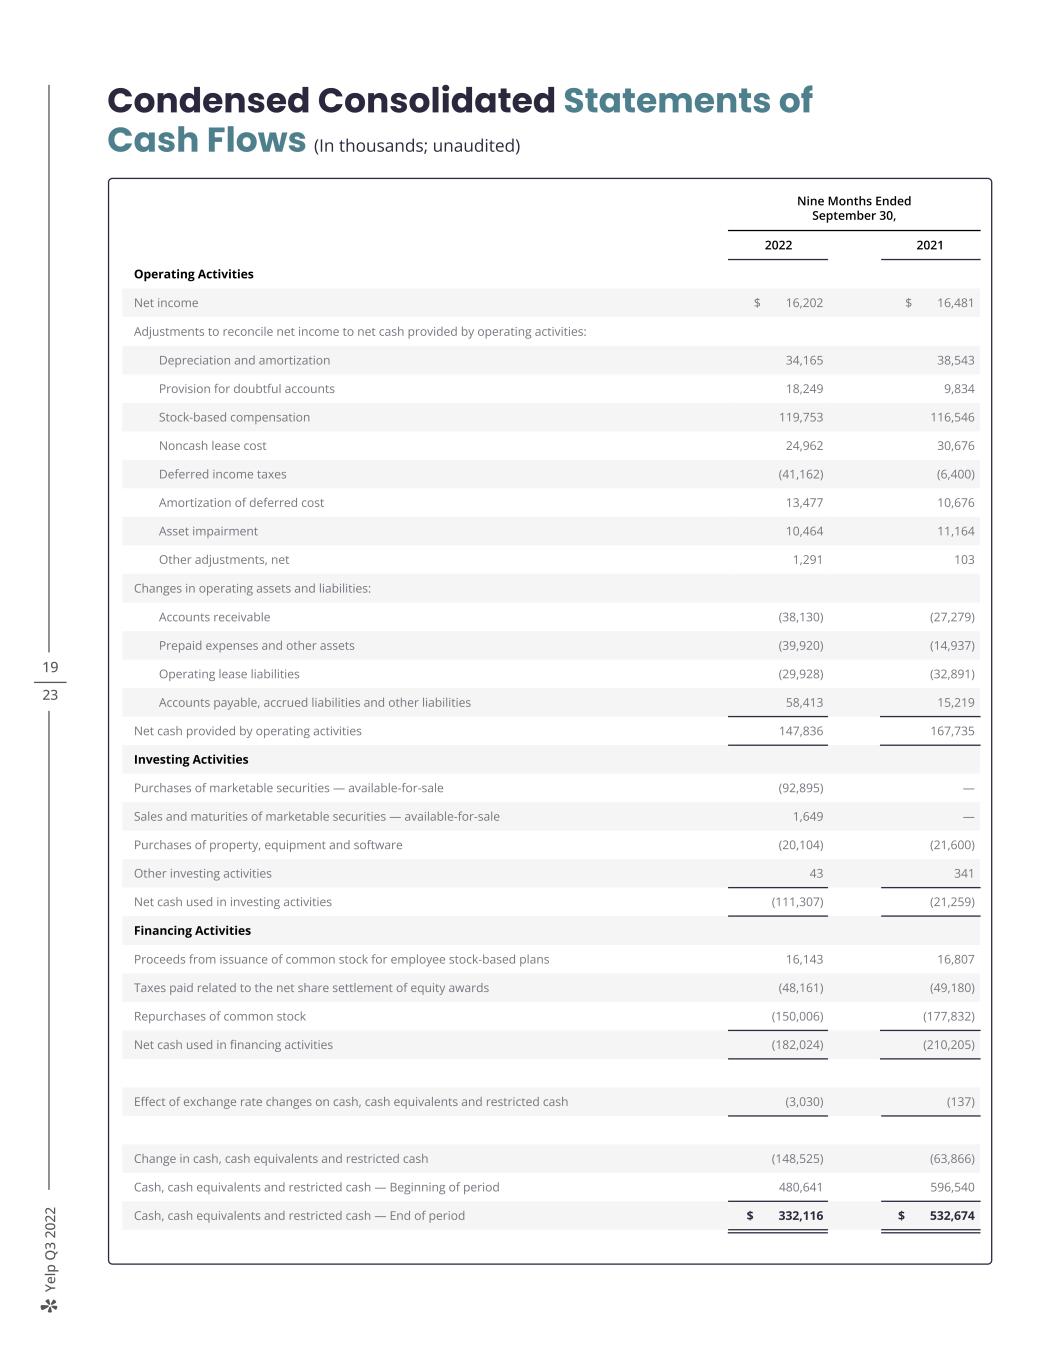
Ye lp Q 3 20 22 19 23 Condensed Consolidated Statements of Cash Flows (In thousands; unaudited) Nine Months Ended September 30, 2022 2021 Operating Activities Net income $ 16,202 $ 16,481 Adjustments to reconcile net income to net cash provided by operating activities: Depreciation and amortization 34,165 38,543 Provision for doubtful accounts 18,249 9,834 Stock-based compensation 119,753 116,546 Noncash lease cost 24,962 30,676 Deferred income taxes (41,162) (6,400) Amortization of deferred cost 13,477 10,676 Asset impairment 10,464 11,164 Other adjustments, net 1,291 103 Changes in operating assets and liabilities: Accounts receivable (38,130) (27,279) Prepaid expenses and other assets (39,920) (14,937) Operating lease liabilities (29,928) (32,891) Accounts payable, accrued liabilities and other liabilities 58,413 15,219 Net cash provided by operating activities 147,836 167,735 Investing Activities Purchases of marketable securities — available-for-sale (92,895) — Sales and maturities of marketable securities — available-for-sale 1,649 — Purchases of property, equipment and software (20,104) (21,600) Other investing activities 43 341 Net cash used in investing activities (111,307) (21,259) Financing Activities Proceeds from issuance of common stock for employee stock-based plans 16,143 16,807 Taxes paid related to the net share settlement of equity awards (48,161) (49,180) Repurchases of common stock (150,006) (177,832) Net cash used in financing activities (182,024) (210,205) Effect of exchange rate changes on cash, cash equivalents and restricted cash (3,030) (137) Change in cash, cash equivalents and restricted cash (148,525) (63,866) Cash, cash equivalents and restricted cash — Beginning of period 480,641 596,540 Cash, cash equivalents and restricted cash — End of period $ 332,116 $ 532,674
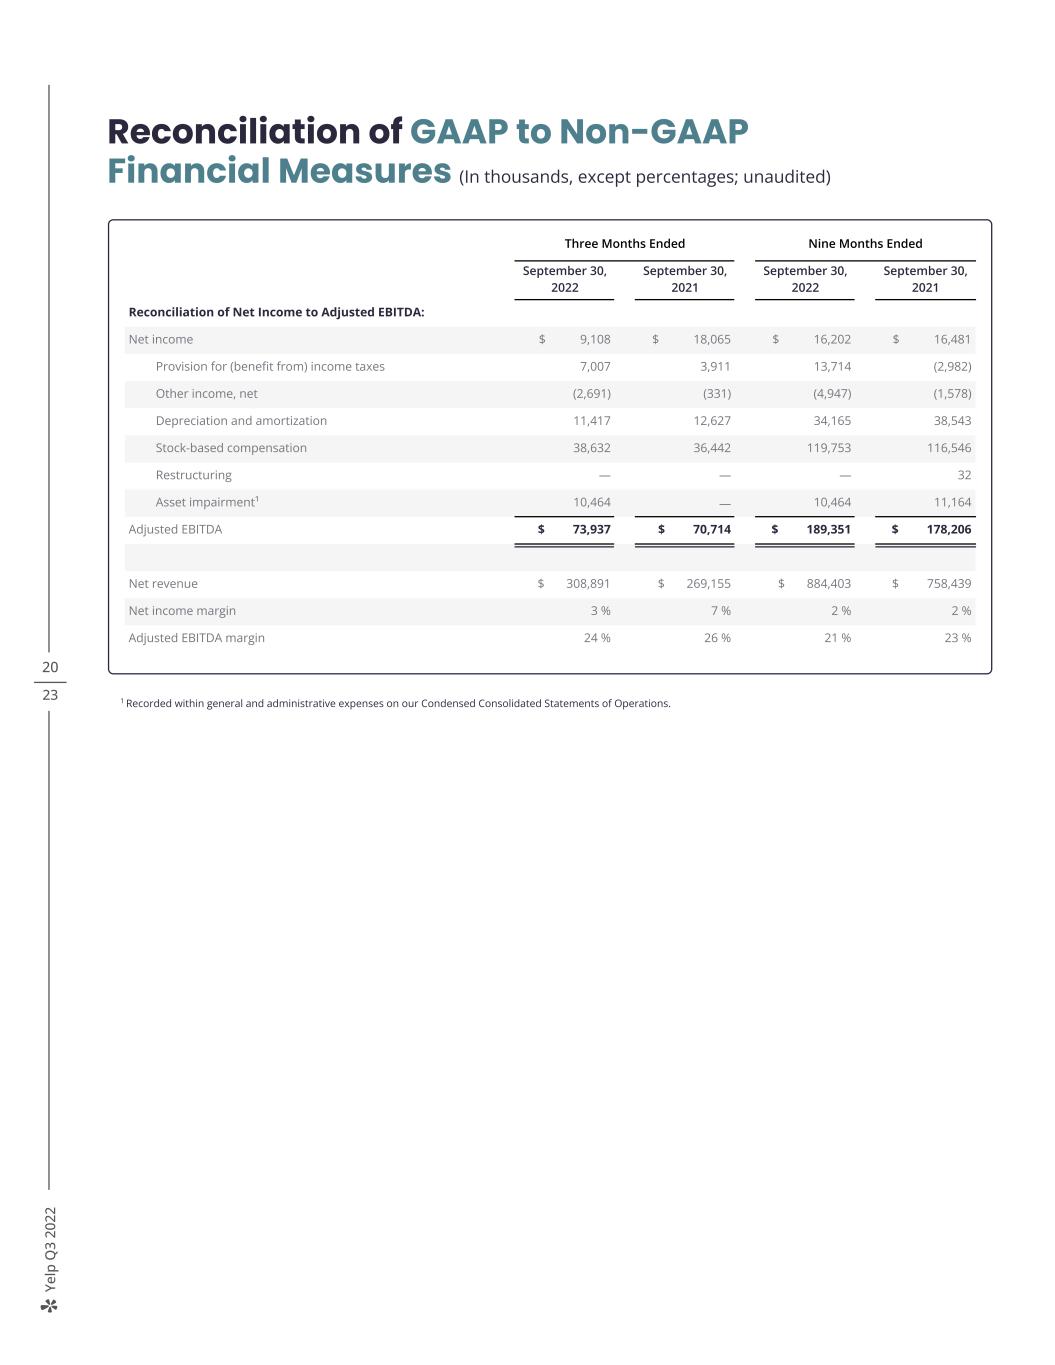
Ye lp Q 3 20 22 20 23 Reconciliation of GAAP to Non-GAAP Financial Measures (In thousands, except percentages; unaudited) 1 Recorded within general and administrative expenses on our Condensed Consolidated Statements of Operations. Three Months Ended Nine Months Ended September 30, 2022 September 30, 2021 September 30, 2022 September 30, 2021 Reconciliation of Net Income to Adjusted EBITDA: Net income $ 9,108 $ 18,065 $ 16,202 $ 16,481 Provision for (benefit from) income taxes 7,007 3,911 13,714 (2,982) Other income, net (2,691) (331) (4,947) (1,578) Depreciation and amortization 11,417 12,627 34,165 38,543 Stock-based compensation 38,632 36,442 119,753 116,546 Restructuring — — — 32 Asset impairment¹ 10,464 — 10,464 11,164 Adjusted EBITDA $ 73,937 $ 70,714 $ 189,351 $ 178,206 Net revenue $ 308,891 $ 269,155 $ 884,403 $ 758,439 Net income margin 3 % 7 % 2 % 2 % Adjusted EBITDA margin 24 % 26 % 21 % 23 %
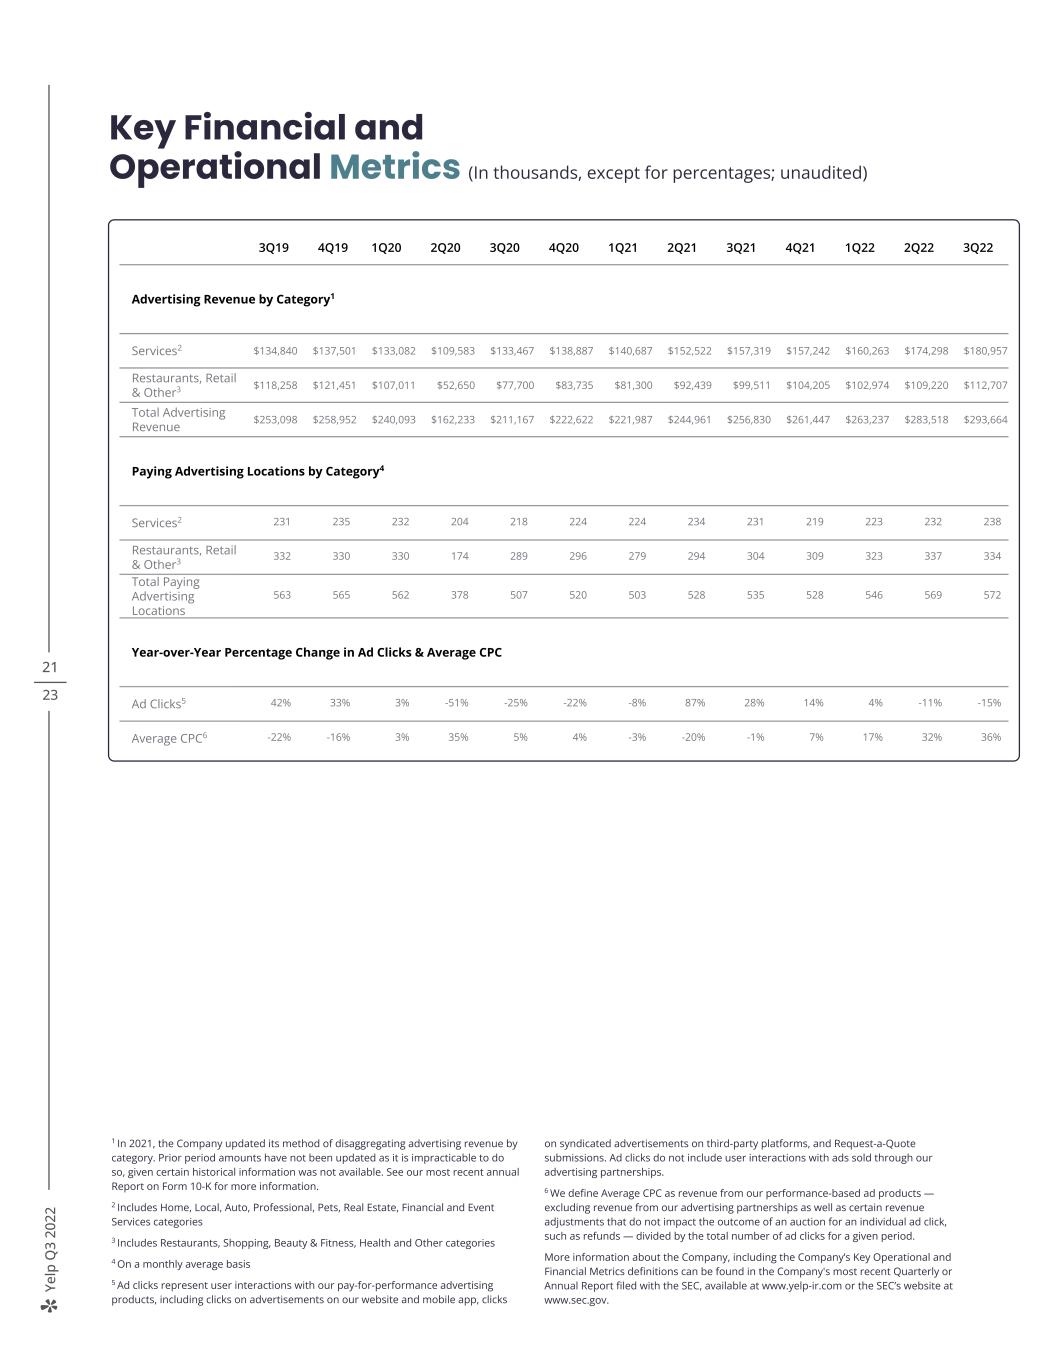
Ye lp Q 3 20 22 21 23 Key Financial and Operational Metrics (In thousands, except for percentages; unaudited) 3Q19 4Q19 1Q20 2Q20 3Q20 4Q20 1Q21 2Q21 3Q21 4Q21 1Q22 2Q22 3Q22 Advertising Revenue by Category1 Services2 $134,840 $137,501 $133,082 $109,583 $133,467 $138,887 $140,687 $152,522 $157,319 $157,242 $160,263 $174,298 $180,957 Restaurants, Retail & Other3 $118,258 $121,451 $107,011 $52,650 $77,700 $83,735 $81,300 $92,439 $99,511 $104,205 $102,974 $109,220 $112,707 Total Advertising Revenue $253,098 $258,952 $240,093 $162,233 $211,167 $222,622 $221,987 $244,961 $256,830 $261,447 $263,237 $283,518 $293,664 Paying Advertising Locations by Category4 Services2 231 235 232 204 218 224 224 234 231 219 223 232 238 Restaurants, Retail & Other3 332 330 330 174 289 296 279 294 304 309 323 337 334 Total Paying Advertising Locations 563 565 562 378 507 520 503 528 535 528 546 569 572 Year-over-Year Percentage Change in Ad Clicks & Average CPC Ad Clicks5 42% 33% 3% -51% -25% -22% -8% 87% 28% 14% 4% -11% -15% Average CPC6 -22% -16% 3% 35% 5% 4% -3% -20% -1% 7% 17% 32% 36% 1 In 2021, the Company updated its method of disaggregating advertising revenue by category. Prior period amounts have not been updated as it is impracticable to do so, given certain historical information was not available. See our most recent annual Report on Form 10-K for more information. 2 Includes Home, Local, Auto, Professional, Pets, Real Estate, Financial and Event Services categories 3 Includes Restaurants, Shopping, Beauty & Fitness, Health and Other categories 4 On a monthly average basis 5 Ad clicks represent user interactions with our pay-for-performance advertising products, including clicks on advertisements on our website and mobile app, clicks on syndicated advertisements on third-party platforms, and Request-a-Quote submissions. Ad clicks do not include user interactions with ads sold through our advertising partnerships. 6 We define Average CPC as revenue from our performance-based ad products — excluding revenue from our advertising partnerships as well as certain revenue adjustments that do not impact the outcome of an auction for an individual ad click, such as refunds — divided by the total number of ad clicks for a given period. More information about the Company, including the Company’s Key Operational and Financial Metrics definitions can be found in the Company's most recent Quarterly or Annual Report filed with the SEC, available at www.yelp-ir.com or the SEC’s website at www.sec.gov.
Ye lp Q 3 20 22 Non-GAAP Financial Measures This letter and statements made during the above referenced webcast may include information relating to Adjusted EBITDA and Adjusted EBITDA margin, each of which is a "non-GAAP financial measure." We define Adjusted EBITDA as net income (loss), adjusted to exclude: provision for (benefit from) income taxes; other income, net; depreciation and amortization; stock-based compensation expense; and, in certain periods, certain other income and expense items, such as restructuring costs and impairment charges. We define Adjusted EBITDA margin as Adjusted EBITDA divided by net revenue. Adjusted EBITDA, which is not prepared under any comprehensive set of accounting rules or principles, has limitations as an analytical tool and you should not consider it in isolation or as a substitute for analysis of Yelp’s financial results as reported in accordance with generally accepted accounting principles in the United States (“GAAP”). In particular, Adjusted EBITDA should not be viewed as a substitute for, or superior to, net income (loss) prepared in accordance with GAAP as a measure of profitability or liquidity. Some of these limitations are: > although depreciation and amortization are non-cash charges, the assets being depreciated and amortized may have to be replaced in the future, and Adjusted EBITDA does not reflect all cash capital expenditure requirements for such replacements or for new capital expenditure requirements; > Adjusted EBITDA does not reflect changes in, or cash requirements for, Yelp's working capital needs; > Adjusted EBITDA does not reflect the impact of the recording or release of valuation allowances or tax payments that may represent a reduction in cash available to Yelp; > Adjusted EBITDA does not consider the potentially dilutive impact of equity-based compensation; > Adjusted EBITDA does not take into account any income or costs that management determines are not indicative of ongoing operating performance, such as restructuring costs and impairment charges; and > other companies, including those in Yelp’s industry, may calculate Adjusted EBITDA differently, which reduces its usefulness as a comparative measure. Because of these limitations, you should consider Adjusted EBITDA and Adjusted EBITDA margin alongside other financial performance measures, net income (loss) and Yelp’s other GAAP results. Forward-Looking Statements This letter contains, and statements made during the above-referenced webcast will contain, forward-looking statements relating to, among other things, the future performance of Yelp and its consolidated subsidiaries that are based on Yelp’s current expectations, forecasts and assumptions and involve risks and uncertainties. These statements include, but are not limited to, statements regarding: > Yelp’s expected financial results for the fourth quarter and full year 2022; > Yelp’s confidence in its ability to execute against the opportunities ahead and drive profitable growth over the long term; > Yelp’s assessment of opportunities to win new customers and capture a greater share of existing customers’ budgets in the Multi-location channel; > Yelp’s assessment of opportunities to drive more high-quality leads to Services advertisers in the years to come; > Yelp’s product investment priorities for 2022; > Yelp’s ability to deliver more value to advertisers and drive top-of-funnel growth in consumers; > Yelp’s belief that it can achieve greater user engagement and audience growth over the long term through its product and marketing initiatives; > Yelp’s assessment of opportunities to increase engagement and monetization through improvement of the Android app experience; > Yelp’s assessment of its opportunities in local advertising and to connect more consumers with great local businesses; > Yelp’s plans to continue prioritizing investments that it believes will drive profitable growth over the long term, including product development and marketing; > The ability of Yelp’s strategic initiatives to drive long-term sustainable and profitable growth through product innovation; 22 23
Ye lp Q 3 20 22 > Yelp’s belief that its evolving approach to compensation will reduce stock-based compensation as a percentage of revenue over time; > Yelp’s plans to continue share repurchases under its stock repurchase program; and > Yelp’s belief that its business outlook for the fourth quarter and full year 2022 appropriately considers both expected sequential seasonality and increased caution due to macro volatility, and our strong performance amid ongoing, heightened macro uncertainties. Yelp’s actual results could differ materially from those predicted or implied by such forward-looking statements and reported results should not be considered as an indication of future performance. Factors that could cause or contribute to such differences include, but are not limited to: > macroeconomic uncertainty, including related to persistent inflation and continued interest rate hikes, and its impact on consumer behavior and advertiser spending; > fluctuations in the number of COVID-19 cases and the spread of COVID-19 variants, the vaccination rate in the United States, any reimposition of COVID-19-related public health restrictions, and the pace of the economic recovery in local economies and the United States generally; > the impact of fears or actual outbreaks of disease, including COVID-19 and any variants thereof, and any resulting changes in consumer behavior, economic conditions or governmental actions; > maintaining and expanding Yelp’s base of advertisers, particularly as many businesses continue to face operating restrictions in connection with the COVID-19 pandemic and other constraints; > Yelp’s ability to continue to effectively operate with a primarily remote work force and attract and retain key talent; > Yelp’s limited operating history in an evolving industry; > Yelp’s ability to generate and maintain sufficient high-quality content from its users; > potential strategic opportunities and Yelp’s ability to successfully manage the acquisition and integration of new businesses, solutions or technologies, as well as its ability to monetize such acquired products, solutions or technologies; > Yelp’s reliance on traffic to its website from search engines like Google and Bing and the quality and reliability of such traffic; > maintaining a strong brand and managing negative publicity that may arise; and > Yelp’s ability to timely upgrade and develop its systems, infrastructure and customer service capabilities. Factors that could cause or contribute to such differences also include, but are not limited to, those factors that could affect Yelp’s business, operating results and stock price included under the captions “Risk Factors” and “Management’s Discussion and Analysis of Financial Condition and Results of Operations” in Yelp’s most recent Annual Report on Form 10-K or Quarterly Report on Form 10-Q at www.yelp-ir.com or the SEC’s website at www.sec.gov. Undue reliance should not be placed on the forward-looking statements in this letter or the above-referenced webcast, which are based on information available to Yelp on the date hereof. Such forward-looking statements do not include the potential impact of any acquisitions or divestitures that may be announced and/or completed after the date hereof. Yelp assumes no obligation to update such statements. 23 23


