Date of Report (Date of earliest event reported) |
October 26, 2025 | ||||

WEX Inc. | ||
(Exact name of registrant as specified in its charter) | ||
Delaware |
001-32426 |
01-0526993 |
||||||||||||
|
(State or other jurisdiction of
incorporation)
|
(Commission File Number) |
(IRS Employer Identification No.) |
||||||||||||
| 1 Hancock Street | , | Portland | , | Maine |
04101 |
||||||||||||||||||
Address of principal executive offices |
Zip Code |
||||||||||||||||||||||
Registrant's telephone number, including area code |
(207) |
733-8171 | ||||||||||||
(Former name or former address if changes since last report) | ||
| Title of each class | Trading Symbol(s) | Name of each exchange on which registered | ||||||
| Common Stock, $0.01 par value | WEX | New York Stock Exchange | ||||||
Exhibit No. |
Description |
|||||||
| 10.1 | ||||||||
99.1 |
||||||||
99.2 |
||||||||
| 99.3 | ||||||||
104 |
Cover Page Interactive Data File (embedded within the Inline XBRL document) |
|||||||
WEX INC. |
||||||||
Date: October 29, 2025 |
By: |
/s/ Jagtar Narula |
||||||
Jagtar Narula |
||||||||
Chief Financial Officer |
||||||||
| Three months ended September 30, | Nine months ended September 30, | ||||||||||||||||||||||
| 2025 | 2024 | 2025 | 2024 | ||||||||||||||||||||
| Revenues | |||||||||||||||||||||||
| Payment processing revenue | $ | 301.7 | $ | 309.9 | $ | 858.8 | $ | 930.3 | |||||||||||||||
| Account servicing revenue | 185.3 | 174.6 | 542.3 | 516.5 | |||||||||||||||||||
| Finance fee revenue | 83.2 | 70.5 | 239.3 | 218.6 | |||||||||||||||||||
| Other revenue | 121.5 | 110.5 | 347.6 | 326.3 | |||||||||||||||||||
| Total revenues | 691.8 | 665.5 | 1,987.9 | 1,991.6 | |||||||||||||||||||
| Cost of services | |||||||||||||||||||||||
| Processing costs | 163.1 | 156.0 | 491.9 | 489.0 | |||||||||||||||||||
| Service fees | 22.6 | 20.7 | 71.5 | 62.4 | |||||||||||||||||||
| Provision for credit losses | 20.4 | 9.7 | 57.9 | 52.6 | |||||||||||||||||||
| Operating interest | 29.2 | 28.3 | 82.0 | 77.6 | |||||||||||||||||||
| Depreciation and amortization | 39.0 | 34.6 | 113.7 | 98.6 | |||||||||||||||||||
| Total cost of services | 274.3 | 249.2 | 817.0 | 780.2 | |||||||||||||||||||
| General and administrative | 92.0 | 92.1 | 251.9 | 281.6 | |||||||||||||||||||
| Sales and marketing | 97.3 | 80.9 | 285.9 | 259.9 | |||||||||||||||||||
| Depreciation and amortization | 44.7 | 46.9 | 135.5 | 140.9 | |||||||||||||||||||
| Operating income | 183.6 | 196.4 | 497.6 | 529.0 | |||||||||||||||||||
| Financing interest expense, net of financial instruments | (63.8) | (58.4) | (181.8) | (178.5) | |||||||||||||||||||
| Change in fair value of contingent consideration | (0.7) | (0.1) | (2.3) | (3.5) | |||||||||||||||||||
| Net foreign currency (loss) gain | (2.6) | 3.2 | (3.3) | (9.7) | |||||||||||||||||||
| Income before income taxes | 116.4 | 141.1 | 310.2 | 337.2 | |||||||||||||||||||
| Income tax expense | 36.2 | 38.2 | 90.3 | 91.6 | |||||||||||||||||||
| Net income | $ | 80.3 | $ | 102.9 | $ | 219.8 | $ | 245.7 | |||||||||||||||
| Net income per share: | |||||||||||||||||||||||
| Basic | $ | 2.34 | $ | 2.56 | $ | 6.13 | $ | 5.95 | |||||||||||||||
| Diluted | $ | 2.30 | $ | 2.52 | $ | 6.07 | $ | 5.89 | |||||||||||||||
| Weighted average common shares outstanding: | |||||||||||||||||||||||
| Basic | 34.4 | 40.3 | 35.8 | 41.3 | |||||||||||||||||||
| Diluted | 34.8 | 40.8 | 36.2 | 41.7 | |||||||||||||||||||
| September 30, 2025 |
December 31, 2024 |
||||||||||
| Assets | |||||||||||
| Cash and cash equivalents | $ | 812.9 | $ | 595.8 | |||||||
| Restricted cash | 668.6 | 837.8 | |||||||||
| Accounts receivable, net | 3,816.1 | 3,008.6 | |||||||||
| Investment securities | 4,129.2 | 3,764.7 | |||||||||
| Securitized accounts receivable, restricted | 138.9 | 109.6 | |||||||||
| Prepaid expenses and other current assets | 149.7 | 199.0 | |||||||||
| Total current assets | 9,715.5 | 8,515.5 | |||||||||
| Property, equipment and capitalized software | 258.5 | 261.2 | |||||||||
| Goodwill and other intangible assets | 4,146.8 | 4,243.3 | |||||||||
| Investment securities | 81.0 | 80.5 | |||||||||
| Deferred income taxes, net | 16.8 | 18.3 | |||||||||
| Other assets | 214.7 | 202.8 | |||||||||
| Total assets | $ | 14,433.3 | $ | 13,321.6 | |||||||
| Liabilities and Stockholders’ Equity | |||||||||||
| Accounts payable | $ | 1,460.4 | $ | 1,090.9 | |||||||
| Accrued expenses and other current liabilities | 665.9 | 653.6 | |||||||||
| Restricted cash payable | 667.4 | 837.0 | |||||||||
| Short-term deposits | 5,152.9 | 4,452.7 | |||||||||
| Short-term debt, net | 1,306.8 | 1,293.2 | |||||||||
| Total current liabilities | 9,253.4 | 8,327.3 | |||||||||
| Long-term debt, net | 3,719.1 | 3,082.1 | |||||||||
| Deferred income taxes, net | 174.6 | 145.6 | |||||||||
| Other liabilities | 167.8 | 277.7 | |||||||||
| Total liabilities | 13,314.9 | 11,832.8 | |||||||||
| Total stockholders’ equity | 1,118.4 | 1,488.8 | |||||||||
| Total liabilities and stockholders’ equity | $ | 14,433.3 | $ | 13,321.6 | |||||||
| Nine Months Ended September 30, | |||||||||||
| 2025 | 2024 | ||||||||||
| Cash flows from operating activities | $ | 159.6 | $ | (157.0) | |||||||
| Cash flows from investing activities | |||||||||||
| Purchases of property, equipment and capitalized software | (102.2) | (108.6) | |||||||||
| Purchase of other investments | (11.7) | (18.0) | |||||||||
| Purchases of available-for-sale debt securities | (923.6) | (900.9) | |||||||||
| Sales and maturities of available-for-sale debt securities | 653.4 | 309.4 | |||||||||
| Acquisition of intangible assets | (14.5) | (5.1) | |||||||||
| Other investing activities | 4.4 | (0.9) | |||||||||
| Net cash used for investing activities | (394.3) | (724.0) | |||||||||
| Cash flows from financing activities | |||||||||||
| Repurchases of common stock | (799.8) | (543.6) | |||||||||
| Net change in deposits | 697.6 | 388.8 | |||||||||
| Net change in restricted cash payable | (215.6) | (480.4) | |||||||||
| Payments of deferred and contingent consideration | (76.7) | (93.7) | |||||||||
| Other financing activities | (39.3) | (23.5) | |||||||||
Net debt activity 1 |
650.7 | 711.3 | |||||||||
| Net cash provided by financing activities | 216.8 | (41.1) | |||||||||
| Effect of exchange rates on cash, cash equivalents and restricted cash | 62.3 | 3.9 | |||||||||
| Net change in cash, cash equivalents and restricted cash | 44.4 | (918.2) | |||||||||
| Cash, cash equivalents and restricted cash, beginning of period | 1,437.0 | 2,230.0 | |||||||||
| Cash, cash equivalents and restricted cash, end of period | $ | 1,481.5 | $ | 1,311.8 | |||||||
| Exhibit 1 Reconciliation of Non-GAAP Measures | ||||||||||||||
| (in millions, except per share data) (unaudited) | ||||||||||||||
| Three Months Ended September 30, | |||||||||||||||||||||||
| 2025 | 2024 | ||||||||||||||||||||||
| per diluted share | per diluted share | ||||||||||||||||||||||
| Net income | $ | 80.3 | $ | 2.30 | $ | 102.9 | $ | 2.52 | |||||||||||||||
| Unrealized gain on financial instruments | (0.3) | (0.01) | (0.9) | (0.02) | |||||||||||||||||||
| Net foreign currency loss (gain) | 2.6 | 0.07 | (3.2) | (0.08) | |||||||||||||||||||
| Change in fair value of contingent consideration | 0.7 | 0.02 | 0.1 | — | |||||||||||||||||||
| Acquisition-related intangible amortization | 47.9 | 1.38 | 50.4 | 1.24 | |||||||||||||||||||
| Other acquisition and divestiture related items | 5.0 | 0.14 | 2.4 | 0.06 | |||||||||||||||||||
| Stock-based compensation | 34.7 | 1.00 | 29.8 | 0.73 | |||||||||||||||||||
| Other costs | 3.6 | 0.10 | 12.6 | 0.31 | |||||||||||||||||||
| Debt restructuring and debt issuance cost amortization | 2.3 | 0.07 | 4.3 | 0.11 | |||||||||||||||||||
| Tax related items | (17.1) | (0.49) | (20.9) | (0.51) | |||||||||||||||||||
| Adjusted net income | $ | 159.7 | $ | 4.59 | $ | 177.5 | $ | 4.35 | |||||||||||||||
| Nine Months Ended September 30, | |||||||||||||||||||||||
| 2025 | 2024 | ||||||||||||||||||||||
| per diluted share | per diluted share | ||||||||||||||||||||||
| Net income | $ | 219.8 | $ | 6.07 | $ | 245.7 | $ | 5.89 | |||||||||||||||
| Unrealized gain on financial instruments | (0.7) | (0.02) | (0.6) | (0.01) | |||||||||||||||||||
| Net foreign currency loss | 3.3 | 0.09 | 9.7 | 0.23 | |||||||||||||||||||
| Change in fair value of contingent consideration | 2.3 | 0.06 | 3.5 | 0.08 | |||||||||||||||||||
| Acquisition-related intangible amortization | 145.1 | 4.01 | 151.9 | 3.64 | |||||||||||||||||||
| Other acquisition and divestiture related items | 9.4 | 0.26 | 9.3 | 0.22 | |||||||||||||||||||
| Stock-based compensation | 80.4 | 2.22 | 89.8 | 2.15 | |||||||||||||||||||
| Other costs | 22.9 | 0.63 | 37.8 | 0.91 | |||||||||||||||||||
| Debt restructuring and debt issuance cost amortization | 6.3 | 0.17 | 12.0 | 0.29 | |||||||||||||||||||
| Tax related items | (54.4) | (1.50) | (71.1) | (1.70) | |||||||||||||||||||
| Adjusted net income | $ | 434.3 | $ | 11.99 | $ | 488.1 | $ | 11.70 | |||||||||||||||
| Three Months Ended September 30, | Nine Months Ended September 30, | ||||||||||||||||||||||||||||||||||
| 2025 | (margin)1 |
2024 | (margin)1 |
2025 | (margin)1 |
2024 | (margin)1 |
||||||||||||||||||||||||||||
| Operating income | $ | 183.6 | 26.5 | % | $ | 196.4 | 29.5 | % | $ | 497.6 | 25.0 | % | $ | 529.0 | 26.6 | % | |||||||||||||||||||
| Unallocated corporate expenses | 23.7 | 24.1 | 74.1 | 73.8 | |||||||||||||||||||||||||||||||
| Acquisition-related intangible amortization | 47.9 | 50.4 | 145.1 | 151.9 | |||||||||||||||||||||||||||||||
| Other acquisition and divestiture related items | 3.8 | 1.6 | 5.0 | 5.4 | |||||||||||||||||||||||||||||||
| Stock-based compensation | 34.7 | 29.8 | 80.4 | 89.8 | |||||||||||||||||||||||||||||||
| Other costs | 3.6 | 14.8 | 22.3 | 42.0 | |||||||||||||||||||||||||||||||
| Total segment adjusted operating income | $ | 297.2 | 43.0 | % | $ | 317.1 | 47.6 | % | $ | 824.4 | 41.5 | % | $ | 891.9 | 44.8 | % | |||||||||||||||||||
| Unallocated corporate expenses | (23.7) | (24.1) | (74.1) | (73.8) | |||||||||||||||||||||||||||||||
| Adjusted operating income | $ | 273.5 | 39.5 | % | $ | 293.0 | 44.0 | % | $ | 750.3 | 37.7 | % | $ | 818.1 | 41.1 | % | |||||||||||||||||||
| Three Months Ended September 30, | Nine Months Ended September 30, | ||||||||||||||||||||||
| 2025 | 2024 | 2025 | 2024 | ||||||||||||||||||||
| Operating cash flow | $ | 376.6 | $ | 3.3 | $ | 159.6 | $ | (157.0) | |||||||||||||||
| Adjustments to operating cash flow, as reported: | |||||||||||||||||||||||
| Change in WEX Bank cash balances | (47.5) | 125.3 | (162.3) | 383.8 | |||||||||||||||||||
Other adjustments1 |
1.5 | — | 61.9 | 67.1 | |||||||||||||||||||
Net Funding Activity2 |
(178.1) | 372.2 | 693.0 | 792.0 | |||||||||||||||||||
| Net sales and maturities (purchases) of current investment securities | 48.7 | (276.3) | (273.3) | (584.8) | |||||||||||||||||||
| Capital expenditures | (35.0) | (35.0) | (102.2) | (108.6) | |||||||||||||||||||
| Adjusted free cash flow | $ | 166.2 | $ | 189.5 | $ | 376.7 | $ | 392.5 | |||||||||||||||
|
Exhibit 2
Impact of Certain Macro Factors on Reported Revenue and Adjusted Net Income
(in millions, except per share data)
(unaudited)
| |||||||||||||||||||||||||||||||||||||||||||||||
| Segment Revenue Results | |||||||||||||||||||||||||||||||||||||||||||||||
| Mobility | Benefits | Corporate Payments | Total WEX Inc. | ||||||||||||||||||||||||||||||||||||||||||||
| Three months ended September 30, | |||||||||||||||||||||||||||||||||||||||||||||||
| 2025 | 2024 | 2025 | 2024 | 2025 | 2024 | 2025 | 2024 | ||||||||||||||||||||||||||||||||||||||||
| Reported revenue | $ | 360.8 | $ | 357.2 | $ | 198.1 | $ | 181.5 | $ | 132.8 | $ | 126.9 | $ | 691.8 | $ | 665.5 | |||||||||||||||||||||||||||||||
FX impact (favorable) / unfavorable |
$ | (0.9) | $ | — | $ | (1.9) | $ | (2.7) | |||||||||||||||||||||||||||||||||||||||
| PPG impact (favorable) / unfavorable | $ | 6.0 | $ | — | $ | — | $ | 6.0 | |||||||||||||||||||||||||||||||||||||||
| Nine months ended September 30, | |||||||||||||||||||||||||||||||||||||||||||||||
| 2025 | 2024 | 2025 | 2024 | 2025 | 2024 | 2025 | 2024 | ||||||||||||||||||||||||||||||||||||||||
| Reported revenue | $ | 1,040.8 | $ | 1,055.6 | $ | 592.5 | $ | 552.5 | $ | 354.5 | $ | 383.5 | $ | 1,987.9 | $ | 1,991.6 | |||||||||||||||||||||||||||||||
| FX impact (favorable) / unfavorable | $ | (0.4) | $ | — | $ | (1.7) | $ | (2.1) | |||||||||||||||||||||||||||||||||||||||
| PPG impact (favorable) / unfavorable | $ | 30.4 | $ | — | $ | — | $ | 30.4 | |||||||||||||||||||||||||||||||||||||||
Segment Estimated Adjusted Net Income Attributable to Shareholders Impact |
|||||||||||||||||||||||||||||||||||
| Mobility | Benefits | Corporate Payments | |||||||||||||||||||||||||||||||||
| Three months ended September 30, | |||||||||||||||||||||||||||||||||||
| 2025 | 2024 | 2025 | 2024 | 2025 | 2024 | ||||||||||||||||||||||||||||||
FX impact (favorable) / unfavorable |
$ | — | $ | — | $ | — | $ | — | $ | (1.2) | $ | — | |||||||||||||||||||||||
| PPG impact (favorable) / unfavorable | $ | 3.7 | $ | — | $ | — | $ | — | $ | — | $ | — | |||||||||||||||||||||||
| Nine months ended September 30, | |||||||||||||||||||||||||||||||||||
| 2025 | 2024 | 2025 | 2024 | 2025 | 2024 | ||||||||||||||||||||||||||||||
| FX impact (favorable) / unfavorable | $ | (0.6) | $ | — | $ | (0.3) | $ | — | $ | (1.6) | $ | — | |||||||||||||||||||||||
| PPG impact (favorable) / unfavorable | $ | 19.0 | $ | — | $ | — | $ | — | $ | — | $ | — | |||||||||||||||||||||||
|
Exhibit 3
Selected Other Metrics
(in millions, except rate statistics)
(unaudited)
| |||||||||||||||||
| Q3 2025 | Q2 2025 | Q1 2025 | Q4 2024 |
Q3 2024 | |||||||||||||
| Mobility: | |||||||||||||||||
Payment processing transactions (1) |
140.0 | 139.2 | 134.5 | 138.5 | 146.5 | ||||||||||||
Payment processing gallons of fuel (2) |
3,639.8 | 3,625.4 | 3,527.7 | 3,600.7 | 3,730.5 | ||||||||||||
| Average US fuel price (US$ / gallon) | $ | 3.38 | $ | 3.28 | $ | 3.32 | $ | 3.25 | $ | 3.45 | |||||||
Payment processing $ of fuel (3) |
$ | 12,641.4 | $ | 12,216.2 | $ | 12,017.9 | $ | 12,003.4 | $ | 13,227.5 | |||||||
Net payment processing rate (4) |
1.33 | % | 1.31 | % | 1.30 | % | 1.36 | % | 1.38 | % | |||||||
| Payment processing revenue | $ | 168.2 | $ | 160.4 | $ | 156.4 | $ | 163.4 | $ | 183.2 | |||||||
Net late fee rate (5) |
0.53 | % | 0.54 | % | 0.53 | % | 0.57 | % | 0.45 | % | |||||||
Late fee revenue (6) |
$ | 67.2 | $ | 65.9 | $ | 63.7 | $ | 68.4 | $ | 59.0 | |||||||
Corporate Payments: |
|||||||||||||||||
Purchase volume (7) |
$ | 23,176.6 | $ | 20,496.8 | $ | 17,285.2 | $ | 16,541.3 | $ | 23,394.4 | |||||||
Net interchange rate (8) |
0.47 | % | 0.48 | % | 0.50 | % | 0.52 | % | 0.45 | % | |||||||
| Payment solutions processing revenue | $ | 109.7 | $ | 97.7 | $ | 85.7 | $ | 85.5 | $ | 104.8 | |||||||
Benefits: |
|||||||||||||||||
Average number of SaaS accounts (9) |
21.5 | 21.2 | 21.5 | 20.4 | 20.3 | ||||||||||||
Purchase volume (10) |
$ | 1,770.5 | $ | 2,002.6 | $ | 2,329.9 | $ | 1,617.1 | $ | 1,645.7 | |||||||
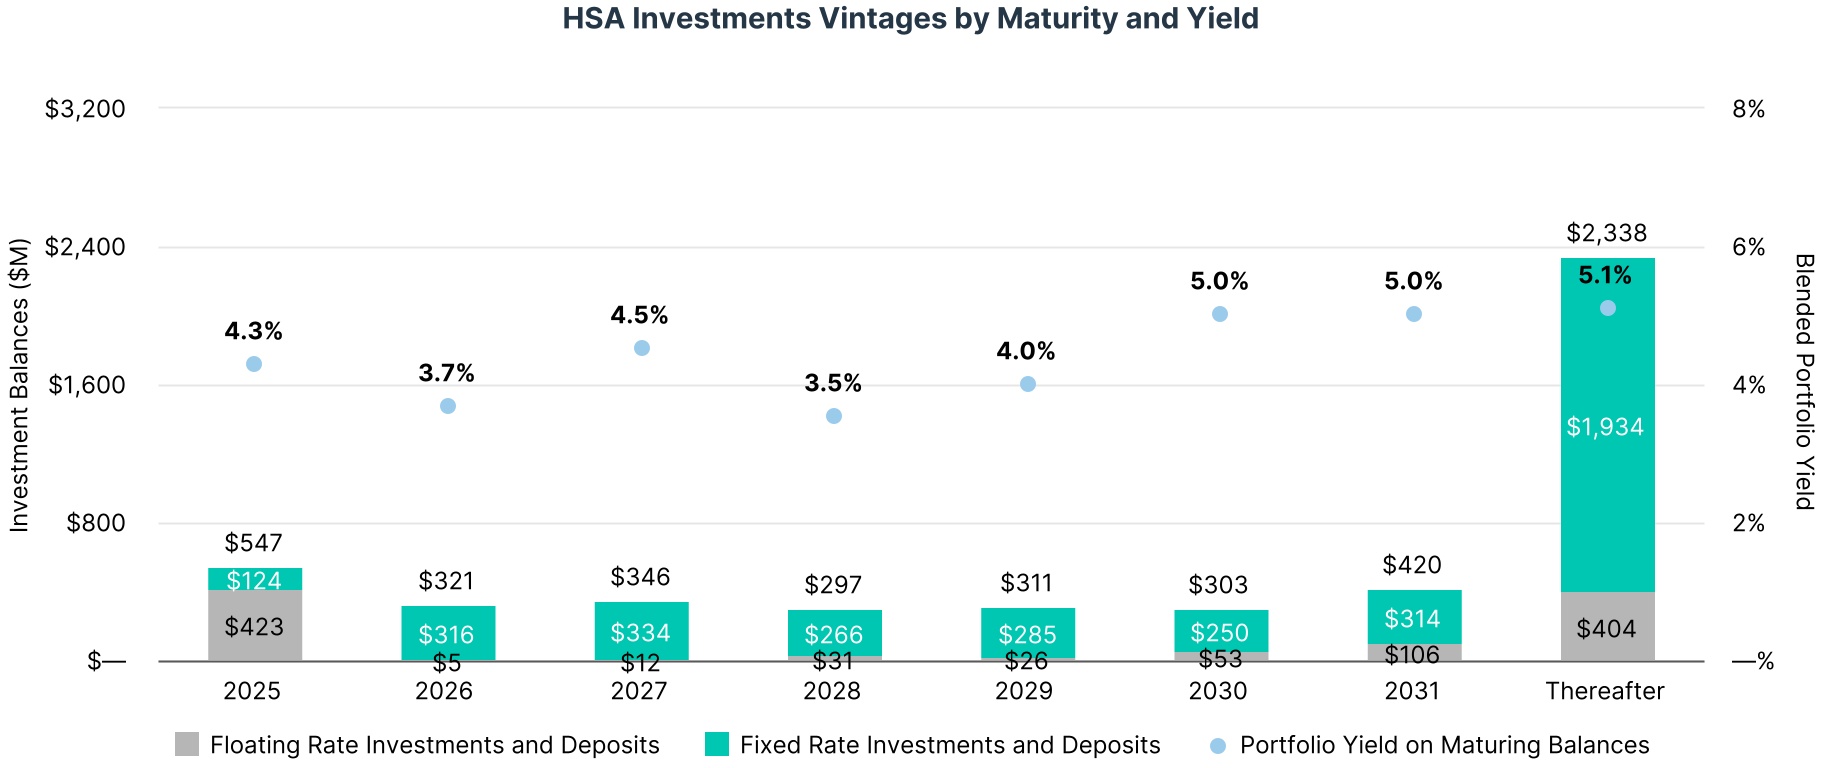
| Average HSA custodial cash assets | $ | 4,808.5 | $ | 4,705.4 | $ | 4,608.9 | $ | 4,366.0 | $ | 4,315.0 | |||||||
|
Exhibit 4
Segment Revenue Information
(in millions)
(unaudited)
| |||||||||||||||||||||||||||||||||||||||||||||||
| Three months ended September 30, | Increase (decrease) | Nine months ended September 30, | Increase (decrease) | ||||||||||||||||||||||||||||||||||||||||||||
| Mobility | 2025 | 2024 | Amount | Percent | 2025 | 2024 | Amount | Percent | |||||||||||||||||||||||||||||||||||||||
| Revenues | |||||||||||||||||||||||||||||||||||||||||||||||
| Payment processing revenue | $ | 168.2 | $ | 183.2 | $ | (15.0) | (8.2) | % | $ | 484.9 | $ | 531.1 | $ | (46.2) | (8.7) | % | |||||||||||||||||||||||||||||||
| Account servicing revenue | 53.7 | 49.0 | 4.7 | 9.6 | % | 155.6 | 145.2 | 10.4 | 7.2 | % | |||||||||||||||||||||||||||||||||||||
| Finance fee revenue | 82.9 | 70.2 | 12.7 | 18.1 | % | 238.1 | 217.9 | 20.2 | 9.3 | % | |||||||||||||||||||||||||||||||||||||
| Other revenue | 56.0 | 54.7 | 1.3 | 2.4 | % | 162.2 | 161.4 | 0.8 | 0.5 | % | |||||||||||||||||||||||||||||||||||||
| Total revenues | $ | 360.8 | $ | 357.2 | $ | 3.7 | 1.0 | % | $ | 1,040.8 | $ | 1,055.6 | $ | (14.8) | (1.4) | % | |||||||||||||||||||||||||||||||
| Three months ended September 30, | Increase (decrease) | Nine months ended September 30, | Increase (decrease) | ||||||||||||||||||||||||||||||||||||||||||||
| Corporate Payments | 2025 | 2024 | Amount | Percent | 2025 | 2024 | Amount | Percent | |||||||||||||||||||||||||||||||||||||||
| Revenues | |||||||||||||||||||||||||||||||||||||||||||||||
| Payment processing revenue | $ | 109.7 | $ | 104.8 | $ | 4.9 | 4.7 | % | $ | 293.1 | $ | 324.2 | $ | (31.1) | (9.6) | % | |||||||||||||||||||||||||||||||
| Account servicing revenue | 18.3 | 15.5 | 2.8 | 18.2 | % | 47.0 | 35.8 | 11.2 | 31.3 | % | |||||||||||||||||||||||||||||||||||||
| Finance fee revenue | 0.3 | 0.2 | — | NM | 1.0 | 0.4 | 0.7 | NM | |||||||||||||||||||||||||||||||||||||||
| Other revenue | 4.5 | 6.4 | (1.9) | (29.2) | % | 13.4 | 23.1 | (9.7) | (42.1) | % | |||||||||||||||||||||||||||||||||||||
| Total revenues | $ | 132.8 | $ | 126.9 | $ | 5.9 | 4.7 | % | $ | 354.5 | $ | 383.5 | $ | (29.0) | (7.6) | % | |||||||||||||||||||||||||||||||
| Three months ended September 30, | Increase (decrease) | Nine months ended September 30, | Increase (decrease) | ||||||||||||||||||||||||||||||||||||||||||||
| Benefits | 2025 | 2024 | Amount | Percent | 2025 | 2024 | Amount | Percent | |||||||||||||||||||||||||||||||||||||||
| Revenues | |||||||||||||||||||||||||||||||||||||||||||||||
| Payment processing revenue | $ | 23.8 | $ | 21.9 | $ | 1.9 | 8.7 | % | $ | 80.8 | $ | 75.0 | $ | 5.8 | 7.7 | % | |||||||||||||||||||||||||||||||
| Account servicing revenue | 113.3 | 110.0 | 3.2 | 2.9 | % | 339.7 | 335.5 | 4.2 | 1.3 | % | |||||||||||||||||||||||||||||||||||||
| Finance fee revenue | — | 0.1 | — | NM | 0.1 | 0.3 | (0.1) | NM | |||||||||||||||||||||||||||||||||||||||
| Other revenue | 61.0 | 49.4 | 11.6 | 23.4 | % | 172.0 | 141.8 | 30.2 | 21.3 | % | |||||||||||||||||||||||||||||||||||||
| Total revenues | $ | 198.1 | $ | 181.5 | $ | 16.7 | 9.2 | % | $ | 592.5 | $ | 552.5 | $ | 40.0 | 7.2 | % | |||||||||||||||||||||||||||||||
|
Exhibit 5
Segment Adjusted Operating Income and Adjusted Operating Income Margin Information
(in millions)
(unaudited)
| |||||||||||||||||||||||
| Segment Adjusted Operating Income | Segment Adjusted Operating Income Margin (1) |
||||||||||||||||||||||
| Three Months Ended September 30, | Three Months Ended September 30, | ||||||||||||||||||||||
| 2025 | 2024 | 2025 | 2024 | ||||||||||||||||||||
| Mobility | $ | 146.7 | $ | 167.1 | 40.7 | % | 46.8 | % | |||||||||||||||
| Corporate Payments | 63.8 | 71.5 | 48.0 | % | 56.4 | % | |||||||||||||||||
| Benefits | 86.7 | 78.4 | 43.8 | % | 43.2 | % | |||||||||||||||||
| Total segment adjusted operating income | $ | 297.2 | $ | 317.1 | 43.0 | % | 47.6 | % | |||||||||||||||
| Segment Adjusted Operating Income | Segment Adjusted Operating Income Margin(1) |
||||||||||||||||||||||
| Nine Months Ended September 30, | Nine Months Ended September 30, | ||||||||||||||||||||||
| 2025 | 2024 | 2025 | 2024 | ||||||||||||||||||||
| Mobility | $ | 412.2 | $ | 452.4 | 39.6 | % | 42.9 | % | |||||||||||||||
| Corporate Payments | 153.7 | 210.5 | 43.4 | % | 54.9 | % | |||||||||||||||||
| Benefits | 258.5 | 229.0 | 43.6 | % | 41.4 | % | |||||||||||||||||
| Total segment adjusted operating income | $ | 824.4 | $ | 891.9 | 41.5 | % | 44.8 | % | |||||||||||||||
| Three Months Ended September 30, | Nine Months Ended September 30, | ||||||||||||||||||||||
| 2025 | 2024 | 2025 | 2024 | ||||||||||||||||||||
| Adjusted operating income | $ | 273.5 | $ | 293.0 | $ | 750.3 | $ | 818.1 | |||||||||||||||
Adjusted operating income margin (1) |
39.5 | % | 44.0 | % | 37.7 | % | 41.1 | % | |||||||||||||||
 .
.| (Unaudited) | For the three months ended | For the twelve months ended | |||||||||||||||||||||||||||||||||
| (in millions except per share amounts) | 9/30/23 | 12/31/23 | 3/31/24 | 6/30/24 | 9/30/24 | 12/31/24 | 3/31/25 | 6/30/25 | 9/30/25 | 12/31/23 | 12/31/24 | ||||||||||||||||||||||||
| Revenues | $ | 651.4 | $ | 663.3 | $ | 652.7 | $ | 673.5 | $ | 665.5 | $ | 636.5 | $ | 636.6 | $ | 659.6 | $ | 691.8 | $ | 2,548.0 | $ | 2,628.1 | |||||||||||||
| Y/Y Change | 5.7 | % | 7.2 | % | 6.7 | % | 8.4 | % | 2.2 | % | (4.0) | % | (2.5) | % | (2.1) | % | 3.9 | % | 8.4 | % | 3.1 | % | |||||||||||||
| FX Impact vs Prior Year1 | $ | (5.3) | $ | (0.3) | $ | (0.7) | $ | 0.8 | $ | (2.2) | $ | 1.3 | $ | 2.5 | $ | (1.9) | $ | (2.7) | $ | (1.7) | $ | (0.8) | |||||||||||||
PPG Impact vs Prior Year1 |
$ | 31.9 | $ | 24.9 | $ | 20.5 | $ | 5.4 | $ | 21.2 | $ | 26.6 | $ | 8.5 | $ | 15.9 | $ | 6.0 | $ | 108.4 | $ | 73.8 | |||||||||||||
| PPG and FX % Impact on Revenue vs Prior Year | (4.3) | % | (4.0) | % | (3.2) | % | (1.0) | % | (2.9) | % | (4.2) | % | (1.7) | % | (2.1) | % | (0.5) | % | (4.5) | % | (2.9) | % | |||||||||||||
GAAP Income per Diluted Share2 |
$ | 0.42 | $ | 1.98 | $ | 1.55 | $ | 1.83 | $ | 2.52 | $ | 1.60 | $ | 1.81 | $ | 1.98 | $ | 2.30 | $ | 6.16 | $ | 7.50 | |||||||||||||
| Y/Y Change3 | NM | (2.0) | % | (0.6) | % | (16.8) | % | NM | (19.2) | % | 16.8 | % | 8.2 | % | (8.7) | % | 36.9 | % | 21.8 | % | |||||||||||||||
ANI per Diluted Share2 |
$ | 4.05 | $ | 3.82 | $ | 3.46 | $ | 3.91 | $ | 4.35 | $ | 3.57 | $ | 3.51 | $ | 3.95 | $ | 4.59 | $ | 14.81 | $ | 15.28 | |||||||||||||
| Y/Y Change | 15.4 | % | 11.0 | % | 4.5 | % | 7.7 | % | 7.4 | % | (6.5) | % | 1.4 | % | 1.0 | % | 5.5 | % | 9.5 | % | 3.2 | % | |||||||||||||
FX Impact per Share vs Prior Year1 |
$ | (0.06) | $ | 0.04 | $ | — | $ | — | $ | (0.05) | $ | 0.01 | $ | — | $ | (0.03) | $ | (0.03) | $ | — | $ | (0.04) | |||||||||||||
PPG Impact per Share vs Prior Year1 |
$ | 0.49 | $ | 0.39 | $ | 0.33 | $ | 0.09 | $ | 0.33 | $ | 0.44 | $ | 0.13 | $ | 0.29 | $ | 0.11 | $ | 1.62 | $ | 1.19 | |||||||||||||
| PPG and FX % Impact on Adjusted Earnings Per Share vs Prior Year | (12.3) | % | (12.5) | % | (10.0) | % | (2.5) | % | (6.9) | % | (11.8) | % | (3.7) | % | (6.7) | % | (1.6) | % | (12.0) | % | (7.8) | % | |||||||||||||
| (Unaudited) | For the three months ended 9/30/25 | For the twelve months ended 12/31/24 | |||||||||||||||||||||||||||
| Mobility | Benefits | Corporate Payments |
Total | Mobility | Benefits | Corporate Payments | Total | ||||||||||||||||||||||
| Revenues | $ | 360.8 | $ | 198.1 | $ | 132.8 | $ | 691.8 | $ | 1,400.8 | $ | 739.5 | $ | 487.8 | $ | 2,628.1 | |||||||||||||
| Segment Revenue % of Total | 52.2 | % | 28.6 | % | 19.2 | % | 53.3 | % | 28.1 | % | 18.6 | % | |||||||||||||||||
| Y/Y Change | 1.0 | % | 9.2 | % | 4.7 | % | 3.9 | % | 1.3% | 10.6% | -1.8% | 3.1% | |||||||||||||||||
| GAAP Operating Income | $ | 111.5 | $ | 56.9 | $ | 52.0 | $ | 183.6 | $ | 469.1 | $ | 173.3 | $ | 203.5 | $ | 686.3 | |||||||||||||
| GAAP Operating Income Margin | 30.9 | % | 28.7 | % | 39.2 | % | 26.5 | % | 33.5 | % | 23.4 | % | 41.7 | % | 26.1 | % | |||||||||||||
| Adjusted Operating Income | $ | 146.7 | $ | 86.7 | $ | 63.8 | $ | 273.5 | $ | 598.5 | $ | 307.0 | $ | 256.2 | $ | 1,059.7 | |||||||||||||
| Adjusted Operating Income Margin4 | 40.7 | % | 43.8 | % | 48.0 | % | 39.5 | % | 42.7 | % | 41.5 | % | 52.5 | % | 40.3 | % | |||||||||||||
 |
Mobility Segment | ||||
| (Unaudited) | For the three months ended | For the twelve months ended | ||||||||||||||||||||||||||||||||||||
| 9/30/23 | 12/31/23 | 3/31/24 | 6/30/24 | 9/30/24 | 12/31/24 | 3/31/25 | 6/30/25 | 9/30/25 | 12/31/23 | 12/31/24 | ||||||||||||||||||||||||||||
| Revenues | ||||||||||||||||||||||||||||||||||||||
| Total Revenues | $ | 350.1 | $ | 350.1 | $ | 339.0 | $ | 359.6 | $ | 357.2 | $ | 345.2 | $ | 333.8 | $ | 346.2 | $ | 360.8 | $ | 1,382.7 | $ | 1,400.8 | ||||||||||||||||
| Y/Y Change | (7.4) | % | (4.7) | % | (1.0) | % | 5.7 | % | 2.0 | % | (1.4) | % | (1.5) | % | (3.7) | % | 1.0 | % | (4.2) | % | 1.3 | % | ||||||||||||||||
| FX Impact6 | $ | (0.6) | $ | (0.9) | $ | 0.1 | $ | 0.4 | $ | (0.5) | $ | 0.1 | $ | 1.3 | $ | (0.8) | $ | (0.9) | $ | 1.7 | $ | — | ||||||||||||||||
PPG Impact6 |
$ | 31.9 | $ | 24.9 | $ | 20.5 | $ | 5.4 | $ | 21.2 | $ | 26.6 | $ | 8.5 | $ | 15.9 | $ | 6.0 | $ | 108.4 | $ | 73.8 | ||||||||||||||||
| PPG and FX % Impact on Revenue | (8.3) | % | (6.5) | % | (6.0) | % | (1.7) | % | (5.9) | % | (7.6) | % | (2.9) | % | (4.2) | % | (1.4) | % | (7.6) | % | (5.3) | % | ||||||||||||||||
| Operating Income (GAAP) | $ | 125.0 | $ | 117.3 | $ | 99.3 | $ | 119.2 | $ | 136.5 | $ | 114.1 | $ | 99.4 | $ | 101.1 | $ | 111.5 | $ | 472.8 | $ | 469.1 | ||||||||||||||||
| Operating Income (GAAP) Margin | 35.7 | % | 33.5 | % | 29.3 | % | 33.1 | % | 38.2 | % | 33.1 | % | 29.8 | % | 29.2 | % | 30.9 | % | 34.2 | % | 33.5 | % | ||||||||||||||||
| Adjusted Operating Income | $ | 159.6 | $ | 150.7 | $ | 131.0 | $ | 154.3 | $ | 167.1 | $ | 146.1 | $ | 131.4 | $ | 134.0 | $ | 146.7 | $ | 599.4 | $ | 598.5 | ||||||||||||||||
| Adjusted Operating Income Margin7 | 45.6 | % | 43.0 | % | 38.6 | % | 42.9 | % | 46.8 | % | 42.3 | % | 39.4 | % | 38.7 | % | 40.7 | % | 43.3 | % | 42.7 | % | ||||||||||||||||
| Select Other Metrics | ||||||||||||||||||||||||||||||||||||||
| Total Volume | $ | 22,220 | $ | 21,057 | $ | 19,943 | $ | 20,849 | $ | 20,137 | $ | 18,610 | $ | 18,751 | $ | 18,833 | $ | 19,684 | $ | 84,721 | $ | 79,539 | ||||||||||||||||
| Y/Y Change | (12.5) | % | (12.2) | % | (6.0) | % | 3.1 | % | (9.4) | % | (11.6) | % | (6.0) | % | (9.7) | % | (2.3) | % | (14.3) | % | (6.1) | % | ||||||||||||||||
| Payment Processing Transactions | 144.6 | 138.1 | 136.9 | 144.9 | 146.5 | 138.5 | 134.5 | 139.2 | 140.0 | 562.6 | 566.8 | |||||||||||||||||||||||||||
| Y/Y Change | (0.4) | % | (0.8) | % | (0.4) | % | 1.8 | % | 1.3 | % | 0.3 | % | (1.8) | % | (3.9) | % | (4.5) | % | 0.4 | % | 0.7 | % | ||||||||||||||||
| Payment Processing $ of Fuel | $ | 14,945 | $ | 13,814 | $ | 13,061 | $ | 13,729 | $ | 13,227 | $ | 12,003 | $ | 12,018 | $ | 12,216 | $ | 12,641 | $ | 56,684 | $ | 52,021 | ||||||||||||||||
| Y/Y Change | (13.1) | % | (13.3) | % | (7.7) | % | (0.4) | % | (11.5) | % | (13.1) | % | (8.0) | % | (11.0) | % | (4.4) | % | (14.3) | % | (8.2) | % | ||||||||||||||||
| Average U.S. Fuel Price | $ | 3.97 | $ | 3.76 | $ | 3.56 | $ | 3.62 | $ | 3.45 | $ | 3.25 | $ | 3.32 | $ | 3.28 | $ | 3.38 | $ | 3.82 | $ | 3.47 | ||||||||||||||||
| Y/Y Change | (12.6) | % | (13.4) | % | (7.8) | % | (1.6) | % | (13.1) | % | (13.6) | % | (6.7) | % | (9.5) | % | (2.1) | % | (14.3) | % | (9.2) | % | ||||||||||||||||
| Payment Processing Gallons | 3,687 | 3,579 | 3,568 | 3,694 | 3,731 | 3,601 | 3,528 | 3,625 | 3,640 | 14,507 | 14,593 | |||||||||||||||||||||||||||
| Y/Y Change | (1.1) | % | (0.9) | % | (0.3) | % | 0.8 | % | 1.2 | % | 0.6 | % | (1.1) | % | (1.9) | % | (2.4) | % | (0.5) | % | 0.6 | % | ||||||||||||||||
| Payment Processing Revenue | $ | 177.1 | $ | 174.3 | $ | 170.7 | $ | 177.2 | $ | 183.2 | $ | 163.4 | $ | 156.4 | $ | 160.4 | $ | 168.2 | $ | 695.0 | $ | 694.5 | ||||||||||||||||
| Y/Y Change | (6.1) | % | (1.7) | % | (0.5) | % | 3.0 | % | 3.4 | % | (6.3) | % | (8.4) | % | (9.5) | % | (8.2) | % | (3.5) | % | (0.1) | % | ||||||||||||||||
| Net Payment Processing Rate | 1.18 | % | 1.26 | % | 1.31 | % | 1.29 | % | 1.38 | % | 1.36 | % | 1.30 | % | 1.31 | % | 1.33 | % | 1.23 | % | 1.34 | % | ||||||||||||||||
| Net Late Fee Revenue | $66.4 | $69.0 | $60.4 | $67.3 | $59.0 | $68.4 | $63.7 | $65.9 | $67.2 | $271.8 | $255.1 | |||||||||||||||||||||||||||
| Y/Y Change | (20.2) | % | (23.3) | % | (14.0) | % | 1.5 | % | (11.1) | % | (0.9) | % | 5.5 | % | (2.0) | % | 13.9 | % | (11.5) | % | (6.1) | % | ||||||||||||||||
| Net Late Fee Rate | 0.44 | % | 0.50 | % | 0.46 | % | 0.49 | % | 0.45 | % | 0.57 | % | 0.53 | % | 0.54 | % | 0.53 | % | 0.48 | % | 0.49 | % | ||||||||||||||||
| Credit Losses, in Basis Points | 7 | 8 | 15 | 14 | 6 | 11 | 12 | 14 | 12 | 15 | 12 | |||||||||||||||||||||||||||
 |
Benefits Segment | ||||
| (Unaudited) | For the three months ended | For the twelve months ended | ||||||||||||||||||||||||||||||||||||
| 9/30/23 | 12/31/23 | 3/31/24 | 6/30/24 | 9/30/24 | 12/31/24 | 3/31/25 | 6/30/25 | 9/30/25 | 12/31/23 | 12/31/24 | ||||||||||||||||||||||||||||
| Revenues | ||||||||||||||||||||||||||||||||||||||
| Total Revenues | $ | 166.1 | $ | 178.2 | $ | 191.2 | $ | 179.8 | $ | 181.5 | $ | 186.9 | $199.3 | $195.1 | $198.1 | $ | 668.4 | $ | 739.5 | |||||||||||||||||||
| Y/Y Change | 33.9 | % | 26.7 | % | 15.9 | % | 12.9 | % | 9.3 | % | 4.9 | % | 4.2 | % | 8.5 | % | 9.2 | % | 32.5 | % | 10.6 | % | ||||||||||||||||
| Operating Income (GAAP) | $ | 26.5 | $ | 19.0 | $ | 46.7 | $ | 32.5 | $ | 45.2 | $ | 48.8 | $ | 56.5 | $ | 53.5 | $ | 56.9 | $ | 114.8 | $ | 173.3 | ||||||||||||||||
| Operating Income (GAAP) Margin | 16.0 | % | 10.7 | % | 24.4 | % | 18.1 | % | 24.9 | % | 26.1 | % | 28.3 | % | 27.4 | % | 28.7 | % | 17.2 | % | 23.4 | % | ||||||||||||||||
| Adjusted Operating Income | $ | 58.8 | $ | 59.2 | $ | 79.4 | $ | 71.1 | $ | 78.4 | $ | 78.0 | $ | 86.9 | $ | 84.9 | $ | 86.7 | $ | 241.8 | $ | 307.0 | ||||||||||||||||
| Adjusted Operating Income Margin8 | 35.4 | % | 33.2 | % | 41.5 | % | 39.6 | % | 43.2 | % | 41.7 | % | 43.6 | % | 43.5 | % | 43.8 | % | 36.2 | % | 41.5 | % | ||||||||||||||||
| Select Other Metrics | ||||||||||||||||||||||||||||||||||||||
| Average SaaS Accounts | 19.9 | 19.9 | 20.3 | 20.0 | 20.3 | 20.4 | 21.5 | 21.2 | 21.5 | 19.9 | 20.3 | |||||||||||||||||||||||||||
| Y/Y Change | 9.2 | % | 7.6 | % | — | % | 2.6 | % | 2.0 | % | 2.5 | % | 6.1 | % | 6.0 | % | 6.0 | % | 10.6 | % | 2.0 | % | ||||||||||||||||
| Total Volume | $ | 2,880 | $ | 2,823 | $ | 3,840 | $ | 3,496 | $ | 3,129 | $ | 3,135 | $ | 4,196 | $ | 3,729 | 3,276 | $ | 12,442 | $ | 13,600 | |||||||||||||||||
| Y/Y Change | 9.3 | % | 8.7 | % | 9.7 | % | 8.0 | % | 8.6 | % | 11.1 | % | 9.3 | % | 6.7 | % | 4.7 | % | 11.0 | % | 9.3 | % | ||||||||||||||||
| Purchase Volume | $ | 1,501 | $ | 1,510 | $ | 2,115 | $ | 1,865 | $ | 1,646 | $ | 1,617 | $ | 2,330 | $ | 2,003 | $ | 1,771 | $ | 6,656 | $ | 7,243 | ||||||||||||||||
| Y/Y Change | 11.2 | % | 9.9 | % | 9.6 | % | 8.7 | % | 9.7 | % | 7.1 | % | 10.2 | % | 7.4 | % | 7.6 | % | 13.4 | % | 8.8 | % | ||||||||||||||||
| Average HSA Custodial Cash Assets | $ | 3,909 | $ | 3,925 | $ | 4,209 | $ | 4,231 | $ | 4,315 | $ | 4,366 | $ | 4,609 | $ | 4,705 | $ | 4,808 | 3,869 | 4,280 | ||||||||||||||||||
| Y/Y Change | 23.0 | % | 13.1 | % | 11.8 | % | 9.1 | % | 10.4 | % | 11.2 | % | 9.5 | % | 11.2 | % | 11.4 | % | 21.8 | % | 10.6 | % | ||||||||||||||||
| Custodial Investment Revenue - in Other Revenue9 | $ | 29.7 | $ | 32.2 | $ | 37.5 | $ | 40.0 | $ | 41.2 | $ | 44.3 | $ | 44.6 | $ | 48.2 | $ | 51.5 | $ | 109.0 | $ | 163.0 | ||||||||||||||||
| Custodial Investment Revenue - in Account Servicing Revenue10 | $ | 14.3 | $ | 13.1 | $ | 13.0 | $ | 11.9 | $ | 12.5 | $ | 9.1 | $ | 11.3 | $ | 9.6 | $ | 10.2 | $ | 59.4 | $ | 46.5 | ||||||||||||||||
| Custodial Investment Revenue - Total | $ | 44.0 | $ | 45.3 | $ | 50.5 | $ | 51.9 | $ | 53.7 | $ | 53.4 | $ | 55.8 | $ | 57.8 | $ | 61.7 | $ | 168.5 | $ | 209.5 | ||||||||||||||||
| Y/Y Change | 177.0 | % | 77.0 | % | 35.8 | % | 23.6 | % | 22.0 | % | 17.9 | % | 10.6 | % | 11.4 | % | 14.9 | % | 175.8 | % | 24.3 | % | ||||||||||||||||
| HSA Yield11 | 4.51 | % | 4.62 | % | 4.80 | % | 4.91 | % | 4.98 | % | 4.89 | % | 4.85 | % | 4.92 | % | 5.13 | % | 4.36 | % | 4.90 | % | ||||||||||||||||
 |
Corporate Payments Segment | ||||
| For the three months ended | For the twelve months ended | |||||||||||||||||||||||||||||||||||||
| 9/30/23 | 12/31/23 | 3/31/24 | 6/30/24 | 9/30/24 | 12/31/24 | 3/31/25 | 6/30/25 | 9/30/25 | 12/31/23 | 12/31/24 | ||||||||||||||||||||||||||||
| Revenues | ||||||||||||||||||||||||||||||||||||||
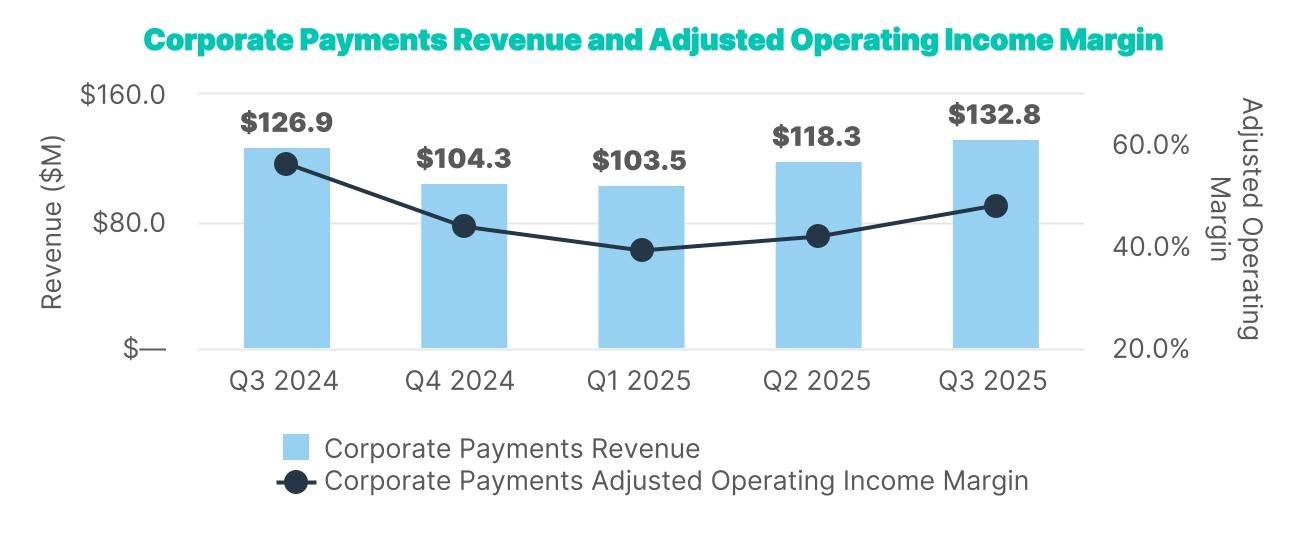
| Total Revenues | $ | 135.2 | $ | 135.0 | $ | 122.5 | $ | 134.1 | $ | 126.9 | $ | 104.3 | $ | 103.5 | $ | 118.3 | $ | 132.8 | $ | 496.9 | $ | 487.8 | ||||||||||||||||
| Y/Y Change | 18.6 | % | 22.0 | % | 16.9 | % | 10.0 | % | (6.1) | % | (22.7) | % | (15.5) | % | (11.8) | % | 4.7 | % | 23.5 | % | (1.8) | % | ||||||||||||||||
| FX Impact12 | $ | (4.7) | $ | 0.6 | $ | (0.9) | $ | 0.5 | $ | (1.7) | $ | 1.3 | $ | 1.3 | $ | (1.1) | $ | (1.9) | $ | (3.3) | $ | (0.9) | ||||||||||||||||
| Operating Income (GAAP) | $ | 69.6 | $ | 60.9 | $ | 51.1 | $ | 61.0 | $ | 56.1 | $ | 35.4 | $ | 27.2 | $ | 38.0 | $ | 52.0 | $ | 219.1 | $ | 203.5 | ||||||||||||||||
| Operating Income (GAAP) Margin | 51.5 | % | 45.1 | % | 41.7 | % | 45.5 | % | 44.2 | % | 33.9 | % | 26.3 | % | 32.1 | % | 39.1 | % | 44.1 | % | 41.7 | % | ||||||||||||||||
| Adjusted Operating Income | $ | 82.9 | $ | 78.8 | $ | 64.6 | $ | 74.4 | $ | 71.5 | $ | 45.7 | $ | 40.5 | $ | 49.5 | $ | 63.8 | $ | 277.2 | $ | 256.2 | ||||||||||||||||
| Adjusted Operating Income Margin13 | 61.3 | % | 58.4 | % | 52.7 | % | 55.5 | % | 56.4 | % | 43.9 | % | 39.1 | % | 41.9 | % | 48.0 | % | 55.8 | % | 52.5 | % | ||||||||||||||||
| Select Other Metrics | ||||||||||||||||||||||||||||||||||||||
| Total Volume | $ | 36,780 | $ | 31,971 | $ | 33,026 | $ | 35,792 | $ | 39,056 | $ | 30,833 | $ | 31,109 | $ | 36,939 | $ | 43,272 | $ | 128,168 | $ | 138,707 | ||||||||||||||||
| Y/Y Change | 24.6 | % | 22.0 | % | 19.7 | % | 12.5 | % | 6.2 | % | (3.6) | % | (5.8) | % | 3.2 | % | 10.8 | % | 26.1 | % | 8.2 | % | ||||||||||||||||
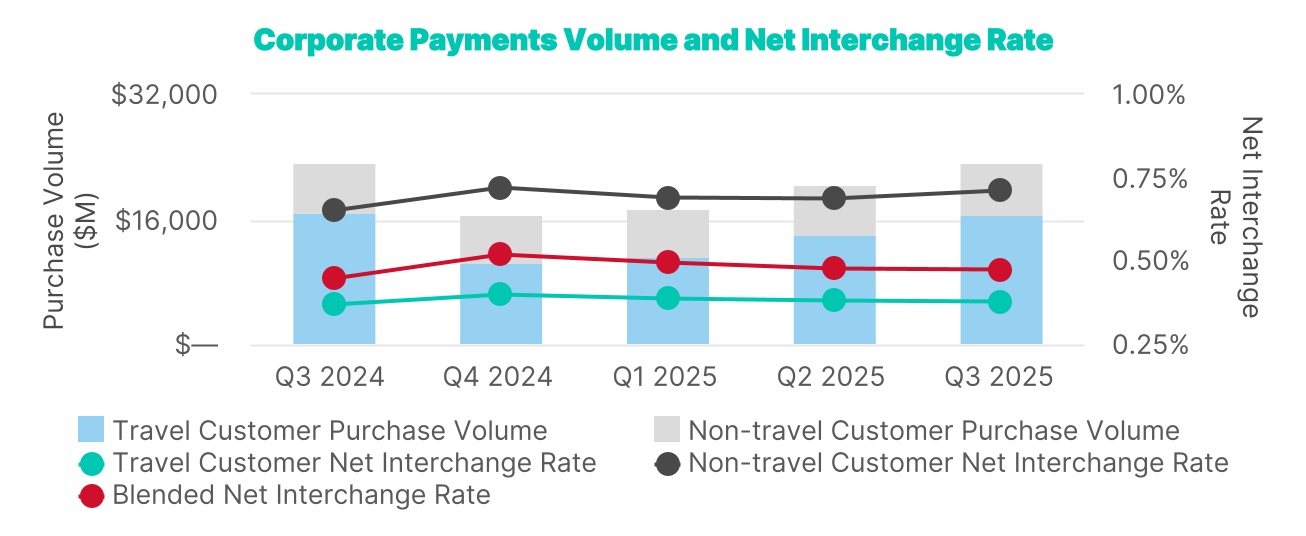
| Total Purchase Volume | $ | 27,860 | $ | 22,801 | $ | 23,948 | $ | 25,756 | $ | 23,394 | $ | 16,541 | $ | 17,285 | $ | 20,497 | $ | 23,177 | $ | 92,197 | $ | 89,640 | ||||||||||||||||
| Y/Y Change | 34.9 | % | 33.5 | % | 28.5 | % | 12.5 | % | (16.0) | % | (27.5) | % | (27.8) | % | (20.4) | % | (0.9) | % | 38.3 | % | (2.8) | % | ||||||||||||||||
| Net Interchange Rate | 0.42 | % | 0.52 | % | 0.43 | % | 0.45 | % | 0.45 | % | 0.52 | % | 0.50 | % | 0.48 | % | 0.47 | % | 0.46 | % | 0.46 | % | ||||||||||||||||
| Payment Solutions Processing Revenue | 115.7 | 117.4 | 103.2 | 116.2 | 104.8 | $ | 85.5 | $ | 85.7 | $ | 97.7 | $ | 109.7 | $ | 428.0 | $ | 409.7 | |||||||||||||||||||||
| Y/Y Change | 14.0 | % | 19.2 | % | 14.5 | % | 10.9 | % | (9.4) | % | (27.2) | % | (16.9) | % | (16.0) | % | 4.7 | % | 21.0 | % | (4.3) | % | ||||||||||||||||
| (in millions, except for leverage ratio) | 9/30/23 | 12/31/23 | 3/31/24 | 6/30/24 | 9/30/24 | 12/31/24 | 3/31/25 | 6/30/25 | 9/30/25 | ||||||||||||||||||||
| Cash and Cash Equivalents | $ | 958 | $ | 976 | $ | 780 | $ | 683 | $ | 535 | $ | 599 | $ | 610 | $ | 773 | $ | 813 | |||||||||||
| Accounts Receivable | 4,054 | 3,429 | 3,857 | 3,966 | 3,770 | 3,023 | 3,768 | 3,925 | 3,816 | ||||||||||||||||||||
| Long-Term Debt, Net | 2,650 | 2,828 | 3,082 | 2,960 | 3,143 | 3,082 | 4,100 | 3,909 | 3,719 | ||||||||||||||||||||
| Corporate Cash | $ | 170 | $ | 172 | $ | 176 | $ | 143 | $ | 123 | $ | 80 | $ | 163 | $ | 134 | $ | 128 | |||||||||||
| Available Liquidity14 | $ | 1,095 | $ | 903 | $ | 639 | $ | 947 | $ | 729 | $ | 735 | $ | 770 | $ | 916 | $ | 1,082 | |||||||||||
| Leverage Ratio15 | 2.4x | 2.5x | 2.6x | 2.5x | 2.6x | 2.6x | 3.5x | 3.4x | 3.25x | ||||||||||||||||||||
| Investment Securities at Cost16 | $ | 2,830 | $ | 3,102 | $ | 3,411 | $ | 3,438 | $ | 3,734 | $ | 3,875 | $ | 3,891 | $ | 4,180 | $ | 4,134 | |||||||||||
| (Unaudited) | For the three months ended | ||||||||||||||||||||||||||||
| (In millions) | 9/30/23 | 12/31/23 | 3/31/24 | 6/30/24 | 9/30/24 | 12/31/24 | 3/31/25 | 6/30/25 | 9/30/25 | ||||||||||||||||||||
| Operating Cash Flow, as reported | $ | 46.5 | $ | 761.9 | $ | (153.3) | $ | (7.0) | $ | 3.3 | $ | 638.4 | $ | (481.6) | $ | 264.6 | $ | 376.6 | |||||||||||
| Adjustments to operating cash flow, as reported | |||||||||||||||||||||||||||||
| Changes in WEX Bank Cash Balances | $ | (83.5) | $ | (23.6) | $ | 188.9 | $ | 69.6 | $ | 125.3 | $ | (104.7) | $ | 67.7 | $ | (182.5) | $ | (47.5) | |||||||||||
| Other | $ | — | $ | (50.0) | $ | 67.1 | $ | — | $ | — | $ | (33.1) | $ | 58.8 | $ | 1.6 | $ | 1.5 | |||||||||||
| Net Funding Activity | $ | 294.8 | $ | (214.4) | $ | 205.0 | $ | 214.8 | $ | 372.2 | $ | (139.3) | $ | 375.5 | $ | 495.6 | $ | (178.1) | |||||||||||
| Less: Purchases of Current Investment Securities, Net of Sales and Maturities | $ | (56.6) | $ | (256.8) | $ | (282.9) | $ | (25.6) | $ | (276.3) | $ | (153.2) | $ | 28.3 | $ | (350.3) | $ | 48.7 | |||||||||||
| Less: Capital Expenditures | $ | (36.4) | $ | (41.9) | $ | (34.0) | $ | (39.6) | $ | (35.0) | $ | (38.7) | $ | (32.6) | $ | (34.6) | $ | (35.0) | |||||||||||
| Adjusted Free Cash Flow | $ | 164.9 | $ | 175.2 | $ | (9.2) | $ | 212.2 | $ | 189.5 | $ | 169.5 | $ | 16.2 | $ | 194.3 | $ | 166.2 | |||||||||||
| Trailing Twelve Month Adjusted Free Cash Flow | $ | 601.7 | $ | 510.6 | $ | 605.0 | $ | 543.0 | $ | 567.8 | $ | 562.0 | $ | 587.4 | $ | 569.5 | $ | 546.2 | |||||||||||
| For the three months ended | |||||||||||||||||||||||||||||
| (In millions) | 9/30/23 | 12/31/23 | 3/31/24 | 6/30/24 | 9/30/24 19 |
12/31/24 | 3/31/25 | 6/30/25 | 9/30/25 | ||||||||||||||||||||
| Capital Expenditures | $ | 36.4 | $ | 41.9 | $ | 34.0 | $ | 39.6 | $ | 35.0 | $ | 38.7 | $ | 32.6 | $ | 34.6 | $ | 35.0 | |||||||||||
| Acquisitions20 | $ | 180.7 | $ | 246.3 | $ | 86.6 | $ | 5.1 | $ | 7.1 | $ | — | $ | 91.2 | $ | — | $ | — | |||||||||||
Share Repurchases19 |
$ | 50.0 | $ | 150.0 | $ | 73.6 | $ | 100.0 | $ | 370.0 | $ | 106.0 | $ | 790.0 | $ | — | $ | — | |||||||||||
| Capital Deployed | $ | 267.1 | $ | 438.2 | $ | 194.2 | $ | 144.7 | $ | 412.1 | $ | 144.7 | $ | 913.8 | $ | 34.6 | $ | 35.0 | |||||||||||
| (In millions) | For the three months ended | ||||||||||||||||||||||||||||
| 9/30/23 | 12/31/23 | 3/31/24 | 6/30/24 | 9/30/24 19 |
12/31/2024 | 03/31/25 | 06/30/25 | 09/30/25 | |||||||||||||||||||||
| Cash Spent Repurchasing Shares | $ | 50.0 | $ | 150.0 | $ | 73.6 | $ | 100.0 | $ | 370.0 | $ | 106.0 | $ | 790.0 | $ | — | $ | — | |||||||||||
| Cumulative Cash Spent | $ | 436.1 | $ | 586.2 | $ | 659.8 | $ | 759.8 | $ | 1,129.8 | $ | 1,235.8 | $ | 2,025.8 | $ | 2,025.8 | $ | 2,025.8 | |||||||||||
| Share Repurchased | 0.26 | 0.87 | 0.35 | 0.47 | 1.72 | 0.77 | 5.10 | — | — | ||||||||||||||||||||
| Cumulative Shares Repurchased Since 2022 | 2.71 | 3.58 | 3.93 | 4.39 | 6.12 | 6.89 | 11.99 | 11.99 | 11.99 | ||||||||||||||||||||
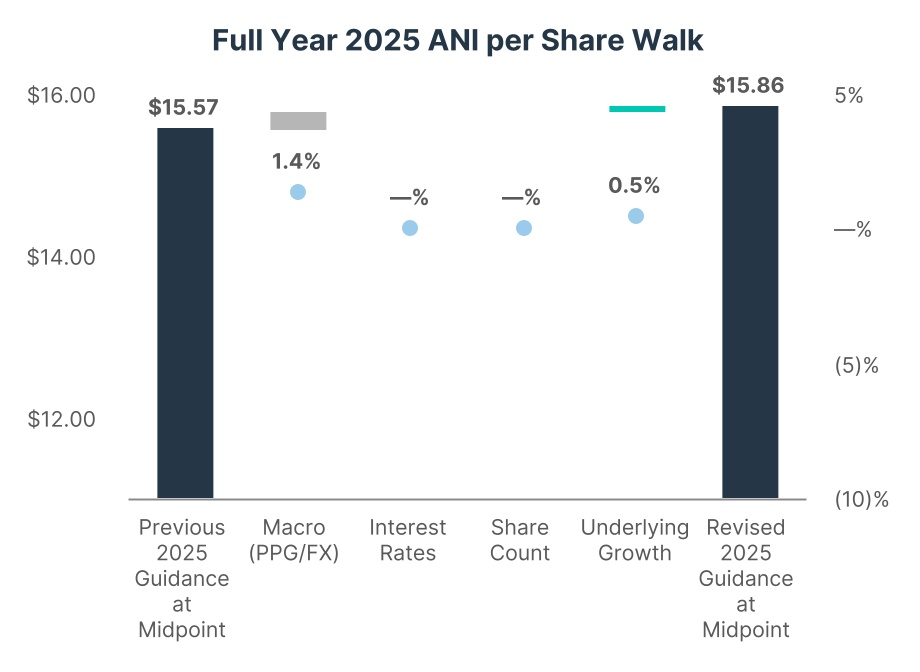
| Financial Guidance | Q4'25 | Full Year 2025 | |||||||||||||||||||||||||||
| Current Guidance | Current Guidance | Changes from Prior Guide at Midpoint | |||||||||||||||||||||||||||
| Low | High | Low | High | $ Change | % Change | Fuel Price Impact | |||||||||||||||||||||||
| Net Revenue, in millions | $ | 646 | $ | 666 | $ | 2,634 | $ | 2,654 | $ | 19 | 1 | % | $12 | ||||||||||||||||
| Adjusted Net Income per Diluted Share21 | $ | 3.76 | $ | 3.96 | $ | 15.76 | $ | 15.96 | $ | 0.29 | 2 | % | $0.21 | ||||||||||||||||
| Key Guidance Assumptions | Q4'25 | Full Year 2025 | |||||||||||||||||||||||||||
| Current Guidance | Current Guidance | Change from Prior Guide at Midpoint | % Change | ||||||||||||||||||||||||||
| Average U.S. Retail Fuel Prices per Gallon | $3.09 | $3.27 | $0.06 | 2% | |||||||||||||||||||||||||
| Mobility Credit Losses (bps) | 14 | - | 19 | 13 | - | 14 | -1 | (7)% | |||||||||||||||||||||
| Weighted Average Diluted Shares Outstanding, in millions | 34.9 | 35.9 | 0 | —% | |||||||||||||||||||||||||
| Price Per Gallon | Interest Rates | ||||||||||||||||
| Sensitivities | +$0.10/Gal | -$0.10/Gal | +100bps | -100bps | |||||||||||||
| Impact to Net Revenue, in millions (approximate) | $ | 20 | $ | (20) | $ | 40 | $ | (40) | |||||||||
| Impact to ANI per Share (approximate)22 | $ | 0.35 | $ | (0.35) | $ | (0.30) | $ | 0.35 | |||||||||

| Adjusted free cash flow | A non-GAAP measure calculated as cash flows from operating activities, adjusted for net purchases of current investment securities, capital expenditures, net Funding Activity, changes in WEX Bank cash balances, and certain other adjustments. | ||||
| Adjusted net income or ANI | A non-GAAP measure that adjusts net income (loss) to exclude all items excluded in segment adjusted operating income except unallocated corporate expenses, further excluding unrealized gains and losses on financial instruments, net foreign currency gains and losses, debt issuance cost amortization, tax related items and certain other non-operating items, as applicable depending on the period presented. | ||||
| ASR | Accelerated Share Repurchase | ||||
| Average number of SaaS accounts | Represents the average number of active consumer-directed health, COBRA, and billing accounts on our SaaS platforms. HSA accounts for which WEX Inc. serves as the non-bank custodian under designation by the U.S. Department of Treasury are included in this average. | ||||
| BTFP | The Federal Reserve Bank Term Funding Program, which provides liquidity to U.S. depository institutions. | ||||
| Company | WEX Inc. and all entities included in the consolidated financial statements. | ||||
| Convertible notes | Convertible senior unsecured notes due on July 15, 2027 in an aggregate principal amount of $310.0 million with a 6.5 percent interest rate, issued July 1, 2020, which were repurchased by the Company and canceled by the trustee at the instruction of the Company on August 11, 2023. | ||||
| Corporate cash | Calculated in accordance with the terms of our consolidated leverage ratio in the Company’s Amended and Restated Credit Agreement. | ||||
| Credit Agreement | Amended and Restated Credit Agreement entered into on April 1, 2021 (as amended from time to time) by and among the Company and certain of its subsidiaries, as borrowers, and Bank of America, N.A., as administrative agent on behalf of the lenders. | ||||
| FHLB | Federal Home Loan Bank | ||||
| Funding activity | Includes the change in net deposits, net advances from the FHLB, changes in participation debt, and changes in borrowings under the BTFP and borrowed federal funds. | ||||
| HSA | Health Savings Account | ||||
| Net interchange rate | Represents the percentage of the dollar value of each payment processing transaction that WEX records as revenue from merchants, less certain discounts given to customers and network fees. | ||||
| Net late fee rate | Net late fee rate represents late fee revenue as a percentage of fuel purchased by fleets that have a payment processing relationship with WEX. | ||||
| Net payment processing rate | The percentage of each payment processing $ of fuel that the Company records as revenue from merchants less certain discounts given to customers and network fees. | ||||
| Operating cash flow | Net cash provided by (used for) operating activities. | ||||
| Over-the-Road | Typically, heavy trucks traveling long distances. | ||||
| Payment processing $ of fuel | Total dollar value of the fuel purchased by fleets that have a payment processing relationship with WEX. | ||||
| Payment processing transactions | Total number of purchases made by fleets that have a payment processing relationship with the Company where the Company maintains the receivable for the total purchase. | ||||
| Purchase volume | Purchase volume in the Corporate Payments segment represents the total dollar value of all WEX-issued transactions that use WEX corporate card products and virtual card products. Purchase volume in the Benefits segment represents the total dollar value of all transactions where interchange is earned by WEX. | ||||
| Revolving Credit Facility | The Company’s secured revolving credit facility under the Amended and Restated Credit Agreement. | ||||
| SaaS | Software-as-a-Service | ||||
| Segment adjusted operating income (AOI) | A non-GAAP measure that adjusts operating income to exclude specified items that the Company’s management excludes in evaluating segment performance, including unallocated corporate expenses, acquisition-related intangible amortization, other acquisition and divestiture related items, debt restructuring costs, stock-based compensation, other costs and certain non-recurring or non-cash operating charges that are not core to our operations, as applicable depending on the period presented. | ||||
| Segment adjusted operating income (AOI) margin | Segment adjusted operating income margin is calculated by dividing segment adjusted operating income by segment revenue. |
||||
| Tender Offer | The Company’s modified “Dutch auction” tender offer, that was completed on March 31, 2025, in which the Company purchased for cash $750 million in value of shares of its common stock upon the terms and subject to the conditions described in that certain Schedule TO and the exhibits thereto, that were originally filed by the Company with the SEC on February 26, 2025 and subsequently amended. |
||||
| Total volume | Includes purchases on WEX-issued accounts as well as purchases issued by others, but using a WEX platform. | ||||
| WEX | WEX Inc., and all of its subsidiaries that are consolidated under accounting principles generally accepted in the United States, unless otherwise indicated or required by the context. | ||||
| (Unaudited) | For the three months ended | For the twelve months ended | ||||||||||||||||||||||||||||||||||||
| 9/30/23 | 12/31/23 | 3/31/24 | 6/30/24 | 9/30/24 | 12/31/24 | 3/31/25 | 6/30/25 | 9/30/25 | 12/31/23 | 12/31/24 | ||||||||||||||||||||||||||||
| Net income attributable to shareholders | $ | 18.4 | $ | 84.9 | $ | 65.8 | $ | 77.0 | $ | 102.9 | $ | 63.9 | $ | 71.5 | $ | 68.1 | $ | 80.3 | $ | 266.6 | $ | 309.6 | ||||||||||||||||
| Unrealized (gain) loss on financial instruments | $ | 7.8 | $ | 10.3 | $ | 0.2 | $ | 0.2 | $ | (0.9) | $ | 0.8 | $ | (0.4) | $ | (0.1) | $ | (0.3) | $ | 30.4 | $ | 0.2 | ||||||||||||||||
| Net foreign currency (gain) loss | $ | 7.8 | $ | (14.3) | $ | 12.5 | $ | 0.4 | $ | (3.2) | $ | 16.4 | $ | 3.1 | $ | (2.4) | $ | 2.6 | $ | (4.9) | $ | 26.1 | ||||||||||||||||
| Change in fair value of contingent consideration | $ | 3.2 | $ | 2.3 | $ | 1.7 | $ | 1.7 | $ | 0.1 | $ | 3.0 | $ | 0.8 | $ | 0.8 | $ | 0.7 | $ | 8.5 | $ | 6.5 | ||||||||||||||||
| Acquisition-related intangible amortization | $ | 45.2 | $ | 50.4 | $ | 50.9 | $ | 50.5 | $ | 50.4 | $ | 49.9 | $ | 47.8 | $ | 49.3 | $ | 47.9 | $ | 184.0 | $ | 201.8 | ||||||||||||||||
| Other acquisition and divestiture related items | $ | 5.1 | $ | (1.0) | $ | 3.2 | $ | 3.8 | $ | 2.4 | $ | 2.8 | $ | 2.5 | $ | 1.9 | $ | 5.0 | $ | 6.6 | $ | 12.1 | ||||||||||||||||
| Stock-based compensation | $ | 31.9 | $ | 37.1 | $ | 26.7 | $ | 33.3 | $ | 29.8 | $ | 22.1 | $ | 13.3 | $ | 32.4 | $ | 34.7 | $ | 131.6 | $ | 111.9 | ||||||||||||||||
| Other costs | $ | 15.1 | $ | 17.0 | $ | 5.8 | $ | 19.4 | $ | 12.6 | $ | 11.1 | $ | 14.8 | $ | 4.5 | $ | 3.6 | $ | 45.6 | $ | 48.9 | ||||||||||||||||
| Debt restructuring and debt issuance cost amortization | $ | 74.4 | $ | 5.5 | $ | 4.5 | $ | 3.2 | $ | 4.3 | $ | 3.9 | $ | 2.2 | $ | 1.8 | $ | 2.3 | $ | 89.4 | $ | 15.9 | ||||||||||||||||
| Tax related items | $ | (32.1) | $ | (28.4) | $ | (24.7) | $ | (25.5) | $ | (20.9) | $ | (31.1) | $ | (17.2) | $ | (20.2) | $ | (17.1) | $ | (112.1) | $ | (102.2) | ||||||||||||||||
| Adjusted net income attributable to shareholders | $ | 176.8 | $ | 163.9 | $ | 146.7 | $ | 164.0 | $ | 177.5 | $ | 142.9 | $ | 138.4 | $ | 136.2 | $ | 159.7 | $ | 645.8 | $ | 631.0 | ||||||||||||||||
| ANI per Diluted Share | $ | 4.05 | $ | 3.82 | $ | 3.46 | $ | 3.91 | $ | 4.35 | $ | 3.57 | $ | 3.51 | $ | 3.95 | $ | 4.59 | $ | 14.81 | $ | 15.28 | ||||||||||||||||
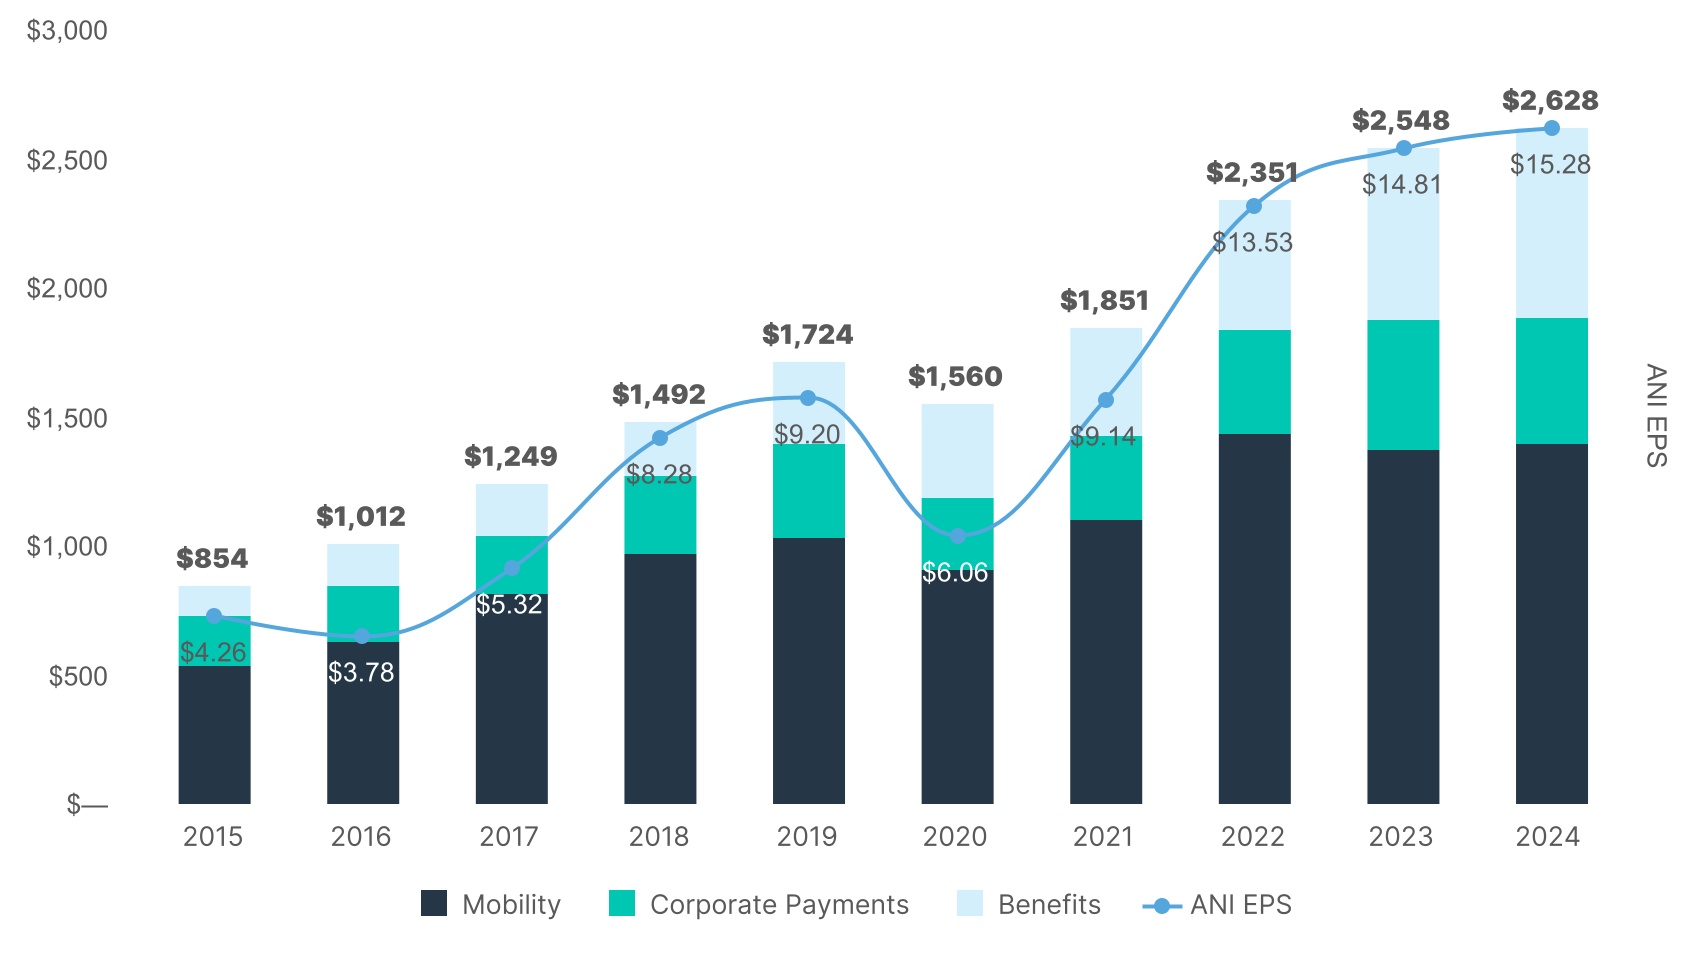
| (Unaudited) | Year Ended December 31, | |||||||||||||||||||||||||||||||
| 2015 | 2016 | 2017 | 2018 | 2019 | 2020 | 2021 | 2022 | 2023 | 2024 | |||||||||||||||||||||||
| Net income (loss) attributable to shareholders per diluted share | $ | 1.96 | $ | 0.57 | $ | 3.71 | $ | 3.86 | $ | 2.26 | $ | (5.56) | $ | — | $ | 4.50 | $ | 6.16 | $ | 7.50 | ||||||||||||
| Unrealized loss (gain) on financial instruments | $ | 0.93 | $ | (0.19) | $ | (0.03) | $ | (0.06) | $ | 0.79 | $ | 0.62 | $ | (0.86) | $ | (1.86) | $ | 0.70 | $ | 0.01 | ||||||||||||
| Net foreign currency loss (gain) | $ | 0.15 | $ | 0.23 | $ | (0.73) | $ | 0.89 | $ | 0.02 | $ | 0.59 | $ | 0.27 | $ | 0.51 | $ | (0.11) | $ | 0.63 | ||||||||||||
| Acquisition-related intangible amortization | $ | 1.23 | $ | 2.39 | $ | 3.57 | $ | 3.17 | $ | 3.64 | $ | 3.90 | $ | 4.01 | $ | 3.81 | $ | 4.25 | $ | 4.89 | ||||||||||||
| Other acquisition and divestiture related items | $ | 0.11 | $ | 1.24 | $ | 0.12 | $ | 0.10 | $ | 0.86 | $ | 1.32 | $ | 0.81 | $ | 0.40 | $ | 0.15 | $ | 0.29 | ||||||||||||
| Legal settlement | $ | — | $ | — | $ | — | $ | — | $ | — | $ | 3.71 | $ | — | $ | — | $ | — | $ | — | ||||||||||||
| Stock-based compensation | $ | 0.32 | $ | 0.48 | $ | 0.71 | $ | 0.81 | $ | 1.09 | $ | 1.50 | $ | 1.70 | $ | 2.25 | $ | 3.04 | $ | 2.71 | ||||||||||||
| Other costs | $ | 0.23 | $ | 0.34 | $ | 0.26 | $ | 0.31 | $ | 0.57 | $ | 0.31 | $ | 0.52 | $ | 0.86 | $ | 1.05 | $ | 1.19 | ||||||||||||
| Vendor settlement | $ | — | $ | 0.38 | $ | — | $ | — | $ | — | $ | — | $ | — | $ | — | $ | — | $ | — | ||||||||||||
| (Gain) loss on sale of subsidiary | $ | (0.03) | $ | — | $ | (0.49) | $ | — | $ | — | $ | 1.06 | $ | — | $ | — | $ | — | $ | — | ||||||||||||
| Impairment charges and asset write-offs | $ | — | $ | — | $ | 1.02 | $ | 0.13 | $ | — | $ | 1.22 | $ | — | $ | 3.05 | $ | — | $ | — | ||||||||||||
| Debt restructuring and debt issuance cost amortization | $ | 0.08 | $ | 0.31 | $ | 0.24 | $ | 0.32 | $ | 0.48 | $ | 0.91 | $ | 0.48 | $ | 0.39 | $ | 2.06 | $ | 0.39 | ||||||||||||
| Change in fair value of contingent consideration | $ | — | $ | — | $ | — | $ | — | $ | — | $ | — | $ | 0.88 | $ | 3.11 | $ | 0.20 | $ | 0.16 | ||||||||||||
| Regulatory reserve | $ | 0.05 | $ | — | $ | — | $ | — | $ | — | $ | — | $ | — | $ | — | $ | — | $ | — | ||||||||||||
| Non-cash adjustments related to tax receivable agreement | $ | (0.06) | $ | 0.01 | $ | (0.35) | $ | 0.02 | $ | (0.02) | $ | (0.01) | $ | — | $ | — | $ | — | $ | — | ||||||||||||
| ANI adjustments attributable to non-controlling interests | $ | 0.13 | $ | (0.06) | $ | (0.04) | $ | (0.03) | $ | 1.21 | $ | (0.98) | $ | 2.91 | $ | (0.77) | $ | — | $ | — | ||||||||||||
| Tax related items | $ | (0.83) | $ | (1.93) | $ | (2.67) | $ | (1.24) | $ | (1.71) | $ | (2.47) | $ | (1.58) | $ | (2.59) | $ | (2.59) | $ | (2.47) | ||||||||||||
| Dilutive impact of stock awards | $ | — | $ | — | $ | — | $ | — | $ | — | $ | (0.06) | $ | — | $ | — | $ | — | $ | — | ||||||||||||
| Dilutive impact of convertible debt | $ | — | $ | — | $ | — | $ | — | $ | — | $ | — | $ | — | $ | (0.13) | $ | (0.10) | $ | — | ||||||||||||
| Adjusted net income attributable to shareholders per diluted share | $ | 4.26 | $ | 3.78 | $ | 5.32 | $ | 8.28 | $ | 9.20 | $ | 6.06 | $ | 9.14 | $ | 13.53 | $ | 14.81 | $ | 15.28 | ||||||||||||
| (Unaudited) | For the three months ended | For the twelve months ended | ||||||||||||||||||||||||||||||||||||
| 9/30/23 | 12/31/23 | 3/31/24 | 6/30/24 | 9/30/24 | 12/31/24 | 3/31/25 | 6/30/25 | 9/30/25 | 12/31/23 | 12/31/24 | ||||||||||||||||||||||||||||
| Operating income | $ | 174.9 | $ | 158.5 | $ | 164.5 | $ | 168.1 | $ | 196.4 | $ | 157.3 | $ | 157.3 | $ | 156.8 | $ | 183.6 | $ | 647.1 | $ | 686.3 | ||||||||||||||||
| Unallocated corporate expenses | $ | 29.1 | $ | 26.2 | $ | 23.6 | $ | 26.1 | $ | 24.1 | $ | 28.3 | $ | 24.9 | $ | 25.4 | $ | 23.7 | $ | 103.0 | $ | 102.1 | ||||||||||||||||
| Acquisition-related intangible amortization | $ | 45.2 | $ | 50.4 | $ | 50.9 | $ | 50.5 | $ | 50.4 | $ | 49.9 | $ | 47.8 | $ | 49.3 | $ | 47.9 | $ | 184.0 | $ | 201.8 | ||||||||||||||||
| Other acquisition and divestiture related items | $ | 5.1 | $ | (1.0) | $ | 2.4 | $ | 1.4 | $ | 1.6 | $ | 0.3 | $ | 0.5 | $ | 0.7 | $ | 3.8 | $ | 6.6 | $ | 5.7 | ||||||||||||||||
| Stock-based compensation | $ | 31.9 | $ | 37.1 | $ | 26.7 | $ | 33.3 | $ | 29.8 | $ | 22.1 | $ | 13.3 | $ | 32.4 | $ | 34.7 | $ | 131.6 | $ | 111.9 | ||||||||||||||||
| Other costs | $ | 15.1 | $ | 17.5 | $ | 6.7 | $ | 20.6 | $ | 14.8 | $ | 11.9 | $ | 14.9 | $ | 3.9 | $ | 3.6 | $ | 46.1 | $ | 53.9 | ||||||||||||||||
| Total segment adjusted operating income | $ | 301.3 | $ | 288.7 | $ | 274.9 | $ | 299.9 | $ | 317.1 | $ | 269.8 | $ | 258.7 | $ | 268.5 | $ | 297.2 | $ | 1,118.4 | $ | 1,161.7 | ||||||||||||||||
| Unallocated corporate expenses | $ | (29.1) | $ | (26.2) | $ | (23.6) | $ | (26.1) | $ | (24.1) | $ | (28.3) | $ | (24.9) | $ | (25.4) | $ | (23.7) | $ | (103.0) | $ | (102.1) | ||||||||||||||||
| Adjusted operating income | $ | 272.2 | $ | 262.5 | $ | 251.3 | $ | 273.9 | $ | 293.0 | $ | 241.5 | $ | 233.8 | $ | 243.0 | $ | 273.5 | $ | 1,015.4 | $ | 1,059.7 | ||||||||||||||||
| For the three months ended | For the twelve months ended | |||||||||||||||||||||||||||||||||||||
| (In millions) | 9/30/23 | 12/31/23 | 3/31/24 | 6/30/24 | 9/30/24 | 12/31/24 | 3/31/25 | 6/30/25 | 9/30/25 | 12/31/23 | 12/31/24 | |||||||||||||||||||||||||||
| Operating cash flow | $ | 46.5 | $ | 761.9 | $ | (153.3) | $ | (7.0) | $ | 3.3 | $ | 638.4 | $ | (481.6) | $ | 264.6 | $ | 376.6 | $ | 907.9 | $ | 481.4 | ||||||||||||||||
| Adjustments to operating cash flow, as reported: | ||||||||||||||||||||||||||||||||||||||
| Changes in WEX Bank cash balances | $ | (83.5) | $ | (23.6) | $ | 188.9 | $ | 69.6 | $ | 125.3 | $ | (104.7) | $ | 67.7 | $ | (182.5) | $ | (47.5) | $ | (82.4) | $ | 279.1 | ||||||||||||||||
| Other adjustments | $ | — | $ | (50.0) | $ | 67.1 | $ | — | $ | — | $ | (33.1) | $ | 58.8 | $ | 1.6 | $ | 1.5 | $ | (48.5) | $ | 34.0 | ||||||||||||||||
| Net Funding Activity | $ | 294.8 | $ | (214.4) | $ | 205.0 | $ | 214.8 | $ | 372.2 | $ | (139.3) | $ | 375.5 | $ | 495.6 | $ | (178.1) | $ | 1,438.2 | $ | 652.7 | ||||||||||||||||
| Net sales and maturities (purchases) of current investment securities | $ | (56.6) | $ | (256.8) | $ | (282.9) | $ | (25.6) | $ | (276.3) | $ | (153.2) | $ | 28.3 | $ | (350.3) | $ | 48.7 | $ | (1,561.0) | $ | (738.0) | ||||||||||||||||
| Capital expenditures | $ | (36.4) | $ | (41.9) | $ | (34.0) | $ | (39.6) | $ | (35.0) | $ | (38.7) | $ | (32.6) | $ | (34.6) | $ | (35.0) | $ | (143.6) | $ | (147.3) | ||||||||||||||||
| Adjusted free cash flow | $ | 164.9 | $ | 175.2 | $ | (9.2) | $ | 212.2 | $ | 189.5 | $ | 169.5 | $ | 16.2 | $ | 194.3 | $ | 166.2 | $ | 510.6 | $ | 562.0 | ||||||||||||||||