株探米国株
日本語 英語
エドガーで原本を確認する
0001306830false00013068302024-02-202024-02-200001306830us-gaap:CommonStockMember2024-02-202024-02-200001306830ce:EURSeniorUnsecuredNotesDue2025Member2024-02-202024-02-200001306830ce:EURSeniorUnsecuredNotesDue2026Member2024-02-202024-02-200001306830ce:EURSeniorUnsecuredNotesDue2027Member2024-02-202024-02-200001306830ce:EURSeniorUnsecuredNotesDue2028Member2024-02-202024-02-200001306830ce:EURSeniorUnsecuredNotesDue2029Member2024-02-202024-02-20

UNITED STATES
SECURITIES AND EXCHANGE COMMISSION
Washington, D.C. 20549
FORM 8-K
CURRENT REPORT
Pursuant to Section 13 or 15(d) of the Securities Exchange Act of 1934
Date of Report (Date of earliest event reported): February 20, 2024
CELANESE CORPORATION
(Exact name of registrant as specified in its charter)
Delaware 001-32410 98-0420726
     
(State or other jurisdiction
of incorporation)
(Commission File
Number)
(IRS Employer
Identification No.)
222 West Las Colinas Blvd. Suite 900N, Irving, TX 75039
(Address of Principal Executive Offices) (Zip Code)
Registrant's telephone number, including area code: (972) 443-4000

N/A
(Former name or former address, if changed since last report)
Check the appropriate box below if the Form 8-K filing is intended to simultaneously satisfy the filing obligation of the registrant under any of the following provisions (see General Instruction A.2. below):
☐   Written communications pursuant to Rule 425 under the Securities Act (17 CFR 230.425)
☐   Soliciting material pursuant to Rule 14a-12 under the Exchange Act (17 CFR 240.14a-12)
☐   Pre-commencement communications pursuant to Rule 14d-2(b) under the Exchange Act (17 CFR 240.14d-2(b))
☐   Pre-commencement communications pursuant to Rule 13e-4(c) under the Exchange Act (17 CFR 240.13e-4(c))
Securities registered pursuant to Section 12(b) of the Act:
Title of Each Class Trading Symbol(s)  Name of Each Exchange on Which Registered
Common Stock, par value $0.0001 per share CE The New York Stock Exchange
1.250% Senior Notes due 2025 CE /25 The New York Stock Exchange
4.777% Senior Notes due 2026 CE /26A The New York Stock Exchange
2.125% Senior Notes due 2027 CE /27 The New York Stock Exchange
0.625% Senior Notes due 2028 CE /28 The New York Stock Exchange
5.337% Senior Notes due 2029 CE /29A The New York Stock Exchange
Indicate by check mark whether the registrant is an emerging growth company as defined in Rule 405 of the Securities Act of 1933 or Rule 12b-2 of the Securities Exchange Act of 1934.
Emerging growth company  ☐
If an emerging growth company, indicate by check mark if the registrant has elected not to use the extended transition period for complying with any new or revised financial accounting standards provided pursuant to Section 13(a) of the Exchange Act.  ☐
1


Item 7.01 Regulation FD Disclosure
On February 21, 2024, Lori J. Ryerkerk, Chair of the Board of Directors, Chief Executive Officer and President of Celanese Corporation (the "Company"), will make a presentation to investors and analysts via a webcast hosted by the Company at 10:00 a.m. ET (9:00 a.m. CT) regarding the Company's financial results for its fourth quarter and full year 2023. The webcast, press release and prepared remarks from management may be accessed on our website at investors.celanese.com under News & Events / Events Calendar. A copy of the prepared remarks posted for the webcast is attached to this Current Report on Form 8-K ("Current Report") as Exhibit 99.1(a) and is incorporated herein solely for purposes of this Item 7.01 disclosure. During the webcast, management may make, and management's prepared remarks contain, references to certain Non-US GAAP financial measures. Non-US GAAP financial measures appearing in management's prepared remarks are defined and reconciled to the most comparable US GAAP financial measure in our Non-US GAAP Financial Measures and Supplemental Information document furnished with this Current Report as Exhibit 99.2 (and available on our website) and incorporated herein solely for purpose of this Item 7.01 disclosure.
Item 9.01 Financial Statements and Exhibits
(d) The following exhibits are being furnished herewith:
Exhibit
Number
 
Description
99.1(a)
99.2
104 Cover Page Interactive Data File (the cover page XBRL tags are embedded within the inline XBRL document contained in Exhibit 101)
* In connection with the disclosure set forth in Item 7.01, the information in this Current Report, including the exhibits attached hereto, is being furnished and shall not be deemed "filed" for purposes of Section 18 of the Securities Exchange Act of 1934, as amended (the "Exchange Act"), or otherwise subject to the liabilities of such section. The information in this Current Report, including the exhibits, shall not be incorporated by reference into any filing under the Securities Act of 1933, as amended, or the Exchange Act, regardless of any incorporation by reference language in any such filing. This Current Report will not be deemed an admission as to the materiality of any information in this Current Report that is required to be disclosed solely by Regulation FD.
2


SIGNATURES
Pursuant to the requirements of the Securities Exchange Act of 1934, the registrant has duly caused this report to be signed on its behalf by the undersigned hereunto duly authorized.
       
 
CELANESE CORPORATION
 
  By: /s/ MICHAEL R. SULLIVAN
  Name:  Michael R. Sullivan
  Title:   Vice President, Deputy General Counsel and Corporate Secretary 
 
Date:
February 20, 2024
3
EX-99.1(A) 2 q420238-kex991a.htm EX-99.1(A) Document

Exhibit 99.1(a)
picture2.jpg
Fourth Quarter 2023 Earnings Prepared Comments
Brandon Ayache, Celanese Corporation, Vice President, Investor Relations
This is the Celanese Corporation fourth quarter 2023 earnings prepared comments. The Celanese Corporation fourth quarter 2023 earnings release was distributed via Business Wire this afternoon and posted on our investor relations website, investors.celanese.com. As a reminder, some of the matters discussed below may include forward-looking statements concerning, for example, our future objectives and plans. Please note the cautionary language contained at the end of these comments. Also, some of the matters discussed include references to non-GAAP financial measures. Explanations of these measures and reconciliations to the comparable GAAP measures are included on our investor relations website under Financial Information/Non-GAAP Financial Measures. The earnings release and non-GAAP information and the reconciliations are being furnished to the SEC in a Current Report on Form 8-K. These prepared comments are also being furnished to the SEC in a separate Current Report on Form 8-K.
On the earnings conference call tomorrow morning, management will be available to answer questions.

Lori Ryerkerk, Celanese Corporation, Chair of the Board and Chief Executive Officer
Today we reported full year 2023 adjusted earnings of $8.92 per share (inclusive of approximately $1.20 per share of Mobility & Materials (M&M) transaction amortization1) and record free cash flow of $1.3 billion. I sincerely thank our teams for persevering across what was a very challenging year to deliver this performance.
Our teams managed the unfavorable and compounding dynamics in a global commercial backdrop across 2023 that challenged both of our businesses. We are still navigating cyclical demand downturns for most durable goods (electronics, appliances, furniture, etc.) and remodel/renovation activity that spanned 2023 as a result of persistent inflation and the follow-on effects of COVID-19 spending patterns. This spurred a wave of prolonged destocking across most of the supply chains into which we sell. Unpredictable demand
1 Calculated as intangible amortization from the M&M transaction divided by diluted weighted average shares outstanding
1


across the year drove producers to chase volume where it could be found and fueled elevated competitive pricing pressures.
These challenges were masked by the addition of M&M, resulting in a reported 2023 volume increase of 23 percent year over year. When excluding the impact of M&M, our 2023 volume decreased by 2 percent across Celanese. Even so, this metric alone does not accurately convey the severity of demand challenges as our commercial team successfully pivoted and pursued volume offsets in alternative end-markets across the year to support our results. Significant competitive pricing pressures, raw material deflation, and meaningful shifts in our sales mix resulted in a 10 percent year over year decline in our pricing. The commercial actions to secure alternative business bolstered our financial results in 2023.
Today we also reported fourth quarter adjusted earnings of $2.24 per share (inclusive of approximately $0.30 of M&M transaction amortization) and record free cash flow of $702 million in the quarter despite continued commercial challenges that resulted in sequentially lower volume and pricing.
We believe these unfavorable commercial dynamics will turn. I wish I could say that we are back to normal demand patterns in 2024, but we are not seeing that yet. As always, our team continues to act on what we can control and to prepare us for demand recovery when it comes.
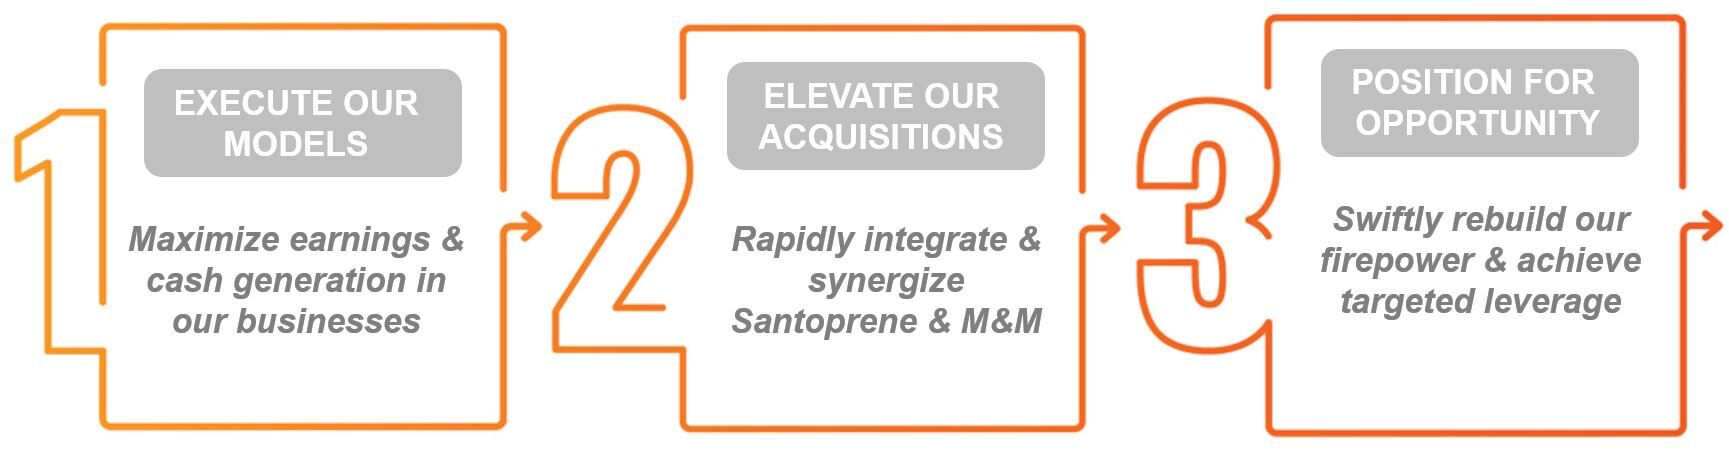
While working to optimize our near-term performance, our team has remained focused on laying the groundwork for future value creation. The first quarter of 2024 is a particularly exciting one for us, as we will complete a series of significant value creation projects.
•On February 1, we successfully went live with M&M on our upgraded SAP S/4HANA ERP system. This was the final step in our strategy to fold the organization onto one upgraded ERP system. I thank our IT, finance, manufacturing, commercial, and supply chain teams for this momentous achievement of integrating a large and complex M&M business onto a new ERP just 15 months after closing the acquisition. This will allow us to completely exit the IT transition services agreement with DuPont in phases over the next few months and support meaningful synergies within the associated functions across 2024. It also allows us to analyze, operate, and report on legacy Engineered Materials (EM) and M&M as one fully integrated business. Starting with the first quarter of 2024, we will talk about one EM, both internally and externally.
•We completed the previously announced closure of our nylon 66 (PA66) and certain high-performance nylons (HPN) polymerization units at Uentrop, Germany. Because polymerization costs at this site were the highest in our global nylon network, this closure will be a meaningful contributor to our synergy realization across the year and helps to further reduce our global fixed cost base.
2


•We have received, inspected, and installed replacement high-metallurgy components at our new acetic acid unit in Clear Lake. We are finalizing the commissioning process and expect the unit to be operational by the end of the first quarter. Once complete, we believe this new 1.3 million ton unit will be the lowest-cost and lowest-carbon footprint acetic acid unit in the world2 and it is expected to drive approximately $100 million in incremental productivity within our global Acetyl Chain (AC) network on a full year basis.
•In late 2023, we commenced an initiative to consolidate our European regional management activities from our legacy Celanese regional headquarters in Amsterdam to the legacy M&M regional headquarters in Meyrin, Switzerland. Among other reasons for this decision, the Meyrin site is already a significant office site with a technology and innovation center, is a facility we own with room to grow, and is centrally located to our manufacturing and commercial footprint in the region. We informed our European team in early 2024, have already relocated certain regional leaders, and will largely complete that process throughout 2024.
We are starting off 2024 with significant milestones in our value creation journey and there will be more throughout the year. It is a great privilege for me to work with individuals at Celanese who diligently search for value creation opportunities and pursue them with great vigor and urgency. In my closing comments, I will revisit the impact of some these milestones and summarize the growth we expect across 2024.
With that, let me pass it to Scott and Chuck to further discuss our fourth quarter business and financial performance using a familiar framework.
capturea.jpg

2 Based on internal estimates
3


Scott Richardson, Celanese Corporation, Executive Vice President and Chief Operating Officer
image1.jpg The Acetyl Chain (AC) delivered fourth quarter adjusted EBIT of $300 million and operating EBITDA of $354 million, at margins of 25 and 30 percent, respectively. Our fourth quarter AC adjusted EBIT was the second highest fourth quarter in our history, behind only the fourth quarter of 2021, a year in which we reported over $2 billion in adjusted EBIT3 due to elevated industry pricing. I commend our team for delivering this performance despite unanticipated challenges impacting the quarter including China pricing that declined more quickly in the quarter than we anticipated and operational disruptions to our U.S. Gulf Coast network.
We had a series of unanticipated operational challenges at our Clear Lake and Bay City plants including unscheduled maintenance and supplier disruptions. These challenges reduced our anticipated production by over 50 kt in the quarter at these cost advantaged facilities within our global network. However, our team successfully maintained reliability of supply to our customers by utilizing higher cost facilities in our global network, leveraging our global logistics, and in some cases, securing third-party product. These actions added nearly $15 million in unanticipated costs in the fourth quarter. The unfavorable impact would have been significantly reduced if our Clear Lake acetic acid expansion was operational, providing us with redundancy and excess make-up capacity at the lowest cost site in our network.
Our 2023 AC adjusted EBIT of $1.3 billion and operating EBITDA of $1.5 billion demonstrated the resilience of our foundational earnings. Despite consistent year over year volumes, AC faced a 17 percent decline in pricing from 2022 levels, which created an almost $1 billion headwind to our performance. Variable margin contributions in 2023 compressed year over year across virtually every product, led by acetic acid and VAM where the combined variable margin contributions declined by approximately 50 percent globally. To elaborate, the variable margin contributions from acetic acid and VAM in 2023 made up the lowest percentage of our total AC variable margin since 2016, a year in which our reported adjusted EBIT was approximately 35 percent lower than 2023. Differentiated results in 2023 were the result of work over the last decade to reduce our fixed cost base and build optionality within the chain. In 2023, we heavily leveraged our downstream optionality to place incremental volume in acetate tow and redispersible powders, the most recent downstream extensions to our chain optionality. As a result of this and other actions, we successfully offset two-thirds of the nearly $1 billion pricing headwind to deliver
3 Inclusive of former Acetate Tow reporting segment
4


foundational earnings of $1.3 billion across the year. Full year adjusted EBIT margin compressed only 220 basis points to 26 percent.
We continuously look for ways to further enhance the optionality of AC. In the fourth quarter we commissioned our latest AC enhancement via the expansion of our methanol production at Clear Lake, a carbon capture and utilization (CCU) project that increases our JV methanol capacity by 130 kt. We have successfully produced low-carbon methanol and are partnering with customers to direct that methanol into a variety of low-carbon AC and EM downstream products, marketed as ECO-CC, for a wide range of consumer applications.
Looking to 2024, we expect to further lift the foundational earnings power of AC with the Clear Lake acetic acid and methanol expansions. Contributions from those expansions will be negligible in the first quarter, as acetic acid is starting up later in the quarter and methanol is currently undergoing a major scheduled turnaround. We are in the middle of a seven week turnaround of our methanol unit that started in mid-January and will extend until early March. This turnaround is the largest of any single unit in our history as we are replacing catalyst and completing maintenance on numerous pieces of equipment (some for the first time since we commissioned the unit in 2015). We will lose over 100 kt of production and expect to incur approximately $35 million in costs related to this methanol turnaround, approximately $25 million of which will hit AC and $10 million of which will flow to EM. Inclusive of these costs, and largely neutral anticipated sequential volume and pricing conditions, we expect first quarter AC adjusted EBIT of $285 to $300 million.
Engineered Materials (EM) delivered fourth quarter adjusted EBIT of $199 million and operating EBITDA of $311 million at margins of 14 and 22 percent, respectively. These results were inclusive of M&M contributions to these earnings metrics of $51 million and $120 million, respectively. Sequential net sales declined by 8 percent, which constituted declines of 5 percent in volume and 3 percent in pricing. The adjusted EBIT outcome was approximately $10 million below our anticipated results and was mainly driven by higher than expected seasonal, year-end destocking within the automotive value chain and product mix headwinds, particularly in M&M. Our legacy EM business delivered an increase in sequential adjusted EBIT4, despite the automotive destocking and continued demand sluggishness in other end-markets.
To focus for a moment on automotive, for most of 2023 we had not seen any material destocking as we had in most other end-markets. Fourth quarter destocking is a common year-end occurrence in automotive, but we anticipated that customer demand and continued strengthening in auto builds would somewhat
4 After accounting for the $13 million in lower sequential consolidated earnings from the Nutrinova JV
5


interrupt that seasonal cycle. While builds increased in the quarter, the automotive value chain reduced inventories in a more typical fashion. The impact of destocking and the lagging effects of the UAW strike caused our fourth quarter sales into automotive to lag sequential auto builds in both the Americas and Europe, while our sales into Asia were consistent with auto builds. The impact of the destocking in the Western Hemisphere and the UAW strike contributed an approximately $10 million sequential headwind to the quarter across EM. In addition to automotive, year-end destocking was also prevalent throughout the distribution channel.
The resilience of our legacy EM business was evident not only in the EBIT expansion described earlier, but also through volume expansion. When excluding the impact of the Nutrinova JV launch, sequential volumes for legacy EM increased in both Europe and Asia, reinforcing our expectation that the prolonged period of destocking is ending. We saw continued strength in the medical segment, as well as sequential improvement in some industrial segments. We expect this demand stabilization to continue.
Another indicator of stabilization is the trend of trade flows from Asian producers into the Western Hemisphere. We discussed previously how these exports negatively impacted pricing and mix, particularly in Europe. Since peaking in March, POM exports from China, Malaysia, and Japan have fallen in both the second and third quarters of 2023. While not yet back to normalized levels, the combined third quarter exports to Europe from these three countries has fallen by 38 percent. This is an indication of progressing demand recovery in Asia and the transitory nature of the export spike, bringing near-term benefit in Asia and anticipated future improvement in Europe.
As we look to the first quarter of 2024, we anticipate commercial conditions to be similar to the fourth quarter. We expect modest volume recovery to be largely offset by price compression due to continued competitive dynamics. Costs related to a two-week planned outage at our Frankfurt POM facility will be approximately $20 million in the quarter. We expect affiliate earnings to decline by approximately $10 million sequentially, largely driven by Ibn Sina. We expect these impacts will be largely offset by meaningful recovery in M&M, where we expect to deliver the highest quarterly earnings since the acquisition closed. As we consider these dynamics, we anticipate EM first quarter adjusted EBIT of $190 to $200 million.
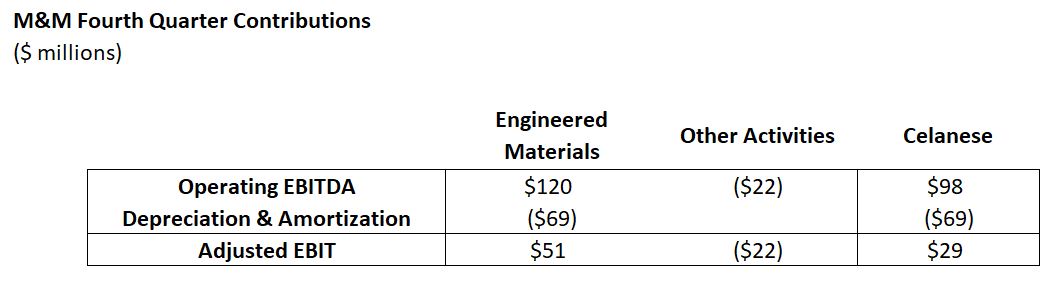
The M&M business contributed $98 million to Celanese operating EBITDA in the fourth quarter, which was reflected in our reporting segments as $120 million contribution to EM operating EBITDA and an alignment of $22 million in costs to Other Activities. The M&M business contributed $51 million to EM adjusted EBIT in the fourth quarter, inclusive of depreciation and approximately $30 million in quarterly transaction amortization.
6


capture.jpg
While the M&M performance did not meet our expectations, the drivers behind the results are transitory and we expect recovery in the first quarter. The impact of the automotive headwinds discussed earlier were amplified in M&M, given that over 50 percent of net sales of its products go into auto. Additionally, results were also adversely affected by restocking across the middle of the year in our Vamac® product line that also is primarily sold into auto.
To focus on the headwinds in Vamac®, M&M had experienced supply constraints within the product line in past years. Our manufacturing and supply chain teams focused on addressing these supply constraints to improve supply reliability. Thanks to these efforts, our last production campaign was one of the most successful in the history of the product and led to heavier restocking by customers that had been impacted by shortfalls in their supply in the past. This caused lower volumes in the fourth quarter and had a negative sequential mix impact of $15 million. As Vamac® supply continues to improve, we expect a return to a more normalized demand pattern.
During the fourth quarter, we started to realize the benefit of lower raw material costs flowing through inventory, particularly in nylon. While sluggish demand and year-end destocking slowed the realization of these gains, variable margin for nylon bottomed in the fourth quarter and is improving in January.
We anticipate meaningful earnings improvements in the M&M business due to automotive volume recovery and continued realization of lower costs flowing through inventory. We have recently completed the previously announced closure of nylon 66 (PA66) and high-performance nylons (HPN) polymerization units at Uentrop, which will lower our fixed cost base while increasing flexibility. We will continue to operate compounding at Uentrop, in addition to polymerization of certain HPN grades, to maintain a localized production presence and allow us to meet our customer demand. We expect these types of strategic actions and continued realization of synergies will drive further business recovery as lower costs increasingly flow through inventory.
7


Chuck Kyrish, Celanese Corporation, Senior Vice President and Chief Financial Officer
image3.jpg In my comments I want to provide some added context for our reported earnings, free cash flow, and deleveraging performance across the fourth quarter.
Let me start by addressing the impact of Other Activities on our fourth quarter earnings. In the quarter we reported a net expense of $65 million in Other Activities adjusted EBIT, a sequential expense reduction of $23 million. This sequential reduction was due to certain non-cash foreign exchange gains5 resulting from significant internal restructuring, primarily related to consolidation of our European management activities into Switzerland. While we anticipated potential gains in the quarter from this activity, the actual amount was more significant due to movement in certain foreign currencies and the scale and timing of the intercompany transactions. Going forward, we do not expect to have this level of foreign exchange gains or losses resulting from restructuring activity.
In the first quarter, we expect Other Activities adjusted EBIT to reflect a net expense more in line with the 2023 quarterly run-rate before accounting for the fourth quarter foreign exchange gain just discussed. As we move through 2024, we expect to see a sustainable reduction in our Other Activities expenses following the SAP integration and pursuit of related synergy opportunities.
Lastly, related to earnings, the tax rate for U.S. GAAP purposes was a benefit of 67 percent for full year 2023 due to deferred tax benefits of non-recurring internal reorganization transactions, the integration of the European headquarters to Switzerland, the release of valuation allowances on U.S. foreign tax credit carryforwards, and excess of U.S. GAAP book gains over tax gains related to the formation of the Nutrinova JV. The effective tax rate for adjusted earnings was 9 percent for 2023 as certain benefits of the internal restructuring will be realized in future periods. At this stage, we anticipate an effective tax rate for adjusted earnings in 2024 that is similar to 2023.
Turning to cash generation, I would like to congratulate and thank our team for delivering record quarterly free cash flow of $702 million in the fourth quarter and record annual free cash flow of $1.3 billion across 2023. This achievement was the result of countless Celanese employees working to achieve our shared objective of maximizing and accelerating our cash generation.
Across 2023 we bolstered our free cash flow by delivering a net reduction of approximately $580 million in our working capital balances. The majority of this reduction came from a $451 million reduction in
5 Reflected in the income statement as Foreign exchange gain (loss), net as well as a portion of Other income (expense), net
8


inventory balances across 2023, exceeding our full year inventory reduction objective. Our team delivered reductions across raw material, work in progress, and finished goods inventory with over 80 percent of the total reduction coming from EM. These efforts continue today.
The record free cash flow we generated in 2023 was delivered following $568 million in capital expenditures, approximately $700 million in net interest, and additional cash costs to integrate and synergize M&M across the year. The reported free cash flow excludes approximately $500 million in cash proceeds from the Nutrinova JV completed in the third quarter.
As a result of our cash generation across the year and proceeds from the Nutrinova JV, we delivered a total net debt reduction of $1.3 billion in 2023. I congratulate our team for meaningfully exceeding our full year objective to reduce net debt by $1 billion in 2023.
As disclosed in an 8-K filing today, we executed an amendment to our U.S. term loan and revolving credit facility, which increased the permitted net debt to EBITDA level through the first quarter of 2026. While this amendment was not necessary for us at this time, we decided to capitalize on an improved credit market backdrop and supportive banking partners to improve the terms and extend the covenant relief period beyond what we believe we will need. The revision in the leverage covenant required no concessions on our part.
Looking forward, our deleveraging objective is very simple - achieve our targeted leverage ratio of 3x net debt to EBITDA as rapidly as possible. What may appear as an urgency to simply reduce leverage is, for us, better described as eagerness to deploy our very strong and growing free cash flow with full flexibility to accelerate our value creation under a balanced capital allocation strategy that would again include share repurchases.
We moved past peak leverage in the second quarter of 2023 and drove our leverage down across each of the last two quarters as a result of both net debt reduction and year over year growth in EBITDA. Across 2024, we expect to make further progress towards 3x leverage from EBITDA growth across the year as well as net debt reduction. This progress will begin in the second quarter, as a result of some of the unique turnaround-related expenses in the first quarter that Scott highlighted as well as first quarter cash flow considerations including normal working capital seasonality and a heavy cash interest burden in the quarter. As a result of these dynamics, we expect negative free cash flow in the first quarter of this year and to maintain similar sequential leverage levels at the end of the first quarter.
We remain committed to aggressively executing against our deleveraging plan and are excited about the opportunities we see across 2024 to deliver earnings and cash flow growth to support this objective.
9


Lori Ryerkerk, Celanese Corporation, Chair of the Board and Chief Executive Officer
To summarize our comments, 2023 was characterized by poor demand conditions and elevated competitive pressures that challenged our volumes, pricing, and the quality of our sales mix.
Across the first six weeks of 2024, we are seeing certain combinations of product, end-market, and geography where demand and competitive challenges are easing, but we do not anticipate meaningful sequential improvement in total volume or pricing in the first quarter. Inclusive of these dynamics and over $50 million in expenses related to planned outages in the first quarter, we anticipate first quarter adjusted earnings per share of $1.75 to $2.00.
I am confident that we will deliver a significant ramp in earnings coming off of the first quarter and across 2024. The cadence of anticipated 2024 earnings is tied to the timing of major contributors (as well as headwinds) to our year over year growth.
•We anticipate incremental M&M synergies of $150 million or more across the year. The vast majority of these synergies will be delivered across the last three quarters of the year, spurred in part by the completion of the SAP integration and the shutdown of Uentrop polymerization in the first quarter. We continue to take actions to accelerate our synergy capture.
•We expect approximately $100 million in additional earnings contribution from Clear Lake in 2024 due to the new expansions of acetic acid and carbon capture and utilization (CCU) methanol.
•We expect the total annual cost of servicing our debt will decrease by approximately $50 million6 from 2023 as a result of debt paydown and debt optimization efforts.
•We expect that lower raw material costs and lower fixed costs, as a result of actions we took in 2023, will increasingly flow to the income statement across the year as we flush higher cost inventory and improve production utilization rates. We still believe this has the potential to be the highest year over year earnings contributor depending on the future trajectory of pricing and demand conditions, though the net contribution is limited in the first quarter.
•We expect over $50 million in higher expenses year over year related to planned outages.
6 Lower interest due to cross-currency swaps will be reflected in the income statement as Other income (expense), net
10


•We expect an unfavorable impact of $50 to $75 million year over year from one-time contributions to 2023 earnings that are unlikely to repeat including certain one-time cost avoidance actions and the foreign currency impacts from restructuring activities that Chuck highlighted.
The first quarter of 2024 will not reflect any material benefit from these year over year contributors as a result of the timing of major projects and demand conditions to start the year. Additionally, the first quarter will bear a disproportionate share of the burden of the year over year headwinds as half or more of the 2024 outage-related expense will hit in the first quarter.
At this stage, we do not yet have visibility in our order books or otherwise, to enough green shoots to meaningfully lift our perspective on the underlying demand backdrop. Consequently, the bases for our full year 2024 outlook are the earnings contributors I highlighted above. Inclusive of our first quarter guidance and an anticipated ramp in earnings across 2024 from those contributors, we expect 2024 earnings of $11 to $12 per share.
We remain focused on executing against the significant value creation opportunities in front of us, particularly in the first quarter, that will support meaningful earnings and cash generation growth across 2024 and beyond.
11


Forward-Looking Statements

These prepared comments may contain "forward-looking statements," which include information concerning the Company's plans, objectives, goals, strategies, future revenues, cash flow, financial performance, synergies, capital expenditures, financing needs and other information that is not historical information. All forward-looking statements are based upon current expectations and beliefs and various assumptions. There can be no assurance that the Company will realize these expectations or that these beliefs will prove correct. There are a number of risks and uncertainties that could cause actual results to differ materially from the results expressed or implied in the forward-looking statements contained in these comments. These risks and uncertainties include, among other things: changes in general economic, business, political and regulatory conditions in the countries or regions in which we operate; the length and depth of product and industry business cycles, particularly in the automotive, electrical, textiles, electronics and construction industries; volatility or changes in the price and availability of raw materials and energy, particularly changes in the demand for, supply of, and market prices of ethylene, methanol, natural gas, wood pulp and fuel oil and the prices for electricity and other energy sources; the ability to pass increases in raw material prices, logistics costs and other costs on to customers or otherwise improve margins through price increases; the possibility that we will not be able to timely or effectively continue to integrate the Mobility & Materials business (the "M&M Business") we acquired from DuPont de Nemours, Inc. (the "M&M Acquisition") in order to realize the anticipated benefits of the M&M Acquisition, including synergies and growth opportunities, whether as a result of difficulties arising from the operation of the M&M Business or other unanticipated delays, costs, inefficiencies or liabilities; increased commercial, legal or regulatory complexity of entering into, or expanding our exposure to, certain end markets and geographies; risks in the global economy and equity and credit markets and their potential impact on our ability to pay down debt in the future and/or refinance at suitable rates, in a timely manner, or at all; risks and costs associated with increased leverage from the M&M Acquisition, including increased interest expense and potential reduction of business and strategic flexibility; the ability to maintain plant utilization rates and to implement planned capacity additions, expansions and maintenance; the ability to reduce or maintain current levels of production costs and to improve productivity by implementing technological improvements to existing plants; increased price competition and the introduction of competing products by other companies; the ability to identify desirable potential acquisition or divestiture opportunities and to complete such transactions, including obtaining regulatory approvals, consistent with the Company's strategy; market acceptance of our products and technology; compliance and other costs and potential disruption or interruption of production or operations due to accidents, interruptions in sources of raw materials, transportation, logistics or supply chain disruptions, cybersecurity incidents, terrorism or political unrest, public health crises (including, but not limited to, the COVID-19 pandemic), or other unforeseen events or delays in construction or operation of facilities, including as a result of geopolitical conditions, the direct or indirect consequences of acts of war or conflict (such as the Russia-Ukraine conflict or the Israel-Hamas conflict) or terrorist incidents or as a result of weather, natural disasters, or other crises; the ability to obtain governmental approvals and to construct facilities on terms and schedules acceptable to the Company; changes in applicable tariffs, duties and trade agreements, tax rates or legislation throughout the world including, but not limited to, adjustments, changes in estimates or interpretations or the resolution of tax examinations or audits that may impact recorded or future tax impacts and potential regulatory and legislative tax developments in the United States and other jurisdictions; changes in the degree of intellectual property and other legal protection afforded to our products or technologies, or the theft of such intellectual property; potential liability for remedial actions and increased costs under existing or future environmental, health and safety regulations, including those relating to climate change or other sustainability matters; potential liability resulting from pending or future claims or litigation, including investigations or enforcement actions, or from changes in the laws, regulations or policies of governments or other governmental activities in the countries in which we operate; changes in currency exchange rates and interest rates; our level of indebtedness, which could diminish our ability to raise additional capital to fund operations or limit our ability to react to changes in the economy or the chemicals industry; tax rates and changes thereto; and various other factors discussed from time to time in the Company's filings with the Securities and Exchange Commission.

Any forward-looking statement speaks only as of the date on which it is made, and the Company undertakes no obligation to update any forward-looking statements to reflect events or circumstances after the date on which it is made or to reflect the occurrence of anticipated or unanticipated events or circumstances.

Results Unaudited
The results in this document, together with the adjustments made to present the results on a comparable basis, have not been audited and are based on internal financial data furnished to management. Quarterly results should not be taken as an indication of the results of operations to be reported for any subsequent period or for the full fiscal year.

Non-GAAP Financial Measures
These prepared comments, and statements made in connection with these prepared comments, refer to non-GAAP financial measures. For more information on the non-GAAP financial measures used by the Company, including the most directly comparable GAAP financial measure for each non-GAAP financial measure used, including definitions and reconciliations of the differences between such non-GAAP financial measures and the comparable GAAP financial measures, please refer to the Non-US GAAP Financial Measures and Supplemental Information document available on our website, investors.celanese.com, under Financial Information/Financial Document Library.


12
EX-99.2 3 q420238-kex992.htm EX-99.2 Document
celogo.jpg
Exhibit 99.2
Non-US GAAP Financial Measures and Supplemental Information
February 20, 2024
In this document, the terms the "Company," "we" and "our" refer to Celanese Corporation and its subsidiaries on a consolidated basis.
Purpose
The purpose of this document is to provide information of interest to investors, analysts and other parties including supplemental financial information and reconciliations and other information concerning our use of non-US GAAP financial measures. This document is updated quarterly.
Presentation
This document presents the Company's two business segments, Engineered Materials and the Acetyl Chain.
Use of Non-US GAAP Financial Measures
From time to time, management may publicly disclose certain numerical "non-GAAP financial measures" in the course of our earnings releases, financial presentations, earnings conference calls, investor and analyst meetings and otherwise. For these purposes, the Securities and Exchange Commission ("SEC") defines a "non-GAAP financial measure" as a numerical measure of historical or future financial performance, financial position or cash flows that excludes amounts, or is subject to adjustments that effectively exclude amounts, included in the most directly comparable measure calculated and presented in accordance with US GAAP, and vice versa for measures that include amounts, or are subject to adjustments that effectively include amounts, that are excluded from the most directly comparable US GAAP measure so calculated and presented. For these purposes, "GAAP" refers to generally accepted accounting principles in the United States.
Non-GAAP financial measures disclosed by management are provided as additional information to investors, analysts and other parties because the Company believes them to be important supplemental measures for assessing our financial and operating results and as a means to evaluate our financial condition and period-to-period comparisons. These non-GAAP financial measures should be viewed as supplemental to, and should not be considered in isolation or as alternatives to, net earnings (loss), operating profit (loss), operating margin, cash flow from operating activities (together with cash flow from investing and financing activities), earnings per share or any other US GAAP financial measure. These non-GAAP financial measures should be considered within the context of our complete audited and unaudited financial results for the given period, which are available on the Financial Information/Financial Document Library page of our website, investors.celanese.com. The definition and method of calculation of the non-GAAP financial measures used herein may be different from other companies' methods for calculating measures with the same or similar titles. Investors, analysts and other parties should understand how another company calculates such non-GAAP financial measures before comparing the other company's non-GAAP financial measures to any of our own. These non-GAAP financial measures may not be indicative of the historical operating results of the Company nor are they intended to be predictive or projections of future results.
Pursuant to the requirements of SEC Regulation G, whenever we refer to a non-GAAP financial measure, we will also present in this document, in the presentation itself or on a Form 8-K in connection with the presentation on the Financial Information/Financial Document Library page of our website, investors.celanese.com, to the extent practicable, the most directly comparable financial measure calculated and presented in accordance with GAAP, along with a reconciliation of the differences between the non-GAAP financial measure we reference and such comparable GAAP financial measure.
This document includes definitions and reconciliations of non-GAAP financial measures used from time to time by the Company.
Specific Measures Used
This document provides information about the following non-GAAP measures: adjusted EBIT, adjusted EBIT margin, operating EBITDA, operating EBITDA margin, operating profit (loss) attributable to Celanese Corporation, adjusted earnings per share, net debt, free cash flow and return on invested capital (adjusted). The most directly comparable financial measure presented in accordance with US GAAP in our consolidated financial statements for adjusted EBIT and operating EBITDA is net earnings (loss) attributable to Celanese Corporation; for adjusted EBIT margin and operating EBITDA margin is operating margin; for operating profit (loss) attributable to Celanese Corporation is operating profit (loss); for adjusted earnings per share is earnings (loss) from continuing operations attributable to Celanese Corporation per common share-diluted; for net debt
1

celogo.jpg
is total debt; for free cash flow is net cash provided by (used in) operations; and for return on invested capital (adjusted) is net earnings (loss) attributable to Celanese Corporation divided by the sum of the average of beginning and end of the year short- and long-term debt and Celanese Corporation stockholders' equity.
Definitions
•Adjusted EBIT is a performance measure used by the Company and is defined by the Company as net earnings (loss) attributable to Celanese Corporation, plus (earnings) loss from discontinued operations, less interest income, plus interest expense, plus refinancing expense and taxes, and further adjusted for Certain Items (refer to Table 8). We believe that adjusted EBIT provides transparent and useful information to management, investors, analysts and other parties in evaluating and assessing our primary operating results from period-to-period after removing the impact of unusual, non-operational or restructuring-related activities that affect comparability. Our management recognizes that adjusted EBIT has inherent limitations because of the excluded items. Adjusted EBIT is one of the measures management uses for planning and budgeting, monitoring and evaluating financial and operating results and as a performance metric in the Company's incentive compensation plan. We do not provide reconciliations for adjusted EBIT on a forward-looking basis (including those contained in this document) when we are unable to provide a meaningful or accurate calculation or estimation of reconciling items and the information is not available without unreasonable effort. This is due to the inherent difficulty of forecasting the timing and amount of Certain Items, such as mark-to-market pension gains and losses, that have not yet occurred, are out of our control and/or cannot be reasonably predicted. For the same reasons, we are unable to address the probable significance of the unavailable information. Adjusted EBIT margin is defined by the Company as adjusted EBIT divided by net sales. Adjusted EBIT margin has the same uses and limitations as Adjusted EBIT.
•Operating EBITDA is a performance measure used by the Company and is defined by the Company as net earnings (loss) attributable to Celanese Corporation, plus (earnings) loss from discontinued operations, less interest income, plus interest expense, plus refinancing expense, taxes and depreciation and amortization, and further adjusted for Certain Items, which Certain Items include accelerated depreciation and amortization expense. Operating EBITDA is equal to adjusted EBIT plus depreciation and amortization. We believe that Operating EBITDA provides transparent and useful information to investors, analysts and other parties in evaluating our operating performance relative to our peer companies. Operating EBITDA margin is defined by the Company as Operating EBITDA divided by net sales. Operating EBITDA margin has the same uses and limitations as Operating EBITDA.
•Operating profit (loss) attributable to Celanese Corporation is defined by the Company as operating profit (loss), less earnings (loss) attributable to noncontrolling interests ("NCI"). We believe that operating profit (loss) attributable to Celanese Corporation provides transparent and useful information to management, investors, analysts and other parties in evaluating our core operational performance. Operating margin attributable to Celanese Corporation is defined by the Company as operating profit (loss) attributable to Celanese Corporation divided by net sales. Operating margin attributable to Celanese Corporation has the same uses and limitations as Operating profit (loss) attributable to Celanese Corporation.
•Adjusted earnings per share is a performance measure used by the Company and is defined by the Company as earnings (loss) from continuing operations attributable to Celanese Corporation, adjusted for income tax (provision) benefit, Certain Items, and refinancing and related expenses, divided by the number of basic common shares and dilutive restricted stock units and stock options calculated using the treasury method. We believe that adjusted earnings per share provides transparent and useful information to management, investors, analysts and other parties in evaluating and assessing our primary operating results from period-to-period after removing the impact of the above stated items that affect comparability and as a performance metric in the Company's incentive compensation plan. We do not provide reconciliations for adjusted earnings per share on a forward-looking basis (including those contained in this document) when we are unable to provide a meaningful or accurate calculation or estimation of reconciling items and the information is not available without unreasonable effort. This is due to the inherent difficulty of forecasting the timing and amount of Certain Items, such as mark-to-market pension gains and losses, that have not yet occurred, are out of our control and/or cannot be reasonably predicted. For the same reasons, we are unable to address the probable significance of the unavailable information.
Note: The income tax expense (benefit) on Certain Items ("Non-GAAP adjustments") is determined using the applicable rates in the taxing jurisdictions in which the Non-GAAP adjustments occurred and includes both current and deferred income tax expense (benefit). The income tax rate used for adjusted earnings per share approximates the midpoint in a range of forecasted tax rates for the year. This range may include certain partial or full-year forecasted tax opportunities and related costs, where applicable, and specifically excludes changes in uncertain tax positions, discrete recognition of GAAP items on a quarterly basis, other pre-tax items adjusted out of our GAAP earnings for adjusted earnings per share purposes and changes in management's assessments regarding the ability to realize deferred tax assets for GAAP. In determining the adjusted earnings per share tax rate, we reflect the impact of foreign tax credits when utilized, or expected to be utilized, absent discrete events impacting the timing of foreign tax credit utilization. We analyze this rate quarterly and adjust it if there is a material change in the range of forecasted tax rates; an updated forecast would not necessarily result in a change to our tax rate used for adjusted earnings per share. The adjusted tax rate is an estimate and may differ from the actual tax rate used for GAAP reporting in any given reporting period. Table 3a summarizes the reconciliation of our estimated GAAP effective tax rate to the adjusted tax rate. The estimated GAAP rate excludes discrete recognition of GAAP items due to our inability to forecast such items. As part of the year-end reconciliation, we will update the reconciliation of the GAAP effective tax rate to the adjusted tax rate for actual results.
2

celogo.jpg
•Free cash flow is a liquidity measure used by the Company and is defined by the Company as net cash provided by (used in) operations, less capital expenditures on property, plant and equipment, and adjusted for contributions from or distributions to our NCI joint ventures. We believe that free cash flow provides useful information to management, investors, analysts and other parties in evaluating the Company's liquidity and credit quality assessment because it provides an indication of the long-term cash generating ability of our business. Although we use free cash flow as a measure to assess the liquidity generated by our business, the use of free cash flow has important limitations, including that free cash flow does not reflect the cash requirements necessary to service our indebtedness, lease obligations, unconditional purchase obligations or pension and postretirement funding obligations. Free cash flow is not a measure of cash available for discretionary expenditures since the Company has certain debt service and finance lease payments that are not deducted from that measure. We do not provide reconciliations for free cash flow on a forward-looking basis when we are unable to provide a meaningful or accurate calculation or estimation of reconciling items and the information is not available without unreasonable effort. This is due to the inherent difficulty of forecasting the timing and amount of items such as working capital changes, fluctuations in foreign currency exchange rates, the impact and timing of potential acquisitions and divestitures, and other structural changes, that have not yet occurred, are out of our control and/or cannot be reasonably predicted. For the same reasons, we are unable to address the probable significance of the unavailable information.
•Net debt is defined by the Company as total debt less cash and cash equivalents. We believe that net debt provides useful information to management, investors, analysts and other parties in evaluating changes to the Company's capital structure and credit quality assessment.
•Return on invested capital (adjusted) is defined by the Company as adjusted EBIT, tax effected using the adjusted tax rate, divided by the sum of the average of beginning and end of the year short- and long-term debt and Celanese Corporation stockholders' equity. We believe that return on invested capital (adjusted) provides useful information to management, investors, analysts and other parties in order to assess our income generation from the point of view of our stockholders and creditors who provide us with capital in the form of equity and debt and whether capital invested in the Company yields competitive returns.
Supplemental Information
Supplemental Information we believe to be of interest to investors, analysts and other parties includes the following:
•Net sales for each of our business segments and the percentage increase or decrease in net sales attributable to price, volume, currency and other factors for each of our business segments.
•Cash dividends received from our equity investments.
•For those consolidated ventures in which the Company owns or is exposed to less than 100% of the economics, the outside stockholders' interests are shown as NCI. Amounts referred to as "attributable to Celanese Corporation" are net of any applicable NCI.
Results Unaudited
The results in this document, together with the adjustments made to present the results on a comparable basis, have not been audited and are based on internal financial data furnished to management. Quarterly results should not be taken as an indication of the results of operations to be reported for any subsequent period or for the full fiscal year.
3

celogo.jpg
Table 1
Celanese Adjusted EBIT and Operating EBITDA - Reconciliation of Non-GAAP Measures - Unaudited
2023 Q4 '23 Q3 '23 Q2 '23 Q1 '23 2022 Q4 '22 Q3 '22 Q2 '22 Q1 '22
(In $ millions)
Net earnings (loss) attributable to Celanese Corporation 1,960  698  951  220  91  1,894  767  191  434  502 
(Earnings) loss from discontinued operations (1) — 
Interest income (39) (12) (12) (7) (8) (69) (33) (34) (1) (1)
Interest expense 720  178  178  182  182  405  168  154  48  35 
Refinancing expense —  —  —  —  —  —  —  — 
Income tax provision (benefit) (790) (575) (236) (4) 25  (489) (840) 127  112  112 
Certain Items attributable to Celanese Corporation (Table 8)
(114) 139  (438) 54  131  422  239  71  47  65 
Adjusted EBIT 1,753  434  451  444  424  2,171  302  510  646  713 
Depreciation and amortization expense(1)
691  174  173  172  172  446  151  97  98  100 
Operating EBITDA 2,444  608  624  616  596  2,617  453  607  744  813 
2023 Q4 '23 Q3 '23 Q2 '23 Q1 '23 2022 Q4 '22 Q3 '22 Q2 '22 Q1 '22
(In $ millions)
Engineered Materials 15  15  —  —  —  13 
Acetyl Chain —  —  —  —  —  —  —  — 
Other Activities(2)
—  —  —  —  —  —  —  — 
Accelerated depreciation and amortization expense 15  15  —  —  —  16 
Depreciation and amortization expense(1)
691  174  173  172  172  446  151  97  98  100 
Total depreciation and amortization expense 706  189  173  172  172  462  153  100  103  106 
______________________________
(1)Excludes accelerated depreciation and amortization expense as detailed in the table above, which amounts are included in Certain Items above.
(2)Other Activities includes corporate Selling, general and administrative ("SG&A") expenses, results of captive insurance companies and certain components of net periodic benefit cost (interest cost, expected return on plan assets and net actuarial gains and losses).
4

celogo.jpg
Table 1a
M&M Adjusted EBIT and Operating EBITDA - Reconciliation of Non-GAAP Measures - Unaudited
2023 Q4 '23 Q3 '23 Q2 '23 Q1 '23 Q4 '22
(In $ millions)
Net earnings (loss) attributable to M&M 24  (22) 47  47  (48) (69) (3)
Income tax provision (benefit) 65  43  10  (1) 13 
Certain Items(1)
151  30  17  18  86  72 
Adjusted EBIT 240  51  74  64  51 
Depreciation and amortization expense 275  69  70  68  68  47 
Operating EBITDA(2)
515  120  144  132  119  56  (4)
______________________________
(1)Amount is included within total Certain Items shown in Table 8.
(2)Excludes $(22) million, $(19) million, $(23) million, $(23) million and $(17) million of Operating EBITDA included in Other Activities for the three months ended December 31, 2023, September 30, 2023, June 30, 2023, March 31, 2023 and December 31, 2022, respectively.
(3)Excludes $30 million of Net loss for the month ended October 31, 2022, prior to our acquisition of the majority of the Mobility & Materials business ("M&M Business") of DuPont de Nemours, Inc.
(4)Excludes $22 million of Operating EBITDA for the month ended October 31, 2022, prior to our acquisition of the M&M Business.
5

Table 2 - Supplemental Segment Data and Reconciliation of Segment Adjusted EBIT and Operating EBITDA - Non-GAAP Measures - Unaudited
celogo.jpg
2023 Q4 '23 Q3 '23 Q2 '23 Q1 '23 2022 Q4 '22 Q3 '22 Q2 '22 Q1 '22
(In $ millions, except percentages)
Operating Profit (Loss) / Operating Margin
Engineered Materials 1,083  17.6  % 122  8.7  % 691  45.2  % 158  10.0  % 112  6.9  % 429  10.7  % 25  2.0  % 114  12.3  % 166  17.5  % 124  13.6  %
Acetyl Chain 1,109  22.7  % 264  22.4  % 272  22.3  % 295  23.9  % 278  22.2  % 1,447  25.2  % 204  18.0  % 312  22.3  % 428  27.5  % 503  30.4  %
Other Activities(1)
(505) (127) (121) (118) (139) (498) (173) (118) (111) (96)
Total 1,687  15.4  % 259  10.1  % 842  30.9  % 335  12.0  % 251  8.8  % 1,378  14.2  % 56  2.4  % 308  13.4  % 483  19.4  % 531  20.9  %
Less: Net Earnings (Loss) Attributable to NCI for Engineered Materials (3) (2) (2) —  —  —  —  —  — 
Less: Net Earnings (Loss) Attributable to NCI for Acetyl Chain — 
Operating Profit (Loss) Attributable to Celanese Corporation 1,683  15.4  % 256  10.0  % 844  31.0  % 334  11.9  % 249  8.7  % 1,370  14.2  % 54  2.3  % 306  13.3  % 481  19.3  % 529  20.8  %
Operating Profit (Loss) / Operating Margin Attributable to Celanese Corporation
Engineered Materials 1,086  17.7  % 121  8.6  % 693  45.4  % 160  10.1  % 112  6.9  % 429  10.7  % 25  2.0  % 114  12.3  % 166  17.5  % 124  13.6  %
Acetyl Chain 1,102  22.6  % 262  22.2  % 272  22.3  % 292  23.7  % 276  22.1  % 1,439  25.1  % 202  17.8  % 310  22.2  % 426  27.3  % 501  30.3  %
Other Activities(1)
(505) (127) (121) (118) (139) (498) (173) (118) (111) (96)
Total 1,683  15.4  % 256  10.0  % 844  31.0  % 334  11.9  % 249  8.7  % 1,370  14.2  % 54  2.3  % 306  13.3  % 481  19.3  % 529  20.8  %
Equity Earnings and Dividend Income, Other Income (Expense) Attributable to Celanese Corporation
Engineered Materials 87  45  12  20  10  207  35  70  53  49 
Acetyl Chain 132  33  33  32  34  143  30  34  39  40 
Other Activities(1)
34  28  (1) 12 
Total 253  106  46  58  43  362  66  108  93  95 
Non-Operating Pension and Other Post-Retirement Employee Benefit (Expense) Income Attributable to Celanese Corporation
Engineered Materials (1) (1) —  —  —  —  —  —  —  — 
Acetyl Chain —  —  —  —  —  —  —  —  —  — 
Other Activities(1)
(68) (66) (1) (2) 17  (57) 25  25  24 
Total (69) (67) (1) (2) 17  (57) 25  25  24 
Certain Items Attributable to Celanese Corporation (Table 8)
Engineered Materials (324) 34  (476) 25  93  143  78  22  38 
Acetyl Chain 24  27  10  10 
Other Activities(1)
186  100  33  21  32  252  151  44  32  25 
Total (114) 139  (438) 54  131  422  239  71  47  65 
Adjusted EBIT / Adjusted EBIT Margin
Engineered Materials 848  13.8  % 199  14.2  % 229  15.0  % 205  12.9  % 215  13.2  % 779  19.4  % 138  11.2  % 206  22.2  % 224  23.6  % 211  23.2  %
Acetyl Chain 1,258  25.8  % 300  25.4  % 310  25.4  % 332  26.9  % 316  25.3  % 1,609  28.0  % 242  21.3  % 349  25.0  % 475  30.5  % 543  32.9  %
Other Activities(1)
(353) (65) (88) (93) (107) (217) (78) (45) (53) (41)
Total 1,753  16.0  % 434  16.9  % 451  16.6  % 444  15.9  % 424  14.9  % 2,171  22.4  % 302  12.9  % 510  22.2  % 646  26.0  % 713  28.1  %
___________________________
(1)Other Activities includes corporate SG&A expenses, results of captive insurance companies and certain components of net periodic benefit cost (interest cost, expected return on plan assets and net actuarial gains and losses).
6

Table 2 - Supplemental Segment Data and Reconciliation of Segment Adjusted EBIT and Operating EBITDA - Non-GAAP Measures - Unaudited (cont.)
celogo.jpg
2023 Q4 '23 Q3 '23 Q2 '23 Q1 '23 2022 Q4 '22 Q3 '22 Q2 '22 Q1 '22
(In $ millions, except percentages)
Depreciation and Amortization Expense(1)
Engineered Materials 447  112  111  112  112  213  90  40  41  42 
Acetyl Chain 217  54  55  54  54  211  52  53  52  54 
Other Activities(2)
27  22 
Total 691  174  173  172  172  446  151  97  98  100 
Operating EBITDA / Operating EBITDA Margin
Engineered Materials 1,295  21.1  % 311  22.1  % 340  22.3  % 317  20.0  % 327  20.1  % 992  24.7  % 228  18.4  % 246  26.5  % 265  28.0  % 253  27.8  %
Acetyl Chain 1,475  30.2  % 354  30.0  % 365  29.9  % 386  31.3  % 370  29.6  % 1,820  31.7  % 294  25.9  % 402  28.8  % 527  33.8  % 597  36.1  %
Other Activities(2)
(326) (57) (81) (87) (101) (195) (69) (41) (48) (37)
Total 2,444  22.3  % 608  23.7  % 624  22.9  % 616  22.0  % 596  20.9  % 2,617  27.1  % 453  19.3  % 607  26.4  % 744  29.9  % 813  32.0  %
___________________________
(1)Excludes accelerated depreciation and amortization expense, which amounts are included in Certain Items above. See Table 1 for details.
(2)Other Activities includes corporate SG&A expenses, results of captive insurance companies and certain components of net periodic benefit cost (interest cost, expected return on plan assets and net actuarial gains and losses).
7

celogo.jpg
Table 3
Adjusted Earnings (Loss) per Share - Reconciliation of a Non-GAAP Measure - Unaudited
2023 Q4 '23 Q3 '23 Q2 '23 Q1 '23 2022 Q4 '22 Q3 '22 Q2 '22 Q1 '22
per share per share per share per share per share per share per share per share per share per share
(In $ millions, except per share data)
Earnings (loss) from continuing operations attributable to Celanese Corporation 1,969  18.00  704  6.43  952  8.70  219  2.00  94  0.86  1,902  17.41  768  7.03  192  1.76  440  4.03  502  4.61 
Income tax provision (benefit) (790) (575) (236) (4) 25  (489) (840) 127  112  112 
Earnings (loss) from continuing operations before tax 1,179  129  716  215  119  1,413  (72) 319  552  614 
Certain Items attributable to Celanese Corporation (Table 8)
(114) 139  (438) 54  131  422  239  71  47  65 
Refinancing and related expenses —  —  —  158  (1) 14  (1) 104  (1) 26  (1) 14  (1)
Adjusted earnings (loss) from continuing operations before tax 1,072  268  285  269  250  1,993  181  494  625  693 
Income tax (provision) benefit on adjusted earnings(2)
(96) (23) (11) (32) (30) (259) (24) (64) (81) (90)
Adjusted earnings (loss) from continuing operations(3)
976  8.92  245  2.24  274  2.50  237  2.17  220  2.01  1,734  15.88  157  1.44  430  3.94  544  4.99  603  5.54 
Diluted shares (in millions)(4)
Weighted average shares outstanding 108.8  109.0  108.9  108.9  108.6  108.4  108.5  108.4  108.4  108.2 
Incremental shares attributable to equity awards 0.6  0.5  0.5  0.4  0.6  0.8  0.7  0.7  0.7  0.7 
Total diluted shares 109.4  109.5  109.4  109.3  109.2  109.2  109.2  109.1  109.1  108.9 
______________________________
(1)Includes net interest expense and certain fees related to debt issued as part of our acquisition of the M&M Business.
(2)Calculated using adjusted effective tax rates (Table 3a) as follows:
2023 Q4 '23 Q3 '23 Q2 '23 Q1 '23 2022 Q4 '22 Q3 '22 Q2 '22 Q1 '22
Adjusted effective tax rate 12  12  13  13  13  13  13 
(3)Excludes the immediate recognition of actuarial gains and losses and the impact of actual vs. expected plan asset returns.
Actual Plan Asset Returns Expected Plan Asset Returns
(In percentages)
Q4 '23 & 2023 8.1  5.2 
Q4 '22 & 2022 (18.4) 5.4 
(4)Potentially dilutive shares are included in the adjusted earnings per share calculation when adjusted earnings are positive.
8

celogo.jpg
Table 3a
Adjusted Tax Rate - Reconciliation of a Non-GAAP Measure - Unaudited
Actual
2023 2022
(In percentages)
US GAAP annual effective tax rate (67) (34)
Discrete quarterly recognition of GAAP items(1)
(6)
Tax impact of other charges and adjustments(2)
(3)
Changes in valuation allowances, excluding impact of other charges and adjustments(3)
13  (1)
Other, includes effect of discrete current year transactions(4)(5)
64  45 
Adjusted tax rate 13 
______________________________
Note: As part of the year-end reconciliation, we updated the reconciliation of the GAAP effective tax rate for actual results.
(1)Such as changes in tax laws (including US tax reform), deferred taxes on outside basis differences, changes in uncertain tax positions and prior year audit adjustments.
(2)Reflects the tax impact on pre-tax adjustments presented in Certain Items (Table 8), which are excluded from pre-tax income for adjusted earnings per share purposes.
(3)Reflects changes in valuation allowances related to changes in judgment regarding the realizability of deferred tax assets or current year operations, excluding other charges and adjustments.
(4)Includes tax impacts related to full-year actual tax opportunities and related costs.
(5)Includes the reversal of certain U.S. GAAP deferred tax benefits related to non-recurring internal restructuring transactions related to the M&M acquisition, to centralize ownership of intellectual property with the business and to facilitate future deployment of cash to service acquisition indebtedness. Certain benefits of the internal restructuring will be realized in future periods for adjusted earnings purposes.
9

celogo.jpg
Table 4
Net Sales by Segment - Unaudited
2023 Q4 '23 Q3 '23 Q2 '23 Q1 '23 2022 Q4 '22 Q3 '22 Q2 '22 Q1 '22
(In $ millions)
Engineered Materials 6,149  1,406  1,528  1,585  1,630  4,024  1,237  929  948  910 
Acetyl Chain 4,884  1,181  1,220  1,233  1,250  5,743  1,135  1,397  1,559  1,652 
Intersegment eliminations(1)
(93) (18) (25) (23) (27) (94) (24) (25) (21) (24)
Net sales 10,940  2,569  2,723  2,795  2,853  9,673  2,348  2,301  2,486  2,538 
___________________________
(1)Includes intersegment sales primarily related to the Acetyl Chain.
10

celogo.jpg
Table 4a
Factors Affecting Segment Net Sales Sequentially - Unaudited
Three Months Ended December 31, 2023 Compared to Three Months Ended September 30, 2023
Volume Price Currency Total
  (In percentages)
Engineered Materials (5) (3) —  (8)
Acetyl Chain —  (3) —  (3)

Total Company (3) (3) —  (6)
Three Months Ended September 30, 2023 Compared to Three Months Ended June 30, 2023
Volume Price Currency Total
(In percentages)
Engineered Materials (1) (3) —  (4)
Acetyl Chain (3) (1) (1)

Total Company (3) (1) (3)
Three Months Ended June 30, 2023 Compared to Three Months Ended March 31, 2023
Volume Price Currency Total
(In percentages)
Engineered Materials (5) —  (3)
Acetyl Chain (3) —  (1)

Total Company (4) —  (2)
Three Months Ended March 31, 2023 Compared to Three Months Ended December 31, 2022
Volume Price Currency Total
(In percentages)
Engineered Materials 34  (4) 32 
Acetyl Chain 10  (2) 10 

Total Company 19  (4) 17 
________________________
(1)2022 includes the effect of the acquisition of the majority of the M&M Business.

Three Months Ended December 31, 2022 Compared to Three Months Ended September 30, 2022
Volume Price Currency Total
(In percentages)
Engineered Materials 34  (1) —  33 
(1)
Acetyl Chain (9) (10) —  (19)

Total Company (6) — 
Three Months Ended September 30, 2022 Compared to Three Months Ended June 30, 2022
Volume Price Currency Total
(In percentages)
Engineered Materials (1) (3) (2)
Acetyl Chain (3) (5) (2) (10)

Total Company (2) (3) (2) (7)
Three Months Ended June 30, 2022 Compared to Three Months Ended March 31, 2022
Volume Price Currency Total
  (In percentages)
Engineered Materials (3)
Acetyl Chain (6) (2) (6)

Total Company (2) (2) (2)
Three Months Ended March 31, 2022 Compared to Three Months Ended December 31, 2021
Volume Price Currency Total
  (In percentages)
Engineered Materials 23  (1) 29 
Acetyl Chain (3) — 

Total Company 12  (1) 12 
11

celogo.jpg
Table 4b
Factors Affecting Segment Net Sales Year Over Year - Unaudited
Three Months Ended December 31, 2023 Compared to Three Months Ended December 31, 2022
Volume Price Currency Total
  (In percentages)
Engineered Materials 21  (8) 14 
Acetyl Chain 14  (11)
Total Company 18  (10)
Three Months Ended September 30, 2023 Compared to Three Months Ended September 30, 2022
Volume Price Currency Total
(In percentages)
Engineered Materials 75  (12) 64 
Acetyl Chain (18) (13)
Total Company 33  (16) 18 
Three Months Ended June 30, 2023 Compared to Three Months Ended June 30, 2022
Volume Price Currency Total
(In percentages)
Engineered Materials 75  (8) —  67 
Acetyl Chain (2) (19) —  (21)
Total Company 27  (15) —  12 
Three Months Ended March 31, 2023 Compared to Three Months Ended March 31, 2022
Volume Price Currency Total
(In percentages)
Engineered Materials 80  (3) 79 
Acetyl Chain (9) (13) (2) (24)
Total Company 23  (8) (3) 12 

Three Months Ended December 31, 2022 Compared to Three Months Ended December 31, 2021
Volume Price Currency Total
  (In percentages)
Engineered Materials 67  17  (9) 75 
Acetyl Chain (12) (14) (3) (29)
Total Company 13  (5) (5)
Three Months Ended September 30, 2022 Compared to Three Months Ended September 30, 2021
Volume Price Currency Total
  (In percentages)
Engineered Materials 23  25  (12) 36 
Acetyl Chain (10) (5) (13)
Total Company (2) (5)
Three Months Ended June 30, 2022 Compared to Three Months Ended June 30, 2021
Volume Price Currency Total
  (In percentages)
Engineered Materials 24  24  (9) 39 
Acetyl Chain (5) 11  (4)
Total Company 14  (4) 13 
Three Months Ended March 31, 2022 Compared to Three Months Ended March 31, 2021
Volume Price Currency Total
  (In percentages)
Engineered Materials 20  25  (4) 41 
Acetyl Chain 38  (3) 42 
Total Company 12  32  (3) 41 
12

celogo.jpg
Table 4c
Factors Affecting Segment Net Sales Year Over Year - Unaudited
Year Ended December 31, 2023 Compared to Year Ended December 31, 2022
Volume Price Currency Total
  (In percentages)
Engineered Materials 54  (1) —  53 
Acetyl Chain (17) —  (15)
Total Company 23  (10) —  13 
Year Ended December 31, 2022 Compared to Year Ended December 31, 2021
Volume Price Currency Total
  (In percentages)
Engineered Materials 33  23  (8) 48 
Acetyl Chain (6) (3) (3)
Total Company 11  (4) 13 

13

celogo.jpg
Table 5
Free Cash Flow - Reconciliation of a Non-GAAP Measure - Unaudited
2023 Q4 '23 Q3 '23 Q2 '23 Q1 '23 2022 Q4 '22 Q3 '22 Q2 '22 Q1 '22
(In $ millions, except percentages)
Net cash provided by (used in) investing activities (134) (168) 375  (163) (178) (11,141) (10,713) (143) (136) (149)
Net cash provided by (used in) financing activities (1,456) (240) (700) (447) (69) 10,290  1,944  8,600  (159) (95)
Net cash provided by (used in) operating activities 1,899  830  403  762  (96) 1,819  541  467  495  316 
Capital expenditures on property, plant and equipment (568) (128) (131) (145) (164) (543) (143) (139) (124) (137)
Contributions from/(Distributions) to NCI (11) —  (4) (6) (1) (13) (3) (3) (3) (4)
Free cash flow(1)
1,320  702  268  611  (261) 1,263  395  325  368  175 
Net sales 10,940  2,569  2,723  2,795  2,853  9,673  2,348  2,301  2,486  2,538 
Free cash flow as % of Net sales 12.1  % 27.3  % 9.8  % 21.9  % (9.1) % 13.1  % 16.8  % 14.1  % 14.8  % 6.9  %
______________________________
(1)Free cash flow is a liquidity measure used by the Company and is defined by the Company as net cash provided by (used in) operating activities, less capital expenditures on property, plant and equipment, and adjusted for contributions from or distributions to our NCI joint ventures.
14

celogo.jpg
Table 6
Cash Dividends Received - Unaudited
2023 Q4 '23 Q3 '23 Q2 '23 Q1 '23 2022 Q4 '22 Q3 '22 Q2 '22 Q1 '22
(In $ millions)
Dividends from equity method investments 157  85  25  40  217  82  27  82  26 
Dividends from equity investments without readily determinable fair values 126  31  30  31  34  133  30  30  36  37 
Total 283  116  37  56  74  350  112  57  118  63 
Table 7
Net Debt - Reconciliation of a Non-GAAP Measure - Unaudited
2023 Q4 '23 Q3 '23 Q2 '23 Q1 '23 2022 Q4 '22 Q3 '22 Q2 '22 Q1 '22
(In $ millions)
Short-term borrowings and current installments of long-term debt - third party and affiliates 1,383  1,383  1,408  1,507  1,386  1,306  1,306  977  809  860 
Long-term debt, net of unamortized deferred financing costs 12,301  12,301  12,291  12,889  13,396  13,373  13,373  11,360  3,022  3,132 
Total debt 13,684  13,684  13,699  14,396  14,782  14,679  14,679  12,337  3,831  3,992 
Cash and cash equivalents (1,805) (1,805) (1,357) (1,296) (1,167) (1,508) (1,508) (9,671) (783) (605)
Net debt 11,879  11,879  12,342  13,100  13,615  13,171  13,171  2,666  3,048  3,387 
15

celogo.jpg
Table 8
Certain Items - Unaudited
The following Certain Items attributable to Celanese Corporation are included in Net earnings (loss) and are adjustments to non-GAAP measures:
2023 Q4 '23 Q3 '23 Q2 '23 Q1 '23 2022 Q4 '22 Q3 '22 Q2 '22 Q1 '22 Income Statement Classification
(In $ millions)
Exit and shutdown costs 89  33  21  26  52  14  29  Cost of sales / SG&A / Other (charges) gains, net / Gain (loss) on disposition of businesses and assets, net / Non-operating pension and other postretirement employee benefit (expense) income
Asset impairments 15  —  —  13  12  (1) —  Cost of sales / Other (charges) gains, net
Impact from plant incidents and natural disasters(1)
—  —  —  17  17  —  —  —  Cost of sales
Mergers, acquisitions and dispositions 195  27  46  23  99  267  138  44  29  56  Cost of sales / SG&A
Actuarial (gain) loss on pension and postretirement plans 69  69  —  —  —  80  80  —  —  —  Cost of sales / SG&A / Non-operating pension and other postretirement employee benefit (expense) income
Legal settlements and commercial disputes 12  —  —  —  Cost of sales / SG&A / Other (charges) gains, net
(Gain) loss on disposition of businesses and assets (510) (3) (508) —  (13) (1) —  (12) —  Gain (loss) on disposition of businesses and assets, net
Other 10  —  —  —  Cost of sales / SG&A
Certain Items attributable to Celanese Corporation (114) 139  (438) 54  131  422  239  71  47  65 
___________________________
(1)Primarily associated with Winter Storm Elliott.

16

celogo.jpg
Table 9
Return on Invested Capital (Adjusted) - Presentation of a Non-GAAP Measure - Unaudited
2023 2022
(In $ millions, except percentages) (In $ millions, except percentages)
Net earnings (loss) attributable to Celanese Corporation 1,960  1,894 
Adjusted EBIT (Table 1)
1,753  2,171 
Adjusted effective tax rate (Table 3a)
% 13  %
Adjusted EBIT tax effected 1,595  1,889 
2023 2022 Average 2022 2021 Average
(In $ millions, except percentages)
Short-term borrowings and current installments of long-term debt - third parties and affiliates 1,383  1,306  1,345  1,306  791  1,049 
Long-term debt, net of unamortized deferred financing costs 12,301  13,373  12,837  13,373  3,176  8,275 
Celanese Corporation stockholders' equity 7,091  5,637  6,364  5,637  4,189  4,913 
Invested capital 20,546  14,237 
Return on invested capital (adjusted) 7.8  % 13.3  %
Net earnings (loss) attributable to Celanese Corporation as a percentage of invested capital 9.5  % 13.3  %
17