株探米国株
日本語 英語
エドガーで原本を確認する
0001306830false00013068302023-08-072023-08-070001306830us-gaap:CommonStockMember2023-08-072023-08-070001306830ce:EURSeniorUnsecuredNotesDue2023Member2023-08-072023-08-070001306830ce:EURSeniorUnsecuredNotesDue2025Member2023-08-072023-08-070001306830ce:EURSeniorUnsecuredNotesDue2026Member2023-08-072023-08-070001306830ce:EURSeniorUnsecuredNotesDue2027Member2023-08-072023-08-070001306830ce:EURSeniorUnsecuredNotesDue2028Member2023-08-072023-08-070001306830ce:EURSeniorUnsecuredNotesDue2029Member2023-08-072023-08-07

UNITED STATES
SECURITIES AND EXCHANGE COMMISSION
Washington, D.C. 20549
FORM 8-K
CURRENT REPORT
Pursuant to Section 13 or 15(d) of the Securities Exchange Act of 1934
Date of Report (Date of earliest event reported): August 7, 2023
CELANESE CORPORATION
(Exact name of registrant as specified in its charter)
Delaware 001-32410 98-0420726
     
(State or other jurisdiction
of incorporation)
(Commission File
Number)
(IRS Employer
Identification No.)
222 West Las Colinas Blvd. Suite 900N, Irving, TX 75039
(Address of Principal Executive Offices) (Zip Code)
Registrant's telephone number, including area code: (972) 443-4000

N/A
(Former name or former address, if changed since last report)
Check the appropriate box below if the Form 8-K filing is intended to simultaneously satisfy the filing obligation of the registrant under any of the following provisions (see General Instruction A.2. below):
☐   Written communications pursuant to Rule 425 under the Securities Act (17 CFR 230.425)
☐   Soliciting material pursuant to Rule 14a-12 under the Exchange Act (17 CFR 240.14a-12)
☐   Pre-commencement communications pursuant to Rule 14d-2(b) under the Exchange Act (17 CFR 240.14d-2(b))
☐   Pre-commencement communications pursuant to Rule 13e-4(c) under the Exchange Act (17 CFR 240.13e-4(c))
Securities registered pursuant to Section 12(b) of the Act:
Title of Each Class Trading Symbol(s)  Name of Each Exchange on Which Registered
Common Stock, par value $0.0001 per share CE The New York Stock Exchange
1.125% Senior Notes due 2023 CE /23 The New York Stock Exchange
1.250% Senior Notes due 2025 CE /25 The New York Stock Exchange
4.777% Senior Notes due 2026 CE /26A The New York Stock Exchange
2.125% Senior Notes due 2027 CE /27 The New York Stock Exchange
0.625% Senior Notes due 2028 CE /28 The New York Stock Exchange
5.337% Senior Notes due 2029 CE /29A The New York Stock Exchange
Indicate by check mark whether the registrant is an emerging growth company as defined in Rule 405 of the Securities Act of 1933 or Rule 12b-2 of the Securities Exchange Act of 1934.
Emerging growth company  ☐
If an emerging growth company, indicate by check mark if the registrant has elected not to use the extended transition period for complying with any new or revised financial accounting standards provided pursuant to Section 13(a) of the Exchange Act.  ☐
1


Item 7.01 Regulation FD Disclosure
On August 8, 2023, Lori J. Ryerkerk, Chair of the Board of Directors, Chief Executive Officer and President of Celanese Corporation (the "Company"), will make a presentation to investors and analysts via a webcast hosted by the Company at 10:00 a.m. ET (9:00 a.m. CT) regarding the Company's financial results for its second quarter 2023. The webcast, press release and prepared remarks from management may be accessed on our website at investors.celanese.com under News & Events / Events Calendar. A copy of the prepared remarks posted for the webcast is attached to this Current Report on Form 8-K ("Current Report") as Exhibit 99.1(a) and is incorporated herein solely for purposes of this Item 7.01 disclosure. During the webcast, management may make, and management's prepared remarks contain, references to certain Non-US GAAP financial measures. Non-US GAAP financial measures appearing in management's prepared remarks are defined and reconciled to the most comparable US GAAP financial measure in our Non-US GAAP Financial Measures and Supplemental Information document furnished with this Current Report as Exhibit 99.2 (and available on our website) and incorporated herein solely for purpose of this Item 7.01 disclosure.
Item 9.01 Financial Statements and Exhibits
(d) The following exhibits are being furnished herewith:
Exhibit
Number
 
Description
99.1(a)
99.2
104 Cover Page Interactive Data File (the cover page XBRL tags are embedded within the inline XBRL document contained in Exhibit 101)
* In connection with the disclosure set forth in Item 7.01, the information in this Current Report, including the exhibits attached hereto, is being furnished and shall not be deemed "filed" for purposes of Section 18 of the Securities Exchange Act of 1934, as amended (the "Exchange Act"), or otherwise subject to the liabilities of such section. The information in this Current Report, including the exhibits, shall not be incorporated by reference into any filing under the Securities Act of 1933, as amended, or the Exchange Act, regardless of any incorporation by reference language in any such filing. This Current Report will not be deemed an admission as to the materiality of any information in this Current Report that is required to be disclosed solely by Regulation FD.
2


SIGNATURES
Pursuant to the requirements of the Securities Exchange Act of 1934, the registrant has duly caused this report to be signed on its behalf by the undersigned hereunto duly authorized.
       
 
CELANESE CORPORATION
 
  By: /s/ MICHAEL R. SULLIVAN
  Name:  Michael R. Sullivan
  Title:   Vice President, Deputy General Counsel and Assistant Corporate Secretary 
 
Date: August 7, 2023
3
EX-99.1(A) 2 q220238-kex991a.htm EX-99.1(A) Document

Exhibit 99.1(a)
picture2a.jpg
Second Quarter 2023 Earnings Prepared Comments
Brandon Ayache, Celanese Corporation, Vice President, Investor Relations
This is the Celanese Corporation second quarter 2023 earnings prepared comments. The Celanese Corporation second quarter 2023 earnings release was distributed via Business Wire this afternoon and posted on our investor relations website, investors.celanese.com. As a reminder, some of the matters discussed below may include forward-looking statements concerning, for example, our future objectives and plans. Please note the cautionary language contained at the end of these comments. Also, some of the matters discussed include references to non-GAAP financial measures. Explanations of these measures and reconciliations to the comparable GAAP measures are included on our investor relations website under Financial Information/Non-GAAP Financial Measures. The earnings release and non-GAAP information and the reconciliations are being furnished to the SEC in a Current Report on Form 8-K. These prepared comments are also being furnished to the SEC in a separate Current Report on Form 8-K.
On the earnings conference call tomorrow morning, management will be available to answer questions.

Lori Ryerkerk, Celanese Corporation, Chair of the Board and Chief Executive Officer
Today we reported second quarter 2023 free cash flow of $611 million and adjusted earnings per share of $2.17 (inclusive of approximately $0.30 per share of Mobility & Materials (M&M) transaction amortization1). In a very challenging environment, our teams worked numerous actions to deliver record free cash flow in the quarter as well as a sequential lift in earnings. We are initiating further controllable actions across the remainder of 2023 to support earnings growth in the second half amid a backdrop that remains unpredictable.
The business conditions we see across the globe remain complex and uneven. Current demand levels vary dramatically across our end-markets with resilience in medical, auto, and packaging countering poor conditions in consumer electronics, construction, industrial, and distribution. Volatility in underlying demand in the second quarter was amplified by continued destocking in certain end-markets, particularly
1 Calculated as intangible amortization from the M&M transaction divided by diluted weighted average shares outstanding
1


in Engineered Materials (EM). This destocking cycle has persisted longer than what our businesses have experienced in the past. I believe this is due to the combination of soft demand and falling raw material pricing across all regions which continues to spur inventory reductions and order deferrals by our customers. As a result of these conditions, sequential volumes across Celanese increased by 2 percent in what is typically a seasonally strong quarter. Amid demand softness across the industry, we are seeing heightened competitive dynamics across all regions. Our teams have been vigilant in assessing real-time pricing pressures to protect certain commercial positions.
The visibility we have within our order book is increasingly limited as lead times are shortening and customers are increasingly changing orders due to volatile demand signals and channel corrections. The demand volatility we are experiencing across 2023 has, in some ways, been the downstream equivalent of the raw material and logistics supply chain volatility we saw in 2021. We are again seeing significant shifts in product mix as we did then, which impact our sequential pricing and margin as we pivot to meet demand where it is.
In this environment our focus remains on our own incremental controllable actions to support an increase in second half earnings and strong 2023 free cash flow.
capture2a.jpg
These actions start with our commercial teams who are navigating a very fluid sales environment. We are rapidly assessing conditions across regions and end-markets to ensure we are preserving maximum value.
•We have identified those customer positions across our businesses which are strategic long-term and for which we must proactively monitor and respond to market conditions.
•We have prioritized certain products where industry supply and demand dynamics support potential spot transactions in the second half of the year. Our teams are positioned to capture potential opportunities in several products including acetate tow, redispersible powders, and GUR.
•We are moving from exclusive distribution arrangements for EM in the West to a dual or multi distribution approach to maximize customer coverage for a larger EM product portfolio. Changes will be implemented over the next two quarters, depending on existing contract terms.
2


•In EM, we have further aligned compensation with our current strategic priorities by temporarily modifying our project pipeline compensation metrics and the drivers of the 2023 annual bonus program for the commercial team, subject to consent of works council or individual employees where required.
Our commercial and manufacturing teams are committed to aligning our production and inventory levels with demand. As a result, we are taking a series of difficult but necessary actions.
•In EM, we will idle certain production units or lines within the second half at two legacy EM facilities as well as six legacy M&M facilities. We will run at reduced rates within the second half across many more EM facilities.
•In the Acetyl Chain (AC), we have again idled our Frankfurt VAM unit through at least the remainder of the third quarter. We will run both Nanjing and Singapore acetic acid at reduced rates within the second half. In downstream products, we will run block operations across a handful of production units across the globe within the second half.
•We are significantly modifying our 2023 and 2024 turnaround schedule in light of recent production decisions. With reduced demand across our global production networks, we have greater flexibility to defer certain turnarounds or execute them at a more cost-effective pace.
•In the second quarter, we significantly expanded our inventory reduction initiative and lowered inventory by $235 million, driven by sequential inventory reductions in EM and AC of 10 percent and 5 percent, respectively. We are expanding our 2023 inventory reduction initiative to achieve a reduction of $400 to $450 million (previously $300 million) across the year.
•We have extended our capex reduction plan into next year and anticipate 2024 capex of approximately $400 million. We have aligned the timing of certain projects to the current demand outlook and maintained flexibility to restore original project timing as demand justifies.
•For the few products which are sold-out, we are assessing near-term opportunities to expand our capacity through repurposing assets and product swaps. We recently secured additional production time to manufacture Vamac®, a sold-out product that is made on a shared asset.
We are exercising certain portions of the playbook we created during COVID and taking incremental cost cutting measures across Celanese. Among other measures:
3


•We are significantly reducing our use of contractors across the company and overtime work. The reduced demand on our production network allows us to complete most work in-house.
•All travel outside of sales, procurement, and keeping our plants operating safely has been suspended. All international travel is being approved by my direct reports.
•We have actioned a significant reduction in marketing and promotional spend.
•At the end of July, we eliminated certain additional roles across Celanese in response to current macro conditions. We will continue to right-size the organization in line with our synergy plan and in response to macro conditions.
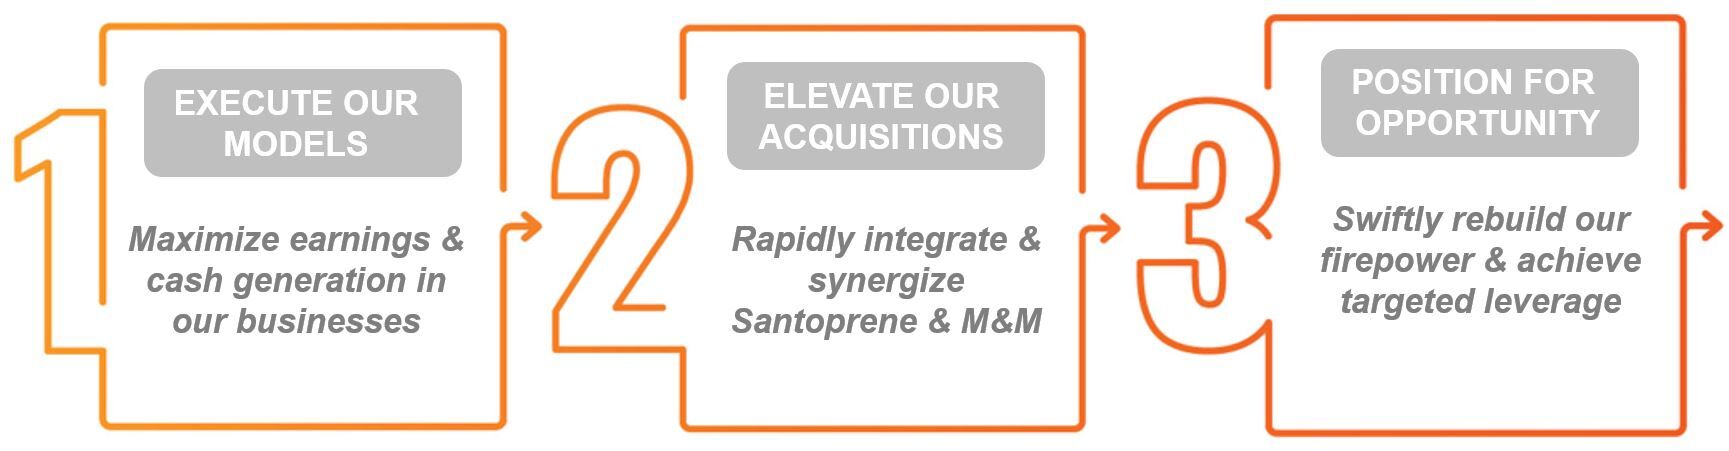
Our actions support our first priority to maximize cash generation in this environment. This is consistent with our strategy under challenging macro backdrops of the past. In the second quarter, our teams delivered free cash flow of $611 million, $91 million above our prior record set in the third quarter of 2021 when we had double the earnings in a favorable backdrop. Strong anticipated 2023 free cash flow of approximately $1.3 billion and anticipated Food Ingredients transaction net proceeds of $450 million give me strong confidence in our ability to meaningfully exceed the 2023 deleveraging commitments we made when we announced the M&M transaction.
I am also confident in our ability to deliver further earnings improvement in the second half despite an uncertain macro environment. The series of incremental cost actions I outlined above are expected to contribute between $60 and $80 million in savings within the second half of 2023.
With second half earnings growth driven by incremental controllable actions, continued M&M synergies, and diminishing destocking as we progress through the year, we anticipate 2023 adjusted earnings of approximately $9 to $10 per share, inclusive of approximately $1.20 per share of M&M transaction amortization. While we do have views on individual regions and end-markets, the reality remains that the backdrop is complex and volatile. Our guidance does not factor in any material improvement in demand conditions beyond a reduction in destocking across the second half, and such improvement would have an incremental positive impact on our earnings.
With the focus on what we can control, let me now highlight our second quarter performance and actions underway in a familiar framework.
4


captureb.jpg
image1a.jpg The Acetyl Chain (AC) generated second quarter adjusted EBIT of $332 million and operating EBITDA of $386 million at margins of 27 and 31 percent, respectively. Across the first half of the year, our AC team delivered performance entirely consistent with foundational adjusted EBIT of $1.3 billion a year, despite a macro environment that remains sub-foundational.
I thank our team for delivering against their second quarter forecast despite conditions that deteriorated from what we saw in April. Anticipated normal seasonal demand recovery and rising China acetic acid pricing in April alluded to tightening industry dynamics ahead of scheduled industry turnarounds. Shortly after providing our second quarter outlook which factored in these dynamics, we saw an unexpected and rapid decrease in China acetic acid pricing from above $400 per ton to below $350 per ton, the lowest since October 2020. This was primarily due to an abnormally soft seasonal rebound in demand following Chinese New Year.
Unusually poor seasonal recovery extended to the West, particularly in Europe, where soft underlying demand and continued destocking across multiple applications drove a 10 percent sequential decline in our volume. Sequential pricing deterioration across all three regions drove the sixth consecutive quarter of contraction in global acetic acid variable margin per ton despite moderation in raw material pricing.
As a result, variable margin from external sales of acetic acid in the second quarter represented the lowest percentage of total AC since the first quarter of 2016, a quarter in which our AC adjusted EBIT was lower by more than $75 million. Our team continues to demonstrate the ongoing lift in the foundational earnings power of AC and our ability to exercise our commercial and supply chain optionality.
The business identified and pivoted to capture additional sequential volume and earnings contributions from downstream derivatives including redispersible powders (RDP) and acetate tow. Our team also took decisive actions within the quarter to align our production with demand. As a result, within the quarter we lowered operating rates at some of our highest cost global facilities including Nanjing acetic acid and Frankfurt VAM. For our more regional products, such as European emulsions, we optimized across our four plants in the regional network by moving production from our highest to lowest cost facilities.
5


As we look to the third quarter, external conditions remain volatile. In the first half of July, acetic acid and VAM pricing recovered off of floors in China as a result of modestly improving demand and industry outages. China pricing has reversed course over the last few weeks despite ongoing industry outages. We are capturing a disproportionate share of demand as industry outages and turnarounds continue with AC July volume in China that was approximately 10 percent higher than any month year to date. We anticipate moderation in our August and September volumes as competitor capacity returns.
We will continue to take actions to align production to demand and to produce cost effectively within our global network. At the end of July we idled our Frankfurt VAM facility, currently the highest cost unit within our five-plant VAM network, and anticipate it will remain idle through at least the third quarter. We will restart Frankfurt VAM when global demand recovers sufficiently. In September we will also carry out a major turnaround at our Singapore acetic acid unit that will extend over a month and will contribute to an incremental $5 to $10 million in sequential turnaround expense.
Inclusive of these manufacturing actions as well as the cost actions I highlighted earlier, we anticipate third quarter AC adjusted EBIT of $310 to $350 million. Also included in this guidance is a sequential headwind of approximately $15 million due to lower sequential margin on certain contract pricing formulas that have a raw material lag, including acetate tow.
Our second half earnings forecast for AC no longer includes a $25 million contribution from the Clear Lake acetic acid expansion, including a previously anticipated $5 to $10 million third quarter contribution. After mechanical completion of the unit and during our commissioning process, our team identified defects in certain high-metallurgy components from the supplier's manufacturing process. These parts must be replaced before start-up. The recasting and quality control of new parts, shipment, installation, and restarted commissioning process will push the initial earnings contribution from the new Clear Lake acid unit into early 2024.
Despite a number of external challenges, we expect to deliver foundational adjusted EBIT of $1.3 billion in AC in 2023. The continued resilience of our earnings power in AC is demonstrated by average quarterly operating EBITDA margins of over 30 percent over the last 5 years, with margins greater than 25 percent in every quarter, including during COVID.
Engineered Materials (EM) delivered second quarter adjusted EBIT of $205 million and operating EBITDA of $317 million at margins of 13 and 20 percent, respectively. These results were inclusive of M&M contributions of $64 million and $132 million, respectively.
6


Second quarter profitability in EM was negatively impacted by soft demand and continued destocking across several end-markets which resulted in elevated competitive dynamics, pricing pressure, and unfavorable product mix. Earnings performance was also negatively impacted by a decision to more significantly reduce inventory and drive free cash flow in the quarter. Regardless of the drivers, this performance is very disappointing relative to our expectations earlier in the quarter.
EM second quarter volume increased by 2 percent sequentially as a result of a 7 percent increase in M&M and a 2 percent decrease in legacy EM. We did not see a typical seasonal lift in demand and our M&M volume recapture efforts were challenged by weak demand conditions and destocking. In legacy EM the poor underlying demand conditions were most acute in Europe and the Americas and across the industrial, and electrical and electronics (E&E) end-markets.
We saw demand softness across highly-differentiated applications impacting our mix for larger products including POM and PA66. Our commercial teams pivoted sales of these products to more standard applications where demand could be found. Such dynamics across these products and others resulted in significant unfavorable changes in sequential sales mix across total EM. We estimate that the total impact of this temporary shift to more standard business in the second quarter resulted in an unfavorable mix impact to earnings of approximately $35 million.
The impact of these demand conditions on competitive pricing pressure has been amplified by a falling raw material environment. What we are seeing currently in POM, for example, is representative of certain other products. Historically, POM global capacity utilization has been in the low to mid 80's and approached 90 percent post-COVID. Across the first half of 2023, we estimate global POM utilization in the low 70's, almost entirely driven by demand. We previously discussed how Asian-produced POM, which historically was consumed locally, is being temporarily exported to Europe at elevated levels. In the first quarter of 2023, combined POM exports from China, Malaysia, and Japan to Europe increased 5x (+12 kt) from the same quarter of 2019. Heightened competitive dynamics across POM and other products require our commercial teams to be more responsive in pricing, which contributed to a 5 percent sequential decline in EM pricing.
We continue to leverage our leading positions in medical and auto where we see demand resilience. For legacy EM, global auto volume was flat sequentially and slightly trailed global auto builds. This was largely due to some of the accelerated buying at the end of the first quarter that we previously discussed. In Asia, where our sequential auto build growth was strongest, our legacy EM sequential volume growth into auto exceeded builds.
7


Beyond our commercial efforts to find demand where it is and price competitively, we took meaningful actions to align our production and inventory with global demand. In the second quarter, we reduced EM inventory by over $200 million, more than double our original target for the quarter. Due to the definitive agreement to form the Nutrinova JV, $28 million of the inventory reduction in EM was the result of reclassifying the Food Ingredients inventory on the balance sheet as assets held for sale. Our team pushed particularly hard to expand our raw material and work in process inventory reduction. As a result of these efforts, despite a significantly larger reduction in total inventory, we were able to limit the unfavorable sequential earnings impact to roughly in line with the $30 to $35 million impact we forecasted previously.
External market conditions in EM remain challenging in the third quarter. We will continue to take cost actions, convert additional inventory to cash, and take the temporary production actions I described earlier. We anticipate third quarter EM volume will increase modestly versus the second quarter due to reduced destocking as well as share recovery efforts in M&M. Competitive dynamics will remain heightened across the quarter and we expect some degree of sequential pricing compression in order to maintain certain positions and to reduce inventory. EM inventory reductions across the third quarter will remain a sequential earnings headwind as our inventory reduction across the portfolio will be partially offset by a Vamac® production campaign. Contemplating these dynamics, we anticipate EM third quarter adjusted EBIT of $210 to $235 million.
image2a.jpg 
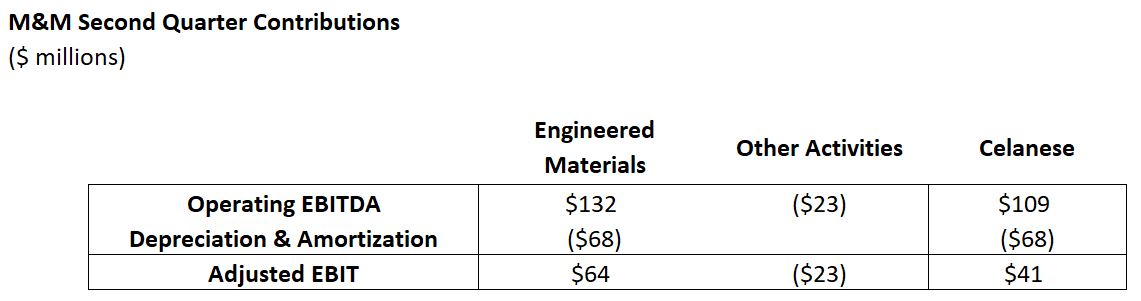
Transitioning to our acquisitions, the M&M business contributed $109 million to Celanese operating EBITDA in the second quarter, which was reflected in our reporting segments as a $132 million contribution to EM operating EBITDA and an alignment of $23 million in costs to Other Activities. The M&M business contributed $64 million to EM adjusted EBIT in the second quarter, inclusive of depreciation and approximately $30 million in quarterly transaction amortization.
capturec.jpg
While our team delivered a 14 percent sequential increase in the M&M operating EBITDA contribution in a difficult environment, these results came in below our expectations.
8


The sequential lift in earnings was unfavorably impacted by (1) our decision to more significantly reduce M&M inventory and (2) a challenging demand and competitive backdrop that diluted the immediate contributions from our commercial and synergy initiatives in the quarter.
Our intentional decision to more significantly drive inventory reduction in M&M resulted in stronger second quarter free cash flow and an approximately $10 million sequential earnings headwind in M&M. This included impacts from inventory fixed cost accounting as well as sales of certain older and higher-cost inventory at positive cash, negative EBIT.
Our team delivered an incremental $11 million in sequential synergies in the second quarter. These savings were realized from the actions we took to right-size our commercial and technical organizations in April as well as real estate, PA66 insourcing, procurement, and functional spend synergies. Second quarter synergies came in at the low-end of our expected range as demand conditions and inventory actions muted the impact of volume-correlated synergies in procurement, PA66 insourcing, logistics, and tax.
Looking forward, we expect a $25 to $35 million sequential lift in the third quarter operating EBITDA contribution from M&M. This sequential increase reflects an additional $10 to $15 million in synergies, incremental controllable cost and manufacturing actions, and modest volume growth due to volume recapture efforts and reduced destocking. We will continue to reduce inventory across the third quarter which will likely result in an earnings headwind roughly consistent with the second quarter.
To sum up the company-wide outlook for the third quarter, we expect contributions from controllable actions, reduced destocking, and continued improvement in M&M earnings to offset broad pricing pressure, unfavorable mix, and the impact of inventory reductions on earnings. We anticipate third quarter earnings of $2.00 to $2.50 per share, inclusive of approximately $0.30 per share of Mobility & Materials (M&M) transaction amortization. This guidance is also inclusive of anticipated third quarter net expenses of approximately $100 million in Other Activities.


9


Scott Richardson, Celanese Corporation, Chief Financial Officer
image3a.jpg I thank our teams for executing against our cash generation initiatives across the second quarter to deliver $611 million in free cash flow. They reduced our second quarter inventory balances by $235 million in a tough demand environment, and despite the associated earnings headwind, delivered a sequential increase in adjusted earnings per share.
As a result, in the second quarter we reduced net debt by $515 million, including $386 million of debt retirement and a $129 million sequential increase in cash on hand. We repaid $370 million of the U.S. term loan which will mature later this year. We expect to pay off the remaining $130 million of that term loan very shortly using free cash flow.
We are at a critical inflection point as we come off of the peak in our leverage in the middle of this year and drive significant deleveraging across the back half of 2023. We expect our leverage metrics to improve across the second half on both net debt reduction as well as year over year EBITDA growth. We continue to progress rapidly on a number of initiatives that will support our deleveraging.
•We are preparing to close our Food Ingredients JV, Nutrinova, in the third quarter, subject to receiving regulatory approvals. We have filed for such approvals in five jurisdictions and qualified for simplified, fast track, or short-form review treatment where available. Once closed, we will immediately deploy approximately $450 million in transaction net proceeds to pay down debt.
•We have already reduced inventory balances by nearly $300 million across the first half of the year. This inventory initiative has added resilience to our 2023 free cash flow outlook despite macro instability.
•We continue to progress on the effective redomiciling of a portion of our U.S. terms loans by obtaining up to $700 million in new debt in China and repaying U.S. debt. When complete in the second half, we expect to capture the interest rate savings due to the difference in U.S. and China benchmark rates, which equates to around 300 basis points in savings.
10


•We are progressing on our restructuring work which should allow us to convert a portion of our U.S. dollar debt into Japanese yen in the second half to lower our blended borrowing rate and align our underlying business currency exposure to our debt mix.
•We continue to evaluate potential opportunistic divestitures which could accelerate our deleveraging.
In addition to these deleveraging and borrowing cost initiatives, we are also looking closely at opportunities to very cost effectively extend our debt maturity profile and effectively eliminate any further need to refinance for the next several years. As we have said previously, when we secured financing for the M&M acquisition last summer, we intentionally built a shorter-term debt maturity profile to avoid locking in abnormally wider spreads on longer-term debt and maintain flexibility to opportunistically refinance in the future. We believe current market conditions, including changes to the yield curve and improvement in credit spreads, potentially present an opportunity to extend our debt maturity profile without adding material incremental cost. We are prepared to move quickly on the right opportunities while maintaining ample flexibility in the debt profile to aggressively pay down debt and execute our deleveraging plan.
We remain committed to maintaining our investment grade credit rating. With expected 2023 free cash flow of approximately $1.3 billion and anticipated net proceeds of approximately $450 million from the Food Ingredients joint venture, I am fully confident that we will meaningfully exceed our full year deleveraging objective to reduce net debt by $1 billion in 2023.
We remain committed to executing against our earnings, cash generation, and deleveraging objectives. This concludes our prepared remarks. We look forward to discussing our second quarter results and addressing your questions.
11


Forward-Looking Statements

These prepared comments may contain "forward-looking statements," which include information concerning the Company's plans, objectives, goals, strategies, future revenues, cash flow, financial performance, synergies, capital expenditures, financing needs and other information that is not historical information. All forward-looking statements are based upon current expectations and beliefs and various assumptions. There can be no assurance that the Company will realize these expectations or that these beliefs will prove correct. There are a number of risks and uncertainties that could cause actual results to differ materially from the results expressed or implied in the forward-looking statements contained in these comments. These risks and uncertainties include, among other things: changes in general economic, business, political and regulatory conditions in the countries or regions in which we operate; volatility or changes in the price and availability of raw materials and energy, particularly changes in the demand for, supply of, and market prices of ethylene, methanol, natural gas, wood pulp and fuel oil and the prices for electricity and other energy sources; the length and depth of product and industry business cycles, particularly in the automotive, electrical, mobility, textiles, medical, electronics and construction industries; the ability to pass increases in raw material prices, logistics costs and other costs on to customers or otherwise improve margins through price increases; the accuracy or inaccuracy of our beliefs or assumptions regarding anticipated benefits of the acquisition (the "M&M Acquisition") by us of the majority of the Mobility & Materials business (the "M&M Business") of DuPont de Nemours, Inc.; the possibility that we will not be able to realize all of the anticipated improvements in the M&M Business's financial performance — including optimizing pricing, currency mix and inventory — or realize all of the anticipated benefits of the M&M Acquisition, including synergies and growth opportunities, within the anticipated timeframe, or at all, whether as a result of difficulties arising from the operation or integration of the M&M Business or other unanticipated delays, costs, inefficiencies or liabilities; increased commercial, legal or regulatory complexity of entering into, or expanding our exposure to, certain end markets and geographies; risks in the global economy and equity and credit markets and their potential impact on our ability to pay down debt in the future and/or refinance at suitable rates, in a timely manner, or at all; diversion of management's attention from ongoing business operations and opportunities and other disruption caused by the M&M Acquisition and the integration processes and their impact on our existing business and relationships; risks and costs associated with increased leverage from the M&M Acquisition, including increased interest expense and potential reduction of business and strategic flexibility; the ability to maintain plant utilization rates and to implement planned capacity additions, expansions and maintenance; the ability to reduce or maintain their current levels of production costs and to improve productivity by implementing technological improvements to existing plants; increased price competition and the introduction of competing products by other companies; the ability to identify desirable potential acquisition or divestiture opportunities and to complete such transactions, including obtaining regulatory approvals, consistent with the Company's strategy; market acceptance of our products and technology; compliance and other costs and potential disruption or interruption of production or operations due to accidents, interruptions in sources of raw materials, transportation, logistics or supply chain disruptions, cybersecurity incidents, terrorism or political unrest, public health crises (including, but not limited to, the COVID-19 pandemic), or other unforeseen events or delays in construction or operation of facilities, including as a result of geopolitical conditions, the occurrence of acts of war (such as the Russia-Ukraine conflict) or terrorist incidents or as a result of weather, natural disasters, or other crises; the ability to obtain governmental approvals and to construct facilities on terms and schedules acceptable to the Company; changes in applicable tariffs, duties and trade agreements, tax rates or legislation throughout the world including, but not limited to, adjustments, changes in estimates or interpretations or the resolution of tax examinations or audits that may impact recorded or future tax impacts and potential regulatory and legislative tax developments in the United States and other jurisdictions; changes in the degree of intellectual property and other legal protection afforded to our products or technologies, or the theft of such intellectual property; potential liability for remedial actions and increased costs under existing or future environmental, health and safety regulations, including those relating to climate change or other sustainability matters; potential liability resulting from pending or future claims or litigation, including investigations or enforcement actions, or from changes in the laws, regulations or policies of governments or other governmental activities in the countries in which we operate; changes in currency exchange rates and interest rates; our level of indebtedness, which could diminish our ability to raise additional capital to fund operations or limit our ability to react to changes in the economy or the chemicals industry; tax rates and changes thereto; our ability to obtain regulatory approval for, and satisfy closing conditions to, any transactions described herein that have not closed; and various other factors discussed from time to time in the Company's filings with the Securities and Exchange Commission.

Any forward-looking statement speaks only as of the date on which it is made, and the Company undertakes no obligation to update any forward-looking statements to reflect events or circumstances after the date on which it is made or to reflect the occurrence of anticipated or unanticipated events or circumstances.

Results Unaudited
The results in this document, together with the adjustments made to present the results on a comparable basis, have not been audited and are based on internal financial data furnished to management. Quarterly results should not be taken as an indication of the results of operations to be reported for any subsequent period or for the full fiscal year.

Non-GAAP Financial Measures
These prepared comments, and statements made in connection with these prepared comments, refer to non-GAAP financial measures. For more information on the non-GAAP financial measures used by the Company, including the most directly comparable GAAP financial measure for each non-GAAP financial measure used, including definitions and reconciliations of the differences between such non-GAAP financial measures and the comparable GAAP financial measures, please refer to the Non-US GAAP Financial Measures and Supplemental Information document available on our website, investors.celanese.com, under Financial Information/Financial Document Library.


12
EX-99.2 3 q220238-kex992.htm EX-99.2 Document
celogoa.jpg
Exhibit 99.2
Non-US GAAP Financial Measures and Supplemental Information
August 7, 2023
In this document, the terms the "Company," "we" and "our" refer to Celanese Corporation and its subsidiaries on a consolidated basis.
Purpose
The purpose of this document is to provide information of interest to investors, analysts and other parties including supplemental financial information and reconciliations and other information concerning our use of non-US GAAP financial measures. This document is updated quarterly.
Presentation
This document presents the Company's two business segments, Engineered Materials and the Acetyl Chain.
Use of Non-US GAAP Financial Measures
From time to time, management may publicly disclose certain numerical "non-GAAP financial measures" in the course of our earnings releases, financial presentations, earnings conference calls, investor and analyst meetings and otherwise. For these purposes, the Securities and Exchange Commission ("SEC") defines a "non-GAAP financial measure" as a numerical measure of historical or future financial performance, financial position or cash flows that excludes amounts, or is subject to adjustments that effectively exclude amounts, included in the most directly comparable measure calculated and presented in accordance with US GAAP, and vice versa for measures that include amounts, or are subject to adjustments that effectively include amounts, that are excluded from the most directly comparable US GAAP measure so calculated and presented. For these purposes, "GAAP" refers to generally accepted accounting principles in the United States.
Non-GAAP financial measures disclosed by management are provided as additional information to investors, analysts and other parties because the Company believes them to be important supplemental measures for assessing our financial and operating results and as a means to evaluate our financial condition and period-to-period comparisons. These non-GAAP financial measures should be viewed as supplemental to, and should not be considered in isolation or as alternatives to, net earnings (loss), operating profit (loss), operating margin, cash flow from operating activities (together with cash flow from investing and financing activities), earnings per share or any other US GAAP financial measure. These non-GAAP financial measures should be considered within the context of our complete audited and unaudited financial results for the given period, which are available on the Financial Information/Financial Document Library page of our website, investors.celanese.com. The definition and method of calculation of the non-GAAP financial measures used herein may be different from other companies' methods for calculating measures with the same or similar titles. Investors, analysts and other parties should understand how another company calculates such non-GAAP financial measures before comparing the other company's non-GAAP financial measures to any of our own. These non-GAAP financial measures may not be indicative of the historical operating results of the Company nor are they intended to be predictive or projections of future results.
Pursuant to the requirements of SEC Regulation G, whenever we refer to a non-GAAP financial measure, we will also present in this document, in the presentation itself or on a Form 8-K in connection with the presentation on the Financial Information/Financial Document Library page of our website, investors.celanese.com, to the extent practicable, the most directly comparable financial measure calculated and presented in accordance with GAAP, along with a reconciliation of the differences between the non-GAAP financial measure we reference and such comparable GAAP financial measure.
This document includes definitions and reconciliations of non-GAAP financial measures used from time to time by the Company.
Specific Measures Used
This document provides information about the following non-GAAP measures: adjusted EBIT, adjusted EBIT margin, operating EBITDA, operating EBITDA margin, operating profit (loss) attributable to Celanese Corporation, adjusted earnings per share, net debt, free cash flow and return on invested capital (adjusted). The most directly comparable financial measure presented in accordance with US GAAP in our consolidated financial statements for adjusted EBIT and operating EBITDA is net earnings (loss) attributable to Celanese Corporation; for adjusted EBIT margin and operating EBITDA margin is operating margin; for operating profit (loss) attributable to Celanese Corporation is operating profit (loss); for adjusted earnings per share is earnings (loss) from continuing operations attributable to Celanese Corporation per common share-diluted; for net debt
1

celogoa.jpg
is total debt; for free cash flow is net cash provided by (used in) operations; and for return on invested capital (adjusted) is net earnings (loss) attributable to Celanese Corporation divided by the sum of the average of beginning and end of the year short- and long-term debt and Celanese Corporation stockholders' equity.
Definitions
•Adjusted EBIT is a performance measure used by the Company and is defined by the Company as net earnings (loss) attributable to Celanese Corporation, plus (earnings) loss from discontinued operations, less interest income, plus interest expense, plus refinancing expense and taxes, and further adjusted for Certain Items (refer to Table 8). We believe that adjusted EBIT provides transparent and useful information to management, investors, analysts and other parties in evaluating and assessing our primary operating results from period-to-period after removing the impact of unusual, non-operational or restructuring-related activities that affect comparability. Our management recognizes that adjusted EBIT has inherent limitations because of the excluded items. Adjusted EBIT is one of the measures management uses for planning and budgeting, monitoring and evaluating financial and operating results and as a performance metric in the Company's incentive compensation plan. We do not provide reconciliations for adjusted EBIT on a forward-looking basis (including those contained in this document) when we are unable to provide a meaningful or accurate calculation or estimation of reconciling items and the information is not available without unreasonable effort. This is due to the inherent difficulty of forecasting the timing and amount of Certain Items, such as mark-to-market pension gains and losses, that have not yet occurred, are out of our control and/or cannot be reasonably predicted. For the same reasons, we are unable to address the probable significance of the unavailable information. Adjusted EBIT margin is defined by the Company as adjusted EBIT divided by net sales. Adjusted EBIT margin has the same uses and limitations as Adjusted EBIT.
•Operating EBITDA is a performance measure used by the Company and is defined by the Company as net earnings (loss) attributable to Celanese Corporation, plus (earnings) loss from discontinued operations, less interest income, plus interest expense, plus refinancing expense, taxes and depreciation and amortization, and further adjusted for Certain Items, which Certain Items include accelerated depreciation and amortization expense. Operating EBITDA is equal to adjusted EBIT plus depreciation and amortization. We believe that Operating EBITDA provides transparent and useful information to investors, analysts and other parties in evaluating our operating performance relative to our peer companies. Operating EBITDA margin is defined by the Company as Operating EBITDA divided by net sales. Operating EBITDA margin has the same uses and limitations as Operating EBITDA.
•Operating profit (loss) attributable to Celanese Corporation is defined by the Company as operating profit (loss), less earnings (loss) attributable to noncontrolling interests ("NCI"). We believe that operating profit (loss) attributable to Celanese Corporation provides transparent and useful information to management, investors, analysts and other parties in evaluating our core operational performance. Operating margin attributable to Celanese Corporation is defined by the Company as operating profit (loss) attributable to Celanese Corporation divided by net sales. Operating margin attributable to Celanese Corporation has the same uses and limitations as Operating profit (loss) attributable to Celanese Corporation.
•Adjusted earnings per share is a performance measure used by the Company and is defined by the Company as earnings (loss) from continuing operations attributable to Celanese Corporation, adjusted for income tax (provision) benefit, Certain Items, and refinancing and related expenses, divided by the number of basic common shares and dilutive restricted stock units and stock options calculated using the treasury method. We believe that adjusted earnings per share provides transparent and useful information to management, investors, analysts and other parties in evaluating and assessing our primary operating results from period-to-period after removing the impact of the above stated items that affect comparability and as a performance metric in the Company's incentive compensation plan. We do not provide reconciliations for adjusted earnings per share on a forward-looking basis (including those contained in this document) when we are unable to provide a meaningful or accurate calculation or estimation of reconciling items and the information is not available without unreasonable effort. This is due to the inherent difficulty of forecasting the timing and amount of Certain Items, such as mark-to-market pension gains and losses, that have not yet occurred, are out of our control and/or cannot be reasonably predicted. For the same reasons, we are unable to address the probable significance of the unavailable information.
Note: The income tax expense (benefit) on Certain Items ("Non-GAAP adjustments") is determined using the applicable rates in the taxing jurisdictions in which the Non-GAAP adjustments occurred and includes both current and deferred income tax expense (benefit). The income tax rate used for adjusted earnings per share approximates the midpoint in a range of forecasted tax rates for the year. This range may include certain partial or full-year forecasted tax opportunities and related costs, where applicable, and specifically excludes changes in uncertain tax positions, discrete recognition of GAAP items on a quarterly basis, other pre-tax items adjusted out of our GAAP earnings for adjusted earnings per share purposes and changes in management's assessments regarding the ability to realize deferred tax assets for GAAP. In determining the adjusted earnings per share tax rate, we reflect the impact of foreign tax credits when utilized, or expected to be utilized, absent discrete events impacting the timing of foreign tax credit utilization. We analyze this rate quarterly and adjust it if there is a material change in the range of forecasted tax rates; an updated forecast would not necessarily result in a change to our tax rate used for adjusted earnings per share. The adjusted tax rate is an estimate and may differ from the actual tax rate used for GAAP reporting in any given reporting period. Table 3a summarizes the reconciliation of our estimated GAAP effective tax rate to the adjusted tax rate. The estimated GAAP rate excludes discrete recognition of GAAP items due to our inability to forecast such items. As part of the year-end reconciliation, we will update the reconciliation of the GAAP effective tax rate to the adjusted tax rate for actual results.
2

celogoa.jpg
•Free cash flow is a liquidity measure used by the Company and is defined by the Company as net cash provided by (used in) operations, less capital expenditures on property, plant and equipment, and adjusted for contributions from or distributions to our NCI joint ventures. We believe that free cash flow provides useful information to management, investors, analysts and other parties in evaluating the Company's liquidity and credit quality assessment because it provides an indication of the long-term cash generating ability of our business. Although we use free cash flow as a measure to assess the liquidity generated by our business, the use of free cash flow has important limitations, including that free cash flow does not reflect the cash requirements necessary to service our indebtedness, lease obligations, unconditional purchase obligations or pension and postretirement funding obligations. Free cash flow is not a measure of cash available for discretionary expenditures since the Company has certain debt service and finance lease payments that are not deducted from that measure. We do not provide reconciliations for free cash flow on a forward-looking basis when we are unable to provide a meaningful or accurate calculation or estimation of reconciling items and the information is not available without unreasonable effort. This is due to the inherent difficulty of forecasting the timing and amount of items such as working capital changes, fluctuations in foreign currency exchange rates, the impact and timing of potential acquisitions and divestitures, and other structural changes, that have not yet occurred, are out of our control and/or cannot be reasonably predicted. For the same reasons, we are unable to address the probable significance of the unavailable information.
•Net debt is defined by the Company as total debt less cash and cash equivalents. We believe that net debt provides useful information to management, investors, analysts and other parties in evaluating changes to the Company's capital structure and credit quality assessment.
•Return on invested capital (adjusted) is defined by the Company as adjusted EBIT, tax effected using the adjusted tax rate, divided by the sum of the average of beginning and end of the year short- and long-term debt and Celanese Corporation stockholders' equity. We believe that return on invested capital (adjusted) provides useful information to management, investors, analysts and other parties in order to assess our income generation from the point of view of our stockholders and creditors who provide us with capital in the form of equity and debt and whether capital invested in the Company yields competitive returns.
Supplemental Information
Supplemental Information we believe to be of interest to investors, analysts and other parties includes the following:
•Net sales for each of our business segments and the percentage increase or decrease in net sales attributable to price, volume, currency and other factors for each of our business segments.
•Cash dividends received from our equity investments.
•For those consolidated ventures in which the Company owns or is exposed to less than 100% of the economics, the outside stockholders' interests are shown as NCI. Amounts referred to as "attributable to Celanese Corporation" are net of any applicable NCI.
Results Unaudited
The results in this document, together with the adjustments made to present the results on a comparable basis, have not been audited and are based on internal financial data furnished to management. Quarterly results should not be taken as an indication of the results of operations to be reported for any subsequent period or for the full fiscal year.
3

celogoa.jpg
Table 1
Celanese Adjusted EBIT and Operating EBITDA - Reconciliation of Non-GAAP Measures - Unaudited
Q2 '23 Q1 '23 2022 Q4 '22 Q3 '22 Q2 '22 Q1 '22
(In $ millions)
Net earnings (loss) attributable to Celanese Corporation 220  91  1,894  767  191  434  502 
(Earnings) loss from discontinued operations (1) — 
Interest income (7) (8) (69) (33) (34) (1) (1)
Interest expense 182  182  405  168  154  48  35 
Income tax provision (benefit) (4) 25  (489) (840) 127  112  112 
Certain Items attributable to Celanese Corporation (Table 8)
54  131  422  239  71  47  65 
Adjusted EBIT 444  424  2,171  302  510  646  713 
Depreciation and amortization expense(1)
172  172  446  151  97  98  100 
Operating EBITDA 616  596  2,617  453  607  744  813 
Q2 '23 Q1 '23 2022 Q4 '22 Q3 '22 Q2 '22 Q1 '22
(In $ millions)
Engineered Materials —  —  13 
Acetyl Chain —  —  —  —  — 
Other Activities(2)
—  —  —  —  — 
Accelerated depreciation and amortization expense —  —  16 
Depreciation and amortization expense(1)
172  172  446  151  97  98  100 
Total depreciation and amortization expense 172  172  462  153  100  103  106 
______________________________
(1)Excludes accelerated depreciation and amortization expense as detailed in the table above, which amounts are included in Certain Items above.
(2)Other Activities includes corporate Selling, general and administrative ("SG&A") expenses, results of captive insurance companies and certain components of net periodic benefit cost (interest cost, expected return on plan assets and net actuarial gains and losses).
4

celogoa.jpg
Table 1a
M&M Adjusted EBIT and Operating EBITDA - Reconciliation of Non-GAAP Measures - Unaudited
Q2 '23 Q1 '23 Q4 '22
(In $ millions)
Net earnings (loss) attributable to M&M 47  (48) (69) (3)
Income tax provision (benefit) (1) 13 
Certain Items(1)
18  86  72 
Adjusted EBIT 64  51 
Depreciation and amortization expense 68  68  47 
Operating EBITDA(2)
132  119  56  (4)
______________________________
(1)Amount is included within total Certain Items shown in Table 8.
(2)Excludes $(23) million, $(23) million and $(17) million of Operating EBITDA included in Other Activities for the three months ended June 30, 2023, March 31, 2023 and December 31, 2022, respectively.
(3)Excludes $30 million of Net loss for the month ended October 31, 2022, prior to our acquisition of the majority of the Mobility & Materials business ("M&M Business") of DuPont de Nemours, Inc.
(4)Excludes $22 million of Operating EBITDA for the month ended October 31, 2022, prior to our acquisition of the M&M Business.
5

Table 2 - Supplemental Segment Data and Reconciliation of Segment Adjusted EBIT and Operating EBITDA - Non-GAAP Measures - Unaudited
celogoa.jpg
Q2 '23 Q1 '23 2022 Q4 '22 Q3 '22 Q2 '22 Q1 '22
(In $ millions, except percentages)
Operating Profit (Loss) / Operating Margin
Engineered Materials 158  10.0  % 112  6.9  % 429  10.7  % 25  2.0  % 114  12.3  % 166  17.5  % 124  13.6  %
Acetyl Chain 295  23.9  % 278  22.2  % 1,447  25.2  % 204  18.0  % 312  22.3  % 428  27.5  % 503  30.4  %
Other Activities(1)
(118) (139) (498) (173) (118) (111) (96)
Total 335  12.0  % 251  8.8  % 1,378  14.2  % 56  2.4  % 308  13.4  % 483  19.4  % 531  20.9  %
Less: Net Earnings (Loss) Attributable to NCI for Engineered Materials (2) —  —  —  —  —  — 
Less: Net Earnings (Loss) Attributable to NCI for Acetyl Chain
Operating Profit (Loss) Attributable to Celanese Corporation 334  11.9  % 249  8.7  % 1,370  14.2  % 54  2.3  % 306  13.3  % 481  19.3  % 529  20.8  %
Operating Profit (Loss) / Operating Margin Attributable to Celanese Corporation
Engineered Materials 160  10.1  % 112  6.9  % 429  10.7  % 25  2.0  % 114  12.3  % 166  17.5  % 124  13.6  %
Acetyl Chain 292  23.7  % 276  22.1  % 1,439  25.1  % 202  17.8  % 310  22.2  % 426  27.3  % 501  30.3  %
Other Activities(1)
(118) (139) (498) (173) (118) (111) (96)
Total 334  11.9  % 249  8.7  % 1,370  14.2  % 54  2.3  % 306  13.3  % 481  19.3  % 529  20.8  %
Equity Earnings and Dividend Income, Other Income (Expense) Attributable to Celanese Corporation
Engineered Materials 20  10  207  35  70  53  49 
Acetyl Chain 32  34  143  30  34  39  40 
Other Activities(1)
(1) 12 
Total 58  43  362  66  108  93  95 
Non-Operating Pension and Other Post-Retirement Employee Benefit (Expense) Income Attributable to Celanese Corporation
Engineered Materials —  —  —  —  —  —  — 
Acetyl Chain —  —  —  —  —  —  — 
Other Activities(1)
(2) 17  (57) 25  25  24 
Total (2) 17  (57) 25  25  24 
Certain Items Attributable to Celanese Corporation (Table 8)
Engineered Materials 25  93  143  78  22  38 
Acetyl Chain 27  10  10 
Other Activities(1)
21  32  252  151  44  32  25 
Total 54  131  422  239  71  47  65 
Adjusted EBIT / Adjusted EBIT Margin
Engineered Materials 205  12.9  % 215  13.2  % 779  19.4  % 138  11.2  % 206  22.2  % 224  23.6  % 211  23.2  %
Acetyl Chain 332  26.9  % 316  25.3  % 1,609  28.0  % 242  21.3  % 349  25.0  % 475  30.5  % 543  32.9  %
Other Activities(1)
(93) (107) (217) (78) (45) (53) (41)
Total 444  15.9  % 424  14.9  % 2,171  22.4  % 302  12.9  % 510  22.2  % 646  26.0  % 713  28.1  %
___________________________
(1)Other Activities includes corporate SG&A expenses, results of captive insurance companies and certain components of net periodic benefit cost (interest cost, expected return on plan assets and net actuarial gains and losses).
6

Table 2 - Supplemental Segment Data and Reconciliation of Segment Adjusted EBIT and Operating EBITDA - Non-GAAP Measures - Unaudited (cont.)
celogoa.jpg
Q2 '23 Q1 '23 2022 Q4 '22 Q3 '22 Q2 '22 Q1 '22
(In $ millions, except percentages)
Depreciation and Amortization Expense(1)
Engineered Materials 112  112  213  90  40  41  42 
Acetyl Chain 54  54  211  52  53  52  54 
Other Activities(2)
22 
Total 172  172  446  151  97  98  100 
Operating EBITDA / Operating EBITDA Margin
Engineered Materials 317  20.0  % 327  20.1  % 992  24.7  % 228  18.4  % 246  26.5  % 265  28.0  % 253  27.8  %
Acetyl Chain 386  31.3  % 370  29.6  % 1,820  31.7  % 294  25.9  % 402  28.8  % 527  33.8  % 597  36.1  %
Other Activities(2)
(87) (101) (195) (69) (41) (48) (37)
Total 616  22.0  % 596  20.9  % 2,617  27.1  % 453  19.3  % 607  26.4  % 744  29.9  % 813  32.0  %
___________________________
(1)Excludes accelerated depreciation and amortization expense, which amounts are included in Certain Items above. See Table 1 for details.
(2)Other Activities includes corporate SG&A expenses, results of captive insurance companies and certain components of net periodic benefit cost (interest cost, expected return on plan assets and net actuarial gains and losses).
7

celogoa.jpg
Table 3
Adjusted Earnings (Loss) per Share - Reconciliation of a Non-GAAP Measure - Unaudited
Q2 '23 Q1 '23 2022 Q4 '22 Q3 '22 Q2 '22 Q1 '22
per share per share per share per share per share per share per share
(In $ millions, except per share data)
Earnings (loss) from continuing operations attributable to Celanese Corporation 219  2.00  94  0.86  1,902  17.41  768  7.03  192  1.76  440  4.03  502  4.61 
Income tax provision (benefit) (4) 25  (489) (840) 127  112  112 
Earnings (loss) from continuing operations before tax 215  119  1,413  (72) 319  552  614 
Certain Items attributable to Celanese Corporation (Table 8)
54  131  422  239  71  47  65 
Refinancing and related expenses —  —  158  (1) 14  (1) 104  (1) 26  (1) 14  (1)
Adjusted earnings (loss) from continuing operations before tax 269  250  1,993  181  494  625  693 
Income tax (provision) benefit on adjusted earnings(2)
(32) (30) (259) (24) (64) (81) (90)
Adjusted earnings (loss) from continuing operations(3)
237  2.17  220  2.01  1,734  15.88  157  1.44  430  3.94  544  4.99  603  5.54 
Diluted shares (in millions)(4)
Weighted average shares outstanding 108.9  108.6  108.4  108.5  108.4  108.4  108.2 
Incremental shares attributable to equity awards 0.4  0.6  0.8  0.7  0.7  0.7  0.7 
Total diluted shares 109.3  109.2  109.2  109.2  109.1  109.1  108.9 
______________________________
(1)Includes net interest expense and certain fees related to debt issued as part of our acquisition of the M&M Business.
(2)Calculated using adjusted effective tax rates (Table 3a) as follows:
Q2 '23 Q1 '23 2022 Q4 '22 Q3 '22 Q2 '22 Q1 '22
Adjusted effective tax rate 12  12  13  13  13  13  13 
(3)Excludes the immediate recognition of actuarial gains and losses and the impact of actual vs. expected plan asset returns.
Actual Plan Asset Returns Expected Plan Asset Returns
(In percentages)
2022 (18.4) 5.4 
(4)Potentially dilutive shares are included in the adjusted earnings per share calculation when adjusted earnings are positive.
8

celogoa.jpg
Table 3a
Adjusted Tax Rate - Reconciliation of a Non-GAAP Measure - Unaudited
Estimated Actual
2023 2022
(In percentages)
US GAAP annual effective tax rate (34)
Discrete quarterly recognition of GAAP items(1)
(6)
Tax impact of other charges and adjustments(2)
Utilization of foreign tax credits (1) — 
Changes in valuation allowances, excluding impact of other charges and adjustments(3)
—  (1)
Other, includes effect of discrete current year transactions(4)
45  (5)
Adjusted tax rate 12  13 
______________________________
Note: As part of the year-end reconciliation, we will update the reconciliation of the GAAP effective tax rate for actual results.
(1)Such as changes in tax laws (including US tax reform), deferred taxes on outside basis differences, changes in uncertain tax positions and prior year audit adjustments.
(2)Reflects the tax impact on pre-tax adjustments presented in Certain Items (Table 8), which are excluded from pre-tax income for adjusted earnings per share purposes.
(3)Reflects changes in valuation allowances related to changes in judgment regarding the realizability of deferred tax assets or current year operations, excluding other charges and adjustments.
(4)Includes tax impacts related to full-year forecasted tax opportunities and related costs.
(5)Includes the reversal of certain U.S. GAAP deferred tax benefits in 2022 related to non-recurring internal restructuring transactions related to the M&M acquisition, to centralize ownership of intellectual property with the business and to facilitate future deployment of cash to service acquisition indebtedness. Certain benefits of the internal restructuring will be realized in future periods for adjusted earnings purposes.
9

celogoa.jpg
Table 4
Net Sales by Segment - Unaudited
Q2 '23 Q1 '23 2022 Q4 '22 Q3 '22 Q2 '22 Q1 '22
(In $ millions)
Engineered Materials 1,585  1,630  4,024  1,237  929  948  910 
Acetyl Chain 1,233  1,250  5,743  1,135  1,397  1,559  1,652 
Intersegment eliminations(1)
(23) (27) (94) (24) (25) (21) (24)
Net sales 2,795  2,853  9,673  2,348  2,301  2,486  2,538 
___________________________
(1)Includes intersegment sales primarily related to the Acetyl Chain.
10

celogoa.jpg
Table 4a
Factors Affecting Segment Net Sales Sequentially - Unaudited
Three Months Ended June 30, 2023 Compared to Three Months Ended March 31, 2023
Volume Price Currency Total
  (In percentages)
Engineered Materials (5) —  (3)
Acetyl Chain (3) —  (1)

Total Company (4) —  (2)
Three Months Ended March 31, 2023 Compared to Three Months Ended December 31, 2022
Volume Price Currency Total
(In percentages)
Engineered Materials 34  (4) 32 
Acetyl Chain 10  (2) 10 

Total Company 19  (4) 17 
Three Months Ended December 31, 2022 Compared to Three Months Ended September 30, 2022
Volume Price Currency Total
(In percentages)
Engineered Materials 34  (1) —  33 
(1)
Acetyl Chain (9) (10) —  (19)

Total Company (6) — 
Three Months Ended September 30, 2022 Compared to Three Months Ended June 30, 2022
Volume Price Currency Total
(In percentages)
Engineered Materials (1) (3) (2)
Acetyl Chain (3) (5) (2) (10)

Total Company (2) (3) (2) (7)
________________________
(1)2022 includes the effect of the acquisition of the majority of the M&M Business.

Three Months Ended June 30, 2022 Compared to Three Months Ended March 31, 2022
Volume Price Currency Total
(In percentages)
Engineered Materials (3)
Acetyl Chain (6) (2) (6)

Total Company (2) (2) (2)
Three Months Ended March 31, 2022 Compared to Three Months Ended December 31, 2021
Volume Price Currency Total
  (In percentages)
Engineered Materials 23  (1) 29 
Acetyl Chain (3) — 

Total Company 12  (1) 12 
11

celogoa.jpg
Table 4b
Factors Affecting Segment Net Sales Year Over Year - Unaudited
Three Months Ended June 30, 2023 Compared to Three Months Ended June 30, 2022
Volume Price Currency Total
  (In percentages)
Engineered Materials 75  (8) —  67 
Acetyl Chain (2) (19) —  (21)
Total Company 27  (15) —  12 
Three Months Ended March 31, 2023 Compared to Three Months Ended March 31, 2022
Volume Price Currency Total
(In percentages)
Engineered Materials 80  (3) 79 
Acetyl Chain (9) (13) (2) (24)
Total Company 23  (8) (3) 12 
Three Months Ended December 31, 2022 Compared to Three Months Ended December 31, 2021
Volume Price Currency Total
(In percentages)
Engineered Materials 67  17  (9) 75 
Acetyl Chain (12) (14) (3) (29)
Total Company 13  (5) (5)
Three Months Ended September 30, 2022 Compared to Three Months Ended September 30, 2021
Volume Price Currency Total
(In percentages)
Engineered Materials 23  25  (12) 36 
Acetyl Chain (10) (5) (13)
Total Company (2) (5)

Three Months Ended June 30, 2022 Compared to Three Months Ended June 30, 2021
Volume Price Currency Total
  (In percentages)
Engineered Materials 24  24  (9) 39 
Acetyl Chain (5) 11  (4)
Total Company 14  (4) 13 
Three Months Ended March 31, 2022 Compared to Three Months Ended March 31, 2021
Volume Price Currency Total
  (In percentages)
Engineered Materials 20  25  (4) 41 
Acetyl Chain 38  (3) 42 
Total Company 12  32  (3) 41 
12

celogoa.jpg
Table 4c
Factors Affecting Segment Net Sales Year Over Year - Unaudited
Year Ended December 31, 2022 Compared to Year Ended December 31, 2021
Volume Price Currency Total
  (In percentages)
Engineered Materials 33  23  (8) 48 
Acetyl Chain (6) (3) (3)
Total Company 11  (4) 13 

13

celogoa.jpg
Table 5
Free Cash Flow - Reconciliation of a Non-GAAP Measure - Unaudited
Q2 '23 Q1 '23 2022 Q4 '22 Q3 '22 Q2 '22 Q1 '22
(In $ millions, except percentages)
Net cash provided by (used in) investing activities (163) (178) (11,141) (10,713) (143) (136) (149)
Net cash provided by (used in) financing activities (447) (69) 10,290  1,944  8,600  (159) (95)
Net cash provided by (used in) operating activities 762  (96) 1,819  541  467  495  316 
Capital expenditures on property, plant and equipment (145) (164) (543) (143) (139) (124) (137)
Contributions from/(Distributions) to NCI (6) (1) (13) (3) (3) (3) (4)
Free cash flow(1)
611  (261) 1,263  395  325  368  175 
Net sales 2,795  2,853  9,673  2,348  2,301  2,486  2,538 
Free cash flow as % of Net sales 21.9  % (9.1) % 13.1  % 16.8  % 14.1  % 14.8  % 6.9  %
______________________________
(1)Free cash flow is a liquidity measure used by the Company and is defined by the Company as net cash provided by (used in) operating activities, less capital expenditures on property, plant and equipment, and adjusted for contributions from or distributions to our NCI joint ventures.
14

celogoa.jpg
Table 6
Cash Dividends Received - Unaudited
Q2 '23 Q1 '23 2022 Q4 '22 Q3 '22 Q2 '22 Q1 '22
(In $ millions)
Dividends from equity method investments 25  40  217  82  27  82  26 
Dividends from equity investments without readily determinable fair values 31  34  133  30  30  36  37 
Total 56  74  350  112  57  118  63 
Table 7
Net Debt - Reconciliation of a Non-GAAP Measure - Unaudited
Q2 '23 Q1 '23 2022 Q4 '22 Q3 '22 Q2 '22 Q1 '22
(In $ millions)
Short-term borrowings and current installments of long-term debt - third party and affiliates 1,507  1,386  1,306  1,306  977  809  860 
Long-term debt, net of unamortized deferred financing costs 12,889  13,396  13,373  13,373  11,360  3,022  3,132 
Total debt 14,396  14,782  14,679  14,679  12,337  3,831  3,992 
Cash and cash equivalents (1,296) (1,167) (1,508) (1,508) (9,671) (783) (605)
Net debt 13,100  13,615  13,171  13,171  2,666  3,048  3,387 
15

celogoa.jpg
Table 8
Certain Items - Unaudited
The following Certain Items attributable to Celanese Corporation are included in Net earnings (loss) and are adjustments to non-GAAP measures:
Q2 '23 Q1 '23 2022 Q4 '22 Q3 '22 Q2 '22 Q1 '22 Income Statement Classification
(In $ millions)
Exit and shutdown costs 21  26  52  14  29  Cost of sales / SG&A / Other (charges) gains, net / Gain (loss) on disposition of businesses and assets, net / Non-operating pension and other postretirement employee benefit (expense) income
Asset impairments —  —  13  12  (1) —  Cost of sales / Other (charges) gains, net
Impact from plant incidents and natural disasters(1)
—  17  17  —  —  —  Cost of sales
Mergers, acquisitions and dispositions 23  99  267  138  44  29  56  Cost of sales / SG&A
Actuarial (gain) loss on pension and postretirement plans —  —  80  80  —  —  —  Cost of sales / SG&A / Non-operating pension and other postretirement employee benefit (expense) income
Legal settlements and commercial disputes —  —  —  Cost of sales / SG&A / Other (charges) gains, net
Other —  (10) —  —  (10) —  Cost of sales / SG&A / Gain (loss) on disposition of businesses and assets, net
Certain Items attributable to Celanese Corporation 54  131  422  239  71  47  65 
___________________________
(1)Primarily associated with Winter Storm Elliott.

16

celogoa.jpg
Table 9
Return on Invested Capital (Adjusted) - Presentation of a Non-GAAP Measure - Unaudited
2022
(In $ millions, except percentages)
Net earnings (loss) attributable to Celanese Corporation 1,894 
Adjusted EBIT (Table 1)
2,171 
Adjusted effective tax rate (Table 3a)
13  %
Adjusted EBIT tax effected 1,889 
2022 2021 Average
(In $ millions, except percentages)
Short-term borrowings and current installments of long-term debt - third parties and affiliates 1,306  791  1,049 
Long-term debt, net of unamortized deferred financing costs 13,373  3,176  8,275 
Celanese Corporation stockholders' equity 5,637  4,189  4,913 
Invested capital 14,237 
Return on invested capital (adjusted) 13.3  %
Net earnings (loss) attributable to Celanese Corporation as a percentage of invested capital 13.3  %
17