| Delaware | 001-37709 | 33-0867444 | ||||||
| (State or other jurisdiction of incorporation) |
(Commission File Number) | (IRS Employer Identification Number) |
||||||
| Securities registered pursuant to Section 12(b) of the Act: | ||||||||
| Title of each class | Trading Symbol(s) | Name of each exchange on which registered | ||||||
| Common stock, $0.01 par value | AX | New York Stock Exchange | ||||||
| Exhibit | Description | |||||||
| 99.1 | ||||||||
| 99.2 | ||||||||
| 99.3 | ||||||||
| 99.4 | ||||||||
| 104 | Cover Page Interactive Data File (embedded within the Inline XBRL document) | |||||||
| Axos Financial, Inc. | ||||||||||||||
| Date: | July 27, 2023 | By: | /s/ Derrick K. Walsh | |||||||||||
| Derrick K. Walsh | ||||||||||||||
| EVP and Chief Financial Officer | ||||||||||||||

| Three Months Ended June 30, | |||||||||||||||||
| (Dollars in thousands, except per share data) | 2023 | 2022 | % Change | ||||||||||||||
| Net interest income | $ | 203,754 | $ | 165,410 | 23.2 | % | |||||||||||
| Non-interest income | $ | 32,705 | $ | 27,100 | 20.7 | % | |||||||||||
| Net income | $ | 87,356 | $ | 57,896 | 50.9 | % | |||||||||||
Adjusted Earnings (Non-GAAP)1 |
$ | 89,431 | $ | 67,616 | 32.3 | % | |||||||||||
| Diluted EPS | $ | 1.46 | $ | 0.96 | 52.1 | % | |||||||||||
Adjusted EPS (Non-GAAP)1 |
$ | 1.50 | $ | 1.12 | 33.9 | % | |||||||||||
| For the Three Months Ended June 30, 2023 | |||||||||||||||||||||||
| (Dollars in thousands) | Banking Business | Securities Business | Corporate/Eliminations | Axos Consolidated | |||||||||||||||||||
| Net interest income | $ | 201,770 | $ | 5,556 | $ | (3,572) | $ | 203,754 | |||||||||||||||
| Provision for loan losses | 7,000 | — | — | 7,000 | |||||||||||||||||||
| Non-interest income | 10,306 | 37,640 | (15,241) | 32,705 | |||||||||||||||||||
| Non-interest expense | 95,579 | 27,648 | (10,771) | 112,456 | |||||||||||||||||||
| Income (Loss) before income taxes | $ | 109,497 | $ | 15,548 | $ | (8,042) | $ | 117,003 | |||||||||||||||
| For the Three Months Ended June 30, 2022 | |||||||||||||||||||||||
| (Dollars in thousands) | Banking Business | Securities Business | Corporate/Eliminations | Axos Consolidated | |||||||||||||||||||
| Net interest income | $ | 165,504 | $ | 3,509 | $ | (3,603) | $ | 165,410 | |||||||||||||||
| Provision for loan losses | 6,000 | — | — | 6,000 | |||||||||||||||||||
| Non-interest income | 14,004 | 18,864 | (5,768) | 27,100 | |||||||||||||||||||
| Non-interest expense | 83,817 | 22,797 | (1,821) | 104,793 | |||||||||||||||||||
| Income (Loss) before income taxes | $ | 89,691 | $ | (424) | $ | (7,550) | $ | 81,717 | |||||||||||||||
| Twelve Months Ended June 30, 2023 | |||||||||||||||||||||||
| (Dollars in thousands) | Banking Business | Securities Business | Corporate/Eliminations | Axos Consolidated | |||||||||||||||||||
| Net interest income | $ | 776,294 | $ | 21,042 | $ | (14,215) | $ | 783,121 | |||||||||||||||
| Provision for loan losses | 24,750 | — | — | 24,750 | |||||||||||||||||||
| Non-interest income | 42,260 | 141,107 | (62,879) | 120,488 | |||||||||||||||||||
| Non-interest expense | 390,911 | 102,572 | (46,368) | 447,115 | |||||||||||||||||||
| Income (Loss) before income taxes | $ | 402,893 | $ | 59,577 | $ | (30,726) | $ | 431,744 | |||||||||||||||
| Twelve Months Ended June 30, 2022 | |||||||||||||||||||||||
| (Dollars in thousands) | Banking Business | Securities Business | Corporate/Eliminations | Axos Consolidated | |||||||||||||||||||
| Net interest income | $ | 597,833 | $ | 17,580 | $ | (8,255) | $ | 607,158 | |||||||||||||||
| Provision for loan losses | 18,500 | — | — | 18,500 | |||||||||||||||||||
| Non-interest income | 60,881 | 64,069 | (11,587) | 113,363 | |||||||||||||||||||
| Non-interest expense | 274,079 | 84,014 | 3,969 | 362,062 | |||||||||||||||||||
| Income (Loss) before income taxes | $ | 366,135 | $ | (2,365) | $ | (23,811) | $ | 339,959 | |||||||||||||||
| Three Months Ended | Twelve Months Ended | ||||||||||||||||||||||
| June 30, | June 30, | ||||||||||||||||||||||
| (Dollars in thousands, except per share amounts) | 2023 | 2022 | 2023 | 2022 | |||||||||||||||||||
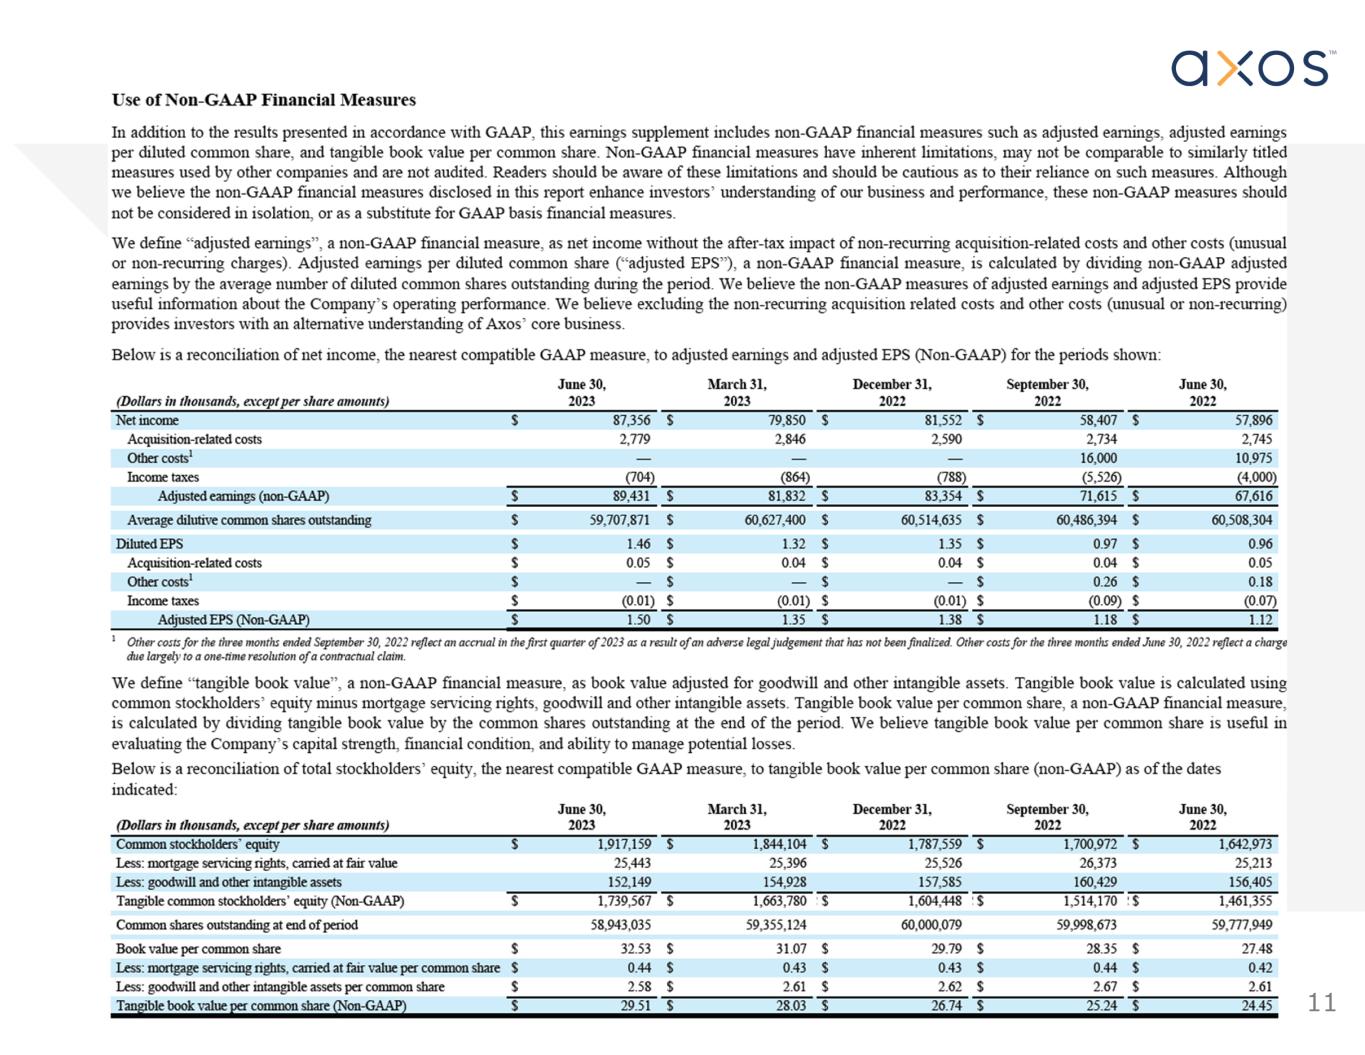
| Net income | $ | 87,356 | $ | 57,896 | $ | 307,165 | $ | 240,716 | |||||||||||||||
| Acquisition-related costs | 2,779 | 2,745 | 10,948 | 11,355 | |||||||||||||||||||
Other costs1 |
— | 10,975 | 16,000 | 10,975 | |||||||||||||||||||
| Income taxes | (704) | (4,000) | (7,776) | (6,519) | |||||||||||||||||||
| Adjusted earnings (Non-GAAP) | $ | 89,431 | $ | 67,616 | $ | 326,337 | $ | 256,527 | |||||||||||||||
| Average dilutive common shares outstanding | 59,707,871 | 60,508,304 | 60,566,854 | 60,610,954 | |||||||||||||||||||
| Diluted EPS | $ | 1.46 | $ | 0.96 | $ | 5.07 | $ | 3.97 | |||||||||||||||
| Acquisition-related costs | 0.05 | 0.05 | 0.18 | 0.19 | |||||||||||||||||||
Other costs1 |
— | 0.18 | 0.27 | 0.18 | |||||||||||||||||||
| Income taxes | (0.01) | (0.07) | (0.13) | (0.11) | |||||||||||||||||||
| Adjusted EPS (Non-GAAP) | $ | 1.50 | $ | 1.12 | $ | 5.39 | $ | 4.23 | |||||||||||||||
| June 30, | |||||||||||
| (Dollars in thousands, except per share amounts) | 2023 | 2022 | |||||||||
| Common stockholders’ equity | $ | 1,917,159 | $ | 1,642,973 | |||||||
| Less: mortgage servicing rights, carried at fair value | 25,443 | 25,213 | |||||||||
| Less: goodwill and other intangible assets | 152,149 | 156,405 | |||||||||
| Tangible common stockholders’ equity (Non-GAAP) | $ | 1,739,567 | $ | 1,461,355 | |||||||
| Common shares outstanding at end of period | 58,943,035 | 59,777,949 | |||||||||
| Book value per common share | $ | 32.53 | $ | 27.48 | |||||||
| Less: mortgage servicing rights, carried at fair value per common share | 0.44 | 0.42 | |||||||||
| Less: goodwill and other intangible assets per common share | 2.58 | 2.61 | |||||||||
| Tangible book value per common share (Non-GAAP) | $ | 29.51 | $ | 24.45 | |||||||
| (Dollars in thousands) | June 30, 2023 |
June 30, 2022 |
June 30, 2021 |
||||||||||||||
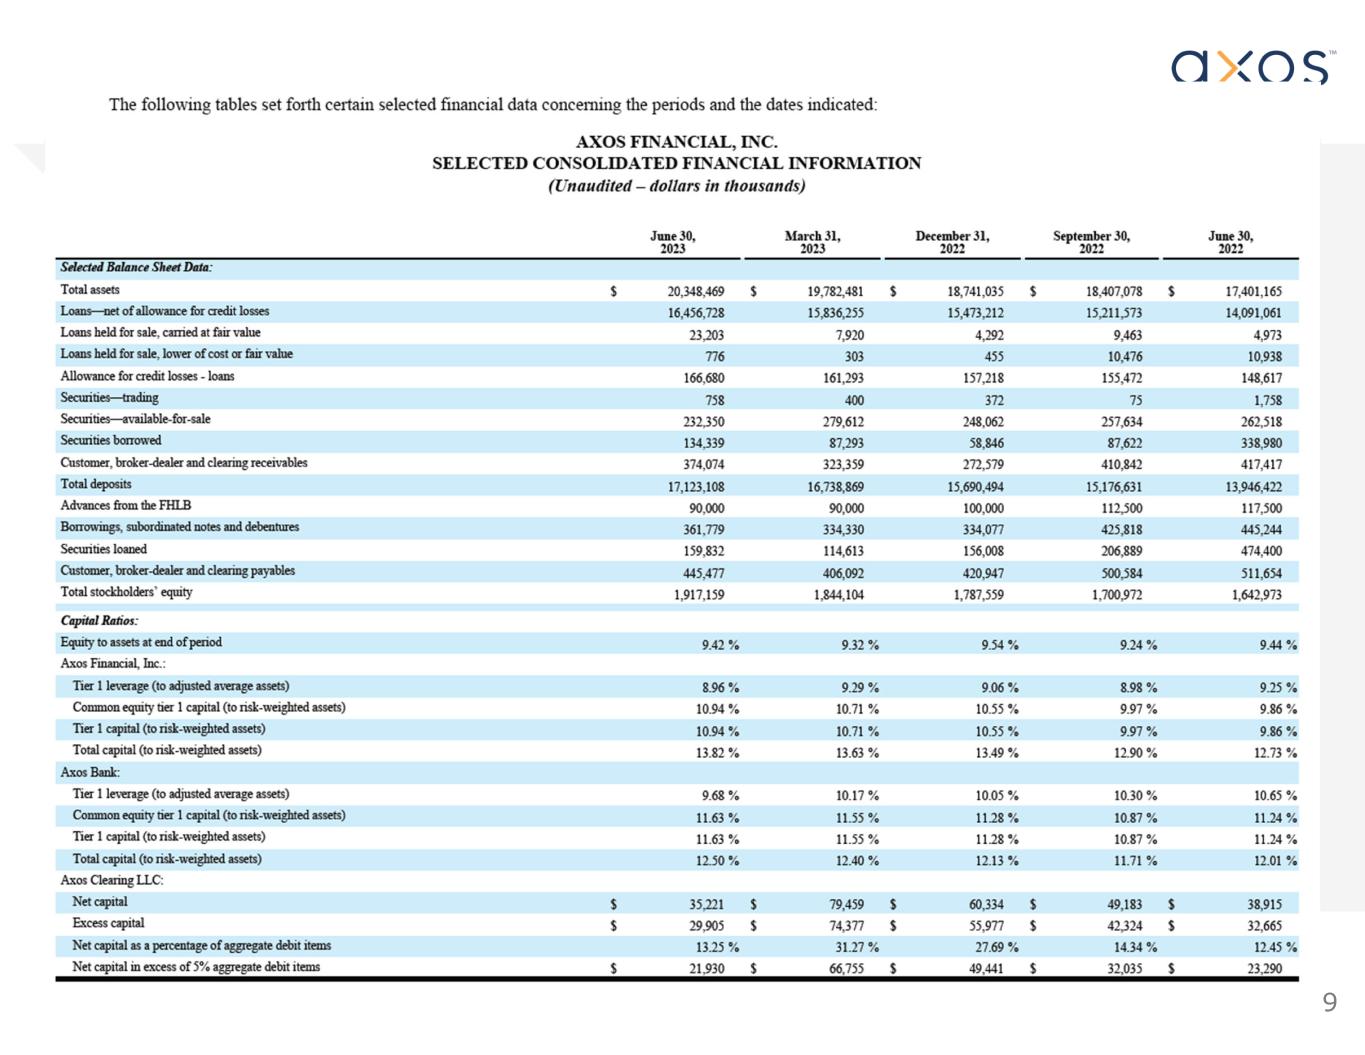
| Selected Balance Sheet Data: | |||||||||||||||||
| Total assets | $ | 20,348,469 | $ | 17,401,165 | $ | 14,265,565 | |||||||||||
| Loans—net of allowance for credit losses | 16,456,728 | 14,091,061 | 11,414,814 | ||||||||||||||
| Loans held for sale, carried at fair value | 23,203 | 4,973 | 29,768 | ||||||||||||||
| Loans held for sale, lower of cost or fair value | 776 | 10,938 | 12,294 | ||||||||||||||
| Allowance for credit losses - loans | 166,680 | 148,617 | 132,958 | ||||||||||||||
| Securities—trading | 758 | 1,758 | 1,983 | ||||||||||||||
| Securities—available-for-sale | 232,350 | 262,518 | 187,335 | ||||||||||||||
| Securities borrowed | 134,339 | 338,980 | 619,088 | ||||||||||||||
| Customer, broker-dealer and clearing receivables | 374,074 | 417,417 | 369,815 | ||||||||||||||
| Total deposits | 17,123,108 | 13,946,422 | 10,815,797 | ||||||||||||||
| Advances from the FHLB | 90,000 | 117,500 | 353,500 | ||||||||||||||
| Borrowings, subordinated notes and debentures | 361,779 | 445,244 | 221,358 | ||||||||||||||
| Securities loaned | 159,832 | 474,400 | 728,988 | ||||||||||||||
| Customer, broker-dealer and clearing payables | 445,477 | 511,654 | 535,425 | ||||||||||||||
| Total stockholders’ equity | 1,917,159 | 1,642,973 | 1,400,936 | ||||||||||||||
| Capital Ratios: | |||||||||||||||||
| Equity to assets at end of period | 9.42 | % | 9.44 | % | 9.82 | % | |||||||||||
| Axos Financial, Inc.: | |||||||||||||||||
| Tier 1 leverage capital to adjusted average assets | 8.96 | % | 9.25 | % | 8.82 | % | |||||||||||
| Common equity tier 1 capital (to risk-weighted assets) | 10.94 | % | 9.86 | % | 11.36 | % | |||||||||||
| Tier 1 capital (to risk-weighted assets) | 10.94 | % | 9.86 | % | 11.36 | % | |||||||||||
| Total capital (to risk-weighted assets) | 13.82 | % | 12.73 | % | 13.78 | % | |||||||||||
| Axos Bank: | |||||||||||||||||
| Tier 1 leverage capital to adjusted average assets | 9.68 | % | 10.65 | % | 9.45 | % | |||||||||||
| Common equity tier 1 capital (to risk-weighted assets) | 11.63 | % | 11.24 | % | 12.28 | % | |||||||||||
| Tier 1 capital (to risk-weighted assets) | 11.63 | % | 11.24 | % | 12.28 | % | |||||||||||
| Total capital (to risk-weighted assets) | 12.50 | % | 12.01 | % | 13.21 | % | |||||||||||
| Axos Clearing, LLC: | |||||||||||||||||
| Net capital | $ | 35,221 | $ | 38,915 | $ | 35,950 | |||||||||||
| Excess capital | $ | 29,905 | $ | 32,665 | $ | 27,904 | |||||||||||
| Net capital as a percentage of aggregate debit items | 13.25 | % | 12.45 | % | 8.94 | % | |||||||||||
| Net capital in excess of 5% aggregate debit items | $ | 21,930 | $ | 23,290 | $ | 15,836 | |||||||||||
| At or for the Three Months Ended | At or for the Fiscal Year Ended | ||||||||||||||||||||||
| June 30, | June 30, | ||||||||||||||||||||||
| (Dollars in thousands, except per share data) | 2023 | 2022 | 2023 | 2022 | |||||||||||||||||||
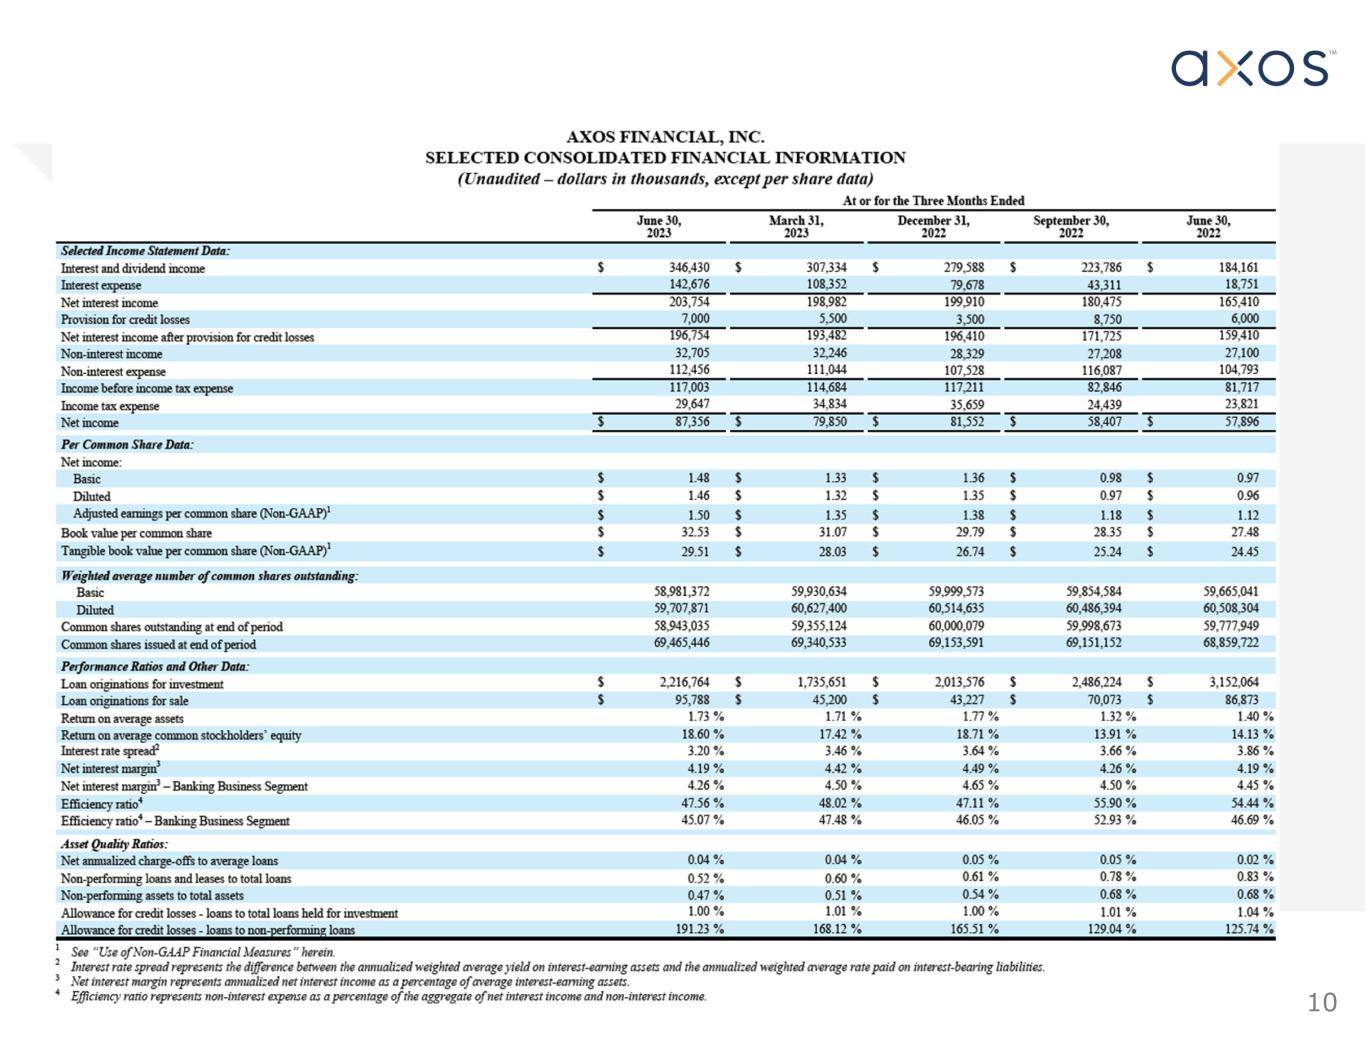
| Selected Income Statement Data: | |||||||||||||||||||||||
| Interest and dividend income | $ | 346,430 | $ | 184,161 | $ | 1,157,138 | $ | 659,728 | |||||||||||||||
| Interest expense | 142,676 | 18,751 | 374,017 | 52,570 | |||||||||||||||||||
| Net interest income | 203,754 | 165,410 | 783,121 | 607,158 | |||||||||||||||||||
| Provision for credit losses | 7,000 | 6,000 | 24,750 | 18,500 | |||||||||||||||||||
| Net interest income after provision for loan losses | 196,754 | 159,410 | 758,371 | 588,658 | |||||||||||||||||||
| Non-interest income | 32,705 | 27,100 | 120,488 | 113,363 | |||||||||||||||||||
| Non-interest expense | 112,456 | 104,793 | 447,115 | 362,062 | |||||||||||||||||||
| Income before income tax expense | 117,003 | 81,717 | 431,744 | 339,959 | |||||||||||||||||||
| Income tax expense | 29,647 | 23,821 | 124,579 | 99,243 | |||||||||||||||||||
| Net income | $ | 87,356 | $ | 57,896 | $ | 307,165 | $ | 240,716 | |||||||||||||||
| Per Share Data: | |||||||||||||||||||||||
| Net income: | |||||||||||||||||||||||
Basic |
$ | 1.48 | $ | 0.97 | $ | 5.15 | $ | 4.04 | |||||||||||||||
Diluted |
$ | 1.46 | $ | 0.96 | $ | 5.07 | $ | 3.97 | |||||||||||||||
Adjusted earnings per common share (Non-GAAP)1 |
$ | 1.50 | $ | 1.12 | $ | 5.39 | $ | 4.23 | |||||||||||||||
| Book value | $ | 32.53 | $ | 27.48 | $ | 32.53 | $ | 27.48 | |||||||||||||||
Tangible book value per common share (Non-GAAP)1 |
$ | 29.51 | $ | 24.45 | $ | 29.51 | $ | 24.45 | |||||||||||||||
| Weighted average number of shares outstanding: | |||||||||||||||||||||||
Basic |
58,981,372 | 59,665,041 | 59,691,541 | 59,523,626 | |||||||||||||||||||
Diluted |
59,707,871 | 60,508,304 | 60,566,854 | 60,610,954 | |||||||||||||||||||
| Common shares outstanding at end of period | 58,943,035 | 59,777,949 | 58,943,035 | 59,777,949 | |||||||||||||||||||
| Common shares issued at end of period | 69,465,446 | 68,859,722 | 69,465,446 | 68,859,722 | |||||||||||||||||||
| Performance Ratios and Other Data: | |||||||||||||||||||||||
| Loan originations for investment | $ | 2,216,764 | $ | 3,152,064 | $ | 8,452,215 | $ | 10,366,796 | |||||||||||||||
| Loan originations for sale | $ | 95,788 | $ | 86,873 | $ | 254,288 | $ | 656,487 | |||||||||||||||
| Return on average assets | 1.73 | % | 1.40 | % | 1.64 | % | 1.57 | % | |||||||||||||||
| Return on average common stockholders’ equity | 18.60 | % | 14.13 | % | 17.22 | % | 15.61 | % | |||||||||||||||
Interest rate spread2 |
3.20 | % | 3.86 | % | 3.44 | % | 3.91 | % | |||||||||||||||
Net interest margin3 |
4.19 | % | 4.19 | % | 4.35 | % | 4.13 | % | |||||||||||||||
Net interest margin3 - Banking Business Segment |
4.26 | % | 4.45 | % | 4.48 | % | 4.36 | % | |||||||||||||||
Efficiency ratio4 |
47.56 | % | 54.44 | % | 49.48 | % | 50.25 | % | |||||||||||||||
Efficiency ratio4 - Banking Business Segment |
45.07 | % | 46.69 | % | 47.76 | % | 41.61 | % | |||||||||||||||
| Asset Quality Ratios: | |||||||||||||||||||||||
| Net annualized charge-offs to average loans | 0.04 | % | 0.02 | % | 0.04 | % | 0.02 | % | |||||||||||||||
| Non-performing loans and leases to total loans | 0.52 | % | 0.83 | % | 0.52 | % | 0.83 | % | |||||||||||||||
| Non-performing assets to total assets | 0.47 | % | 0.68 | % | 0.47 | % | 0.68 | % | |||||||||||||||
| Allowance for credit losses - loans to total loans held for investment | 1.00 | % | 1.04 | % | 1.00 | % | 1.04 | % | |||||||||||||||
| Allowance for credit losses - loans to non-performing loans | 191.23 | % | 125.74 | % | 191.23 | % | 125.74 | % | |||||||||||||||
| At June 30, | |||||||||||
| (Dollars in thousands, except par and stated value) | 2023 | 2022 | |||||||||
| ASSETS | |||||||||||
| Cash and cash equivalents | $ | 2,233,027 | $ | 1,202,587 | |||||||
| Cash segregated for regulatory purposes | 149,059 | 372,112 | |||||||||
| Total cash, cash equivalents, cash segregated | 2,382,086 | 1,574,699 | |||||||||
| Securities: | |||||||||||
| Trading | 758 | 1,758 | |||||||||
| Available-for-sale | 232,350 | 262,518 | |||||||||
| Stock of regulatory agencies | 21,510 | 20,368 | |||||||||
| Loans held for sale, carried at fair value | 23,203 | 4,973 | |||||||||
| Loans held for sale, lower of cost or fair value | 776 | 10,938 | |||||||||
Loans—net of allowance for credit losses of $166,680 as of June 2023 and $148,617 as of June 2022 |
16,456,728 | 14,091,061 | |||||||||
| Mortgage servicing rights, carried at fair value | 25,443 | 25,213 | |||||||||
| Securities borrowed | 134,339 | 338,980 | |||||||||
| Customer, broker-dealer and clearing receivables | 374,074 | 417,417 | |||||||||
| Goodwill and other intangible assets—net | 152,149 | 156,405 | |||||||||
| Other assets | 545,053 | 496,835 | |||||||||
| TOTAL ASSETS | $ | 20,348,469 | $ | 17,401,165 | |||||||
| LIABILITIES AND STOCKHOLDERS’ EQUITY | |||||||||||
| Deposits: | |||||||||||
| Non-interest bearing | $ | 2,898,150 | $ | 5,033,970 | |||||||
| Interest bearing | 14,224,958 | 8,912,452 | |||||||||
| Total deposits | 17,123,108 | 13,946,422 | |||||||||
| Advances from the Federal Home Loan Bank | 90,000 | 117,500 | |||||||||
| Borrowings, subordinated notes and debentures | 361,779 | 445,244 | |||||||||
| Securities loaned | 159,832 | 474,400 | |||||||||
| Customer, broker-dealer and clearing payables | 445,477 | 511,654 | |||||||||
| Accounts payable and other liabilities | 251,114 | 262,972 | |||||||||
| Total liabilities | 18,431,310 | 15,758,192 | |||||||||
| STOCKHOLDERS’ EQUITY: | |||||||||||
| Common stock—$0.01 par value; 150,000,000 shares authorized, 69,465,446 shares issued and 58,943,035 shares outstanding as of June 30, 2023; 68,859,722 shares issued and 59,777,949 shares outstanding as of June 30, 2022 | 695 | 689 | |||||||||
| Additional paid-in capital | 479,878 | 453,784 | |||||||||
| Accumulated other comprehensive income (loss)—net of tax | (6,610) | (2,933) | |||||||||
| Retained earnings | 1,735,609 | 1,428,444 | |||||||||
| Treasury stock, at cost; 10,522,411 shares as of June 30, 2023 and 9,081,773 shares as of June 30, 2022 | (292,413) | (237,011) | |||||||||
| Total stockholders’ equity | 1,917,159 | 1,642,973 | |||||||||
| TOTAL LIABILITIES AND STOCKHOLDERS’ EQUITY | $ | 20,348,469 | $ | 17,401,165 | |||||||
| For the Quarters Ended June 30, | |||||||||||
| (Dollars in thousands, except earnings per share) | 2023 | 2022 | |||||||||
| INTEREST AND DIVIDEND INCOME: | |||||||||||
| Loans, including fees | $ | 305,011 | $ | 174,110 | |||||||
| Securities borrowed and customer receivables | 4,815 | 4,462 | |||||||||
| Investments and other | 36,604 | 5,589 | |||||||||
| Total interest and dividend income | 346,430 | 184,161 | |||||||||
| INTEREST EXPENSE: | |||||||||||
| Deposits | 137,189 | 11,179 | |||||||||
| Advances from the Federal Home Loan Bank | 523 | 1,663 | |||||||||
| Securities loaned | 356 | 503 | |||||||||
| Other borrowings | 4,608 | 5,406 | |||||||||
| Total interest expense | 142,676 | 18,751 | |||||||||
| Net interest income | 203,754 | 165,410 | |||||||||
| Provision for credit losses | 7,000 | 6,000 | |||||||||
| Net interest income, after provision for credit losses | 196,754 | 159,410 | |||||||||
| NON-INTEREST INCOME: | |||||||||||
| Broker-dealer fee income | 13,768 | 4,912 | |||||||||
| Advisory fee income | 7,503 | 8,152 | |||||||||
| Banking and service fees | 7,838 | 6,308 | |||||||||
| Mortgage banking income | 1,988 | 3,498 | |||||||||
| Prepayment penalty fee income | 1,608 | 4,230 | |||||||||
| Total non-interest income | 32,705 | 27,100 | |||||||||
| NON-INTEREST EXPENSE: | |||||||||||
| Salaries and related costs | 54,509 | 43,541 | |||||||||
| Data processing | 16,095 | 13,594 | |||||||||
| Depreciation and amortization | 5,665 | 6,022 | |||||||||
| Advertising and promotional | 8,095 | 3,449 | |||||||||
| Professional services | 5,979 | 7,649 | |||||||||
| Occupancy and equipment | 4,037 | 3,480 | |||||||||
| FDIC and regulatory fees | 4,371 | 3,967 | |||||||||
| Broker-dealer clearing charges | 3,509 | 3,940 | |||||||||
| General and administrative expense | 10,196 | 19,151 | |||||||||
| Total non-interest expense | 112,456 | 104,793 | |||||||||
| INCOME BEFORE INCOME TAXES | 117,003 | 81,717 | |||||||||
| INCOME TAXES | 29,647 | 23,821 | |||||||||
| NET INCOME | $ | 87,356 | $ | 57,896 | |||||||
| COMPREHENSIVE INCOME | $ | 86,319 | $ | 56,896 | |||||||
| Basic earnings per share | $ | 1.48 | $ | 0.97 | |||||||
| Diluted earnings per share | $ | 1.46 | $ | 0.96 | |||||||
| Year Ended June 30, | |||||||||||||||||
| (Dollars in thousands, except earnings per share) | 2023 | 2022 | 2021 | ||||||||||||||
| INTEREST AND DIVIDEND INCOME: | |||||||||||||||||
| Loans, including fees | $ | 1,048,874 | $ | 626,628 | $ | 584,410 | |||||||||||
| Securities borrowed and customer receivables | 18,657 | 20,512 | 20,466 | ||||||||||||||
| Investments and other | 89,607 | 12,588 | 12,987 | ||||||||||||||
| Total interest and dividend income | 1,157,138 | 659,728 | 617,863 | ||||||||||||||
| INTEREST EXPENSE: | |||||||||||||||||
| Deposits | 339,481 | 33,620 | 60,529 | ||||||||||||||
| Advances from the Federal Home Loan Bank | 12,644 | 4,625 | 4,672 | ||||||||||||||
| Securities loaned | 3,673 | 1,124 | 1,496 | ||||||||||||||
| Other borrowings | 18,219 | 13,201 | 12,424 | ||||||||||||||
| Total interest expense | 374,017 | 52,570 | 79,121 | ||||||||||||||
| Net interest income | 783,121 | 607,158 | 538,742 | ||||||||||||||
| Provision for credit losses | 24,750 | 18,500 | 23,750 | ||||||||||||||
| Net interest income, after provision for credit losses | 758,371 | 588,658 | 514,992 | ||||||||||||||
| NON-INTEREST INCOME: | |||||||||||||||||
| Broker-dealer fee income | 46,503 | 22,880 | 26,317 | ||||||||||||||
| Advisory fee income | 28,324 | 29,230 | — | ||||||||||||||
| Banking and service fees | 32,938 | 28,752 | 29,137 | ||||||||||||||
| Mortgage banking income | 7,101 | 19,198 | 42,641 | ||||||||||||||
| Prepayment penalty fee income | 5,622 | 13,303 | 7,166 | ||||||||||||||
| Total non-interest income | 120,488 | 113,363 | 105,261 | ||||||||||||||
| NON-INTEREST EXPENSE: | |||||||||||||||||
| Salaries and related costs | 204,271 | 167,390 | 152,576 | ||||||||||||||
| Data processing | 60,557 | 50,159 | 40,719 | ||||||||||||||
| Depreciation and amortization | 23,387 | 24,596 | 24,124 | ||||||||||||||
| Advertising and promotional | 37,150 | 13,580 | 14,212 | ||||||||||||||
| Professional services | 29,268 | 22,482 | 22,241 | ||||||||||||||
| Occupancy and equipment | 15,647 | 13,745 | 13,402 | ||||||||||||||
| FDIC and regulatory fees | 15,534 | 11,823 | 10,603 | ||||||||||||||
| Broker-dealer clearing charges | 13,433 | 15,184 | 11,152 | ||||||||||||||
| General and administrative expense | 47,868 | 43,103 | 25,481 | ||||||||||||||
| Total non-interest expense | 447,115 | 362,062 | 314,510 | ||||||||||||||
| INCOME BEFORE INCOME TAXES | 431,744 | 339,959 | 305,743 | ||||||||||||||
| INCOME TAXES | 124,579 | 99,243 | 90,036 | ||||||||||||||
| NET INCOME | $ | 307,165 | $ | 240,716 | $ | 215,707 | |||||||||||
| COMPREHENSIVE INCOME | $ | 303,488 | $ | 235,276 | $ | 219,151 | |||||||||||
| Basic earnings per share | $ | 5.15 | $ | 4.04 | $ | 3.64 | |||||||||||
| Diluted earnings per share | $ | 5.07 | $ | 3.97 | $ | 3.56 | |||||||||||
| Year Ended June 30, | |||||||||||||||||
| (Dollars in thousands) | 2023 | 2022 | 2021 | ||||||||||||||
| NET INCOME | $ | 307,165 | $ | 240,716 | $ | 215,707 | |||||||||||
| Net unrealized gain (loss) from available-for-sale securities, net of tax expense (benefit) of $(1,575), $(2,416), and $1,495 for the years ended June 30, 2023, 2022 and 2021, respectively. | (3,677) | (5,440) | 3,444 | ||||||||||||||
| Other comprehensive income (loss) | $ | (3,677) | $ | (5,440) | $ | 3,444 | |||||||||||
| COMPREHENSIVE INCOME | $ | 303,488 | $ | 235,276 | $ | 219,151 | |||||||||||
| Preferred Stock | Common Stock | Additional Paid-in Capital |
Accumulated Other Comprehensive Income (Loss), Net of Income Tax |
Retained Earnings |
Treasury Stock |
Total | |||||||||||||||||||||||||||||||||||||||||||||||||||||||||||
| Number of Shares | |||||||||||||||||||||||||||||||||||||||||||||||||||||||||||||||||
| (Dollars in thousands) | Shares | Amount | Issued | Treasury | Outstanding | Amount | |||||||||||||||||||||||||||||||||||||||||||||||||||||||||||
| Balance as of June 30, 2020 | 515 | $ | 5,063 | 67,323,053 | (7,710,418) | 59,612,635 | $ | 673 | $ | 411,873 | $ | (937) | $ | 1,009,299 | $ | (195,125) | $ | 1,230,846 | |||||||||||||||||||||||||||||||||||||||||||||||
| Cumulative effect of change in accounting principle net of tax, adoption of ASU No. 2016-13 | — | — | — | — | — | — | — | — | (37,088) | — | (37,088) | ||||||||||||||||||||||||||||||||||||||||||||||||||||||
| Net income | — | — | — | — | — | — | — | — | 215,707 | — | 215,707 | ||||||||||||||||||||||||||||||||||||||||||||||||||||||
| Other comprehensive income (loss) | — | — | — | — | — | — | — | 3,444 | — | — | 3,444 | ||||||||||||||||||||||||||||||||||||||||||||||||||||||
| Cash dividends on preferred stock | — | — | — | — | — | — | — | — | (103) | — | (103) | ||||||||||||||||||||||||||||||||||||||||||||||||||||||
| Preferred stock - Series A redemption | (515) | (5,063) | — | — | — | — | — | — | (87) | — | (5,150) | ||||||||||||||||||||||||||||||||||||||||||||||||||||||
| Purchase of treasury stock | — | — | — | (753,597) | (753,597) | — | — | — | — | (16,757) | (16,757) | ||||||||||||||||||||||||||||||||||||||||||||||||||||||
| Stock-based compensation activity | — | — | 746,268 | (287,362) | 458,906 | 8 | 20,677 | — | — | (10,648) | 10,037 | ||||||||||||||||||||||||||||||||||||||||||||||||||||||
| Balance as of June 30, 2021 | — | $ | — | 68,069,321 | (8,751,377) | 59,317,944 | $ | 681 | $ | 432,550 | $ | 2,507 | $ | 1,187,728 | $ | (222,530) | $ | 1,400,936 | |||||||||||||||||||||||||||||||||||||||||||||||
| Net income | — | — | — | — | — | — | — | — | 240,716 | — | 240,716 | ||||||||||||||||||||||||||||||||||||||||||||||||||||||
| Other comprehensive income (loss) | — | — | — | — | — | — | — | (5,440) | — | — | (5,440) | ||||||||||||||||||||||||||||||||||||||||||||||||||||||
| Stock-based compensation activity | — | — | 790,401 | (330,396) | 460,005 | 8 | 21,234 | — | — | (14,481) | 6,761 | ||||||||||||||||||||||||||||||||||||||||||||||||||||||
| Stock option exercises and tax benefits | — | — | — | — | — | — | — | — | — | — | — | ||||||||||||||||||||||||||||||||||||||||||||||||||||||
| Balance as of June 30, 2022 | — | $ | — | 68,859,722 | (9,081,773) | 59,777,949 | $ | 689 | $ | 453,784 | $ | (2,933) | $ | 1,428,444 | $ | (237,011) | $ | 1,642,973 | |||||||||||||||||||||||||||||||||||||||||||||||
| Net income | — | — | — | — | — | — | — | 307,165 | — | 307,165 | |||||||||||||||||||||||||||||||||||||||||||||||||||||||
| Other comprehensive income (loss) | — | — | — | — | — | — | — | (3,677) | — | — | (3,677) | ||||||||||||||||||||||||||||||||||||||||||||||||||||||
| Purchase of treasury stock | — | — | — | (1,321,161) | (1,321,161) | — | — | — | — | (49,258) | (49,258) | ||||||||||||||||||||||||||||||||||||||||||||||||||||||
| Stock-based compensation activity | — | — | 605,724 | (119,477) | 486,247 | 6 | 26,094 | — | — | (6,144) | 19,956 | ||||||||||||||||||||||||||||||||||||||||||||||||||||||
| Balance as of June 30, 2023 | — | $ | — | 69,465,446 | (10,522,411) | 58,943,035 | $ | 695 | $ | 479,878 | $ | (6,610) | $ | 1,735,609 | $ | (292,413) | $ | 1,917,159 | |||||||||||||||||||||||||||||||||||||||||||||||
|
AXOS FINANCIAL, INC.
CONSOLIDATED STATEMENTS OF CASH FLOWS
(Unaudited)
| |||||||||||||||||
| Year Ended June 30, | |||||||||||||||||
| (Dollars in thousands) | 2023 | 2022 | 2021 | ||||||||||||||
| CASH FLOWS FROM OPERATING ACTIVITIES: | |||||||||||||||||
| Net income | $ | 307,165 | $ | 240,716 | $ | 215,707 | |||||||||||
| Adjustments to reconcile net income to net cash provided by (used in) operating activities: | |||||||||||||||||
| Depreciation and amortization | 23,387 | 24,596 | 24,124 | ||||||||||||||
| Other accretion and amortization | (1,616) | 3,933 | 4,752 | ||||||||||||||
| Stock-based compensation expense | 26,100 | 21,242 | 20,685 | ||||||||||||||
| Trading activity | 1,000 | 225 | (1,878) | ||||||||||||||
| Provision for credit losses | 24,750 | 18,500 | 23,750 | ||||||||||||||
| Deferred income taxes | (19,586) | (9,400) | (8,828) | ||||||||||||||
| Origination of loans held for sale | (254,288) | (656,487) | (1,608,700) | ||||||||||||||
| Unrealized and realized gains on loans held for sale | (7,999) | (16,237) | (41,172) | ||||||||||||||
| Proceeds from sale of loans held for sale | 242,772 | 689,530 | 1,671,515 | ||||||||||||||
| Amortization and change in fair value of mortgage servicing rights | 634 | (2,228) | 6,319 | ||||||||||||||
| Net change in assets and liabilities which provide (use) cash: | |||||||||||||||||
| Securities borrowed | 204,641 | 280,108 | (396,720) | ||||||||||||||
| Customer, broker-dealer and clearing receivables | 43,342 | (43,925) | (149,549) | ||||||||||||||
| Other Assets | (13,724) | (107,314) | (7,460) | ||||||||||||||
| Securities loaned | (314,568) | (254,588) | 473,043 | ||||||||||||||
| Customer, broker-dealer and clearing payables | (66,177) | (23,771) | 187,811 | ||||||||||||||
| Accounts payable and other liabilities | (7,874) | 45,382 | (817) | ||||||||||||||
| Net cash provided by operating activities | $ | 187,959 | $ | 210,282 | $ | 412,582 | |||||||||||
| CASH FLOWS FROM INVESTING ACTIVITIES: | |||||||||||||||||
| Purchases of available-for-sale investment securities | (32,669) | (143,733) | (122,338) | ||||||||||||||
| Proceeds from sale and repayment of available-for-sale investment securities | 57,989 | 131,868 | 74,667 | ||||||||||||||
| Purchase of stock of regulatory agencies | (108,724) | (54,350) | (305) | ||||||||||||||
| Proceeds from redemption of stock of regulatory agencies | 108,724 | 54,350 | 920 | ||||||||||||||
| Origination of loans held for investment | (8,346,443) | (10,325,104) | (5,761,303) | ||||||||||||||
| Proceeds from sale of loans originally classified as held for investment | 14,185 | 106,324 | 80,049 | ||||||||||||||
| Mortgage warehouse loan activity, net | 30,773 | 333,562 | (139,806) | ||||||||||||||
| Proceeds from sale of other real estate owned and repossessed assets | 4,167 | 8,654 | 1,586 | ||||||||||||||
| Proceeds from BOLI claim settlement | 2,778 | — | — | ||||||||||||||
| Acquisition of business activity, net of cash acquired | (5,531) | (54,597) | — | ||||||||||||||
| Purchase of loans and leases, net of discounts and premiums | (1,564) | (33,085) | (3,619) | ||||||||||||||
| Principal repayments on loans | 5,916,179 | 7,220,931 | 5,013,817 | ||||||||||||||
| Purchases of furniture, equipment, software and intangibles | (30,215) | (21,504) | (10,437) | ||||||||||||||
| Net cash used in investing activities | $ | (2,390,351) | $ | (2,776,684) | $ | (866,769) | |||||||||||
| CASH FLOWS FROM FINANCING ACTIVITIES: | |||||||||||||||||
| Net increase in deposits | 3,176,686 | 3,130,625 | (520,897) | ||||||||||||||
| Repayments of the Federal Home Loan Bank term advances | (27,500) | (50,000) | (70,000) | ||||||||||||||
| Net (repayment) proceeds of Federal Home Loan Bank other advances | — | (186,000) | 181,000 | ||||||||||||||
| Net (repayment) proceeds of other borrowings | (84,300) | 75,300 | 14,700 | ||||||||||||||
| Redemption of subordinated notes | — | — | (51,000) | ||||||||||||||
| Repayment of Paycheck Protection Program Liquidity Facility advances | — | — | (151,952) | ||||||||||||||
| Tax payments related to settlement of restricted stock units | (6,144) | (14,481) | (10,648) | ||||||||||||||
| Purchase of treasury stock | (48,963) | — | (16,757) | ||||||||||||||
| Redemption of Preferred Stock, Series A | — | — | (5,150) | ||||||||||||||
| Cash dividends paid on preferred stock | — | — | (103) | ||||||||||||||
| Payment of debt issuance costs | — | (2,120) | (2,748) | ||||||||||||||
| Proceeds from issuance of subordinated notes | — | 150,000 | 175,000 | ||||||||||||||
| Net cash provided by (used in) financing activities | $ | 3,009,779 | $ | 3,103,324 | $ | (458,555) | |||||||||||
| NET CHANGE IN CASH AND CASH EQUIVALENTS | $ | 807,387 | $ | 536,922 | $ | (912,742) | |||||||||||
| CASH AND CASH EQUIVALENTS—Beginning of year | $ | 1,574,699 | $ | 1,037,777 | $ | 1,950,519 | |||||||||||
| CASH AND CASH EQUIVALENTS—End of year | $ | 2,382,086 | $ | 1,574,699 | $ | 1,037,777 | |||||||||||
| SUPPLEMENTAL DISCLOSURE OF CASH FLOW INFORMATION: | |||||||||||||||||
| Interest paid on interest-bearing liabilities | $ | 368,311 | $ | 50,269 | $ | 77,995 | |||||||||||
| Income taxes paid | 131,365 | 99,701 | 92,506 | ||||||||||||||
| Transfers to other real estate and repossessed vehicles from loans held for investment | 12,664 | 2,134 | 1,903 | ||||||||||||||
| Transfers from loans held for investment to loans held for sale | 14,185 | 105,884 | 71,136 | ||||||||||||||
| Transfers from loans held for sale to loans and leases held for investment | 690 | 3,098 | 29,616 | ||||||||||||||
| Operating lease liabilities from obtaining right of use assets | 3,400 | 6,876 | — | ||||||||||||||
| Impact of adoption of ASC 326 on retained earnings | — | — | 37,088 | ||||||||||||||
| Securities transferred from available-for-sale portfolio to other assets | — | — | 70,751 | ||||||||||||||
| (Unaudited) (Dollars in thousands) |
June 30, 2023 | June 30, 2022 | |||||||||
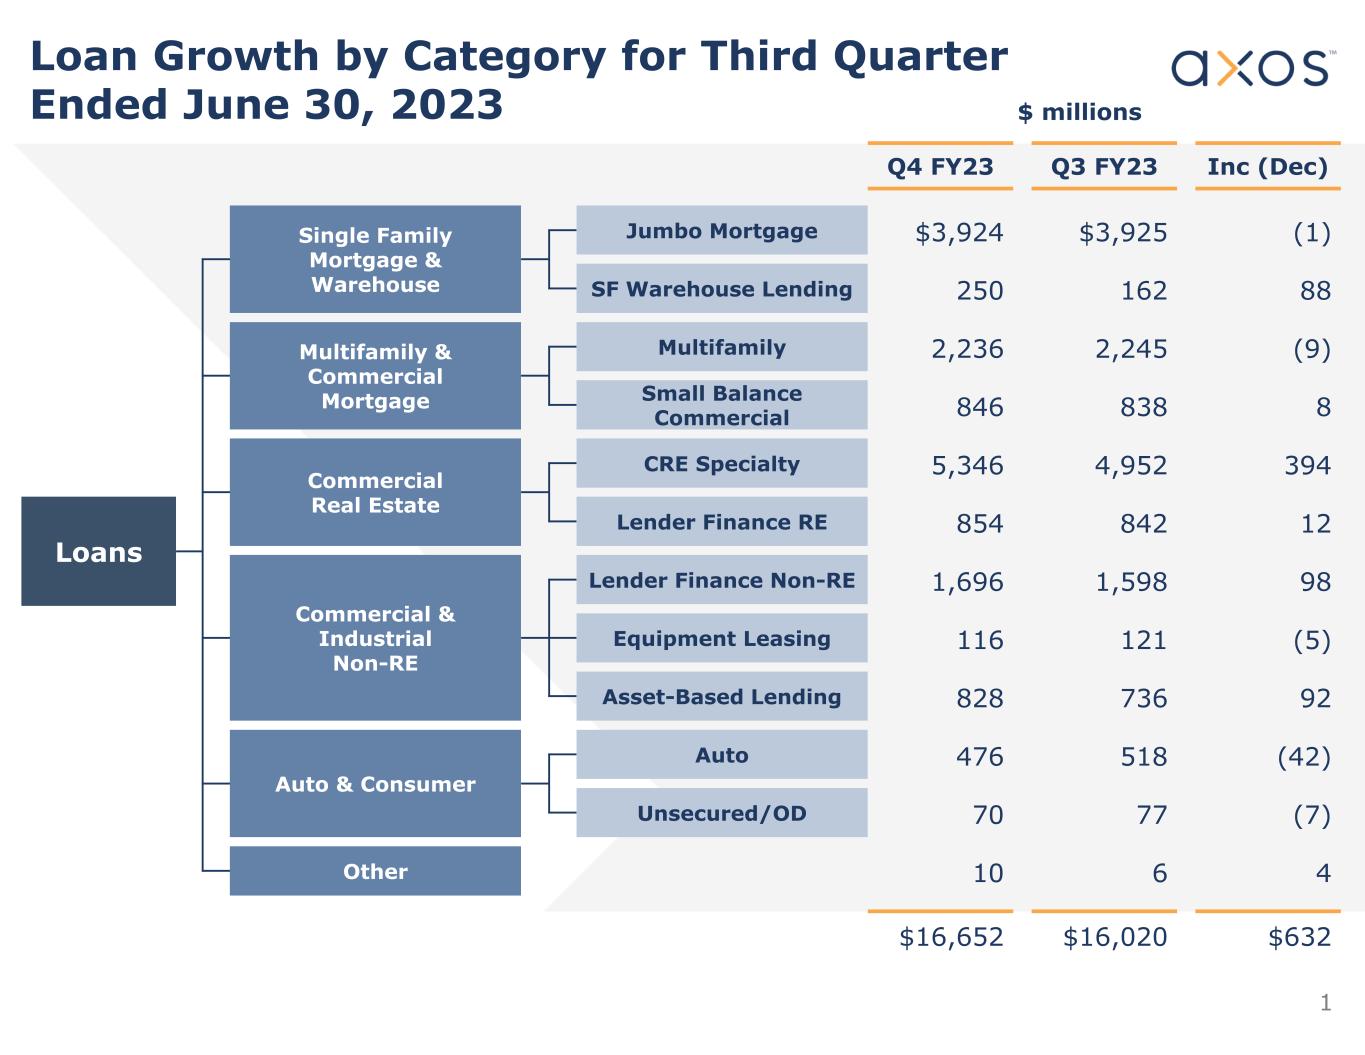
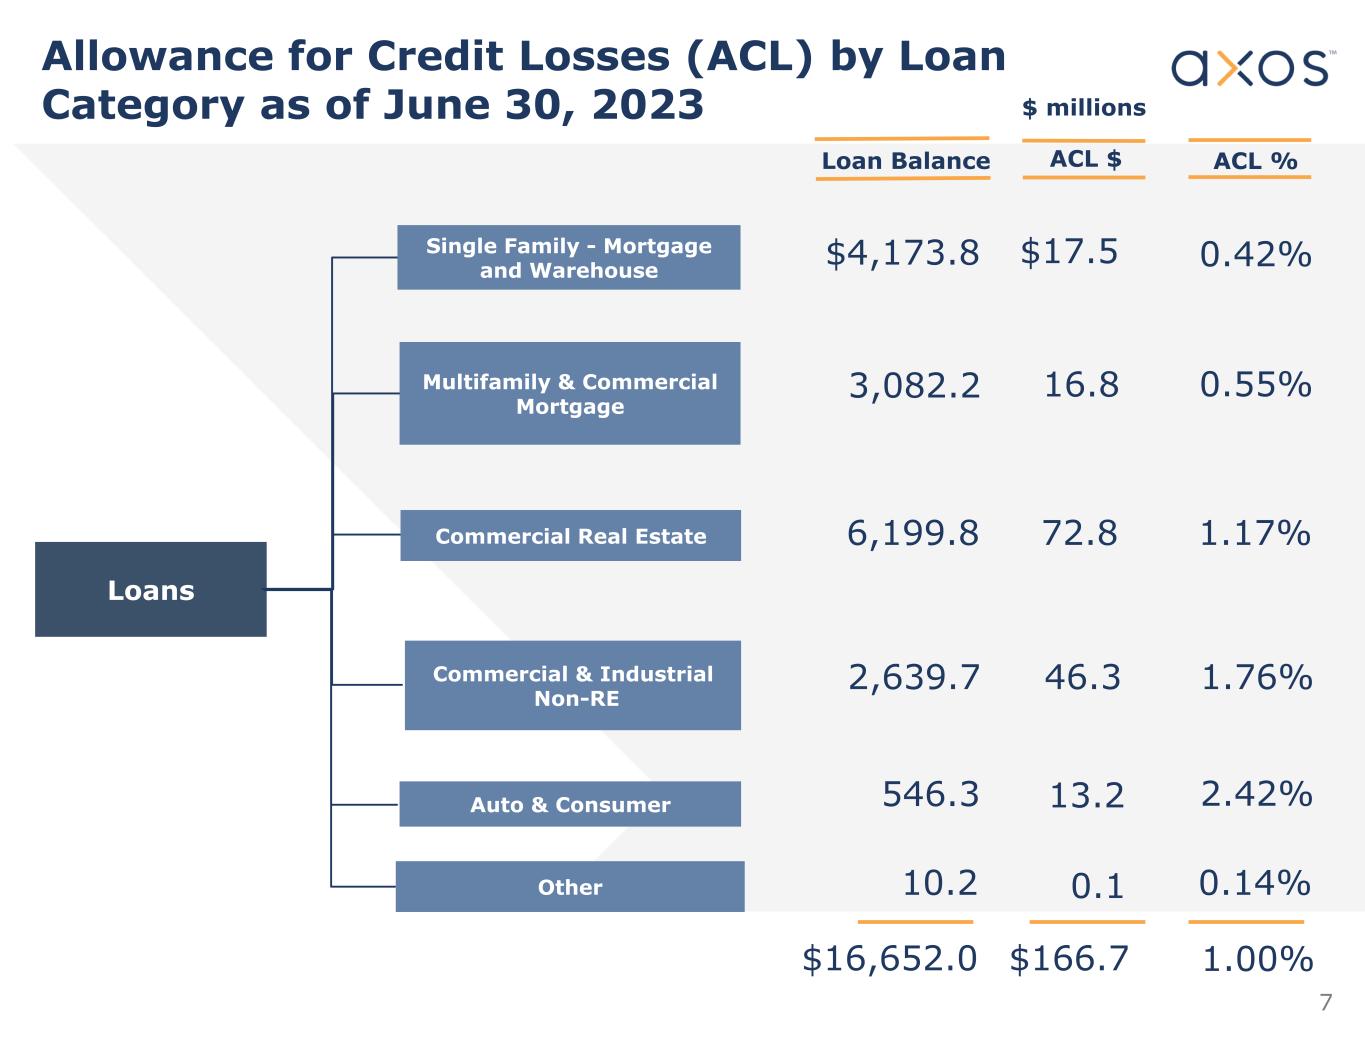
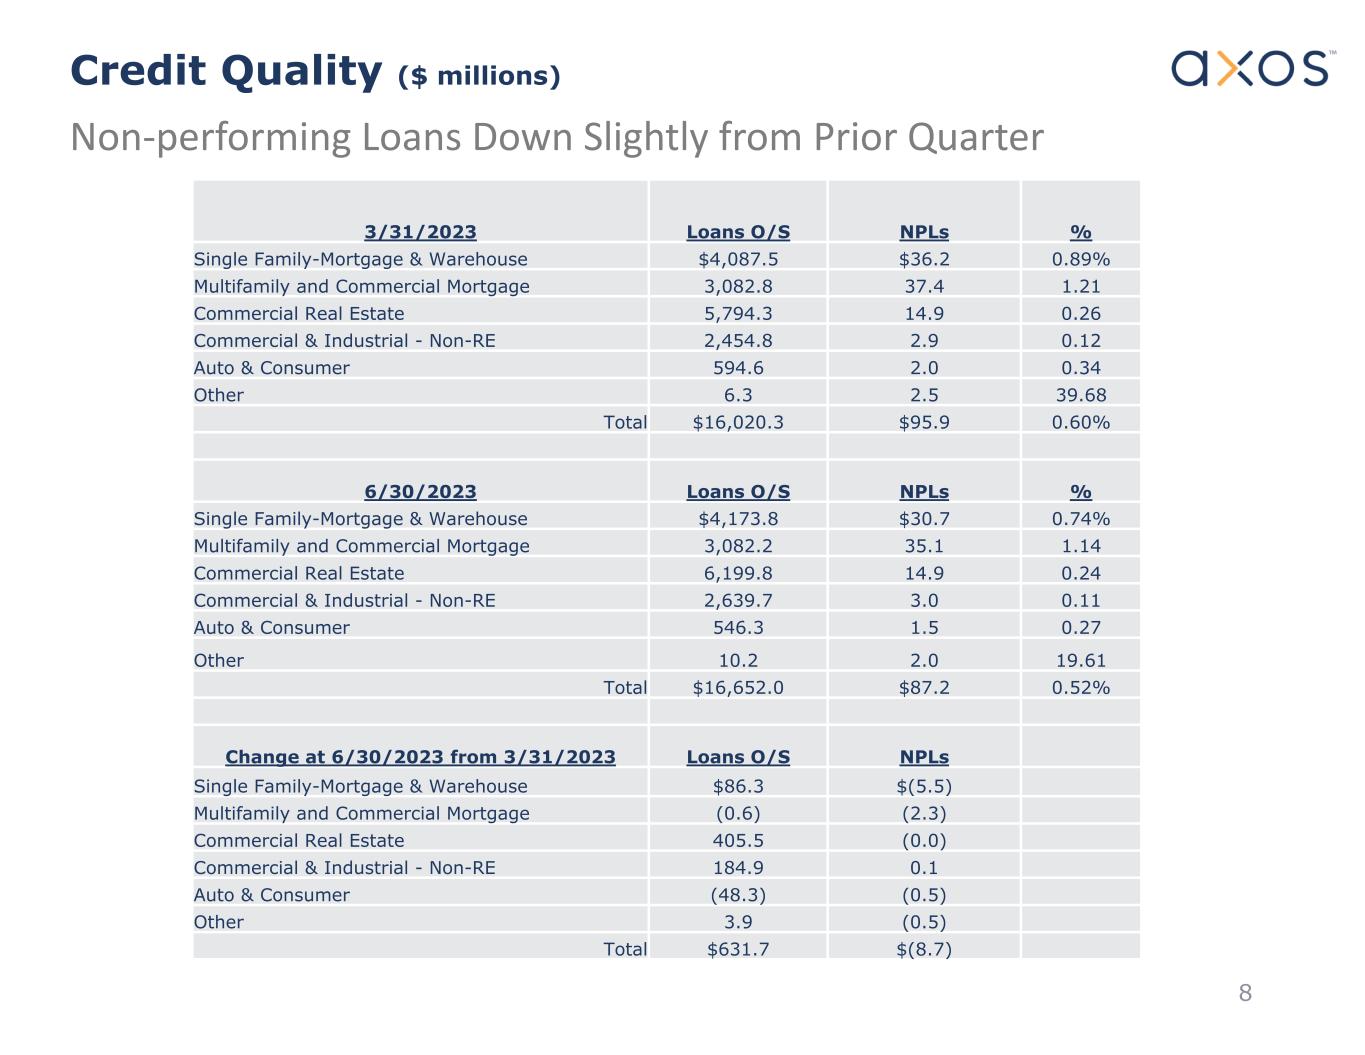
| Single Family - Mortgage & Warehouse | $ | 4,173,833 | $ | 3,988,462 | |||||||
| Multifamily and Commercial Mortgage | 3,082,225 | 2,877,680 | |||||||||
| Commercial Real Estate | 6,199,818 | 4,781,044 | |||||||||
| Commercial & Industrial - Non-RE | 2,639,650 | 2,028,128 | |||||||||
| Auto & Consumer | 546,264 | 567,228 | |||||||||
| Other | 10,236 | 11,134 | |||||||||
| Total gross loans | 16,652,026 | 14,253,676 | |||||||||
| Allowance for credit losses - loans | (166,680) | (148,617) | |||||||||
| Unaccreted premiums (discounts) and loan fees | (28,618) | (13,998) | |||||||||
| Total net loans | $ | 16,456,728 | $ | 14,091,061 | |||||||
| June 30, 2023 | |||||||||||||||||||||||||||||
| Trading | Available-for-sale | ||||||||||||||||||||||||||||
| (Unaudited) (Dollars in thousands) |
Fair Value |
Amortized Cost |
Unrealized Gains |
Unrealized Losses |
Fair Value |
||||||||||||||||||||||||
| Mortgage-backed securities (MBS): | |||||||||||||||||||||||||||||
U.S agencies1 |
$ | — | $ | 27,024 | $ | — | $ | (3,077) | $ | 23,947 | |||||||||||||||||||
Non-agency2 |
— | 210,271 | 711 | (5,977) | 205,005 | ||||||||||||||||||||||||
| Total mortgage-backed securities | 237,295 | 711 | (9,054) | 228,952 | |||||||||||||||||||||||||
| Non-MBS: | |||||||||||||||||||||||||||||
| Municipal | 758 | 3,656 | — | (258) | 3,398 | ||||||||||||||||||||||||
| Asset-backed securities and structured notes | — | — | — | — | — | ||||||||||||||||||||||||
| Total Non-MBS | 758 | 3,656 | — | (258) | 3,398 | ||||||||||||||||||||||||
| Total debt securities | $ | 758 | $ | 240,951 | $ | 711 | $ | (9,312) | $ | 232,350 | |||||||||||||||||||
| June 30, 2022 | |||||||||||||||||||||||||||||
| Trading | Available-for-sale | ||||||||||||||||||||||||||||
| (Unaudited) (Dollars in thousands) |
Fair Value |
Amortized Cost |
Unrealized Gains |
Unrealized Losses |
Fair Value |
||||||||||||||||||||||||
| Mortgage-backed securities (MBS): | |||||||||||||||||||||||||||||
U.S agencies1 |
$ | — | $ | 27,722 | $ | 9 | $ | (2,406) | $ | 25,325 | |||||||||||||||||||
Non-agency2 |
— | 187,616 | 1,832 | (2,634) | 186,814 | ||||||||||||||||||||||||
| Total mortgage-backed securities | — | 215,338 | 1,841 | (5,040) | 212,139 | ||||||||||||||||||||||||
| Non-MBS: | |||||||||||||||||||||||||||||
| Municipal | 1,758 | 3,529 | — | (281) | 3,248 | ||||||||||||||||||||||||
| Asset-backed securities and structured notes | — | 47,000 | 131 | — | 47,131 | ||||||||||||||||||||||||
| Total Non-MBS | 1,758 | 50,529 | 131 | (281) | 50,379 | ||||||||||||||||||||||||
| Total debt securities | $ | 1,758 | $ | 265,867 | $ | 1,972 | $ | (5,321) | $ | 262,518 | |||||||||||||||||||
| (Unaudited) | June 30, 2023 | June 30, 2022 | |||||||||||||||||||||
| (Dollars in thousands) | Amount | Rate1 |
Amount | Rate1 |
|||||||||||||||||||
| Non-interest bearing | $ | 2,898,150 | — | % | $ | 5,033,970 | — | % | |||||||||||||||
| Interest bearing: | |||||||||||||||||||||||
| Demand | 3,334,615 | 2.43 | % | 3,611,889 | 0.61 | % | |||||||||||||||||
| Savings | 9,575,781 | 4.20 | % | 4,245,555 | 0.95 | % | |||||||||||||||||
| Total interest-bearing demand and savings | 12,910,396 | 3.74 | % | 7,857,444 | 0.79 | % | |||||||||||||||||
| Time deposits: | |||||||||||||||||||||||
| $250 and under | 932,436 | 3.72 | % | 651,392 | 1.22 | % | |||||||||||||||||
| Greater than $250 | 382,126 | 4.36 | % | 403,616 | 1.41 | % | |||||||||||||||||
| Total time deposits | 1,314,562 | 3.91 | % | 1,055,008 | 1.25 | % | |||||||||||||||||
Total interest bearing2 |
14,224,958 | 3.76 | % | 8,912,452 | 0.85 | % | |||||||||||||||||
| Total deposits | $ | 17,123,108 | 3.12 | % | $ | 13,946,422 | 0.54 | % | |||||||||||||||
| At June 30, | |||||||||||
| 2023 | 2022 | ||||||||||
| Non-interest-bearing | 45,640 | 42,372 | |||||||||
| Interest-bearing checking and savings accounts | 427,299 | 344,593 | |||||||||
| Time deposits | 6,340 | 8,734 | |||||||||
| Total number of deposit accounts | 479,279 | 395,699 | |||||||||
| For the Three Months Ended | |||||||||||||||||||||||||||||||||||
| June 30, | |||||||||||||||||||||||||||||||||||
| 2023 | 2022 | ||||||||||||||||||||||||||||||||||
| (Unaudited) (Dollars in thousands) |
Average Balance1 |
Interest Income / Expense |
Average Yields Earned / Rates Paid2 |
Average Balance1 |
Interest Income / Expense |
Average Yields Earned / Rates Paid2 |
|||||||||||||||||||||||||||||
| Assets: | |||||||||||||||||||||||||||||||||||
Loans3,4 |
$ | 16,242,438 | $ | 305,011 | 7.51 | % | $ | 13,704,420 | $ | 174,110 | 5.08 | % | |||||||||||||||||||||||
| Interest-earning deposits in other financial institutions | 2,601,097 | 32,492 | 5.00 | % | 1,239,655 | 2,597 | 0.84 | % | |||||||||||||||||||||||||||
Mortgage-backed and other investment securities4 |
254,133 | 3,815 | 6.00 | % | 247,655 | 2,648 | 4.28 | % | |||||||||||||||||||||||||||
| Securities borrowed and margin lending | 355,687 | 4,815 | 5.41 | % | 592,234 | 4,462 | 3.01 | % | |||||||||||||||||||||||||||
| Stock of the regulatory agencies | 17,250 | 297 | 6.89 | % | 24,852 | 344 | 5.54 | % | |||||||||||||||||||||||||||
| Total interest-earning assets | 19,470,605 | 346,430 | 7.12 | % | 15,808,816 | 184,161 | 4.66 | % | |||||||||||||||||||||||||||
| Non-interest-earning assets | 715,554 | 776,659 | |||||||||||||||||||||||||||||||||
| Total assets | $ | 20,186,159 | $ | 16,585,475 | |||||||||||||||||||||||||||||||
| Liabilities and Stockholders’ Equity: | |||||||||||||||||||||||||||||||||||
| Interest-bearing demand and savings | $ | 12,507,836 | $ | 123,146 | 3.94 | % | $ | 7,007,335 | $ | 8,379 | 0.48 | % | |||||||||||||||||||||||
| Time deposits | 1,418,347 | 14,043 | 3.96 | % | 1,012,705 | 2,800 | 1.11 | % | |||||||||||||||||||||||||||
| Securities loaned | 184,608 | 356 | 0.77 | % | 408,416 | 503 | 0.49 | % | |||||||||||||||||||||||||||
| Advances from the FHLB | 90,000 | 523 | 2.32 | % | 543,247 | 1,663 | 1.22 | % | |||||||||||||||||||||||||||
| Borrowings, subordinated notes and debentures | 357,645 | 4,608 | 5.15 | % | 448,548 | 5,406 | 4.82 | % | |||||||||||||||||||||||||||
| Total interest-bearing liabilities | 14,558,436 | 142,676 | 3.92 | % | 9,420,251 | 18,751 | 0.80 | % | |||||||||||||||||||||||||||
| Non-interest-bearing demand deposits | 3,117,796 | 4,695,748 | |||||||||||||||||||||||||||||||||
| Other non-interest-bearing liabilities | 631,415 | 829,995 | |||||||||||||||||||||||||||||||||
| Stockholders’ equity | 1,878,512 | 1,639,481 | |||||||||||||||||||||||||||||||||
| Total liabilities and stockholders’ equity | $ | 20,186,159 | $ | 16,585,475 | |||||||||||||||||||||||||||||||
| Net interest income | $ | 203,754 | $ | 165,410 | |||||||||||||||||||||||||||||||
Interest rate spread6 |
3.20 | % | 3.86 | % | |||||||||||||||||||||||||||||||
Net interest margin7 |
4.19 | % | 4.19 | % | |||||||||||||||||||||||||||||||
| For the Fiscal Years Ended June 30, | |||||||||||||||||||||||||||||||||||||||||||||||||||||
| 2023 | 2022 | 2021 | |||||||||||||||||||||||||||||||||||||||||||||||||||
| (Unaudited) (Dollars in thousands) |
Average Balance1 |
Interest Income / Expense |
Average Yields Earned / Rates Paid |
Average Balance1 |
Interest Income / Expense |
Average Yields Earned / Rates Paid |
Average Balance1 |
Interest Income / Expense |
Average Yields Earned / Rates Paid |
||||||||||||||||||||||||||||||||||||||||||||
| Assets: | |||||||||||||||||||||||||||||||||||||||||||||||||||||
Loans2,3 |
$ | 15,571,290 | $ | 1,048,874 | 6.74 | % | $ | 12,576,873 | $ | 626,628 | 4.98 | % | $ | 11,332,020 | $ | 584,410 | 5.16 | % | |||||||||||||||||||||||||||||||||||
| Interest-earning deposits in other financial institutions | 1,761,902 | 73,467 | 4.17 | % | 1,233,983 | 4,501 | 0.36 | % | 1,600,811 | 2,185 | 0.14 | % | |||||||||||||||||||||||||||||||||||||||||
Mortgage-backed and other investment securities3 |
259,473 | 14,669 | 5.65 | % | 176,951 | 6,952 | 3.93 | % | 192,420 | 9,560 | 4.97 | % | |||||||||||||||||||||||||||||||||||||||||
Securities borrowed and margin lending4 |
388,386 | 18,657 | 4.80 | % | 687,363 | 20,512 | 2.98 | % | 613,735 | 20,466 | 3.33 | % | |||||||||||||||||||||||||||||||||||||||||
| Stock of the regulatory agencies | 20,936 | 1,471 | 7.03 | % | 21,844 | 1,135 | 5.20 | % | 20,588 | 1,242 | 6.03 | % | |||||||||||||||||||||||||||||||||||||||||
| Total interest-earning assets | 18,001,987 | 1,157,138 | 6.43 | % | 14,697,014 | 659,728 | 4.49 | % | 13,759,574 | 617,863 | 4.49 | % | |||||||||||||||||||||||||||||||||||||||||
| Non-interest-earning assets | 735,783 | 658,494 | 394,085 | ||||||||||||||||||||||||||||||||||||||||||||||||||
| Total assets | $ | 18,737,770 | $ | 15,355,508 | $ | 14,153,659 | |||||||||||||||||||||||||||||||||||||||||||||||
| Liabilities and Stockholders’ Equity: | |||||||||||||||||||||||||||||||||||||||||||||||||||||
| Interest-bearing demand and savings | $ | 10,211,737 | $ | 305,655 | 2.99 | % | $ | 6,773,321 | $ | 20,053 | 0.30 | % | $ | 7,204,698 | $ | 29,031 | 0.40 | % | |||||||||||||||||||||||||||||||||||
| Time deposits | 1,225,537 | 33,826 | 2.76 | % | 1,226,774 | 13,567 | 1.11 | % | 1,825,795 | 31,498 | 1.73 | % | |||||||||||||||||||||||||||||||||||||||||
| Securities loaned | 303,932 | 3,673 | 1.21 | % | 469,051 | 1,124 | 0.24 | % | 412,385 | 1,496 | 0.36 | % | |||||||||||||||||||||||||||||||||||||||||
| Advances from the FHLB | 423,612 | 12,644 | 2.98 | % | 349,796 | 4,625 | 1.32 | % | 211,077 | 4,672 | 2.21 | % | |||||||||||||||||||||||||||||||||||||||||
| Borrowings, subordinated notes and debentures | 362,733 | 18,219 | 5.02 | % | 302,454 | 13,201 | 4.36 | % | 340,699 | 12,424 | 3.65 | % | |||||||||||||||||||||||||||||||||||||||||
| Total interest-bearing liabilities | 12,527,551 | 374,017 | 2.99 | % | 9,121,396 | 52,570 | 0.58 | % | 9,994,654 | 79,121 | 0.79 | % | |||||||||||||||||||||||||||||||||||||||||
| Non-interest-bearing demand deposits | 3,730,524 | 3,927,195 | 2,182,009 | ||||||||||||||||||||||||||||||||||||||||||||||||||
| Other non-interest-bearing liabilities | 695,617 | 764,542 | 671,581 | ||||||||||||||||||||||||||||||||||||||||||||||||||
| Stockholders’ equity | 1,784,078 | 1,542,375 | 1,305,415 | ||||||||||||||||||||||||||||||||||||||||||||||||||
| Total liabilities and stockholders’ equity | $ | 18,737,770 | $ | 15,355,508 | $ | 14,153,659 | |||||||||||||||||||||||||||||||||||||||||||||||
| Net interest income | $ | 783,121 | $ | 607,158 | $ | 538,742 | |||||||||||||||||||||||||||||||||||||||||||||||
Interest rate spread5 |
3.44 | % | 3.91 | % | 3.70 | % | |||||||||||||||||||||||||||||||||||||||||||||||
Net interest margin6 |
4.35 | % | 4.13 | % | 3.92 | % | |||||||||||||||||||||||||||||||||||||||||||||||
| For the Three Months Ended | |||||||||||||||||||||||||||||||||||
| June 30, | |||||||||||||||||||||||||||||||||||
| 2023 | 2022 | ||||||||||||||||||||||||||||||||||
| (Dollars in thousands) |
Average
Balance1
|
Interest Income/ Expense |
Average Yields
Earned/Rates
Paid2
|
Average
Balance1
|
Interest Income/ Expense |
Average Yields
Earned/Rates
Paid2
|
|||||||||||||||||||||||||||||
| Assets: | |||||||||||||||||||||||||||||||||||
Loans3, 4 |
$ | 16,220,701 | $ | 304,676 | 7.51 | % | $ | 13,672,947 | $ | 173,334 | 5.07 | % | |||||||||||||||||||||||
| Interest-earning deposits in other financial institutions | 2,438,379 | 30,693 | 5.03 | % | 929,695 | 1,993 | 0.86 | % | |||||||||||||||||||||||||||
Mortgage-backed and other investment securities4 |
260,538 | 3,850 | 5.91 | % | 265,080 | 2,745 | 4.14 | % | |||||||||||||||||||||||||||
| Stock of the regulatory agencies | 17,250 | 295 | 6.84 | % | 21,734 | 344 | 6.33 | % | |||||||||||||||||||||||||||
| Total interest-earning assets | 18,936,868 | 339,514 | 7.17 | % | 14,889,456 | 178,416 | 4.79 | % | |||||||||||||||||||||||||||
| Non-interest-earning assets | 371,710 | 298,721 | |||||||||||||||||||||||||||||||||
| Total assets | $ | 19,308,578 | $ | 15,188,177 | |||||||||||||||||||||||||||||||
| Liabilities and Stockholders’ Equity: | |||||||||||||||||||||||||||||||||||
| Interest-bearing demand and savings | $ | 12,570,893 | $ | 123,178 | 3.92 | % | $ | 7,148,061 | $ | 8,449 | 0.47 | % | |||||||||||||||||||||||
| Time deposits | 1,418,347 | 14,043 | 3.96 | % | 1,012,705 | 2,800 | 1.11 | % | |||||||||||||||||||||||||||
| Advances from the FHLB | 90,000 | 523 | 2.32 | % | 543,247 | 1,663 | 1.22 | % | |||||||||||||||||||||||||||
| Borrowings, subordinated notes and debentures |
34 | — | — | % | 33 | — | — | % | |||||||||||||||||||||||||||
| Total interest-bearing liabilities | 14,079,274 | 137,744 | 3.91 | % | 8,704,046 | 12,912 | 0.59 | % | |||||||||||||||||||||||||||
| Non-interest-bearing demand deposits | 3,177,475 | 4,770,915 | |||||||||||||||||||||||||||||||||
| Other non-interest-bearing liabilities | 192,007 | 139,753 | |||||||||||||||||||||||||||||||||
| Stockholders’ equity | 1,859,822 | 1,573,463 | |||||||||||||||||||||||||||||||||
| Total liabilities and stockholders’ equity | $ | 19,308,578 | $ | 15,188,177 | |||||||||||||||||||||||||||||||
| Net interest income | $ | 201,770 | $ | 165,504 | |||||||||||||||||||||||||||||||
Interest rate spread5 |
3.26 | % | 4.20 | % | |||||||||||||||||||||||||||||||
Net interest margin6 |
4.26 | % | 4.45 | % | |||||||||||||||||||||||||||||||
| (Dollars in thousands) | June 30, 2023 | June 30, 2022 | |||||||||
| FDIC insured deposit program balances at banks | $ | 1,627,053 | $ | 3,452,358 | |||||||
| Cash reserves for the benefit of customers | $ | 149,059 | $ | 372,112 | |||||||
| Securities lending: | |||||||||||
| Interest-earning assets – stock borrowed | $ | 134,339 | $ | 338,980 | |||||||
| Interest-bearing liabilities – stock loaned | $ | 159,832 | $ | 474,400 | |||||||
