株探米国株
日本語 英語
エドガーで原本を確認する
0001289419false00012894192024-07-242024-07-24

UNITED STATES
SECURITIES AND EXCHANGE COMMISSION
Washington, D.C. 20549
______________________________
FORM 8-K
______________________________
CURRENT REPORT
Pursuant to Section 13 or 15(d) of
the Securities Exchange Act of 1934

Date of Report (Date of earliest event reported): July 24, 2024


MORNINGSTAR, INC.
(Exact name of registrant as specified in its charter)

Illinois
(State or other jurisdiction
of incorporation)
000-51280
(Commission
File Number)

36-3297908
(I.R.S. Employer
Identification No.)
22 West Washington Street
Chicago, Illinois
(Address of principal executive offices)

60602
(Zip Code)
(312) 696-6000
(Registrant’s telephone number, including area code)

N/A
(Former name or former address, if changed since last report)
__________________________________

Check the appropriate box below if the Form 8-K filing is intended to simultaneously satisfy the filing obligation of the registrant under any of the following provisions:

    o    Written communications pursuant to Rule 425 under the Securities Act (17 CFR 230.425)

    o    Soliciting material pursuant to Rule 14a-12 under the Exchange Act (17 CFR 240.14a-12)

    o    Pre-commencement communications pursuant to Rule 14d-2(b) under the Exchange Act (17 CFR 240.14d-2(b))

    o    Pre-commencement communications pursuant to Rule 13e-4(c) under the Exchange Act (17 CFR 240.13e-4(c))

Indicate by check mark whether the registrant is an emerging growth company as defined in Rule 405 of the Securities Act of 1933 (§230.405 of this chapter) or Rule 12b-2 of the Securities Exchange Act of 1934 (§240.12b-2 of this chapter).

Emerging growth company ¨

If an emerging growth company, indicate by check mark if the registrant has elected not to use the extended transition period for complying with any new or revised financial accounting standards provided pursuant to Section 13(a) of the Exchange Act. ¨

Securities registered pursuant to Section 12(b) of the Act:
Title of Each Class
Trading Symbol
Name of Each Exchange on Which Registered
Common stock, no par value MORN The Nasdaq Stock Market LLC


Item 2.02.    Results of Operations and Financial Condition.

On July 24, 2024, Morningstar, Inc. (the "Company" or "we") issued a press release announcing its financial results for the second quarter ended June 30, 2024. A copy of the press release is attached hereto as Exhibit 99.1 and incorporated herein by reference. Additionally, on July 24, 2024, the Company published a Supplemental Presentation. A copy of the Supplemental Presentation is attached hereto as Exhibit 99.2 and incorporated herein by reference. The Press Release and Supplemental Presentation shall each be deemed furnished, not filed, for purposes of this Current Report on Form 8-K (this "Report").

Item 7.01.    Regulation FD Disclosure.

On July 24, 2024, the Company published a Shareholder Letter. The Shareholder Letter is included as Exhibit 99.3 to this Report and incorporated herein by reference. The Shareholder Letter shall be deemed furnished, not filed, for purposes of this Report.

Additionally, on July 24, 2024, the Company published updated questions and answers (“Updated Q&A”) regarding the previously announced transaction between the Company and AssetMark, Inc. (“AssetMark”), pursuant to which AssetMark will acquire all of the client advisory agreements associated with the Company’s U.S. turnkey asset management platform (the “Transaction”). A copy of the Updated Q&A is included as Exhibit 99.4 to this Report and incorporated herein by reference. The Updated Q&A shall be deemed furnished, not filed, for purposes of this Report.

The information set forth under Item 2.02, "Results of Operations and Financial Condition" is incorporated herein by reference.

Information or documents on the Company's website referred to in this Report or in the exhibits to this Report are not incorporated by reference into this Report.

Cautionary Note Regarding Forward-Looking Statements

This Report contains forward-looking statements as that term is used in the Private Securities Litigation Reform Act of 1995. These statements are based on our current expectations about future events or future financial performance. Forward-looking statements by their nature address matters that are, to different degrees, uncertain, and often contain words such as consider,” “estimate,” “forecast,” “future,” “goal,” “designed to,” “maintain,” “may,” “objective,” “ongoing,” “could,” “expect,” “intend,” “plan,” “possible,” “potential,” “anticipate,” “believe,” “predict,” “continue,” “strategy,” “strive,” “will,” “would,” "determine," "evaluate," or the negative thereof, and similar expressions. These statements involve known and unknown risks and uncertainties that may cause the events we discuss not to occur or to differ significantly from what we expect.
2


For us, these risks and uncertainties include, among others, failing to maintain and protect our brand, independence, and reputation; failure to prevent and/or mitigate cybersecurity events and the failure to protect confidential information, including personal information about individuals; compliance failures, regulatory action, or changes in laws applicable to our credit ratings operations, investment advisory, environmental, social, and governance and index businesses; failing to innovate our product and service offerings, or anticipate our clients’ changing needs; the impact of artificial intelligence and related technologies on our business, legal and regulatory exposure profile and reputation; failing to detect errors in our products or the failure of our products to perform properly due to defects, malfunctions or similar problems; failing to recruit, develop, and retain qualified employees; prolonged volatility or downturns affecting the financial sector, global financial markets, and the global economy and its effect on our revenue from asset-based fees and our credit ratings business; failing to scale our operations and increase productivity in order to implement our business plans and strategies; liability for any losses that result from errors in our automated advisory tools or errors in the use of the information and data we collect; inadequacy of our operational risk management, business continuity programs and insurance coverage in the event of a material disruptive event; failing to close, or achieve the anticipated economic benefit of a strategic transaction, including the Transaction, on a timely basis or at all; failing to efficiently integrate and leverage acquisitions and other investments, which may not realize the expected business or financial benefits, to produce the results we anticipate; failing to maintain growth across our businesses in today's fragmented geopolitical, regulatory and cultural world; liability relating to the information and data we collect, store, use, create, and distribute or the reports that we publish or are produced by our software products; the potential adverse effect of our indebtedness on our cash flows and financial and operational flexibility; challenges in accounting for tax complexities in the global jurisdictions which we operate in and their effect on our tax obligations and tax rates; and failing to protect our intellectual property rights or claims of intellectual property infringement against us. A more complete description of these risks and uncertainties, among others, can be found in our filings with the Securities and Exchange Commission (SEC), including our most recent Reports on Forms 10-K and 10-Q. If any of these risks and uncertainties materialize, our actual future results and other future events may vary significantly from what we expect. We do not undertake to update our forward-looking statements as a result of new information, future events or otherwise, except as may be required by law. You are, however, advised to review any further disclosures we make on related subjects, and about new or additional risks, uncertainties and assumptions in our filings with the SEC on Forms 10-K, 10-Q and 8-K.


Item 9.01. Financial Statements and Exhibits.
    (d)    Exhibits:
Exhibit No. Description
104
The cover page from this Current Report on Form 8-K formatted in Inline XBRL (included as Exhibit 101).
_____________________________________________________________________________________


3


SIGNATURES
Pursuant to the requirements of the Securities Exchange Act of 1934, the registrant has duly caused this report to be signed on its behalf by the undersigned hereunto duly authorized.
MORNINGSTAR, INC.
Date: July 24, 2024 By:/s/ Jason Dubinsky
Name: Jason Dubinsky
Title: Chief Financial Officer
4

EX-99.1 2 exhibit991-pressrelease_06.htm EX-99.1 Document
image_0.jpg
image_1.jpg        News Release
22 West Washington Street         Telephone: +1 312 696-6000
Chicago                Facsimile: +1 312 696-6009
Illinois 60602                


FOR IMMEDIATE RELEASE
Morningstar, Inc. Reports Second-Quarter 2024 Financial Results
CHICAGO, July 24, 2024 - Morningstar, Inc. (Nasdaq: MORN), a leading provider of independent investment insights, posted double-digit second-quarter revenue growth while expanding operating margins.
“Led by Morningstar Credit's strength across regions and asset classes, we finished the first half of 2024 on a high note,” said Kunal Kapoor, Morningstar's chief executive officer. “We remain focused on durable growth in adjusted operating income. Our teams are delivering product enhancements to customers, including the addition of collateralized loan obligation data to PitchBook, and the integration of our Intelligence Engine into Advisor Workstation, which will allow advisors to further automate client workflows."
The Company's quarterly shareholder letter provides more context on its quarterly results and business and can be found at shareholders.morningstar.com.
Second-Quarter 2024 Financial Highlights
•Reported revenue increased 13.3% to $571.9 million compared to the prior-year period; organic revenue grew 13.6%.
•Reported operating income increased 160.2% to $108.5 million; adjusted operating income increased 87.9%.
•Diluted net income per share increased 90.5% to $1.60; adjusted diluted net income per share increased 54.6% to $2.01.
•Cash provided by operating activities increased to $152.7 million from $24.5 million in the prior-year period. Free cash flow increased to $120.8 million compared to negative $5.8 million in the prior-year period. Cash flows in the prior-year period were negatively impacted by certain items totaling $63.1 million. Excluding these items, cash provided by operating activities and free cash flow would have increased by 74.3% and 110.8%, respectively.


Year-To-Date Financial Highlights
•Reported revenue increased 13.2% to $1.1 billion compared to the prior-year period; organic revenue grew 13.3%.
•Reported operating income increased 203.8% to $201.1 million; adjusted operating income increased 99.0%.
•Diluted net income per share increased 361.2% to $3.09; adjusted diluted net income per share increased 101.1% to $3.74.
•Cash provided by operating activities increased 414.2% to $246.3 million. Free cash flow increased to $180.3 million compared to negative $11.9 million in the prior-year period. Cash flows in the prior-year period were negatively impacted by certain items totaling $74.5 million. Excluding these items, cash provided by operating activities and free cash flow would have increased by 101.2% and 188.0%, respectively.

Second-Quarter 2024 Results
Revenue increased 13.3% to $571.9 million on a reported basis and 13.6% on an organic basis versus the prior-year period, driven by strength across most of the business. Morningstar Credit, PitchBook, and Morningstar Data and Analytics were the biggest contributors to reported revenue growth.
Operating expense was relatively flat at $463.4 million. Excluding the impact of M&A-related expenses (related to merger, acquisition, and divestiture activity including severance and earn-outs), amortization, and costs related to the transition of the Company's China activities in the prior-year period, operating expense increased 1.4% in the quarter. Compensation and benefits and certain infrastructure-related costs including those related to SaaS-based software subscriptions, cloud computing, and data purchases increased during the quarter. This growth was mostly offset by decreases in facilities-related expenses, partially driven by the consolidation of our real estate footprint, and professional fees.
Second-quarter operating income increased 160.2% to $108.5 million. Adjusted operating income was $131.0 million, an increase of 87.9%. Second-quarter operating margin was 19.0%, compared with 8.3% in the prior-year period. Adjusted operating margin was 22.9% in the second quarter of 2024, versus 13.8% in the prior-year period.
Net income in the second quarter of 2024 was $69.1 million, or $1.60 per diluted share, compared with net income of $36.1 million, or $0.84 per diluted share in the second quarter of 2023, an increase of 90.5% on a per share basis. Adjusted diluted net income per share increased 54.6% to $2.01 in the second quarter of 2024, compared with $1.30 in the prior-year period.
Page 2 of 14


Foreign exchange losses had a negative $0.10 impact on adjusted diluted net income per share in the second quarter of 2024.
The Company's effective tax rate was 21.7% in the second quarter of 2024. The Company's prior-year period effective tax rate was not meaningful due to the low level of pretax income in the period.
Segment Highlights
Morningstar Data and Analytics
Morningstar Data and Analytics contributed $196.9 million to consolidated revenue and $10.9 million to consolidated revenue growth, with revenue increasing 5.9% in the second quarter versus the prior-year period, or 6.2% on an organic basis. Higher revenues were primarily driven by growth in Morningstar Direct and Morningstar Data. Morningstar Direct benefited from growth across geographies, with licenses increasing 0.7%. Increases in managed investment (fund) data, especially in Europe, helped drive Morningstar Data growth, partially offset by lower contributions to growth from Morningstar Essentials and equity and exchange market data.
Morningstar Data and Analytics adjusted operating income increased 9.0% to $87.3 million, and adjusted operating margin increased 1.2 percentage points to 44.3% compared to the prior-year period.
PitchBook
PitchBook contributed $151.7 million to consolidated revenue and $14.9 million to consolidated revenue growth, with revenue increasing 10.9% on a reported and organic basis. Higher revenue was primarily driven by the PitchBook platform with licensed users growing 16.6%, including the impact of legacy Leveraged Commentary & Data clients who have moved to PitchBook licenses. PitchBook platform growth drivers were consistent with recent quarters and reflected strength in PitchBook's core investor and advisor client segments, including venture capital, private equity, and investment banks. This was partially offset by continued softness in the corporate client segment, especially with smaller firms with more limited use cases.
PitchBook segment adjusted operating income increased 27.2% to $47.3 million, and adjusted operating margin increased 4.0 percentage points to 31.2%. The increase in margin was partially driven by the forfeiture of stock in the now-terminated PitchBook management bonus plan, which was a compensation vehicle designed primarily to incentivize former PitchBook CEO, John Gabbert.
Morningstar Wealth
Morningstar Wealth contributed $62.6 million to consolidated revenue and $6.8 million to consolidated revenue growth, with revenue increasing 12.2% in the second quarter versus the prior-year period, or 12.4% on an organic basis. Growth was primarily driven by Investment Management, supported by higher revenue for strategist model portfolios offered on third-party platforms and international wealth platform growth.
Page 3 of 14


Reported assets under management and advisement (AUMA) increased 11.3% to $59.1 billion compared with the prior-year period, helped by strong market performance which drove higher asset values. Positive net flows to Morningstar Managed Portfolios over the trailing 12 months primarily reflected strong net inflows outside the United States.
Morningstar Wealth adjusted operating loss was $2.2 million compared to a $12.3 million loss in the prior-year period, and adjusted operating margin was negative 3.5% compared with negative 22.0%. In conjunction with the recent announcement of the expected sale of assets from the Morningstar Wealth Turnkey Asset Management Platform to AssetMark, the Company recorded $3.3 million in severance expense in the quarter. These costs are excluded from Morningstar Wealth adjusted operating income and consolidated adjusted operating income.
Morningstar Credit
Morningstar Credit contributed $77.6 million to consolidated revenue and $23.4 million to consolidated revenue growth, with revenue increasing 43.2% in the second quarter versus the prior-year period, or 44.2% on an organic basis. Ratings-related revenue increased significantly across asset classes and geographies, compared to a relatively soft prior-year period, with particular strength in commercial mortgage-backed securities, asset-backed securities, and corporate ratings. Increases in residential mortgage-backed securities and financial institution ratings also contributed to growth.
Morningstar Credit adjusted operating income was $27.9 million compared with $5.0 million in the prior-year period, and adjusted operating margin was 36.0% compared with 9.2% in the prior-year period.
Morningstar Retirement
Morningstar Retirement contributed $33.3 million to consolidated revenue and $5.9 million to consolidated revenue growth, with revenue increasing 21.5% in the second quarter versus the prior-year period on a reported and organic basis. AUMA increased 22.2% to $257.2 billion compared with the prior-year period, reflecting market gains and significant positive net flows, supported by rapid growth in Advisor Managed Accounts.
Morningstar Retirement adjusted operating income increased 29.1% to $17.3 million, and adjusted operating margin increased 3.1 percentage points to 52.0%.
Corporate and All Other
Revenue attributable to Corporate and All Other contributed $49.8 million to consolidated revenue and $5.3 million to consolidated revenue growth, with revenue increasing 11.9% in the second quarter versus the prior-year period, driven by growth in Morningstar Indexes.
Page 4 of 14


The increase in Morningstar Indexes revenue was primarily driven by higher investable product revenue as market performance and net inflows over the trailing 12 months increased asset value linked to Morningstar Indexes by 22.3% to $207.6 billion. Morningstar Indexes licensed data sales also increased.
Morningstar Sustainalytics revenues were relatively flat compared to the prior-year period for both license- and transaction-based products. In Europe, regulatory use cases and demand from institutional clients were areas of strength. This strength was largely offset by increased cancellations in investor solutions due to vendor consolidation and softness in parts of the asset management and wealth client segments. Revenue was also negatively impacted by actions taken to streamline the corporate solutions product lineup, specifically the licensed ratings product.
The impact of Corporate and All Other on consolidated adjusted operating income was negative $46.6 million compared with negative $53.7 million in the prior-year period.
Balance Sheet and Capital Allocation
As of June 30, 2024, the Company had cash, cash equivalents, and investments totaling $439.2 million and $899.6 million of debt, compared with $389.0 million and $972.4 million, respectively, as of Dec. 31, 2023.
Cash provided by operating activities increased to $152.7 million in the second quarter of 2024, compared to $24.5 million in the prior-year period.. Free cash flow increased to $120.8 million, compared to negative $5.8 million in the prior-year period. The increases in cash provided by operating activities and free cash flow were driven by both higher cash earnings and improvements in working capital. As previously disclosed, operating cash flows were negatively impacted in the prior-year period by certain items totaling $63.1 million. Excluding these items, cash provided by operating activities and free cash flow would have increased by 74.3% and 110.8%, respectively. In addition, the Company paid $17.3 million in dividends in the quarter.
Use of Non-GAAP Financial Measures
The tables at the end of this press release include a reconciliation of the non-GAAP financial measures used by the Company to comparable GAAP measures and an explanation of why the Company uses them.
Investor Communication
Morningstar encourages all interested parties — including securities analysts, current shareholders, potential shareholders, and others — to submit questions in writing. Investors and others may send questions about Morningstar’s business to investors@morningstar.com. Morningstar will make written responses to selected inquiries available to all investors at the same time in Form 8-Ks furnished to the SEC, periodically.
Page 5 of 14


About Morningstar, Inc.
Morningstar, Inc. is a leading provider of independent investment insights in North America, Europe, Australia, and Asia. The Company offers an extensive line of products and solutions that serve a wide range of market participants, including individual and institutional investors in public and private capital markets, financial advisors and wealth managers, asset managers, retirement plan providers and sponsors, and issuers of fixed-income securities. Morningstar provides data and research insights on a wide range of investment offerings, including managed investment products, publicly listed companies, private capital markets, debt securities, and real-time global market data. Morningstar also offers investment management services through its investment advisory subsidiaries, with approximately $316 billion in AUMA as of June 30, 2024. The Company operates through wholly-owned subsidiaries in 32 countries. For more information, visit www.morningstar.com/company. Follow Morningstar on X (formerly known as Twitter) @MorningstarInc.
Caution Concerning Forward-Looking Statements
This press release contains forward-looking statements as that term is used in the Private Securities Litigation Reform Act of 1995. These statements are based on our current expectations about future events or future financial performance. Forward-looking statements by their nature address matters that are, to different degrees, uncertain, and often contain words such as “consider,” “future,” “maintain,” “may,” “expect,” “potential,” “anticipate,” “believe,” “continue,” “will,” or the negative thereof, and similar expressions. These statements involve known and unknown risks and uncertainties that may cause the events we discuss not to occur or to differ significantly from what we expect. For us, these risks and uncertainties include, among others, failing to maintain and protect our brand, independence, and reputation; failure to prevent and/or mitigate cybersecurity events and the failure to protect confidential information, including personal information about individuals; compliance failures, regulatory action, or changes in laws applicable to our credit ratings operations, investment advisory, environmental, social, and governance, and index businesses; failing to innovate our product and service offerings, or anticipate our clients’ changing needs; the impact of artificial intelligence and related technologies on our business, legal, and regulatory exposure profile and reputation; failing to detect errors in our products or the failure of our products to perform properly due to defects, malfunctions, or similar problems; failing to recruit, develop, and retain qualified employees; prolonged volatility or downturns affecting the financial sector, global financial markets, and the global economy and its effect on our revenue from asset-based fees and our credit ratings business; failing to scale our operations and increase productivity in order to implement our business plans and strategies; liability for any losses that result from errors in our automated advisory tools or errors in the use of the information and data we collect; inadequacy of our operational risk management, business continuity programs and insurance coverage in the event of a material disruptive event; failing to close, or achieve the anticipated economic or other benefits of, a strategic transaction on a timely basis or at all; failing to efficiently integrate and leverage acquisitions and other investments, which may not realize the expected business or financial benefits, to produce the results we anticipate; failing to maintain growth across our businesses in today's fragmented geopolitical, regulatory, and cultural world; liability relating to the information and data we collect, store, use, create, and distribute or the reports that we publish or are produced by our software products; the potential adverse effect of our indebtedness on our cash flows and financial and operational flexibility; challenges in accounting for tax complexities in the global jurisdictions which we operate in and their effect on our tax obligations and tax rates; and failing to protect our intellectual property rights or claims of intellectual property infringement against us. A more complete description of these risks and uncertainties, among others, can be found in our filings with the Securities and Exchange Commission (SEC), including our most recent Reports on Forms 10-K and 10-Q. If any of these risks and uncertainties materialize, our actual future results and other future events may vary significantly from what we expect. We do not undertake to update our forward-looking statements as a result of new information, future events or otherwise, except as may be required by law.
Page 6 of 14


You are, however, advised to review any further disclosures we make on related subjects, and about new or additional risks, uncertainties and assumptions in our filings with the SEC on Forms 10-K, 10-Q and 8-K.
# # #
Media Relations Contact:
Stephanie Lerdall, +1 312-244-7805, stephanie.lerdall@morningstar.com
Investor Relations Contact:
Sarah Bush, +1 312-384-3754, sarah.bush@morningstar.com
©2024 Morningstar, Inc. All Rights Reserved.
MORN-E
Page 7 of 14


Morningstar, Inc. and Subsidiaries
Unaudited Condensed Consolidated Statements of Income
Three months ended June 30, Six months ended June 30,
(in millions, except per share amounts) 2024 2023 Change 2024 2023 Change
Revenue $ 571.9  $ 504.7  13.3  % $ 1,114.7  $ 984.4  13.2  %
Operating expense:
Cost of revenue 222.7  216.4  2.9  % 440.8  435.2  1.3  %
Sales and marketing 111.3  109.5  1.6  % 215.9  217.1  (0.6) %
General and administrative 80.3  90.1  (10.9) % 160.6  174.1  (7.8) %
Depreciation and amortization 49.1  47.0  4.5  % 96.3  91.8  4.9  %
Total operating expense 463.4  463.0  0.1  % 913.6  918.2  (0.5) %
Operating income 108.5  41.7  160.2  % 201.1  66.2  203.8  %
Operating margin 19.0  % 8.3  % 10.7 pp 18.0  % 6.7  % 11.3 pp
Non-operating expense, net:
Interest expense, net
(10.3) (14.1) (27.0) % (21.8) (27.4) (20.4) %
Expense from equity method transaction, net
—  —  —  % —  (11.8) NMF
Other income (expense), net
(8.7) 4.1  NMF (2.8) 6.8  NMF
Non-operating expense, net
(19.0) (10.0) 90.0  % (24.6) (32.4) (24.1) %
Income before income taxes and equity in investments of unconsolidated entities
89.5  31.7  182.3  % 176.5  33.8  422.2  %
Equity in investments of unconsolidated entities
(1.2) (1.8) (33.3) % (2.7) (3.1) (12.9) %
Income tax expense (benefit)
19.2  (6.2) NMF 40.5  2.2  NMF
Consolidated net income
$ 69.1  $ 36.1  91.4  % $ 133.3  $ 28.5  367.7  %
Net income per share:
Basic $ 1.61  $ 0.85  89.4  % $ 3.11  $ 0.67  364.2  %
Diluted $ 1.60  $ 0.84  90.5  % $ 3.09  $ 0.67  361.2  %
Weighted average shares outstanding:
Basic 42.8  42.6  42.8  42.6 
Diluted 43.1  42.8  43.1  42.8 
_________________________________________________________________
NMF - Not meaningful, pp - percentage points
Page 8 of 14


Morningstar, Inc. and Subsidiaries
Unaudited Condensed Consolidated Balance Sheets
(in millions)   As of June 30, 2024 As of December 31, 2023
     
Assets    
Current assets:    
Cash and cash equivalents   $ 391.2  $ 337.9 
Investments   48.0  51.1 
Accounts receivable, net   336.4  343.9 
Income tax receivable, net
  —  0.6 
Other current assets   100.2  82.2 
Total current assets   875.8  815.7 
   
Goodwill 1,569.5  1,578.8 
Intangible assets, net 443.1  484.4 
Property, equipment, and capitalized software, net   210.3  207.7 
Operating lease assets 148.1  163.9 
Investments in unconsolidated entities   97.3  100.2 
Deferred tax assets, net
24.2  14.6 
Other assets   35.2  38.1 
Total assets   $ 3,403.5  $ 3,403.4 
   
Liabilities and equity  
Current liabilities:  
Deferred revenue $ 548.2  $ 517.7 
Accrued compensation 166.2  214.4 
Accounts payable and accrued liabilities   77.1  78.4 
Operating lease liabilities 32.0  36.4 
Current portion of long-term debt —  32.1 
Other current liabilities   13.9  1.8 
Total current liabilities   837.4  880.8 
   
Operating lease liabilities
136.6  151.4 
Accrued compensation   23.4  23.7 
Deferred tax liabilities, net
  30.4  35.6 
Long-term debt   899.6  940.3 
Other long-term liabilities   42.4  43.8 
Total liabilities   1,969.8  2,075.6 
Total equity   1,433.7  1,327.8 
Total liabilities and equity   $ 3,403.5  $ 3,403.4 

Page 9 of 14


Morningstar, Inc. and Subsidiaries
Unaudited Condensed Consolidated Statements of Cash Flows
    Three months ended June 30,   Six months ended June 30,
(in millions)   2024 2023   2024 2023
Operating activities        
Consolidated net income
  $ 69.1  $ 36.1  $ 133.3  $ 28.5 
Adjustments to reconcile consolidated net income to net cash flows from operating activities
  73.7  52.4  116.7  61.4 
Changes in operating assets and liabilities, net   9.9  (64.0) (3.7) (42.0)
Cash provided by operating activities   152.7  24.5  246.3  47.9 
Investing activities  
Capital expenditures   (31.9) (30.3) (66.0) (59.8)
Purchases of investments in unconsolidated entities   (0.8) (0.8) (3.6) (0.9)
Other, net   (0.1) 4.0  10.1  32.9 
Cash used for investing activities
  (32.8) (27.1) (59.5) (27.8)
Financing activities  
Common shares repurchased   —  (1.4) —  (1.4)
Dividends paid   (17.3) (16.0) (34.6) (31.9)
Repayments of debt
  (50.0) (113.2) (163.1) (186.3)
Proceeds from debt
—  135.0  90.0  230.0 
Payment of acquisition-related earn-outs
—  —  —  (45.5)
Other, net   (14.3) (10.5) (17.4) (19.8)
Cash used for financing activities
  (81.6) (6.1) (125.1) (54.9)
Effect of exchange rate changes on cash and cash equivalents   (0.8) (0.2) (8.4) 1.5 
Net increase (decrease) in cash and cash equivalents
  37.5  (8.9) 53.3  (33.3)
Cash and cash equivalents-beginning of period   353.7  352.2  337.9  376.6 
Cash and cash equivalents-end of period   $ 391.2  $ 343.3  $ 391.2  $ 343.3 

Page 10 of 14


Morningstar, Inc. and Subsidiaries
Supplemental Data (Unaudited)
Three months ended June 30, Six months ended June 30,
(in millions) 2024 2023 Change
Organic (1)
2024 2023 Change
Organic (1)
Morningstar Data and Analytics
Revenue
$ 196.9  $ 186.0  5.9  % 6.2  % $ 393.6  $ 365.8  7.6  % 7.5  %
Adjusted Operating Income
87.3  80.1  9.0  % 178.5  161.0  10.9  %
Adjusted Operating Margin
44.3  % 43.1  % 1.2 pp 45.4  % 44.0  % 1.4 pp
PitchBook
Revenue
$ 151.7  $ 136.8  10.9  % 10.9  % $ 299.3  $ 267.9  11.7  % 11.7  %
Adjusted Operating Income
47.3  37.2  27.2  % 87.3  67.6  29.1  %
Adjusted Operating Margin
31.2  % 27.2  % 4.0 pp 29.2  % 25.2  % 4.0 pp
Morningstar Wealth
Revenue
$ 62.6  $ 55.8  12.2  % 12.4  % $ 121.6  $ 110.7  9.8  % 10.1  %
Adjusted Operating Income (Loss) (2.2) (12.3) (82.1) % (7.8) (26.9) (71.0) %
Adjusted Operating Margin
(3.5) % (22.0) % 18.5 pp (6.4) % (24.3) % 17.9 pp
Morningstar Credit
Revenue
$ 77.6  $ 54.2  43.2  % 44.2  % $ 137.9  $ 101.0  36.5  % 36.6  %
Adjusted Operating Income 27.9  5.0  458.0  % 40.2  1.0  NMF
Adjusted Operating Margin
36.0  % 9.2  % 26.8 pp 29.2  % 1.0  % 28.2 pp
Morningstar Retirement
Revenue
$ 33.3  $ 27.4  21.5  % 21.5  % $ 61.7  $ 52.6  17.3  % 17.3  %
Adjusted Operating Income
17.3  13.4  29.1  % 31.5  24.6  28.0  %
Adjusted Operating Margin
52.0  % 48.9  % 3.1 pp 51.1  % 46.8  % 4.3 pp
Consolidated Revenue
Total Reportable Segments $ 522.1  $ 460.2  13.5  % $ 1,014.1  $ 898.0  12.9  %
Corporate and All Other (2)
49.8  44.5  11.9  % 100.6  86.4  16.4  %
Total Revenue $ 571.9  $ 504.7  13.3  % 13.6  % $ 1,114.7  $ 984.4  13.2  % 13.3  %
Consolidated Adjusted Operating Income
Total Reportable Segments $ 177.6  $ 123.4  43.9  % $ 329.7  $ 227.3  45.1  %
Less: Corporate and All Other (3)
(46.6) (53.7) (13.2) % (87.9) (105.8) (16.9) %
Adjusted Operating Income $ 131.0  $ 69.7  87.9  % $ 241.8  $ 121.5  99.0  %
Adjusted Operating Margin
22.9  % 13.8  % 9.1 pp 21.7  % 12.3  % 9.4 pp
____________________________________________________________________________________________
(1) Organic revenue is a non-GAAP measure that excludes acquisitions, divestitures, the impacts of the adoption of new accounting standards or revisions to accounting practices, and the effect of foreign currency translations. In addition, the calculation of organic revenue growth by product revenue type compares the three and six months ended June 30, 2024 revenue to the prior periods on the basis of the updated classifications.

(2) Corporate and All Other provides a reconciliation between revenue from our Total Reportable Segments and consolidated revenue amounts. Corporate and All Other includes Morningstar Sustainalytics and Morningstar Indexes as sources of revenues. Revenue from Morningstar Sustainalytics was $29.2 million and $29.4 million for the three months ended June 30, 2024 and 2023, respectively and $60.0 million and $56.8 million for the six months ended June 30, 2024 and 2023. Revenue from Morningstar Indexes was $20.6 million and $15.1 million for the three months ended June 30, 2024 and 2023, respectively and $40.6 million and $29.6 million for the six months ended June 30, 2024 and 2023.
(3) Corporate and All Other includes unallocated corporate expenses as well as adjusted operating income (loss) from Morningstar Sustainalytics and Morningstar Indexes. During the second quarter of 2024 and 2023, unallocated corporate expenses were $46.1 million and $38.9 million, respectively. During the first six months of 2024 and 2023, unallocated corporate expenses were $87.0 million and $75.0 million, respectively. Unallocated corporate expenses include finance, human resources, legal, marketing, and other management-related costs that are not considered when segment performance is evaluated.


Page 11 of 14


Morningstar, Inc. and Subsidiaries
Supplemental Data (Unaudited)
As of June 30,
AUMA (approximate) ($bil)
2024 2023 Change
Morningstar Retirement
Managed Accounts $ 149.9  $ 118.1  26.9  %
Fiduciary Services 62.6  55.4  13.0  %
Custom Models/CIT 44.7  36.9  21.1  %
Morningstar Retirement (total)
$ 257.2  $ 210.4  22.2  %
Investment Management
Morningstar Managed Portfolios $ 41.8  $ 35.1  19.1  %
Institutional Asset Management 7.3  10.2  (28.4) %
Asset Allocation Services 10.0  7.8  28.2  %
Investment Management (total) $ 59.1  $ 53.1  11.3  %
Asset value linked to Morningstar Indexes ($bil) $ 207.6  $ 169.8  22.3  %
Three months ended June 30, Six months ended June 30,
2024 2023 Change 2024 2023 Change
Average AUMA ($bil)
$ 304.9  $ 258.0  18.2  % $ 298.6  $ 253.9  17.6  %


Page 12 of 14


Morningstar, Inc. and Subsidiaries
Reconciliations of Non-GAAP Measures with the Nearest Comparable GAAP Measures (Unaudited)
To supplement Morningstar’s condensed consolidated financial statements presented in accordance with U.S. Generally Accepted Accounting Principles (GAAP), Morningstar uses the following measures considered as non-GAAP by the Securities and Exchange Commission, including:
•consolidated revenue, excluding acquisitions, divestitures, adoption of new accounting standards or revisions to accounting practices (accounting changes), and the effect of foreign currency translations (organic revenue);
•consolidated operating income, excluding intangible amortization expense, all merger and acquisition (M&A)-related expenses (related to merger, acquisition, and divestiture activity including severance and earn-outs), and expenses related to the significant reduction and shift of the Company's operations in China (adjusted operating income);
•consolidated operating margin, excluding intangible amortization expense, all M&A-related expenses, and expenses related to the significant reduction and shift of the Company's operations in China (adjusted operating margin);
•consolidated diluted net income (loss) per share, excluding intangible amortization expense, all M&A-related expenses, items related to the significant reduction and shift of the Company's operations in China, and certain non-operating gains/losses (adjusted diluted net income per share); and
•cash provided by or used for operating activities less capital expenditures (free cash flow).
These non-GAAP measures may not be comparable to similarly titled measures reported by other companies and should not be considered an alternative to any measure or performance as promulgated under GAAP.
Morningstar presents organic revenue because the Company believes this non-GAAP measure helps investors better compare period-over-period results, and Morningstar’s management team uses this measure to evaluate the performance of the business. Morningstar excludes revenue from acquired businesses from its organic revenue growth calculation for a period of 12 months after it completes the acquisition. For divestitures, Morningstar excludes revenue in the prior-year period for which there is no comparable revenue in the current period.
Morningstar presents adjusted operating income, adjusted operating margin, and adjusted diluted net income per share to show the effect of significant acquisition and divestiture activity, better compare period-over-period results, and improve overall understanding of the underlying performance of the business absent the impact of M&A and the shift of Morningstar's operations in China.
In addition, Morningstar presents free cash flow solely as supplemental disclosure to help investors better understand how much cash is available after making capital expenditures. Morningstar's management team uses free cash flow to evaluate the health of its business. Free cash flow should not be considered an alternative to any measure required to be reported under GAAP (such as cash provided by (used for) operating, investing, and financing activities).
  Three months ended June 30,   Six months ended June 30,
(in millions)   2024 2023   Change   2024 2023   Change
Reconciliation from consolidated revenue to organic revenue:  
Consolidated revenue   $ 571.9  $ 504.7  13.3  % $ 1,114.7  $ 984.4  13.2  %
Less: acquisitions   —  —  —  % —  —  —  %
Less: accounting changes —  —  —  % —  —  —  %
Effect of foreign currency translations   1.4  —  NMF 0.2  —  NMF
Organic revenue $ 573.3  $ 504.7  13.6  % $ 1,114.9  $ 984.4  13.3  %
Reconciliation from consolidated operating income to adjusted operating income:  
Consolidated operating income   $ 108.5  $ 41.7  160.2  % $ 201.1  $ 66.2  203.8  %
Add: Intangible amortization expense (1)
  17.5  17.7  (1.1) % 35.2  35.2  —  %
Add: M&A-related expenses (2)
  5.0  3.0  66.7  % 5.5  7.2  (23.6) %
Add: Severance and personnel expenses (3) —  2.9  NMF —  4.1  NMF
Add: Transformation costs (3)
—  2.2  NMF —  6.4  NMF
Add: Asset impairment costs (3)
—  2.2  NMF —  2.4  NMF
Adjusted operating income $ 131.0  $ 69.7  87.9  % $ 241.8  $ 121.5  99.0  %
Reconciliation from consolidated operating margin to adjusted operating margin:  
Consolidated operating margin   19.0  % 8.3  % 10.7 pp 18.0  % 6.7  % 11.3 pp
Add: Intangible amortization expense (1)   3.0  % 3.5  % (0.5) pp 3.2  % 3.6  % (0.4) pp
Add: M&A-related expenses (2)   0.9  % 0.6  % 0.3 pp 0.5  % 0.7  % (0.2) pp
Add: Severance and personnel expenses (3) —  % 0.6  % (0.6) pp —  % 0.4  % (0.4) pp
Add: Transformation costs (3) —  % 0.4  % (0.4) pp —  % 0.7  % (0.7) pp
Add: Asset impairment costs (3) —  % 0.4  % (0.4) pp —  % 0.2  % (0.2) pp
Page 13 of 14


  Three months ended June 30,   Six months ended June 30,
(in millions)   2024 2023   Change   2024 2023   Change
Adjusted operating margin 22.9  % 13.8  % 9.1 pp 21.7  % 12.3  % 9.4 pp
Reconciliation from consolidated diluted net income per share to adjusted diluted net income per share:
 
Consolidated diluted net income per share
  $ 1.60  $ 0.84  90.5  % $ 3.09  $ 0.67  361.2  %
Add: Intangible amortization expense (1)   0.30  0.31  (3.2) % 0.61  0.61  —  %
Add: M&A-related expenses (2)   0.09  0.05  80.0  % 0.09  0.12  (25.0) %
Add: Severance and personnel expenses (3) —  0.05  NMF —  0.07  NMF
Add: Transformation costs (3) —  0.04  NMF —  0.11  NMF
Add: Asset impairment costs (3) —  0.04  NMF —  0.04  NMF
Less: Non-operating (gains) losses (4) 0.02  (0.03) NMF (0.05) 0.24  NMF
Adjusted diluted net income per share
$ 2.01  $ 1.30  54.6  % $ 3.74  $ 1.86  101.1  %
Reconciliation from cash provided by operating activities to free cash flow:
Cash provided by operating activities $ 152.7  $ 24.5  NMF $ 246.3  $ 47.9  414.2  %
Capital expenditures (31.9) (30.3) 5.3  % (66.0) (59.8) 10.4  %
Free cash flow $ 120.8  $ (5.8) NMF $ 180.3  $ (11.9) NMF
______________________________________________________________________
NMF - Not meaningful, pp - percentage points
(1) Excludes finance lease amortization expense of $0.1 million and $0.4 million during the three months ended June 30, 2024 and 2023, respectively, and $0.4 million and $0.5 million during the six months ended June 30, 2024 and 2023, respectively.
(2) Reflects non-recurring expenses related to merger, acquisition, and divestiture activity including pre-deal due diligence, transaction costs, severance, and post-close integration costs.
(3) Reflects costs associated with the significant reduction of the Company's operations in Shenzhen, China, and the shift of work related to its global business functions to other Morningstar locations.
Severance and personnel expenses include severance charges, incentive payments related to early signing of severance agreements, transition bonuses, and stock-based compensation related to the accelerated vesting of restricted stock unit and market stock unit awards. In addition, the reversal of accrued sabbatical liabilities is included in this category.
Transformation costs include professional fees and the temporary duplication of headcount. As the Company hired replacement roles in other markets and shifted capabilities, it employed certain Shenzhen-based staff through the transition period, which resulted in elevated compensation costs on a temporary basis.
Asset impairment costs include the write-off or accelerated depreciation of fixed assets in the Shenzhen, China office that were not redeployed, in addition to lease abandonment costs as the Company downsized its office space prior to the lease termination date.
(4) Non-operating (gains) losses in the three and six months ended June 30, 2024 and June 30, 2023, related to realized and unrealized gains and losses on investments. In addition, non-operating (gains) losses for the six months ended June 30, 2023 also include expense from an equity method transaction, net.
Page 14 of 14
EX-99.2 3 morningstar_q2x2024xsupp.htm EX-99.2 morningstar_q2x2024xsupp
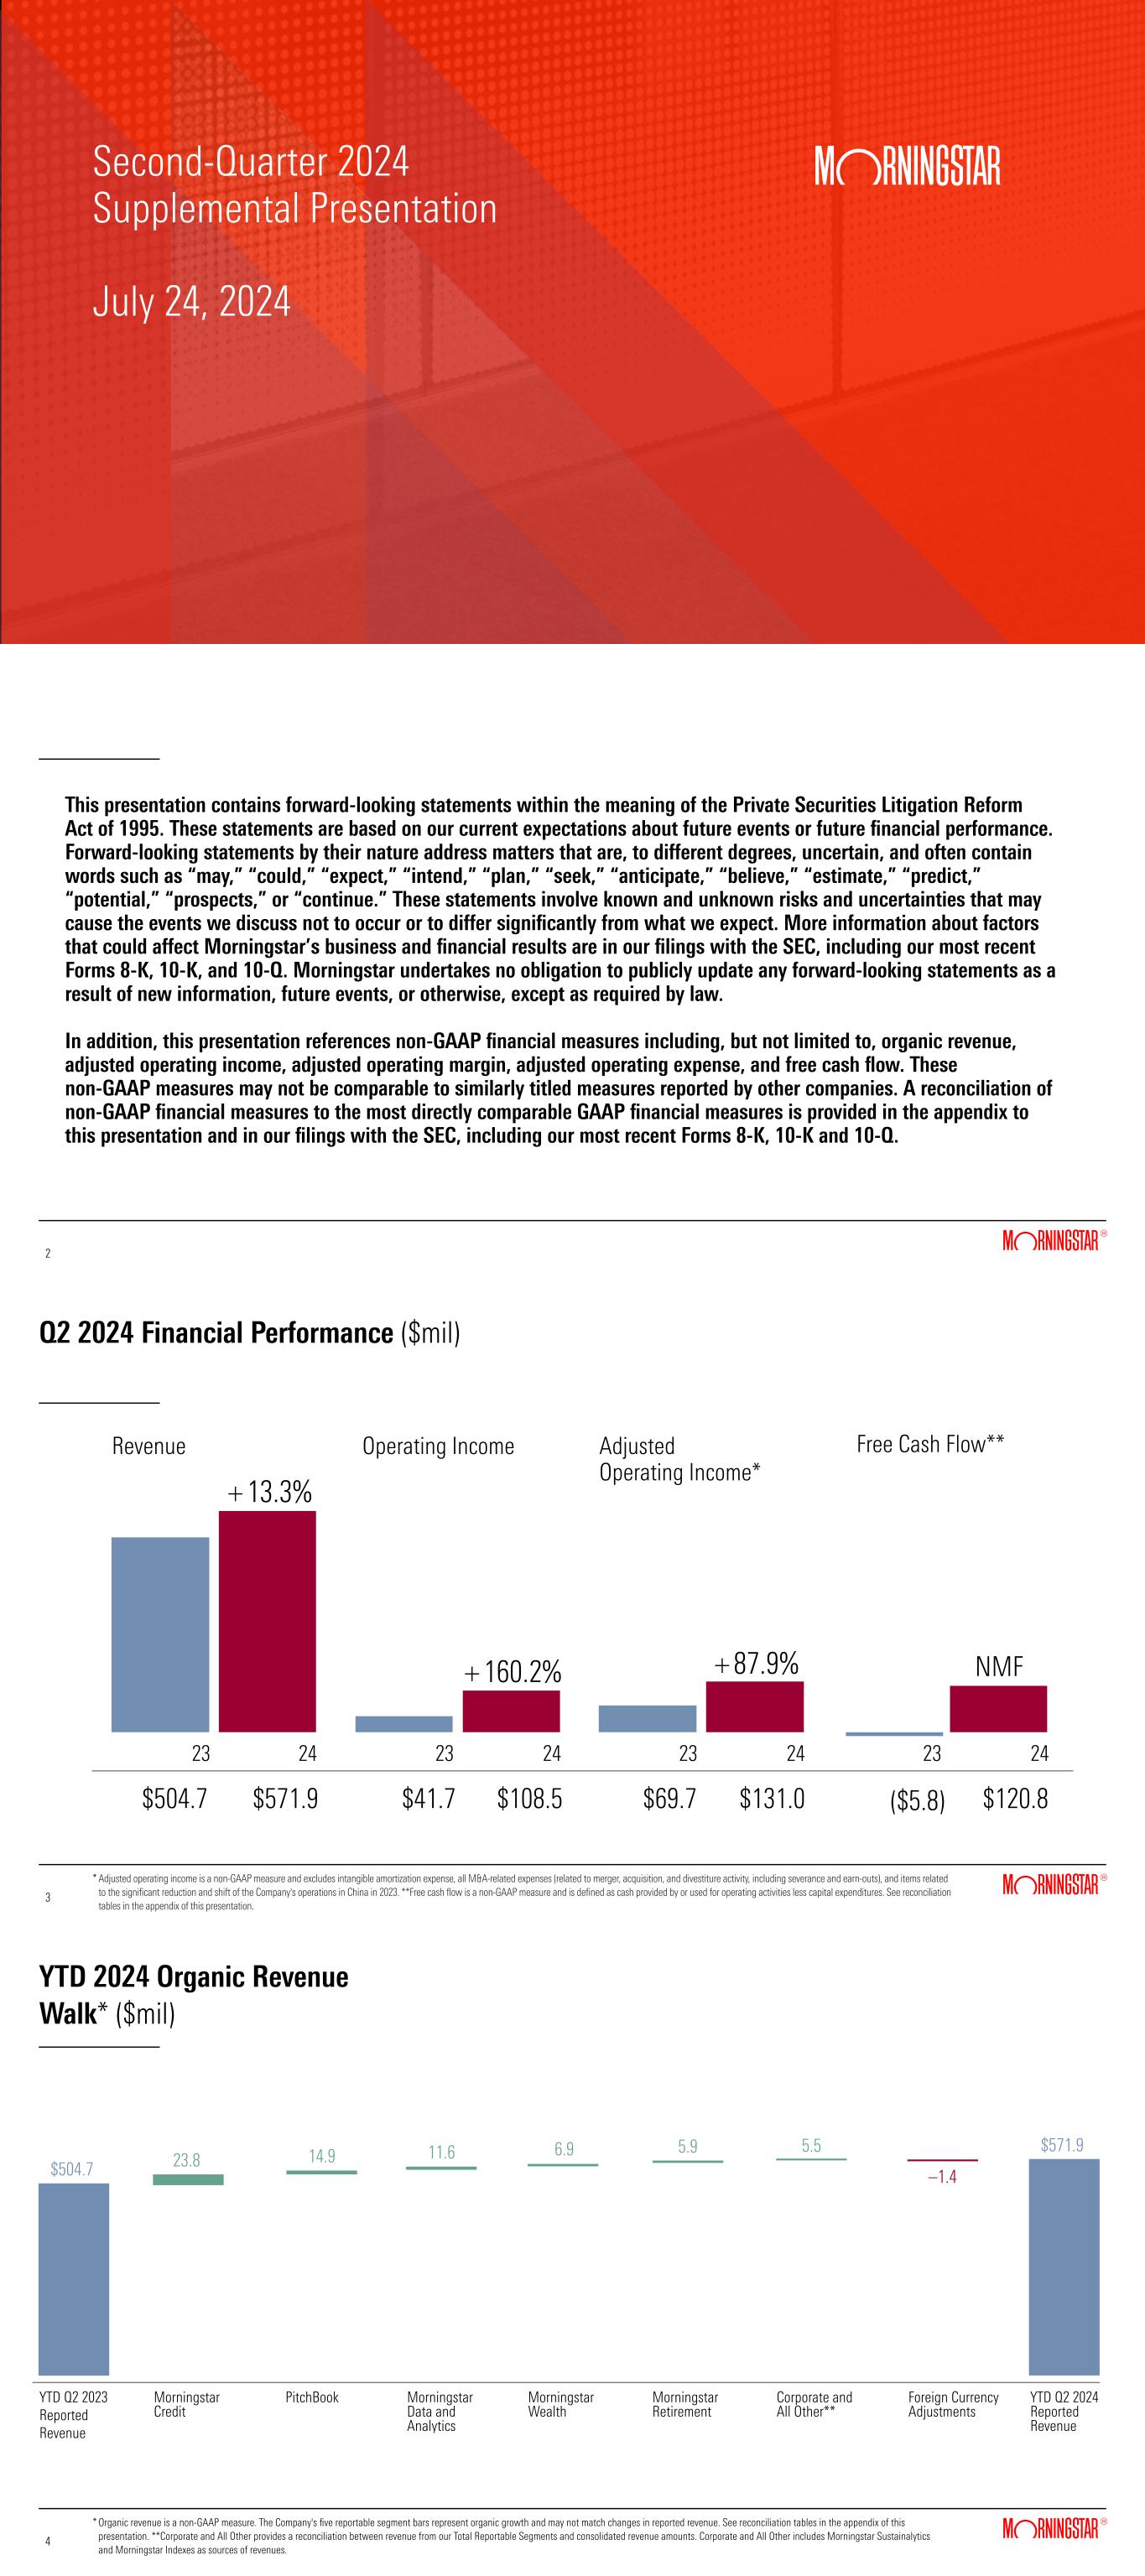
Second-Quarter 2024 Supplemental Presentation July 24, 2024 This presentation contains forward-looking statements within the meaning of the Private Securities Litigation Reform Act of 1995. These statements are based on our current expectations about future events or future financial performance. Forward-looking statements by their nature address matters that are, to different degrees, uncertain, and often contain words such as “may,” “could,” “expect,” “intend,” “plan,” “seek,” “anticipate,” “believe,” “estimate,” “predict,” “potential,” “prospects,” or “continue.” These statements involve known and unknown risks and uncertainties that may cause the events we discuss not to occur or to differ significantly from what we expect. More information about factors that could affect Morningstar’s business and financial results are in our filings with the SEC, including our most recent Forms 8-K, 10-K, and 10-Q. Morningstar undertakes no obligation to publicly update any forward-looking statements as a result of new information, future events, or otherwise, except as required by law. In addition, this presentation references non-GAAP financial measures including, but not limited to, organic revenue, adjusted operating income, adjusted operating margin, adjusted operating expense, and free cash flow. These non-GAAP measures may not be comparable to similarly titled measures reported by other companies. A reconciliation of non-GAAP financial measures to the most directly comparable GAAP financial measures is provided in the appendix to this presentation and in our filings with the SEC, including our most recent Forms 8-K, 10-K and 10-Q. 2 2 Q2 2024 Financial Performance ($mil) $108.5$41.7 2423 $131.0 +13.3% +87.9% 2423 $571.9$504.7 2423 $69.7 $120.8 2423 ($5.8) Operating Income Free Cash Flow** Revenue Adjusted Operating Income* * 3 3 Adjusted operating income is a non-GAAP measure and excludes intangible amortization expense, all M&A-related expenses (related to merger, acquisition, and divestiture activity, including severance and earn-outs), and items related to the significant reduction and shift of the Company's operations in China in 2023. **Free cash flow is a non-GAAP measure and is defined as cash provided by or used for operating activities less capital expenditures. See reconciliation tables in the appendix of this presentation. NMF+160.2% YTD 2024 Organic Revenue Walk* ($mil) 4 4 * YTD Q2 2023 Reported Revenue Foreign Currency Adjustments PitchBook Morningstar Data and Analytics Morningstar Credit Morningstar Wealth Corporate and All Other** Morningstar Retirement YTD Q2 2024 Reported Revenue $504.7 –1.4 23.8 14.9 11.6 5.9 5.5 $571.9 Organic revenue is a non-GAAP measure. The Company's five reportable segment bars represent organic growth and may not match changes in reported revenue. See reconciliation tables in the appendix of this presentation. **Corporate and All Other provides a reconciliation between revenue from our Total Reportable Segments and consolidated revenue amounts. Corporate and All Other includes Morningstar Sustainalytics and Morningstar Indexes as sources of revenues. 6.9


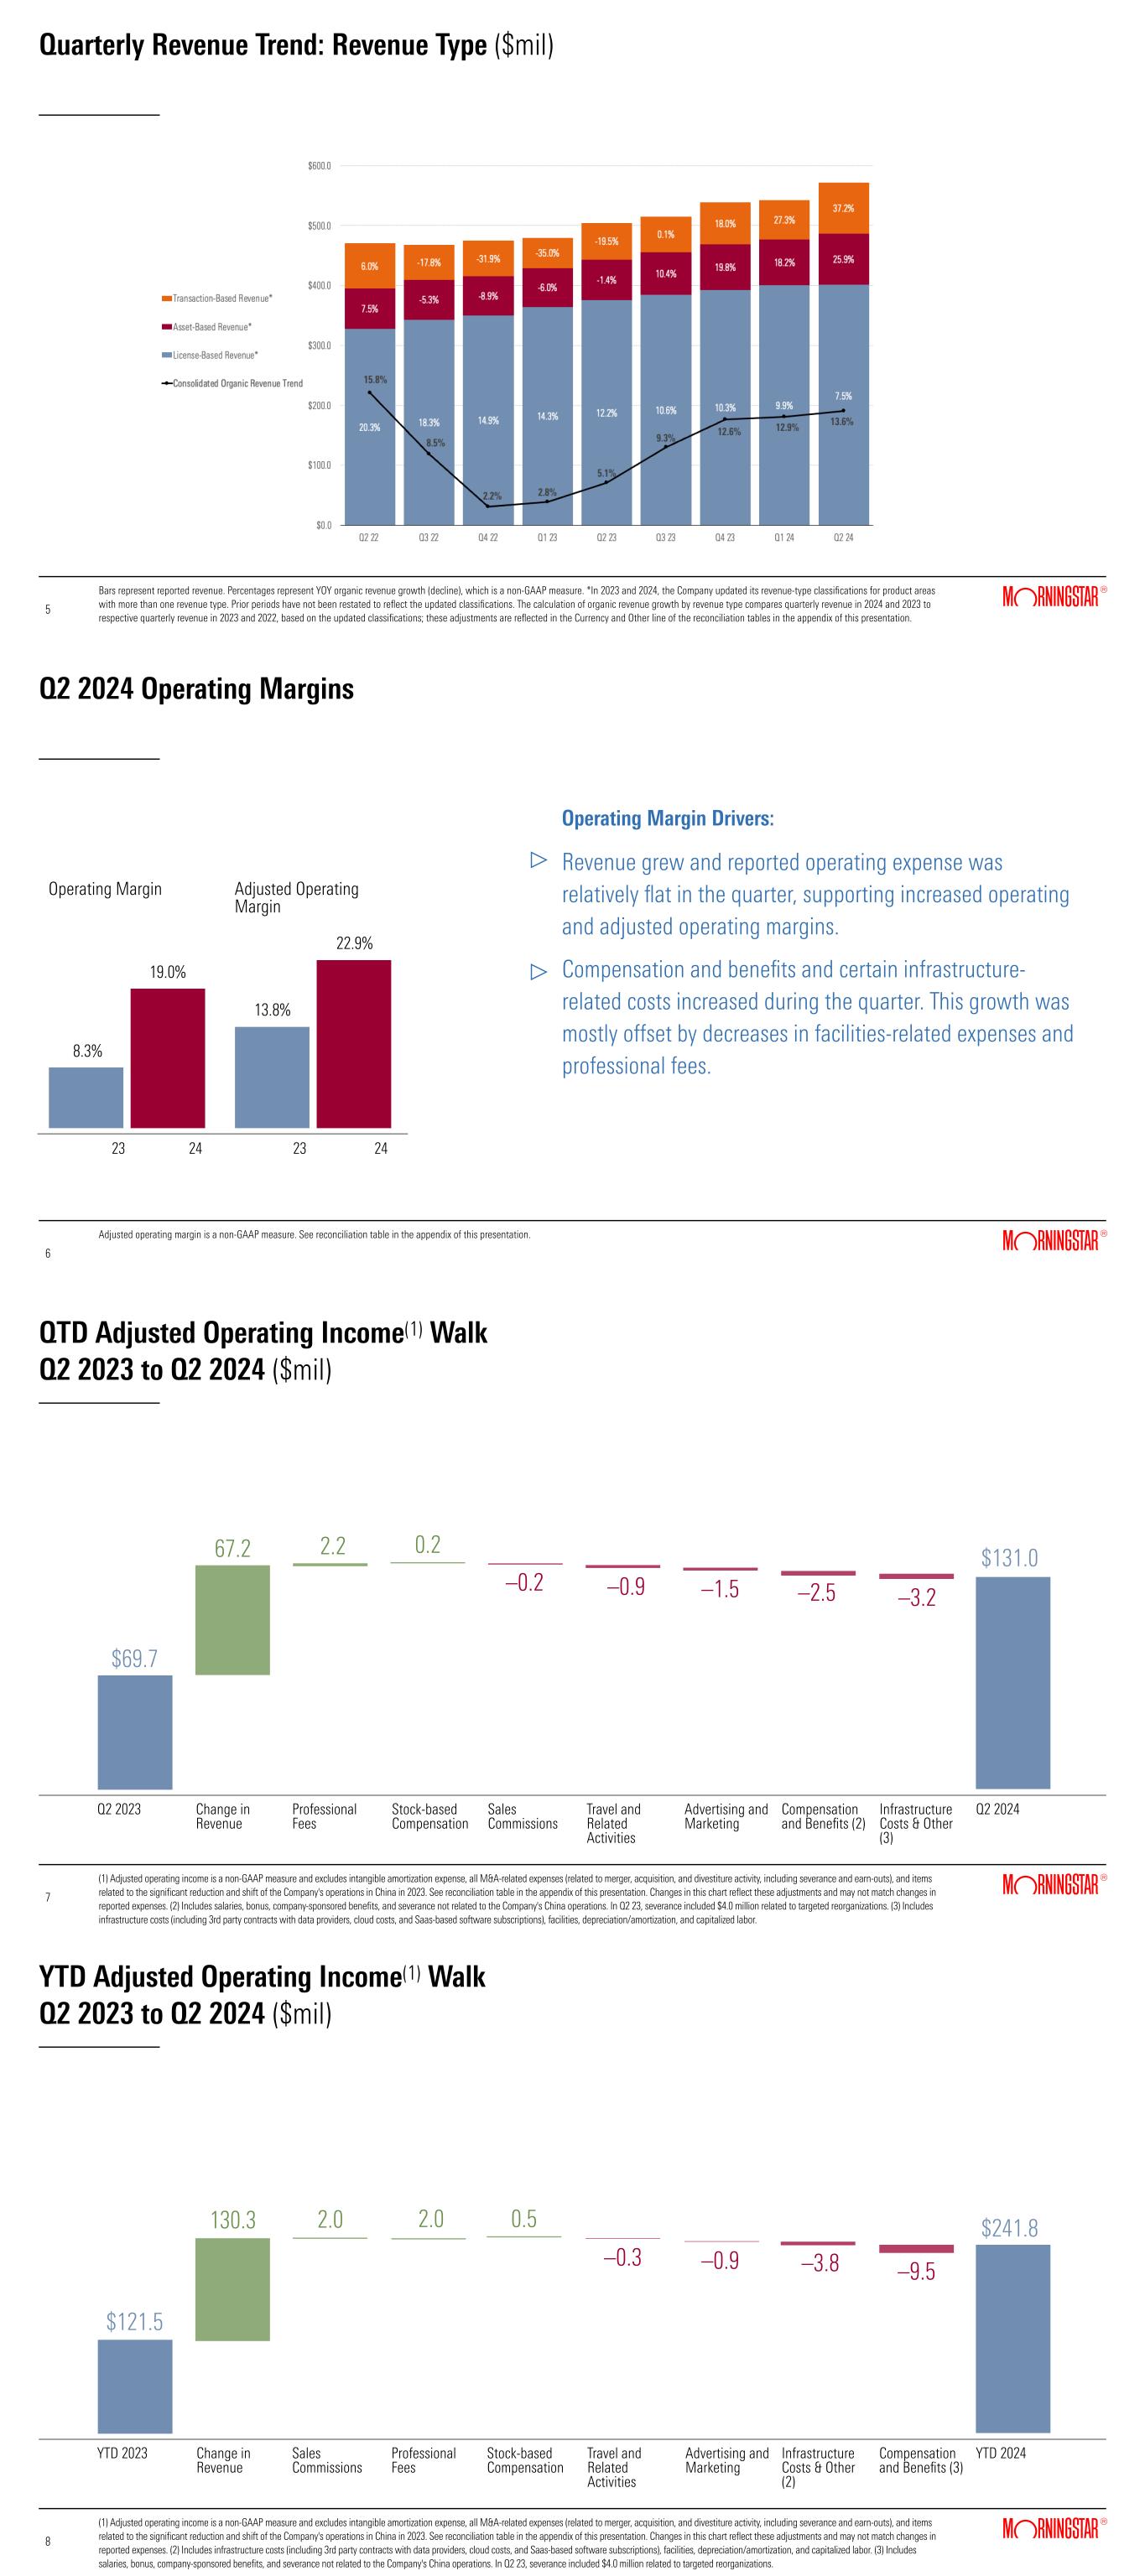
Quarterly Revenue Trend: Revenue Type ($mil) Bars represent reported revenue. Percentages represent YOY organic revenue growth (decline), which is a non-GAAP measure. *In 2023 and 2024, the Company updated its revenue-type classifications for product areas with more than one revenue type. Prior periods have not been restated to reflect the updated classifications. The calculation of organic revenue growth by revenue type compares quarterly revenue in 2024 and 2023 to respective quarterly revenue in 2023 and 2022, based on the updated classifications; these adjustments are reflected in the Currency and Other line of the reconciliation tables in the appendix of this presentation. 5 Q2 2024 Operating Margins 6 6 Adjusted operating margin is a non-GAAP measure. See reconciliation table in the appendix of this presentation. Adjusted Operating Margin Operating Margin 2423 19.0% 22.9% 2423 8.3% 13.8% Operating Margin Drivers: Revenue grew and reported operating expense was relatively flat in the quarter, supporting increased operating and adjusted operating margins. Compensation and benefits and certain infrastructure- related costs increased during the quarter. This growth was mostly offset by decreases in facilities-related expenses and professional fees. QTD Adjusted Operating Income(1) Walk Q2 2023 to Q2 2024 ($mil) (1) Adjusted operating income is a non-GAAP measure and excludes intangible amortization expense, all M&A-related expenses (related to merger, acquisition, and divestiture activity, including severance and earn-outs), and items related to the significant reduction and shift of the Company's operations in China in 2023. See reconciliation table in the appendix of this presentation. Changes in this chart reflect these adjustments and may not match changes in reported expenses. (2) Includes salaries, bonus, company-sponsored benefits, and severance not related to the Company's China operations. In Q2 23, severance included $4.0 million related to targeted reorganizations. (3) Includes infrastructure costs (including 3rd party contracts with data providers, cloud costs, and Saas-based software subscriptions), facilities, depreciation/amortization, and capitalized labor. 7 7 Q2 2023 Change in Revenue Sales Commissions Travel and Related Activities Professional Fees Advertising and Marketing Stock-based Compensation Q2 2024 $69.7 2.267.2 0.2 $131.0 Infrastructure Costs & Other (3) –3.2–1.5 Compensation and Benefits (2) –2.5 C–0.2 –0.9C C YTD Adjusted Operating Income(1) Walk Q2 2023 to Q2 2024 ($mil) (1) Adjusted operating income is a non-GAAP measure and excludes intangible amortization expense, all M&A-related expenses (related to merger, acquisition, and divestiture activity, including severance and earn-outs), and items related to the significant reduction and shift of the Company's operations in China in 2023. See reconciliation table in the appendix of this presentation. Changes in this chart reflect these adjustments and may not match changes in reported expenses. (2) Includes infrastructure costs (including 3rd party contracts with data providers, cloud costs, and Saas-based software subscriptions), facilities, depreciation/amortization, and capitalized labor. (3) Includes salaries, bonus, company-sponsored benefits, and severance not related to the Company's China operations. In Q2 23, severance included $4.0 million related to targeted reorganizations. 8 8 YTD 2023 Change in Revenue Sales Commissions Travel and Related Activities Professional Fees Advertising and Marketing Stock-based Compensation YTD 2024 $121.5 2.0130.3 2.0 $241.8 Infrastructure Costs & Other (2) –9.5–0.9 Compensation and Benefits (3) –3.8 C 0.5 –0.3C CC


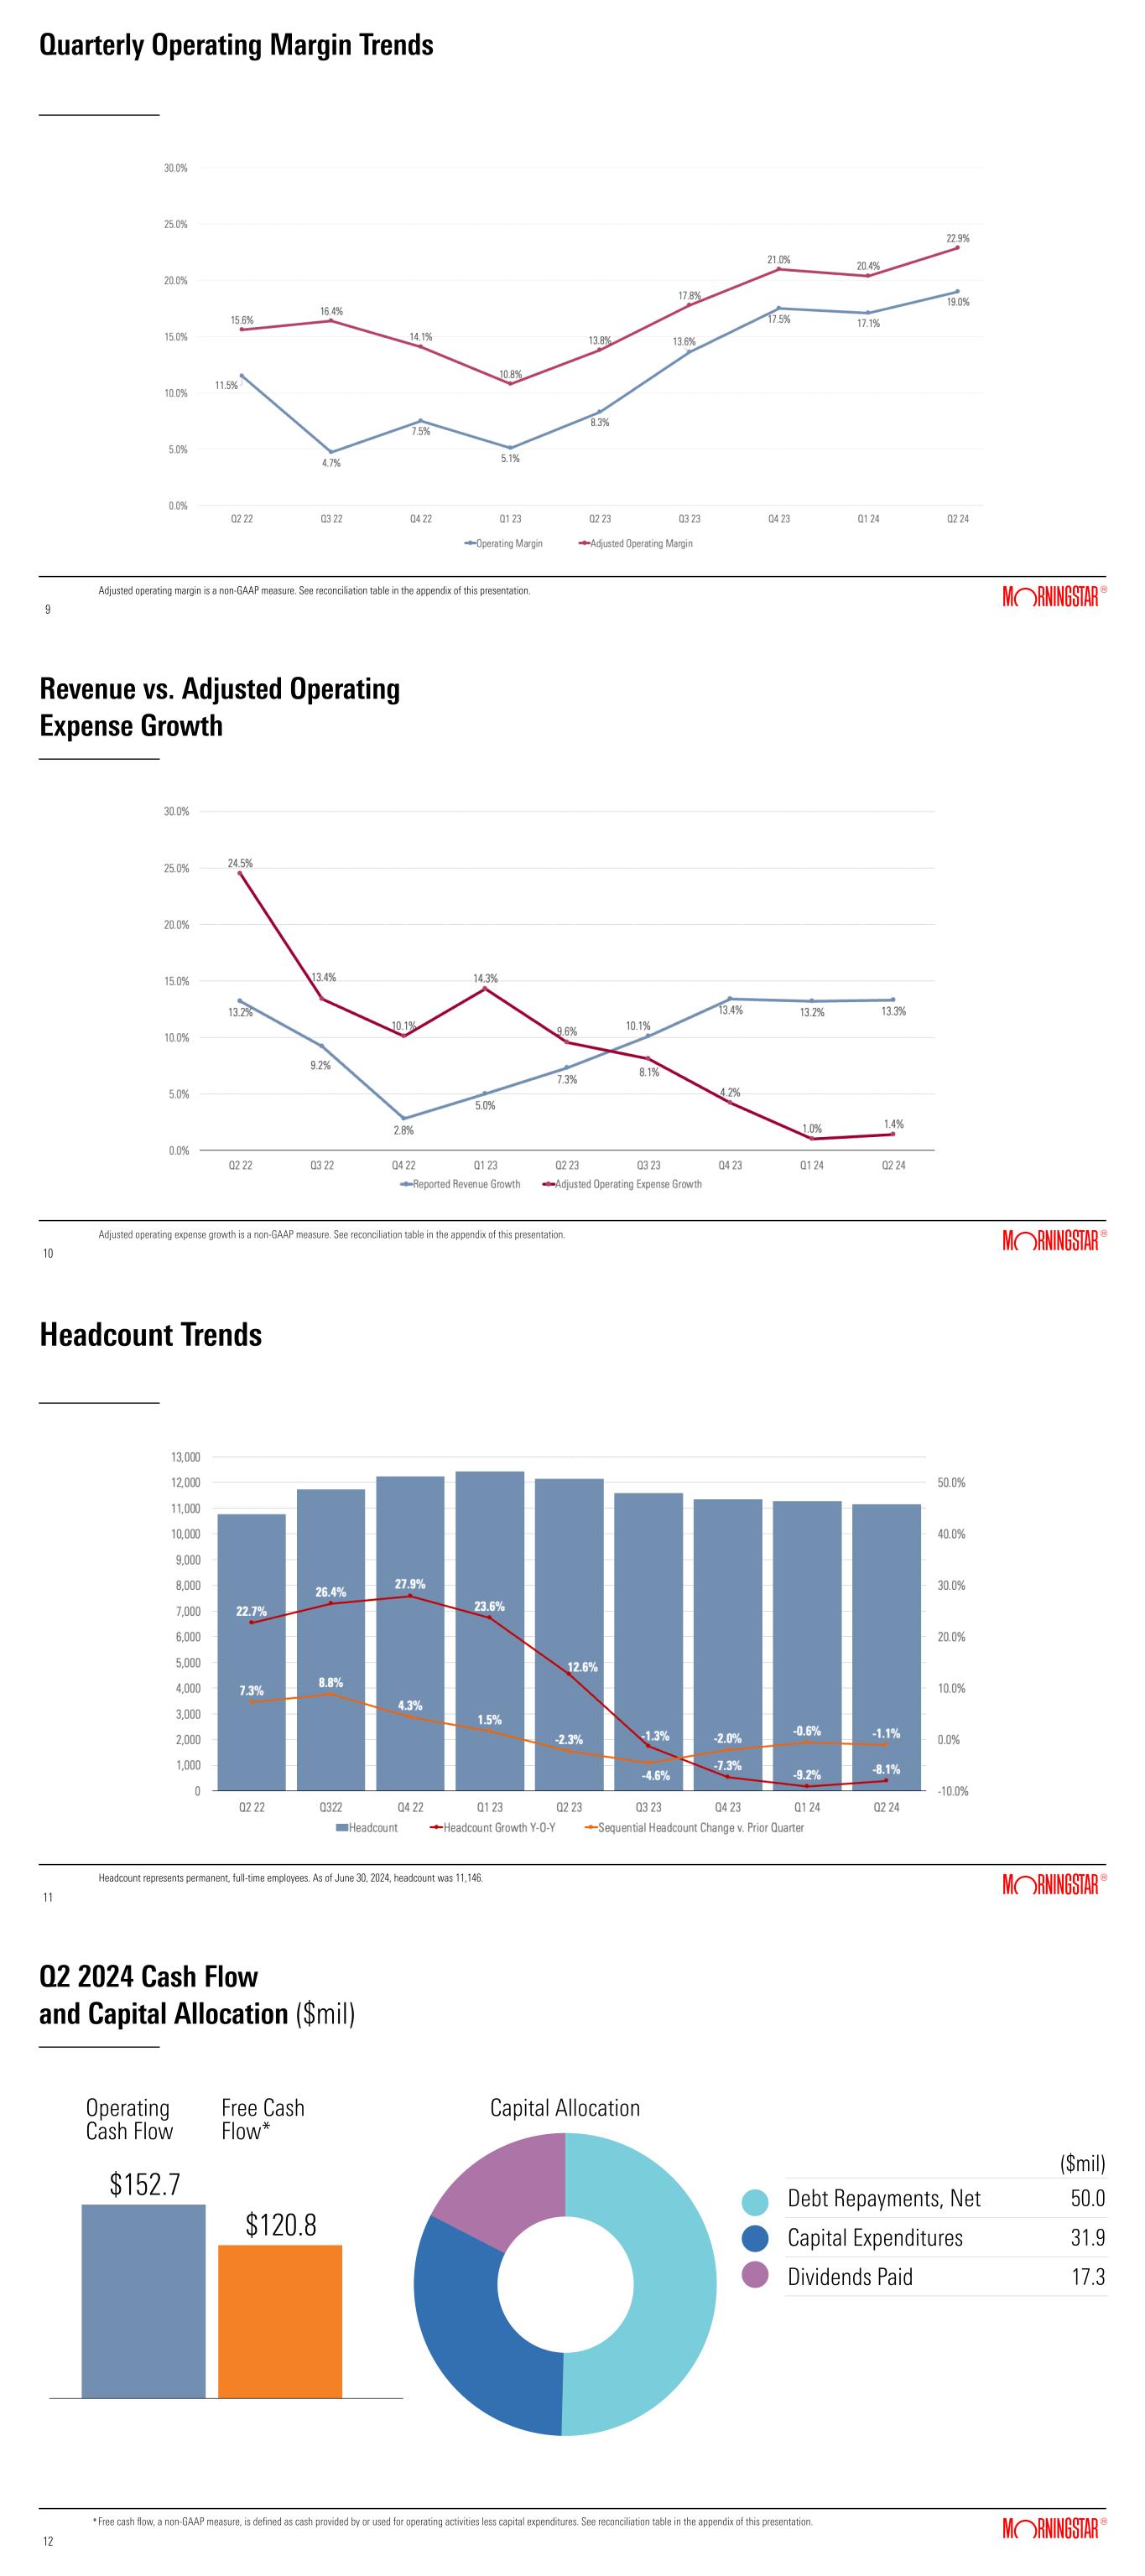
Quarterly Operating Margin Trends Adjusted operating margin is a non-GAAP measure. See reconciliation table in the appendix of this presentation. 9 9 Revenue vs. Adjusted Operating Expense Growth 10 10 Adjusted operating expense growth is a non-GAAP measure. See reconciliation table in the appendix of this presentation. Headcount Trends 11 11 Headcount represents permanent, full-time employees. As of June 30, 2024, headcount was 11,146. Q2 2024 Cash Flow and Capital Allocation ($mil) 2 $152.7 $120.8 Operating Cash Flow Free Cash Flow* Capital Allocation 12 12 * ($mil) Debt Repayments, Net 50.0 Capital Expenditures 31.9 Dividends Paid 17.3 Free cash flow, a non-GAAP measure, is defined as cash provided by or used for operating activities less capital expenditures. See reconciliation table in the appendix of this presentation.


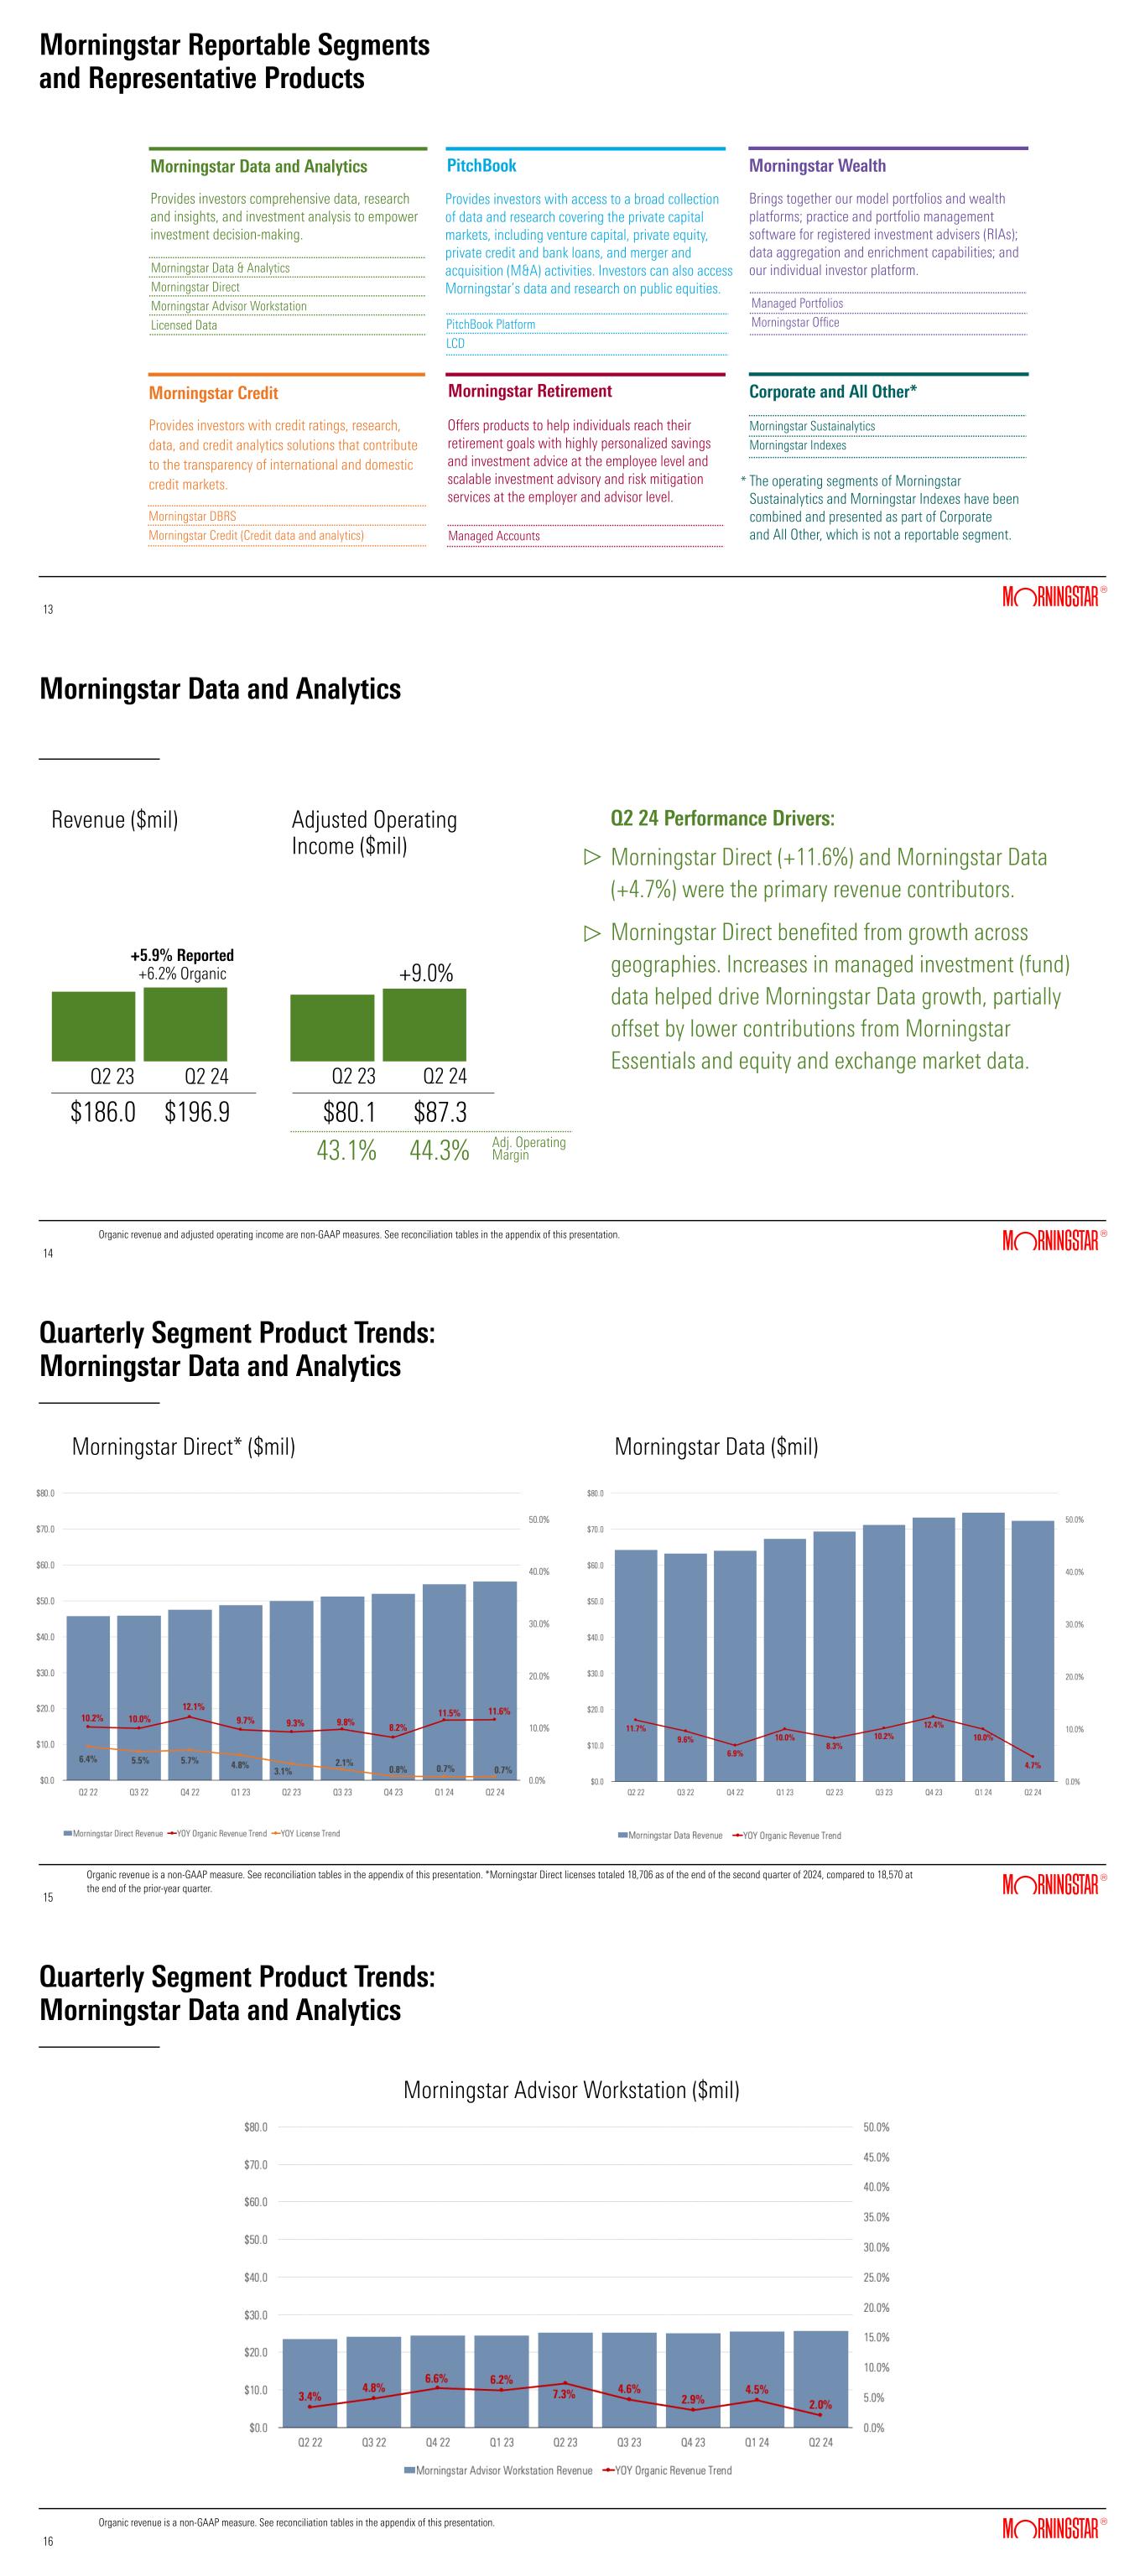
Morningstar Reportable Segments and Representative Products 13 Morningstar Data and Analytics Provides investors comprehensive data, research and insights, and investment analysis to empower investment decision-making. Morningstar Retirement Offers products to help individuals reach their retirement goals with highly personalized savings and investment advice at the employee level and scalable investment advisory and risk mitigation services at the employer and advisor level. Morningstar Credit Provides investors with credit ratings, research, data, and credit analytics solutions that contribute to the transparency of international and domestic credit markets. Morningstar Wealth Brings together our model portfolios and wealth platforms; practice and portfolio management software for registered investment advisers (RIAs); data aggregation and enrichment capabilities; and our individual investor platform. PitchBook Morningstar Data & Analytics Morningstar Direct Morningstar Advisor Workstation Licensed Data Provides investors with access to a broad collection of data and research covering the private capital markets, including venture capital, private equity, private credit and bank loans, and merger and acquisition (M&A) activities. Investors can also access Morningstar’s data and research on public equities. PitchBook Platform LCD Managed Portfolios Morningstar Office Morningstar DBRS Morningstar Credit (Credit data and analytics) Managed Accounts Corporate and All Other* The operating segments of Morningstar Sustainalytics and Morningstar Indexes have been combined and presented as part of Corporate and All Other, which is not a reportable segment. Morningstar Sustainalytics Morningstar Indexes * Morningstar Data and Analytics Q2 24Q2 23 Q2 24 Performance Drivers: Morningstar Direct (+11.6%) and Morningstar Data (+4.7%) were the primary revenue contributors. Morningstar Direct benefited from growth across geographies. Increases in managed investment (fund) data helped drive Morningstar Data growth, partially offset by lower contributions from Morningstar Essentials and equity and exchange market data.   Organic revenue and adjusted operating income are non-GAAP measures. See reconciliation tables in the appendix of this presentation. $186.0 $196.9 14 14 Revenue ($mil) Q2 24Q2 23 $80.1 $87.3 Adjusted Operating Income ($mil) +9.0% 43.1% 44.3% Adj. Operating Margin +5.9% Reported +6.2% Organic Quarterly Segment Product Trends: Morningstar Data and Analytics Morningstar Direct* ($mil) 15 15 Morningstar Data ($mil) Organic revenue is a non-GAAP measure. See reconciliation tables in the appendix of this presentation. *Morningstar Direct licenses totaled 18,706 as of the end of the second quarter of 2024, compared to 18,570 at the end of the prior-year quarter. Quarterly Segment Product Trends: Morningstar Data and Analytics Morningstar Advisor Workstation ($mil) 16 16 Organic revenue is a non-GAAP measure. See reconciliation tables in the appendix of this presentation.


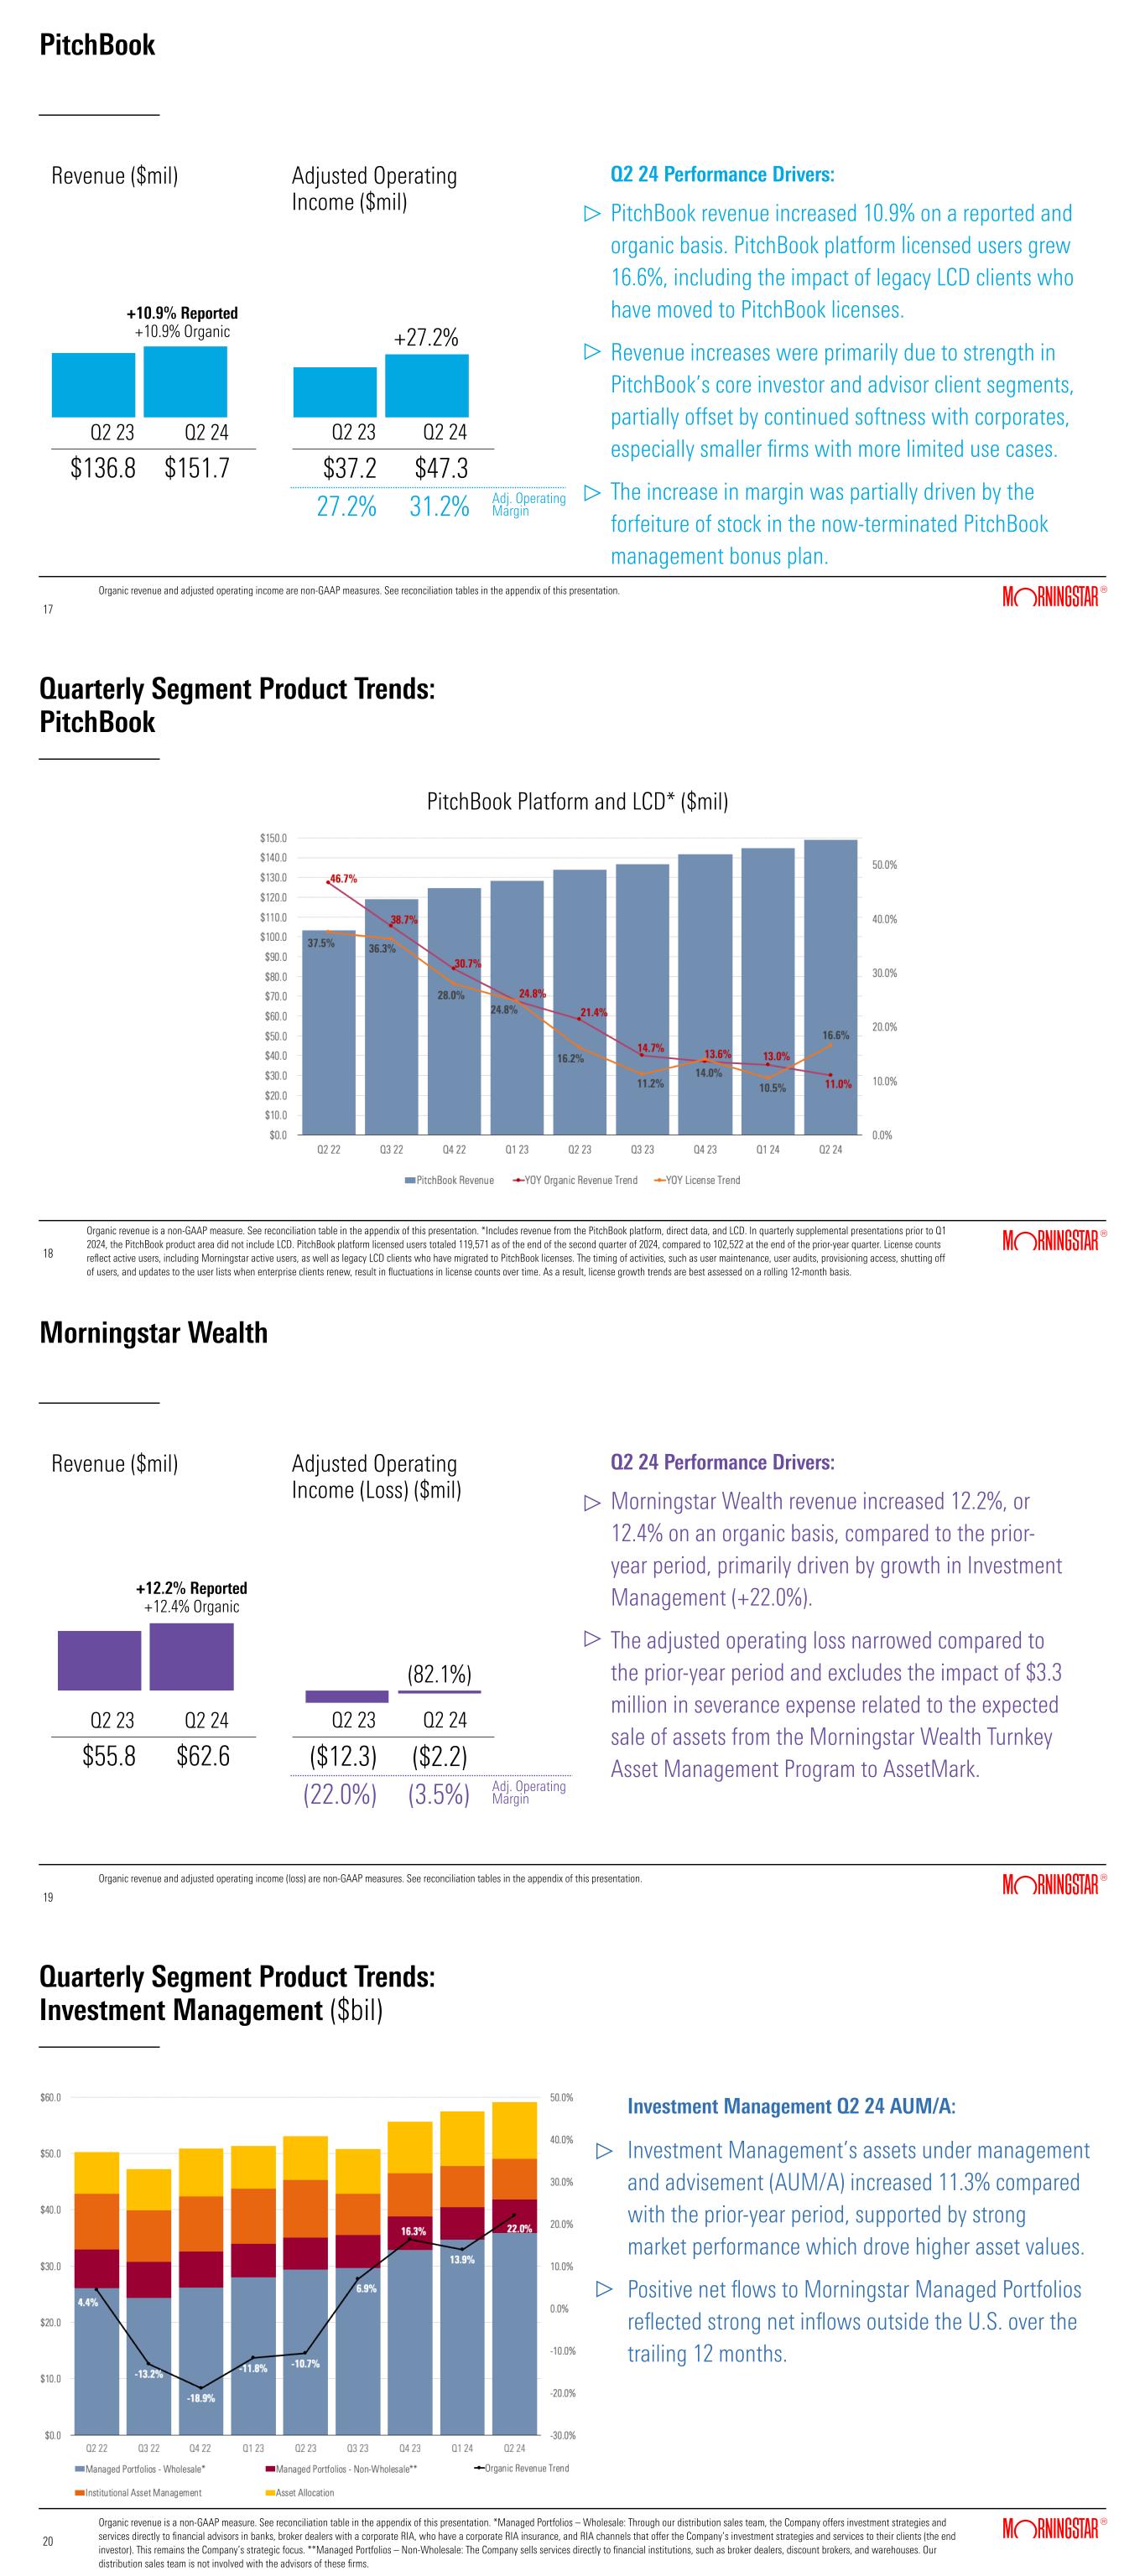
PitchBook Q2 24Q2 23 Q2 24 Performance Drivers: PitchBook revenue increased 10.9% on a reported and organic basis. PitchBook platform licensed users grew 16.6%, including the impact of legacy LCD clients who have moved to PitchBook licenses. Revenue increases were primarily due to strength in PitchBook’s core investor and advisor client segments, partially offset by continued softness with corporates, especially smaller firms with more limited use cases. The increase in margin was partially driven by the forfeiture of stock in the now-terminated PitchBook management bonus plan.   Organic revenue and adjusted operating income are non-GAAP measures. See reconciliation tables in the appendix of this presentation. $136.8 $151.7 17 17 Revenue ($mil) Q2 24Q2 23 $37.2 $47.3 Adjusted Operating Income ($mil) +27.2% 27.2% 31.2% Adj. Operating Margin +10.9% Reported +10.9% Organic Quarterly Segment Product Trends: PitchBook PitchBook Platform and LCD* ($mil) 18 18 Organic revenue is a non-GAAP measure. See reconciliation table in the appendix of this presentation. *Includes revenue from the PitchBook platform, direct data, and LCD. In quarterly supplemental presentations prior to Q1 2024, the PitchBook product area did not include LCD. PitchBook platform licensed users totaled 119,571 as of the end of the second quarter of 2024, compared to 102,522 at the end of the prior-year quarter. License counts reflect active users, including Morningstar active users, as well as legacy LCD clients who have migrated to PitchBook licenses. The timing of activities, such as user maintenance, user audits, provisioning access, shutting off of users, and updates to the user lists when enterprise clients renew, result in fluctuations in license counts over time. As a result, license growth trends are best assessed on a rolling 12-month basis. Morningstar Wealth Q2 24Q2 23 Q2 24 Performance Drivers: Morningstar Wealth revenue increased 12.2%, or 12.4% on an organic basis, compared to the prior- year period, primarily driven by growth in Investment Management (+22.0%). The adjusted operating loss narrowed compared to the prior-year period and excludes the impact of $3.3 million in severance expense related to the expected sale of assets from the Morningstar Wealth Turnkey Asset Management Program to AssetMark. Organic revenue and adjusted operating income (loss) are non-GAAP measures. See reconciliation tables in the appendix of this presentation. $55.8 $62.6 19 19 Revenue ($mil) Q2 24Q2 23 ($12.3) ($2.2) Adjusted Operating Income (Loss) ($mil) (22.0%) (3.5%) Adj. Operating Margin +12.2% Reported +12.4% Organic (82.1%) Quarterly Segment Product Trends: Investment Management ($bil) Investment Management Q2 24 AUM/A: Investment Management’s assets under management and advisement (AUM/A) increased 11.3% compared with the prior-year period, supported by strong market performance which drove higher asset values. Positive net flows to Morningstar Managed Portfolios reflected strong net inflows outside the U.S. over the trailing 12 months. Organic revenue is a non-GAAP measure. See reconciliation table in the appendix of this presentation. *Managed Portfolios – Wholesale: Through our distribution sales team, the Company offers investment strategies and services directly to financial advisors in banks, broker dealers with a corporate RIA, who have a corporate RIA insurance, and RIA channels that offer the Company’s investment strategies and services to their clients (the end investor). This remains the Company’s strategic focus. **Managed Portfolios – Non-Wholesale: The Company sells services directly to financial institutions, such as broker dealers, discount brokers, and warehouses. Our distribution sales team is not involved with the advisors of these firms. 20 20


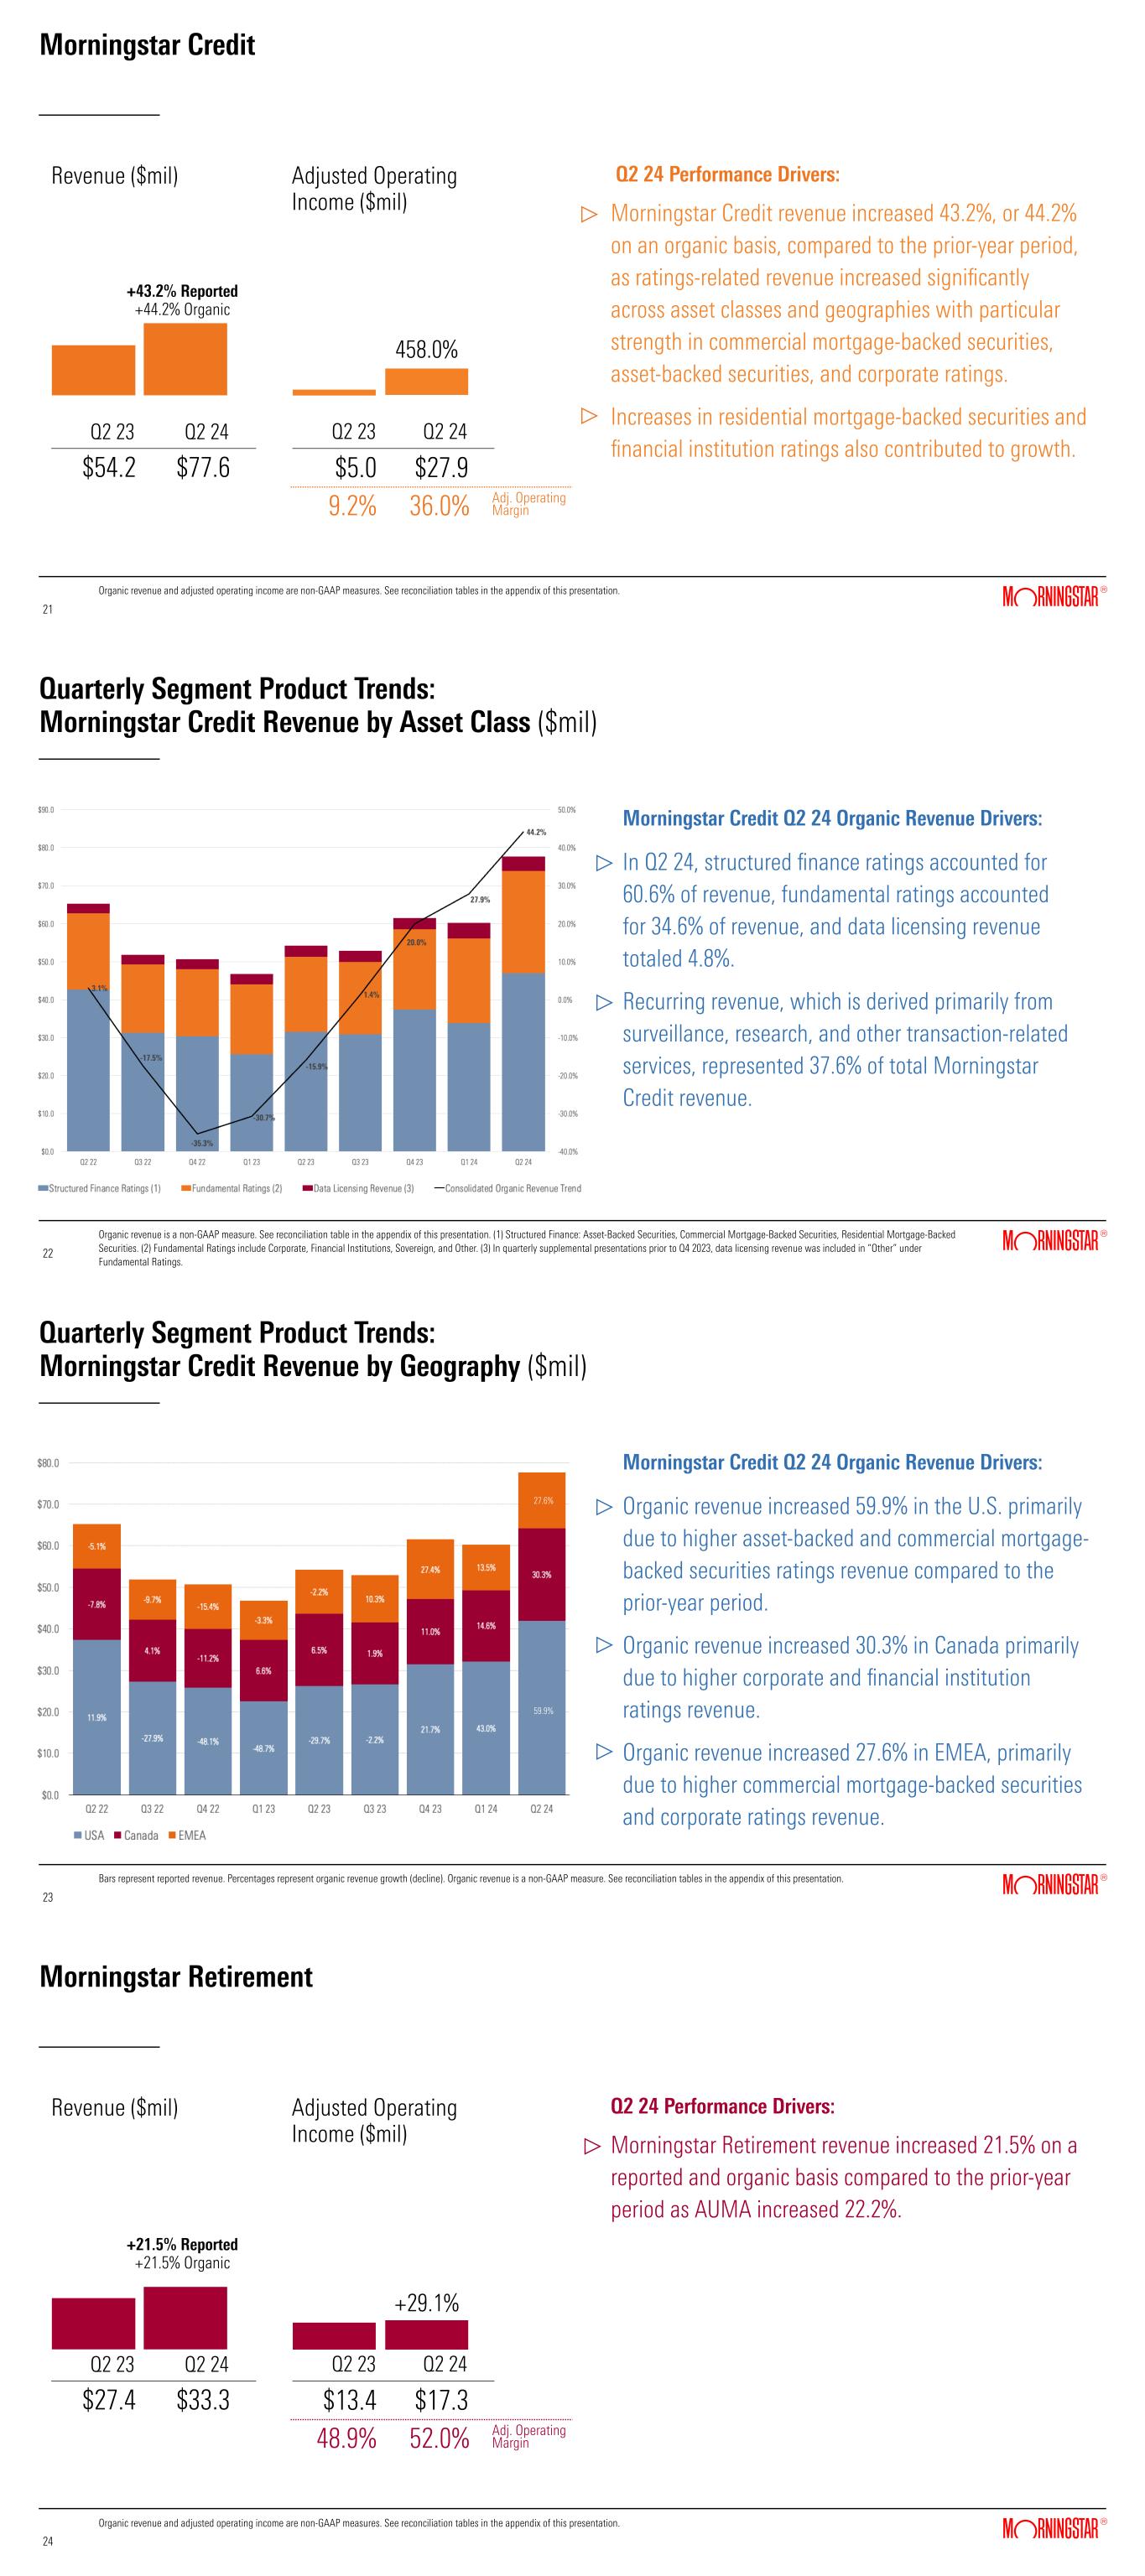
Morningstar Credit Q2 24Q2 23 Q2 24 Performance Drivers: Morningstar Credit revenue increased 43.2%, or 44.2% on an organic basis, compared to the prior-year period, as ratings-related revenue increased significantly across asset classes and geographies with particular strength in commercial mortgage-backed securities, asset-backed securities, and corporate ratings. Increases in residential mortgage-backed securities and financial institution ratings also contributed to growth.   Organic revenue and adjusted operating income are non-GAAP measures. See reconciliation tables in the appendix of this presentation. $54.2 $77.6 21 21 Revenue ($mil) Q2 24Q2 23 $5.0 $27.9 Adjusted Operating Income ($mil)  9.2% 36.0% Adj. Operating Margin +43.2% Reported +44.2% Organic 458.0% Quarterly Segment Product Trends: Morningstar Credit Revenue by Asset Class ($mil) Morningstar Credit Q2 24 Organic Revenue Drivers: In Q2 24, structured finance ratings accounted for 60.6% of revenue, fundamental ratings accounted for 34.6% of revenue, and data licensing revenue totaled 4.8%. Recurring revenue, which is derived primarily from surveillance, research, and other transaction-related services, represented 37.6% of total Morningstar Credit revenue. Organic revenue is a non-GAAP measure. See reconciliation table in the appendix of this presentation. (1) Structured Finance: Asset-Backed Securities, Commercial Mortgage-Backed Securities, Residential Mortgage-Backed Securities. (2) Fundamental Ratings include Corporate, Financial Institutions, Sovereign, and Other. (3) In quarterly supplemental presentations prior to Q4 2023, data licensing revenue was included in “Other” under Fundamental Ratings. 22 22 Quarterly Segment Product Trends: Morningstar Credit Revenue by Geography ($mil) Morningstar Credit Q2 24 Organic Revenue Drivers: Organic revenue increased 59.9% in the U.S. primarily due to higher asset-backed and commercial mortgage- backed securities ratings revenue compared to the prior-year period. Organic revenue increased 30.3% in Canada primarily due to higher corporate and financial institution ratings revenue.  Organic revenue increased 27.6% in EMEA, primarily due to higher commercial mortgage-backed securities and corporate ratings revenue. Bars represent reported revenue. Percentages represent organic revenue growth (decline). Organic revenue is a non-GAAP measure. See reconciliation tables in the appendix of this presentation. 23 23 27.6% 59.9% Morningstar Retirement Q2 24Q2 23 Q2 24 Performance Drivers: Morningstar Retirement revenue increased 21.5% on a reported and organic basis compared to the prior-year period as AUMA increased 22.2%. $27.4 $33.3 24 24 Revenue ($mil) Q2 24Q2 23 $13.4 $17.3 Adjusted Operating Income ($mil) +29.1% 48.9% 52.0% Adj. Operating Margin +21.5% Reported +21.5% Organic Organic revenue and adjusted operating income are non-GAAP measures. See reconciliation tables in the appendix of this presentation.


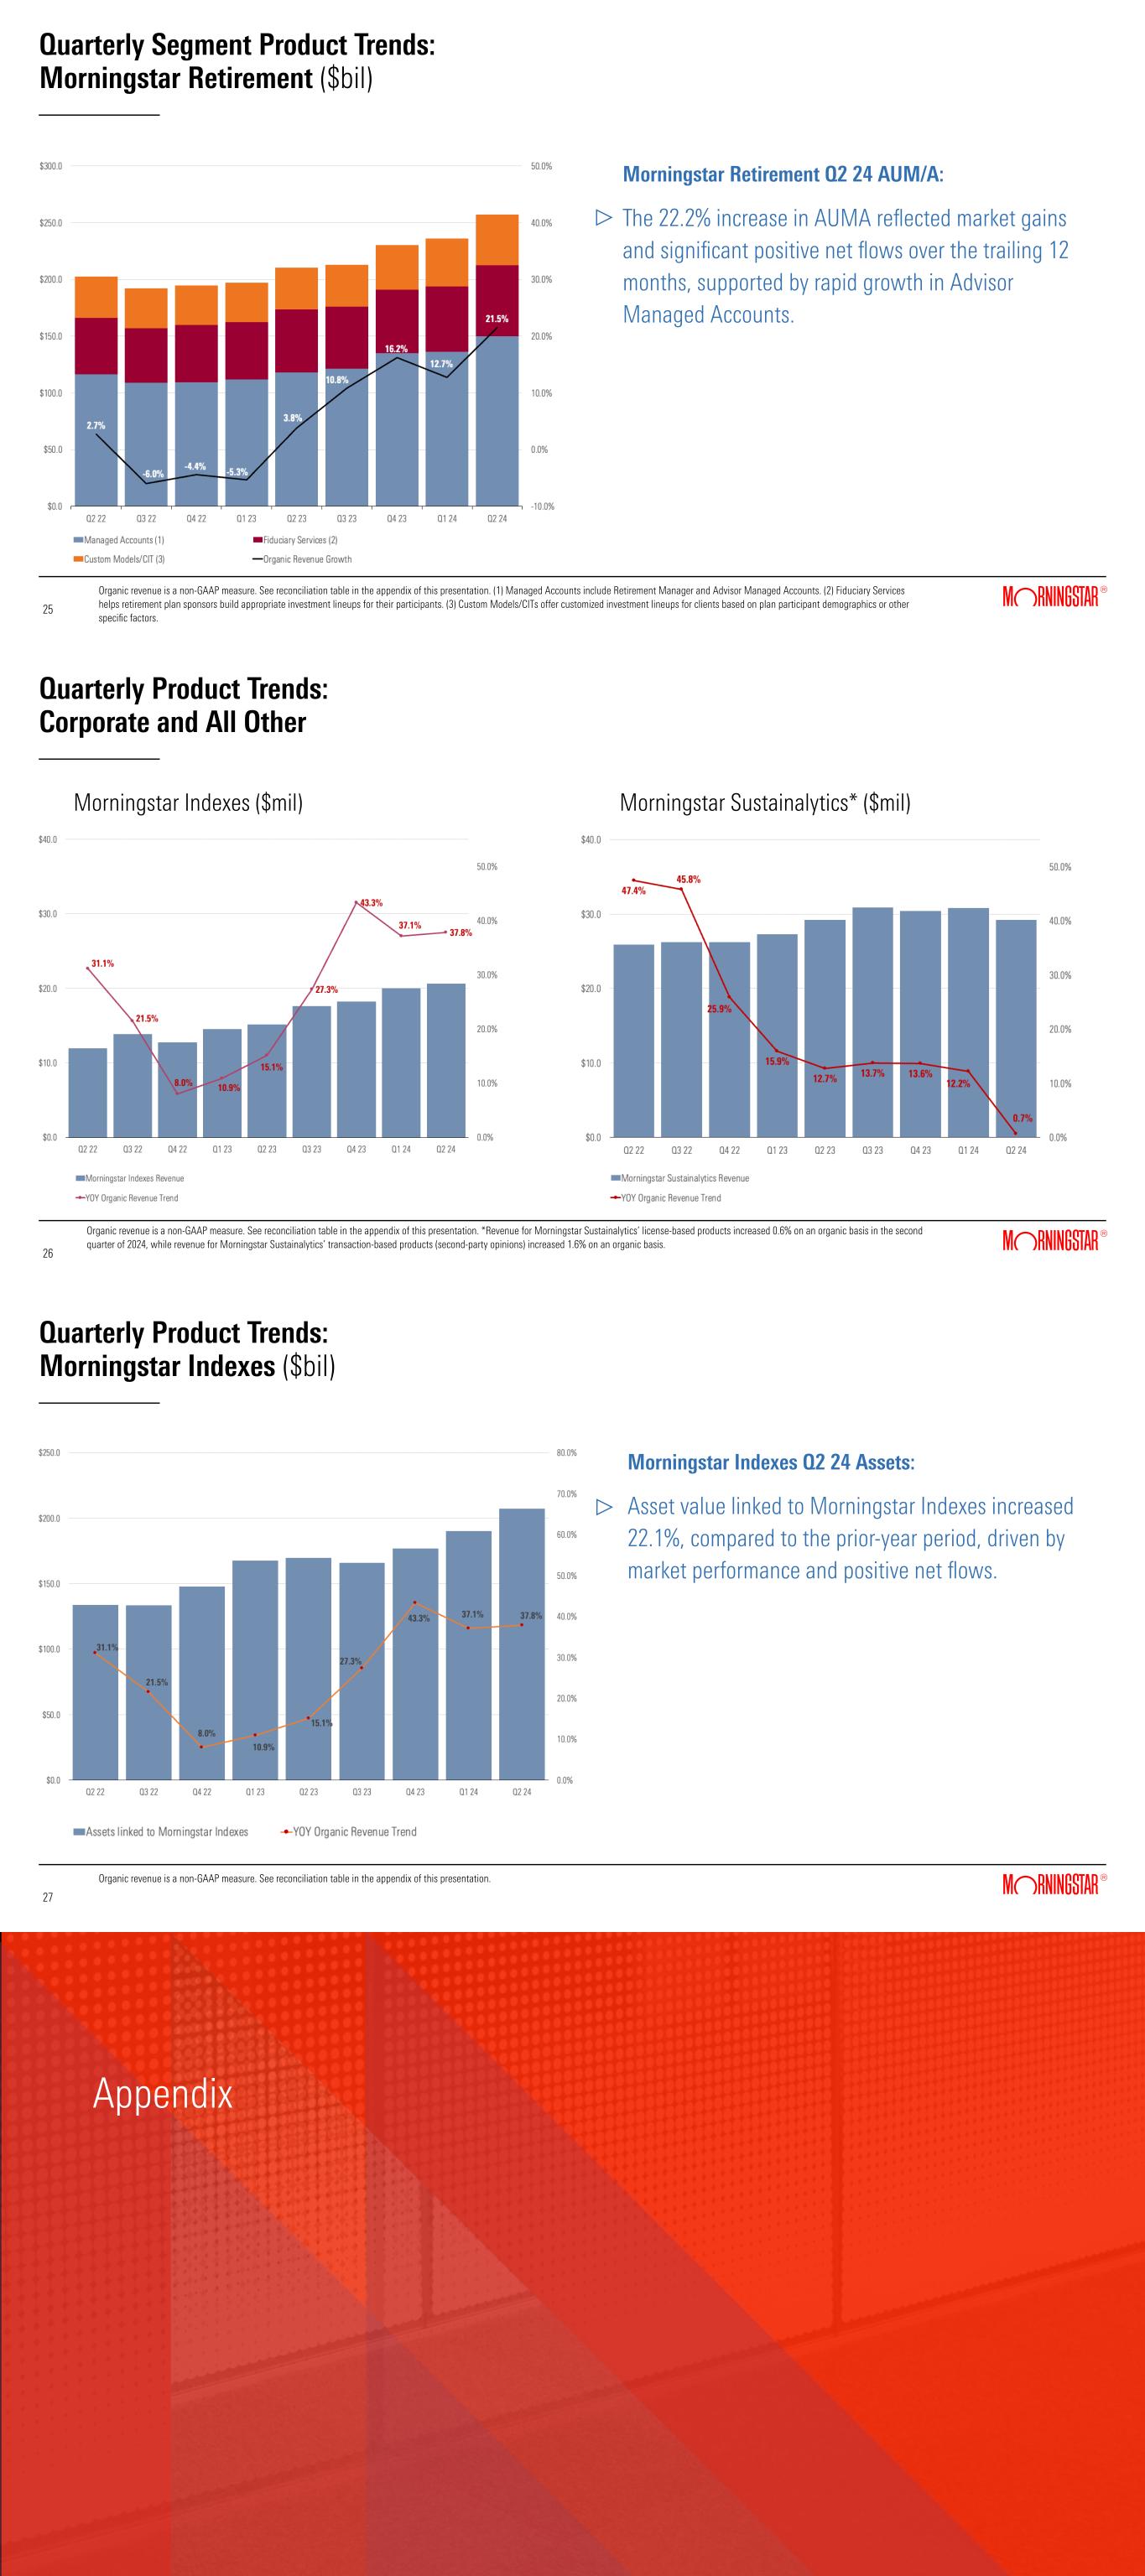
Morningstar Retirement Q2 24 AUM/A: The 22.2% increase in AUMA reflected market gains and significant positive net flows over the trailing 12 months, supported by rapid growth in Advisor Managed Accounts. Quarterly Segment Product Trends: Morningstar Retirement ($bil) Organic revenue is a non-GAAP measure. See reconciliation table in the appendix of this presentation. (1) Managed Accounts include Retirement Manager and Advisor Managed Accounts. (2) Fiduciary Services helps retirement plan sponsors build appropriate investment lineups for their participants. (3) Custom Models/CITs offer customized investment lineups for clients based on plan participant demographics or other specific factors. 25 25 Quarterly Product Trends: Corporate and All Other Morningstar Sustainalytics* ($mil) 26 26 Morningstar Indexes ($mil) Organic revenue is a non-GAAP measure. See reconciliation table in the appendix of this presentation. *Revenue for Morningstar Sustainalytics’ license-based products increased 0.6% on an organic basis in the second quarter of 2024, while revenue for Morningstar Sustainalytics’ transaction-based products (second-party opinions) increased 1.6% on an organic basis. 20 Quarterly Product Trends: Morningstar Indexes ($bil) 27 27 Organic revenue is a non-GAAP measure. See reconciliation table in the appendix of this presentation. Morningstar Indexes Q2 24 Assets: Asset value linked to Morningstar Indexes increased 22.1%, compared to the prior-year period, driven by market performance and positive net flows. Appendix


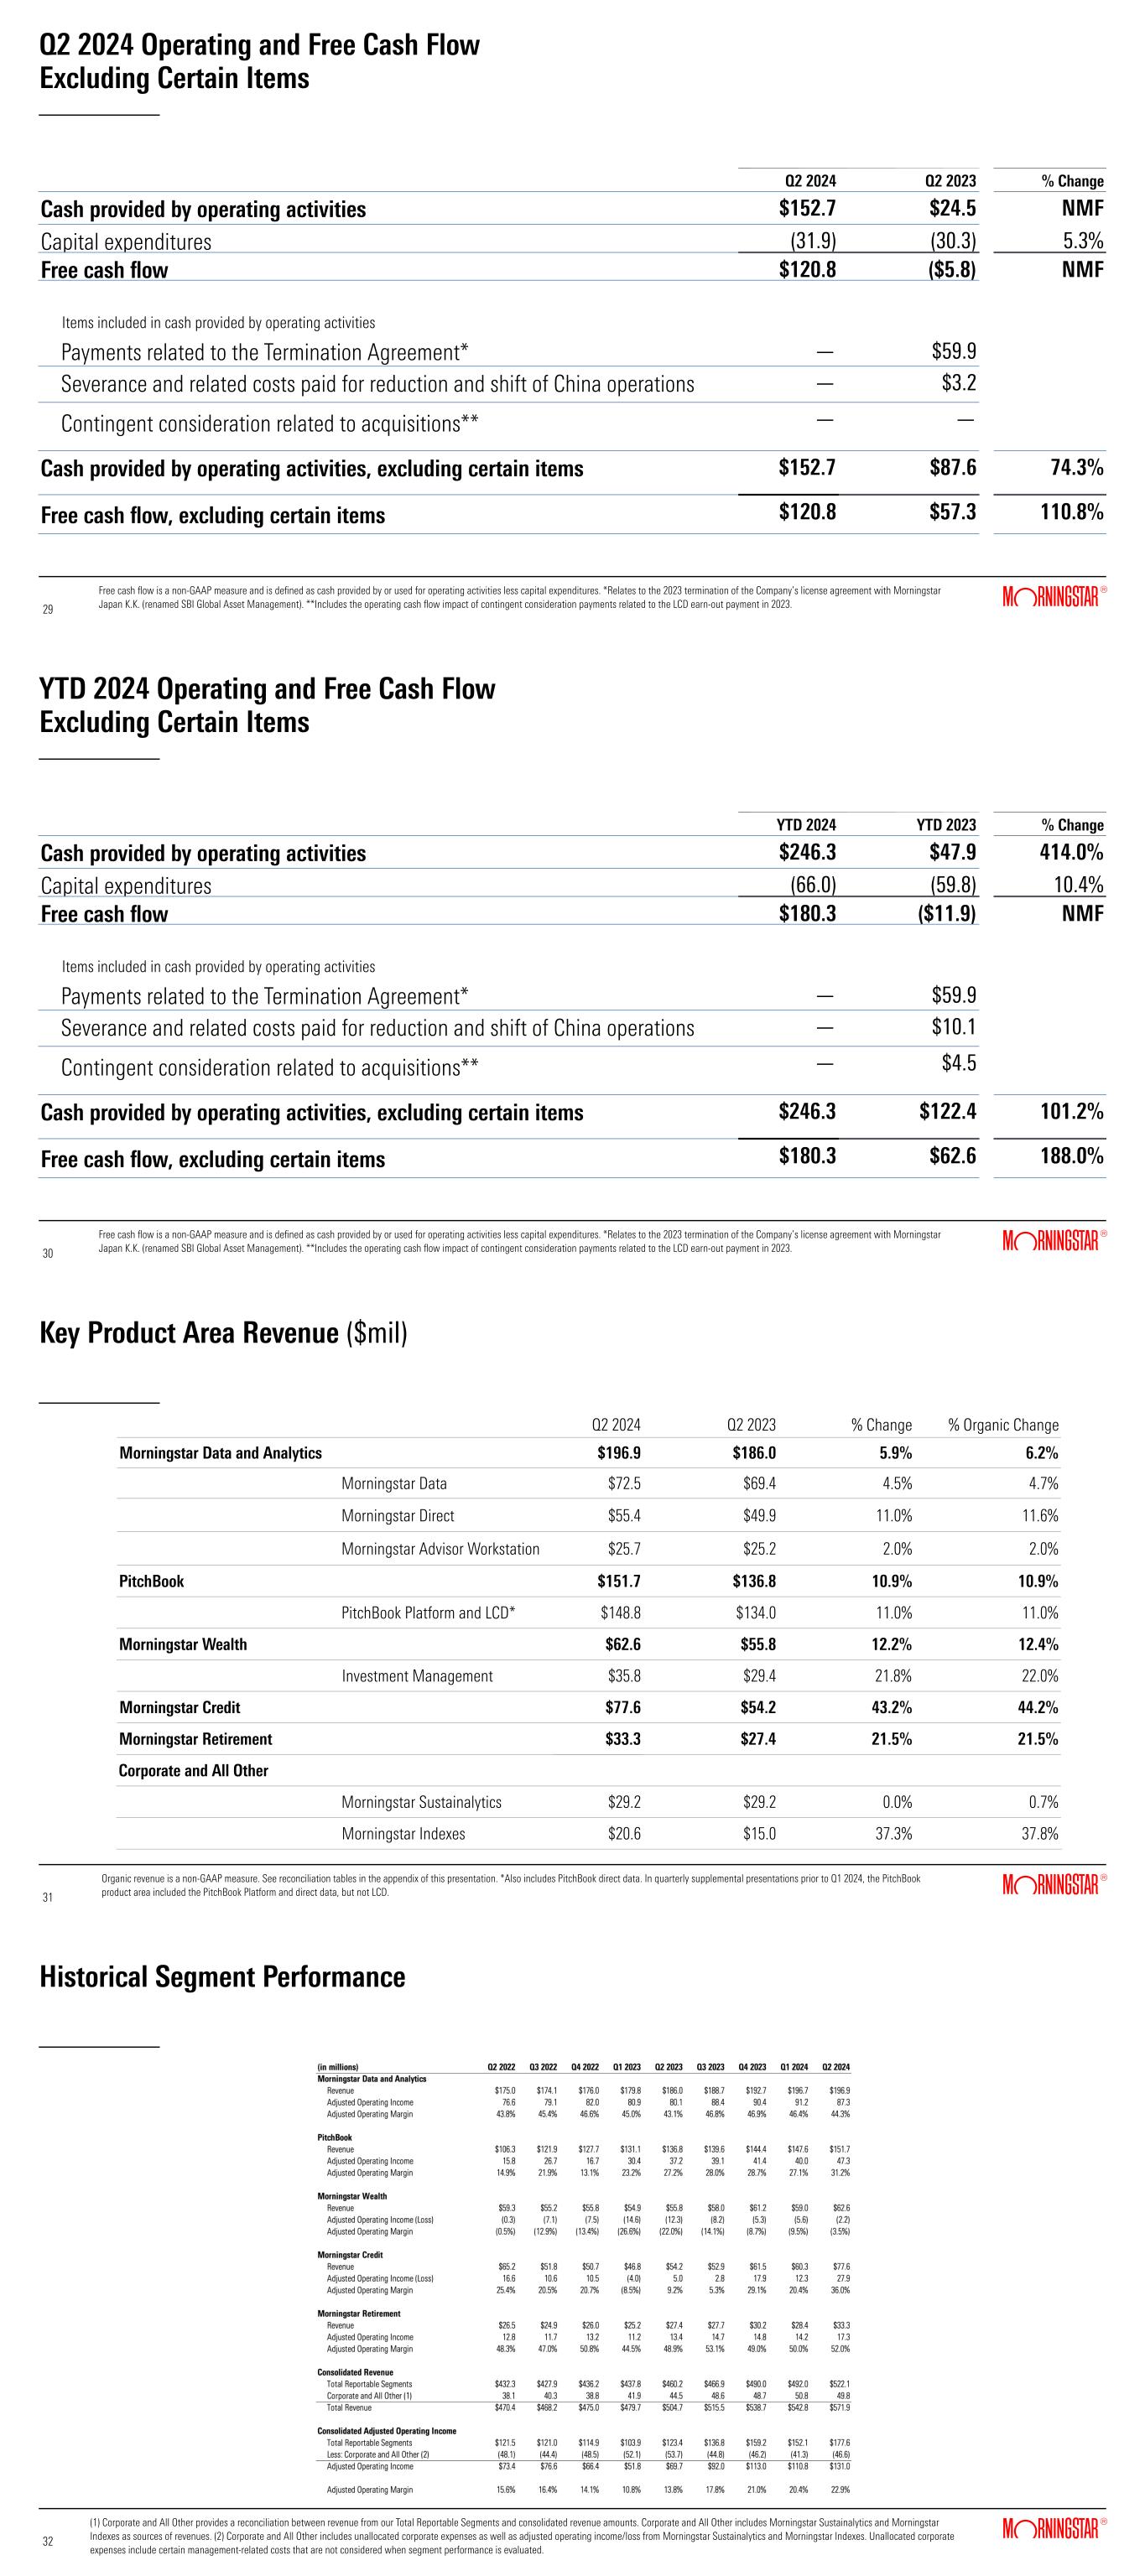
Q2 2024 Operating and Free Cash Flow Excluding Certain Items Free cash flow is a non-GAAP measure and is defined as cash provided by or used for operating activities less capital expenditures. *Relates to the 2023 termination of the Company’s license agreement with Morningstar Japan K.K. (renamed SBI Global Asset Management). **Includes the operating cash flow impact of contingent consideration payments related to the LCD earn-out payment in 2023. Q2 2024 Q2 2023 % Change Cash provided by operating activities $152.7 $24.5 NMF Capital expenditures (31.9) (30.3) 5.3% Free cash flow $120.8 ($5.8) NMF Items included in cash provided by operating activities Payments related to the Termination Agreement* — $59.9 Severance and related costs paid for reduction and shift of China operations S — $3.2 Contingent consideration related to acquisitions** — — Cash provided by operating activities, excluding certain items $152.7 $87.6 74.3% Free cash flow, excluding certain items $120.8 $57.3 110.8% 29 29 YTD 2024 Operating and Free Cash Flow Excluding Certain Items Free cash flow is a non-GAAP measure and is defined as cash provided by or used for operating activities less capital expenditures. *Relates to the 2023 termination of the Company’s license agreement with Morningstar Japan K.K. (renamed SBI Global Asset Management). **Includes the operating cash flow impact of contingent consideration payments related to the LCD earn-out payment in 2023. YTD 2024 YTD 2023 % Change Cash provided by operating activities $246.3 $47.9 414.0% Capital expenditures (66.0) (59.8) 10.4% Free cash flow $180.3 ($11.9) NMF Items included in cash provided by operating activities Payments related to the Termination Agreement* — $59.9 Severance and related costs paid for reduction and shift of China operations S — $10.1 Contingent consideration related to acquisitions** — $4.5 Cash provided by operating activities, excluding certain items $246.3 $122.4 101.2% Free cash flow, excluding certain items $180.3 $62.6 188.0% 30 30 Key Product Area Revenue ($mil) 31 31 Q2 2024 Q2 2023 % Change % Organic Change Morningstar Data and Analytics $196.9 $186.0 5.9% 6.2% Morningstar Data $72.5 $69.4 4.5% 4.7% Morningstar Direct $55.4 $49.9 11.0% 11.6% Morningstar Advisor Workstation $25.7 $25.2 2.0% 2.0% PitchBook $151.7 $136.8 10.9% 10.9% PitchBook Platform and LCD* $148.8 $134.0 11.0% 11.0% Morningstar Wealth $62.6 $55.8 12.2% 12.4% Investment Management $35.8 $29.4 21.8% 22.0% Morningstar Credit $77.6 $54.2 43.2% 44.2% Morningstar Retirement $33.3 $27.4 21.5% 21.5% Corporate and All Other Morningstar Sustainalytics $29.2 $29.2 0.0% 0.7% Morningstar Indexes $20.6 $15.0 37.3% 37.8% Organic revenue is a non-GAAP measure. See reconciliation tables in the appendix of this presentation. *Also includes PitchBook direct data. In quarterly supplemental presentations prior to Q1 2024, the PitchBook product area included the PitchBook Platform and direct data, but not LCD. 32 32 Historical Segment Performance (1) Corporate and All Other provides a reconciliation between revenue from our Total Reportable Segments and consolidated revenue amounts. Corporate and All Other includes Morningstar Sustainalytics and Morningstar Indexes as sources of revenues. (2) Corporate and All Other includes unallocated corporate expenses as well as adjusted operating income/loss from Morningstar Sustainalytics and Morningstar Indexes. Unallocated corporate expenses include certain management-related costs that are not considered when segment performance is evaluated.


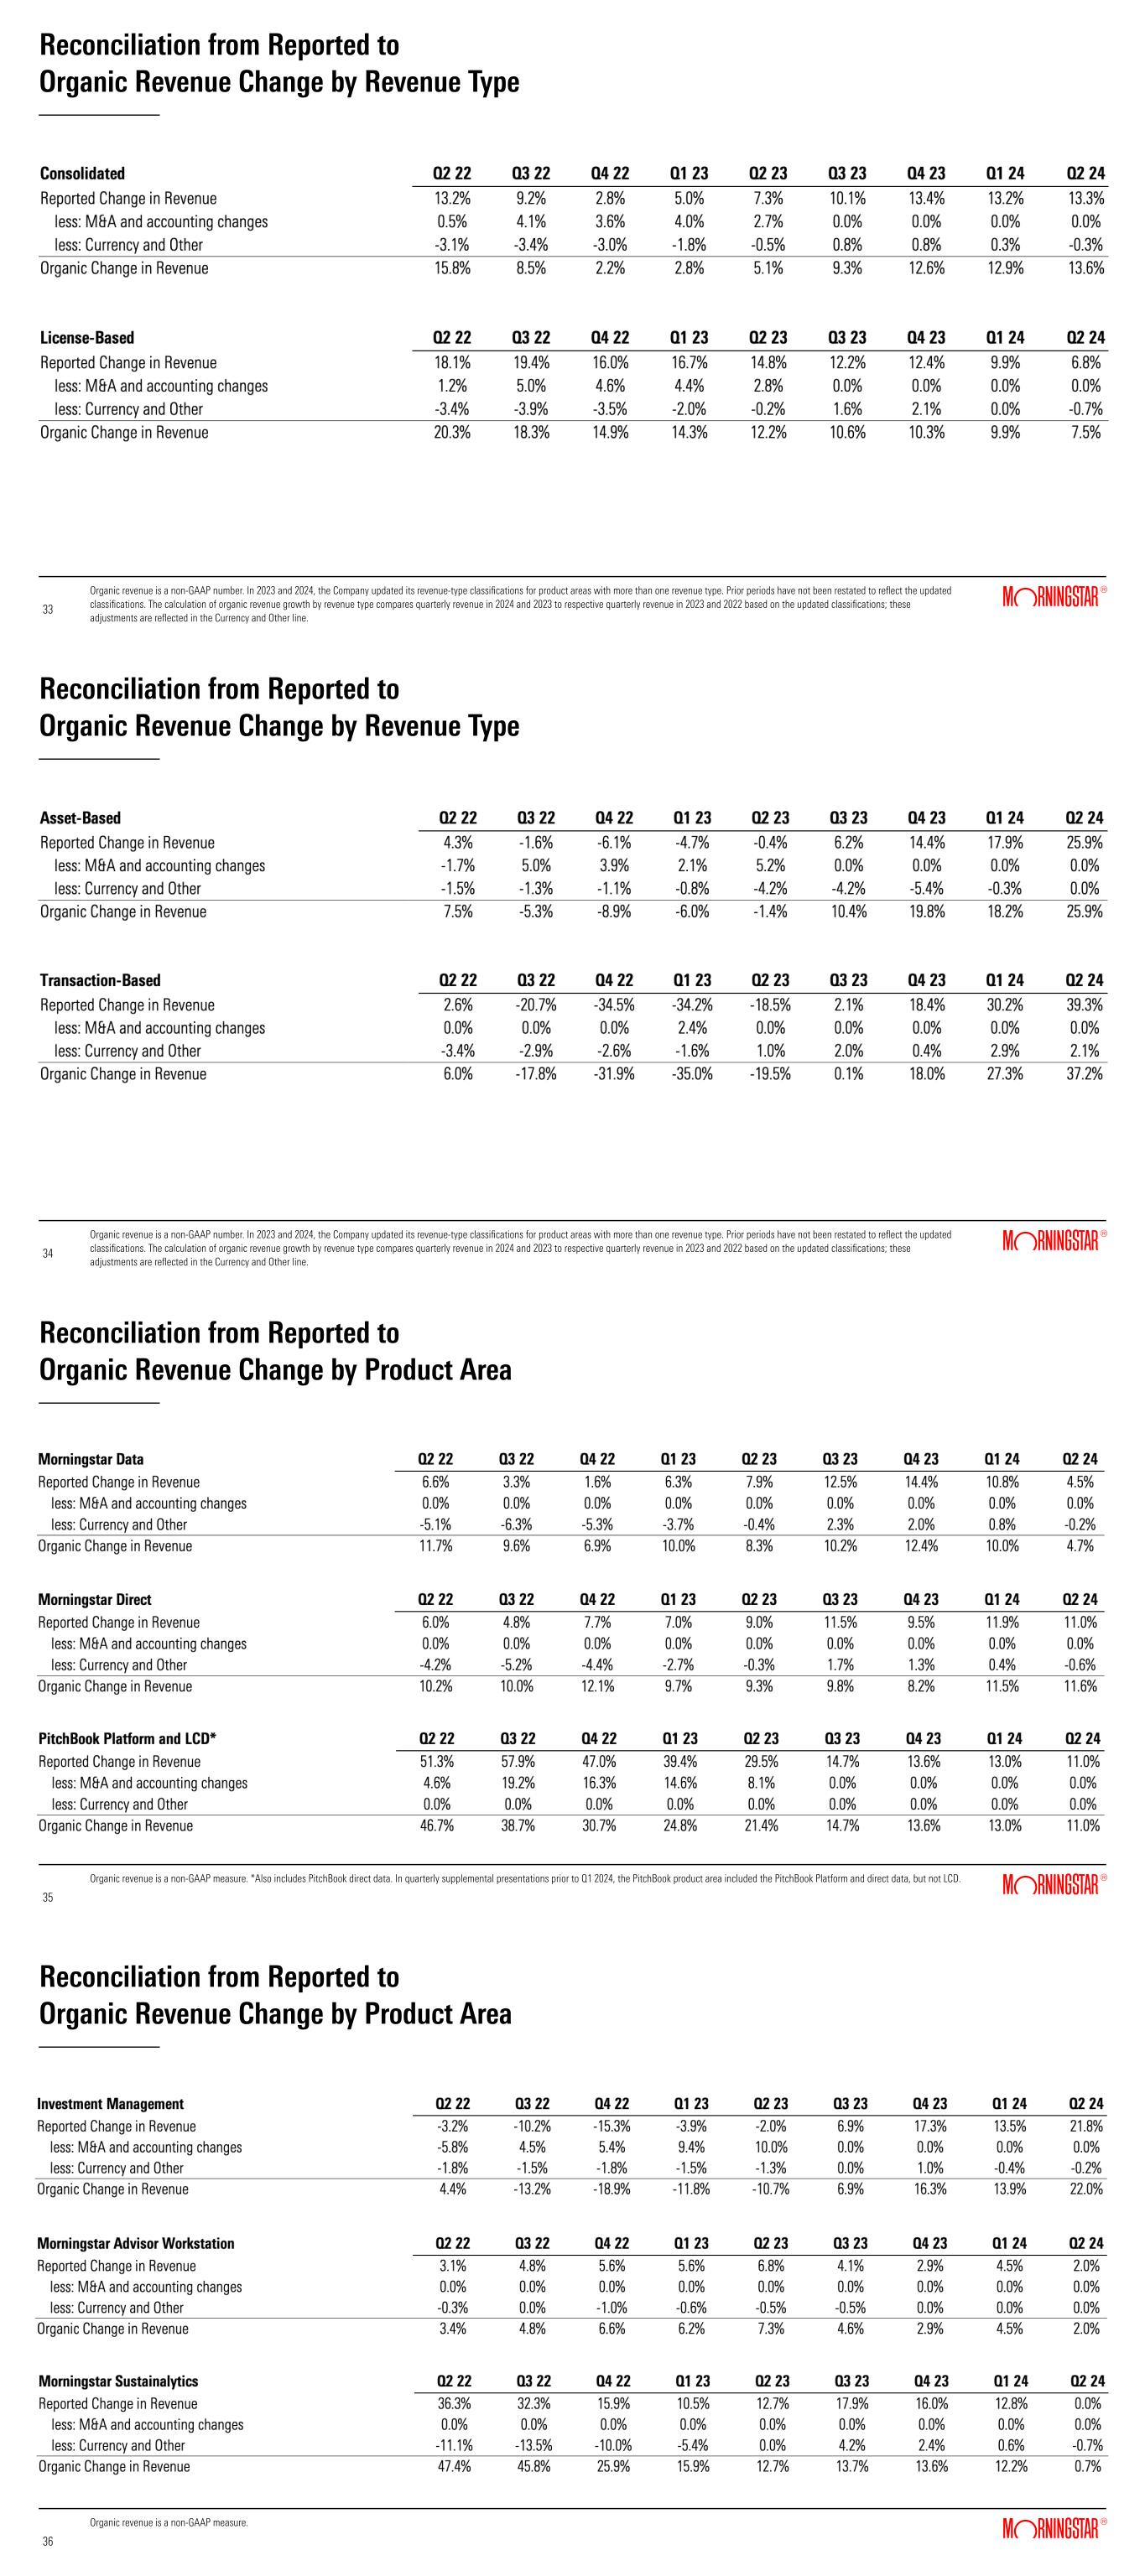
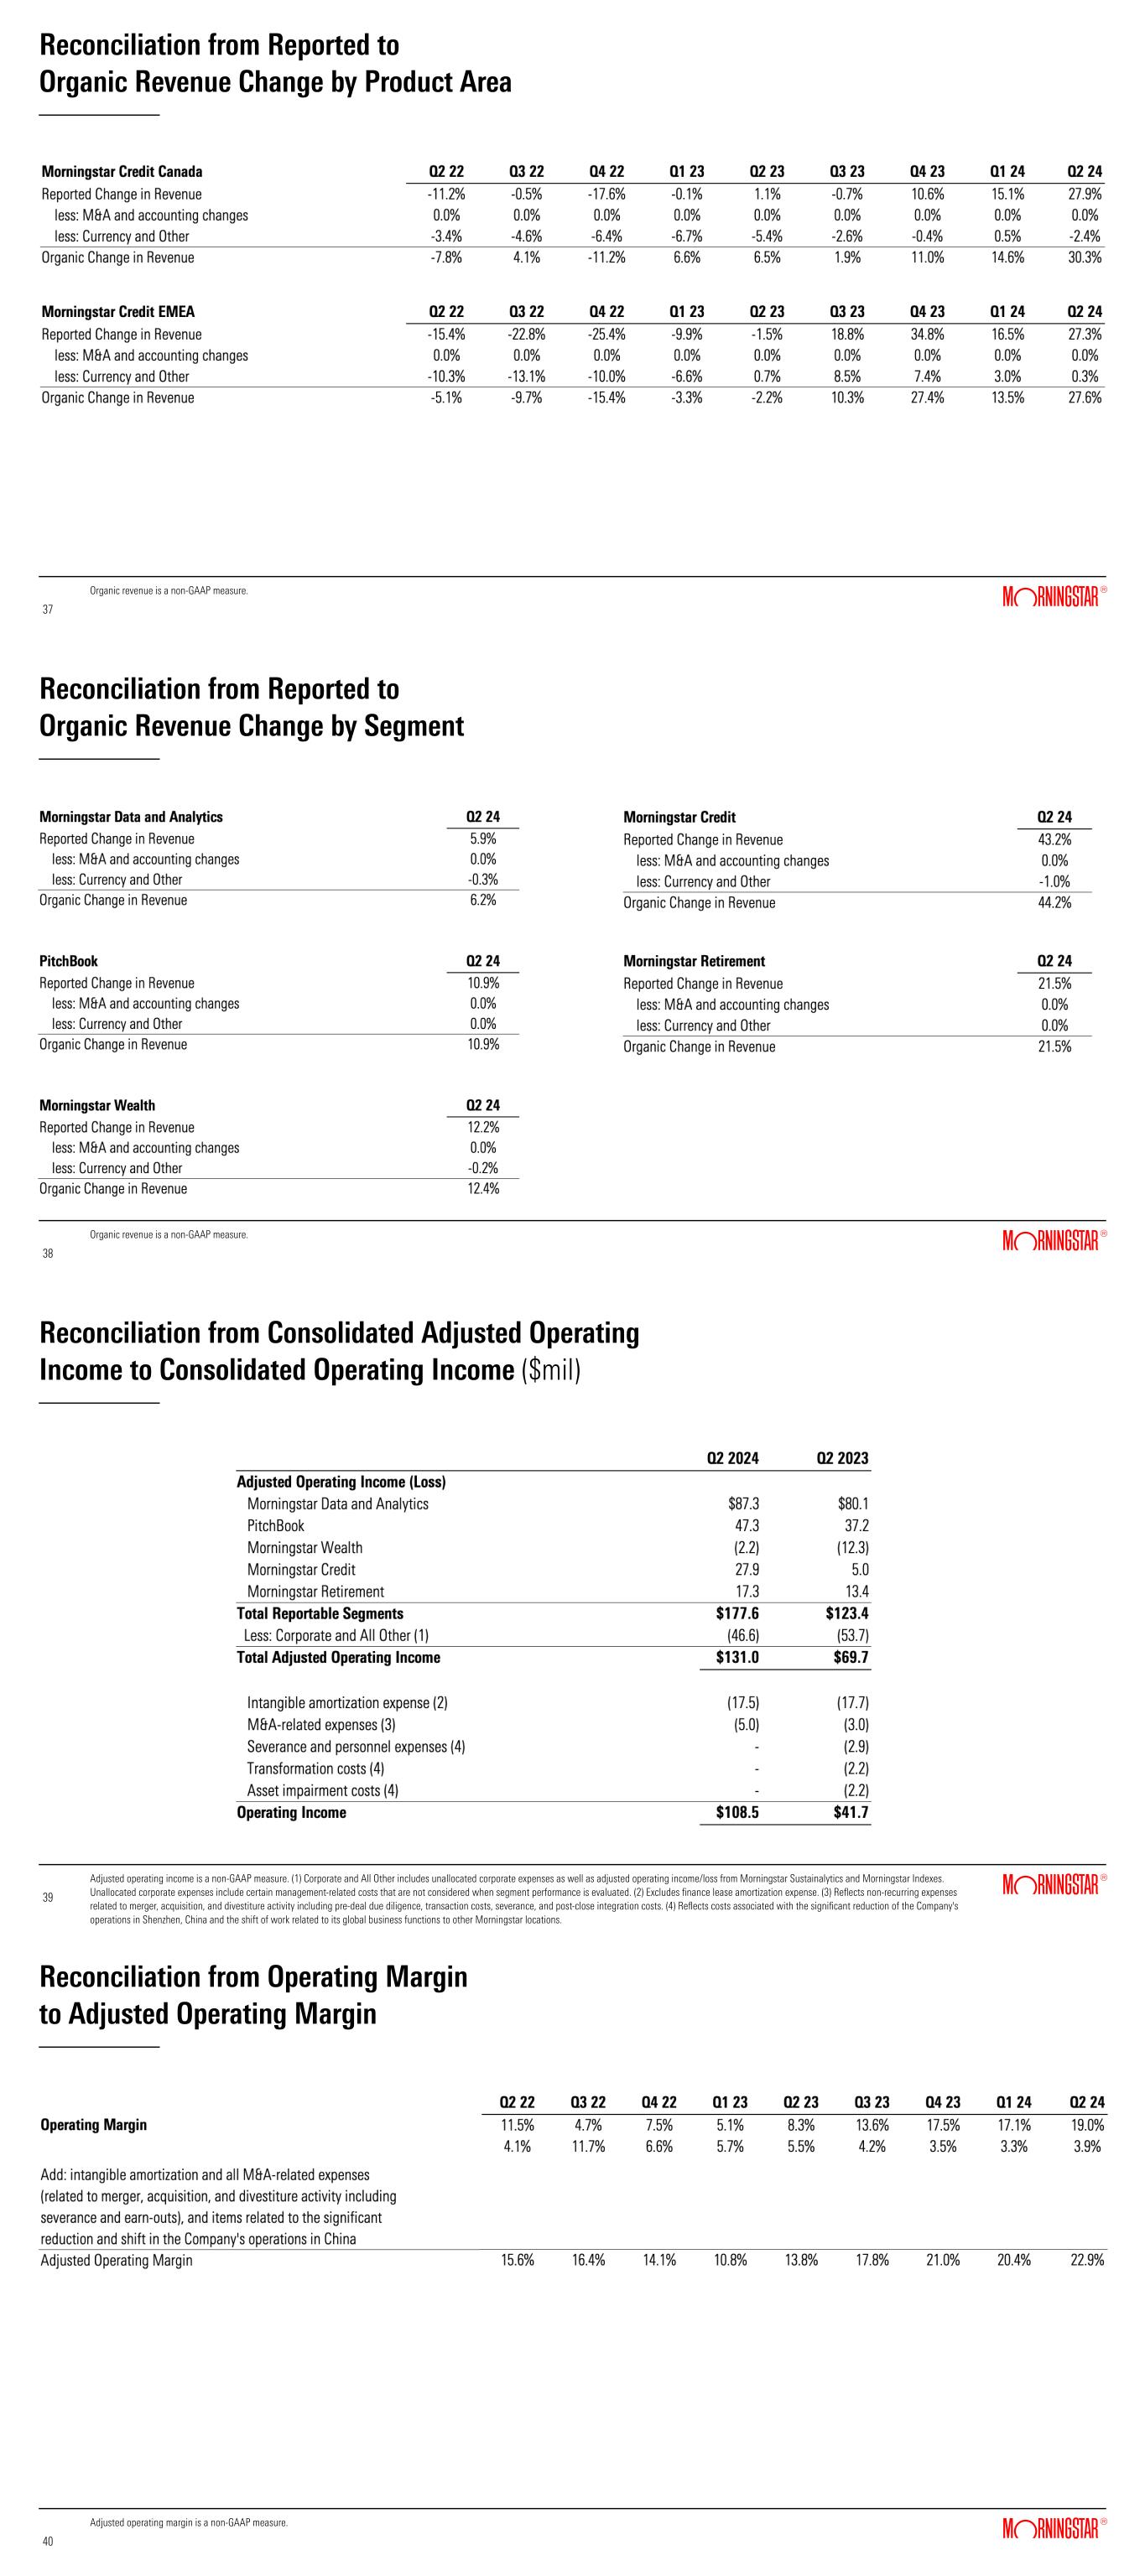
Reconciliation from Reported to Organic Revenue Change by Revenue Type 33 33 Organic revenue is a non-GAAP number. In 2023 and 2024, the Company updated its revenue-type classifications for product areas with more than one revenue type. Prior periods have not been restated to reflect the updated classifications. The calculation of organic revenue growth by revenue type compares quarterly revenue in 2024 and 2023 to respective quarterly revenue in 2023 and 2022 based on the updated classifications; these adjustments are reflected in the Currency and Other line. Reconciliation from Reported to Organic Revenue Change by Revenue Type 34 34 Organic revenue is a non-GAAP number. In 2023 and 2024, the Company updated its revenue-type classifications for product areas with more than one revenue type. Prior periods have not been restated to reflect the updated classifications. The calculation of organic revenue growth by revenue type compares quarterly revenue in 2024 and 2023 to respective quarterly revenue in 2023 and 2022 based on the updated classifications; these adjustments are reflected in the Currency and Other line. Reconciliation from Reported to Organic Revenue Change by Product Area 35 35 Organic revenue is a non-GAAP measure. *Also includes PitchBook direct data. In quarterly supplemental presentations prior to Q1 2024, the PitchBook product area included the PitchBook Platform and direct data, but not LCD. Reconciliation from Reported to Organic Revenue Change by Product Area 36 36 Organic revenue is a non-GAAP measure.


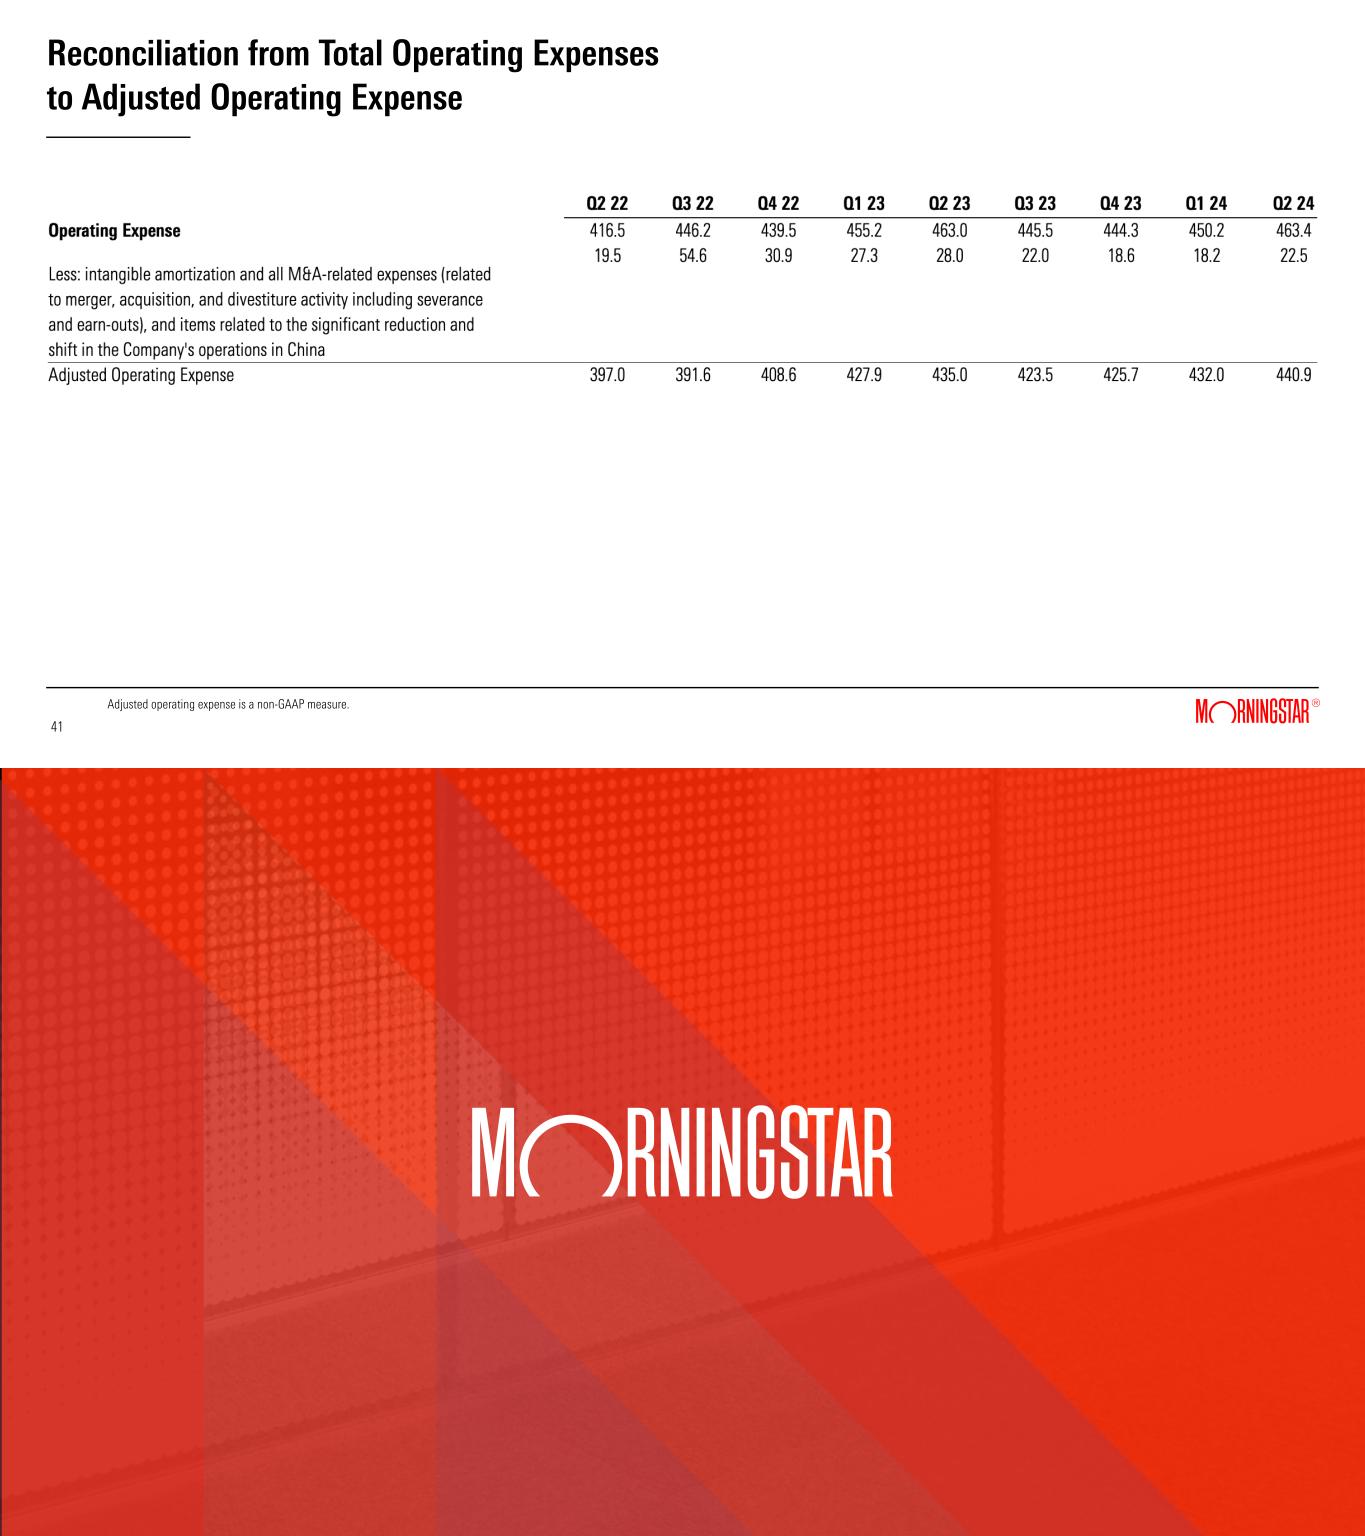
Reconciliation from Reported to Organic Revenue Change by Product Area 37 37 Organic revenue is a non-GAAP measure. 38 38 Reconciliation from Reported to Organic Revenue Change by Segment Organic revenue is a non-GAAP measure. Reconciliation from Consolidated Adjusted Operating Income to Consolidated Operating Income ($mil) 39 39 Adjusted operating income is a non-GAAP measure. (1) Corporate and All Other includes unallocated corporate expenses as well as adjusted operating income/loss from Morningstar Sustainalytics and Morningstar Indexes. Unallocated corporate expenses include certain management-related costs that are not considered when segment performance is evaluated. (2) Excludes finance lease amortization expense. (3) Reflects non-recurring expenses related to merger, acquisition, and divestiture activity including pre-deal due diligence, transaction costs, severance, and post-close integration costs. (4) Reflects costs associated with the significant reduction of the Company's operations in Shenzhen, China and the shift of work related to its global business functions to other Morningstar locations. Reconciliation from Operating Margin to Adjusted Operating Margin 40 40 Adjusted operating margin is a non-GAAP measure.


Reconciliation from Total Operating Expenses to Adjusted Operating Expense 41 41 Adjusted operating expense is a non-GAAP measure.


EX-99.3 4 shareholderletter-q224fi.htm EX-99.3 shareholderletter-q224fi
© July 24, 2024. Morningstar. All Rights Reserved. Letter from CEO Kunal Kapoor Second-Quarter Earnings 2024 Dear Morningstar shareholders, In the second quarter of 2024, revenue increased 13.3%, or 13.6% on an organic basis. Operating margins and cash flow grew significantly compared to the prior-year period. A Rebound in Credit Issuance We saw growth across our business segments in the quarter, led by Morningstar Credit. Ratings revenue increased across geographies and asset classes as issuance surged in an environment of relatively stable spreads. Morningstar Credit also continues to benefit from investments we made in 2023 to expand our analytical capabilities, including in certain parts of the asset-backed securities market, private corporate ratings, and data products. PitchBook and Morningstar Data and Analytics also fueled growth. For PitchBook, the headlines were strength in core client segments and weaker performance in smaller corporates with more limited use cases. PitchBook’s overall growth tends to align with trends in private capital, and we’ve seen headwinds there with private capital raised falling 7.2% in the 12 months ended March 2024. (Read more about these trends in PitchBook’s Global Private Market Fundraising Report.) At a time when others are waking up to the convergence of public and private markets, we are confident in our ability to keep leading in the space. We’ve got a great core product in the PitchBook Platform with ever-increasing data and content across public and private markets, including expanded private credit news, data, and analytics from our Leveraged Commentary & Data capability. In the past quarter, we added collateralized loan obligation data, business development company data, and credit amendments to the platform. As of June, we’re seeing some of our highest renewal rates with credit investors and participants. That’s a still small segment for us, but one in which we expect to keep growing. With continued strength in equity markets, both Morningstar Wealth and Morningstar Retirement grew nicely. In the case of Morningstar Wealth, we’re seeing growth driven by strategist models offered on third-party platforms and our International Wealth Platform. We’ve sharpened our focus on these areas as we embark on our strategic alliance with AssetMark, which I’ll describe in more detail below. Morningstar Sustainalytics was relatively flat compared to the prior-year quarter for both its license- and transaction-based products, although year-to- date results for second-party opinions remain strong. Regulatory use cases and demand from institutional clients in Europe were positives, offset by cancellations due to vendor consolidation and softness in parts of the asset management and wealth client segments. The teams continue to do the hard work of evolving our products to meet the client need, with second quarter updates to our flagship ESG Risk Ratings and our Low Carbon Transition Rating. We’re also focused on streamlining our corporate solutions product portfolio, specifically the licensed ratings product, contributing to softness in the quarter. Rounding out the revenue picture, Morningstar Indexes had another strong quarter, benefiting from both market gains and positive net flows. Turning to expenses, we’re sticking to our discipline in managing costs, which supported increased profitability in the quarter. Operating income increased 160.2% to $108.5 million and adjusted operating income increased 87.9% to $131.0 million, compared to the prior-year period. Operating margin increased from 8.3% to 19.0%, and adjusted operating margin increased 13.8% to 22.9%. We remain focused on driving durable growth in adjusted operating income. Our increased profitability supported higher operating and free cash flows during the quarter. We reduced outstanding debt by $50.0 million and paid a dividend of 40.5 cents per share, or $17.3 million, in the quarter. Strategic Alliance with AssetMark In June, we announced that we will enter a strategic alliance with AssetMark and sunset our U.S. TAMP, also known as a turnkey asset management program. To help frame the rationale for this transaction, I’ll start with a quick summary of our current Managed Portfolios offering, which is our flagship Investment Management product within the Morningstar Wealth segment. We serve fee-based independent advisors who hire us to manage their


Letter from CEO Kunal Kapoor Second-Quarter Earnings 2024 © July 24, 2024. Morningstar. All Rights Reserved. clients’ assets in professionally managed portfolios using mutual funds, ETFs, and individual securities. Today, advisors in the U.S. can access Morningstar Managed Portfolios via our TAMP’s web-based advisor portal as well as on third-party platforms. In addition to investment strategies, our TAMP offers advisors a variety of tools, information, and workflows such as risk questionnaires, proposal generation, digital investment account opening, and it handles back-office work such as trading, billing, and reconciliation on behalf of the advisor. In turn, advisors free up time to deepen relationships with their clients and grow their business. We receive an asset-management fee for assets in Morningstar Managed Portfolios and an additional platform fee for investors who access Managed Portfolios via our TAMP. In the transaction, AssetMark will acquire approximately $12 billion in assets on our TAMP. Once the transition is complete, advisors and clients on Morningstar’s TAMP will have access to AssetMark’s platform, which is viewed as one of the industry’s best, and Morningstar Managed Portfolios will be newly offered on the AssetMark platform. We will be working closely with our clients to make the transition and expect that the vast majority of our current clients will continue to use Morningstar Managed Portfolios. At closing, we expect to receive $65 million, subject to the value of assets being assigned. We also have the potential to receive an additional post-closing payment tied to the successful transition of clients and assets to the AssetMark platform through the first anniversary of closing, which would total roughly $35 million assuming current asset values. We’re entering this transaction for a couple of reasons. Frankly, we weren’t getting to scale quickly enough with the TAMP, which operates in a highly competitive space. A key part of our investment process is to assess whether our plans are generating the results we expected. As investment timelines stretched out and we incurred significant costs to maintain and improve the TAMP, we decided that it didn’t make sense to continue to commit resources here. Although there will be an initial revenue and margin hit in Morningstar Wealth from the lost platform fees and maintaining costs to support a successful transition, we currently expect that once completed, the transaction will have a positive run-rate impact on adjusted operating income, an important step in our plan to get Morningstar Wealth to profitable growth. We’re also excited about the expanded distribution of Morningstar Managed Portfolios to AssetMark’s advisors, most of whom don’t use our TAMP today. We believe that the best way to scale the business in the U.S. is to reach more clients with our products, leaning into the parts of the advisor workflow where we believe that Morningstar’s data and research add the most value. We’re excited about the potential for our alliance with AssetMark, and I want to thank CEO Michael Kim and his team for the spirit in which they have approached our work together. We have high hopes for a successful long-term relationship. As we sunset the TAMP, our Managed Portfolios and our International Wealth Platform will continue to represent important parts of our broader offering. We see a strong secular growth opportunity for these products as household wealth continues to grow with expanded usage of managed accounts. And, in contrast to what we were seeing in the U.S., in the U.K, our International Wealth Platform is gaining market share and is an important growth driver for Managed Portfolios. The bottom line is that we remain committed to empowering advisor workflows through these solutions, our branded software, data, research and ratings, and Morningstar Retirement’s advisor managed accounts. For more on the AssetMark transaction, please review our updated Investor FAQs, which include responses to questions we’ve received since the announcement. Leadership Transition There’s no denying that we will miss PitchBook founder John Gabbert. He was especially talented at establishing a vision and making it happen. Part of that involved building a terrific team, and he leaves behind a top-notch group who are working hard to make sure we don’t skip a beat. Rod Diefendorf, PitchBook’s Chief Operating Officer since 2016, is now at the helm after a very natural transition. Among Rod’s many skills is his ability to think about all stakeholders—internal and external—and he brings a level of vigor to the organization that is palpable. Rod is also a disciple of the “Rule of 40” if you want a sense for how he thinks about measuring financial success. Congrats to Rod on joining the Morningstar leadership team, and a big thanks to John for all he contributed. I know he is cheering the team on from the sidelines.


Letter from CEO Kunal Kapoor Second-Quarter Earnings 2024 © July 24, 2024. Morningstar. All Rights Reserved. What I'm Reading Here’s recent commentary by our researchers that I especially enjoyed: • Global Sustainable Fund Flows: Q2 2024 in Review, Hortense Bioy, July 22, 2024 • Fund Fees Are Still Declining—but at a Slower Pace, Zachary Evens, July 9, 2024 • Q2 In Review and Q3 2024 Market Outlook, Tom Lauricella, July 1, 2024 • Active ETFs: What Investors Need to Know, Bryan Armour, Daniel Sotiroff, Ryan Jackson, and Sarah Hansen, June 28, 2024 • Launch Report: Pharmatech, Kazi Helal, June 27, 2024 • Interval Funds: Are They Worth What You Give Up?, Brian Moriarty, June 24, 2024 • Launch Report: Pharma Services, Rebecca Springer, June 18, 2024 • A Closer Look at Private Credit Covenant Relief, Morningstar DBRS, June 17, 2024 • Is Vanguard Changing Course?, Daniel Sotiroff and Susan Dziubinski, June 12, 2024 • Voice of the Asset Owner Survey 2024: Qualitative Insights, Thomas Kuh, June 4, 2024 • Navigating the Client Lifecycle in Financial Advice, Danielle Labotka, Samantha Lamas, and Ryan Murphy, June 2024 • Technology Observer: Connecting Generative AI to Rapid Networking Growth: Patient Investors Should See Long-Term Opportunities, William Kerwin and Brian Colello, June 2024 • Never Mind Market Efficiency: Are the Markets Sensible?, John Rekenthaler, May 13, 2024 • Home Equity Investments—A Primer, Morningstar DBRS, April 26, 2024 You may also appreciate these recent pieces that share more about our strategy and product innovations: • Morningstar CEO Kunal Kapoor on AI, Investing, and Company Culture, Barron’s Advisor, July 16, 2024 • Conference Sponsorships Ain't Cheap, but Connections? 'Invaluable', Ignites, July 1, 2024 • Morningstar CEO Kunal Kapoor: ‘Evolve Ahead’, Morningstar, June 27, 2024 • AssetMark to Snap Up Multibillion-Dollar TAMP Business from Morningstar, InvestmentNews, June 20, 2024 • Morningstar Throws Down Gauntlet to Chant West, SuperRatings, Investment Magazine, May 29, 2024 • Futurizing Financial Data: Morningstar CTO James Rhodes Talks Architecture Modernization, Client Personalization, and the Company’s AI Chatbot ‘Mo’, “Technovation” Podcast, May 2, 2024 • 'Increased Regulation Barrier to Entrants in Advice Space', FT Adviser, May 1, 2024 Best regards, Kunal


Letter from CEO Kunal Kapoor Second-Quarter Earnings 2024 © July 24, 2024. Morningstar. All Rights Reserved. This letter contains forward-looking statements within the meaning of the Private Securities Litigation Reform Act of 1995. These statements are based on our current expectations about future events or future financial performance. Forward-looking statements by their nature address matters that are, to different degrees, uncertain, and often contain words such as “may,” “could,” “expect,” “intend,” “plan,” “seek,” “anticipate,” “believe,” “will,” “estimate,” “predict,” “potential,” “prospects,” or “continue.” These statements involve known and unknown risks and uncertainties that may cause the events we discuss not to occur or to differ significantly from what we expect. More information about factors that could affect Morningstar’s business and financial results are in our filings with the SEC, including our most recent reports on Forms 8-K, 10-K and 10-Q. Morningstar undertakes no obligation to publicly update any forward-looking statements as a result of new information, future events, or otherwise, except as required by law. In addition, this letter references non-GAAP financial measures including, but not limited to, organic revenue, adjusted operating income and adjusted operating margin. These non-GAAP measures may not be comparable to similarly titled measures reported by other companies. A discussion of our second quarter results, including a reconciliation of non-GAAP financial measures to the most directly comparable GAAP financial measures described in this letter, is provided in our earnings release for the three months ended June 30, 2024, which has been furnished to the SEC and is available on our website.


EX-99.4 5 investorfaq-updatedjuly2.htm EX-99.4 investorfaq-updatedjuly2
© 2024 Morningstar. All Rights Reserved. Morningstar Wealth and AssetMark Strategic Alliance Frequently Asked Questions Updated July 24, 2024 What is happening? AssetMark and Morningstar have entered into an agreement in which AssetMark will acquire approximately $12 billion in assets administered on the Morningstar Wealth Turnkey Asset Management Platform (TAMP). Financial advisors and clients on Morningstar Wealth’s TAMP will be able to have their accounts transitioned to AssetMark’s platform, which provides industry-leading service, advisor technology, business consulting, and a carefully curated set of investment strategists. Morningstar Wealth will continue to manage the investment strategies of the transitioned assets on AssetMark’s platform. Financial advisors currently working with AssetMark will gain access to a wide range of model portfolios and SMAs managed by the Morningstar Investment Management team, which has over $290 billion of assets under management and advisement globally. Morningstar Wealth will join the AssetMark platform as a third-party strategist and continue to expand its lineup of investment services that meet the needs of advisors and their clients. Why is Morningstar doing this deal? This alliance allows each party to lean into its relative strengths: Morningstar Wealth in leveraging our data and research to deliver a full spectrum of investment products, and AssetMark in providing clients with a best-in-class advisor experience. The Morningstar Wealth TAMP was launched in 2001. The cost of maintaining and improving it is significant, and scale is important for success. In the U.S., we believe the best way to scale our business is to reach more clients with our investment products, and to allow others like AssetMark to own the technology platform. The alliance is expected to bring our professionally managed investments to more advisors across the U.S. in a way that supports profitable, long-term growth. How is the transaction structured? Under the terms of the agreement, AssetMark will make an upfront payment to Morningstar at closing. Morningstar has the potential to receive an additional payment tied to the transition of clients and assets to the AssetMark platform during the 12-month period post- closing, plus upside opportunities for attracting new assets to the AssetMark platform after that time. What are the Morningstar Wealth product implications? After the transaction closes later this year, we will begin to sunset our U.S. TAMP. We remain committed to Morningstar Wealth as a growth driver for the company over the long term, and our goal is to continue to build assets in investment strategies distributed on third-party platforms as well as on our International Wealth Platform to support the segment’s revenue growth and improved profitability. Other offerings under Morningstar Wealth, including Office, ByAllAccounts, Investor, and international products, will also continue operating as usual. With the transaction, we will have a focused investment management business in the U.S. without the complexity of a legacy platform, which has faced secular headwinds. We’ll also focus on our International Wealth platform, which came out of our 2022 acquisition of Praemium's international operations. In the UK, in particular, we are gaining share as a challenger with growth in line with our expectations. We've also had success cross-selling Morningstar Investment Management products to existing clients on the International Wealth platform, creating a significant opportunity for growth. Why is AssetMark the right fit? We share a common culture and ambition to empower advisor growth and investor success. What is the expected financial impact for the Morningstar Wealth segment? We expect to see a reduction in revenue post-closing from fees related to our TAMP. We also expect to maintain certain operating costs (and incur other one-time costs) through the transition period which will wind down as clients and assets transfer to AssetMark. Once the 12- month transition period has concluded, we expect to see a positive run-rate impact on adjusted operating income for Morningstar Wealth, as planned cost reductions will more than offset lower revenue. How does this change your proposition for advisors and wealth managers? Advisors are central to our mission of empowering investor success. Morningstar has a long history of supporting advisors and wealth managers directly and indirectly to deliver personalized advice through our content, technology, and investment products. Today we serve approximately 300,000* advisors directly through our proprietary data, APIs, investment strategies, or workflow software such as Advisor Workstation, and we serve another estimated 125,000 unique advisors indirectly by integrating our data, strategies, managed accounts, and capabilities with third parties. As we look ahead in North America, we are leaning into the parts of the advisor workflow where we believe the clarity of Morningstar’s data and research intelligence adds the most value. That’s primarily in proposal creation, investment research, investment management, and


Morningstar Wealth and AssetMark Strategic Alliance Frequently Asked Questions © 2024 Morningstar. All Rights Reserved. retirement services. We see good growth opportunities with independent advisors as well as broker dealers in these areas. For other parts of the advisor workflow, we’ve been making it easier to team with third parties, both on our own platform and on others’. Advisor Workstation, for example, recently integrated with iCapital to enable side-by-side reviews of traditional and alternative investments and with Luma Financial Technologies to bring users structured product data and analytics. In the U.S., our newly announced alliance with AssetMark is the latest example of how we’re teaming up to support other parts of the advice journey. In our international markets, we will do all this but also continue to operate and invest in the fast-growing International Wealth Platform to support advisors’ end-to-end workflow. What is the purchase price and total consideration for the transaction? Under the terms of the agreement, AssetMark will make an upfront payment to Morningstar at closing. That payment will be determined by the value of TAMP assets being assigned at closing. If assets are above a minimum threshold, Morningstar will receive $65 million. That amount is subject to a downward revision, with a floor, if closing asset value is below the threshold. As of June 30, the expected value of the assets being transferred exceeds this minimum threshold. Morningstar has the potential to receive an additional post-closing payment tied to the successful transition of clients and assets to the AssetMark platform through the 12-month period following closing. Assuming current asset values, this payment would total approximately $35 million, which is subject to both upward and downward revision. Why is Morningstar not transferring its assets outside the US to a third-party platform? Is there something structurally different in markets outside the US (particularly in the UK) which makes it financially more attractive for Morningstar to continue to run its own wealth platform? We remain committed to our International Wealth Platform. It is a challenger platform that’s gaining market share from larger incumbents in the U.K. and helping to drive flows to Morningstar Managed Portfolios, supporting Morningstar Wealth revenue growth. What is the financial impact of the transaction in 2025 and 2026? We expect to see a reduction in revenue post-closing from fees related to our TAMP. Assuming the transaction closes at the end of 2024 and based on today’s run-rate revenue and assumptions about the transition, we expect a net revenue decline of approximately $13 million in 2025 related to the loss of TAMP revenue offset by interim service fees from AssetMark. As we expect to maintain certain operating costs through the account transition period, we do not expect to fully offset the net revenue loss in 2025. Once the transition period has concluded, we expect to see a positive run-rate impact on adjusted operating income in 2026 for Morningstar Wealth, as planned cost reductions will more than offset lower TAMP revenue after the transition. What fee does Morningstar expect to charge to those clients on the TAMP platform for using its model portfolios via the AssetMark platform going forward? Is this lower than the current average basis point fee in the investment management business? For accounts on the TAMP, we currently charge a platform fee (which covers the services offered on the TAMP) and an investment management fee for investing in Morningstar Managed Portfolios. Following the transition to AssetMark, we’ll receive a negotiated strategist fee associated with assets invested in Morningstar Managed Portfolios but will no longer receive a platform fee. The fee will vary based on the investment strategy and is comparable to strategist fees we collect from other third-party platforms. What is the anticipated impact on Morningstar Wealth’s assets under management and advisement (AUMA)? As of June 30, 2024, TAMP assets totaled slightly more than $12 billion. The total assets transferred to AssetMark at closing and through the end of the transition period will vary depending on net flows and market performance. We include assets invested in our investment strategies offered on third-party platforms in AUMA and assets that are transferred to AssetMark but stay invested in Morningstar Managed Portfolios will continue to be included in the AUMA we report. We will receive a negotiated fee on these assets. *Previously disclosed numbers of advisor clients have not included Direct Compass users or advisors who directly access data or APIs outside of our software products. This document contains forward-looking statements within the meaning of the Private Securities Litigation Reform Act of 1995. These statements are based on our current expectations about future events or future financial performance. Forward- looking statements by their nature address matters that are, to different degrees, uncertain, and often contain words such as “may,” “could,” “expect,” “intend,” “plan,” “seek,” “anticipate,” “believe,” “estimate,” “predict,” “potential,” “prospects,” or “continue.” These statements involve known and unknown risks and uncertainties that may cause the events we discuss not to occur or to differ significantly from what we expect. More information about factors that could affect


Morningstar Wealth and AssetMark Strategic Alliance Frequently Asked Questions © 2024 Morningstar. All Rights Reserved. Morningstar’s business and financial results are in our filings with the SEC, including our most recent reports on Forms 8-K, 10-K and 10-Q. Morningstar undertakes no obligation to publicly update any forward-looking statements as a result of new information, future events, or otherwise, except as required by law.