
| Delaware | 1-33409 | 20-0836269 | ||||||||||||
| (State or other jurisdiction | (Commission File Number) | (I.R.S. Employer | ||||||||||||
of incorporation) |
Identification No.) | |||||||||||||
☐ |
Written communications pursuant to Rule 425 under the Securities Act (17 CFR 230.425) | ||||
☐ |
Soliciting material pursuant to Rule 14a-12 under the Exchange Act (17 CFR 240.14a-12) | ||||
☐ |
Pre-commencement communications pursuant to Rule 14d-2(b) under the Exchange Act (17 CFR 240.14d-2(b)) | ||||
☐ |
Pre-commencement communications pursuant to Rule 13e-4(c) under the Exchange Act (17 CFR 240.13e-4(c)) | ||||
| Title of each class | Trading Symbol | Name of each exchange on which registered | ||||||||||||
| Common Stock, par value $0.00001 per share | TMUS | The NASDAQ Stock Market LLC | ||||||||||||
| Exhibit | Description | |||||||
| 104 | Cover Page Interactive Data File (formatted as inline XBRL and contained in Exhibit 101) | |||||||
| SIGNATURES | |||||||||||
T-MOBILE US, INC. |
|||||||||||
| October 25, 2023 | /s/ Peter Osvaldik | ||||||||||
| Peter Osvaldik Executive Vice President and Chief Financial Officer |
|||||||||||

| Quarter | Nine Months Ended September 30, | ||||||||||||||||||||||||||||
| (in thousands, except churn) | Q3 2023 | Q2 2023 | Q3 2022 | 2023 | 2022 | ||||||||||||||||||||||||
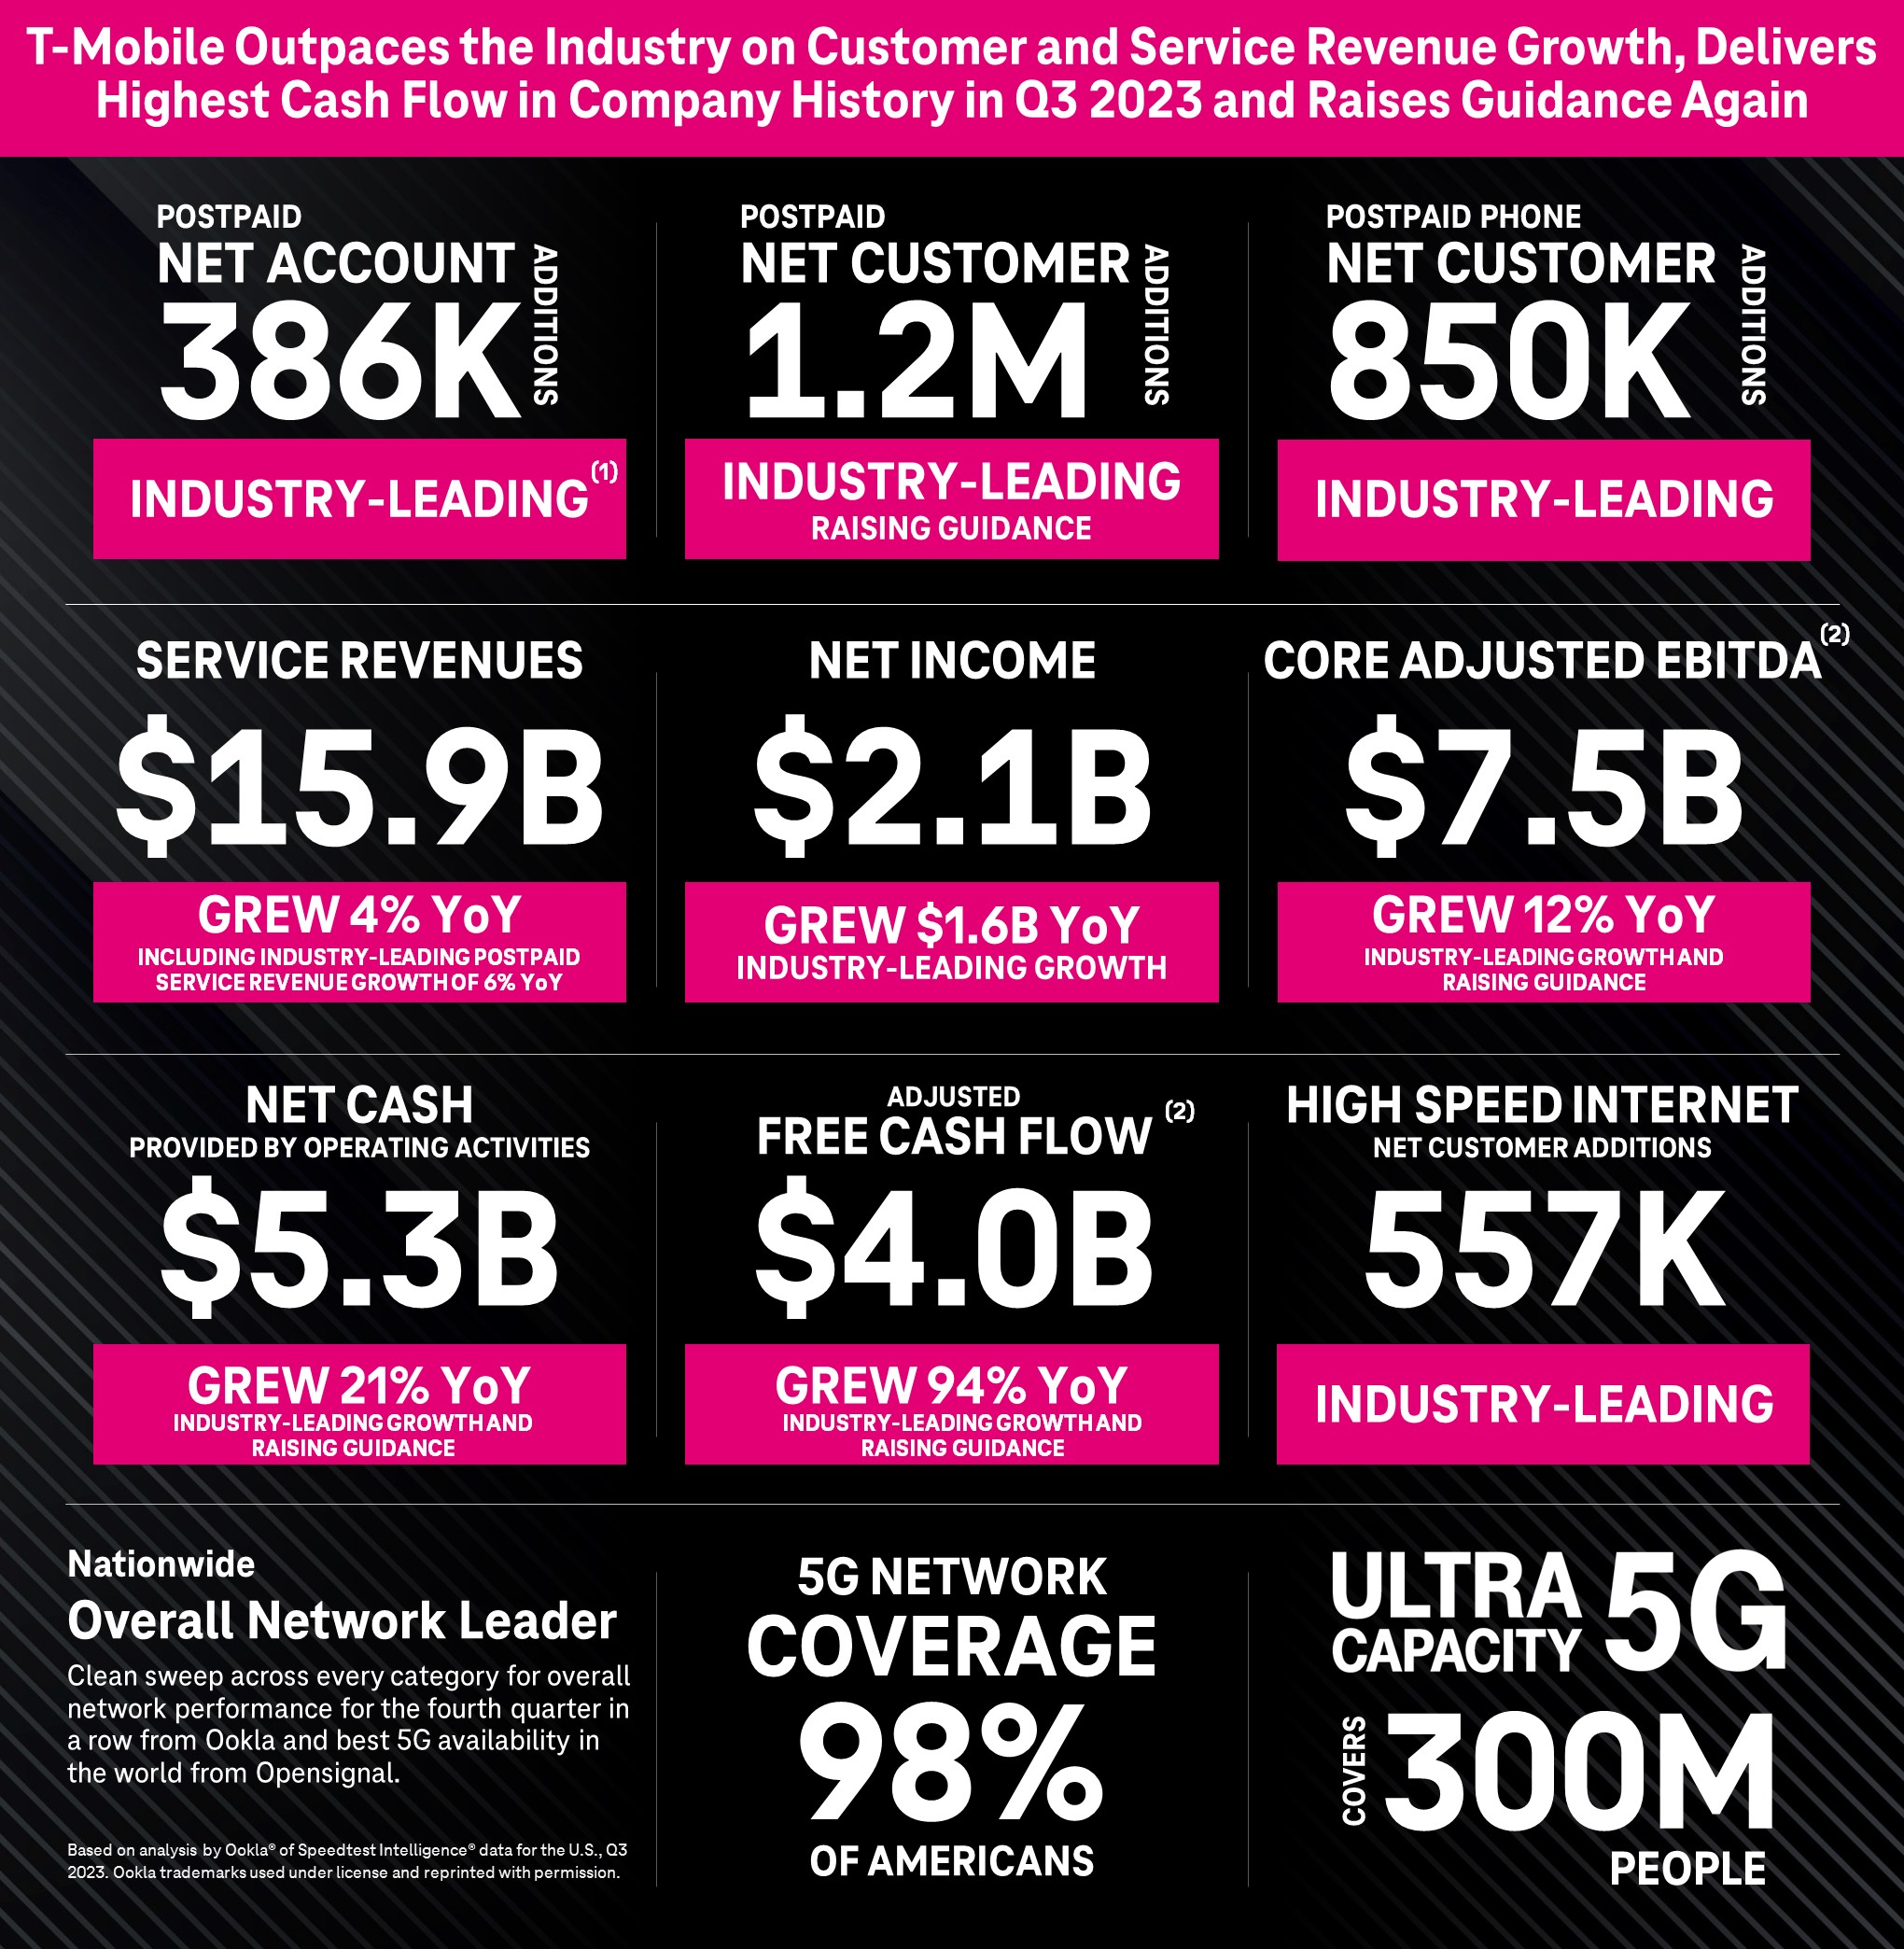
| Postpaid net account additions | 386 | 299 | 394 | 972 | 1,122 | ||||||||||||||||||||||||
| Total net customer additions | 1,305 | 1,685 | 1,732 | 4,309 | 4,914 | ||||||||||||||||||||||||
| Postpaid net customer additions | 1,226 | 1,561 | 1,627 | 4,080 | 4,601 | ||||||||||||||||||||||||
| Postpaid phone net customer additions | 850 | 760 | 854 | 2,148 | 2,166 | ||||||||||||||||||||||||
Postpaid other net customer additions (2) |
376 | 801 | 773 | 1,932 | 2,435 | ||||||||||||||||||||||||
Prepaid net customer additions (2) |
79 | 124 | 105 | 229 | 313 | ||||||||||||||||||||||||
Total customers, end of period (2)(3) |
117,907 | 116,602 | 111,755 | 117,907 | 111,755 | ||||||||||||||||||||||||
| Postpaid phone churn | 0.87 | % | 0.77 | % | 0.88 | % | 0.84 | % | 0.87 | % | |||||||||||||||||||
| Prepaid churn | 2.81 | % | 2.62 | % | 2.88 | % | 2.73 | % | 2.71 | % | |||||||||||||||||||
| High Speed Internet net customer additions | 557 | 509 | 578 | 1,589 | 1,476 | ||||||||||||||||||||||||
| Total High Speed Internet customers, end of period | 4,235 | 3,678 | 2,122 | 4,235 | 2,122 | ||||||||||||||||||||||||
| Quarter | Nine Months Ended September 30, |
Q3 2023
vs.
Q2 2023
|
Q3 2023
vs.
Q3 2022
|
YTD 2023
vs.
YTD 2022
|
|||||||||||||||||||||||||||||||||||||||||||
| (in millions, except EPS) | Q3 2023 | Q2 2023 | Q3 2022 | 2023 | 2022 | ||||||||||||||||||||||||||||||||||||||||||
| Total service revenues | $ | 15,914 | $ | 15,738 | $ | 15,361 | $ | 47,198 | $ | 45,805 | 1.1 | % | 3.6 | % | 3.0 | % | |||||||||||||||||||||||||||||||
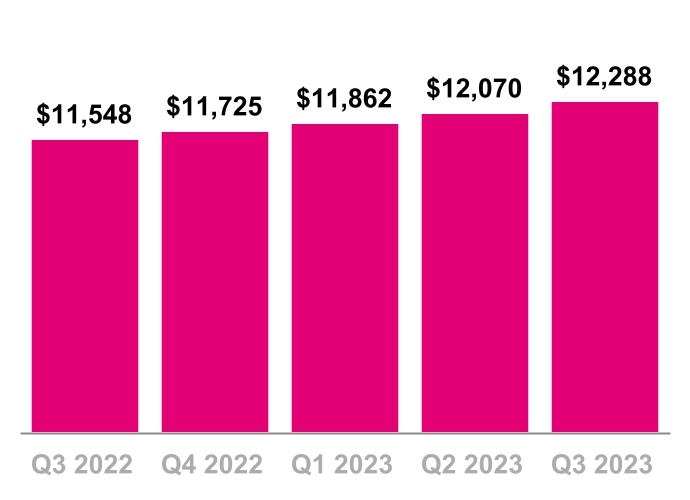
| Postpaid service revenues | 12,288 | 12,070 | 11,548 | 36,220 | 34,194 | 1.8 | % | 6.4 | % | 5.9 | % | ||||||||||||||||||||||||||||||||||||
| Total revenues | 19,252 | 19,196 | 19,477 | 58,080 | 59,298 | 0.3 | % | (1.2) | % | (2.1) | % | ||||||||||||||||||||||||||||||||||||
| Net income | 2,142 | 2,221 | 508 | 6,303 | 1,113 | (3.6) | % | 321.7 | % | 466.3 | % | ||||||||||||||||||||||||||||||||||||
| Diluted EPS | 1.82 | 1.86 | 0.40 | 5.26 | 0.88 | (2.2) | % | 355.0 | % | 497.7 | % | ||||||||||||||||||||||||||||||||||||
| Adjusted EBITDA | 7,600 | 7,405 | 7,039 | 22,204 | 20,993 | 2.6 | % | 8.0 | % | 5.8 | % | ||||||||||||||||||||||||||||||||||||
| Core Adjusted EBITDA | 7,547 | 7,336 | 6,728 | 21,935 | 19,809 | 2.9 | % | 12.2 | % | 10.7 | % | ||||||||||||||||||||||||||||||||||||
| Net cash provided by operating activities | 5,294 | 4,355 | 4,391 | 13,700 | 12,445 | 21.6 | % | 20.6 | % | 10.1 | % | ||||||||||||||||||||||||||||||||||||
| Cash purchases of property and equipment, including capitalized interest | 2,424 | 2,789 | 3,634 | 8,214 | 10,587 | (13.1) | % | (33.3) | % | (22.4) | % | ||||||||||||||||||||||||||||||||||||
Adjusted Free Cash Flow |
4,003 | 2,877 | 2,065 | 9,281 | 5,472 | 39.1 | % | 93.8 | % | 69.6 | % | ||||||||||||||||||||||||||||||||||||
| (in millions, except Postpaid net customer additions) | Previous | Current | Change (Mid-point) | ||||||||||||||||||||||||||
| Postpaid net customer additions (thousands) | 5,600 | 5,900 | 5,700 | 5,900 | 50 | ||||||||||||||||||||||||
Net income (1) |
N/A | N/A | N/A | N/A | N/A | ||||||||||||||||||||||||
Core Adjusted EBITDA (2) |
$ | 28,900 | $ | 29,200 | $ | 29,000 | $ | 29,200 | $ | 50 | |||||||||||||||||||
| Merger synergies | ~7,500 |
~7,500 |
— | ||||||||||||||||||||||||||
Merger-related costs (3) |
~1,000 |
~1,000 |
— | ||||||||||||||||||||||||||
| Net cash provided by operating activities | 18,000 | 18,300 | 18,300 | 18,500 | 250 | ||||||||||||||||||||||||
Capital expenditures (4) |
9,500 | 9,700 | 9,600 | 9,800 | 100 | ||||||||||||||||||||||||
Adjusted Free Cash Flow (5) |
13,200 | 13,600 | 13,400 | 13,600 | 100 | ||||||||||||||||||||||||
| Quarter | Nine Months Ended September 30, | ||||||||||||||||||||||||||||||||||||||||||||||||||||
| (in millions) | Q1 2022 | Q2 2022 | Q3 2022 | Q4 2022 | Q1 2023 | Q2 2023 | Q3 2023 | 2022 | 2023 | ||||||||||||||||||||||||||||||||||||||||||||
| Net income (loss) | $ | 713 | $ | (108) | $ | 508 | $ | 1,477 | $ | 1,940 | $ | 2,221 | $ | 2,142 | $ | 1,113 | $ | 6,303 | |||||||||||||||||||||||||||||||||||
| Adjustments: | |||||||||||||||||||||||||||||||||||||||||||||||||||||
| Interest expense, net | 864 | 851 | 827 | 822 | 835 | 861 | 790 | 2,542 | 2,486 | ||||||||||||||||||||||||||||||||||||||||||||
| Other expense (income), net | 11 | 21 | 3 | (2) | (9) | (6) | (41) | 35 | (56) | ||||||||||||||||||||||||||||||||||||||||||||
| Income tax expense (benefit) | 218 | (55) | (57) | 450 | 631 | 717 | 705 | 106 | 2,053 | ||||||||||||||||||||||||||||||||||||||||||||
| Operating income | 1,806 | 709 | 1,281 | 2,747 | 3,397 | 3,793 | 3,596 | 3,796 | 10,786 | ||||||||||||||||||||||||||||||||||||||||||||
| Depreciation and amortization | 3,585 | 3,491 | 3,313 | 3,262 | 3,203 | 3,110 | 3,187 | 10,389 | 9,500 | ||||||||||||||||||||||||||||||||||||||||||||
Stock-based compensation (1) |
136 | 149 | 145 | 146 | 173 | 155 | 152 | 430 | 480 | ||||||||||||||||||||||||||||||||||||||||||||
Merger-related costs |
1,413 | 1,668 | 1,296 | 592 | 358 | 276 | 152 | 4,377 | 786 | ||||||||||||||||||||||||||||||||||||||||||||
| Impairment expense | — | 477 | — | — | — | — | — | 477 | — | ||||||||||||||||||||||||||||||||||||||||||||
Legal-related expenses (recoveries), net (2) |
— | 400 | (19) | 10 | (43) | — | — | 381 | (43) | ||||||||||||||||||||||||||||||||||||||||||||
| Loss (gain) on disposal group held for sale | — | — | 1,071 | 16 | (42) | 17 | — | 1,071 | (25) | ||||||||||||||||||||||||||||||||||||||||||||
Other, net (3) |
10 | 110 | (48) | 55 | 153 | 54 | 513 | 72 | 720 | ||||||||||||||||||||||||||||||||||||||||||||
| Adjusted EBITDA | 6,950 | 7,004 | 7,039 | 6,828 | 7,199 | 7,405 | 7,600 | 20,993 | 22,204 | ||||||||||||||||||||||||||||||||||||||||||||
Lease revenues |
(487) | (386) | (311) | (246) | (147) | (69) | (53) | (1,184) | (269) | ||||||||||||||||||||||||||||||||||||||||||||
| Core Adjusted EBITDA | $ | 6,463 | $ | 6,618 | $ | 6,728 | $ | 6,582 | $ | 7,052 | $ | 7,336 | $ | 7,547 | $ | 19,809 | $ | 21,935 | |||||||||||||||||||||||||||||||||||
| Quarter | Nine Months Ended September 30, | ||||||||||||||||||||||||||||||||||||||||||||||||||||
| (in millions, except percentages) | Q1 2022 | Q2 2022 | Q3 2022 | Q4 2022 | Q1 2023 | Q2 2023 | Q3 2023 | 2022 | 2023 | ||||||||||||||||||||||||||||||||||||||||||||
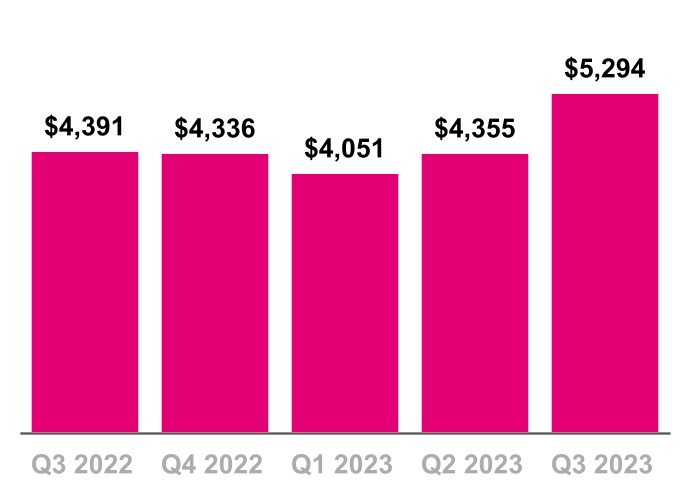
| Net cash provided by operating activities | $ | 3,845 | $ | 4,209 | $ | 4,391 | $ | 4,336 | $ | 4,051 | $ | 4,355 | $ | 5,294 | $ | 12,445 | $ | 13,700 | |||||||||||||||||||||||||||||||||||
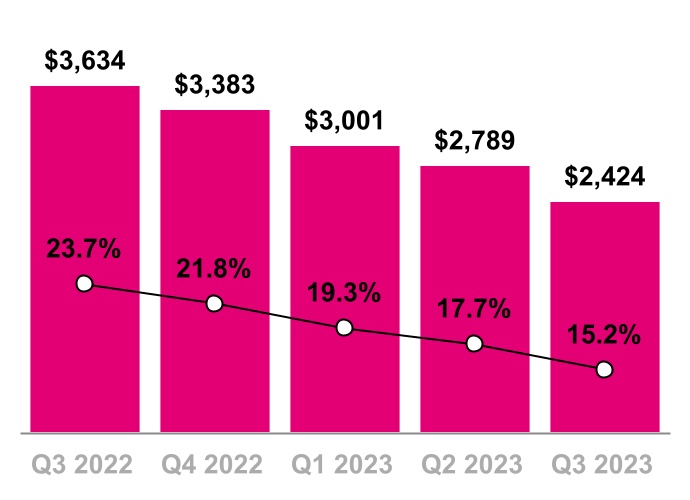
| Cash purchases of property and equipment, including capitalized interest | (3,381) | (3,572) | (3,634) | (3,383) | (3,001) | (2,789) | (2,424) | (10,587) | (8,214) | ||||||||||||||||||||||||||||||||||||||||||||
| Proceeds from sales of tower sites | — | — | — | 9 | 6 | 2 | 2 | — | 10 | ||||||||||||||||||||||||||||||||||||||||||||
| Proceeds related to beneficial interests in securitization transactions | 1,185 | 1,121 | 1,308 | 1,222 | 1,345 | 1,309 | 1,131 | 3,614 | 3,785 | ||||||||||||||||||||||||||||||||||||||||||||
Adjusted Free Cash Flow |
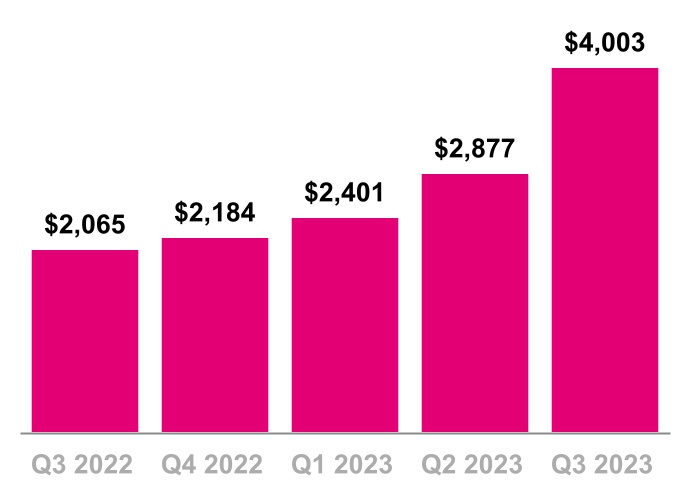
$ | 1,649 | $ | 1,758 | $ | 2,065 | $ | 2,184 | $ | 2,401 | $ | 2,877 | $ | 4,003 | $ | 5,472 | $ | 9,281 | |||||||||||||||||||||||||||||||||||
| Net cash provided by operating activities margin (Net cash provided by operating activities divided by Service revenues) | 25.4 | % | 27.5 | % | 28.6 | % | 27.9 | % | 26.1 | % | 27.7 | % | 33.3 | % | 27.2 | % | 29.0 | % | |||||||||||||||||||||||||||||||||||
| Adjusted Free Cash Flow margin (Adjusted Free Cash Flow divided by Service revenues) | 10.9 | % | 11.5 | % | 13.4 | % | 14.1 | % | 15.4 | % | 18.3 | % | 25.2 | % | 11.9 | % | 19.7 | % | |||||||||||||||||||||||||||||||||||
| FY 2023 | |||||||||||
| (in millions) | Guidance Range | ||||||||||
| Net cash provided by operating activities | $ | 18,300 | $ | 18,500 | |||||||
| Cash purchases of property and equipment, including capitalized interest | (9,600) | (9,800) | |||||||||
Proceeds related to beneficial interests in securitization transactions (1) |
4,700 | 4,900 | |||||||||
| Adjusted Free Cash Flow | $ | 13,400 | $ | 13,600 | |||||||
| FY 2023 | |||||||||||
| (in millions) | Guidance Range | ||||||||||
| Net cash provided by operating activities | $ | 18,000 | $ | 18,300 | |||||||
| Cash purchases of property and equipment, including capitalized interest | (9,500) | (9,700) | |||||||||
Proceeds related to beneficial interests in securitization transactions (1) |
4,700 | 5,000 | |||||||||
| Adjusted Free Cash Flow | $ | 13,200 | $ | 13,600 | |||||||
| Quarter | Nine Months Ended September 30, | ||||||||||||||||||||||||||||||||||||||||||||||||||||
| (in dollars) | Q1 2022 | Q2 2022 | Q3 2022 | Q4 2022 | Q1 2023 | Q2 2023 | Q3 2023 | 2022 | 2023 | ||||||||||||||||||||||||||||||||||||||||||||
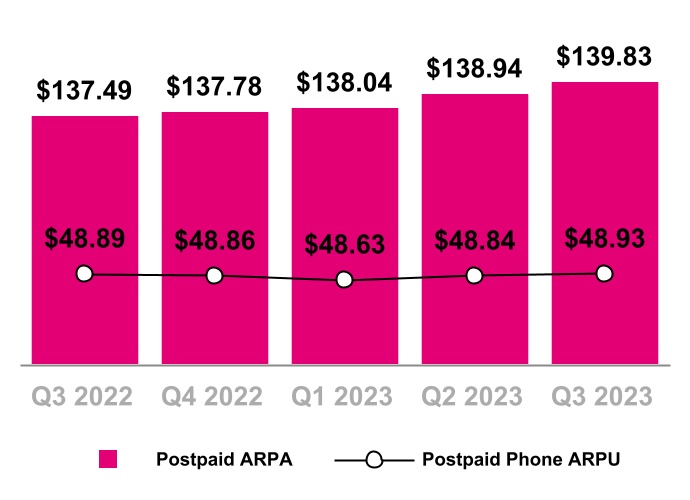
| Postpaid ARPA | $ | 136.53 | $ | 137.92 | $ | 137.49 | $ | 137.78 | $ | 138.04 | $ | 138.94 | $ | 139.83 | $ | 137.32 | $ | 138.94 | |||||||||||||||||||||||||||||||||||
| Postpaid phone ARPU | 48.41 | 48.96 | 48.89 | 48.86 | 48.63 | 48.84 | 48.93 | 48.75 | 48.80 | ||||||||||||||||||||||||||||||||||||||||||||
| Prepaid ARPU | 39.19 | 38.71 | 38.86 | 38.29 | 37.98 | 37.98 | 38.18 | 38.92 | 38.05 | ||||||||||||||||||||||||||||||||||||||||||||

 |
2 |
||||
| Highlights | ||||||||
| Customer Metrics | ||||||||
| Financial Metrics | ||||||||
| Capital Structure | ||||||||
| Merger & Integration | ||||||||
| Guidance | ||||||||
| Contacts | ||||||||
| Financial and Operational Tables | ||||||||
 | ||
 |
3 |
||||
 | ||||||||
| ||
 |
4 |
||||
|
Postpaid Accounts
(in thousands)
|
|||||
| Year-Over-Year | ||
| Sequential | ||
| Year-Over-Year | ||
| Sequential | ||
| Sequential | ||
| Postpaid ARPA & Postpaid Phone ARPU | |||||
| ||
|
5 |
||||
|
Postpaid Customers
(in thousands)
|
|||||
| Year-Over-Year | ||
| Sequential | ||
| Year-Over-Year | ||
| Sequential | ||
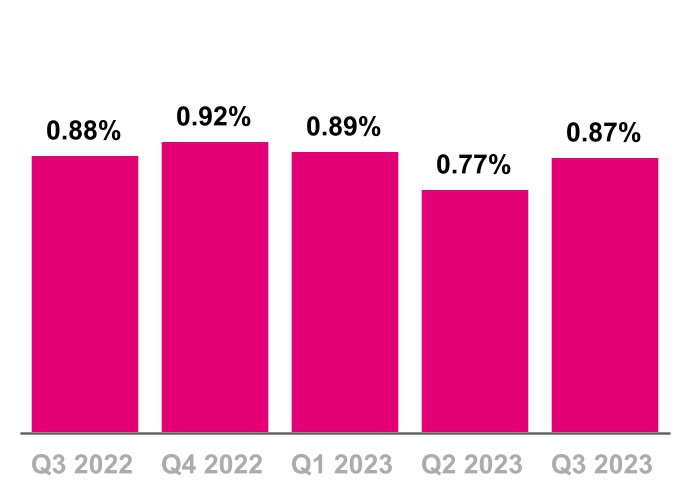
| Postpaid Phone Churn | |||||
| ||
|
6 |
||||
|
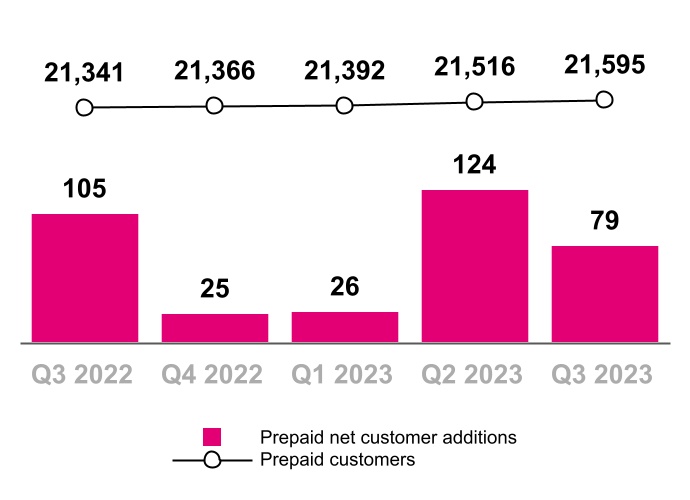
Prepaid Customers
(in thousands)
|
|||||
| Year-Over-Year | ||
| Sequential | ||
| Year-Over-Year | ||
| Sequential | ||
|
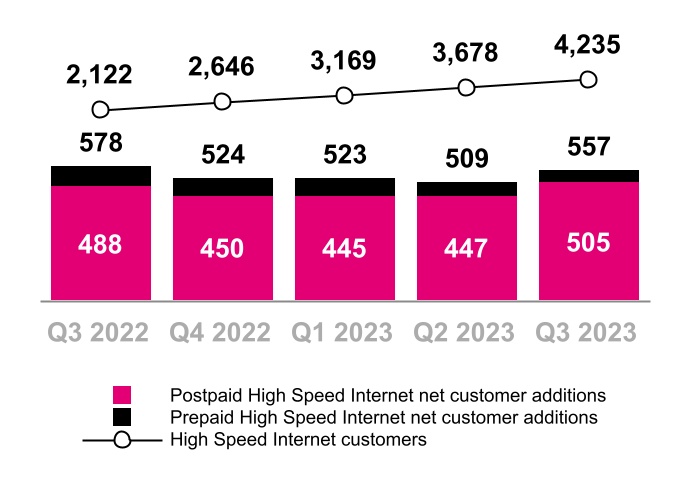
High Speed Internet Customers
(in thousands)
|
|||||
| ||
 |
7 |
||||
|
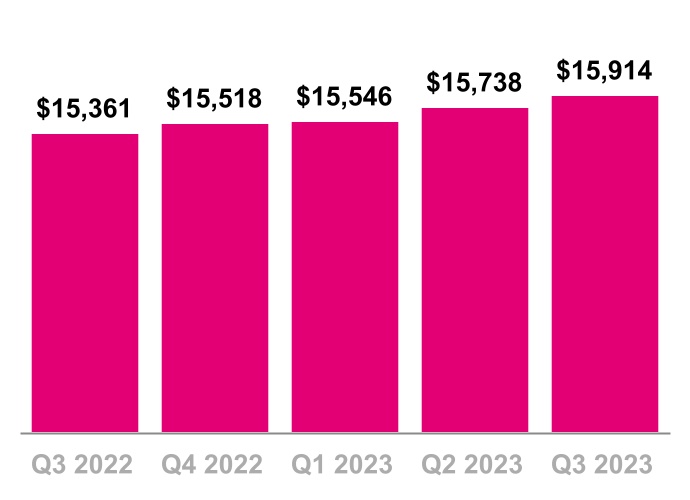
Service Revenues
($ in millions)
|
|||||
| Year-Over-Year | ||
| Sequential | ||
| Year-Over-Year | ||
| Sequential | ||
|
Postpaid Service Revenues
($ in millions)
|
|||||
| ||
|
8 |
||||
|
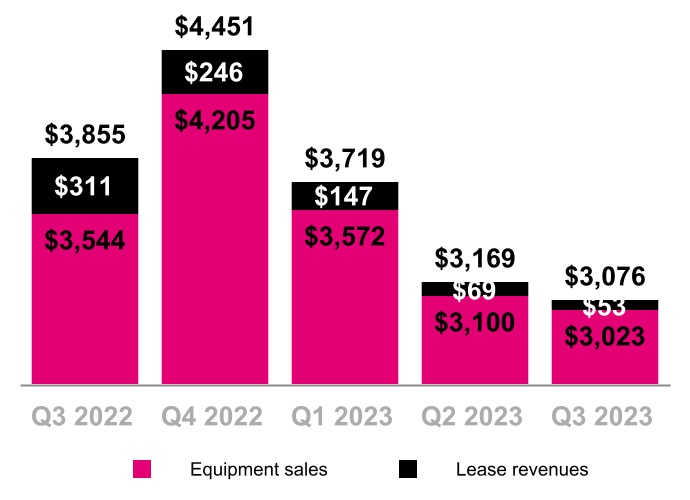
Equipment Revenues
($ in millions)
|
|||||
| Year-Over-Year | ||
| Sequential | ||
| Year-Over-Year | ||
| Sequential | ||
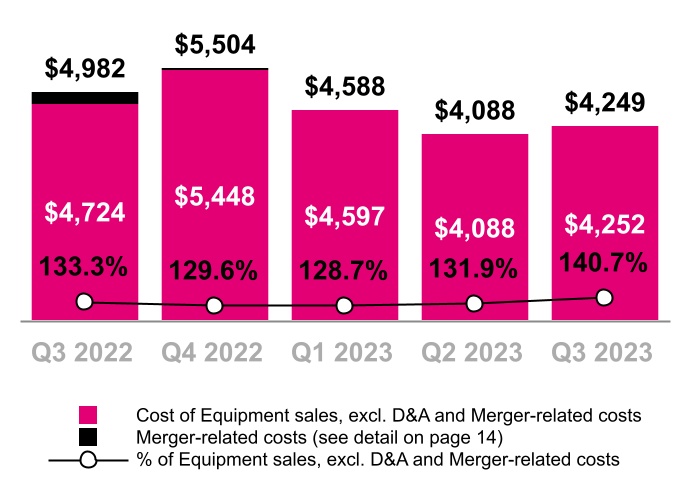
|
Cost of Equipment Sales, exclusive of D&A
($ in millions)
|
|||||
| ||
|
9 |
||||
|
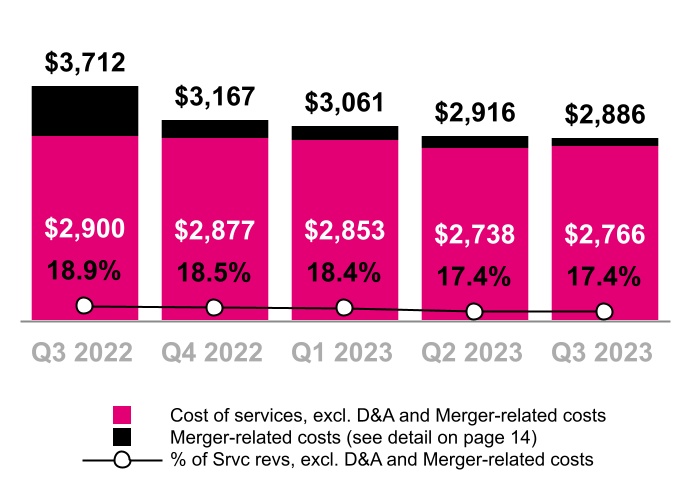
Cost of Services, exclusive of D&A
($ in millions, % of Service revenues)
|
|||||
| Year-Over-Year | ||
| Sequential | ||
| Year-Over-Year | ||
| Sequential | ||
|
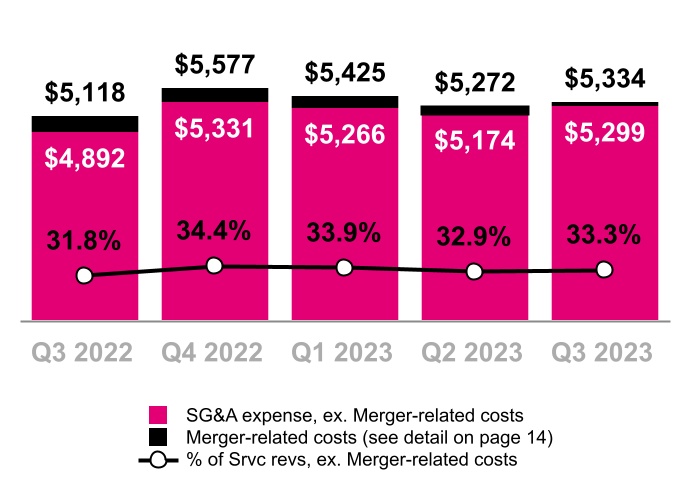
Selling, General and Administrative (SG&A) Expense
($ in millions, % of Service revenues)
|
|||||
| ||
|
10 |
||||
|
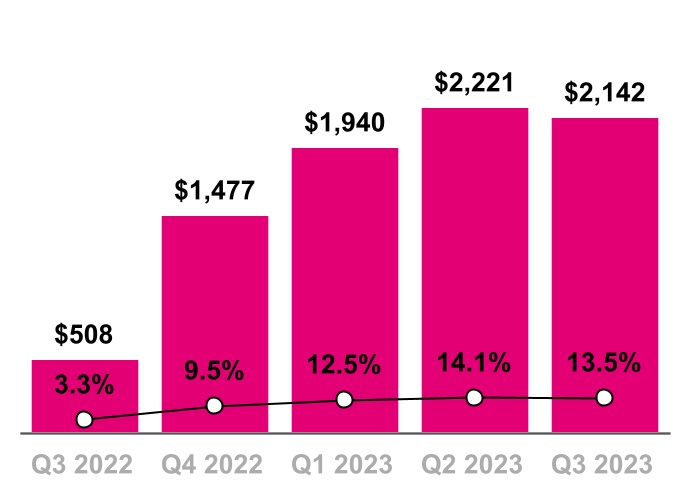
Net Income
($ in millions, % of Service revenues)
|
|||||
|
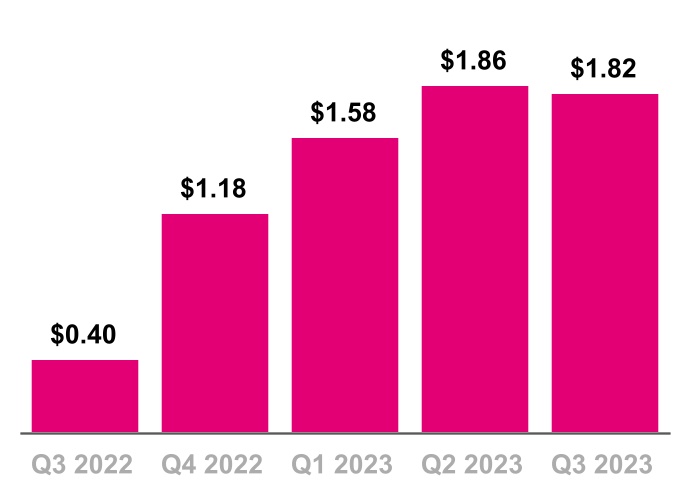
Diluted Earnings Per Share
(Diluted EPS)
|
|||||
| Year-Over-Year | ||
| Sequential | ||
| ||
|
11 |
||||
|
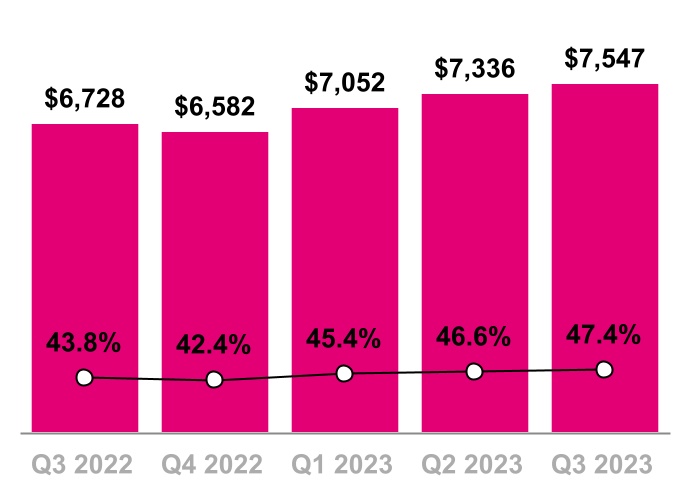
Core Adjusted EBITDA*
($ in millions, % of Service revenues)
|
|||||
| Year-Over-Year | ||
| Sequential | ||
| Year-Over-Year | ||
| Sequential | ||
|
Net Cash Provided by Operating Activities
($ in millions)
|
|||||
| ||
|
12 |
||||
|
Cash Purchases of Property and Equipment, incl. Capitalized Interest
($ in millions, % of Service revenues)
|
|||||
| Year-Over-Year | ||
| Sequential | ||
| Year-Over-Year | ||
| Sequential | ||
|
Adjusted Free Cash Flow
($ in millions)
|
|||||
| ||
 |
13 |
||||
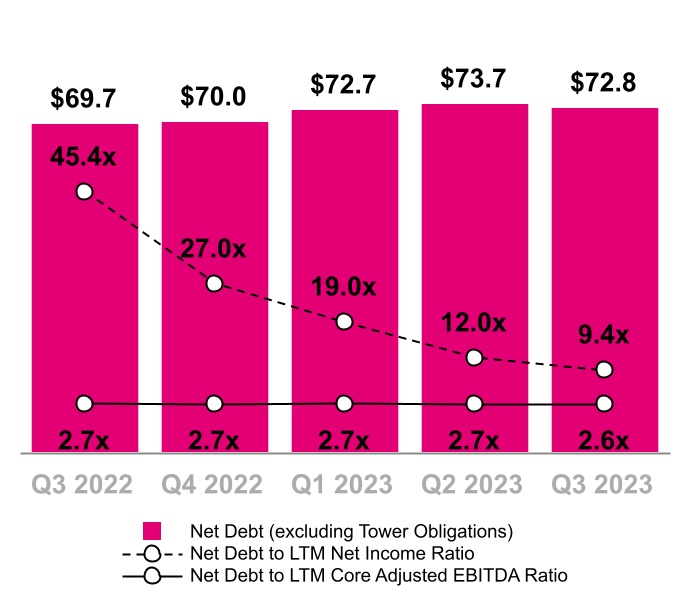
|
Net Debt (Excluding Tower Obligations) & Net Debt to LTM Net Income and Core Adj. EBITDA Ratios
($ in billions)
|
|||||
| ||
 |
14 |
||||
| Merger-Related Synergies Guidance | ||
|
Merger synergies are expected to be approximately $7.5 billion in 2023:
▪Approximately $2.7 billion of SG&A expense reductions
▪Approximately $3.2 billion of cost of service expense reductions achieved through network efficiencies
▪Approximately $1.6 billion of savings related to avoided network expenses
| ||
| Merger-Related Costs | |||||||||||||||||||||||||||||||||||||||||||||||||||||
| (in millions, excl. EPS) | |||||||||||||||||||||||||||||||||||||||||||||||||||||
| Sequential Change | Year-Over-Year Change | ||||||||||||||||||||||||||||||||||||||||||||||||||||
| Q3 2022 | Q4 2022 | Q1 2023 | Q2 2023 | Q3 2023 | $ | % | $ | % | |||||||||||||||||||||||||||||||||||||||||||||
| Cost of services | $ | 812 | $ | 290 | $ | 208 | $ | 178 | $ | 120 | $ | (58) | (33) | % | $ | (692) | (85) | % | |||||||||||||||||||||||||||||||||||
| Cost of equipment sales | 258 | 56 | (9) | — | (3) | (3) | NM | (261) | (101) | % | |||||||||||||||||||||||||||||||||||||||||||
| Selling, general & administrative | 226 | 246 | 159 | 98 | 35 | (63) | (64) | % | (191) | (85) | % | ||||||||||||||||||||||||||||||||||||||||||
| Total Merger-related costs | $ | 1,296 | $ | 592 | $ | 358 | $ | 276 | $ | 152 | $ | (124) | (45) | % | $ | (1,144) | (88) | % | |||||||||||||||||||||||||||||||||||
| Total Merger-related costs, net of tax |
$ | 972 | $ | 444 | $ | 268 | $ | 207 | $ | 114 | $ | (93) | (45) | % | $ | (858) | (88) | % | |||||||||||||||||||||||||||||||||||
| Diluted EPS impact of Merger-related costs | $ | 0.77 | $ | 0.36 | $ | 0.22 | $ | 0.17 | $ | 0.10 | $ | (0.07) | (41) | % | $ | (0.67) | (87) | % | |||||||||||||||||||||||||||||||||||
| Net cash payments for Merger-related costs |
$ | 942 | $ | 622 | $ | 484 | $ | 728 | $ | 345 | $ | (383) | (53) | % | $ | (597) | (63) | % | |||||||||||||||||||||||||||||||||||
| ||
 |
15 |
||||
| Metric | Previous | Revised | Change at Midpoint | ||||||||
| Postpaid net customer additions | 5.6 to 5.9 million |
5.7 to 5.9 million |
50 thousand |
||||||||
Net income (1) |
N/A | N/A | N/A | ||||||||
Core Adjusted EBITDA (2) |
$28.9 to $29.2 billion |
$29.0 to $29.2 billion |
$50 million |
||||||||
| Merger synergies | ~$7.5 billion |
~$7.5 billion |
No change |
||||||||
Merger-related costs (3) |
~$1.0 billion |
~$1.0 billion |
No change |
||||||||
| Net cash provided by operating activities | $18.0 to $18.3 billion |
$18.3 to $18.5 billion |
$250 million |
||||||||
Capital expenditures (4) |
$9.5 to $9.7 billion |
$9.6 to $9.8 billion |
$100 million |
||||||||
Adjusted Free Cash Flow (5) |
$13.2 to $13.6 billion |
$13.4 to $13.6 billion |
$100 million |
||||||||
| ||
 |
16 |
||||
 |
 |
 |
||||||||||||||||||
| Jud Henry | Justin Taiber | Rob Brust | ||||||||||||||||||
| Senior Vice President | Senior Director | Senior Director | ||||||||||||||||||
| Investor Relations | Investor Relations | Investor Relations | ||||||||||||||||||
 |
 |
 |
||||||||||||||||||
| Zach Witterstaetter | Rose Kopecky | Jacob Marks | ||||||||||||||||||
| Investor Relations | Investor Relations | Investor Relations | ||||||||||||||||||
| Manager | Manager | Manager | ||||||||||||||||||
| ||
 |
17 |
||||
| (in millions, except share and per share amounts) | September 30, 2023 |
December 31, 2022 |
|||||||||
| Assets | |||||||||||
| Current assets | |||||||||||
| Cash and cash equivalents | $ | 5,030 | $ | 4,507 | |||||||
| Accounts receivable, net of allowance for credit losses of $166 and $167 | 4,500 | 4,445 | |||||||||
Equipment installment plan receivables, net of allowance for credit losses and imputed discount of $610 and $667 |
4,470 | 5,123 | |||||||||
| Inventory | 1,685 | 1,884 | |||||||||
| Prepaid expenses | 712 | 673 | |||||||||
| Other current assets | 2,272 | 2,435 | |||||||||
| Total current assets | 18,669 | 19,067 | |||||||||
| Property and equipment, net | 41,080 | 42,086 | |||||||||
| Operating lease right-of-use assets | 27,568 | 28,715 | |||||||||
| Financing lease right-of-use assets | 3,390 | 3,257 | |||||||||
| Goodwill | 12,234 | 12,234 | |||||||||
| Spectrum licenses | 96,689 | 95,798 | |||||||||
| Other intangible assets, net | 2,824 | 3,508 | |||||||||
Equipment installment plan receivables due after one year, net of allowance for credit losses and imputed discount of $130 and $144 |
1,879 | 2,546 | |||||||||
| Other assets | 4,246 | 4,127 | |||||||||
| Total assets | $ | 208,579 | $ | 211,338 | |||||||
| Liabilities and Stockholders' Equity | |||||||||||
| Current liabilities | |||||||||||
| Accounts payable and accrued liabilities | $ | 9,665 | $ | 12,275 | |||||||
| Short-term debt | 3,437 | 5,164 | |||||||||
| Deferred revenue | 830 | 780 | |||||||||
| Short-term operating lease liabilities | 3,545 | 3,512 | |||||||||
| Short-term financing lease liabilities | 1,286 | 1,161 | |||||||||
| Other current liabilities | 2,948 | 1,850 | |||||||||
| Total current liabilities | 21,711 | 24,742 | |||||||||
| Long-term debt | 70,365 | 65,301 | |||||||||
| Long-term debt to affiliates | 1,496 | 1,495 | |||||||||
| Tower obligations | 3,819 | 3,934 | |||||||||
| Deferred tax liabilities | 12,900 | 10,884 | |||||||||
| Operating lease liabilities | 28,677 | 29,855 | |||||||||
| Financing lease liabilities | 1,273 | 1,370 | |||||||||
| Other long-term liabilities | 3,640 | 4,101 | |||||||||
| Total long-term liabilities | 122,170 | 116,940 | |||||||||
| Commitments and contingencies | |||||||||||
| Stockholders' equity | |||||||||||
| Common stock, par value $0.00001 per share, 2,000,000,000 shares authorized; 1,262,375,765 and 1,256,876,527 shares issued, 1,161,979,708 and 1,233,960,078 shares outstanding | — | — | |||||||||
| Additional paid-in capital | 74,404 | 73,941 | |||||||||
| Treasury stock, at cost, 100,396,057 and 22,916,449 shares issued | (14,092) | (3,016) | |||||||||
| Accumulated other comprehensive loss | (949) | (1,046) | |||||||||
| Retained earnings (accumulated deficit) | 5,335 | (223) | |||||||||
| Total stockholders' equity | 64,698 | 69,656 | |||||||||
| Total liabilities and stockholders' equity | $ | 208,579 | $ | 211,338 | |||||||
| ||
|
18 |
||||
| Three Months Ended | Nine Months Ended September 30, | ||||||||||||||||||||||||||||
| (in millions, except share and per share amounts) | September 30, 2023 |
June 30, 2023 |
September 30, 2022 |
2023 | 2022 | ||||||||||||||||||||||||
| Revenues | |||||||||||||||||||||||||||||
| Postpaid revenues | $ | 12,288 | $ | 12,070 | $ | 11,548 | $ | 36,220 | $ | 34,194 | |||||||||||||||||||
| Prepaid revenues | 2,473 | 2,444 | 2,484 | 7,334 | 7,408 | ||||||||||||||||||||||||
| Wholesale and other service revenues | 1,153 | 1,224 | 1,329 | 3,644 | 4,203 | ||||||||||||||||||||||||
| Total service revenues | 15,914 | 15,738 | 15,361 | 47,198 | 45,805 | ||||||||||||||||||||||||
| Equipment revenues | 3,076 | 3,169 | 3,855 | 9,964 | 12,679 | ||||||||||||||||||||||||
| Other revenues | 262 | 289 | 261 | 918 | 814 | ||||||||||||||||||||||||
| Total revenues | 19,252 | 19,196 | 19,477 | 58,080 | 59,298 | ||||||||||||||||||||||||
| Operating expenses | |||||||||||||||||||||||||||||
| Cost of services, exclusive of depreciation and amortization shown separately below | 2,886 | 2,916 | 3,712 | 8,863 | 11,499 | ||||||||||||||||||||||||
| Cost of equipment sales, exclusive of depreciation and amortization shown separately below | 4,249 | 4,088 | 4,982 | 12,925 | 16,036 | ||||||||||||||||||||||||
| Selling, general and administrative | 5,334 | 5,272 | 5,118 | 16,031 | 16,030 | ||||||||||||||||||||||||
| Impairment expense | — | — | — | — | 477 | ||||||||||||||||||||||||
| Loss (gain) on disposal group held for sale | — | 17 | 1,071 | (25) | 1,071 | ||||||||||||||||||||||||
| Depreciation and amortization | 3,187 | 3,110 | 3,313 | 9,500 | 10,389 | ||||||||||||||||||||||||
| Total operating expenses | 15,656 | 15,403 | 18,196 | 47,294 | 55,502 | ||||||||||||||||||||||||
| Operating income | 3,596 | 3,793 | 1,281 | 10,786 | 3,796 | ||||||||||||||||||||||||
| Other expense, net | |||||||||||||||||||||||||||||
| Interest expense, net | (790) | (861) | (827) | (2,486) | (2,542) | ||||||||||||||||||||||||
| Other income (expense), net | 41 | 6 | (3) | 56 | (35) | ||||||||||||||||||||||||
| Total other expense, net | (749) | (855) | (830) | (2,430) | (2,577) | ||||||||||||||||||||||||
| Income before income taxes | 2,847 | 2,938 | 451 | 8,356 | 1,219 | ||||||||||||||||||||||||
| Income tax (expense) benefit | (705) | (717) | 57 | (2,053) | (106) | ||||||||||||||||||||||||
| Net income | $ | 2,142 | $ | 2,221 | $ | 508 | $ | 6,303 | $ | 1,113 | |||||||||||||||||||
| Net income | $ | 2,142 | $ | 2,221 | $ | 508 | $ | 6,303 | $ | 1,113 | |||||||||||||||||||
| Other comprehensive income, net of tax | |||||||||||||||||||||||||||||
Reclassification of loss from cash flow hedges, net of tax effect of $15, $13, $13, $42 and $39 |
41 | 40 | 39 | 121 | 113 | ||||||||||||||||||||||||
Unrealized gain (loss) on foreign currency translation adjustment, net of tax effect of $0, $0, $0, $0 and $(1) |
— | 7 | (7) | 9 | (11) | ||||||||||||||||||||||||
Amortization of actuarial gain, net of tax effect of $(11), $0, $0, $(11) and $0 |
(33) | — | — | (33) | — | ||||||||||||||||||||||||
| Other comprehensive income | 8 | 47 | 32 | 97 | 102 | ||||||||||||||||||||||||
| Total comprehensive income | $ | 2,150 | $ | 2,268 | $ | 540 | $ | 6,400 | $ | 1,215 | |||||||||||||||||||
| Earnings per share | |||||||||||||||||||||||||||||
| Basic | $ | 1.83 | $ | 1.86 | $ | 0.40 | $ | 5.28 | $ | 0.89 | |||||||||||||||||||
| Diluted | $ | 1.82 | $ | 1.86 | $ | 0.40 | $ | 5.26 | $ | 0.88 | |||||||||||||||||||
| Weighted-average shares outstanding | |||||||||||||||||||||||||||||
| Basic | 1,171,336,373 | 1,193,078,891 | 1,253,873,429 | 1,194,497,722 | 1,252,783,140 | ||||||||||||||||||||||||
| Diluted | 1,174,390,472 | 1,195,533,499 | 1,259,210,271 | 1,198,290,141 | 1,258,061,478 | ||||||||||||||||||||||||
| ||
|
19 |
||||
| Three Months Ended | Nine Months Ended September 30, | ||||||||||||||||||||||||||||
| (in millions) | September 30, 2023 |
June 30, 2023 |
September 30, 2022 |
2023 | 2022 | ||||||||||||||||||||||||
| Operating activities | |||||||||||||||||||||||||||||
| Net income | $ | 2,142 | $ | 2,221 | $ | 508 | $ | 6,303 | $ | 1,113 | |||||||||||||||||||
| Adjustments to reconcile net income to net cash provided by operating activities | |||||||||||||||||||||||||||||
| Depreciation and amortization | 3,187 | 3,110 | 3,313 | 9,500 | 10,389 | ||||||||||||||||||||||||
| Stock-based compensation expense | 156 | 167 | 150 | 500 | 445 | ||||||||||||||||||||||||
| Deferred income tax expense (benefit) | 671 | 703 | (36) | 1,985 | 73 | ||||||||||||||||||||||||
| Bad debt expense | 228 | 213 | 239 | 663 | 760 | ||||||||||||||||||||||||
| Losses from sales of receivables | 46 | 51 | 60 | 135 | 168 | ||||||||||||||||||||||||
| Impairment expense | — | — | — | — | 477 | ||||||||||||||||||||||||
| Loss on remeasurement of disposal group held for sale | — | 22 | 371 | 9 | 371 | ||||||||||||||||||||||||
| Changes in operating assets and liabilities | |||||||||||||||||||||||||||||
| Accounts receivable | (1,046) | (1,514) | (1,224) | (3,828) | (3,781) | ||||||||||||||||||||||||
| Equipment installment plan receivables | 165 | 246 | (77) | 563 | (801) | ||||||||||||||||||||||||
| Inventory | (309) | 362 | (7) | 182 | 384 | ||||||||||||||||||||||||
| Operating lease right-of-use assets | 886 | 929 | 1,113 | 2,823 | 4,275 | ||||||||||||||||||||||||
| Other current and long-term assets | (135) | 354 | (334) | 77 | (450) | ||||||||||||||||||||||||
| Accounts payable and accrued liabilities | 208 | (864) | 342 | (1,538) | 319 | ||||||||||||||||||||||||
| Short- and long-term operating lease liabilities | (692) | (1,183) | (700) | (2,884) | (2,218) | ||||||||||||||||||||||||
| Other current and long-term liabilities | (260) | (466) | 550 | (909) | 587 | ||||||||||||||||||||||||
| Other, net | 47 | 4 | 123 | 119 | 334 | ||||||||||||||||||||||||
| Net cash provided by operating activities | 5,294 | 4,355 | 4,391 | 13,700 | 12,445 | ||||||||||||||||||||||||
| Investing activities | |||||||||||||||||||||||||||||
Purchases of property and equipment, including capitalized interest of $(66), $(14), $(16), $(94) and $(44) |
(2,424) | (2,789) | (3,634) | (8,214) | (10,587) | ||||||||||||||||||||||||
| Purchases of spectrum licenses and other intangible assets, including deposits | (119) | (33) | (360) | (225) | (3,319) | ||||||||||||||||||||||||
| Proceeds from sales of tower sites | 2 | 2 | — | 10 | — | ||||||||||||||||||||||||
| Proceeds related to beneficial interests in securitization transactions | 1,131 | 1,309 | 1,308 | 3,785 | 3,614 | ||||||||||||||||||||||||
| Acquisition of companies, net of cash and restricted cash acquired | — | — | — | — | (52) | ||||||||||||||||||||||||
| Other, net | 17 | 24 | 131 | 36 | 138 | ||||||||||||||||||||||||
| Net cash used in investing activities | (1,393) | (1,487) | (2,555) | (4,608) | (10,206) | ||||||||||||||||||||||||
| Financing activities | |||||||||||||||||||||||||||||
| Proceeds from issuance of long-term debt | 1,983 | 3,450 | 2,972 | 8,446 | 2,972 | ||||||||||||||||||||||||
| Repayments of financing lease obligations | (304) | (304) | (311) | (914) | (901) | ||||||||||||||||||||||||
| Repayments of long-term debt | (4,474) | (223) | (132) | (4,828) | (3,145) | ||||||||||||||||||||||||
| Repurchases of common stock | (2,681) | (3,591) | (557) | (10,891) | (557) | ||||||||||||||||||||||||
| Tax withholdings on share-based awards | (10) | (70) | (10) | (267) | (225) | ||||||||||||||||||||||||
| Other, net | (24) | (46) | (35) | (113) | (97) | ||||||||||||||||||||||||
| Net cash (used in) provided by financing activities | (5,510) | (784) | 1,927 | (8,567) | (1,953) | ||||||||||||||||||||||||
| Change in cash and cash equivalents, including restricted cash and cash held for sale | (1,609) | 2,084 | 3,763 | 525 | 286 | ||||||||||||||||||||||||
| Cash and cash equivalents, including restricted cash and cash held for sale | |||||||||||||||||||||||||||||
| Beginning of period | 6,808 | 4,724 | 3,226 | 4,674 | 6,703 | ||||||||||||||||||||||||
| End of period | $ | 5,199 | $ | 6,808 | $ | 6,989 | $ | 5,199 | $ | 6,989 | |||||||||||||||||||
| ||
|
20 |
||||
| Three Months Ended | Nine Months Ended September 30, | ||||||||||||||||||||||||||||
| (in millions) | September 30, 2023 |
June 30, 2023 |
September 30, 2022 |
2023 | 2022 | ||||||||||||||||||||||||
| Supplemental disclosure of cash flow information | |||||||||||||||||||||||||||||
| Interest payments, net of amounts capitalized | $ | 915 | $ | 896 | $ | 781 | $ | 2,651 | $ | 2,548 | |||||||||||||||||||
| Operating lease payments | 1,037 | 1,483 | 1,073 | 3,834 | 3,163 | ||||||||||||||||||||||||
| Income tax payments | 4 | 95 | 12 | 126 | 75 | ||||||||||||||||||||||||
| Non-cash investing and financing activities | |||||||||||||||||||||||||||||
| Non-cash beneficial interest obtained in exchange for securitized receivables | $ | 920 | $ | 1,109 | $ | 1,181 | $ | 3,148 | $ | 3,189 | |||||||||||||||||||
| Change in accounts payable and accrued liabilities for purchases of property and equipment | (459) | (408) | 390 | (1,196) | 139 | ||||||||||||||||||||||||
| Increase in Tower obligations from contract modification | — | — | — | — | 1,158 | ||||||||||||||||||||||||
| Operating lease right-of-use assets obtained in exchange for lease obligations | 563 | 674 | 479 | 1,676 | 7,045 | ||||||||||||||||||||||||
| Financing lease right-of-use assets obtained in exchange for lease obligations | 398 | 324 | 348 | 961 | 1,197 | ||||||||||||||||||||||||
| ||
|
21 |
||||
| Quarter | Nine Months Ended September 30, | ||||||||||||||||||||||||||||||||||||||||||||||||||||
| (in thousands) | Q1 2022 | Q2 2022 | Q3 2022 | Q4 2022 | Q1 2023 | Q2 2023 | Q3 2023 | 2022 | 2023 | ||||||||||||||||||||||||||||||||||||||||||||
| Customers, end of period | |||||||||||||||||||||||||||||||||||||||||||||||||||||
Postpaid phone customers (1) |
70,656 | 71,053 | 71,907 | 72,834 | 73,372 | 74,132 | 74,982 | 71,907 | 74,982 | ||||||||||||||||||||||||||||||||||||||||||||
Postpaid other customers (1) |
17,767 | 17,734 | 18,507 | 19,398 | 20,153 | 20,954 | 21,330 | 18,507 | 21,330 | ||||||||||||||||||||||||||||||||||||||||||||
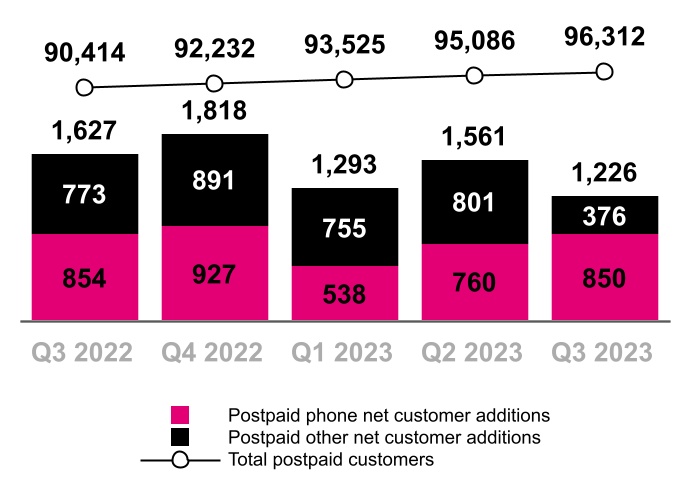
| Total postpaid customers | 88,423 | 88,787 | 90,414 | 92,232 | 93,525 | 95,086 | 96,312 | 90,414 | 96,312 | ||||||||||||||||||||||||||||||||||||||||||||
Prepaid customers (1) |
21,118 | 21,236 | 21,341 | 21,366 | 21,392 | 21,516 | 21,595 | 21,341 | 21,595 | ||||||||||||||||||||||||||||||||||||||||||||
| Total customers | 109,541 | 110,023 | 111,755 | 113,598 | 114,917 | 116,602 | 117,907 | 111,755 | 117,907 | ||||||||||||||||||||||||||||||||||||||||||||
Adjustments to customers (1) |
(558) | (1,320) | — | — | — | — | — | (1,878) | — | ||||||||||||||||||||||||||||||||||||||||||||
| Quarter | Nine Months Ended September 30, | ||||||||||||||||||||||||||||||||||||||||||||||||||||
| (in thousands) | Q1 2022 | Q2 2022 | Q3 2022 | Q4 2022 | Q1 2023 | Q2 2023 | Q3 2023 | 2022 | 2023 | ||||||||||||||||||||||||||||||||||||||||||||
| Net customer additions | |||||||||||||||||||||||||||||||||||||||||||||||||||||
| Postpaid phone customers | 589 | 723 | 854 | 927 | 538 | 760 | 850 | 2,166 | 2,148 | ||||||||||||||||||||||||||||||||||||||||||||
| Postpaid other customers | 729 | 933 | 773 | 891 | 755 | 801 | 376 | 2,435 | 1,932 | ||||||||||||||||||||||||||||||||||||||||||||
| Total postpaid customers | 1,318 | 1,656 | 1,627 | 1,818 | 1,293 | 1,561 | 1,226 | 4,601 | 4,080 | ||||||||||||||||||||||||||||||||||||||||||||
| Prepaid customers | 62 | 146 | 105 | 25 | 26 | 124 | 79 | 313 | 229 | ||||||||||||||||||||||||||||||||||||||||||||
| Total net customer additions | 1,380 | 1,802 | 1,732 | 1,843 | 1,319 | 1,685 | 1,305 | 4,914 | 4,309 | ||||||||||||||||||||||||||||||||||||||||||||
| Migrations from prepaid to postpaid plans | 165 | 155 | 155 | 175 | 145 | 140 | 155 | 475 | 440 | ||||||||||||||||||||||||||||||||||||||||||||
| Quarter | Nine Months Ended September 30, | ||||||||||||||||||||||||||||||||||||||||||||||||||||
| Q1 2022 | Q2 2022 | Q3 2022 | Q4 2022 | Q1 2023 | Q2 2023 | Q3 2023 | 2022 | 2023 | |||||||||||||||||||||||||||||||||||||||||||||
| Churn | |||||||||||||||||||||||||||||||||||||||||||||||||||||
| Postpaid phone churn | 0.93 | % | 0.80 | % | 0.88 | % | 0.92 | % | 0.89 | % | 0.77 | % | 0.87 | % | 0.87 | % | 0.84 | % | |||||||||||||||||||||||||||||||||||
| Prepaid churn | 2.67 | % | 2.58 | % | 2.88 | % | 2.93 | % | 2.76 | % | 2.62 | % | 2.81 | % | 2.71 | % | 2.73 | % | |||||||||||||||||||||||||||||||||||
| Quarter | Nine Months Ended September 30, | ||||||||||||||||||||||||||||||||||||||||||||||||||||
| Q1 2022 | Q2 2022 | Q3 2022 | Q4 2022 | Q1 2023 | Q2 2023 | Q3 2023 | 2022 | 2023 | |||||||||||||||||||||||||||||||||||||||||||||
| Postpaid upgrade rate | |||||||||||||||||||||||||||||||||||||||||||||||||||||
| Postpaid device upgrade rate | 4.8 | % | 4.1 | % | 3.8 | % | 3.9 | % | 3.2 | % | 2.6 | % | 2.7 | % | 12.7 | % | 8.5 | % | |||||||||||||||||||||||||||||||||||
| ||
|
22 |
||||
| Quarter | Nine Months Ended September 30, | ||||||||||||||||||||||||||||||||||||||||||||||||||||
| (in thousands) | Q1 2022 | Q2 2022 | Q3 2022 | Q4 2022 | Q1 2023 | Q2 2023 | Q3 2023 | 2022 | 2023 | ||||||||||||||||||||||||||||||||||||||||||||
| Accounts, end of period | |||||||||||||||||||||||||||||||||||||||||||||||||||||
Total postpaid customer accounts (1) |
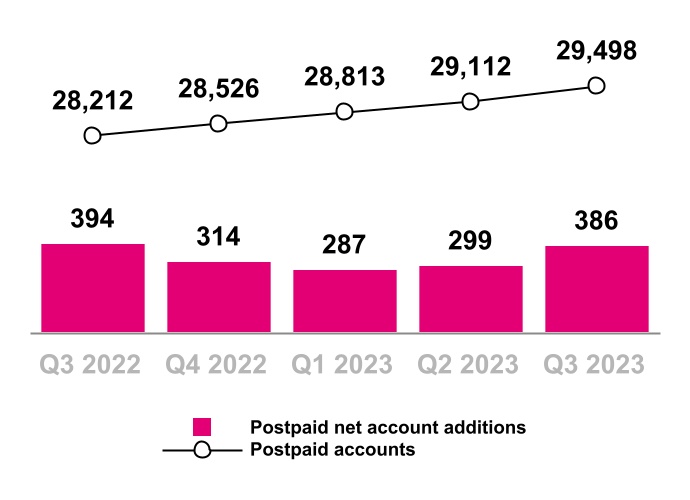
27,507 | 27,818 | 28,212 | 28,526 | 28,813 | 29,112 | 29,498 | 28,212 | 29,498 | ||||||||||||||||||||||||||||||||||||||||||||
| Quarter | Nine Months Ended September 30, | ||||||||||||||||||||||||||||||||||||||||||||||||||||
| (in thousands) | Q1 2022 | Q2 2022 | Q3 2022 | Q4 2022 | Q1 2023 | Q2 2023 | Q3 2023 | 2022 | 2023 | ||||||||||||||||||||||||||||||||||||||||||||
| Net account additions | |||||||||||||||||||||||||||||||||||||||||||||||||||||
| Postpaid net account additions | 348 | 380 | 394 | 314 | 287 | 299 | 386 | 1,122 | 972 | ||||||||||||||||||||||||||||||||||||||||||||
| Quarter | Nine Months Ended September 30, | ||||||||||||||||||||||||||||||||||||||||||||||||||||
| (in thousands) | Q1 2022 | Q2 2022 | Q3 2022 | Q4 2022 | Q1 2023 | Q2 2023 | Q3 2023 | 2022 | 2023 | ||||||||||||||||||||||||||||||||||||||||||||
| High speed internet customers, end of period | |||||||||||||||||||||||||||||||||||||||||||||||||||||
| Postpaid high speed internet customers | 975 | 1,472 | 1,960 | 2,410 | 2,855 | 3,302 | 3,807 | 1,960 | 3,807 | ||||||||||||||||||||||||||||||||||||||||||||
| Prepaid high speed internet customers | 9 | 72 | 162 | 236 | 314 | 376 | 428 | 162 | 428 | ||||||||||||||||||||||||||||||||||||||||||||
| Total high speed internet customers, end of period | 984 | 1,544 | 2,122 | 2,646 | 3,169 | 3,678 | 4,235 | 2,122 | 4,235 | ||||||||||||||||||||||||||||||||||||||||||||
| Quarter | Nine Months Ended September 30, | ||||||||||||||||||||||||||||||||||||||||||||||||||||
| (in thousands) | Q1 2022 | Q2 2022 | Q3 2022 | Q4 2022 | Q1 2023 | Q2 2023 | Q3 2023 | 2022 | 2023 | ||||||||||||||||||||||||||||||||||||||||||||
| High speed internet - net customer additions | |||||||||||||||||||||||||||||||||||||||||||||||||||||
| Postpaid high speed internet customers | 329 | 497 | 488 | 450 | 445 | 447 | 505 | 1,314 | 1,397 | ||||||||||||||||||||||||||||||||||||||||||||
| Prepaid high speed internet customers | 9 | 63 | 90 | 74 | 78 | 62 | 52 | 162 | 192 | ||||||||||||||||||||||||||||||||||||||||||||
| Total high speed internet net customer additions | 338 | 560 | 578 | 524 | 523 | 509 | 557 | 1,476 | 1,589 | ||||||||||||||||||||||||||||||||||||||||||||
| Quarter | Nine Months Ended September 30, | ||||||||||||||||||||||||||||||||||||||||||||||||||||
| (in millions, except percentages) | Q1 2022 | Q2 2022 | Q3 2022 | Q4 2022 | Q1 2023 | Q2 2023 | Q3 2023 | 2022 | 2023 | ||||||||||||||||||||||||||||||||||||||||||||
| Device financing - equipment installment plans | |||||||||||||||||||||||||||||||||||||||||||||||||||||
| Gross EIP financed | $ | 4,247 | $ | 3,580 | $ | 3,758 | $ | 4,103 | $ | 3,335 | $ | 2,858 | $ | 3,116 | $ | 11,585 | $ | 9,309 | |||||||||||||||||||||||||||||||||||
| EIP billings | 3,333 | 3,447 | 3,717 | 3,889 | 3,871 | 3,732 | 3,622 | 10,497 | 11,225 | ||||||||||||||||||||||||||||||||||||||||||||
| EIP receivables, net | 7,898 | 7,734 | 7,562 | 7,669 | 7,262 | 6,745 | 6,349 | 7,562 | 6,349 | ||||||||||||||||||||||||||||||||||||||||||||
| EIP receivables classified as prime | 61 | % | 61 | % | 61 | % | 59 | % | 59 | % | 59 | % | 62 | % | 61 | % | 62 | % | |||||||||||||||||||||||||||||||||||
| EIP receivables classified as prime (including EIP receivables sold) | 58 | % | 57 | % | 58 | % | 57 | % | 56 | % | 56 | % | 59 | % | 58 | % | 59 | % | |||||||||||||||||||||||||||||||||||
| Device financing - leased devices | |||||||||||||||||||||||||||||||||||||||||||||||||||||
| Lease revenues | $ | 487 | $ | 386 | $ | 311 | $ | 246 | $ | 147 | $ | 69 | $ | 53 | $ | 1,184 | $ | 269 | |||||||||||||||||||||||||||||||||||
| Leased device depreciation | 445 | 317 | 226 | 141 | 58 | 46 | 37 | 988 | 141 | ||||||||||||||||||||||||||||||||||||||||||||
| ||
|
23 |
||||
| Quarter | Nine Months Ended September 30, | ||||||||||||||||||||||||||||||||||||||||||||||||||||
| (in millions, except percentages) | Q1 2022 | Q2 2022 | Q3 2022 | Q4 2022 | Q1 2023 | Q2 2023 | Q3 2023 | 2022 | 2023 | ||||||||||||||||||||||||||||||||||||||||||||
| Financial measures | |||||||||||||||||||||||||||||||||||||||||||||||||||||
| Service revenues | $ | 15,128 | $ | 15,316 | $ | 15,361 | $ | 15,518 | $ | 15,546 | $ | 15,738 | $ | 15,914 | $ | 45,805 | $ | 47,198 | |||||||||||||||||||||||||||||||||||
| Equipment revenue | $ | 4,694 | $ | 4,130 | $ | 3,855 | $ | 4,451 | $ | 3,719 | $ | 3,169 | $ | 3,076 | $ | 12,679 | $ | 9,964 | |||||||||||||||||||||||||||||||||||
| Lease revenues | 487 | 386 | 311 | 246 | 147 | 69 | 53 | 1,184 | 269 | ||||||||||||||||||||||||||||||||||||||||||||
| Equipment sales | $ | 4,207 | $ | 3,744 | $ | 3,544 | $ | 4,205 | $ | 3,572 | $ | 3,100 | $ | 3,023 | $ | 11,495 | $ | 9,695 | |||||||||||||||||||||||||||||||||||
| Total revenues | $ | 20,120 | $ | 19,701 | $ | 19,477 | $ | 20,273 | $ | 19,632 | $ | 19,196 | $ | 19,252 | $ | 59,298 | $ | 58,080 | |||||||||||||||||||||||||||||||||||
| Net income (loss) | $ | 713 | $ | (108) | $ | 508 | $ | 1,477 | $ | 1,940 | $ | 2,221 | $ | 2,142 | $ | 1,113 | $ | 6,303 | |||||||||||||||||||||||||||||||||||
| Net income (loss) margin | 4.7 | % | (0.7) | % | 3.3 | % | 9.5 | % | 12.5 | % | 14.1 | % | 13.5 | % | 2.4 | % | 13.4 | % | |||||||||||||||||||||||||||||||||||
| Adjusted EBITDA | $ | 6,950 | $ | 7,004 | $ | 7,039 | $ | 6,828 | $ | 7,199 | $ | 7,405 | $ | 7,600 | $ | 20,993 | $ | 22,204 | |||||||||||||||||||||||||||||||||||
| Adjusted EBITDA margin | 45.9 | % | 45.7 | % | 45.8 | % | 44.0 | % | 46.3 | % | 47.1 | % | 47.8 | % | 45.8 | % | 47.0 | % | |||||||||||||||||||||||||||||||||||
| Core Adjusted EBITDA | $ | 6,463 | $ | 6,618 | $ | 6,728 | $ | 6,582 | $ | 7,052 | $ | 7,336 | $ | 7,547 | $ | 19,809 | $ | 21,935 | |||||||||||||||||||||||||||||||||||
| Core Adjusted EBITDA margin | 42.7 | % | 43.2 | % | 43.8 | % | 42.4 | % | 45.4 | % | 46.6 | % | 47.4 | % | 43.2 | % | 46.5 | % | |||||||||||||||||||||||||||||||||||
| Cost of services | $ | 3,727 | $ | 4,060 | $ | 3,712 | $ | 3,167 | $ | 3,061 | $ | 2,916 | $ | 2,886 | $ | 11,499 | $ | 8,863 | |||||||||||||||||||||||||||||||||||
| Merger-related costs | 607 | 961 | 812 | 290 | 208 | 178 | 120 | 2,380 | 506 | ||||||||||||||||||||||||||||||||||||||||||||
| Cost of services excluding Merger-related costs | $ | 3,120 | $ | 3,099 | $ | 2,900 | $ | 2,877 | $ | 2,853 | $ | 2,738 | $ | 2,766 | $ | 9,119 | $ | 8,357 | |||||||||||||||||||||||||||||||||||
| Cost of equipment sales | $ | 5,946 | $ | 5,108 | $ | 4,982 | $ | 5,504 | $ | 4,588 | $ | 4,088 | $ | 4,249 | $ | 16,036 | $ | 12,925 | |||||||||||||||||||||||||||||||||||
| Merger-related costs | 751 | 459 | 258 | 56 | (9) | — | (3) | 1,468 | (12) | ||||||||||||||||||||||||||||||||||||||||||||
| Cost of equipment sales excluding Merger-related costs | $ | 5,195 | $ | 4,649 | $ | 4,724 | $ | 5,448 | $ | 4,597 | $ | 4,088 | $ | 4,252 | $ | 14,568 | $ | 12,937 | |||||||||||||||||||||||||||||||||||
| Selling, general and administrative | $ | 5,056 | $ | 5,856 | $ | 5,118 | $ | 5,577 | $ | 5,425 | $ | 5,272 | $ | 5,334 | $ | 16,030 | $ | 16,031 | |||||||||||||||||||||||||||||||||||
| Merger-related costs | 55 | 248 | 226 | 246 | 159 | 98 | 35 | 529 | 292 | ||||||||||||||||||||||||||||||||||||||||||||
| Selling, general and administrative excluding Merger-related costs | $ | 5,001 | $ | 5,608 | $ | 4,892 | $ | 5,331 | $ | 5,266 | $ | 5,174 | $ | 5,299 | $ | 15,501 | $ | 15,739 | |||||||||||||||||||||||||||||||||||
| Total bad debt expense and losses from sales of receivables | $ | 256 | $ | 373 | $ | 300 | $ | 311 | $ | 260 | $ | 264 | $ | 274 | $ | 929 | $ | 798 | |||||||||||||||||||||||||||||||||||
| Bad debt and losses from sales of receivables as a percentage of Total revenues | 1.3 | % | 1.9 | % | 1.5 | % | 1.5 | % | 1.3 | % | 1.4 | % | 1.4 | % | 1.6 | % | 1.4 | % | |||||||||||||||||||||||||||||||||||
| Cash purchases of property and equipment including capitalized interest | $ | 3,381 | $ | 3,572 | $ | 3,634 | $ | 3,383 | $ | 3,001 | $ | 2,789 | $ | 2,424 | $ | 10,587 | $ | 8,214 | |||||||||||||||||||||||||||||||||||
| Capitalized interest | 15 | 13 | 16 | 17 | 14 | 14 | 66 | 44 | 94 | ||||||||||||||||||||||||||||||||||||||||||||
| Net cash proceeds from securitization | (3) | (10) | (18) | (26) | (29) | (31) | (33) | (31) | (93) | ||||||||||||||||||||||||||||||||||||||||||||
| Operating measures | |||||||||||||||||||||||||||||||||||||||||||||||||||||
| Postpaid ARPA | $ | 136.53 | $ | 137.92 | $ | 137.49 | $ | 137.78 | $ | 138.04 | $ | 138.94 | $ | 139.83 | $ | 137.32 | $ | 138.94 | |||||||||||||||||||||||||||||||||||
| Postpaid phone ARPU | 48.41 | 48.96 | 48.89 | 48.86 | 48.63 | 48.84 | 48.93 | 48.75 | 48.80 | ||||||||||||||||||||||||||||||||||||||||||||
| Prepaid ARPU | 39.19 | 38.71 | 38.86 | 38.29 | 37.98 | 37.98 | 38.18 | 38.92 | 38.05 | ||||||||||||||||||||||||||||||||||||||||||||
| ||
|
24 |
||||
| Quarter | Nine Months Ended September 30, | ||||||||||||||||||||||||||||||||||||||||||||||||||||
| (in millions, except percentages) | Q1 2022 | Q2 2022 | Q3 2022 | Q4 2022 | Q1 2023 | Q2 2023 | Q3 2023 | 2022 | 2023 | ||||||||||||||||||||||||||||||||||||||||||||
| Net income (loss) | $ | 713 | $ | (108) | $ | 508 | $ | 1,477 | $ | 1,940 | $ | 2,221 | $ | 2,142 | $ | 1,113 | $ | 6,303 | |||||||||||||||||||||||||||||||||||
| Adjustments: | |||||||||||||||||||||||||||||||||||||||||||||||||||||
| Interest expense, net | 864 | 851 | 827 | 822 | 835 | 861 | 790 | 2,542 | 2,486 | ||||||||||||||||||||||||||||||||||||||||||||
| Other expense (income), net | 11 | 21 | 3 | (2) | (9) | (6) | (41) | 35 | (56) | ||||||||||||||||||||||||||||||||||||||||||||
| Income tax expense (benefit) | 218 | (55) | (57) | 450 | 631 | 717 | 705 | 106 | 2,053 | ||||||||||||||||||||||||||||||||||||||||||||
| Operating income | 1,806 | 709 | 1,281 | 2,747 | 3,397 | 3,793 | 3,596 | 3,796 | 10,786 | ||||||||||||||||||||||||||||||||||||||||||||
| Depreciation and amortization | 3,585 | 3,491 | 3,313 | 3,262 | 3,203 | 3,110 | 3,187 | 10,389 | 9,500 | ||||||||||||||||||||||||||||||||||||||||||||
Stock-based compensation (1) |
136 | 149 | 145 | 146 | 173 | 155 | 152 | 430 | 480 | ||||||||||||||||||||||||||||||||||||||||||||
| Merger-related costs | 1,413 | 1,668 | 1,296 | 592 | 358 | 276 | 152 | 4,377 | 786 | ||||||||||||||||||||||||||||||||||||||||||||
| Impairment expense | — | 477 | — | — | — | — | — | 477 | — | ||||||||||||||||||||||||||||||||||||||||||||
Legal-related expenses (recoveries), net (2) |
— | 400 | (19) | 10 | (43) | — | — | 381 | (43) | ||||||||||||||||||||||||||||||||||||||||||||
| Loss (gain) on disposal group held for sale | — | — | 1,071 | 16 | (42) | 17 | — | 1,071 | (25) | ||||||||||||||||||||||||||||||||||||||||||||
Other, net (3) |
10 | 110 | (48) | 55 | 153 | 54 | 513 | 72 | 720 | ||||||||||||||||||||||||||||||||||||||||||||
| Adjusted EBITDA | 6,950 | 7,004 | 7,039 | 6,828 | 7,199 | 7,405 | 7,600 | 20,993 | 22,204 | ||||||||||||||||||||||||||||||||||||||||||||
| Lease revenues | (487) | (386) | (311) | (246) | (147) | (69) | (53) | (1,184) | (269) | ||||||||||||||||||||||||||||||||||||||||||||
| Core Adjusted EBITDA | $ | 6,463 | $ | 6,618 | $ | 6,728 | $ | 6,582 | $ | 7,052 | $ | 7,336 | $ | 7,547 | $ | 19,809 | $ | 21,935 | |||||||||||||||||||||||||||||||||||
| Net income (loss) margin (Net income (loss) divided by Service revenues) | 4.7 | % | (0.7) | % | 3.3 | % | 9.5 | % | 12.5 | % | 14.1 | % | 13.5 | % | 2.4 | % | 13.4 | % | |||||||||||||||||||||||||||||||||||
| Adjusted EBITDA margin (Adjusted EBITDA divided by Service revenues) | 45.9 | % | 45.7 | % | 45.8 | % | 44.0 | % | 46.3 | % | 47.1 | % | 47.8 | % | 45.8 | % | 47.0 | % | |||||||||||||||||||||||||||||||||||
| Core Adjusted EBITDA margin (Core Adjusted EBITDA divided by Service revenues) | 42.7 | % | 43.2 | % | 43.8 | % | 42.4 | % | 45.4 | % | 46.6 | % | 47.4 | % | 43.2 | % | 46.5 | % | |||||||||||||||||||||||||||||||||||
| ||
|
25 |
||||
| (in millions, except net debt ratios) | Mar 31, 2022 |
Jun 30, 2022 |
Sep 30, 2022 |
Dec 31, 2022 |
Mar 31, 2023 |
Jun 30, 2023 |
Sep 30, 2023 |
||||||||||||||||||||||||||||||||||
| Short-term debt | $ | 2,865 | $ | 2,942 | $ | 7,398 | $ | 5,164 | $ | 5,215 | $ | 7,731 | $ | 3,437 | |||||||||||||||||||||||||||
| Short-term debt to affiliates | 1,250 | — | — | — | — | — | — | ||||||||||||||||||||||||||||||||||
| Short-term financing lease liabilities | 1,121 | 1,220 | 1,239 | 1,161 | 1,180 | 1,220 | 1,286 | ||||||||||||||||||||||||||||||||||
| Long-term debt | 66,861 | 66,552 | 64,834 | 65,301 | 68,035 | 68,646 | 70,365 | ||||||||||||||||||||||||||||||||||
| Long-term debt to affiliates | 1,494 | 1,495 | 1,495 | 1,495 | 1,495 | 1,495 | 1,496 | ||||||||||||||||||||||||||||||||||
| Financing lease liabilities | 1,447 | 1,597 | 1,590 | 1,370 | 1,284 | 1,254 | 1,273 | ||||||||||||||||||||||||||||||||||
| Less: Cash and cash equivalents | (3,245) | (3,151) | (6,888) | (4,507) | (4,540) | (6,647) | (5,030) | ||||||||||||||||||||||||||||||||||
| Net debt (excluding tower obligations) | $ | 71,793 | $ | 70,655 | $ | 69,668 | $ | 69,984 | $ | 72,669 | $ | 73,699 | $ | 72,827 | |||||||||||||||||||||||||||
| Divided by: Last twelve months Net income | $ | 2,804 | $ | 1,718 | $ | 1,535 | $ | 2,590 | $ | 3,817 | $ | 6,146 | $ | 7,780 | |||||||||||||||||||||||||||
| Net debt (excluding tower obligations) to LTM Net income Ratio | 25.6 | 41.1 | 45.4 | 27.0 | 19.0 | 12.0 | 9.4 | ||||||||||||||||||||||||||||||||||
| Divided by: Last twelve months Adjusted EBITDA | $ | 26,969 | $ | 27,067 | $ | 27,295 | $ | 27,821 | $ | 28,070 | $ | 28,471 | $ | 29,032 | |||||||||||||||||||||||||||
| Net debt (excluding tower obligations) to LTM Adjusted EBITDA Ratio | 2.7 | 2.6 | 2.6 | 2.5 | 2.6 | 2.6 | 2.5 | ||||||||||||||||||||||||||||||||||
| Divided by: Last twelve months Core Adjusted EBITDA | $ | 24,175 | $ | 24,801 | $ | 25,488 | $ | 26,391 | $ | 26,980 | $ | 27,698 | $ | 28,517 | |||||||||||||||||||||||||||
| Net debt (excluding tower obligations) to LTM Core Adjusted EBITDA Ratio | 3.0 | 2.8 | 2.7 | 2.7 | 2.7 | 2.7 | 2.6 | ||||||||||||||||||||||||||||||||||
| Quarter | Nine Months Ended September 30, | ||||||||||||||||||||||||||||||||||||||||||||||||||||
| (in millions, except percentages) | Q1 2022 | Q2 2022 | Q3 2022 | Q4 2022 | Q1 2023 | Q2 2023 | Q3 2023 | 2022 | 2023 | ||||||||||||||||||||||||||||||||||||||||||||
| Net cash provided by operating activities | $ | 3,845 | $ | 4,209 | $ | 4,391 | $ | 4,336 | $ | 4,051 | $ | 4,355 | $ | 5,294 | $ | 12,445 | $ | 13,700 | |||||||||||||||||||||||||||||||||||
| Cash purchases of property and equipment, including capitalized interest | (3,381) | (3,572) | (3,634) | (3,383) | (3,001) | (2,789) | (2,424) | (10,587) | (8,214) | ||||||||||||||||||||||||||||||||||||||||||||
| Proceeds from sales of tower sites | — | — | — | 9 | 6 | 2 | 2 | — | 10 | ||||||||||||||||||||||||||||||||||||||||||||
| Proceeds related to beneficial interests in securitization transactions | 1,185 | 1,121 | 1,308 | 1,222 | 1,345 | 1,309 | 1,131 | 3,614 | 3,785 | ||||||||||||||||||||||||||||||||||||||||||||
| Adjusted Free Cash Flow | $ | 1,649 | $ | 1,758 | $ | 2,065 | $ | 2,184 | $ | 2,401 | $ | 2,877 | $ | 4,003 | $ | 5,472 | $ | 9,281 | |||||||||||||||||||||||||||||||||||
Net cash provided by operating activities margin |
25.4 | % | 27.5 | % | 28.6 | % | 27.9 | % | 26.1 | % | 27.7 | % | 33.3 | % | 27.2 | % | 29.0 | % | |||||||||||||||||||||||||||||||||||
Adjusted Free Cash Flow margin |
10.9 | % | 11.5 | % | 13.4 | % | 14.1 | % | 15.4 | % | 18.3 | % | 25.2 | % | 11.9 | % | 19.7 | % | |||||||||||||||||||||||||||||||||||
| ||
|
26 |
||||
| FY 2023 | |||||||||||
| (in millions) | Guidance Range | ||||||||||
| Net cash provided by operating activities | $ | 18,300 | $ | 18,500 | |||||||
| Cash purchases of property and equipment, including capitalized interest | (9,600) | (9,800) | |||||||||
Proceeds related to beneficial interests in securitization transactions (1) |
4,700 | 4,900 | |||||||||
| Adjusted Free Cash Flow | $ | 13,400 | $ | 13,600 | |||||||
| FY 2023 | |||||||||||
| (in millions) | Guidance Range | ||||||||||
| Net cash provided by operating activities | $ | 18,000 | $ | 18,300 | |||||||
| Cash purchases of property and equipment, including capitalized interest | (9,500) | (9,700) | |||||||||
Proceeds related to beneficial interests in securitization transactions (1) |
4,700 | 5,000 | |||||||||
| Adjusted Free Cash Flow | $ | 13,200 | $ | 13,600 | |||||||
| ||
|
27 |
||||
| ||
|
28 |
||||
| ||
|
29 |
||||
| ||