UNITED STATES
SECURITIES AND EXCHANGE COMMISSION
Washington, D.C. 20549
FORM 8-K
CURRENT REPORT
Pursuant to Section 13 or 15(d)
of The Securities Exchange Act of 1934
Date of Report (Date of earliest event reported) November 4, 2025
NEURONETICS, INC.
(Exact name of registrant as specified in its charter)
| Delaware | 001-38546 | 33-1051425 | ||
| (State or other jurisdiction of incorporation) |
(Commission File Number) |
(I.R.S. Employer Identification No.) |
| 3222 Phoenixville Pike, Malvern, PA | 19355 | |
| (Address of principal executive offices) | (Zip Code) |
Registrant’s telephone number, including area code (877) 600-7555
(Former name or former address, if changed since last report.) Not applicable.
Securities registered pursuant to Section 12(b) of the Act:
| Title of each class |
Trading |
Name on each exchange |
||
| Common Stock ($0.01 par value) | STIM | The Nasdaq Global Market |
Check the appropriate box below if the Form 8-K filing is intended to simultaneously satisfy the filing obligation of the registrant under any of the following provisions:
| ☐ | Written communications pursuant to Rule 425 under the Securities Act (17 CFR 230.425) |
| ☐ | Soliciting material pursuant to Rule 14a-12 under the Exchange Act (17 CFR 240.14a-12) |
| ☐ | Pre-commencement communications pursuant to Rule 14d-2(b) under the Exchange Act (17 CFR 240.14d-2(b)) |
| ☐ | Pre-commencement communications pursuant to Rule 13e-4(c) under the Exchange Act (17 CFR 240.13e-4(c)) |
Indicate by check mark whether the registrant is an emerging growth company as defined in Rule 405 of the Securities Act of 1933 or Rule 12b-2 of the Securities Exchange Act of 1934.
Emerging growth company ☐
If an emerging growth company, indicate by check mark if the registrant has elected not to use the extended transition period for complying with any new or revised financial accounting standards provided pursuant to Section 13(a) of the Exchange Act. ☐
| Item 2.02 | Results of Operations and Financial Condition. |
Neuronetics, Inc. (the “Company”) issued a press release on November 4, 2025, announcing its financial results for the three months ended September 30, 2025. A copy of the press release is being furnished to the Securities and Exchange Commission (“SEC”) as Exhibit 99.1 to this report on Form 8-K and is incorporated by reference to this Item 2.02.
***
The information furnished pursuant to Item 2.02, including Exhibit 99.1, shall not be deemed to be “filed” for purposes of Section 18 of the Securities Exchange Act of 1934, as amended (the “Exchange Act”), or otherwise subject to the liabilities of that section, nor shall it be deemed to be incorporated by reference into any of the Company’s filings with the SEC under the Exchange Act or the Securities Act of 1933, as amended (the “Securities Act”), whether made before or after the date hereof, regardless of any general incorporation language in such a filing, except as expressly set forth by specific reference in such a filing. Except as required by law, the Company undertakes no duty or obligation to publicly update or revise the information so furnished.
| Item 5.02 | Departure of Directors or Certain Officers; Election of Directors; Appointment of Certain Officers; Compensatory Arrangements of Certain Officers. |
On November 4, 2025, the Company announced that Keith J. Sullivan, who has served as President and Chief Executive Officer since July 14, 2020, informed the Board of Directors (the “Board”) of his intention to retire on June 30, 2026. The Company has commenced a search for Mr. Sullivan’s successor. Mr. Sullivan will continue in his current position until a successor is hired. Once a successor is appointed, Mr. Sullivan will remain as a consultant to ensure a seamless transition. Mr. Sullivan’s decision to resign is not the result of any dispute or disagreement with the Company, the Company’s management or the Company’s Board on any matter relating to the Company’s operations, policies or practices.
| Item 7.01 | Regulation FD Disclosure. |
On November 4, 2025, Neuronetics released a presentation (the “Presentation”) that it may present to certain investors. A copy of the Presentation is attached hereto as Exhibit 99.2. The information contained in Exhibit 99.2 is incorporated herein by reference.
The information in this report furnished pursuant to Item 7.01, including Exhibit 99.2, shall not be deemed “filed” for the purposes of Section 18 of the Exchange Act, or otherwise subject to the liabilities of that section, nor shall it be deemed to be incorporated by reference into any of the Company’s filings with the SEC under the Exchange Act or the Securities Act whether made before or after the date hereof, regardless of any general incorporation language in such a filing, except as expressly set forth by specific reference in such a filing. Except as required by law, the Company undertakes no duty or obligation to publicly update or revise the information so furnished.
“Safe harbor” statement under the Private Securities Litigation Reform Act of 1995:
Certain statements in this report, including the documents incorporated by reference herein, include “forward-looking statements” within the meaning of Section 27A of the Securities Act, Section 21E of the Exchange Act, which are intended to be covered by the safe harbors created by those laws and other applicable laws and “forward-looking information” within the meaning of applicable Canadian securities laws. Statements in this report that are not historical facts constitute “forward-looking statements” within the meaning of the Private Securities Litigation Reform Act of 1995. These forward-looking statements may be identified by terms such as “may,” “will,” “would,” “should,” “expect,” “plan,” “design,” “anticipate,” “could,” “intend,” “target,” “project,” “contemplate,” “believe,” “estimate,” “predict,” “potential,” “outlook” or “continue” as well as the negative of these terms and similar expressions. These statements include those relating to the Company’s business outlook and current expectations for upcoming quarters and fiscal year 2025, including with respect to revenue, expenses, growth, and any statements of assumptions underlying any of the foregoing items.
These statements are subject to significant risks and uncertainties and actual results could differ materially from those projected. The Company cautions investors not to place undue reliance on the forward-looking statements contained in this report. These risks and uncertainties include, without limitation, risks and uncertainties related to: the effect of the transaction with Greenbrook on our business relationships; operating results and business generally; our ability to execute our business strategy; our ability to achieve or sustain profitable operations due to our history of losses; our reliance on the sale and usage of our NeuroStar Advanced Therapy System to generate revenues; the scale and efficacy of our salesforce; our ability to retain talent; availability of coverage and reimbursement from third-party payors for treatments using our products; physician and patient demand for treatments using our products; developments in respect of competing technologies and therapies for the indications that our products treat; product defects; our revenue concentration among a small number of customers; our ability to obtain and maintain intellectual property protection for our technology; developments in clinical trials or regulatory review of the NeuroStar Advanced Therapy System for additional indications; developments in regulation in the U.S. and other applicable jurisdictions; potential effects of evolving and/or extensive government regulation; the terms of our credit facility; our ability to successfully roll-out our Better Me Provider Program on the planned timeline; our self-sustainability and existing cash balances; and our ability to achieve cash flow breakeven in the fourth quarter of 2025. For a discussion of these and other related risks, please refer to the Company’s recent filings with the SEC, which are available on the SEC’s website at www.sec.gov, including, without limitation, the factors described under the heading “Risk Factors” in Neuronetics’ Annual Report on Form 10-K for the fiscal year ended December 31, 2024, as may be updated or supplemented by subsequent reports that Neuronetics has filed or files with the SEC. These forward-looking statements are based on the Company’s expectations and assumptions as of the date of this report. Except as required by law, the Company undertakes no duty or obligation to update any forward-looking statements contained in this report as a result of new information, future events, or changes in the Company’s expectations.
| Item 9.01 | Financial Statements and Exhibits. |
(d) Exhibits.
| Exhibit Number |
Description | |
| 99.1 | Press Release, dated November 4, 2025, of Neuronetics, Inc. | |
| 99.2 | Company Presentation November 2025 | |
| 104 | Cover Page Interactive Data File (embedded within the Inline XBRL document) | |
SIGNATURE
Pursuant to the requirements of the Securities Exchange Act of 1934, the registrant has duly caused this report to be signed on its behalf by the undersigned hereunto duly authorized.
| NEURONETICS, INC. | ||||||
| (Registrant)
|
||||||
| Date: November 4, 2025 | By: | /s/ Steven E. Pfanstiel |
||||
| Name: | Steven E. Pfanstiel | |||||
| Title: | EVP, Chief Financial Officer and Treasurer | |||||
Exhibit 99.1

Neuronetics Reports Third Quarter 2025 Financial and Operating Results and Announces CEO Transition Plan
Delivered $37.3 million total revenue in Q3 2025, representing 11% adjusted pro forma revenue growth versus Q3 2024
Generated Greenbrook clinic revenue of $21.8 million in Q3 2025, an increase of 25% on an adjusted pro forma basis versus Q3 2024
Continued cash management improvement, with cash used in operations of $0.8 million in Q3 2025
Strengthened balance sheet in Q3 2025, ending the quarter with $34.5 million of total cash, consisting of cash, cash equivalents, and restricted cash
MALVERN, PA., November 4, 2025 – Neuronetics, Inc., (NASDAQ: STIM) (the “Company” or “Neuronetics”) a vertically integrated, commercial stage, medical technology and healthcare company with a strategic vision of transforming the lives of patients whenever and wherever they need help, with the leading neurohealth therapies in the world, today announced its financial and operating results for the third quarter of 2025 and the intention of Keith J. Sullivan, Neuronetics’ President and Chief Executive Officer, to retire effective June 30, 2026.
Third Quarter 2025 Highlights
| • | Third quarter 2025 revenue of $37.3 million, an 11% increase as compared to the third quarter 2024 on an adjusted pro forma basis and a 101% increase as compared to the third quarter 2024 on an unadjusted basis |
| • | U.S. Greenbrook clinic revenue of $21.8 million in the quarter, representing 25% growth on an adjusted pro forma basis as compared to the third quarter of 2024 |
| • | U.S. NeuroStar Advanced Therapy System revenue of $3.5 million, shipping 40 systems |
Recent Operational Highlights
| • | Achieved milestone of over 229,429 global patients treated with 8.2 million treatment sessions |
| • | New York State Medicaid Expands Coverage for TMS Therapy, Including NeuroStar Advanced Therapy, to Treat Major Depressive Disorder |
| • | Received an additional $10 million of funding under the Perceptive debt agreement, and extended the $2 million minimum liquidity requirement from September 2025 to September 2026 |
| • | Raised $7.8 million in net proceeds through the sale of approximately 2.3 million shares of its common stock under its at-the-market (“ATM”) facility. |
“Our third quarter results reflect continued progress as we integrate and optimize our combined operations,” said Keith Sullivan, President and Chief Executive Officer of Neuronetics “On an adjusted pro forma basis, we delivered 11% revenue growth, with particularly strong performance from our Greenbrook clinics. We are finding opportunities to improve efficiency across both the Greenbrook clinic network and NeuroStar business, taking advantage of our combined scale, which is driving meaningful progress toward cash flow positivity. The momentum we’re building gives us confidence in our ability to deliver value for both patients and shareholders.”
The Company also announced that Mr. Sullivan has informed the Board of Directors of his intention to retire as President and Chief Executive Officer on June 30, 2026. The Company has commenced a search for Mr. Sullivan’s successor. Once a successor is appointed, Mr. Sullivan has agreed to remain as a consultant after his retirement and will work closely with the new CEO to ensure a seamless transition.
“Keith has been instrumental in transforming Neuronetics in his five years as CEO. In particular, the strategic acquisition of Greenbrook TMS has vertically integrated the Company’s value chain and positioned the Company well for long-term growth,” said Rob Cascella, the Company’s Chairman of the Board. “We want to thank Keith for his dedication to the Company and look forward to his participation in our comprehensive search process to identify the ideal candidate to lead Neuronetics through its next stage of growth.”
Third Quarter 2025 Financial and Operating Results for the Three Months Ended September 30, 2025
| Revenues by Geography Three Months Ended September 30, |
||||||||||||
| 2025 | 2024 | |||||||||||
| Amount | Amount | % Change | ||||||||||
| (Unaudited; in thousands, except percentages) | ||||||||||||
| U.S. |
$ | 36,248 | $ | 17,922 | 102 | % | ||||||
| International |
1,049 | 608 | 73 | % | ||||||||
|
|
|
|
|
|
|
|||||||
| Total revenues |
$ | 37,297 | $ | 18,530 | 101 | % | ||||||
|
|
|
|
|
|
|
|||||||
Total revenues for the three months ended September 30, 2025 was $37.3 million, an increase of 101% compared to revenues of $18.5 million in the third quarter of 2024, primarily driven by the acquisition of Greenbrook TMS Inc. (“Greenbrook”). During the quarter, total U.S. revenue increased by 102% and international revenue increased 73% over the third quarter of 2024. The increase in revenue was primarily attributable to U.S. clinic revenue of $21.8 million, added as a result of the acquisition of Greenbrook, partially offset by the absence of prior year quarter sales to Greenbrook of $2.4 million and a decrease of sales of $0.6 million relating to NeuroStar Advanced Therapy Systems and treatment session revenue.
| U.S. Revenues by Product Category Three Months Ended September 30, |
||||||||||||
| 2025 | 2024 | |||||||||||
| Amount | Amount | % Change | ||||||||||
| (Unaudited; in thousands, except percentages) | ||||||||||||
| NeuroStar Advanced Therapy System |
$ | 3,508 | $ | 4,108 | (15 | )% | ||||||
| Treatment sessions |
10,543 | 13,326 | (21 | )% | ||||||||
| Clinic revenue |
21,808 | — | — | % | ||||||||
| Other |
389 | 488 | (20 | )% | ||||||||
|
|
|
|
|
|
|
|||||||
| Total U.S. revenues |
$ | 36,248 | $ | 17,922 | 102 | % | ||||||
|
|
|
|
|
|
|
|||||||
U.S. NeuroStar Advanced Therapy System revenue for the three months ended September 30, 2025 was $3.5 million a decrease of 15% compared to $4.1 million in the third quarter of 2024. For the three months ended September 30, 2025, the Company shipped 40 systems. Following our previously announced realignment of our capital team, the number of units shipped in the third quarter of 2025 was below the prior year quarter, but in line with our focus on strategic higher volume accounts.
U.S. treatment session revenue for the three months ended September 30, 2025 was $10.5 million, a decrease of 21% compared to $13.3 million in the third quarter of 2024. The decline was primarily attributable to the absence of $2.2 million in treatment session revenue from Greenbrook. On a pro forma basis, U.S treatment session revenue decreased 5.1% compared to $11.1 million in the third quarter of 2024. The decrease in third quarter treatment session revenue versus the prior year is largely due to the impact of a change in customer purchasing patterns, which led to higher increased customer inventory levels during 2024.
U.S. clinic revenue, which represents revenue generated by treatment centers from the Greenbrook acquisition, was $21.8 million for the three months ended September 30, 2025. On an adjusted pro forma basis, clinic revenue increased 25% compared to the third quarter of 2024.
Gross margin for the third quarter of 2025 was 45.9% compared to the third quarter of 2024 gross margin of 75.6%. The decrease in gross margin was primarily a result of the inclusion of Greenbrook’s clinic business.
Operating expenses during the third quarter of 2025 were $24.4 million, an increase of $2.7 million, or 12%, compared to $21.7 million in the third quarter of 2024, mainly attributable to inclusion of Greenbrook’s general and administrative expenses of $6.1 million, partially offset by savings in general, administrative, sales, and marketing expenses.
Net loss for the third quarter of 2025 was $(9.4) million, or $(0.13) per share, as compared to $(13.3) million, or $(0.44) per share, in the third quarter of 2024. Net loss per share was based on 67,308,607 and 30,267,236 weighted average common shares outstanding for the third quarters of 2025 and 2024, respectively.
As of September 30, 2025, the Company held $34.5 million in total cash, consisting of cash and cash equivalents of $28.0 million and $6.5 million of restricted cash, which is compared to $19.5 million as of December 31, 2024. Cash used in operations for the third quarter was $0.8 million, representing a continued improvement in operating cash flow and validating the operational initiatives implemented during the year.
Company Secures $10 Million in Additional Funding from Perceptive
In August 2025, Neuronetics received $10.0 million of additional funding under the existing debt agreement with Perceptive Credit Holdings IV, LP. The Company became eligible for the funds as a result of achieving required revenue conditions under the Tranche 2 funds. Neuronetics also remains eligible for an additional $5 million of Tranche 2 funding, subject to certain customary conditions described in the agreement. The $2 million minimum liquidity requirement was extended from September 2025 through September 2026, after which the requirement becomes $5 million.
At-the-Market Equity Offering
During the period ended September 30, 2025, the Company sold an aggregate of 2,261,835 shares of its common stock under its ATM facility at an average price of $3.68 per share, generating gross proceeds of $8.3 million. After paying sales commissions of $0.3 million and incurring additional offering-related expenses of $0.2 million, the Company generated net proceeds of approximately $7.8 million. The Company intends to use the net proceeds for general corporate purposes, including working capital and growth initiatives.
New York State Medicaid Expands Coverage for TMS Therapy, Including NeuroStar Advanced Therapy, to Treat Major Depressive Disorder
Neuronetics announced that New York State Medicaid will begin covering transcranial magnetic stimulation (“TMS”) therapy for adults diagnosed with major depressive disorder (“MDD”), expanding access to over 5 million members statewide. Coverage took effect October 1, 2025, for fee-for-service Medicaid members and November 1, 2025, for those in managed care plans. This milestone underscores growing recognition of TMS as an effective, non-drug treatment for depression and reflects Neuronetics’ continued commitment to improving access to advanced mental health therapies through its NeuroStar Advanced Therapy system.
Business Outlook
For the fourth quarter of 2025, the Company expects total worldwide revenue between $40 million and $43 million.
For the full year 2025, the Company now expects its total worldwide revenue to be between $147 million and $150 million, compared to previous guidance of $149 million and $155 million.
For the full year 2025, the Company now expects gross margin to be between 47% and 49% compared to previous guidance of 48% and 50%. The change is driven by a shift in the overall mix of the business.
For the full year 2025, the Company continues to expect total operating expenses to be between $100 million and $105 million.
We continue to target positive cash flow from operations in the fourth quarter of 2025, with a range of between $2 million of positive to $2 million of negative operating cash flow. We further project year end 2025 total cash, consisting of cash, cash equivalents, and restricted cash to be in the range of $32 million and $36 million.
Webcast and Conference Call Information
The conference call will be broadcast live in listen-only mode via webcast at https://edge.media-server.com/mmc/p/yxrs8osc. To listen to the conference call on your telephone, you may register for the call here. While it is not required, it is recommended you join 10 minutes prior to the event start.
About Neuronetics
Neuronetics, Inc. believes that mental health is as important as physical health. As a global leader in neuroscience, Neuronetics is delivering more treatment options to patients and physicians by offering exceptional in-office treatments that produce extraordinary results. NeuroStar Advanced Therapy (“NeuroStar Therapy”) is a non-drug, noninvasive treatment that can improve the quality of life for people suffering from neurohealth conditions when traditional medication has not helped. In addition to selling the NeuroStar Advanced Therapy System (the “NeuroStar System”) and associated treatment sessions to customers, Neuronetics operates Greenbrook treatment centers across the United States, acquired in December 2024, offering NeuroStar Therapy, SPRAVATO®, and other treatment modalities for the treatment of MDD and other mental health disorders.
NeuroStar Therapy is indicated for the treatment of depressive episodes and for decreasing anxiety symptoms for those who may exhibit comorbid anxiety symptoms in adult patients suffering from MDD and who failed to achieve satisfactory improvement from previous antidepressant medication treatment in the current episode. It is also cleared by the U.S. Food and Drug Administration as an adjunct for adults with obsessive-compulsive disorder and for adolescent patients aged 15 to 21 with MDD. Neuronetics is committed to transforming lives by offering an exceptional treatment that produces extraordinary results.
“Safe harbor” statement under the Private Securities Litigation Reform Act of 1995:
Certain statements in this press release, including the documents incorporated by reference herein, include “forward-looking statements” within the meaning of Section 27A of the Securities Act of 1933, as amended (the “Securities Act”), Section 21E of the Securities Exchange Act of 1934, as amended, which are intended to be covered by the safe harbors created by those laws and other applicable laws and “forward-looking information” within the meaning of applicable Canadian securities laws. Statements in this press release that are not historical facts constitute “forward-looking statements” within the meaning of the Private Securities Litigation Reform Act of 1995. These forward-looking statements may be identified by terms such as “may,” “will,” “would,” “should,” “expect,” “plan,” “design,” “anticipate,” “could,” “intend,” “target,” “project,” “contemplate,” “believe,” “estimate,” “predict,” “potential,” “outlook” or “continue” as well as the negative of these terms and similar expressions. These statements include those relating to the Company’s business outlook and current expectations for upcoming quarters and fiscal year 2025, including with respect to revenue, expenses, growth, and any statements of assumptions underlying any of the foregoing items. These statements are subject to significant risks and uncertainties and actual results could differ materially from those projected. The Company cautions investors not to place undue reliance on the forward-looking statements contained in this press release. These risks and uncertainties include, without limitation, risks and uncertainties related to: the effect of the transaction with Greenbrook on our business relationships; operating results and business generally; our ability to execute our business strategy; our ability to achieve or sustain profitable operations due to our history of losses; our reliance on the sale and usage of our NeuroStar Advanced Therapy System to generate revenues; the scale and efficacy of our salesforce; our ability to retain talent; availability of coverage and reimbursement from third-party payors for treatments using our products; physician and patient demand for treatments using our products; developments in respect of competing technologies and therapies for the indications that our products treat; product defects; our revenue concentration among a small number of customers; our ability to obtain and maintain intellectual property protection for our technology; developments in clinical trials or regulatory review of the NeuroStar Advanced Therapy System for additional indications; developments in regulation in the U.S. and other applicable jurisdictions; potential effects of evolving and/or extensive government regulation; the terms of our credit facility; our ability to successfully roll-out our Better Me Provider Program on the planned timeline; our self-sustainability and existing cash balances; and our ability to achieve cash flow breakeven in the fourth quarter of 2025. For a discussion of these and other related risks, please refer to the Company’s recent filings with the SEC, which are available on the SEC’s website at www.sec.gov, including, without limitation, the factors described under the heading “Risk Factors” in Neuronetics’ Annual Report on Form 10-K for the fiscal year ended December 31, 2024, as may be updated or supplemented by subsequent reports that Neuronetics has filed or files with the SEC. These forward-looking statements are based on the Company’s expectations and assumptions as of the date of this press release. Except as required by law, the Company undertakes no duty or obligation to update any forward-looking statements contained in this press release as a result of new information, future events, or changes in the Company’s expectations.
Investor Contact:
Mike Vallie or Mark Klausner
ICR Healthcare
443-213-0499
ir@neuronetics.com
Media Contact:
EvolveMKD
646-517-4220
NeuroStar@evolvemkd.com
NEURONETICS, INC.
Consolidated Statements of Operations
(Unaudited; In thousands, except per share data)
| Three Months ended September 30, |
Nine months ended September 30, |
|||||||||||||||
| 2025 | 2024 | 2025 | 2024 | |||||||||||||
| Revenues |
$ | 37,297 | $ | 18,530 | $ | 107,380 | $ | 52,397 | ||||||||
| Cost of revenues |
20,189 | 4,529 | 56,776 | 13,129 | ||||||||||||
|
|
|
|
|
|
|
|
|
|||||||||
| Gross profit |
17,108 | 14,001 | 50,604 | 39,268 | ||||||||||||
|
|
|
|
|
|
|
|
|
|||||||||
| Operating expenses: |
||||||||||||||||
| Sales and marketing |
11,848 | 11,877 | 35,715 | 35,820 | ||||||||||||
| General and administrative |
11,077 | 7,436 | 36,364 | 19,540 | ||||||||||||
| Research and development |
1,504 | 2,416 | 4,918 | 6,999 | ||||||||||||
|
|
|
|
|
|
|
|
|
|||||||||
| Total operating expenses |
24,429 | 21,729 | 76,997 | 62,359 | ||||||||||||
|
|
|
|
|
|
|
|
|
|||||||||
| Loss from operations |
(7,321 | ) | (7,728 | ) | (26,393 | ) | (23,091 | ) | ||||||||
|
|
|
|
|
|
|
|
|
|||||||||
| Other (income) expense: |
||||||||||||||||
| Interest expense |
2,206 | 1,725 | 6,097 | 5,529 | ||||||||||||
| Loss on extinguishment of debt |
— | 4,427 | — | 4,427 | ||||||||||||
| Other income, net |
(126 | ) | (539 | ) | (561 | ) | (2,001 | ) | ||||||||
|
|
|
|
|
|
|
|
|
|||||||||
| Net loss |
$ | (9,401 | ) | $ | (13,341 | ) | $ | (31,929 | ) | $ | (31,046 | ) | ||||
|
|
|
|
|
|
|
|
|
|||||||||
| Less: Net loss attributable to non-controlling interest |
(356 | ) | — | (89 | ) | — | ||||||||||
|
|
|
|
|
|
|
|
|
|||||||||
| Net loss attributable to Neuronetics stockholders’ |
(9,045 | ) | (13,341 | ) | (31,840 | ) | (31,046 | ) | ||||||||
|
|
|
|
|
|
|
|
|
|||||||||
| Net loss per share of common stock outstanding, basic and diluted attributable to Neuronetics stockholders’ |
$ | (0.13) | $ | (0.44) | $ | (0.49) | $ | (1.04) | ||||||||
|
|
|
|
|
|
|
|
|
|||||||||
| Weighted average common shares outstanding, basic and diluted |
67,309 | 30,267 | 65,006 | 29,931 | ||||||||||||
|
|
|
|
|
|
|
|
|
|||||||||
NEURONETICS, INC.
Consolidated Balance Sheets
(Unaudited; In thousands, except per share data)
| September 30, 2025 |
December 31, 2024 |
|||||||
| Assets |
||||||||
| Current assets: |
||||||||
| Cash and cash equivalents |
$ | 27,971 | $ | 18,459 | ||||
| Restricted cash |
6,500 | 1,000 | ||||||
| Accounts receivable, net of allowance of credit losses for $1,065 and $1,930 as of September 30, 2025 and December 31, 2024, respectively |
18,693 | 23,355 | ||||||
| Inventory |
4,322 | 4,248 | ||||||
| Current portion of net investments in sales-type leases |
175 | 206 | ||||||
| Current portion of prepaid commission expense |
3,118 | 3,078 | ||||||
| Current portion of note receivables |
493 | 930 | ||||||
| Prepaid expenses and other current assets |
3,616 | 6,846 | ||||||
|
|
|
|
|
|||||
| Total current assets |
64,888 | 58,122 | ||||||
|
|
|
|
|
|||||
| Property and equipment, net |
4,937 | 6,242 | ||||||
| Goodwill |
22,664 | 18,634 | ||||||
| Intangible assets, net |
18,513 | 19,606 | ||||||
| Operating lease right-of-use assets |
24,234 | 27,093 | ||||||
| Net investments in sales-type leases |
94 | 86 | ||||||
| Prepaid commission expense |
8,021 | 8,902 | ||||||
| Long-term notes receivable |
221 | 295 | ||||||
| Other assets |
1,893 | 1,923 | ||||||
|
|
|
|
|
|||||
| Total assets |
$ | 145,465 | $ | 140,903 | ||||
|
|
|
|
|
|||||
| Liabilities and Equity |
||||||||
| Current liabilities: |
||||||||
| Accounts payable |
$ | 11,573 | $ | 11,077 | ||||
| Accrued expenses |
9,653 | 12,818 | ||||||
| Current portion of deferred revenue |
754 | 974 | ||||||
| Deferred and contingent consideration |
1,000 | 1,000 | ||||||
| Other payables |
376 | 605 | ||||||
| Current portion of operating lease liabilities |
5,584 | 4,791 | ||||||
|
|
|
|
|
|||||
| Total current liabilities |
28,940 | 31,265 | ||||||
|
|
|
|
|
|||||
| Long-term debt, net |
65,671 | 55,151 | ||||||
| Deferred revenue |
— | 2 | ||||||
| Operating lease liabilities |
19,494 | 22,686 | ||||||
|
|
|
|
|
|||||
| Total liabilities |
114,105 | 109,104 | ||||||
|
|
|
|
|
|||||
| Commitments and contingencies |
||||||||
| Equity: |
||||||||
| Preferred stock, $0.01 par value: 10,000 shares authorized; no shares issued or outstanding on September 30, 2025 and December 31, 2024 |
— | — | ||||||
| Common stock, $0.01 par value: 250,000 shares authorized; 68,445 and 55,679 shares issued and outstanding on September 30, 2025 and December 31, 2024, respectively |
685 | 557 | ||||||
| Additional paid-in capital |
478,300 | 446,938 | ||||||
| Accumulated deficit |
(451,629 | ) | (419,789 | ) | ||||
|
|
|
|
|
|||||
| Total Stockholders’ equity |
27,356 | 27,706 | ||||||
| Non-controlling interest |
4,004 | 4,093 | ||||||
|
|
|
|
|
|||||
| Total equity |
31,360 | 31,799 | ||||||
|
|
|
|
|
|||||
| Total liabilities and equity |
$ | 145,465 | $ | 140,903 | ||||
|
|
|
|
|
|||||
NEURONETICS, INC.
Consolidated Statements of Cash Flows
(Unaudited; In thousands)
| Nine months ended September 30, | ||||||||
| 2025 | 2024 | |||||||
| Cash flows from Operating activities: |
||||||||
| Net loss |
$ | (31,929 | ) | $ | (31,046 | ) | ||
| Adjustments to reconcile net loss to net cash used in operating activities: |
||||||||
| Depreciation and amortization |
2,698 | 1,627 | ||||||
| Allowance for credit losses |
382 | 1,947 | ||||||
| Inventory impairment |
267 | 346 | ||||||
| Share-based compensation |
4,667 | 4,320 | ||||||
| Non-cash interest expense |
600 | 580 | ||||||
| Loss on extinguishment of debt |
— | 4,427 | ||||||
| Loss on disposal of property and equipment |
45 | — | ||||||
| Changes in certain assets and liabilities: |
||||||||
| Accounts receivable, net |
1,384 | (3,834 | ) | |||||
| Inventory |
(240 | ) | 2,718 | |||||
| Prepaid commission expense |
840 | (770 | ) | |||||
| Prepaid expenses and other assets |
3,813 | (374 | ) | |||||
| Accounts payable |
(77 | ) | (1,524 | ) | ||||
| Accrued expenses |
(3,302 | ) | (1,166 | ) | ||||
| Other liabilities |
(223 | ) | — | |||||
| Deferred revenue |
(229 | ) | (506 | ) | ||||
|
|
|
|
|
|||||
| Net Cash used in Operating activities |
(21,282 | ) | (22,401 | ) | ||||
|
|
|
|
|
|||||
| Cash flows from Investing activities: |
||||||||
| Purchases of property and equipment and capitalized software |
(585 | ) | (1,377 | ) | ||||
| Repayment of notes receivable |
— | 1,340 | ||||||
|
|
|
|
|
|||||
| Net Cash used in Investing activities |
(585 | ) | (37 | ) | ||||
|
|
|
|
|
|||||
| Cash flows from Financing activities: |
||||||||
| Payments of debt issuance costs |
(80 | ) | (2,188 | ) | ||||
| Proceeds from issuance of long-term debt |
10,000 | 48,084 | ||||||
| Proceeds from issuance of warrants |
— | 1,916 | ||||||
| Repayment of long-term debt |
— | (60,000 | ) | |||||
| Payment for debt extinguishment cost |
— | (4,185 | ) | |||||
| Proceeds from the issuance of common stock |
20,700 | — | ||||||
| Payments of common stock offering issuance costs |
(1,731 | ) | — | |||||
| Proceeds from issuance of common stock under ATM facility |
8,313 | — | ||||||
| Payments of common stock offering issuance costs under ATM Program |
(336 | ) | — | |||||
| Proceeds from exercises of stock options |
13 | 1 | ||||||
|
|
|
|
|
|||||
| Net Cash provided by (used in) Financing activities |
36,879 | (16,372 | ) | |||||
|
|
|
|
|
|||||
| Net increase (decrease) in Cash, Cash equivalents and Restricted cash |
15,012 | (38,810 | ) | |||||
| Cash, Cash equivalents and Restricted cash, Beginning of Period |
19,459 | 59,677 | ||||||
|
|
|
|
|
|||||
| Cash, Cash equivalents and Restricted cash, End of Period |
$ | 34,471 | $ | 20,867 | ||||
|
|
|
|
|
|||||
| Reconciliation of cash, cash equivalents and restricted cash to the consolidated balance sheet: |
||||||||
| Cash and cash equivalents |
27,971 | 20,867 | ||||||
| Restricted cash and cash equivalents |
6,500 | — | ||||||
|
|
|
|
|
|||||
| Total cash, cash equivalents and restricted cash |
$ | 34,471 | $ | 20,867 | ||||
|
|
|
|
|
|||||
Non-GAAP Financial Measures (Unaudited)
Earnings before interest, taxes, depriciation, and amortization (“EBITDA”) is not a measure of financial performance under generally accepted accounting principles in the U.S. (“GAAP”), and should not be construed as a substitute for, or superior to, GAAP net loss. However, management uses both the GAAP and non-GAAP financial measures internally to evaluate and manage the Company’s operations and to better understand its business. Further, management believes that the addition of the non-GAAP financial measures provides meaningful supplementary information to, and facilitates analysis by, investors in evaluating the Company’s financial performance, results of operations, and trends. The Company’s calculation of EBITDA may not be comparable to similarly designated measures reported by other companies, because companies and investors may differ as to what type of events warrant adjustment.
The following table reconciles reported net loss to EBITDA:
| Three Months ended September 30, |
Nine months ended September 30, |
|||||||||||||||
| 2025 | 2024 | 2025 | 2024 | |||||||||||||
| (in thousands) | (in thousands) | |||||||||||||||
| Net loss |
$ | (9,401 | ) | $ | (13,341 | ) | $ | (31,929 | ) | $ | (31,046 | ) | ||||
| Interest expense, net |
2,080 | 1,186 | 5,536 | 3,528 | ||||||||||||
| Income taxes |
— | — | — | — | ||||||||||||
| Depreciation and amortization |
886 | 512 | 2,698 | 1,627 | ||||||||||||
|
|
|
|
|
|
|
|
|
|||||||||
| EBITDA |
$ | (6,435 | ) | $ | (11,643 | ) | $ | (23,695 | ) | $ | (25,891 | ) | ||||
|
|
|
|
|
|
|
|
|
|||||||||
Non-GAAP Pro Forma and Adjusted Pro Forma Revenue Information (Unaudited)
The following table presents the Company’s pro forma operating results, giving effect to the acquisition of Greenbrook as if the transaction had occurred on January 1, 2024. These pro forma results are based on assumptions that management believes are reasonable under the circumstances. However, they are not necessarily indicative of the Company’s future performance. The pro forma financial information reflects the historical operating results of both the Company and Greenbrook, with all intercompany transactions eliminated. The adjusted pro forma results further reflect eliminations related to the closure of certain clinics in 2024. The pro forma data does not include the impact of any potential synergies or cost-saving initiatives resulting from the acquisition:
| Three Months ended September 30, 2024 |
||||
| (in thousands) | ||||
| Neuronetics |
$ | 18,530 | ||
| Greenbrook |
19,072 | |||
| Intercompany revenue |
(2,392 | ) | ||
|
|
|
|||
| Total Pro forma |
35,210 | |||
| Adjusted for clinic closures |
(1,652 | ) | ||
|
|
|
|||
| Adjusted Pro forma Revenue |
$ | 33,558 | ||
|
|
|
|||
| Three Months ended September 30, 2024 |
||||
| (in thousands) | ||||
| Neuronetics Treatment sessions |
$ | 13,326 | ||
| Intercompany Treatment sessions |
(2,220 | ) | ||
|
|
|
|||
| Total Pro forma Treatment sessions |
11,106 | |||
|
|
|
|||
Exhibit 99.2

COMPANY PRESENTATION NASDAQ: STIM November 2025 Transforming Lives Through NeuroHealth
Forward Looking Statements This presentation contains estimates and other statistical data prepared by independent parties and by Neuronetics, Inc. (“Neuronetics” or the “Company”) relating to market size and growth and other data about the industry in which the Company operates. These estimates and data involve a number of assumptions and limitations, and you are cautioned not to give undue weight to such estimates and data. Certain statements in this presentation, including the documents incorporated by reference herein, include “forward-looking statements” within the meaning of Section 27A of the Securities Act of 1933, as amended (the “Securities Act”), Section 21E of the Securities Exchange Act of 1934, as amended, which are intended to be covered by the safe harbors created by those laws and other applicable laws and “forward-looking information” within the meaning of applicable Canadian securities laws. Statements in this presentation that are not historical facts constitute “forward-looking statements” within the meaning of the Private Securities Litigation Reform Act of 1995. These forward-looking statements may be identified by terms such as “may,” “will,” “would,” “should,” “expect,” “plan,” “design,” “anticipate,” “could,” “intend,” “target,” “project,” “contemplate,” “believe,” “estimate,” “predict,” “potential,” “outlook” or “continue” as well as the negative of these terms and similar expressions. These statements include those relating to the Company’s business outlook and current expectations for upcoming quarters and fiscal year 2025, including with respect to revenue, expenses, growth, and any statements of assumptions underlying any of the foregoing items. These statements are subject to significant risks and uncertainties and actual results could differ materially from those projected. The Company cautions investors not to place undue reliance on the forward-looking statements contained in this presentation. These risks and uncertainties include, without limitation, risks and uncertainties related to: the effect of the transaction with Greenbrook TMS Inc. (“Greenbrook”) on our business relationships; operating results and business generally; our ability to execute our business strategy; our ability to achieve or sustain profitable operations due to our history of losses; our reliance on the sale and usage of our NeuroStar Advanced Therapy System to generate revenues; the scale and efficacy of our salesforce; our ability to retain talent; availability of coverage and reimbursement from third-party payors for treatments using our products; physician and patient demand for treatments using our products; developments in respect of competing technologies and therapies for the indications that our products treat; product defects; our revenue concentration among a small number of customers; our ability to obtain and maintain intellectual property protection for our technology; developments in clinical trials or regulatory review of the NeuroStar Advanced Therapy System for additional indications; developments in regulation in the U.S. and other applicable jurisdictions; potential effects of evolving and/or extensive government regulation; the terms of our credit facility; our ability to successfully roll-out our Better Me Provider Program on the planned timeline; our self-sustainability and existing cash balances; and our ability to achieve cash flow breakeven in the fourth quarter of 2025. For a discussion of these and other related risks, please refer to the Company’s recent filings with the U.S. Securities and Exchange Commission (the “SEC”), which are available on the SEC’s website at www.sec.gov, including, without limitation, the factors described under the heading “Risk Factors” in Neuronetics’ Annual Report on Form 10-K for the fiscal year ended December 31, 2024, as may be updated or supplemented by subsequent reports that Neuronetics has filed or files with the SEC. These forward-looking statements are based on the Company’s expectations and assumptions as of the date of this presentation. Except as required by law, the Company undertakes no duty or obligation to update any forward-looking statements contained in this presentation as a result of new information, future events, or changes in the Company’s expectations.
Non-GAAP Financial Measures In addition to financial measures prepared in accordance with accounting principles generally accepted in the United States (“GAAP”), from time to time we may use or publicly disclose certain non-GAAP financial measures in the course of our financial presentations, earnings releases, earnings conference calls, and otherwise. For these purposes, the SEC defines a non-GAAP financial measure as a numerical measure of historical or future financial performance, financial positions, or cash flows that (i) exclude amounts, or is subject to adjustments that effectively exclude amounts, included in the most directly comparable measure calculated and presented in accordance with GAAP in financial statements, and (ii) include amounts, or is subject to adjustments that effectively include amounts, that are excluded from the most directly comparable measure so calculated and presented. Non-GAAP financial measures are provided as additional information to investors to provide an alternative method for assessing our financial condition and operating results. We believe that these non-GAAP measures, when taken together with our GAAP financial measures, allow us and our investors to better evaluate our performance and profitability. These measures are not in accordance with, or a substitute for, GAAP, and may be different from or inconsistent with non-GAAP financial measures used by other companies. These measures should be used in addition to and in conjunction with results presented in accordance with GAAP, and should not be relied upon to the exclusion of GAAP financial measures. Pursuant to the requirements of Regulation G, whenever we refer to a non-GAAP financial measure, we will also generally present, the most directly comparable financial measure calculated and presented in accordance with GAAP, along with a reconciliation of the differences between the non-GAAP financial measure we reference with such comparable GAAP financial measure.
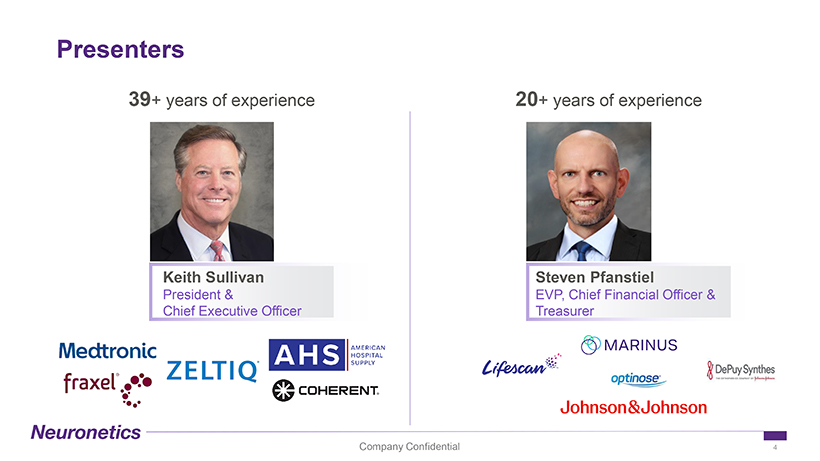
Presenters 39+ years of experience Keith SullivanPresident & Chief Executive Officer 20+ years of experience Steven Pfanstiel EVP, Chief Financial Officer & Treasurer

STRONGER together Two of the nation’s largest mental health and device companies are now combined to create an organization with the ability to leverage its scale and capabilities to treat more patients suffering from mental health conditions
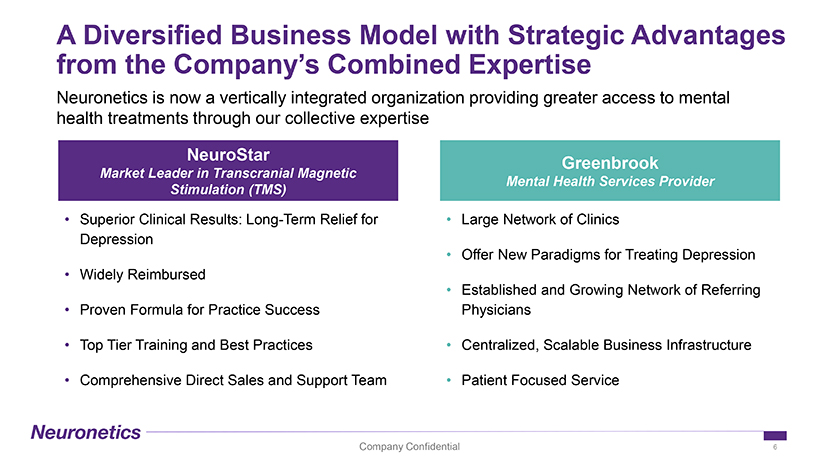
A Diversified Business Model with Strategic Advantages from the Company’s Combined Expertise Neuronetics is now a vertically integrated organization providing greater access to mental health treatments through our collective expertise NeuroStar Market Leader in Transcranial Magnetic Stimulation (TMS) • Superior Clinical Results: Long-Term Relief for Depression • Widely Reimbursed • Proven Formula for Practice Success • Top Tier Training and Best Practices • Comprehensive Direct Sales and Support Team Greenbrook Mental Health Services Provider • Large Network of Clinics • Offer New Paradigms for Treating Depression • Established and Growing Network of Referring Physicians • Centralized, Scalable Business Infrastructure • Patient Focused Service
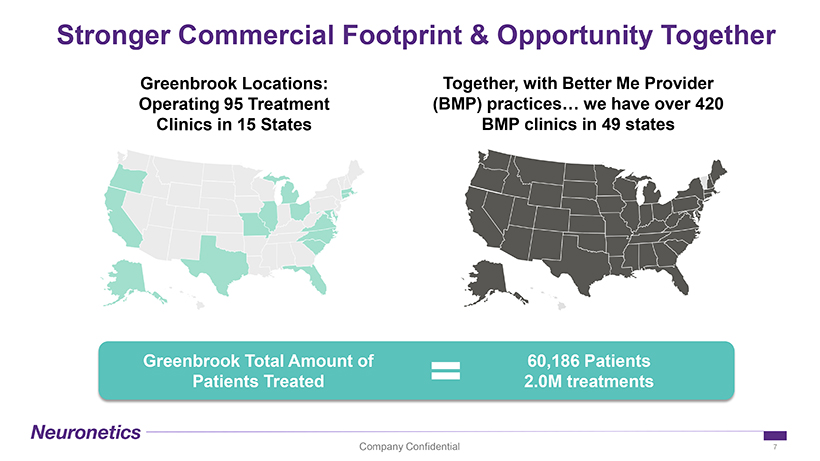
Stronger Commercial Footprint & Opportunity Together Greenbrook Locations: Operating 95 Treatment Clinics in 15 States Together, with Better Me Provider (BMP) practices… we have over 420 BMP clinics in 49 states

A Compelling Investment Opportunity Combines one of the U.S.’s most utilized therapeutic platforms for the treatment of MDD with one of the largest service providers to renew even more lives Large patient population best served by managing the therapeutic paradigm Multiple initiatives in place to drive accelerated growth across the organization Significant, realized cost reductions enable immediate operating leverage Transformed financial profile adds scale and supportive balance sheet Poised to deliver mid-teens revenue growth and expected to achieve profitability in near-term

Senior Leadership Management Team Board of Directors Keith Sullivan Cory Anderson Sara Grubbs Jeff Jones President & CEO SVP, Chief SVP, Chief SVP, Chief Technology Officer Revenue Officer of Operations Bill Leonard Andrew Macan Steven Pfanstiel Lisa Metzner-Rosas EVP, Chief EVP, GC & Chief EVP, Chief Financial SVP, Chief Clinic Officer Compliance Officer Officer & Treasurer Marketing Officer Rob Cascella Avinash Amin, MD Sheryl Conley Sasha Cucuz Board Chairman Glenn Muir Megan Keith Sullivan Rosengarten

Over 29 Million Lives Affected by Depression and OCD Total Available Market 29.3 million U.S. Adults and Adolescents (ages 15-21) suffering from depression, depression with anxiety and OCD Nearly 8 million patients are poorly served by antidepressant medication • Lack of Treatment Efficacy • Intolerable Side Effects Adult Depression (MDD) 21 million suffering1 6.4 million on medication1,2,3 Anxious Depression 53% of MDD patients have significant anxiety6 Adolescent Depression 4.3 million suffering4 1 million on medications5 New indication: 35% increase in addressable market OCD 4 million suffering7 235k on medication8 (1) NIMH https://www.nimh.nih.gov/health/statistics/major-depression.shtml, accessed 4/29/2024. (2) Per STAR*D patients that have failed one or more antidepressant trial of adequate dose and duration. (3) Journal of Clinical Psychiatry, accessed 3/7/2022. (4) Depression- Pharma Intelligence Disease Analysis, www.datamonitorhealthcare.com, Publication Date: June 2021. (5) Key Substance Use and Mental Health Indicators in the United States: Results from the 2017 National Survey on Drug Use and Health. (6) Kalin N, The Critical Relationship Between Anxiety and Depression, Am J Psychiatry 2020; 177:365–367; doi: 10.1176/appi.ajp.2020.20030305. (7) Harvard Medical School, 2007. National Comorbidity 03Nov25 Survey (NCSSC) 12:27 . (8) Definitive Health Page Diagnosis/Prescription 20 Data: 3/25/22.
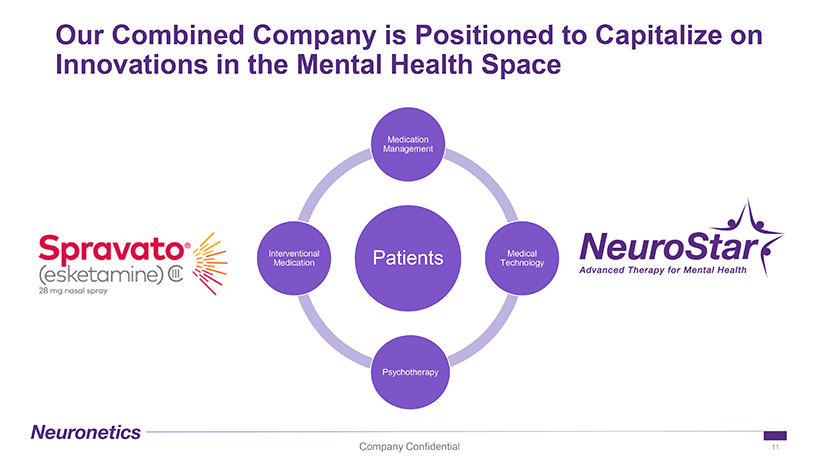
Our Combined Company is Positioned to Capitalize on Innovations in the Mental Health Space Medication Management Interventional Patients Medical Medication Technology Psychotherapy

#1 Physician Recommended TMS We’re inspired every day by the opportunity to help people live more fulfilling lives Market Leader in TMS1 Over 7.9 million treatment sessions performed in over 216,000 patients Robust R&D Pipeline 3rd generation system. Largest clinical dataset in the world to drive new indications Dedicated to Practice Success Largest direct sales and customer support team in the industry to support over 1,100 U.S. offices1 Widely Reimbursed Dedicated to driving health policy to ensure broad U.S. reimbursement among commercial and government payors

Proven, Long-Term Relief for MDD1 Real-World Clinical Results for Patients with MDD2 Clinically Proven Durability through 12 Months1 (1) Dunner DL, et al. (2014). J Clin Psychiatry. 75(12):1394-1401. (2) Sackeim HA, et al. (2020) J. Affect. Disord. 277:65-74. Based on a real-world, retrospective study using CGI-S and a sample size of 615 patients.
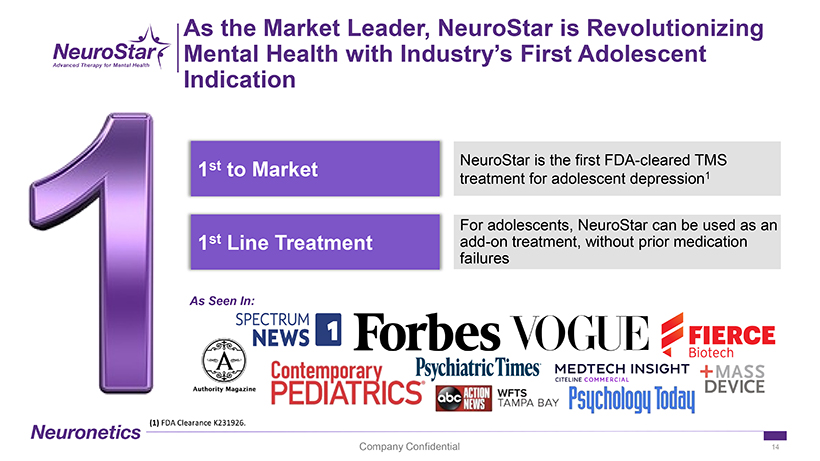
As the Market Leader, NeuroStar is Revolutionizing Mental Health with Industry’s First Adolescent Indication 1st to Market NeuroStar is the first FDA-cleared TMS treatment for adolescent depression1 1st Line Treatment For adolescents, NeuroStar can be used as an add-on treatment, without prior medication failures
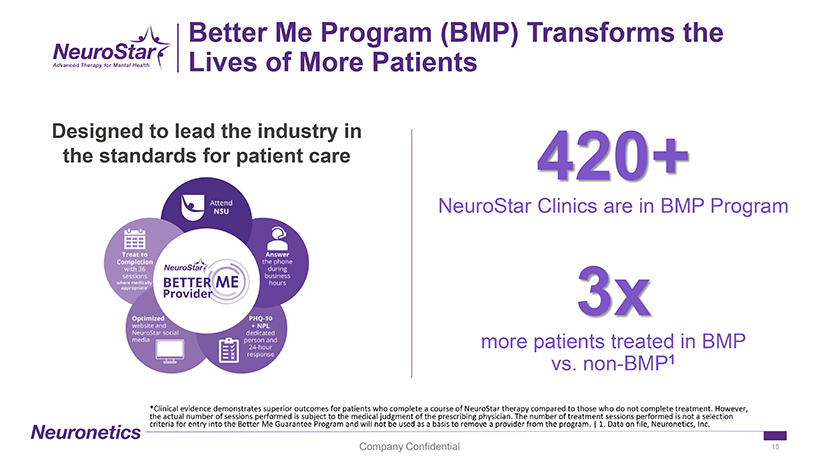
Better Me Program (BMP) Transforms the Lives of More Patients Designed to lead the industry in the standards for patient care 420+ NeuroStar Clinics are in BMP Program 3x more patients treated in BMP vs. non-BMP1 *Clinical evidence demonstrates superior outcomes for patients who complete a course of NeuroStar therapy compared to those who do not complete treatment. However, the actual number of sessions performed is subject to the medical judgment of the prescribing physician. The number of treatment sessions performed is not a selection criteria for entry into the Better Me Guarantee Program and will not be used as a basis to remove a provider from the program. | 1. Data on file, Neuronetics, Inc.
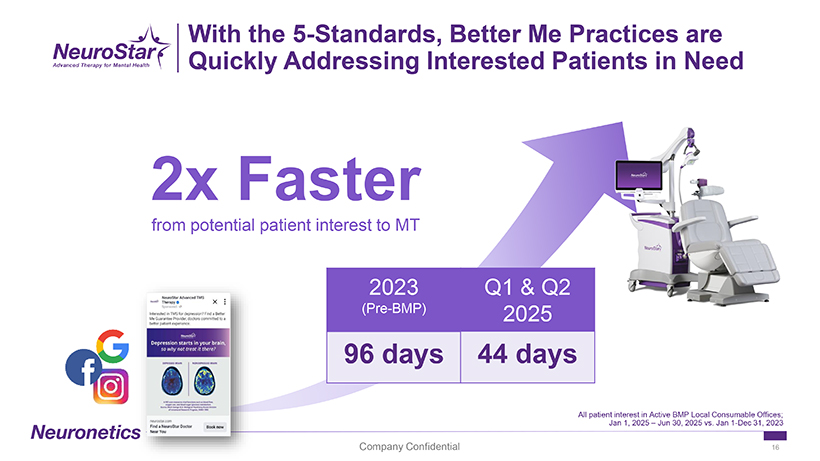
With the 5-Standards, Better Me Practices are Quickly Addressing Interested Patients in Need 2x Faster from potential patient interest to MT 2023 (Pre-BMP) 96 days Q1 & Q2 2025 44 days All patient interest in Active BMP Local Consumable Offices; Jan 1, 2025 – Jun 30, 2025 vs. Jan 1-Dec 31, 2023

NeuroStar University Since NSU opened in Q3 2022, NSU attendees have started 38% more patients than non-attendees.* A 2-DAY COURSE HELD AT OUR STATE-OF-THE-ART TRAINING CENTER Practices learn how to achieve the best clinical outcomes and market their NeuroStar business, through a combination of instruction and peer to peer learning.

Partnering with Practices to Build Local Consumer Awareness1 – this one Co-Op Marketing: collaborative effort with practices to increase local patient awareness while sharing advertising costs +22% treatment session utilization*+19% in new MTs* Q3 2025 data from accounts who participated in Co-Op in the prior two consecutive quarters (Q1 2025 & 98237-003 03Nov25 12:27 Page 28 Q2 2025). Data on file, Neuronetics, Inc.

In March 2019, the FDA approved SPRAVATO® (esketamine) nasal spray, in conjunction with an oral antidepressant, for Treatment Resistant Depression in adults and in August 2020, the FDA added a second indication for depressive symptoms in adults with MDD with acute suicidal ideation or behavior SPRAVATO® fills the gap in the treatment paradigm between or before TMS and Electroconvulsive Therapy, providing for a complimentary treatment to TMS, effectively broadening Greenbrook offering to patients Delivered in a two-spray dispenser under supervision from a health care professional as patients self-administer Treatment consists of: Induction (8 treatments)—Twice a week for 4 weeks Taper (4 treatments)—Once a week for 4 weeks Maintenance—Once every one to two weeks for the next year We currently have a total of 82 Treatment Centers now offering SPRAVATO® and expect to have 89 Treatment Centers offering SPRAVATO by the end of Fiscal 2025 through an accelerated roll-out

Key Growth Initiatives for Network Clinics Focus on execution, profitable product diversification & expansion Identifying and Drive growth in 95 clinics through enhanced RAM clinic Educating Patients engagement, leveraging automated referral systems and optimized digital/DTC targeting Expanding the Fill the gap in treatment paradigm with SPRAVATO® Continuum of Care for expansion to all locations with Buy & Bill model that Patients increases treatment revenue Consistent Standardize operational excellence across our network Implementation of Best through comprehensive training, enhanced practice Operation Practices capabilities, and centralized services
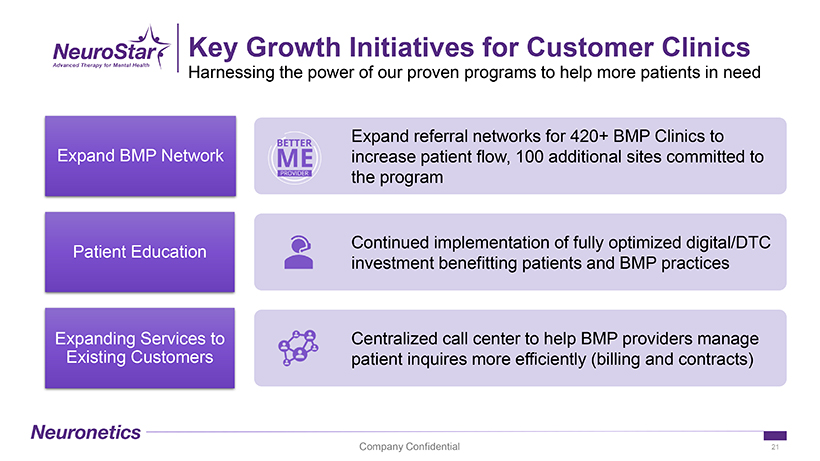
Key Growth Initiatives for Customer Clinics Harnessing the power of our proven programs to help more patients in need Expand referral networks for 420+ BMP Clinics to Expand BMP Network increase patient flow, 100 additional sites committed to the program Patient Education Continued implementation of fully optimized digital/DTC investment benefitting patients and BMP practices Expanding Services to Centralized call center to help BMP providers manage Existing Customers patient inquires more efficiently (billing and contracts)
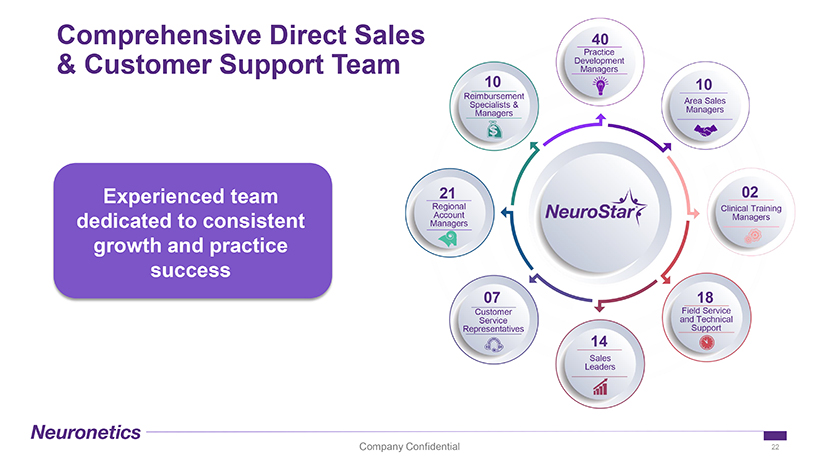
Comprehensive Direct Sales & Customer Support Team Experienced team dedicated to consistent growth and practice success

Comprehensive Direct Sales & Customer Support Team Experienced team dedicated to consistent growth and practice success Revenue $147M to $150M (+14% to +16% Adjusted Pro Forma YoY) 1 Prior Guidance of $149M—$155M2 Between 47% and 49%1 Gross Margin Prior Guidance of 48%—50%2 Operating Expenses $100M—$105M 2 Cash Flow Q4 Cash Flow from Operations: +$2M to -$2M1 Targeting Positive Cash Flow from Operations in Q4 20251
Financial Overview Neuronetics transforming lives through NeuroHealth
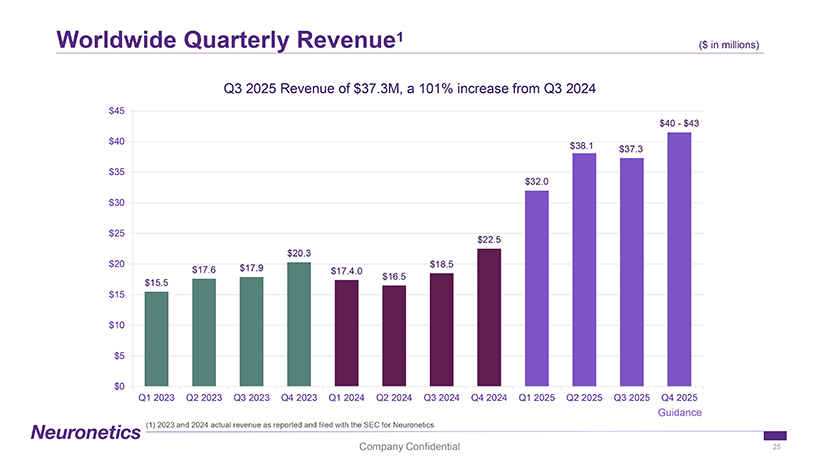
Worldwide Quarterly Revenue1 FY 2025 Guidance Revenue $147M to $150M (+14% to +16% Adjusted Pro Forma YoY) 1 Prior Guidance of $149M - $155M2 Between 47% and 49%1 Gross Margin Prior Guidance of 48% - 50%2 Operating Expenses $100M - $105M2 Cash Flow Q4 Cash Flow from Operations: +$2M to -$2M1 Targeting Positive Cash Flow from Operations in Q4 20251

Results of Operations1 ( thousands) $ in thousands) As of September 30, 2025 Cash and Cash Equivalents $27,971Restricted Cash $6,500

Financial Position Cash and Cash Equivalents $27, 971

Worldwide Quarterly Revenue1 Q3 2025 Revenue of $37.3M, an 11% increase from Q3 2024 (1) 2024 revenue is based on Adjusted Pro forma revenue, pro forma revenue adjusted for Greenbrook store closures, per slide 29
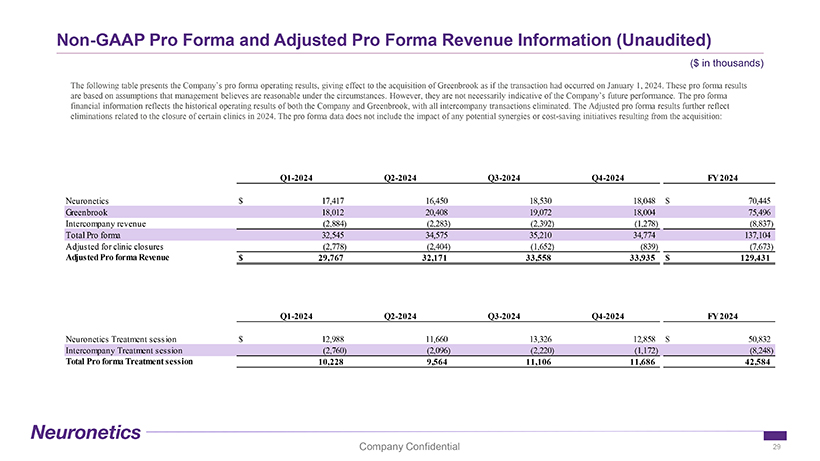
Non-GAAP Pro Forma and Adjusted Pro Forma Revenue Information (Unaudited) ($ in thousands) The following table presents the Company’s pro forma operating results, giving effect to the acquisition of Greenbrook as if the transaction had occurred on January 1, 2024. These pro forma results are based on assumptions that management believes are reasonable under the circumstances. However, they are not necessarily indicative of the Company’s future performance. The pro forma financial information reflects the historical operating results of both the Company and Greenbrook, with all intercompany transactions eliminated. The Adjusted pro forma results further reflect eliminations related to the closure of certain clinics in 2024. The pro forma data does not include the impact of any potential synergies or cost-saving initiatives resulting from the acquisition: Q1-2024 Q2-2024 Q3-2024 Q4-2024 FY 2024 Neuronetics $17,417 16,450 18,530 18,048 $ 70,445 Greenbrook 18,012 20,408 19,072 18,004 75,496

Annual Revenue1 ($ in millions) Annual Revenue by Geography (1) 2024 is Adjusted Pro forma revenue, pro forma revenue adjusted for Greenbrook store closures, per slide 29

Supplemental Information Neuronetics, Inc.
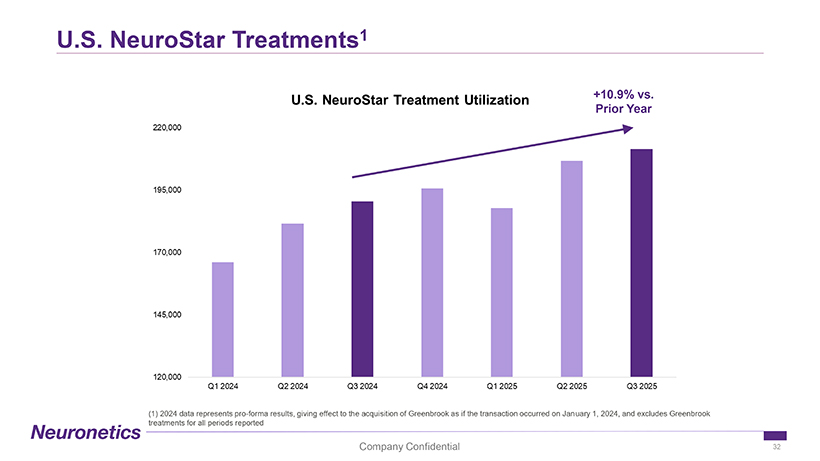
U.S. NeuroStar Treatments1 (1) 2024 data represents pro-forma results, giving effect to the acquisition of Greenbrook as if the transaction occurred on January 1, 2024, and excludes Greenbrook
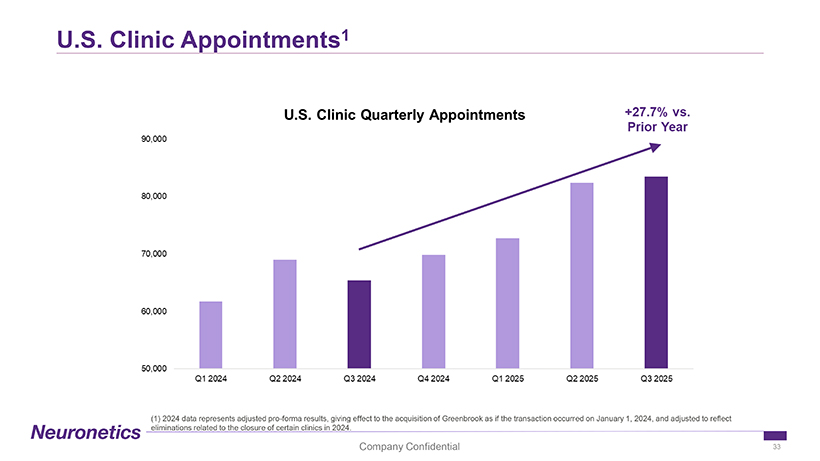
U.S. Clinic Appointments1 (1) 2024 data represents adjusted pro-forma results, giving effect to the acquisition of Greenbrook as if the transaction occurred on January 1, 2024, and adjusted to reflect

Supplemental Financial and Operating Information1 2023 2024 2025 2024 Revenue ($ thousands) Q1 Q2 Q3 Q4 Q1 Q2 Q3 Q4 Q1 Q2 Q3 FY Total U.S. NeuroStar Advanced Therapy System Revenues $3,850 $4,489 $3,597 $4,524 $3,310 $4,000 $4,108 $3,849 $2,846 $3,484 $3,508 $15,267 YoY Change 6% 2% -9% -2% -14% -11% 14% -15% -14% -13% -15% -7% Total U.S. Treatment Sessions Revenues $10,643 $12,314 $13,060 $14,878 $12,988 $11,660 $13,326 $12,858 $9,612 $10,773 $10,543 $50,832 YoY Change 12% 9% 10% 20% 22% -5% 2% -14% -26% -8% -21% 0% Total U.S. Clinic Revenues $0 $0 $0 $0 $0 $0 $0 $4,445 $18,659 $23,024 $21,808 $4,445 YoY Change na na na na na Total U.S. Other Revenues $471 $486 $554 $470 $495 $470 $488 $490 $366 $375 $389 $1,943 YoY Change 16% 7% 24% 5% 5% -3% -12% 4% -26% -20% -20% -2% Total U.S. Revenues $14,964 $17,289 $17,211 $19,872 $16,793 $16,130 $17,922 $21,642 $31,483 $37,656 $36,248 $72,487 YoY Change 11% 7% 6% 13% 12% -7% 4% 9% 87% 133% 102% 5% Total International Revenues $576 $321 $673 $442 $624 $320 $608 $851 $492 $452 $1,049 $2,402 YoY Change -13% 62% 166% -36% 8% 0% -10% 93% -21% 41% 73% 19% Total Revenues $15,540 $17,610 $17,884 $20,314 $17,417 $16,450 $18,530 $22,493 $31,975 $38,108 $37,297 $74,890 YoY Change 10% 8% 8% 12% 12% -7% 4% 11% 84% 132% 101% 5% 2023 2024 2025 2024 U.S. Operating and Financial Metrics Q1 Q2 Q3 Q4 Q1 Q2 Q3 Q4 Q1 Q2 Q3 FY Total NeuroStar Systems 49 54 43 58 40 49 48 47 31 41 40 184 YoY Change 7% -8% -14% 0% -18% -9% 12% -19% -23% -16% -17% -10%

Supplemental Financial and Operating Information1 2024 2025 2024 Revenue ($ thousands) Q1 Q2 Q3 Q4 Q1 Q2 Q3 FY Total U.S. NeuroStar Advanced Therapy System Revenues $3,310 $4,000 $4,108 $3,849 $2,846 $3,484 $3,508 $15,267 YoY Change -14% -11% 14% -15% -14% -13% -15% -7% Total U.S. Treatment Sessions Revenues $10,228 $9,564 $11,106 $11,686 $9,612 $10,773 $10,543 $42,584 YoY Change -4% -22% -15% -21% -6% 13% -5% -16% Total U.S. Clinic Revenues $15,234 $18,004 $17,420 $17,165 $18,659 $23,024 $21,808 $67,823 YoY Change 22% 28% 25% n/a Total U.S. Other Revenues $371 $283 $316 $384 $366 $375 $389 $1,354 YoY Change -21% -42% -43% -18% -1% 33% 23% -32% Total U.S. Revenues $29,144 $31,850 $32,950 $33,084 $31,483 $37,656 $36,248 $127,027 YoY Change 95% 84% 91% 66% 8% 18% 10% 83% Total International Revenues $624 $320 $608 $851 $492 $452 $1,049 $2,402 YoY Change 8% 0% -10% 93% -21% 41% 73% 19% Total Revenues $29,767 $32,171 $33,558 $33,935 $31,975 $38,108 $37,297 $129,431 YoY Change 92% 83% 88% 67% 7% 18% 11% 81% 2024 2025 2024 U.S. Operating and Financial Metrics Q1 Q2 Q3 Q4 Q1 Q2 Q3 FY Total NeuroStar Systems 40 49 48 47 31 41 40 184 YoY Change -32% -2% -17% -19% -23% -16% -17% -10%