UNITED STATES
SECURITIES AND EXCHANGE COMMISSION
Washington, D.C. 20549
FORM 8-K
CURRENT REPORT
Pursuant to Section 13 or 15(d)
of the Securities Exchange Act of 1934
Date of Report (Date of earliest event reported) October 22, 2025
NORWOOD FINANCIAL CORP
(Exact name of registrant as specified in its charter)
| Pennsylvania | 0-28364 | 23-2828306 | ||
| (State or other jurisdiction of incorporation) |
(Commission File Number) |
(IRS Employer Identification No.) |
| 717 Main Street, Honesdale, Pennsylvania | 18431 | |
| (Address of principal executive offices) | (Zip Code) |
Registrant’s telephone number, including area code: (570) 253-1455
Not Applicable
(Former name or former address, if changed since last report)
Check the appropriate box below if the Form 8-K filing is intended to simultaneously satisfy the filing obligation of the registrant under any of the following provisions:
| ☒ | Written communications pursuant to Rule 425 under the Securities Act (17 CFR 230.425) |
| ☐ | Soliciting material pursuant to Rule 14a-12 under the Exchange Act (17 CFR 240.14a-12) |
| ☐ | Pre-commencement communications pursuant to Rule 14d-2(b) under the Exchange Act (17 CFR 240.14d-2(b)) |
| ☐ | Pre-commencement communications pursuant to Rule 13e-4(c) under the Exchange Act (17 CFR 240.13e-4(c)). |
Securities registered pursuant to Section 12(b) of the Act:
| Title of each class |
Trading symbol(s) |
Name of each exchange on which registered |
||
| Common Stock, par value $0.10 per share | NWFL | The Nasdaq Stock Market LLC |
Indicate by check mark whether the registrant is an emerging growth company as defined in Rule 405 of the Securities Act of 1933 (§230.405 of this chapter) or Rule 12b-2 of the Securities Exchange Act of 1934 (§240.12b-2 of this chapter).
Emerging growth company ☐
If an emerging growth company, indicate by check mark if the registrant has elected not to use the extended transition period for complying with any new or revised financial accounting standards provided pursuant to Section 13(a) of the Exchange Act. ☐
NORWOOD FINANCIAL CORP
INFORMATION TO BE INCLUDED IN THE REPORT
| Item 2.02 | Results of Operations and Financial Condition. |
On October 22, 2025, Norwood Financial Corp (the “Company”) issued a press release announcing its earnings for the three and nine months ended September 30, 2025. A copy of the press release is furnished with this report as exhibit 99.1 hereto and shall not be deemed “filed” for purposes of Section 18 of the Securities Exchange Act of 1934, as amended, nor shall it be deemed incorporated by reference in any filing under the Securities Act of 1933, as amended.
| Item 7.01 | Regulation FD Disclosure. |
On October 22, 2025, the Company will host an earnings call with respect to earnings for the third quarter of 2025 and will use and post an investor presentation, which will include September 30, 2025, financial highlights (the “Investor Presentation”). The Investor Presentation is filed as Exhibit 99.1 to this Current Report on Form 8-K and incorporated herein by reference. The information included in this Current Report pursuant to this Item 7.01 is being furnished to, and not filed with, the Securities and Exchange Commission (“SEC”) and shall not be deemed “filed” for purposes of Section 18 of the Securities Exchange Act of 1934, as amended (the “Exchange Act”), or otherwise subject to the liabilities of that section, nor shall it be deemed incorporated by reference in any filing under the Securities Act of 1933, as amended.
By filing this Current Report on Form 8-K and furnishing the information contained herein, the Company makes no admission as to the materiality of any information in this report that is required to be disclosed solely by reason of Regulation FD.
The information contained in the Investor Presentation is summary information that is intended to be considered in the context of the Company’s SEC filings and other public announcements that the Company may make, by press release or otherwise, from time to time. The Company undertakes no duty or obligation to publicly update or revise the information contained in this report, although it may do so from time to time as its management believes is warranted. Any such updating may be made through the filing of other reports or documents with the SEC, through press releases or through other public disclosure.
Forward-Looking Statements
This Current Report on Form 8-K contains forward-looking statements within the meaning of the Private Securities Litigation Reform Act of 1995. These forward-looking statements include, but are not limited to, statements about (i) the benefits of the merger between Norwood Financial and PB Bankshares, including anticipated future results, cost savings and accretion to reported earnings that may be realized from the merger; (ii) Norwood Financial and PB Bankshares plans, objectives, expectations and intentions and other statements contained in this presentation that are not historical facts; and (iii) other statements identified by words such as “expects,” “anticipates,” “intends,” “plans,” “believes,” “seeks,” “estimates” or words of similar meaning.
Forward-looking statements involve risks and uncertainties that may cause actual results to differ materially from those in such statements. The following factors, among others, could cause actual results to differ materially from the anticipated results expressed in the forward-looking statements: the businesses of Norwood Financial and PB Bankshares may not be combined successfully, or such combination may take longer than expected; the cost savings from the merger may not be fully realized or may take longer than expected; operating costs, customer loss and business disruption following the merger may be greater than expected; governmental approvals of the merger may not be obtained, or adverse regulatory conditions may be imposed in connection with governmental approvals of the merger or otherwise; the stockholders of PB Bankshares may fail to approve the merger; the interest rate environment may further compress margins and adversely affect new interest income; the risks associated with continued diversification of assets and adverse changes to credit quality; and difficulties associated with achieving expected future financial results.
Additional factors that could cause actual results to differ materially from those expressed in the forward-looking statements are discussed in Norwood Financial’s reports (such as the Annual Report on Form 10-K, Quarterly Reports on Form 10-Q and Current Reports on Form 8-K) filed with the Securities and Exchange Commission (the “SEC”) and available at the SEC’s website at www.sec.gov. All subsequent written and oral forward-looking statements concerning the proposed transaction or other matters attributable to Norwood Financial or PB Bankshares or any person acting on their behalf are expressly qualified in their entirety by the cautionary statements above. Except as required by law, Norwood Financial and PB Bankshares do not undertake any obligation to update any forward-looking statement to reflect circumstances or events that occur after the date the forward-looking statement is made.
Additional Information about the Proposed Transaction
In connection with the proposed merger, Norwood filed a Registration Statement on Form S-4 (File No. 333-290392) with the Securities and Exchange Commission (the “SEC”), to register the shares of Norwood common stock to be issued in connection with the proposed transaction. The Registration Statement, as amended, has not yet been declared effective by the SEC, includes the joint proxy statement/prospectus of Norwood and PB Bankshares which will be mailed to stockholders of PB Bankshares, seeking their approval of the proposed transaction. This communication does not constitute an offer to sell or the solicitation of an offer to buy any securities or a solicitation of any vote or approval. SHAREHOLDERS OF PB BANKSHARES ARE URGED TO READ THE REGISTRATION STATEMENT AND THE PROXY STATEMENT/PROSPECTUS REGARDING THE MERGER WHEN IT BECOMES AVAILABLE, AND ANY OTHER RELEVANT DOCUMENTS FILED OR TO BE FILED WITH THE SEC, AS WELL AS ANY AMENDMENTS OR SUPPLEMENTS TO THOSE DOCUMENTS, BECAUSE THEY WILL CONTAIN IMPORTANT INFORMATION. You may obtain a free copy of the registration statement, including the proxy statement/prospectus (when it becomes available) and other relevant documents filed by Norwood with the SEC, without charge, at the SEC’s website at www.sec.gov. Copies of the proxy statement/prospectus and the filings with the SEC that will be incorporated by reference in the proxy statement/prospectus can also be obtained, free of charge, by directing a request to Norwood Financial Corp, 717 Main Street, Honesdale, Pennsylvania 18431, attention: John M. McCaffery (570) 253-1455, or PB Bankshares, Inc., 185 East Lincoln Highway, Coatesville, Pennsylvania 19320, attention: Mackenzie Jackson, Corporate Secretary, (610) 384-8282.
Norwood Financial, PB Bankshares and their respective directors and executive officers may, under the rules of the SEC, be deemed to be “participants” in the solicitation of proxies from shareholders of PB Bankshares in connection with the proposed merger. Information concerning the interests of the persons who may be considered “participants” in the solicitation will be set forth in the proxy statement/prospectus relating to the Transaction. Information concerning Norwood Financial’s directors and executive officers, including their ownership of Norwood Financial common stock, is set forth in its proxy statement previously filed with the SEC on March 18, 2025. Additional information regarding the interests of such potential participants will be included in the proxy statement/prospectus and other relevant documents filed with the SEC when they become available. You may obtain free copies of these documents from Norwood Financial or PB Bankshares using the sources indicated above.
No Offer or Solicitation
This communication is not intended to and shall not constitute an offer to sell or the solicitation of an offer to sell or the solicitation of an offer to buy any securities or a solicitation of any vote of approval, nor shall there be any sale of securities in any jurisdiction in which such offer, solicitation or sale would be unlawful prior to registration or qualification under the securities laws of any such jurisdiction. No offer of securities shall be made except by means of a prospectus meeting the requirements of Section 10 of the Securities Act of 1933, as amended.
| Item 9.01 | Financial Statements and Exhibits. |
| (d) | Exhibits: |
The following exhibits are being furnished with this report.
| No. |
Description |
|
| 99.1 | Press Release dated October 22, 2025. | |
| 99.2 | Norwood Financial Corp Investor Presentation | |
| 104 | Cover Page Interactive Data File (embedded within the Inline XBRL document). | |
SIGNATURES
Pursuant to the requirements of the Securities Exchange Act of 1934, the registrant has duly caused this report to be signed on its behalf by the undersigned hereunto duly authorized.
| NORWOOD FINANCIAL CORP | ||||||
| Date: October 22, 2025 | By: | /s/ John M. McCaffery |
||||
| John M. McCaffery | ||||||
| Executive Vice President and Chief Financial Officer | ||||||
| (Duly Authorized Representative) | ||||||
Exhibit 99.1

FOR IMMEDIATE RELEASE
Norwood Financial Corp announces Third Quarter and Year-to-Date 2025 Results
Quarterly and Year-to-Date Highlights:
| • | Fully diluted EPS of $0.89, an 85% increase over the same period in 2024 |
| • | Return on assets rose 72 basis points to 1.40% from 3Q 2024. |
| • | Net interest margin increased 20 basis points vs. the prior quarter and 64 basis points over the prior year. |
| • | Loans grew at a 5.4% and 7.3% annualized rate during the third quarter and year-to-date, respectively. |
| • | Deposits grew year-to-date at an annualized rate of 15% while deposit costs fell 19 basis points since the 4th quarter of 2024. |
| • | Capital continues to improve on increased earnings and lower accumulated other comprehensive income (AOCI) adjustment. |
Honesdale, Pennsylvania – October 22, 2025 - Norwood Financial Corp (Nasdaq Global Market-NWFL) and its subsidiary, Wayne Bank, announced results for the three months and nine months ended September 30, 2025.
Jim Donnelly, President and Chief Executive Officer, stated, “Our quarterly results continue to demonstrate the strength of our community banking franchise. We have been able to maintain solid growth, while improving profitability and efficiency.”
Mr. Donnelly continued, “Our disciplined approach to growth, improving margins, and credit quality have allowed us to deliver strong quarterly results for our shareholders. I am proud of the performance of the entire Norwood team as they remain focused on delivering the products and services that help our customers achieve their goals. We have improved our credit quality from already sound levels. This is a result of our well-managed and consistent approach to credit. We have also improved our fee income lines of business.”
“During the second quarter we launched our ‘Every Day Better’ brand to high acclaim from customers, employees, and community members. This full rebrand enabled us to articulate our values and mission, stand out from competitors, and unite and energize our company culture. Building on this great combination of a high-performing team and strong brand, I believe that we are on our way to creating a bright future for us, our customers, and our shareholders.”
Selected Financial Highlights (unaudited)
| (dollars in thousands, except per share data) |
Year-Over Year | Linked Quarter | Year-to-Date | |||||||||||||||||||||||||||||
| 3 Months Ended | 3 Months Ended | 9 Months Ended | ||||||||||||||||||||||||||||||
| Sep-25 | Sep-24 | Change | Jun-25 | Change | Sep-25 | Sep-24 | Change | |||||||||||||||||||||||||
| Net interest income |
$ | 20,458 | $ | 15,931 | $ | 4,527 | $ | 19,065 | $ | 1,393 | $ | 57,380 | $ | 45,566 | $ | 11,814 | ||||||||||||||||
| Net interest spread (fte) 1 |
2.94 | % | 2.23 | % | 71 bps | 2.75 | % | 19 bps | 2.77 | % | 2.12 | % | 65 bps | |||||||||||||||||||
| Net interest margin (fte) 1 |
3.63 | % | 2.99 | % | 64 bps | 3.43 | % | 20 bps | 3.46 | % | 2.87 | % | 59 bps | |||||||||||||||||||
| Pre Provision Net Revenue (PPNR) 1 |
$ | 10,029 | $ | 6,195 | $ | 3,834 | $ | 8,782 | $ | 1,247 | $ | 26,956 | $ | 16,868 | $ | 10,088 | ||||||||||||||||
| Net income |
$ | 8,334 | $ | 3,844 | $ | 4,490 | $ | 6,205 | $ | 2,129 | $ | 20,313 | $ | 12,491 | $ | 7,822 | ||||||||||||||||
| Diluted earnings per share |
$ | 0.89 | $ | 0.48 | $ | 0.41 | $ | 0.67 | $ | 0.22 | $ | 2.22 | $ | 1.55 | $ | 0.67 | ||||||||||||||||
| Return on average assets |
1.40 | % | 0.68 | % | 72 bps | 1.06 | % | 34 bps | 1.16 | % | 0.75 | % | 41 bps | |||||||||||||||||||
| Return on average tangible equity |
16.76 | % | 9.58 | % | 718bps | 12.83 | % | 393bps | 14.04 | % | 10.82 | % | 322 bps | |||||||||||||||||||
| 1 | - Non GAAP ratio. See Non-GAAP Reconciliation |
Excluding merger charges (see Non-GAAP reconciliations)
| (dollars in thousands, except per share data) |
Year-Over Year | Linked Quarter | Year-to-Date | |||||||||||||||||||||||||||||
| 3 Months Ended | 3 Months Ended | 9 Months Ended | ||||||||||||||||||||||||||||||
| Sep-25 | Sep-24 | Change | Jun-25 | Change | Sep-25 | Sep-24 | Change | |||||||||||||||||||||||||
| Pre Provision Net Revenue (PPNR) |
$ | 10,597 | $ | 6,195 | $ | 4,402 | $ | 8,932 | $ | 1,665 | $ | 27,674 | $ | 16,868 | $ | 10,806 | ||||||||||||||||
| Net income |
$ | 8,783 | $ | 3,844 | $ | 4,939 | $ | 6,324 | $ | 2,460 | $ | 20,880 | $ | 12,491 | $ | 8,389 | ||||||||||||||||
| Diluted earnings per share |
$ | 0.94 | $ | 0.48 | $ | 0.46 | $ | 0.69 | $ | 0.25 | $ | 2.28 | $ | 1.55 | $ | 0.73 | ||||||||||||||||
| Return on average assets |
1.47 | % | 0.68 | % | 79 bps | 1.08 | % | 39 bps | 1.19 | % | 0.75 | % | 44 bps | |||||||||||||||||||
| Return on average tangible equity |
17.66 | % | 9.58 | % | 808bps | 13.08 | % | 458bps | 14.43 | % | 10.82 | % | 361 bps | |||||||||||||||||||
Discussion of financial results for the three months ended September 30, 2025:
| • | The Company had net income of $8.3 million for the three months ended September 30, 2025, an increase of $4.5 million over the same period last year. |
| • | Net interest income increased during the third quarter of 2025 compared to the third quarter of 2024 due to increases in asset yields while interest costs of liabilities decreased. |
| • | Correspondingly, the net interest margin in the third quarter of 2025 was 3.63% compared to 2.99% in the third quarter of 2024. |
| • | Non-interest income in the first 9 months of 2025 increased $597 thousand or 9.2% over the same period in 2024. |
| • | The efficiency ratio for the third quarter of 2025 was 56.3% compared to 66.0% in the third quarter of 2024. |
| • | As of September 30, 2025, total assets were $2.412 billion, compared to $2.280 billion at September 30, 2024, an increase of 5.80%. |
| • | Loans receivable were $1.815 billion at September 30, 2025, compared to $1.675 billion at September 30, 2024, an increase of 8.3%. |
| • | Total deposits were $2.074 billion at September 30, 2025, compared to $1.855 billion at September 30, 2024, an increase of 11.8%. |
| • | Tangible Common Equity was 8.63% as of September 30, 2025, versus 7.57% at September 30, 2024. |
| • | Tangible Book Value per share increased $2.34 from $19.85 at December 31, 2024, to $22.19 at September 30, 2025. |
Norwood Financial Corp is the parent company of Wayne Bank, which operates from fifteen offices throughout Northeastern Pennsylvania and fourteen offices in Delaware, Sullivan, Ontario, Otsego and Yates Counties, New York. The Company’s stock trades on the Nasdaq Global Market under the symbol “NWFL”.
Forward-Looking Statements
The Private Securities Litigation Reform Act of 1995 contains safe harbor provisions regarding forward-looking statements. When used in this discussion, the words “believes”, “anticipates”, “contemplates”, “expects”, “bode”, “future performance”, “solid footing,” “good momentum,” “bright future”, “robust growth” and similar expressions are intended to identify forward-looking statements. Such statements are subject to certain risks and uncertainties, which could cause actual results to differ materially from those projected. Those risks and uncertainties include, among other things, changes in federal and state laws, changes in interest rates, our ability to maintain strong credit quality metrics, our ability to have future performance, our ability to control core operating expenses and costs, demand for real estate, government fiscal and trade policies, cybersecurity and general economic conditions. The Company undertakes no obligation to publicly release the results of any revisions to those forward-looking statements which may be made to reflect events or circumstances after the date hereof or to reflect the occurrence of unanticipated events.
Contact: John M. McCaffery
Executive Vice President &
Chief Financial Officer
NORWOOD FINANCIAL CORP
272-304-3003
www.waynebank.com
NORWOOD FINANCIAL CORP
Consolidated Balance Sheets
(dollars in thousands, except share and per share data)
(unaudited)
| September 30 | ||||||||
| 2025 | 2024 | |||||||
| ASSETS |
||||||||
| Cash and due from banks |
$ | 50,348 | $ | 47,072 | ||||
| Interest-bearing deposits with banks |
24,382 | 35,808 | ||||||
|
|
|
|
|
|||||
| Cash and cash equivalents |
74,730 | 82,880 | ||||||
| Securities available for sale |
403,989 | 396,891 | ||||||
| Loans receivable |
1,814,682 | 1,675,139 | ||||||
| Less: Allowance for credit losses |
19,911 | 18,699 | ||||||
|
|
|
|
|
|||||
| Net loans receivable |
1,794,771 | 1,656,440 | ||||||
| Regulatory stock, at cost |
6,163 | 6,329 | ||||||
| Bank premises and equipment, net |
22,292 | 18,503 | ||||||
| Bank owned life insurance |
45,821 | 46,382 | ||||||
| Foreclosed real estate owned |
— | — | ||||||
| Accrued interest receivable |
8,686 | 8,062 | ||||||
| Deferred tax assets, net |
16,528 | 18,818 | ||||||
| Goodwill |
29,266 | 29,266 | ||||||
| Other intangible assets |
109 | 167 | ||||||
| Other assets |
9,596 | 16,013 | ||||||
|
|
|
|
|
|||||
| TOTAL ASSETS |
$ | 2,411,951 | $ | 2,279,751 | ||||
|
|
|
|
|
|||||
| LIABILITIES |
||||||||
| Deposits: |
||||||||
| Non-interest bearing demand |
$ | 424,027 | $ | 420,967 | ||||
| Interest-bearing |
1,649,941 | 1,434,284 | ||||||
|
|
|
|
|
|||||
| Total deposits |
2,073,968 | 1,855,251 | ||||||
| Short-term borrowings |
— | 52,453 | ||||||
| Other borrowings |
72,071 | 144,959 | ||||||
| Accrued interest payable |
9,823 | 12,688 | ||||||
| Other liabilities |
21,184 | 18,746 | ||||||
|
|
|
|
|
|||||
| TOTAL LIABILITIES |
2,177,046 | 2,084,097 | ||||||
| STOCKHOLDERS’ EQUITY |
||||||||
| Preferred Stock, no par value per share, authorized 5,000,000 shares |
— | — | ||||||
| Common Stock, $.10 par value per share, authorized: 20,000,000 shares, issued: 2025: 9,491,558 shares, 2024: 8,311,851 shares |
949 | 831 | ||||||
| Surplus |
127,190 | 98,330 | ||||||
| Retained earnings |
136,662 | 140,489 | ||||||
| Treasury stock, at cost: 2025: 229,233 shares, 2024: 221,140 shares |
(6,188 | ) | (5,969 | ) | ||||
| Accumulated other comprehensive loss |
(23,708 | ) | (38,027 | ) | ||||
|
|
|
|
|
|||||
| TOTAL STOCKHOLDERS’ EQUITY |
234,905 | 195,654 | ||||||
|
|
|
|
|
|||||
| TOTAL LIABILITIES AND STOCKHOLDERS’ EQUITY |
$2,411,951 | $2,279,751 | ||||||
|
|
|
|
|
|||||
NORWOOD FINANCIAL CORP
Consolidated Statements of Income
(dollars in thousands, except per share data)
(unaudited)
| Three Months Ended September 30, | Nine Months Ended September 30, | |||||||||||||||
| 2025 | 2024 | 2025 | 2024 | |||||||||||||
| INTEREST INCOME |
||||||||||||||||
| Loans receivable, including fees |
$ | 28,141 | $ | 25,464 | $ | 81,244 | $ | 73,266 | ||||||||
| Securities |
3,907 | 2,526 | 11,648 | 7,635 | ||||||||||||
| Other |
144 | 497 | 590 | 2,194 | ||||||||||||
|
|
|
|
|
|
|
|
|
|||||||||
| Total Interest income |
32,192 | 28,487 | 93,482 | 83,095 | ||||||||||||
| INTEREST EXPENSE |
||||||||||||||||
| Deposits |
10,730 | 10,553 | 32,347 | 31,349 | ||||||||||||
| Short-term borrowings |
105 | 323 | 774 | 1,015 | ||||||||||||
| Other borrowings |
899 | 1,680 | 2,981 | 5,165 | ||||||||||||
|
|
|
|
|
|
|
|
|
|||||||||
| Total Interest expense |
11,734 | 12,556 | 36,102 | 37,529 | ||||||||||||
|
|
|
|
|
|
|
|
|
|||||||||
| NET INTEREST INCOME |
20,458 | 15,931 | 57,380 | 45,566 | ||||||||||||
| (RELEASE OF) PROVISION FOR CREDIT LOSSES |
(502 | ) | 1,345 | 1,305 | 1,069 | |||||||||||
|
|
|
|
|
|
|
|
|
|||||||||
| NET INTEREST INCOME AFTER (RELEASE OF) PROVISION FOR CREDIT LOSSES |
20,960 | 14,586 | 56,075 | 44,497 | ||||||||||||
| OTHER INCOME |
||||||||||||||||
| Service charges and fees |
1,660 | 1,517 | 4,687 | 4,364 | ||||||||||||
| Income from fiduciary activities |
254 | 256 | 805 | 719 | ||||||||||||
| Gains on sales of loans, net |
130 | 103 | 242 | 145 | ||||||||||||
| Gains on sales of foreclosed real estate owned |
— | — | — | 32 | ||||||||||||
| Earnings and proceeds on life insurance policies |
268 | 261 | 820 | 781 | ||||||||||||
| Other |
193 | 158 | 551 | 467 | ||||||||||||
|
|
|
|
|
|
|
|
|
|||||||||
| Total other income |
2,505 | 2,295 | 7,105 | 6,508 | ||||||||||||
| OTHER EXPENSES |
||||||||||||||||
| Salaries and employee benefits |
6,696 | 6,239 | 19,773 | 18,328 | ||||||||||||
| Occupancy, furniture and equipment |
1,361 | 1,269 | 4,088 | 3,758 | ||||||||||||
| Data processing and related operations |
1,087 | 1,162 | 3,361 | 3,208 | ||||||||||||
| Taxes, other than income |
192 | 179 | 577 | 452 | ||||||||||||
| Professional fees |
968 | 576 | 2,250 | 1,669 | ||||||||||||
| FDIC Insurance assessment |
368 | 339 | 1,129 | 1,009 | ||||||||||||
| Foreclosed real estate |
1 | 9 | 143 | 45 | ||||||||||||
| Amortization of intangibles |
12 | 16 | 42 | 54 | ||||||||||||
| Other |
2,249 | 2,242 | 6,166 | 6,683 | ||||||||||||
|
|
|
|
|
|
|
|
|
|||||||||
| Total other expenses |
12,934 | 12,031 | 37,529 | 35,206 | ||||||||||||
| INCOME BEFORE TAX EXPENSE |
10,531 | 4,850 | 25,651 | 15,799 | ||||||||||||
| INCOME TAX EXPENSE |
2,197 | 1,006 | 5,338 | 3,308 | ||||||||||||
|
|
|
|
|
|
|
|
|
|||||||||
| NET INCOME |
$ | 8,334 | $ | 3,844 | $ | 20,313 | $ | 12,491 | ||||||||
|
|
|
|
|
|
|
|
|
|||||||||
| Basic earnings per share |
$ | 0.89 | $ | 0.48 | $ | 2.22 | $ | 1.55 | ||||||||
|
|
|
|
|
|
|
|
|
|||||||||
| Diluted earnings per share |
$ | 0.89 | $ | 0.48 | $ | 2.22 | $ | 1.55 | ||||||||
|
|
|
|
|
|
|
|
|
|||||||||
NORWOOD FINANCIAL CORP
NET INTEREST MARGIN ANALYSIS
(dollars in thousands)
| For the Quarter Ended | ||||||||||||||||||||||||||||||||||||
| September 30, 2025 | June 30, 2025 | September 30, 2024 | ||||||||||||||||||||||||||||||||||
| Average | Average | Average | Average | Average | Average | |||||||||||||||||||||||||||||||
| Balance | Interest | Rate | Balance | Interest | Rate | Balance | Interest | Rate | ||||||||||||||||||||||||||||
| (2) | (1) | (3) | (2) | (1) | (3) | (2) | (1) | (3) | ||||||||||||||||||||||||||||
| Assets |
||||||||||||||||||||||||||||||||||||
| Interest-earning assets: |
||||||||||||||||||||||||||||||||||||
| Interest-bearing deposits with banks |
$ | 12,485 | $ | 144 | 4.58 | % | $ | 19,085 | $ | 220 | 4.62 | % | $ | 36,221 | $ | 497 | 5.46 | % | ||||||||||||||||||
| Securities available for sale: |
||||||||||||||||||||||||||||||||||||
| Taxable |
399,090 | 3,661 | 3.64 | 404,428 | 3,624 | 3.59 | 392,168 | 2,161 | 2.19 | |||||||||||||||||||||||||||
| Tax-exempt (1) |
44,074 | 312 | 2.81 | 44,158 | 312 | 2.83 | 67,563 | 461 | 2.71 | |||||||||||||||||||||||||||
|
|
|
|
|
|
|
|
|
|
|
|
|
|||||||||||||||||||||||||
| Total securities available for sale (1) |
443,164 | 3,973 | 3.56 | 448,586 | 3,936 | 3.52 | 459,731 | 2,622 | 2.27 | |||||||||||||||||||||||||||
| Loans receivable (1) (4) (5) |
1,802,046 | 28,267 | 6.22 | 1,783,626 | 27,249 | 6.13 | 1,651,921 | 25,575 | 6.16 | |||||||||||||||||||||||||||
|
|
|
|
|
|
|
|
|
|
|
|
|
|||||||||||||||||||||||||
| Total interest-earning assets |
2,257,695 | 32,384 | 5.69 | 2,251,297 | 31,405 | 5.60 | 2,147,873 | 28,694 | 5.31 | |||||||||||||||||||||||||||
| Non-interest earning assets: |
||||||||||||||||||||||||||||||||||||
| Cash and due from banks |
31,050 | 30,323 | 28,193 | |||||||||||||||||||||||||||||||||
| Allowance for credit losses |
(21,128 | ) | (20,733 | ) | (17,944 | ) | ||||||||||||||||||||||||||||||
| Other assets |
96,142 | 94,922 | 78,344 | |||||||||||||||||||||||||||||||||
|
|
|
|
|
|
|
|||||||||||||||||||||||||||||||
| Total non-interest earning assets |
106,064 | 104,512 | 88,593 | |||||||||||||||||||||||||||||||||
|
|
|
|
|
|
|
|||||||||||||||||||||||||||||||
| Total Assets |
$ | 2,363,759 | $ | 2,355,809 | $ | 2,236,466 | ||||||||||||||||||||||||||||||
|
|
|
|
|
|
|
|||||||||||||||||||||||||||||||
| Liabilities and Stockholders’ Equity |
||||||||||||||||||||||||||||||||||||
| Interest-bearing liabilities: |
||||||||||||||||||||||||||||||||||||
| Interest-bearing demand and money market |
$ | 579,145 | $ | 2,900 | 1.99 | $ | 573,904 | $ | 2,887 | 2.02 | $ | 461,897 | $ | 2,782 | 2.40 | |||||||||||||||||||||
| Savings |
200,559 | 113 | 0.22 | 204,318 | 119 | 0.23 | 221,366 | 13 | 0.02 | |||||||||||||||||||||||||||
| Time |
822,491 | 7,717 | 3.72 | 821,725 | 7,863 | 3.84 | 734,235 | 7,758 | 4.20 | |||||||||||||||||||||||||||
|
|
|
|
|
|
|
|
|
|
|
|
|
|||||||||||||||||||||||||
| Total interest-bearing deposits |
1,602,195 | 10,730 | 2.66 | 1,599,947 | 10,869 | 2.72 | 1,417,498 | 10,553 | 2.96 | |||||||||||||||||||||||||||
| Short-term borrowings |
8,740 | 105 | 4.77 | 17,757 | 211 | 4.77 | 53,622 | 323 | 2.40 | |||||||||||||||||||||||||||
| Other borrowings |
81,125 | 899 | 4.40 | 95,792 | 1,061 | 4.44 | 146,357 | 1,680 | 4.57 | |||||||||||||||||||||||||||
|
|
|
|
|
|
|
|
|
|
|
|
|
|||||||||||||||||||||||||
| Total interest-bearing liabilities |
1,692,060 | 11,734 | 2.75 | 1,713,496 | 12,141 | 2.84 | 1,617,477 | 12,556 | 3.09 | |||||||||||||||||||||||||||
| Non-interest bearing liabilities: |
||||||||||||||||||||||||||||||||||||
| Demand deposits |
416,150 | 389,323 | 400,314 | |||||||||||||||||||||||||||||||||
| Other liabilities |
28,816 | 29,639 | 29,540 | |||||||||||||||||||||||||||||||||
|
|
|
|
|
|
|
|||||||||||||||||||||||||||||||
| Total non-interest bearing liabilities |
444,966 | 418,962 | 429,854 | |||||||||||||||||||||||||||||||||
| Stockholders’ equity |
226,733 | 223,351 | 189,135 | |||||||||||||||||||||||||||||||||
|
|
|
|
|
|
|
|||||||||||||||||||||||||||||||
| Total Liabilities and Stockholders’ Equity |
$ | 2,363,759 | $ | 2,355,809 | $ | 2,236,466 | ||||||||||||||||||||||||||||||
|
|
|
|
|
|
|
|||||||||||||||||||||||||||||||
| Net interest income/spread (tax equivalent basis) |
20,650 | 2.94 | % | 19,264 | 2.75 | % | 16,138 | 2.23 | % | |||||||||||||||||||||||||||
|
|
|
|
|
|
|
|||||||||||||||||||||||||||||||
| Tax-equivalent basis adjustment |
(192 | ) | (199 | ) | (207 | ) | ||||||||||||||||||||||||||||||
|
|
|
|
|
|
|
|||||||||||||||||||||||||||||||
| Net interest income |
$ | 20,458 | $ | 19,065 | $ | 15,931 | ||||||||||||||||||||||||||||||
|
|
|
|
|
|
|
|||||||||||||||||||||||||||||||
| Net interest margin (tax equivalent basis) |
3.63 | % | 3.43 | % | 2.99 | % | ||||||||||||||||||||||||||||||
|
|
|
|
|
|
|
|||||||||||||||||||||||||||||||
| (1) | Interest and yields are presented on a tax-equivalent basis using a marginal tax rate of 21%. |
| (2) | Average balances have been calculated based on daily balances. |
| (3) | Annualized |
| (4) | Loan balances include non-accrual loans and are net of unearned income. |
| (5) | Loan yields include the effect of amortization of deferred fees, net of costs. |
NORWOOD FINANCIAL CORP
NET INTEREST MARGIN ANALYSIS
(dollars in thousands)
| Year to Date | ||||||||||||||||||||||||||||||||||||
| September 30, 2025 | June 30, 2025 | September 30, 2024 | ||||||||||||||||||||||||||||||||||
| Average | Average | Average | Average | Average | Average | |||||||||||||||||||||||||||||||
| Balance | Interest | Rate | Balance | Interest | Rate | Balance | Interest | Rate | ||||||||||||||||||||||||||||
| (2) | (1) | (3) | (2) | (1) | (3) | (2) | (1) | (3) | ||||||||||||||||||||||||||||
| Assets |
||||||||||||||||||||||||||||||||||||
| Interest-earning assets: |
||||||||||||||||||||||||||||||||||||
| Interest-bearing deposits with banks |
$ | 17,427 | $ | 590 | 4.53 | % | $ | 19,939 | $ | 446 | 4.51 | % | $ | 53,046 | $ | 2,194 | 5.52 | % | ||||||||||||||||||
| Securities available for sale: |
||||||||||||||||||||||||||||||||||||
| Taxable |
403,947 | 10,907 | 3.61 | 406,416 | 7,247 | 3.60 | 398,462 | 6,514 | 2.18 | |||||||||||||||||||||||||||
| Tax-exempt (1) |
44,157 | 938 | 2.84 | 44,199 | 626 | 2.86 | 68,852 | 1,419 | 2.75 | |||||||||||||||||||||||||||
|
|
|
|
|
|
|
|
|
|
|
|
|
|||||||||||||||||||||||||
| Total securities available for sale (1) |
448,104 | 11,845 | 3.53 | 450,615 | 7,873 | 3.52 | 467,314 | 7,933 | 2.27 | |||||||||||||||||||||||||||
| Loans receivable (1) (4) (5) |
1,776,629 | 81,636 | 6.14 | 1,763,710 | 53,369 | 6.10 | 1,631,179 | 73,569 | 6.02 | |||||||||||||||||||||||||||
|
|
|
|
|
|
|
|
|
|
|
|
|
|||||||||||||||||||||||||
| Total interest-earning assets |
2,242,160 | 94,071 | 5.61 | 2,234,264 | 61,688 | 5.57 | 2,151,539 | 83,696 | 5.20 | |||||||||||||||||||||||||||
| Non-interest earning assets: |
||||||||||||||||||||||||||||||||||||
| Cash and due from banks |
30,035 | 29,519 | 26,409 | |||||||||||||||||||||||||||||||||
| Allowance for credit losses |
(20,675 | ) | (20,445 | ) | (18,353 | ) | ||||||||||||||||||||||||||||||
| Other assets |
94,389 | 94,031 | 73,935 | |||||||||||||||||||||||||||||||||
|
|
|
|
|
|
|
|||||||||||||||||||||||||||||||
| Total non-interest earning assets |
103,749 | 103,105 | 81,991 | |||||||||||||||||||||||||||||||||
|
|
|
|
|
|
|
|||||||||||||||||||||||||||||||
| Total Assets |
$ | 2,345,909 | $ | 2,337,369 | $ | 2,233,530 | ||||||||||||||||||||||||||||||
|
|
|
|
|
|
|
|||||||||||||||||||||||||||||||
| Liabilities and Stockholders’ Equity |
||||||||||||||||||||||||||||||||||||
| Interest-bearing liabilities: |
||||||||||||||||||||||||||||||||||||
| Interest-bearing demand and money market |
$ | 566,762 | $ | 8,588 | 2.03 | $ | 560,469 | $ | 5,688 | 2.05 | $ | 460,579 | $ | 7,489 | 2.17 | |||||||||||||||||||||
| Savings |
205,552 | 374 | 0.24 | 208,090 | 261 | 0.25 | 223,825 | 549 | 0.33 | |||||||||||||||||||||||||||
| Time |
812,778 | 23,385 | 3.85 | 807,841 | 15,668 | 3.91 | 738,205 | 23,311 | 4.22 | |||||||||||||||||||||||||||
|
|
|
|
|
|
|
|
|
|
|
|
|
|||||||||||||||||||||||||
| Total interest-bearing deposits |
1,585,092 | 32,347 | 2.73 | 1,576,400 | 21,617 | 2.77 | 1,422,609 | 31,349 | 2.94 | |||||||||||||||||||||||||||
| Short-term borrowings |
23,468 | 774 | 4.41 | 30,954 | 669 | 4.36 | 57,754 | 1,015 | 2.35 | |||||||||||||||||||||||||||
| Other borrowings |
90,110 | 2,981 | 4.42 | 94,676 | 2,082 | 4.43 | 150,418 | 5,165 | 4.59 | |||||||||||||||||||||||||||
|
|
|
|
|
|
|
|
|
|
|
|
|
|||||||||||||||||||||||||
| Total interest-bearing liabilities |
1,698,670 | 36,102 | 2.84 | 1,702,030 | 24,368 | 2.89 | 1,630,781 | 37,529 | 3.07 | |||||||||||||||||||||||||||
| Non-interest bearing liabilities: |
||||||||||||||||||||||||||||||||||||
| Demand deposits |
395,470 | 384,958 | 391,479 | |||||||||||||||||||||||||||||||||
| Other liabilities |
28,978 | 29,594 | 27,677 | |||||||||||||||||||||||||||||||||
|
|
|
|
|
|
|
|||||||||||||||||||||||||||||||
| Total non-interest bearing liabilities |
424,448 | 414,552 | 419,156 | |||||||||||||||||||||||||||||||||
| Stockholders’ equity |
222,791 | 220,787 | 183,593 | |||||||||||||||||||||||||||||||||
|
|
|
|
|
|
|
|||||||||||||||||||||||||||||||
| Total Liabilities and Stockholders’ Equity |
$ | 2,345,909 | $ | 2,337,369 | $ | 2,233,530 | ||||||||||||||||||||||||||||||
|
|
|
|
|
|
|
|||||||||||||||||||||||||||||||
| Net interest income/spread (tax equivalent basis) |
57,969 | 2.77 | % | 37,320 | 2.68 | % | 46,167 | 2.12 | % | |||||||||||||||||||||||||||
|
|
|
|
|
|
|
|||||||||||||||||||||||||||||||
| Tax-equivalent basis adjustment |
(589 | ) | (397 | ) | (601 | ) | ||||||||||||||||||||||||||||||
|
|
|
|
|
|
|
|||||||||||||||||||||||||||||||
| Net interest income |
$ | 57,380 | $ | 36,923 | $ | 45,566 | ||||||||||||||||||||||||||||||
|
|
|
|
|
|
|
|||||||||||||||||||||||||||||||
| Net interest margin (tax equivalent basis) |
3.46 | % | 3.37 | % | 2.87 | % | ||||||||||||||||||||||||||||||
|
|
|
|
|
|
|
|||||||||||||||||||||||||||||||
(1) Interest and yields are presented on a tax-equivalent basis using a marginal tax rate of 21%.
(2) Average balances have been calculated based on daily balances.
(3) Annualized
(4) Loan balances include non-accrual loans and are net of unearned income.
(5) Loan yields include the effect of amortization of deferred fees, net of costs.
NORWOOD FINANCIAL CORP
Financial Highlights (Unaudited)
(dollars in thousands, except per share data)
| For the Three Months Ended September 30 |
2025 | 2024 | ||||||
| Net interest income |
$ | 20,458 | $ | 15,931 | ||||
| Net income |
8,334 | 3,844 | ||||||
| Net interest spread (fully taxable equivalent) |
2.94 | % | 2.23 | % | ||||
| Net interest margin (fully taxable equivalent) |
3.63 | % | 2.99 | % | ||||
| Return on average assets |
1.40 | % | 0.68 | % | ||||
| Return on average equity |
14.58 | % | 8.09 | % | ||||
| Return on average tangible equity |
16.76 | % | 9.58 | % | ||||
| Basic earnings per share |
$ | 0.89 | $ | 0.48 | ||||
| Diluted earnings per share |
$ | 0.89 | $ | 0.48 | ||||
| For the Nine Months Ended September 30 |
2025 | 2024 | ||||||
| Net interest income |
57,380 | 45,566 | ||||||
| Net income |
20,313 | 12,491 | ||||||
| Net interest spread (fully taxable equivalent) |
2.77 | % | 2.12 | % | ||||
| Net interest margin (fully taxable equivalent) |
3.46 | % | 2.87 | % | ||||
| Return on average assets |
1.16 | % | 0.75 | % | ||||
| Return on average equity |
12.19 | % | 9.09 | % | ||||
| Return on average tangible equity |
14.04 | % | 10.82 | % | ||||
| Basic earnings per share |
2.22 | 1.55 | ||||||
| Diluted earnings per share |
2.22 | 1.55 | ||||||
| As of September 30 |
2025 | 2024 | ||||||
| Total assets |
$ | 2,411,951 | $ | 2,279,751 | ||||
| Total loans receivable |
1,814,682 | 1,675,139 | ||||||
| Allowance for credit losses |
19,911 | 18,699 | ||||||
| Total deposits |
2,073,968 | 1,855,251 | ||||||
| Stockholders’ equity |
234,905 | 195,654 | ||||||
| Trust assets under management |
211,563 | 209,857 | ||||||
| Book value per share |
$ | 25.36 | $ | 24.18 | ||||
| Tangible book value per share |
$ | 22.19 | $ | 20.54 | ||||
| Equity to total assets |
9.74 | % | 8.58 | % | ||||
| Allowance to total loans receivable |
1.10 | % | 1.12 | % | ||||
| Nonperforming loans to total loans |
0.36 | % | 0.47 | % | ||||
| Nonperforming assets to total assets |
0.31 | % | 0.35 | % | ||||
NORWOOD FINANCIAL CORP
Historical Consolidated Statements of Income (unaudited)
(dollars in thousands, except per share data)
| September 30 | June 30 | March 31 | December 31 | September 30 | ||||||||||||||||
| Three months ended | 2025 | 2025 | 2025 | 2024 | 2024 | |||||||||||||||
| INTEREST INCOME |
||||||||||||||||||||
| Loans receivable, including fees |
$ | 28,141 | $ | 27,115 | $ | 25,988 | $ | 26,122 | $ | 25,464 | ||||||||||
| Securities |
3,907 | 3,871 | 3,870 | 2,789 | 2,526 | |||||||||||||||
| Other |
144 | 220 | 226 | 574 | 497 | |||||||||||||||
|
|
|
|
|
|
|
|
|
|
|
|||||||||||
| Total interest income |
32,192 | 31,206 | 30,084 | 29,485 | 28,487 | |||||||||||||||
| INTEREST EXPENSE |
||||||||||||||||||||
| Deposits |
10,730 | 10,869 | 10,748 | 10,984 | 10,553 | |||||||||||||||
| Borrowings |
1,004 | 1,272 | 1,479 | 1,876 | 2,003 | |||||||||||||||
|
|
|
|
|
|
|
|
|
|
|
|||||||||||
| Total interest expense |
11,734 | 12,141 | 12,227 | 12,860 | 12,556 | |||||||||||||||
|
|
|
|
|
|
|
|
|
|
|
|||||||||||
| NET INTEREST INCOME |
20,458 | 19,065 | 17,857 | 16,625 | 15,931 | |||||||||||||||
| PROVISION FOR (RELEASE OF) CREDIT LOSSES |
(502 | ) | 950 | 857 | 1,604 | 1,345 | ||||||||||||||
|
|
|
|
|
|
|
|
|
|
|
|||||||||||
| NET INTEREST INCOME AFTER (RELEASE OF) PROVISION FOR CREDIT LOSSES |
20,960 | 18,115 | 17,000 | 15,021 | 14,586 | |||||||||||||||
| OTHER INCOME |
||||||||||||||||||||
| Service charges and fees |
1,660 | 1,514 | 1,513 | 1,595 | 1,517 | |||||||||||||||
| Income from fiduciary activities |
254 | 226 | 325 | 224 | 256 | |||||||||||||||
| Net realized (losses) gains on sales of securities |
— | — | — | (19,962 | ) | — | ||||||||||||||
| Gains on sales of loans, net |
130 | 65 | 47 | 50 | 103 | |||||||||||||||
| Gains on sales of foreclosed real estate owned |
— | — | — | — | — | |||||||||||||||
| Earnings and proceeds on life insurance policies |
268 | 266 | 286 | 275 | 261 | |||||||||||||||
| Other |
193 | 177 | 180 | 159 | 158 | |||||||||||||||
|
|
|
|
|
|
|
|
|
|
|
|||||||||||
| Total other income |
2,505 | 2,248 | 2,351 | (17,659 | ) | 2,295 | ||||||||||||||
| OTHER EXPENSES |
||||||||||||||||||||
| Salaries and employee benefits |
6,696 | 6,605 | 6,472 | 6,690 | 6,239 | |||||||||||||||
| Occupancy, furniture and equipment, net |
1,361 | 2,538 | 1,378 | 1,291 | 1,269 | |||||||||||||||
| Foreclosed real estate |
1 | 137 | 4 | 9 | 9 | |||||||||||||||
| FDIC insurance assessment |
368 | 355 | 406 | 335 | 339 | |||||||||||||||
| Other |
4,508 | 2,896 | 3,804 | 5,094 | 4,175 | |||||||||||||||
|
|
|
|
|
|
|
|
|
|
|
|||||||||||
| Total other expenses |
12,934 | 12,531 | 12,064 | 13,419 | 12,031 | |||||||||||||||
| INCOME BEFORE TAX (BENEFIT) EXPENSE |
10,531 | 7,832 | 7,287 | (16,057 | ) | 4,850 | ||||||||||||||
| INCOME TAX (BENEFIT) EXPENSE |
2,197 | 1,627 | 1,514 | (3,406 | ) | 1,006 | ||||||||||||||
|
|
|
|
|
|
|
|
|
|
|
|||||||||||
| NET (LOSS) INCOME |
$ | 8,334 | $ | 6,205 | $ | 5,773 | $ | (12,651 | ) | $ | 3,844 | |||||||||
|
|
|
|
|
|
|
|
|
|
|
|||||||||||
| Basic (loss) earnings per share |
$ | 0.89 | $ | 0.67 | $ | 0.63 | $ | (1.54 | ) | $ | 0.48 | |||||||||
|
|
|
|
|
|
|
|
|
|
|
|||||||||||
| Diluted (loss) earnings per share |
$ | 0.89 | $ | 0.67 | $ | 0.63 | $ | (1.54 | ) | $ | 0.48 | |||||||||
|
|
|
|
|
|
|
|
|
|
|
|||||||||||
| Return on average assets (annualized) |
1.40 | % | 1.06 | % | 1.01 | % | -2.19 | % | 0.68 | % | ||||||||||
| Return on average equity (annualized) |
14.58 | % | 11.14 | % | 10.73 | % | -26.08 | % | 8.09 | % | ||||||||||
| Return on average tangible equity (annualized) |
16.76 | % | 12.83 | % | 12.40 | % | -30.77 | % | 9.58 | % | ||||||||||
| Net interest spread (fte) |
2.94 | % | 2.75 | % | 2.61 | % | 2.31 | % | 2.23 | % | ||||||||||
| Net interest margin (fte) |
3.63 | % | 3.43 | % | 3.30 | % | 3.04 | % | 2.99 | % | ||||||||||
NORWOOD FINANCIAL CORP
Historical Consolidated Balance Sheets (unaudited)
(dollars in thousands)
| September 30 | June 30 | March 31 | December 31 | September 30 | ||||||||||||||||
| 2025 | 2025 | 2025 | 2024 | 2024 | ||||||||||||||||
| ASSETS |
||||||||||||||||||||
| Cash and due from banks |
$ | 50,348 | $ | 32,052 | $ | 31,729 | $ | 27,562 | $ | 47,072 | ||||||||||
| Interest-bearing deposits with banks |
24,382 | 20,993 | 43,678 | 44,777 | 35,808 | |||||||||||||||
|
|
|
|
|
|
|
|
|
|
|
|||||||||||
| Cash and cash equivalents |
74,730 | 53,045 | 75,407 | 72,339 | 82,880 | |||||||||||||||
| Securities available for sale |
403,989 | 402,460 | 408,742 | 397,846 | 396,891 | |||||||||||||||
| Loans receivable |
1,814,682 | 1,790,574 | 1,771,269 | 1,713,638 | 1,675,139 | |||||||||||||||
| Less: Allowance for credit losses |
19,911 | 20,908 | 20,442 | 19,843 | 18,699 | |||||||||||||||
|
|
|
|
|
|
|
|
|
|
|
|||||||||||
| Net loans receivable |
1,794,771 | 1,769,666 | 1,750,827 | 1,693,795 | 1,656,440 | |||||||||||||||
| Regulatory stock, at cost |
6,163 | 7,538 | 7,616 | 13,366 | 6,329 | |||||||||||||||
| Bank owned life insurance |
45,821 | 46,099 | 46,914 | 46,657 | 46,382 | |||||||||||||||
| Bank premises and equipment, net |
22,292 | 21,608 | 20,273 | 19,657 | 18,503 | |||||||||||||||
| Foreclosed real estate owned |
— | — | — | — | — | |||||||||||||||
| Goodwill and other intangibles |
29,375 | 29,387 | 29,402 | 29,418 | 29,433 | |||||||||||||||
| Other assets |
34,810 | 35,547 | 36,863 | 44,384 | 42,893 | |||||||||||||||
|
|
|
|
|
|
|
|
|
|
|
|||||||||||
| TOTAL ASSETS |
$ | 2,411,951 | $ | 2,365,350 | $ | 2,376,044 | $ | 2,317,462 | $ | 2,279,751 | ||||||||||
|
|
|
|
|
|
|
|
|
|
|
|||||||||||
| LIABILITIES |
||||||||||||||||||||
| Deposits: |
||||||||||||||||||||
| Non-interest bearing demand |
$ | 424,027 | $ | 406,358 | $ | 391,377 | $ | 381,479 | $ | 420,967 | ||||||||||
| Interest-bearing deposits |
1,649,941 | 1,591,476 | 1,613,071 | 1,477,684 | 1,434,284 | |||||||||||||||
|
|
|
|
|
|
|
|
|
|
|
|||||||||||
| Total deposits |
2,073,968 | 1,997,834 | 2,004,448 | 1,859,163 | 1,855,251 | |||||||||||||||
| Borrowings |
72,071 | 111,850 | 118,590 | 214,862 | 197,412 | |||||||||||||||
| Other liabilities |
31,007 | 30,241 | 32,299 | 29,929 | 31,434 | |||||||||||||||
|
|
|
|
|
|
|
|
|
|
|
|||||||||||
| TOTAL LIABILITIES |
2,177,046 | 2,139,925 | 2,155,337 | 2,103,954 | 2,084,097 | |||||||||||||||
| STOCKHOLDERS’ EQUITY |
234,905 | 225,425 | 220,707 | 213,508 | 195,654 | |||||||||||||||
|
|
|
|
|
|
|
|
|
|
|
|||||||||||
| TOTAL LIABILITIES AND STOCKHOLDERS’ EQUITY |
$ | 2,411,951 | $ | 2,365,350 | $ | 2,376,044 | $ | 2,317,462 | $ | 2,279,751 | ||||||||||
|
|
|
|
|
|
|
|
|
|
|
|||||||||||
| Book Value per share |
$ | 25.36 | $ | 24.34 | $ | 23.84 | $ | 23.02 | $ | 24.18 | ||||||||||
| Tangible Book Value per share |
22.19 | 21.17 | 20.66 | 19.85 | 20.54 | |||||||||||||||
| Allowance for credit losses to total loans |
1.10 | % | 1.17 | % | 1.15 | % | 1.16 | % | 1.12 | % | ||||||||||
| Net charge-offs to average loans (annualized) |
0.13 | % | 0.08 | % | 0.07 | % | 0.12 | % | 0.08 | % | ||||||||||
| Nonperforming loans to total loans |
0.36 | % | 0.45 | % | 0.45 | % | 0.46 | % | 0.47 | % | ||||||||||
| Nonperforming assets to total assets |
0.31 | % | 0.34 | % | 0.33 | % | 0.34 | % | 0.35 | % | ||||||||||
Non-GAAP Financial Measures (unaudited)
The following tables reconcile certain Non-GAAP financial measures references in this release:
| Adjusted Return on Average Assets |
||||||||||||||||||||
| (Dollars in thousands) | ||||||||||||||||||||
| Three Months Ended September 30, | Nine Months Ended September 30, | Three Months Ended | ||||||||||||||||||
| 2025 | 2024 | 2025 | 2024 | June 30, 2025 | ||||||||||||||||
| Net (loss) income |
$ | 8,334 | $ | 3,844 | $ | 20,313 | $ | 12,491 | $ | 6,205 | ||||||||||
| Average assets |
2,363,759 | 2,236,466 | 2,345,909 | 2,233,530 | 2,355,809 | |||||||||||||||
| Return on average assets (annualized) |
1.40 | % | 0.68 | % | 1.16 | % | 0.75 | % | 1.06 | |||||||||||
| Net (loss) income |
8,334 | 3,844 | 20,313 | 12,491 | 6,205 | |||||||||||||||
| Merger Expenses |
568 | 0 | 718 | 0 | 150 | |||||||||||||||
| Tax effect at 21% |
(119 | ) | 0 | (151 | ) | 0 | (32 | ) | ||||||||||||
|
|
|
|
|
|
|
|
|
|
|
|||||||||||
| Adjusted Net Income (Non-GAAP) |
8,783 | 3,844 | 20,880 | 12,491 | 6,324 | |||||||||||||||
| Average assets |
2,363,759 | 2,236,466 | 2,345,909 | 2,233,530 | 2,355,809 | |||||||||||||||
| Adjusted return on average assets (annualized) (Non-GAAP) |
1.47 | % | 0.68 | % | 1.19 | % | 0.75 | % | 1.08 | |||||||||||
| Adjusted Return on Average Tangible |
||||||||||||||||||||
| (Dollars in thousands) | ||||||||||||||||||||
| Three Months Ended September 30, | Nine Months Ended September 30, | Three Months Ended | ||||||||||||||||||
| 2025 | 2024 | 2025 | 2024 | June 30, 2025 | ||||||||||||||||
| Net (loss) income |
$ | 8,334 | $ | 3,844 | $ | 20,313 | $ | 12,491 | $ | 6,205 | ||||||||||
| Average shareholders’ equity |
226,733 | 189,135 | 222,791 | 183,593 | 223,351 | |||||||||||||||
| Average intangible assets |
29,380 | 29,440 | 29,394 | 29,457 | 29,394 | |||||||||||||||
|
|
|
|
|
|
|
|
|
|
|
|||||||||||
| Average tangible shareholders’ equity |
197,353 | 159,695 | 193,397 | 154,136 | 193,957 | |||||||||||||||
| Return on average tangible shareholders’ equity (annualized) |
16.76 | % | 9.58 | % | 14.04 | % | 10.82 | % | 12.83 | |||||||||||
| Net (loss) income |
8,334 | 3,844 | 20,313 | 12,491 | 6,205 | |||||||||||||||
| Merger Expenses |
568 | 0 | 718 | 0 | 150 | |||||||||||||||
| Tax effect at 21% |
(119 | ) | 0 | (151 | ) | 0 | (32 | ) | ||||||||||||
|
|
|
|
|
|
|
|
|
|
|
|||||||||||
| Adjusted Net Income (Non-GAAP) |
8,783 | 3,844 | 20,880 | 12,491 | 6,324 | |||||||||||||||
| Average tangible shareholders’ equity |
197,353 | 159,695 | 193,397 | 154,136 | 193,957 | |||||||||||||||
| Adjusted return on average shareholders’ equity (annualized) (Non-GAAP) |
17.66 | % | 9.58 | % | 14.43 | % | 10.82 | % | 13.08 | |||||||||||
| Adjusted Earnings Per Share |
||||||||||||||||||||
| (Dollars in thousands) | ||||||||||||||||||||
| Three Months Ended September 30, | Nine Months Ended September 30, | Three Months Ended | ||||||||||||||||||
| 2025 | 2024 | 2025 | 2024 | June 30, 2025 | ||||||||||||||||
| GAAP-Based Earnings Per Share, Basic |
$ | 0.89 | $ | 0.48 | $ | 2.22 | $ | 1.55 | $ | 0.67 | ||||||||||
| GAAP-Based Earnings Per Share, Diluted |
$ | 0.89 | $ | 0.48 | $ | 2.22 | $ | 1.55 | $ | 0.67 | ||||||||||
| Net (Loss) Income |
8,334 | 3,844 | 20,313 | 12,491 | 6,205 | |||||||||||||||
| Merger Expenses |
568 | 0 | 718 | 0 | 150 | |||||||||||||||
| Tax effect at 21% |
(119 | ) | 0 | (151 | ) | 0 | (32 | ) | ||||||||||||
|
|
|
|
|
|
|
|
|
|
|
|||||||||||
| Adjusted Net Income (Non-GAAP) |
8,783 | 3,844 | 20,880 | 12,491 | 6,324 | |||||||||||||||
| Adjusted Earnings per Share, Basic (Non-GAAP) |
$ | 0.94 | $ | 0.48 | $ | 2.28 | $ | 1.55 | $ | 0.69 | ||||||||||
| Adjusted Earnings per Share, Diluted (Non-GAAP) |
$ | 0.94 | $ | 0.48 | $ | 2.28 | $ | 1.55 | $ | 0.69 | ||||||||||
| Pre Provision Net Revenue |
||||||||||||||||||||
| (Dollars in thousands) | ||||||||||||||||||||
| Three Months Ended September 30, | Nine Months Ended September 30, | Three Months Ended | ||||||||||||||||||
| 2025 | 2024 | 2025 | 2024 | June 30, 2025 | ||||||||||||||||
| Income before tax expense (GAAP) |
$ | 10,531 | $ | 4,850 | $ | 25,651 | $ | 15,799 | $ | 7,832 | ||||||||||
| Provision for (release of) credit losses |
(502 | ) | 1,345 | 1,305 | 1,069 | 950 | ||||||||||||||
|
|
|
|
|
|
|
|
|
|
|
|||||||||||
| Pre provision net revenue (PPNR) (Non-GAAP) |
10,029 | 6,195 | 26,956 | 16,868 | 8,782 | |||||||||||||||
| Merger expenses |
568 | 0 | 718 | 0 | 150 | |||||||||||||||
|
|
|
|
|
|
|
|
|
|
|
|||||||||||
| PPNR adjusted for merger expenses (Non-GAAP) |
$ | 10,597 | $ | 6,195 | $ | 27,674 | $ | 16,868 | $ | 8,932 | ||||||||||
| Net interest income on a fully taxable
equivalent |
||||||||||||||||||||
| (Dollars in thousands) | ||||||||||||||||||||
| Three Months Ended September 30, | Nine Months Ended September 30, | Three Months Ended | ||||||||||||||||||
| 2025 | 2024 | 2025 | 2024 | June 30, 2025 | ||||||||||||||||
| Net Interest Income |
$ | 20,458 | $ | 15,931 | $ | 57,380 | $ | 45,566 | $ | 19,065 | ||||||||||
| Taxable equivalent basis adjustment using 21% marginal tax rate |
192 | 207 | 589 | 601 | 199 | |||||||||||||||
| Net interest income on a fully taxable equivalent basis |
$ | 20,650 | $ | 16,138 | $ | 57,969 | $ | 46,167 | $ | 19,264 | ||||||||||
|
|
|
|
|
|
|
|
|
|
|
|||||||||||
| Average tangible equity |
||||||||||||||||||||
| (Dollars in thousands) | ||||||||||||||||||||
| Three Months Ended September 30, | Nine Months Ended September 30, | Three Months Ended | ||||||||||||||||||
| 2025 | 2024 | 2025 | 2024 | June 30, 2025 | ||||||||||||||||
| Average equity |
$ | 226,733 | $ | 189,135 | $ | 222,791 | $ | 183,593 | $ | 223,351 | ||||||||||
| Average goodwill and other intangibles |
(29,380 | ) | (29,440 | ) | (29,394 | ) | (29,457 | ) | (29,394 | ) | ||||||||||
| Average tangible equity |
$ | 197,353 | $ | 159,695 | $ | 193,397 | $ | 154,136 | $ | 193,957 | ||||||||||
|
|
|
|
|
|
|
|
|
|
|
|||||||||||
| Tangible Book Value |
||||||||||||||||||||
| (Dollars in thousands) | ||||||||||||||||||||
| at September 30, | at June 30, | |||||||||||||||||||
| 2025 | 2024 | 2025 | ||||||||||||||||||
| Total shareholders’ equity |
234,905 | 195,654 | 225,425 | |||||||||||||||||
| Adjustments: |
||||||||||||||||||||
| Goodwill |
(29,266 | ) | (29,266 | ) | (29,266 | ) | ||||||||||||||
| Other intangible assets |
(109 | ) | (167 | ) | (121 | ) | ||||||||||||||
|
|
|
|
|
|
|
|||||||||||||||
| Tangible common equity (Non-GAAP) |
205,530 | 166,221 | 196,038 | |||||||||||||||||
| Common shares outstanding |
9,262,325 | 8,090,711 | 9,260,522 | |||||||||||||||||
| Book value per common share |
25.36 | 24.18 | 24.34 | |||||||||||||||||
| Tangible book value per common share (Non-GAAP) |
22.19 | 20.54 | 21.17 | |||||||||||||||||

Exhibit 99.2 INVESTOR PRESENTATION Q3 2025 Earnings Call O c t o b e r 2 2 , 2 0 2 5

Forward-looking Statements and Additional Information This presentation contains forward-looking statements within the meaning of the federal securities laws relating to the proposed merger with PB Bankshares, Inc. (“PBBK”) by Norwood Financial Corp. (“Norwood” or “NWFL”), the integration of PBBK with NWFL, the combination of their businesses and projected or pro forma financial information and metrics. All statements other than statements of historical fact are statements that could be deemed forward-looking statements, including all statements regarding the intent, belief or current expectations of NWFL and PBBK and members of their respective board of directors and senior management teams. Investors and security holders are cautioned that such statements are predictions, and are not guarantees of future performance. Actual events or results may differ materially. Completion of the proposed merger, expected financial results or other plans are subject to a number of known and unknown risks, uncertainties and assumptions that are difficult to assess and are subject to change based on factors which are, in many instances, beyond NWFL's control. Additional risks and uncertainties may include, but are not limited to, the risk that expected cost savings, revenue synergies and other financial benefits from the proposed merger may not be realized or take longer than expected to realize, the failure to obtain required regulatory or shareholder approvals, the failure of the closing conditions in the merger agreement to be satisfied or any unexpected delay in closing the transaction. For further information regarding these risks and uncertainties and additional factors that could cause results to differ materially from those contained in the forward-looking statements, see the forward-looking statement disclosure contained in the Annual Report on Form 10-K for the most recently ended fiscal year of NWFL and PBBK, as well as the proxy statement/prospectus described below, and other documents subsequently filed by NWFL and PBBK with the Securities and Exchange Commission. Due to these and other possible uncertainties and risks, NWFL and PBBK can give no assurance that the results contemplated in the forward-looking statements will be realized, and readers are cautioned not to place undue reliance on the forward-looking statements contained in this presentation. Forward-looking statements are based on information currently available to NWFL and PBBK, and the parties assume no obligation and disclaim any intent to update any such forward-looking statements. All forward-looking statements, express or implied, included in the presentation are qualified in their entirety by this cautionary statement. NON-GAAP FINANCIAL MEASURES In addition to results presented in accordance with GAAP, this presentation includes certain non-GAAP financial measures. NWFL and PBBK believe these non-GAAP financial measures provide additional information that is useful to investors in helping to understand underlying financial performance and condition and trends of NWFL. Non-GAAP financial measures have inherent limitations. Readers should be aware of these limitations and should be cautious with respect to the use of such measures. To compensate for these limitations, non-GAAP measures are used as comparative tools, together with GAAP measures, to assist in the evaluation of operating performance or financial condition. These measures are also calculated using the appropriate GAAP or regulatory components in their entirety and are computed in a manner intended to facilitate consistent period-to-period comparisons. NWFL’s method of calculating these non-GAAP measures may differ from methods used by other companies. These non- GAAP measures should not be considered in isolation or as a substitute or an alternative for those financial measures prepared in accordance with GAAP or in-effect regulatory requirements. Numbers in this presentation may not sum due to rounding. Where non-GAAP financial measures are used, the most directly comparable GAAP or regulatory financial measure, as well as the reconciliation to the most directly comparable GAAP or regulatory financial measure, can be found in this presentation. 2

Forward-looking Statements and Additional Information This communication is being made in respect of the proposed merger transaction involving NWFL and PBBK. This material is not a solicitation of any vote or approval of the NWFL and PBBK shareholders and is not a substitute for the proxy statement/prospectus or any other documents that NWFL and PBBK may send to their respective shareholders in connection with the proposed transaction. This communication does not constitute an offer to sell or the solicitation of an offer to buy any securities. The proposed merger transaction will be submitted to the shareholders of PBBK for their consideration. In connection with the proposed merger, Norwood filed a Registration Statement on Form S-4 (File No. 333-290392) with the Securities and Exchange Commission (the “SEC”), to register the shares of Norwood common stock to be issued in connection with the proposed transaction. The Registration Statement, as amended, has not yet been declared effective by the SEC, includes the joint proxy statement/prospectus of Norwood and PB Bankshares which will be mailed to stockholders of PB Bankshares, seeking their approval of the proposed transaction. This communication does not constitute an offer to sell of the solicitation of an offer to buy and securities or a solicitation of any vote or approval. BEFORE MAKING ANY VOTING OR INVESTMENT DECISIONS, INVESTORS AND PBBK SHAREHOLDERS ARE URGED TO READ THE REGISTRATION STATEMENT AND THE PROXY STATEMENT/PROSPECTUS REGARDING THE PROPOSED TRANSACTION AND ANY OTHER RELEVANT DOCUMENTS FILED OR TO BE FILED WITH THE SEC AND ANY AMENDMENTS OR SUPPLEMENTS TO THOSE DOCUMENTS CAREFULLY AND IN THEIR ENTIRETY WHEN THEY BECOME AVAILABLE BECAUSE THEY WILL CONTAIN IMPORTANT INFORMATION ABOUT NWFL, PBBK, THE PROPOSED TRANSACTION AND RELATED MATTERS. Shareholders are also urged to carefully review and consider NWFL’s and PBBK’s public filings with the SEC, including, but not limited to, its proxy statements, its Annual Reports on Form 10-K, its Quarterly Reports on Form 10-Q and its Current Reports on Form 8-K. Investors and security holders may obtain free copies of the Registration Statement, the proxy statement/prospectus, any amendments or supplements thereto and other documents containing important information about NWFL or PBBK and/or the proposed transaction, once such documents are filed with the SEC, at the SEC’s website at www.sec.gov. In addition, copies of the documents filed with the SEC by NWFL, including the proxy statement/prospectus and the SEC filings that will be incorporated by reference in the proxy statement/prospectus, will be available free of charge on the NWFL’s website at www.wayne.bank under the heading “Shareholder Services.” Participants in the Solicitation NWFL, PBBK and certain of their respective directors, executive officers and other members of management and employees may, under the SEC’s rules, be deemed to be participants in the solicitation of proxies in connection with the proposed transaction. Information about the directors and executive officers of NWFL is set forth in its proxy statement for its 2025 annual meeting of shareholders, which was filed with the SEC on March 18, 2025, its annual report on Form 10-K for the fiscal year ended December 31, 2024, which was filed with the SEC on March 14, 2025, and in other documents filed with the SEC, each of which can be obtained free of charge from the sources indicated above. Information about the directors and executive officers of PBBK is set forth in its proxy statement for its 2025 annual meeting of shareholders, which was filed with the SEC on April 23, 2025, its annual report on Form 10-K for the fiscal year ended December 31, 2024, which was filed with the SEC on March 28, 2025, and in other documents filed with the SEC, each of which can be obtained free of charge from the sources indicated above. Additional information regarding the participants in the proxy solicitation, including a description of their direct and indirect interests, by security holdings or otherwise, will be contained in the proxy statement/prospectus and other relevant materials to be filed with the SEC when they become available. Free copies of these documents may be obtained as described in the preceding paragraph. 3

Q3 2025 Summary Selected Financial Highlights Key Messages (all comps Y/Y) We performed well during the third quarter, improving $20.5M 2.94% margins, increasing profitability, growing assets, and 1 1 Net Interest Spread (fte) Net Interest Income strengthening our financial position +71 bps +28% Our 2025 results continue to benefit from the strategic $10.6M 2 repositioning of our bond portfolio completed Q4 2024 3.63% Adjusted Pre Provision 1 Net Interest Margin (fte) 1 Net Revenue +64 bps +71% We have filed all required applications with regulatory authorities for approval of the merger, and the 3 applications are pending $0.94 $8.8M 1 1 Adjusted Net Income Adjusted Diluted EPS We completed the leadership transition of our Board of +56% +96% Directors and added two new Directors to strengthen 4 governance and lead NWFL into our next leg of growth 1.47% 17.66% Adjusted Return on Adjusted Return on Our employees continue to live out our values of 1 1 Average Assets Tangible Equity 5 community service, making them “Every Day Better” +79 bps +808 bps 1) See appendix for Non-GAAP reconciliation 4

Franchise Overview | Norwood Financial Corp. Branch Footprint Franchise Highlights Cooperstown NASDAQ: NWFL $2.4B Oneonta 29 2 10 CA1 Total Assets Headquarters: Honesdale, PA Offices States Counties Honesdale Founded: 1871 $1.8B Milford Total Gross Loans Scranton Employees: 281 Dividend Yield: 5.0% Stroudsburg NY $2.1B Geneva Total Deposits Rejoined the Russell 2000 Index in 2023 $235M Total Equity PA NJ $244.0M Market Cap $1B - $5B in Asset Size Note: Financials as of September 30, 2024; Market data as of December 5, 2024 Source: S&P Capital IQ Pro

Strength. Security. Stability. Key Tenets for Success Customers Employees Community Shareholders Recently rebranded: Consolidated Wayne Bank, the Bank of Cooperstown and Bank of the Finger Lakes under single Wayne Bank brand. 150+ Years in Business Committed to the same community banking mission and core values instated upon our founding in 1871 Focused on achieving above-peer performance targets bolstered by our competitive strength in markets of operation Repositioned the balance sheet to improve performance in 2025 and Rewarding Shareholders beyond Record of 32 consecutive years of increasing cash dividends Consistent record of organic growth bolstered by three successful acquisitions between 2011 and 2020 Growth & Expansion Focused on expanding fee income lines such as wealth/trust, mortgage and treasury management services Mission Statement: “Helping the community grow by serving businesses and their employees” A Community Pillar The Bank and its employees are key contributors to several local charities Focused on small business and local relationships
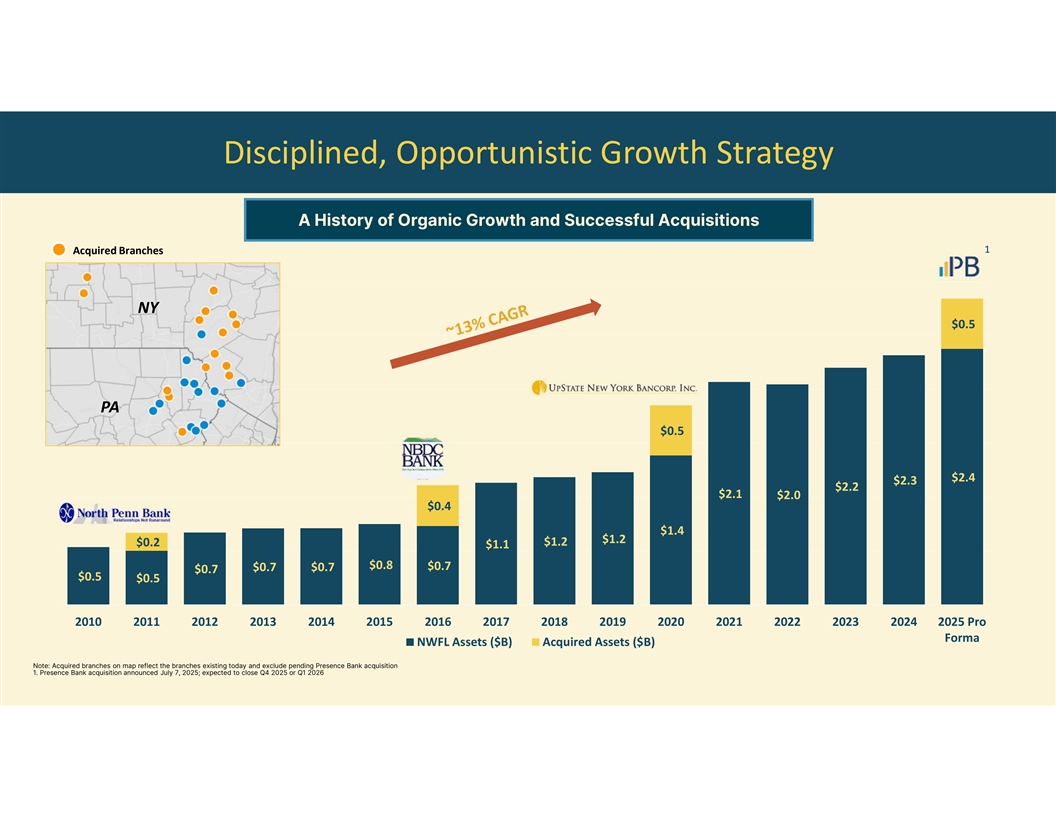
Disciplined, Opportunistic Growth Strategy A History of Organic Growth and Successful Acquisitions 1 Acquired Branches NY $0.5 PA $0.5 $2.4 $2.3 $2.2 $2.1 $2.0 $0.4 $1.4 $1.2 $1.2 $0.2 $1.1 $0.8 $0.7 $0.7 $0.7 $0.7 $0.5 $0.5 2010 2011 2012 2013 2014 2015 2016 2017 2018 2019 2020 2021 2022 2023 2024 2025 Pro Forma NWFL Assets ($B) Acquired Assets ($B) Note: Acquired branches on map reflect the branches existing today and exclude pending Presence Bank acquisition 1. Presence Bank acquisition announced July 7, 2025; expected to close Q4 2025 or Q1 2026

Loan Portfolio Overview Small Business Lending, Granular Relationships and Limited Industry Concentration Loan Portfolio By Category Historical Asset Yields JM1 1-4 Family, 6.22% 6.18% 6.16% 6.13% 6.08% C&I, 14% 14% 5.98% 5.90% 5.84% 5.69% 5.60% 5.52% 5.54% Const & Land, 5.35% 5.33% 5.31% 5.17% 5.11% 5.08% 5.01% 5% 4.92% 4.73% 4.57% Consumer, 1% 4.37% Total 4.19% Indirect, 18% $1.8B NOO CRE, 21% 2022Q4 2023Q1 2023Q2 2023Q3 2023Q4 2024Q1 2024Q2 2024Q3 2024Q4 2025Q1 2025Q2 2025Q3 Yield on Loans Yield on Int. Earning Assets Home Eq, 5% CRE Loans by Industry OO CRE, 22% 1-4 Family Rental Investor Real $91K Average Loan Size Agriculture 10% Estate 8% 23% $298K Average Commercial Loan Size CRE 13% Adjustable, 32% Floating, and 55% Fixed Rate Multi Family $792M 8% Office Exposure: 7 loans for ~$5M Owner CRE Ratio: 131% (as of Q2 2025) Occupied 51%
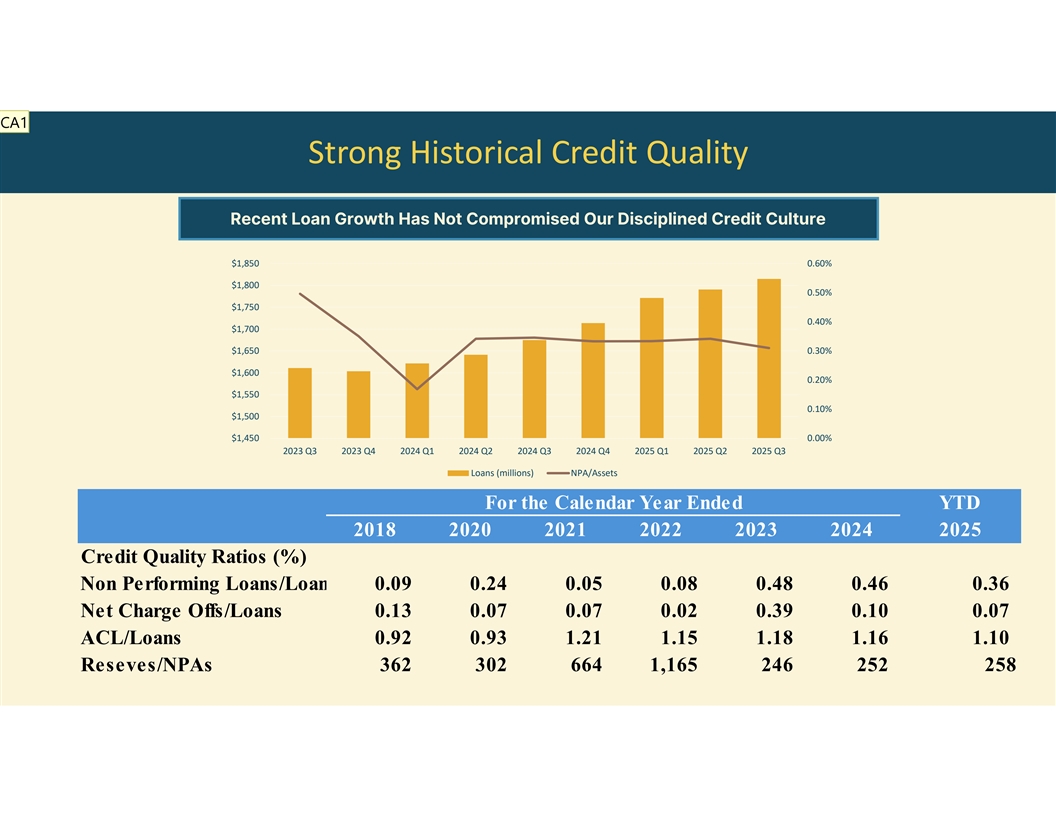
CA1 Strong Historical Credit Quality Recent Loan Growth Has Not Compromised Our Disciplined Credit Culture $1,850 0.60% $1,800 0.50% $1,750 0.40% $1,700 $1,650 0.30% $1,600 0.20% $1,550 0.10% $1,500 $1,450 0.00% 2023 Q3 2023 Q4 2024 Q1 2024 Q2 2024 Q3 2024 Q4 2025 Q1 2025 Q2 2025 Q3 Loans (millions) NPA/Assets For the Calendar Year Ended YTD 2018 2020 2021 2022 2023 2024 2025 Credit Quality Ratios (%) Non Performing Loans/Loans 0.09 0 .24 0 .05 0 .08 0 .48 0 .46 0.36 Net Charge Offs/Loans 0.13 0 .07 0 .07 0 .02 0 .39 0 .10 0.07 ACL/Loans 0.92 0 .93 1 .21 1 .15 1 .18 1 .16 1.10 Reseves/NPAs 3 62 302 6 64 1 ,165 246 2 52 258
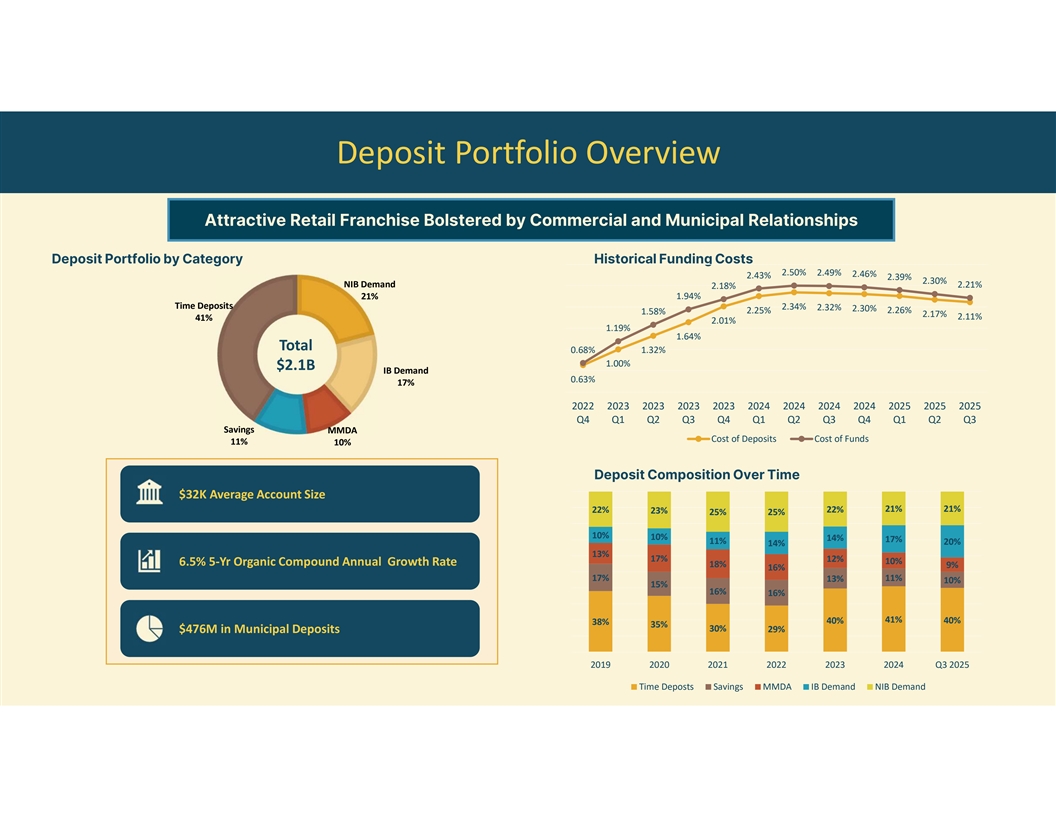
Deposit Portfolio Overview Attractive Retail Franchise Bolstered by Commercial and Municipal Relationships Deposit Portfolio by Category Historical Funding Costs 2.50% 2.49% 2.46% 2.43% 2.39% 2.30% NIB Demand 2.21% 2.18% 21% 1.94% Time Deposits 2.34% 2.32% 2.30% 2.25% 2.26% 1.58% 2.17% 2.11% 41% 2.01% 1.19% 1.64% Total 0.68% 1.32% 1.00% $2.1B IB Demand 0.63% 17% 2022 2023 2023 2023 2023 2024 2024 2024 2024 2025 2025 2025 Q4 Q1 Q2 Q3 Q4 Q1 Q2 Q3 Q4 Q1 Q2 Q3 Savings MMDA Cost of Deposits Cost of Funds 11% 10% Deposit Composition Over Time $32K Average Account Size 21% 21% 22% 23% 22% 25% 25% 10% 10% 14% 17% 11% 20% 14% 13% 17% 12% 10% 6.5% 5-Yr Organic Compound Annual Growth Rate 18% 9% 16% 17% 13% 11% 10% 15% 16% 16% 41% 40% 40% 38% 35% 30% 29% $476M in Municipal Deposits 2019 2020 2021 2022 2023 2024 Q3 2025 Time Deposts Savings MMDA IB Demand NIB Demand

Interest Rate Sensitivity Net Interest Income Sensitivity 1.5% 0.8% 0.5% 0.2% -1.1% -1.1% -2.1% -2.4% -2.6% -3.8% -4.4% -6.8% -300 -200 -100 Base +100 +200 +300 Q1 2025 Q2 2025 Note: Impact to net interest income as of September 30, 2024

Investment Proposition Strong local ties providing consistent and Disciplined underwriting culture sound growth opportunities Experienced Executive Team, aligned Granular loan and deposit portfolio tied to with Board of Directors, focused on our community delivering shareholder return Attractive financial profile enhanced by the Well-positioned to take advantage of proposed offering and repositioning market dislocation and M&Aopportunities Strength. Security. Stability.

APPENDIX

Non-GAAP Financial Measures Adjusted Return on Average Assets (Dollars in thousands) Three Months Ended September 30, Nine Months Ended September 30, Three Months Ended 2025 2024 2025 2024 June 30, 2025 Net (loss) income $ 8,334 $ 3,844 $ 20,313 $ 12,491 $ 6,205 Average assets 2,363,759 2,236,466 2,345,909 2,233,530 2,355,809 Return on average assets (annualized) 1.40 % 0.68 % 1.16 % 0.75 % 1.06 % Net (loss) income 8,334 3,844 20,313 12,491 6,205 Merger Expenses 568 0 718 0 150 Tax effect at 21% (119) 0 (151) 0 (32) Adjusted Net Income (Non-GAAP) 8,783 3,844 20,880 12,491 6,324 Average assets 2,363,759 2,236,466 2,345,909 2,233,530 2,355,809 Adjusted return on average assets (annualized) (Non-GAAP) 1.47 % 0.68 % 1.19 % 0.75 % 1.08 % Adjusted Return on Average Tangible Shareholders' Equity (Dollars in thousands) Three Months Ended September 30, Nine Months Ended September 30, Three Months Ended 2025 2024 2025 2024 June 30, 2025 Net (loss) income $ 8,334 $ 3,844 $ 20,313 $ 12,491 $ 6,205 Average shareholders' equity 226,733 189,135 222,791 183,593 223,351 Average intangible assets 29,380 29,440 29,394 29,457 29,394 Average tangible shareholders' equity 197,353 159,695 193,397 154,136 193,957 Return on average tangible shareholders' equity (annualized) 16.76 % 9.58 % 14.04 % 10.82 % 12.83 % Net (loss) income 8,334 3,844 20,313 12,491 6,205 Merger Expenses 568 0 718 0 150 Tax effect at 21% (119) 0 (151) 0 (32) Adjusted Net Income (Non-GAAP) 8,783 3,844 20,880 12,491 6,324 Average tangible shareholders' equity 197,353 159,695 193,397 154,136 193,957 Adjusted return on average shareholders' equity (annualized) (Non-GAAP) 17.66 % 9.58 % 14.43 % 10.82 % 13.08 % 14
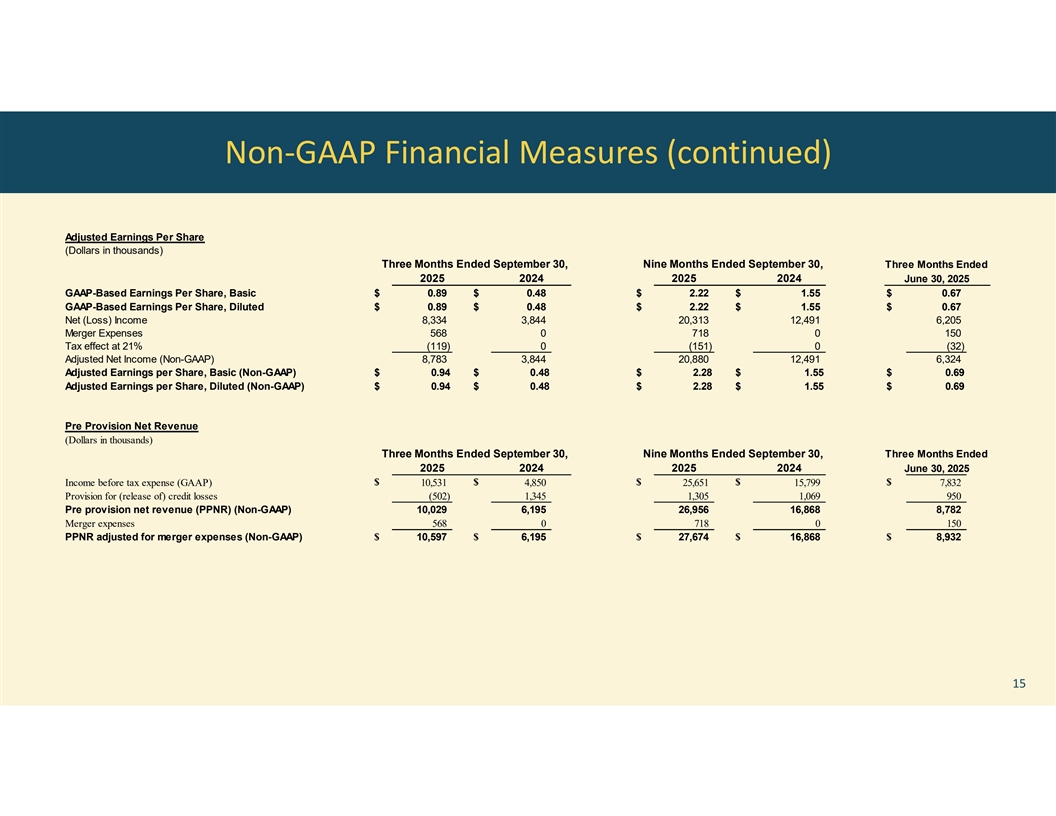
Non-GAAP Financial Measures (continued) Adjusted Earnings Per Share (Dollars in thousands) Three Months Ended September 30, Nine Months Ended September 30, Three Months Ended 2025 2024 2025 2024 June 30, 2025 GAAP-Based Earnings Per Share, Basic $ 0.89 $ 0.48 $ 2.22 $ 1.55 $ 0.67 GAAP-Based Earnings Per Share, Diluted $ 0.89 $ 0.48 $ 2.22 $ 1.55 $ 0.67 Net (Loss) Income 8,334 3,844 20,313 12,491 6,205 Merger Expenses 568 0 718 0 150 Tax effect at 21% (119) 0 (151) 0 (32) Adjusted Net Income (Non-GAAP) 8,783 3,844 20,880 12,491 6,324 Adjusted Earnings per Share, Basic (Non-GAAP) $ 0.94 $ 0.48 $ 2.28 $ 1.55 $ 0.69 Adjusted Earnings per Share, Diluted (Non-GAAP) $ 0.94 $ 0.48 $ 2.28 $ 1.55 $ 0.69 Pre Provision Net Revenue (Dollars in thousands) Three Months Ended September 30, Nine Months Ended September 30, Three Months Ended 2025 2024 2025 2024 June 30, 2025 $ $ $ $ $ Income before tax expense (GAAP) 10,531 4,850 25,651 15,799 7,832 Provision for (release of) credit losses (502) 1,345 1,305 1,069 950 Pre provision net revenue (PPNR) (Non-GAAP) 10,029 6,195 26,956 16,868 8,782 Merger expenses 568 0 718 0 150 PPNR adjusted for merger expenses (Non-GAAP) $ 10,597 $ 6,195 $ 27,674 $ 16,868 $ 8,932 15

Non-GAAP Financial Measures (continued) Net interest income on a fully taxable equivalent basis (Dollars in thousands) Three Months Ended September 30, Nine Months Ended September 30, Three Months Ended 2025 2024 2025 2024 June 30, 2025 Net Interest Income $ 20,458 $ 15,931 $ 5 7,380 $ 4 5,566 $ 19,065 Taxable equivalent basis adjustment using 21% marginal tax rate 192 207 589 601 199 Net interest income on a fully taxable equivalent basis $ 2 0,650 $ 1 6,138 $ 5 7,969 $ 46,167 $ 1 9,264 Average tangible equity (Dollars in thousands) Three Months Ended September 30, Nine Months Ended September 30, Three Months Ended 2025 2024 2025 2024 June 30, 2025 Average equity $ 226,733 $ 189,135 $ 222,791 $ 183,593 $ 223,351 Average goodwill and other intangibles (29,380) (29,440) (29,394) (29,457) (29,394) Average tangible equity $ 197,353 $ 159,695 $ 193,397 $ 154,136 $ 193,957 Tangible Book Value (Dollars in thousands) at September 30, at June 30, 2025 2024 2025 Total shareholders' equity 234,905 195,654 225,425 Adjustments: Goodwill (29,266) (29,266) (29,266) Other intangible assets (109) (167) (121) Tangible common equity (Non-GAAP) 205,530 166,221 196,038 Common shares outstanding 9,262,325 8,090,711 9,260,522 Book value per common share 25.36 24.18 24.34 Tangible book value per common share (Non-GAAP) 22.19 20.54 21.17 16

Thank You