UNITED STATES
SECURITIES AND EXCHANGE COMMISSION
WASHINGTON, DC 20549
FORM 8-K
CURRENT REPORT
PURSUANT TO SECTION 13 OR 15(d)
OF THE SECURITIES EXCHANGE ACT OF 1934
Date of Report (Date of earliest event reported): April 30, 2024
MIMEDX GROUP, INC.
(Exact name of registrant as specified in charter)
| Florida | 001-35887 | 26-2792552 | ||
| (State or other jurisdiction of incorporation) |
(Commission File Number) |
(IRS Employer Identification No.) |
1775 West Oak Commons Ct., NE, Marietta GA 30062
(Address of principal executive offices) (Zip Code)
Registrant’s telephone number, including area code: (770) 651-9100
Check the appropriate box below if the Form 8-K filing is intended to simultaneously satisfy the filing obligation of the registrant under any of the following provisions (see General Instruction A.2. below):
| ☐ | Written communications pursuant to Rule 425 under the Securities Act (17 CFR 230.425) |
| ☐ | Soliciting material pursuant to Rule 14a-12 under the Exchange Act (17 CFR 240.14a-12) |
| ☐ | Pre-commencement communications pursuant to Rule 14d-2(b) under the Exchange Act (17 CFR 240.14d-2(b)) |
| ☐ | Pre-commencement communications pursuant to Rule 13e-4(c) under the Exchange Act (17 CFR 240.13e-4(c)) |
Securities registered pursuant to Section 12(b) of the Act:
| Title of each class |
Trading |
Name of each exchange on which registered |
||
| Common Stock, $0.001 par value per share | MDXG | The Nasdaq Stock Market LLC |
Indicate by check mark whether the registrant is an emerging growth company as defined in Rule 405 of the Securities Act of 1933 (§ 230.405 of this chapter) or Rule 12b-2 of the Securities Exchange Act of 1934 (§ 240.12b-2 of this chapter).
Emerging growth company ☐
If an emerging growth company, indicate by check mark if the registrant has elected not to use the extended transition period for complying with any new or revised financial accounting standards provided pursuant to Section 13(a) of the Exchange Act. ☐
Important Cautionary Statement
This report includes forward-looking statements. Statements regarding: (i) future sales or sales growth; (ii) our 2024 financial goals and expectations for future financial results, including levels of net sales, Adjusted EBITDA, Adjusted EBITDA margin, corporate expenses and cash; (iii) our cash flows; (iv) our expectations regarding our new products, including EPIEFFECT and AMNIOEFFECT; (v) our expectations regarding the launch of our collagen particulate xenograft product; and (vi) continued growth in different care settings. Additional forward-looking statements may be identified by words such as “believe,” “expect,” “may,” “plan,” “goal,” “outlook,” “potential,” “will,” “preliminary,” and similar expressions, and are based on management’s current beliefs and expectations.
Forward-looking statements are subject to risks and uncertainties, and the Company cautions investors against placing undue reliance on such statements. Actual results may differ materially from those set forth in the forward-looking statements. Factors that could cause actual results to differ from expectations include: (i) future sales are uncertain and are affected by competition, access to customers, patient access to healthcare providers, the reimbursement environment and many other factors; (ii) the Company may change its plans due to unforeseen circumstances; (iii) the results of scientific research are uncertain and may have little or no value; (iv) our ability to sell our products in other countries depends on a number of factors including adequate levels of reimbursement, market acceptance of novel therapies, and our ability to build and manage a direct sales force or third party distribution relationship; (v) the effectiveness of amniotic tissue as a therapy for particular indications or conditions is the subject of further scientific and clinical studies; and (vi) we may alter the timing and amount of planned expenditures for research and development based on regulatory developments. The Company describes additional risks and uncertainties in the Risk Factors section of its most recent annual report and quarterly reports filed with the Securities and Exchange Commission. Any forward-looking statements speak only as of the date of this press release and the Company assumes no obligation to update any forward-looking statement.
Item 2.02 Results of Operations and Financial Condition.
On April 30, 2024, MiMedx Group, Inc. (the “Company”), issued a press release (the “Earnings Press Release”) announcing its results for the first quarter ended March 31, 2024. A copy of the Earnings Press Release is attached hereto as Exhibit 99.1 and is incorporated herein by reference.
The foregoing information is furnished pursuant to Item 2.02, “Results of Operations and Financial Condition”, including Exhibit 99.1 attached hereto, and shall not be deemed “filed” for purposes of Section 18 of the Securities Exchange Act of 1934, as amended (the “Exchange Act”), or otherwise subject to the liabilities of that section. It may only be incorporated by reference into another filing under the Exchange Act or Securities Act of 1933, as amended (the “Securities Act”), if such subsequent filing specifically references this Form 8-K. All information in the Earnings Press Release speaks as of the date thereof and the Company does not assume any obligation to update said information in the future. In addition, the Company disclaims any inference regarding the materiality of such information which otherwise may arise as a result of its furnishing such information under Item 2.02 of this report on Form 8-K.
Item 7.01 Regulation FD Disclosure.
On April 30, 2024, at 4:30 p.m. Eastern Daylight Time, the Company intends to host a conference call and webcast (the “Earnings Call”) to discuss its financial and operating results for the first quarter ended March 31, 2024. A copy of the slide presentation to be used by the Company in connection with the Earnings Call is attached hereto as Exhibit 99.2 and is incorporated herein by reference. A copy of the presentation materials made available to the investors by the Company on the Company’s website in connection with Earnings Release is furnished as Exhibit 99.3 to this Current Report and is incorporated herein by reference.
The foregoing information is furnished pursuant to Item 7.01, including Exhibit 99.2 and Exhibit 99.3 attached hereto, and shall not be deemed “filed” for purposes of Section 18 of the Exchange Act, or otherwise subject to the liabilities of that section. It may only be incorporated by reference into another filing under the Exchange Act or Securities Act if such subsequent filing specifically references this Form 8-K.
Item 9.01 Financial Statements and Exhibits.
(d) Exhibits.
| Exhibit No. | Description of Exhibit | |
| 99.1 | Earnings Press Release dated April 30, 2024. | |
| 99.2 | Earnings Call Presentation, dated April 30, 2024. | |
| 99.3 | Investor Presentation, dated April 30, 2024. | |
| 104 | The cover page from this Current Report on Form 8-K, formatted in Inline XBRL. | |
SIGNATURES
Pursuant to the requirements of the Exchange Act, the Registrant has duly caused this report to be signed on its behalf by the undersigned hereunto duly authorized.
| MIMEDX GROUP, INC. | ||||||
| Date: April 30, 2024 | By: | /s/ Doug Rice |
||||
| Doug Rice Chief Financial Officer |
||||||
Exhibit 99.1
MIMEDX Announces First Quarter 2024 Operating and Financial
Results
Net Sales of $85 Million Grew 18% Year-Over-Year for the First Quarter
First Quarter GAAP Net Income was $9 Million
First Quarter Adjusted EBITDA of $19 Million, or 22% of Net Sales
Management to Host Conference Call Today, April 30, 2024, at 4:30 PM ET
MARIETTA, Ga., April 30, 2024 — MiMedx Group, Inc. (Nasdaq: MDXG) (“MIMEDX” or the “Company”), today announced operating and financial results for the first quarter 2024.
Recent Operating and Financial Highlights:
| • | First quarter 2024 net sales of $85 million, reflecting 18% growth over the prior year period. |
| • | GAAP net income from continuing operations and net margin for the first quarter 2024 of $9 million and 11%, respectively. |
| • | Adjusted EBITDA and Adjusted EBITDA margin for the first quarter 2024 of $19 million and 22%, respectively. |
| • | Improved capital structure with new senior secured credit facilities and debt refinancing. |
| • | Announced portfolio expansion through a distribution agreement with Regenity Biosciences for a 510(k)-cleared collagen particulate xenograft product we plan to launch later this year. |
| • | Appointed two new independent directors to the Company’s Board of Directors. |
| • | Introduced MIMEDX Connect, an online product ordering and account management platform for our customers. |
Joseph H. Capper, MIMEDX Chief Executive Officer, commented, “Our first quarter 2024 results represent another stellar period for MIMEDX, with significant accomplishments across the organization that underscore our success executing on our major strategic priorities. Net sales growth was robust once again, achieving an 18% increase year-over-year. In addition, we expanded our portfolio in the first quarter to include a xenograft product that we see as a strategic fit and plan to launch later this year. Finally, we continued to apply disciplined expense management in the first quarter, resulting in an Adjusted EBITDA margin of 22%.”
Mr. Capper continued, “We believe the clinical strength of our product portfolio, effectiveness of our commercial organization, solid financial foundation, and the pending launch of our xenograft product into the Surgical market position MIMEDX well for another successful year and long-term growth.”
| Three Months Ended March 31, | ||||||||
| 2024 | 2023 | |||||||
| Net Income (loss) |
$ | 9,261 | $ | (4,983 | ) | |||
| Non-GAAP Adjustments: |
||||||||
| Depreciation expense |
558 | 714 | ||||||
| Amortization of intangible assets |
189 | 190 | ||||||
| Interest expense, net |
1,690 | 1,553 | ||||||
| Income tax provision (benefit) expense |
2,348 | 51 | ||||||
| Share-based compensation |
4,340 | 4,345 | ||||||
| Investigation, restatement and related expenses |
311 | 3,673 | ||||||
| Strategic and other expenses |
168 | — | ||||||
| Expenses related to disbanding of Regenerative Medicine business unit |
(200 | ) | — | |||||
|
|
|
|
|
|||||
| Adjusted EBITDA |
$ | 18,665 | $ | 5,543 | ||||
|
|
|
|
|
|||||
| Adjusted EBITDA margin |
22.0 | % | 7.7 | % | ||||
First Quarter 2024 Results Discussion1
Net Sales
MIMEDX reported net sales for the three months ended March 31, 2024, of $85 million, compared to $72 million for the three months ended March 31, 2023, an increase of 18%. Net sales growth came from solid contributions in both the Wound & Surgical end markets and across each of our main sites of service.
| 1 | The following discussion of the Company’s first quarter 2024 results are made on a “continuing operations basis” and exclude the historical costs of the Regenerative Medicine business unit, which was disbanded beginning in June 2023. For a full discussion of the impact of these discontinued operations, please refer to our Annual Report on Form 10-K filed with the Securities and Exchange Commission for the year ended December 31, 2023. |
Gross Profit and Margin
Gross profit for the three months ended March 31, 2024, was $72 million, an increase of $12 million as compared to the prior year period. Gross margin for the three months ended March 31, 2024 was 84.7%, compared to 82.7% in the prior year period. The year-over-year improvement in gross margin was driven by favorable product mix and our continued execution on yield improvement projects.
Operating Expenses
Selling, general and administrative (“SG&A”) expenses for the three months ended March 31, 2024, were $55 million compared to $52 million for the three months ended March 31, 2023. SG&A expense during the first quarter 2024 included increased sales commissions due to higher sales volumes.
Research and development expenses were $3 million for each of the three months ended March 31, 2024 and March 31, 2023.
Investigation, restatement and related expense was immaterial for the three months ended March 31, 2024 compared to $4 million for the three months ended March 31, 2023. The decrease was related to negotiated reductions in legal fees previously incurred. In addition, following the end of a legal proceeding, expenses under our last material proceeding involving indemnification of former officers and directors substantially ceased in 2023.
Net income from continuing operations for the three months ended March 31, 2024 was $9 million compared to a net loss from continuing operations of $2 million for the three months ended March 31, 2023.
Cash and Cash Equivalents
As of March 31, 2024, the Company had $48 million of cash and cash equivalents compared to $82 million as of December 31, 2023. The decrease during the period ended March 31, 2024 was primarily a result of our repaying the $30 million outstanding balance on our revolving credit facility during the first quarter, as well as the $5 million cash payment associated with our agreement with TELA Bio, Inc., paving the way for our exclusive manufacturing and supply agreement with Regenity Biosciences.
Conference Call and Webcast
MIMEDX will host a conference call and webcast to review its first quarter 2024 results on Tuesday, April 30, 2024, beginning at 4:30 p.m., Eastern Time. The call can be accessed using the following information:
Webcast: Click here
U.S. Investors: 877-407-6184
International Investors: 201-389-0877
Conference ID: 13745475
A replay of the webcast will be available for approximately 30 days on the Company’s website at www.mimedx.com following the conclusion of the event.
Important Cautionary Statement
This press release includes forward-looking statements. Statements regarding: (i) future sales or sales growth; (ii) our 2024 financial goals and expectations for future financial results, including levels of net sales, Adjusted EBITDA, and Adjusted EBITDA margin; (iii) our cash flows; (iv)our expectations regarding the use of our products, including EPIEFFECT and AMNIOEFFECT; (v) our expectations regarding the launch of our collagen particulate xenograft product; and (v) continued growth in different care settings. Additional forward-looking statements may be identified by words such as “believe,” “expect,” “may,” “plan,” “goal,” “outlook,” “potential,” “will,” “preliminary,” and similar expressions, and are based on management’s current beliefs and expectations.
Forward-looking statements are subject to risks and uncertainties, and the Company cautions investors against placing undue reliance on such statements. Actual results may differ materially from those set forth in the forward-looking statements. Factors that could cause actual results to differ from expectations include: (i) future sales are uncertain and are affected by competition, access to customers, patient access to healthcare providers, the reimbursement environment and many other factors; (ii) the Company may change its plans due to unforeseen circumstances; (iii) the results of scientific research are uncertain and may have little or no value; (iv) our ability to sell our products in other countries depends on a number of factors including adequate levels of reimbursement, market acceptance of novel therapies, and our ability to build and manage a direct sales force or third party distribution relationship; (v) the effectiveness of amniotic tissue as a therapy for particular indications or conditions is the subject of further scientific and clinical studies; and (vi) we may alter the timing and amount of planned expenditures for research and development based on regulatory developments. The Company describes additional risks and uncertainties in the Risk Factors section of its most recent annual report and quarterly reports filed with the Securities and Exchange Commission. Any forward-looking statements speak only as of the date of this press release and the Company assumes no obligation to update any forward-looking statement.
About MIMEDX
MIMEDX is a pioneer and leader focused on helping humans heal. With more than a decade of helping clinicians manage chronic and other hard-to-heal wounds, MIMEDX is dedicated to providing a leading portfolio of products for applications in the wound care, burn, and surgical sectors of healthcare. The Company’s vision is to be the leading global provider of healing solutions through relentless innovation to restore quality of life. For additional information, please visit www.mimedx.com.
Contact:
Matt Notarianni
Investor Relations
470.304.7291
mnotarianni@mimedx.com
Selected Unaudited Financial Information
MiMedx Group, Inc.
Condensed Consolidated Balance Sheets
(in thousands) Unaudited
| March 31, 2024 | December 31, 2023 | |||||||
| ASSETS |
||||||||
| Current assets: |
||||||||
| Cash and cash equivalents |
$ | 48,487 | $ | 82,000 | ||||
| Accounts receivable, net |
57,016 | 53,871 | ||||||
| Inventory |
24,454 | 21,021 | ||||||
| Prepaid expenses |
6,095 | 5,624 | ||||||
| Other current assets |
2,801 | 1,745 | ||||||
|
|
|
|
|
|||||
| Total current assets |
138,853 | 164,261 | ||||||
| Property and equipment, net |
7,340 | 6,974 | ||||||
| Right of use asset |
3,499 | 2,132 | ||||||
| Deferred tax asset, net |
38,747 | 40,777 | ||||||
| Goodwill |
19,441 | 19,441 | ||||||
| Intangible assets, net |
12,550 | 5,257 | ||||||
| Other assets |
1,251 | 205 | ||||||
|
|
|
|
|
|||||
| Total assets |
$ | 221,681 | $ | 239,047 | ||||
|
|
|
|
|
|||||
| LIABILITIES AND STOCKHOLDERS’ EQUITY |
||||||||
| Current liabilities: |
||||||||
| Current portion of long term debt |
$ | 1,000 | $ | 1,000 | ||||
| Accounts payable |
9,697 | 9,048 | ||||||
| Accrued compensation |
17,913 | 22,353 | ||||||
| Accrued expenses |
9,196 | 9,361 | ||||||
| Current liabilities of discontinued operations |
344 | 1,352 | ||||||
| Other current liabilities |
4,071 | 2,894 | ||||||
|
|
|
|
|
|||||
| Total current liabilities |
42,221 | 46,008 | ||||||
| Long term debt, net |
18,453 | 48,099 | ||||||
| Other liabilities |
5,276 | 2,223 | ||||||
|
|
|
|
|
|||||
| Total liabilities |
65,950 | 96,330 | ||||||
| Total stockholders’ equity |
155,731 | 142,717 | ||||||
|
|
|
|
|
|||||
| Total liabilities and stockholders’ equity |
$ | 221,681 | $ | 239,047 | ||||
|
|
|
|
|
|||||
MiMedx Group, Inc.
Condensed Consolidated Statements of Operations
(in thousands, except share and per share amounts) Unaudited
| Three Months Ended March 31, | ||||||||
| 2024 | 2023 | |||||||
| Net sales |
$ | 84,709 | $ | 71,676 | ||||
| Cost of sales |
12,987 | 12,419 | ||||||
|
|
|
|
|
|||||
| Gross profit |
71,722 | 59,257 | ||||||
| Operating expenses: |
||||||||
| Selling, general and administrative |
55,129 | 52,250 | ||||||
| Research and development |
2,841 | 3,484 | ||||||
| Investigation, restatement and related |
311 | 3,673 | ||||||
| Amortization of intangible assets |
189 | 190 | ||||||
| Impairment of intangible assets |
54 | — | ||||||
|
|
|
|
|
|||||
| Operating income (loss) |
13,198 | (340 | ) | |||||
| Other expense, net |
||||||||
| Interest expense, net |
(1,690 | ) | (1,553 | ) | ||||
| Other (expense) income, net |
(99 | ) | 2 | |||||
|
|
|
|
|
|||||
| Income (loss) from continuing operations before income tax |
11,409 | (1,891 | ) | |||||
| Income tax expense from continuing operations |
(2,348 | ) | (51 | ) | ||||
|
|
|
|
|
|||||
| Net income (loss) from continuing operations |
9,061 | (1,942 | ) | |||||
| Income (loss) from discontinued operations, net of tax |
200 | (3,041 | ) | |||||
|
|
|
|
|
|||||
| Net income (loss) |
$ | 9,261 | $ | (4,983 | ) | |||
|
|
|
|
|
|||||
| Net income (loss) from continuing operations available to common stockholders |
$ | 9,061 | $ | (3,626 | ) | |||
|
|
|
|
|
|||||
| Basic net income (loss) per common share: |
||||||||
| Continuing operations |
$ | 0.06 | $ | (0.03 | ) | |||
| Discontinued operations |
0.00 | (0.03 | ) | |||||
|
|
|
|
|
|||||
| Basic net income (loss) per common share |
$ | 0.06 | $ | (0.06 | ) | |||
|
|
|
|
|
|||||
| Diluted net income (loss) per common share: |
||||||||
| Continuing operations |
$ | 0.06 | $ | (0.03 | ) | |||
| Discontinued operations |
0.00 | (0.03 | ) | |||||
|
|
|
|
|
|||||
| Diluted net income (loss) per common share |
$ | 0.06 | $ | (0.06 | ) | |||
|
|
|
|
|
|||||
| Weighted average common shares outstanding - basic |
146,404,587 | 114,398,813 | ||||||
| Weighted average common shares outstanding - diluted |
150,028,107 | 114,398,813 | ||||||
MiMedx Group, Inc.
Condensed Consolidated Statements of Cash Flows
(in thousands) Unaudited
| Three Months Ended March 31, | ||||||||
| 2024 | 2023 | |||||||
| Net cash flows provided by (used in) operating activities |
5,978 | (4,048 | ) | |||||
| Net cash flows used in investing activities |
(6,024 | ) | (677 | ) | ||||
| Net cash flows used in financing activities |
(33,467 | ) | (4 | ) | ||||
|
|
|
|
|
|||||
| Net change in cash |
$ | (33,513 | ) | $ | (4,729 | ) | ||
Reconciliation of Non-GAAP Measures
In addition to our GAAP results, we provide certain non-GAAP metrics including Adjusted EBITDA, related margins, Free Cash Flow, Adjusted Net Income, and Adjusted Earnings Per Share (“Adjusted EPS”). We believe that the presentation of these measures provides important supplemental information to management and investors regarding our performance. These measurements are not a substitute for GAAP measurements. Company management uses these non-GAAP measurements as aids in monitoring our ongoing financial performance from quarter-to-quarter and year-to-year on a regular basis and for benchmarking against comparable companies.
These non-GAAP financial measures reflect the exclusion of the following items:
| • | Share-based compensation expense - expense recognized related to awards to various employees pursuant to our share-based compensation plans. This expense is reflected amongst cost of sales, research and development expense, and selling, general, and administrative expense in the unaudited condensed consolidated statements of operations. |
| • | Investigation, restatement, and related expense - expenses incurred toward the legal defense of the Company and advanced on behalf of certain former officers and directors, net of negotiated reductions and settlements of amounts previously advanced related to certain legal matters. This expense is reflected in the line of the same name in our unaudited condensed consolidated statements of operations. |
| • | Strategic and other expenses - reflects expenses incurred resulting from the consummation of material transactions or the integration of acquired assets or operations into our core business, impairment of intangibles, and certain regulatory expenses. With respect to the three months ended March 31, 2024, this relates to the acquisition and integration of exclusive distribution rights to a Collagen particulate xenograft product and regulatory and litigation expenses incurred relating to the FDA designation of one of our products. |
| • | Loss on extinguishment of debt - reflects the excess of cash paid to extinguish debt over the carrying value of the debt on our balance sheet upon the repayment and termination of a loan agreement. With respect to the three months ended March 31, 2024, this relates to the repayment and termination of the Hayfin Loan Agreement. Amounts in this line reflect (i) prepayment premium paid and (ii) write-offs of unamortized original issue discount and deferred financing costs. |
| • | Expenses related to the Disbanding of Regenerative Medicine - incremental expenses recognized or incurred directly as a result of our announcement to disband our Regenerative Medicine segment. This reflects (i) write-downs of clinical trial assets, (ii) charges associated with the wind-down of contracts associated with our clinical trial program, (iii) severance expenses incurred which were directly attributable to the disbanding, and (iv) impairment of goodwill. Severance expenses are reflected in research and development expense on the unaudited condensed consolidated statements of operations. All other charges are reflected in restructuring expense in the unaudited condensed consolidated statements of operations. |
| • | Income Tax Adjustment - for purposes of calculating Adjusted Net Income (Loss) and Adjusted Earnings Per Share, reflects our expectation of a long-term effective tax rate, which is normalized and balance sheet-agnostic. Actual reporting tax expense will be based on GAAP earnings, and may differ from the expected long-term effective tax rate due to a variety of factors, including the tax treatment of various transactions included in GAAP net income and other reconciling items that are excluded in determining Adjusted Net Income (Loss) and Adjusted EPS. The long-term normalized effective tax rate was 25% for each of the quarters ended March 31, 2024 and 2023. |
Adjusted EBITDA and Adjusted EBITDA margin
Adjusted EBITDA consists of GAAP net income (loss) excluding: (i) depreciation, (ii) amortization of intangibles, (iii) interest expense, net, (iv) income tax provision, (v) investigation, restatement and related expenses, (vi) reorganization expenses related to severance charges for certain officers and employees (vii) expenses related to disbanding of the Regenerative Medicine business unit and (viii) share-based compensation.
Please refer to the tables at the beginning of this press release for reconciliation to GAAP net income (loss).
Adjusted Net Income (Loss)
Adjusted Net Income (Loss) provides a view of our operating performance, exclusive of certain items which are non-recurring or not reflective of our core operations.
Adjusted Net Income is defined as GAAP net income (loss) plus (i) loss on extinguishment of debt (ii) investigation restatement and related expenses, (iii) expenses related to disbanding of our Regenerative Medicine business unit, (iv) strategic and other expenses, and (v) the long-term effective income tax rate adjustment.
A reconciliation of GAAP Net Income (Loss) to Adjusted Net Income appears in the table below (in thousands):
| Three Months Ended March 31, | ||||||||
| 2024 | 2023 | |||||||
| Net income (loss) |
$ | 9,261 | $ | (4,983 | ) | |||
| Loss on extinguishment of debt |
1,401 | — | ||||||
| Investigation, restatement and related expenses |
311 | 3,673 | ||||||
| Strategic and other expenses |
168 | — | ||||||
| Expenses related to disbanding of Regenerative Medicine business unit |
(200 | ) | — | |||||
| Long-term effective income tax rate adjustment |
(974 | ) | 366 | |||||
|
|
|
|
|
|||||
| Adjusted net income (loss) |
$ | 9,967 | $ | (944 | ) | |||
|
|
|
|
|
|||||
Adjusted Earnings Per Share
Adjusted Earnings Per Share is intended to provide a normalized view of earnings per share by removing items that may be irregular, one-time, or non-recurring from net income. This enables us to identify underlying trends in our business that could otherwise be masked by such items. Adjusted Earnings Per Share consists of GAAP diluted earnings per share including adjustments for: (i) effects of antidilution, (ii) investigation, restatement and related expenses, (iii) reorganization expenses related to severance charges for certain officers and employees and (iv) long-term adjusted effective income tax rate.
A reconciliation of GAAP diluted earnings per share to Adjusted Earnings Per Share appears in the table below (per diluted share):
| Three Months Ended March 31, | ||||||||
| 2024 | 2023 | |||||||
| GAAP net income (loss) per common share - diluted |
$ | 0.06 | $ | (0.06 | ) | |||
| Loss on extinguishment of debt |
0.01 | 0.00 | ||||||
| Investigation, restatement and related (benefit) expense |
0.00 | 0.03 | ||||||
| Strategic and other expenses |
0.00 | 0.00 | ||||||
| Expenses related to disbanding of Regenerative Medicine business unit |
0.00 | 0.00 | ||||||
| Long-term effective income tax rate adjustment |
0.00 | 0.00 | ||||||
|
|
|
|
|
|||||
| Adjusted Earnings Per Share |
$ | 0.07 | $ | (0.03 | ) | |||
|
|
|
|
|
|||||
| Weighted average common shares outstanding - adjusted |
150,028,107 | 114,398,813 | ||||||
Free Cash Flow
Free Cash Flow is intended to provide a measure of our ability to generate cash in excess of capital investments. It provides management with a view of cash flows which can be used to finance operational and strategic investments.
Free Cash Flow is defined as net cash provided by (used in) operating activities less capital expenditures, including purchases of equipment.
A reconciliation of GAAP net cash flows provided by (used in) operating activities to Free Cash Flow appears in the table below (in thousands):
| Three Months Ended March 31, | ||||||||
| 2024 | 2023 | |||||||
| Net cash flows provided by (used in) operating activities |
5,978 | (4,048 | ) | |||||
| Capital expenditures, including purchases of equipment |
(1,144 | ) | (633 | ) | ||||
|
|
|
|
|
|||||
| Free Cash Flow |
$ | 4,834 | $ | (4,681 | ) | |||
|
|
|
|
|
|||||
Exhibit 99.2 Q1 2024 Results Conference Call April 30, 2024
Disclaimer & Cautionary Statements This presentation includes forward-looking statements. Forward-looking statements are subject to risks and uncertainties, and the Company cautions investors against placing undue reliance on such statements. Actual results may differ materially from those set forth in the forward-looking statements. Such forward-looking statements include statements regarding: • Future sales or sales growth; • Estimates of potential market size and demand for the Company’s current and future products; • Plans for expansion outside of the U.S.; • The effectiveness of amniotic tissue as a therapy for any particular indication or condition; • Expected spending on research and development and litigation; • Expectations regarding the reimbursement environment for the Company’s products; • The Company’s long-term strategy and goals for value creation, the status of its pipeline products, expectations for future products, and expectations for future growth and profitability 2

Disclaimer & Cautionary Statements Additional forward-looking statements may be identified by words such as believe, expect, may, plan, potential, will, preliminary, and similar expressions, and are based on management's current beliefs and expectations. Forward-looking statements are subject to risks and uncertainties, and the Company cautions investors against placing undue reliance on such statements. Actual results may differ materially from those set forth in the forward-looking statements. Factors that could cause actual results to differ from expectations include: • Future sales are uncertain and are affected by competition, access to customers, patient access to hospitals and healthcare providers, the reimbursement environment and many other factors; • The future market for the Company’s products can depend on regulatory approval of such products, which might not occur at all or when expected, and is based in part on assumptions regarding the number of patients who elect less acute and more acute treatment than the Company’s products, market acceptance of the Company’s products, and adequate reimbursement for such therapies; • The process of obtaining regulatory clearances or approvals to market a biological product or medical device from the FDA or similar regulatory authorities outside of the U.S. is costly and time consuming, and such clearances or approvals may not be granted on a timely basis, or at all, and the ability to obtain the rights to market additional, suitable products depends on negotiations with third parties which may not be forthcoming; and • The Company describes additional risks and uncertainties in the Risk Factors section of its most recent annual report and quarterly reports filed with the Securities and Exchange Commission. Any forward-looking statements speak only as of the date of this presentation and the Company assumes no obligation to update any forward- looking statement. 3

Joe Capper Chief Executive Officer helping humans heal.
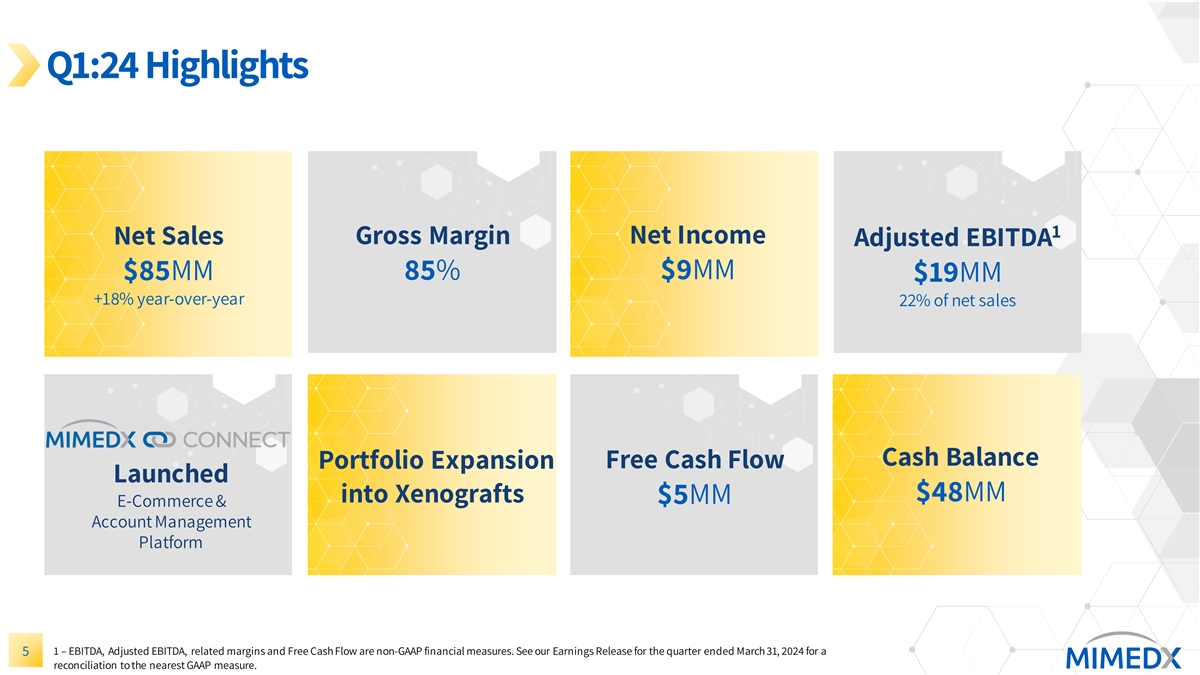
Q1:24 Highlights 1 Gross Margin Net Income Net Sales Adjusted EBITDA $85MM 85% $9MM $19MM +18% year-over-year 22% of net sales Cash Balance Portfolio Expansion Free Cash Flow Launched $48MM into Xenografts $5MM E-Commerce & Account Management Platform 1 – EBITDA, Adjusted EBITDA, related margins and Free Cash Flow are non-GAAP financial measures. See our Earnings Release for the quarter ended March 31, 2024 for a 5 reconciliation to the nearest GAAP measure.
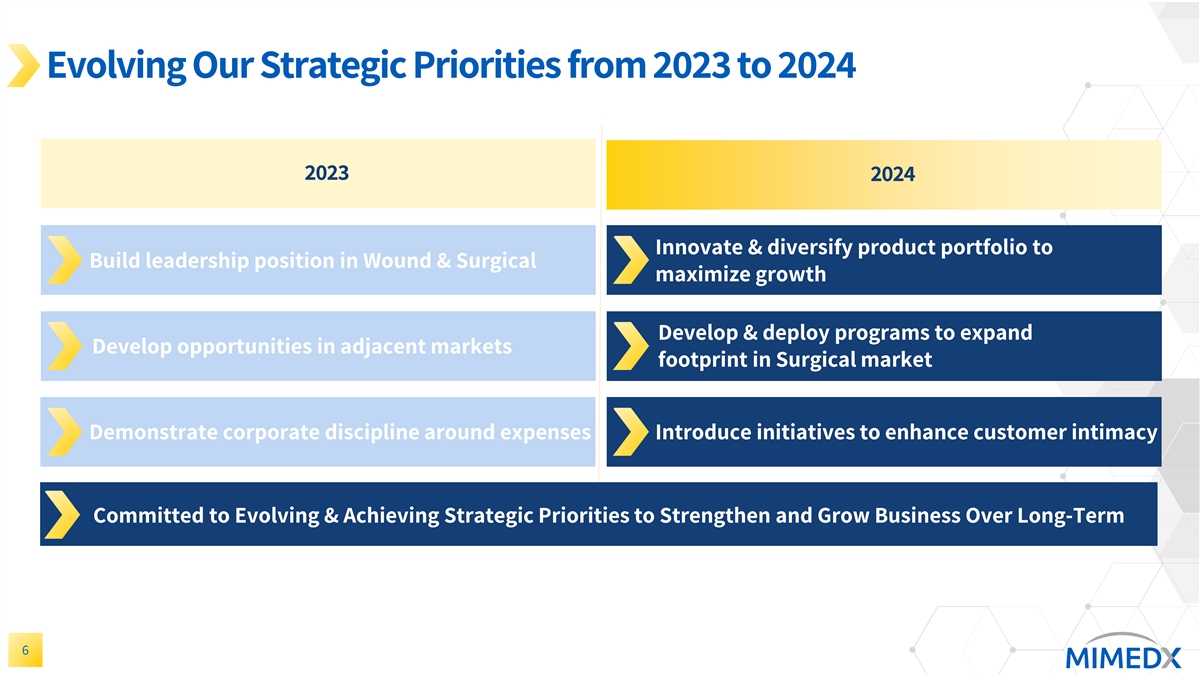
Evolving Our Strategic Priorities from 2023 to 2024 2023 2024 Innovate & diversify product portfolio to Build leadership position in Wound & Surgical maximize growth Develop & deploy programs to expand Develop opportunities in adjacent markets footprint in Surgical market Demonstrate corporate discipline around expenses Introduce initiatives to enhance customer intimacy Committed to Evolving & Achieving Strategic Priorities to Strengthen and Grow Business Over Long-Term 6
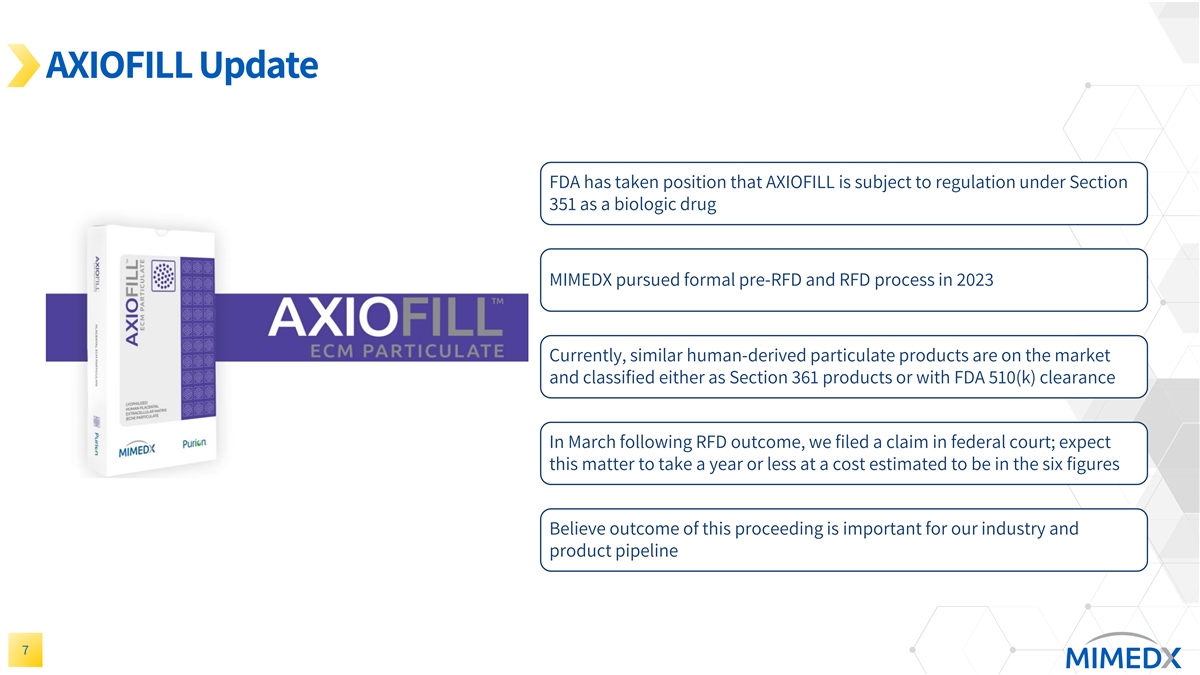
AXIOFILL Update FDA has taken position that AXIOFILL is subject to regulation under Section 351 as a biologic drug MIMEDX pursued formal pre-RFD and RFD process in 2023 Currently, similar human-derived particulate products are on the market and classified either as Section 361 products or with FDA 510(k) clearance In March following RFD outcome, we filed a claim in federal court; expect this matter to take a year or less at a cost estimated to be in the six figures Believe outcome of this proceeding is important for our industry and product pipeline 7
Doug Rice Chief Financial Officer helping humans heal.
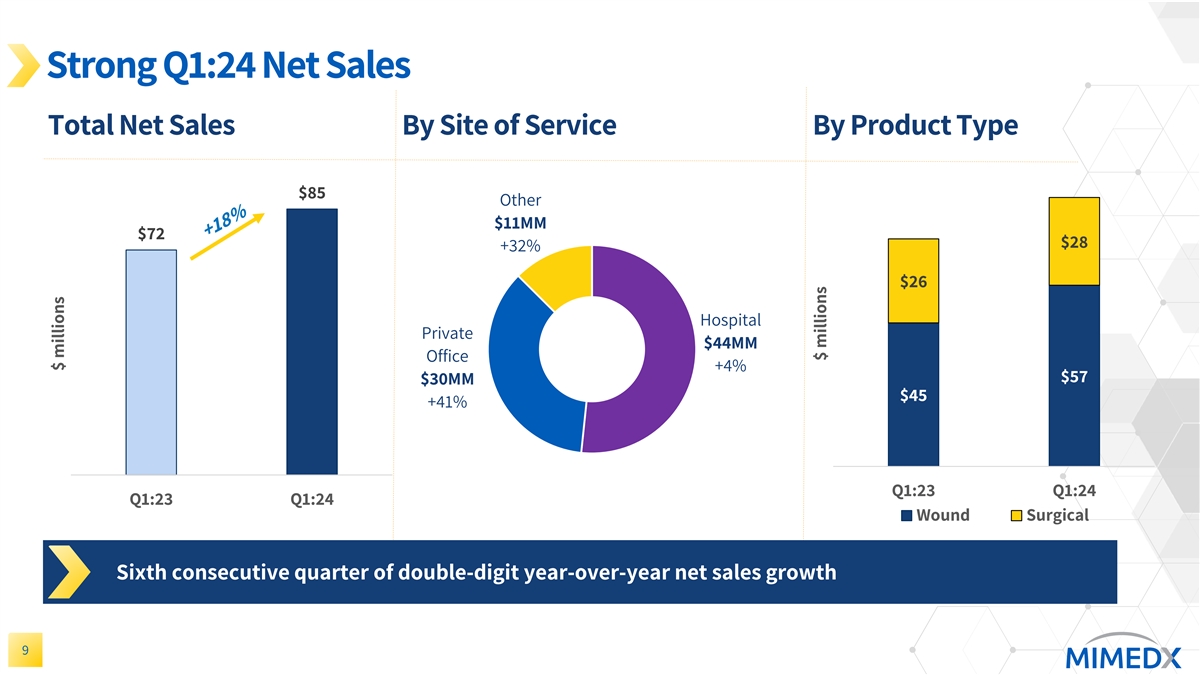
Strong Q1:24 Net Sales Total Net Sales By Site of Service By Product Type $85 Other $11MM $72 $28 +32% $26 Hospital Private $44MM Office +4% $57 $30MM $45 +41% Q1:23 Q1:24 Q1:23 Q1:24 Wound Surgical Sixth consecutive quarter of double-digit year-over-year net sales growth 9 $ millions $ millions
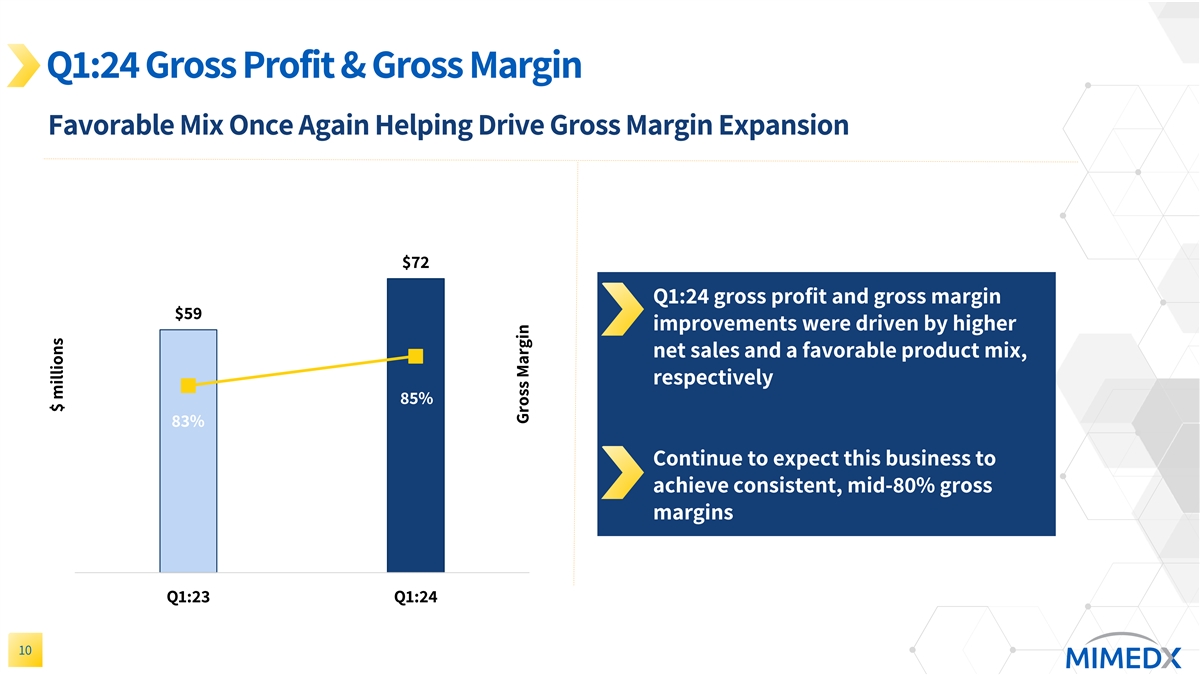
Q1:24 Gross Profit & Gross Margin Favorable Mix Once Again Helping Drive Gross Margin Expansion 80 $72 Q1:24 gross profit and gross margin $59 improvements were driven by higher net sales and a favorable product mix, respectively 85% 83% Continue to expect this business to achieve consistent, mid-80% gross margins 0 Q1:23 Q1:24 10 $ millions Gross Margin
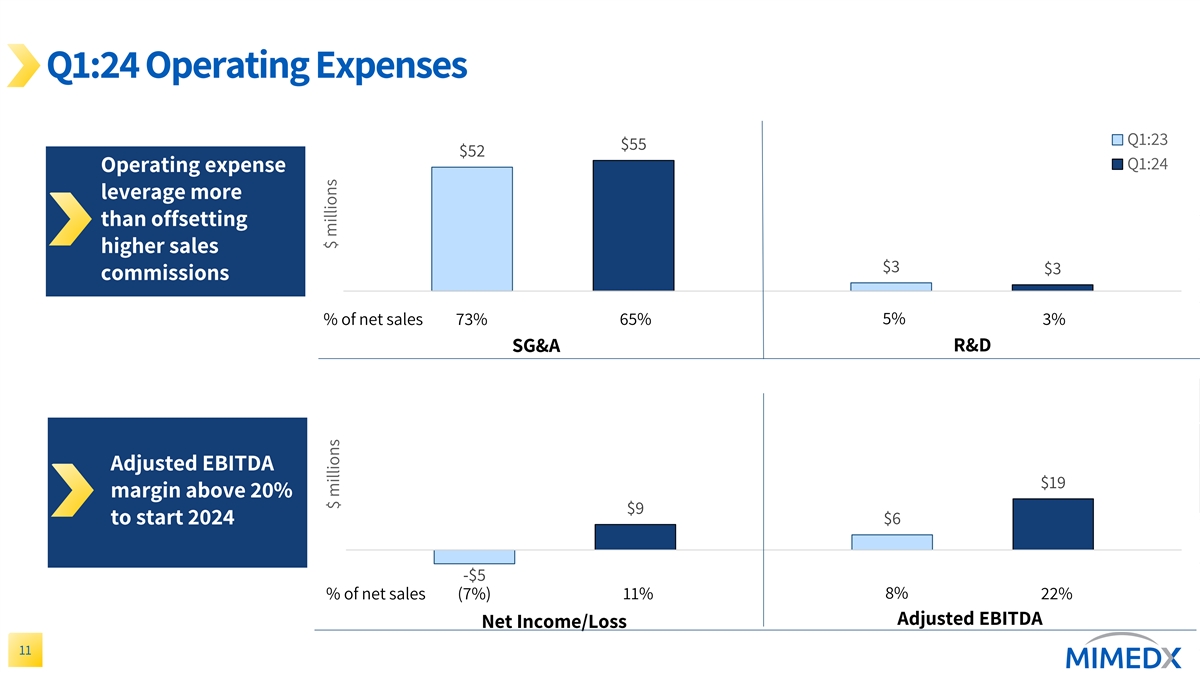
Q1:24 Operating Expenses Q1:23 $55 $52 Q1:24 Operating expense leverage more than offsetting higher sales $3 $3 commissions % of net sales 73% 65% 5% 3% R&D SG&A Adjusted EBITDA $19 margin above 20% $9 $6 to start 2024 -$5 8% % of net sales (7%) 11% 22% Adjusted EBITDA Net Income/Loss 11 $ millions $ millions
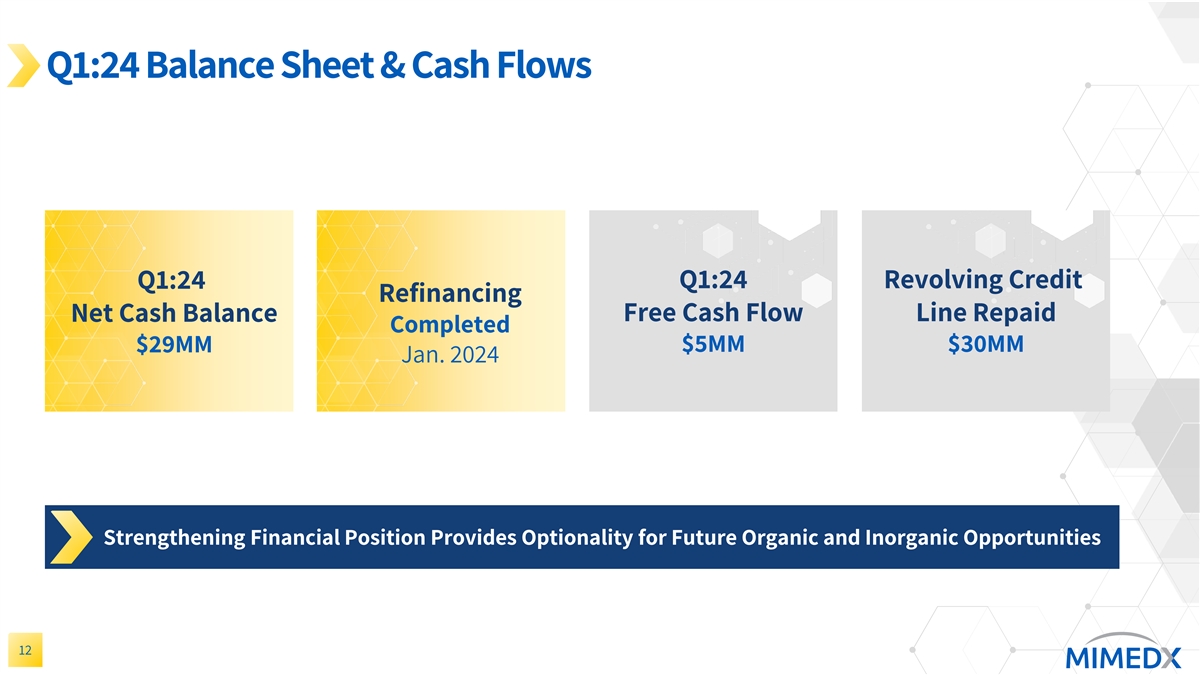
Q1:24 Balance Sheet & Cash Flows Q1:24 Q1:24 Revolving Credit Refinancing Free Cash Flow Line Repaid Net Cash Balance Completed $29MM $5MM $30MM Jan. 2024 Strengthening Financial Position Provides Optionality for Future Organic and Inorganic Opportunities 12
Joe Capper Chief Executive Officer helping humans heal.
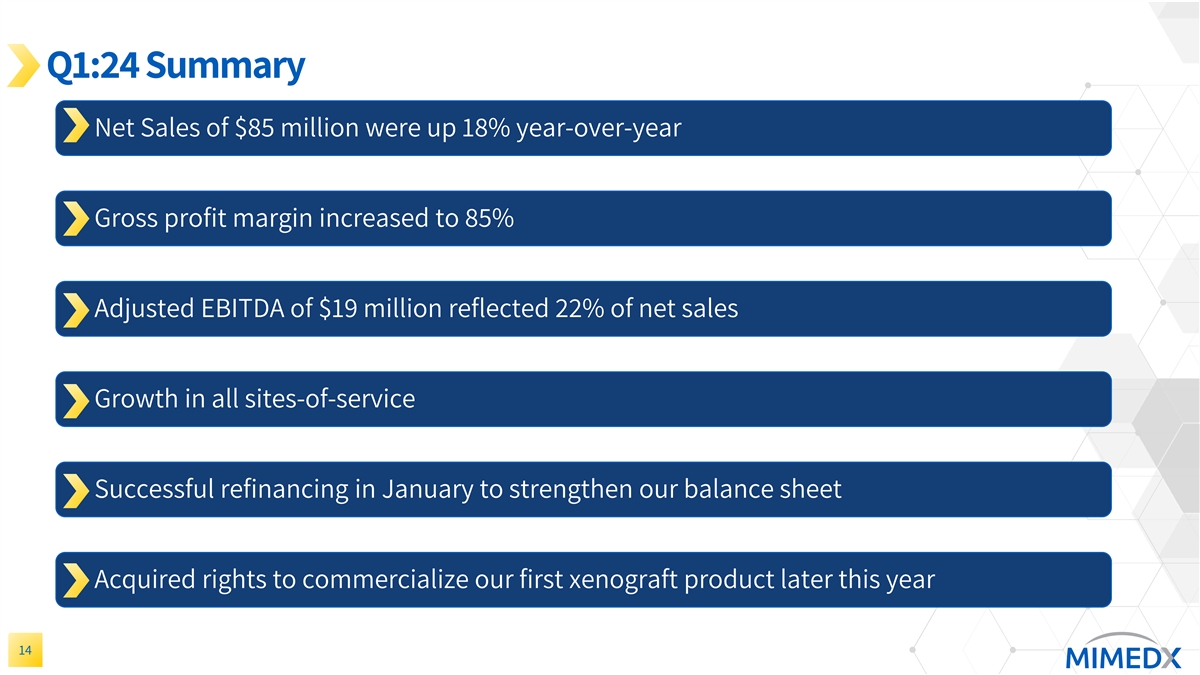
Q1:24 Summary Net Sales of $85 million were up 18% year-over-year Gross profit margin increased to 85% Adjusted EBITDA of $19 million reflected 22% of net sales Growth in all sites-of-service Successful refinancing in January to strengthen our balance sheet Acquired rights to commercialize our first xenograft product later this year 14
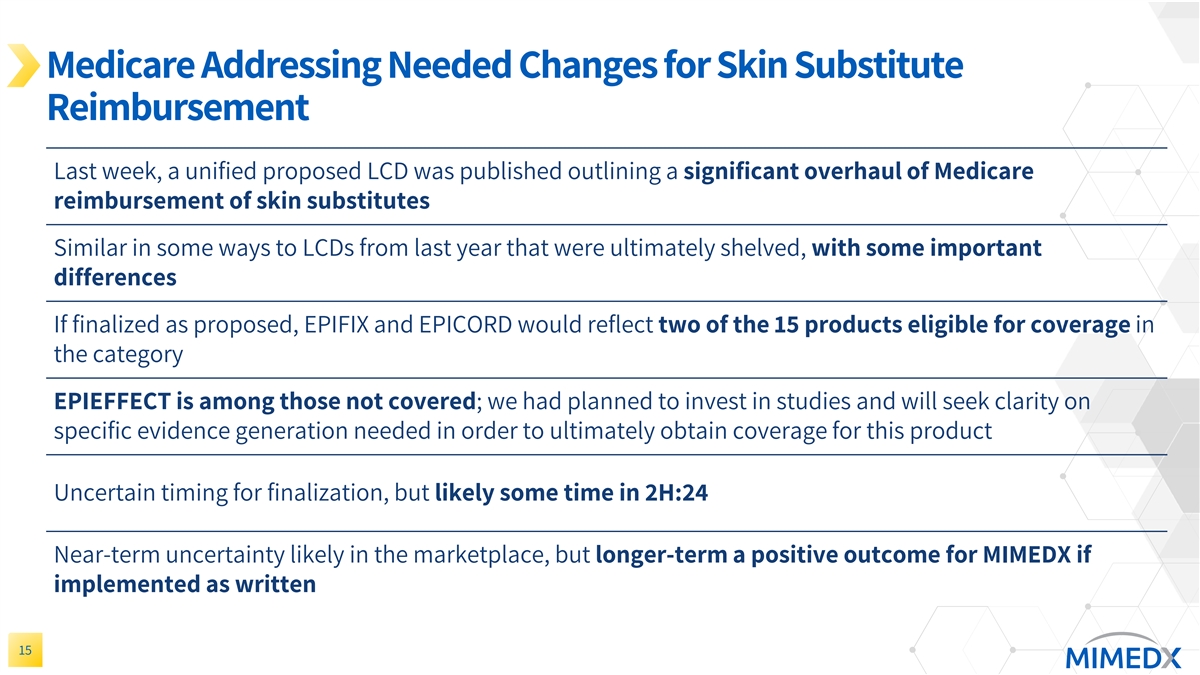
Medicare Addressing Needed Changes for Skin Substitute Reimbursement Last week, a unified proposed LCD was published outlining a significant overhaul of Medicare reimbursement of skin substitutes Similar in some ways to LCDs from last year that were ultimately shelved, with some important differences If finalized as proposed, EPIFIX and EPICORD would reflect two of the 15 products eligible for coverage in the category EPIEFFECT is among those not covered; we had planned to invest in studies and will seek clarity on specific evidence generation needed in order to ultimately obtain coverage for this product Uncertain timing for finalization, but likely some time in 2H:24 Near-term uncertainty likely in the marketplace, but longer-term a positive outcome for MIMEDX if implemented as written 15
Closing Remarks, Q&A

Exhibit 99.3 Investor Presentation May 2024 helping humans heal.

Disclaimer & Cautionary Statements This presentation includes forward-looking statements. Forward-looking statements are subject to risks and uncertainties, and the Company cautions investors against placing undue reliance on such statements. Actual results may differ materially from those set forth in the forward-looking statements. Such forward-looking statements include statements regarding: • Future sales or sales growth; • Estimates of potential market size and demand for the Company’s current and future products; • Plans for expansion outside of the U.S.; • The effectiveness of amniotic tissue as a therapy for any particular indication or condition; • Expected spending on research and development and litigation; • Expectations regarding the reimbursement environment for the Company’s products; • The Company’s long-term strategy and goals for value creation, the status of its pipeline products, expectations for future products, and expectations for future growth and profitability 2
Disclaimer & Cautionary Statements Additional forward-looking statements may be identified by words such as believe, expect, may, plan, potential, will, preliminary, and similar expressions, and are based on management's current beliefs and expectations. Forward-looking statements are subject to risks and uncertainties, and the Company cautions investors against placing undue reliance on such statements. Actual results may differ materially from those set forth in the forward-looking statements. Factors that could cause actual results to differ from expectations include: • Future sales are uncertain and are affected by competition, access to customers, patient access to hospitals and healthcare providers, the reimbursement environment and many other factors; • The future market for the Company’s products can depend on regulatory approval of such products, which might not occur at all or when expected, and is based in part on assumptions regarding the number of patients who elect less acute and more acute treatment than the Company’s products, market acceptance of the Company’s products, and adequate reimbursement for such therapies; • The process of obtaining regulatory clearances or approvals to market a biological product or medical device from the FDA or similar regulatory authorities outside of the U.S. is costly and time consuming, and such clearances or approvals may not be granted on a timely basis, or at all, and the ability to obtain the rights to market additional, suitable products depends on negotiations with third parties which may not be forthcoming; and • The Company describes additional risks and uncertainties in the Risk Factors section of its most recent annual report and quarterly reports filed with the Securities and Exchange Commission. Any forward-looking statements speak only as of the date of this presentation and the Company assumes no obligation to update any forward- looking statement. 3
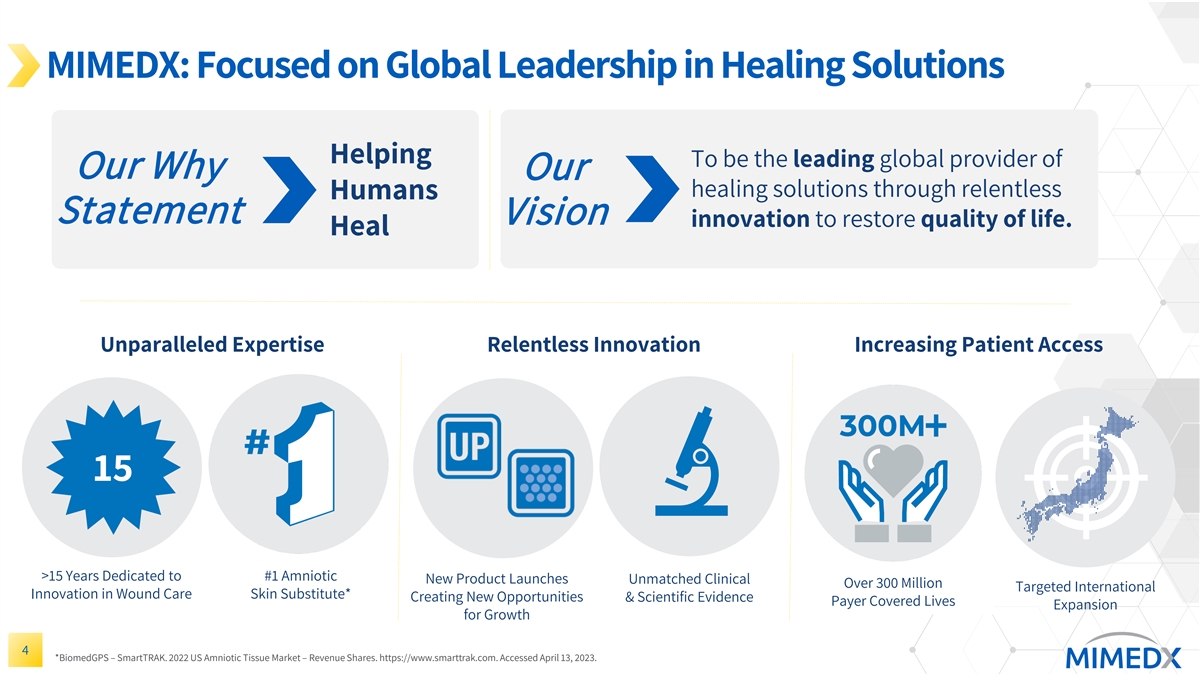
MIMEDX: Focused on Global Leadership in Healing Solutions Helping To be the leading global provider of Our Why Our healing solutions through relentless Humans Statement Vision innovation to restore quality of life. Heal Unparalleled Expertise Relentless Innovation Increasing Patient Access 15 >15 Years Dedicated to #1 Amniotic New Product Launches Unmatched Clinical Over 300 Million Targeted International Innovation in Wound Care Skin Substitute* Creating New Opportunities & Scientific Evidence Payer Covered Lives Expansion for Growth 4 *BiomedGPS – SmartTRAK. 2022 US Amniotic Tissue Market – Revenue Shares. https://www.smarttrak.com. Accessed April 13, 2023.
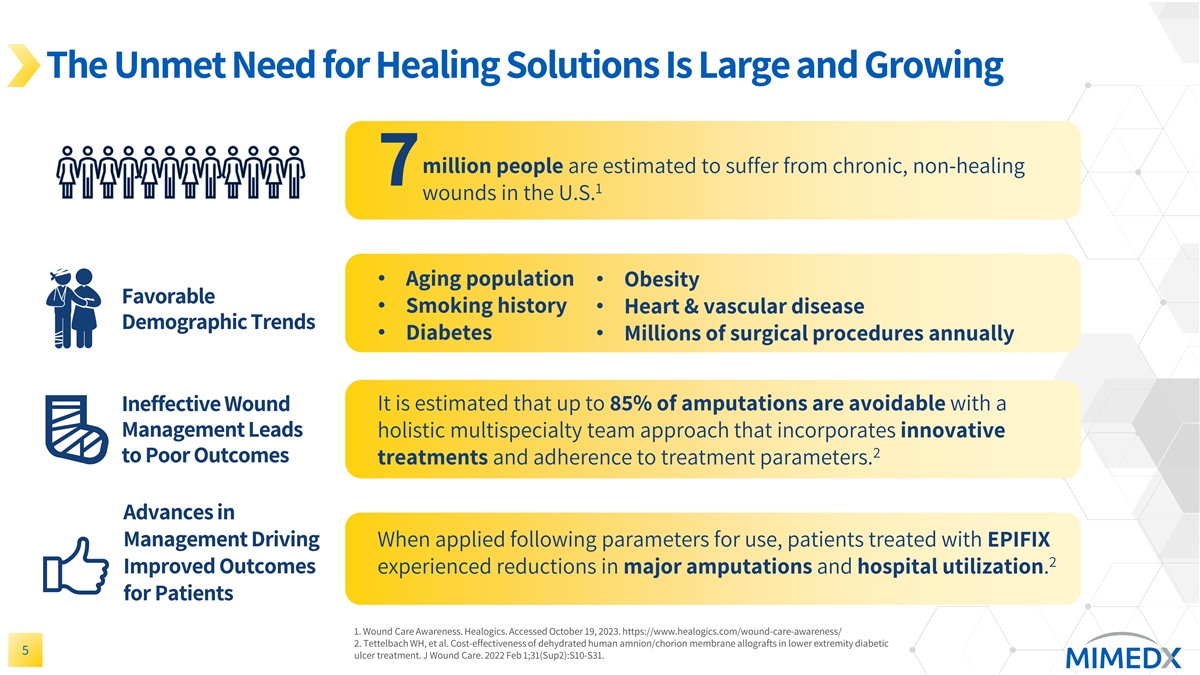
The Unmet Need for Healing Solutions Is Large and Growing million people are estimated to suffer from chronic, non-healing 7 1 wounds in the U.S. • Aging population • Obesity Favorable • Smoking history • Heart & vascular disease Demographic Trends • Diabetes • Millions of surgical procedures annually Ineffective Wound It is estimated that up to 85% of amputations are avoidable with a Management Leads holistic multispecialty team approach that incorporates innovative 2 to Poor Outcomes treatments and adherence to treatment parameters. Advances in Management Driving When applied following parameters for use, patients treated with EPIFIX 2 Improved Outcomes experienced reductions in major amputations and hospital utilization. for Patients 1. Wound Care Awareness. Healogics. Accessed October 19, 2023. https://www.healogics.com/wound-care-awareness/ 2. Tettelbach WH, et al. Cost-effectiveness of dehydrated human amnion/chorion membrane allografts in lower extremity diabetic 5 ulcer treatment. J Wound Care. 2022 Feb 1;31(Sup2):S10-S31.
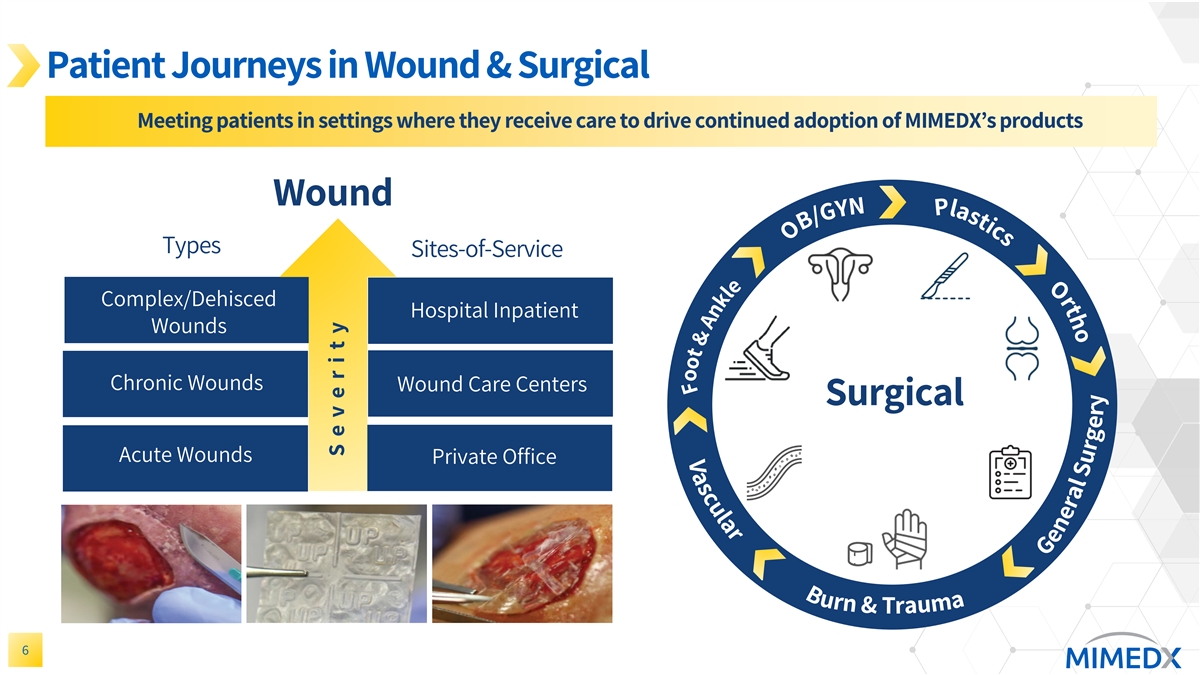
Patient Journeys in Wound & Surgical Meeting patients in settings where they receive care to drive continued adoption of MIMEDX’s products Wound Types Sites-of-Service Complex/Dehisced Hospital Inpatient Wounds Chronic Wounds Wound Care Centers Surgical Acute Wounds Private Office 6 S ever i t y
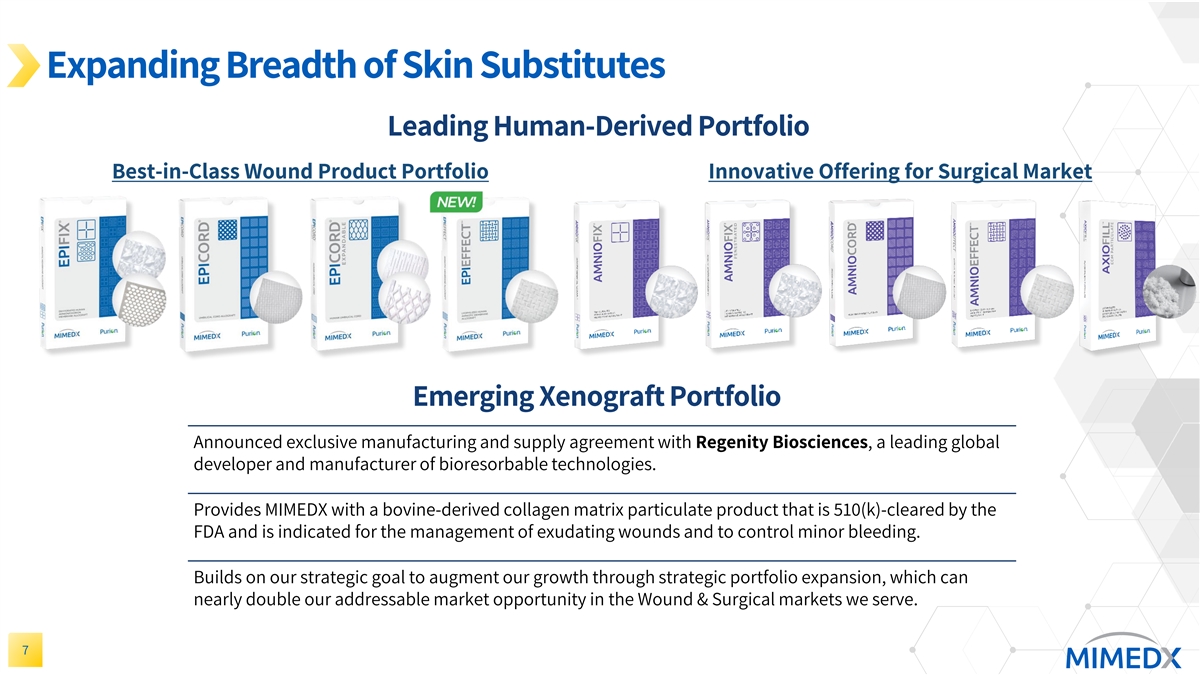
Expanding Breadth of Skin Substitutes Leading Human-Derived Portfolio Best-in-Class Wound Product Portfolio Innovative Offering for Surgical Market Emerging Xenograft Portfolio Announced exclusive manufacturing and supply agreement with Regenity Biosciences, a leading global developer and manufacturer of bioresorbable technologies. Provides MIMEDX with a bovine-derived collagen matrix particulate product that is 510(k)-cleared by the FDA and is indicated for the management of exudating wounds and to control minor bleeding. Builds on our strategic goal to augment our growth through strategic portfolio expansion, which can nearly double our addressable market opportunity in the Wound & Surgical markets we serve. 7
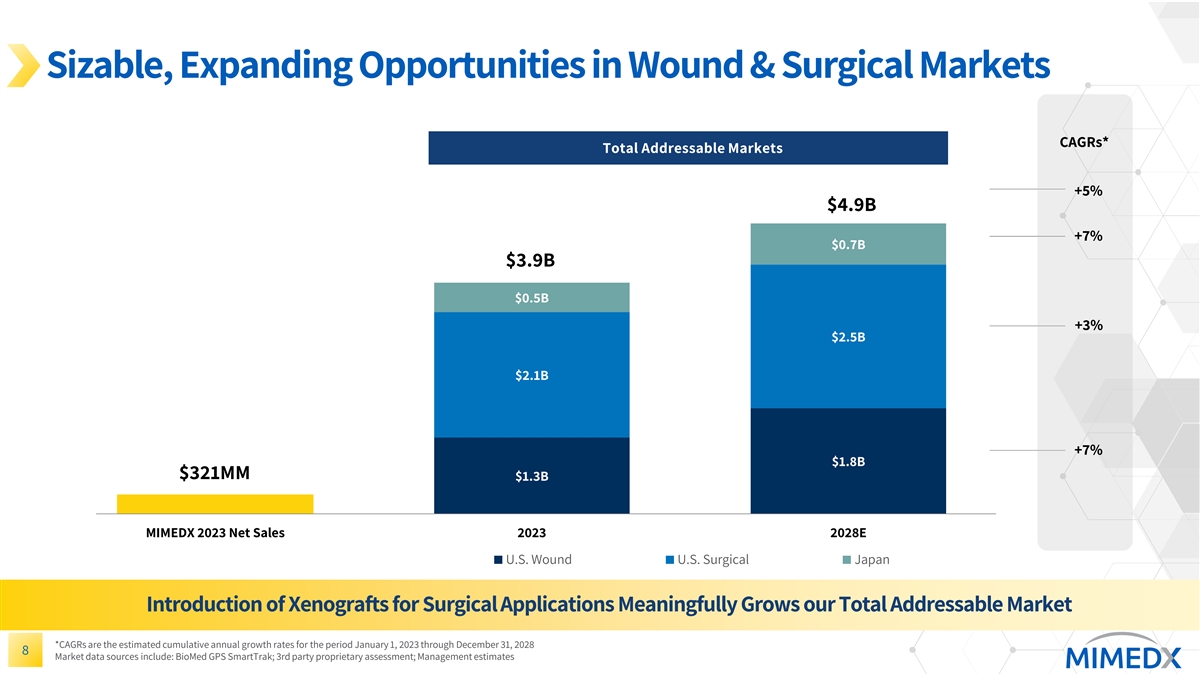
Sizable, Expanding Opportunities in Wound & Surgical Markets CAGRs* Total Addressable Markets +5% $4.9B +7% $0.7B $3.9B $0.5B +3% $2.5B $2.1B +7% $1.8B $321MM $1.3B MIMEDX 2023 Net Sales 2023 2028E U.S. Wound U.S. Surgical Japan Introduction of Xenografts for Surgical Applications Meaningfully Grows our Total Addressable Market *CAGRs are the estimated cumulative annual growth rates for the period January 1, 2023 through December 31, 2028 8 Market data sources include: BioMed GPS SmartTrak; 3rd party proprietary assessment; Management estimates
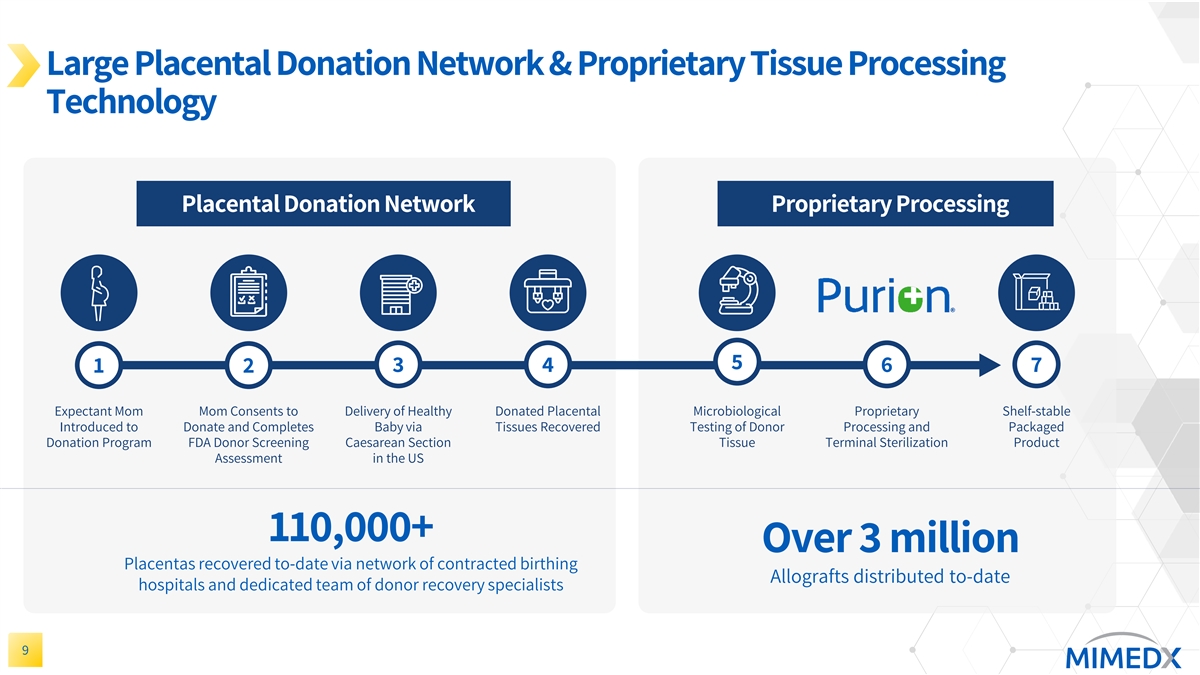
Large Placental Donation Network & Proprietary Tissue Processing Technology Placental Donation Network Proprietary Processing 5 1 2 3 4 6 7 Expectant Mom Mom Consents to Delivery of Healthy Donated Placental Microbiological Proprietary Shelf-stable Introduced to Donate and Completes Baby via Tissues Recovered Testing of Donor Processing and Packaged Donation Program FDA Donor Screening Caesarean Section Tissue Terminal Sterilization Product Assessment in the US 110,000+ Over 3 million Placentas recovered to-date via network of contracted birthing Allografts distributed to-date hospitals and dedicated team of donor recovery specialists 9
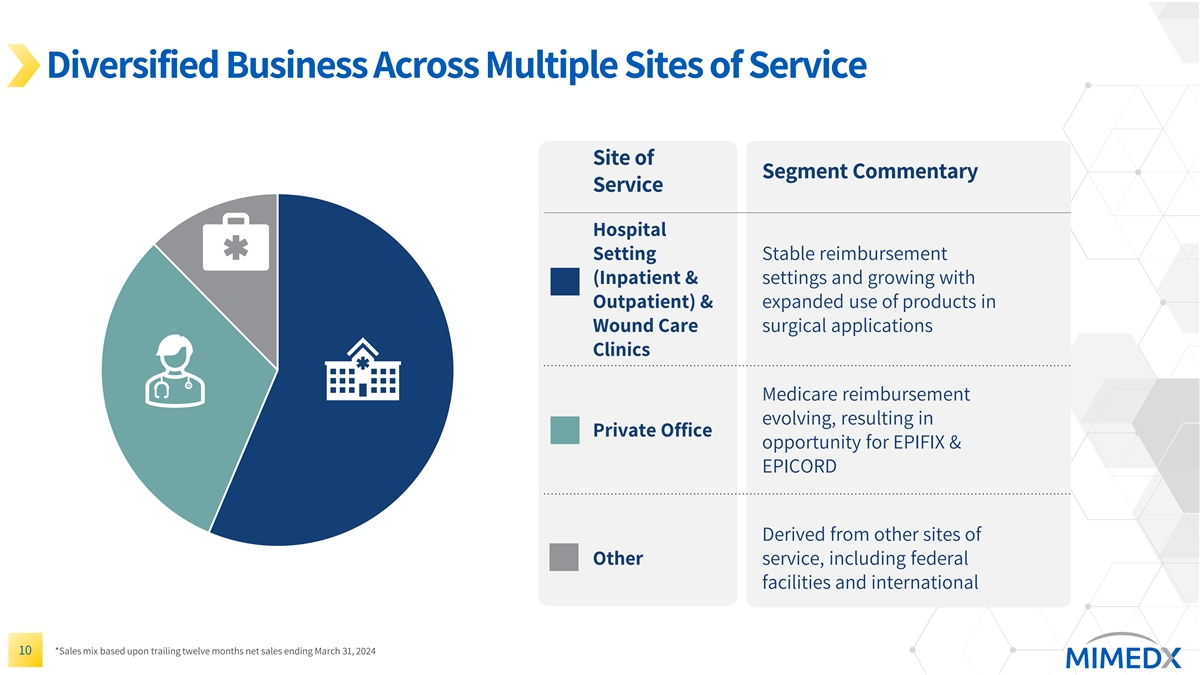
Diversified Business Across Multiple Sites of Service Site of Segment Commentary Service Hospital Setting Stable reimbursement (Inpatient & settings and growing with Outpatient) & expanded use of products in Wound Care surgical applications Clinics Medicare reimbursement evolving, resulting in Private Office opportunity for EPIFIX & EPICORD Derived from other sites of Other service, including federal facilities and international 10 *Sales mix based upon trailing twelve months net sales ending March 31, 2024
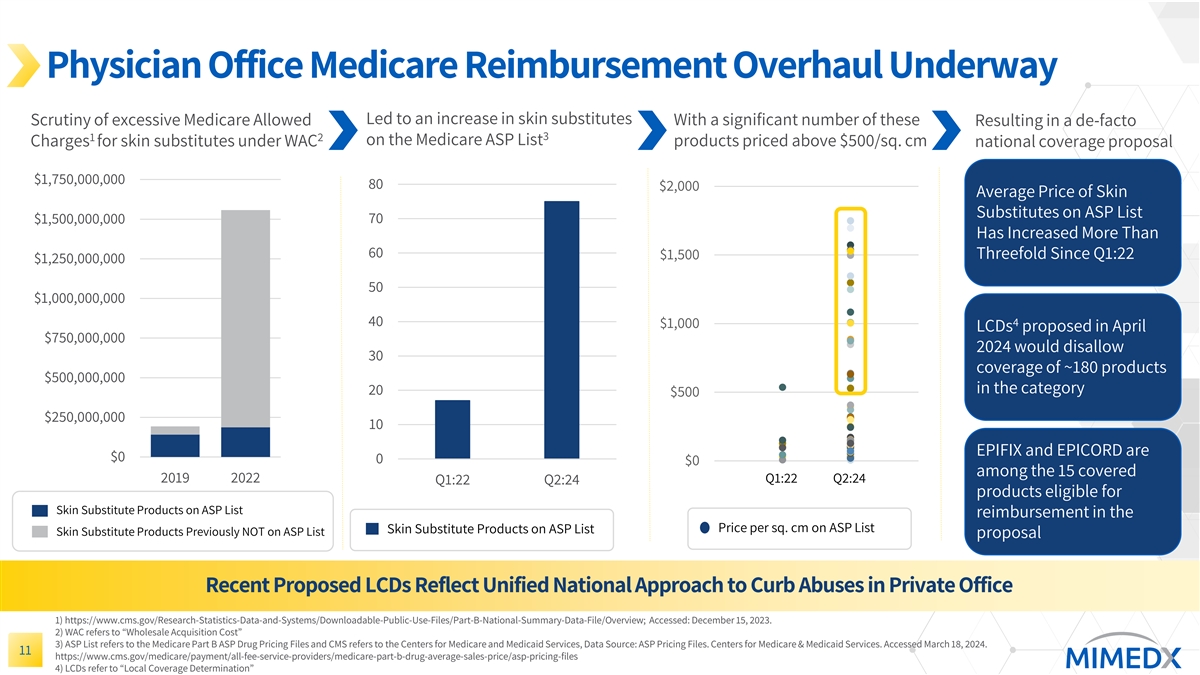
Physician Office Medicare Reimbursement Overhaul Underway Led to an increase in skin substitutes With a significant number of these Scrutiny of excessive Medicare Allowed Resulting in a de-facto 3 1 2 on the Medicare ASP List Charges for skin substitutes under WAC products priced above $500/sq. cm national coverage proposal $1,750,000,000 80 $2,000 Average Price of Skin Substitutes on ASP List $1,500,000,000 70 Has Increased More Than 60 Threefold Since Q1:22 $1,500 $1,250,000,000 50 $1,000,000,000 40 4 $1,000 LCDs proposed in April $750,000,000 2024 would disallow 30 coverage of ~180 products $500,000,000 in the category 20 $500 $250,000,000 10 EPIFIX and EPICORD are $0 0 $0 among the 15 covered 2019 2022 Q1:22 Q2:24 Q1:22 Q2:24 products eligible for Skin Substitute Products on ASP List reimbursement in the Price per sq. cm on ASP List Skin Substitute Products on ASP List Skin Substitute Products Previously NOT on ASP List proposal Recent Proposed LCDs Reflect Unified National Approach to Curb Abuses in Private Office 1) https://www.cms.gov/Research-Statistics-Data-and-Systems/Downloadable-Public-Use-Files/Part-B-National-Summary-Data-File/Overview; Accessed: December 15, 2023. 2) WAC refers to “Wholesale Acquisition Cost” 3) ASP List refers to the Medicare Part B ASP Drug Pricing Files and CMS refers to the Centers for Medicare and Medicaid Services, Data Source: ASP Pricing Files. Centers for Medicare & Medicaid Services. Accessed March 18, 2024. 11 https://www.cms.gov/medicare/payment/all-fee-service-providers/medicare-part-b-drug-average-sales-price/asp-pricing-files 4) LCDs refer to “Local Coverage Determination”
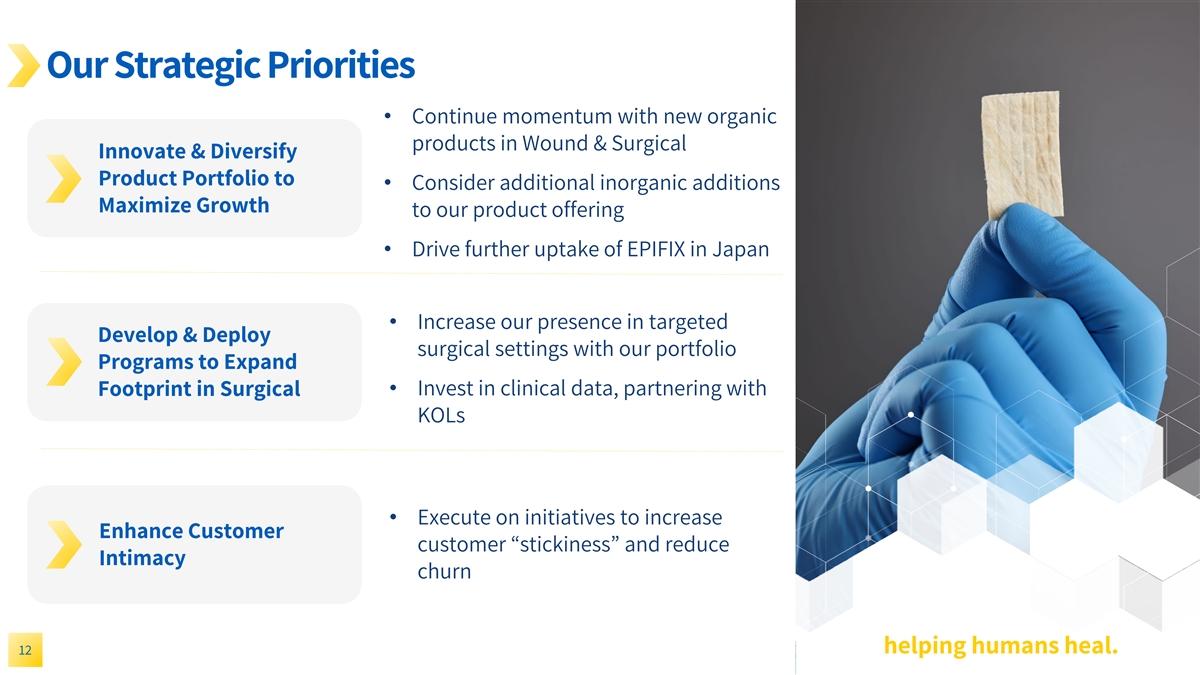
Our Strategic Priorities • Continue momentum with new organic products in Wound & Surgical Innovate & Diversify Build leadership position Product Portfolio to • Consider additional inorganic additions in Wound & Surgical Maximize Growth to our product offering • Drive further uptake of EPIFIX in Japan • Increase our presence in targeted Develop & Deploy surgical settings with our portfolio Programs to Expand • Invest in clinical data, partnering with Footprint in Surgical KOLs • Execute on initiatives to increase Enhance Customer customer “stickiness” and reduce Intimacy churn helping humans heal. 12
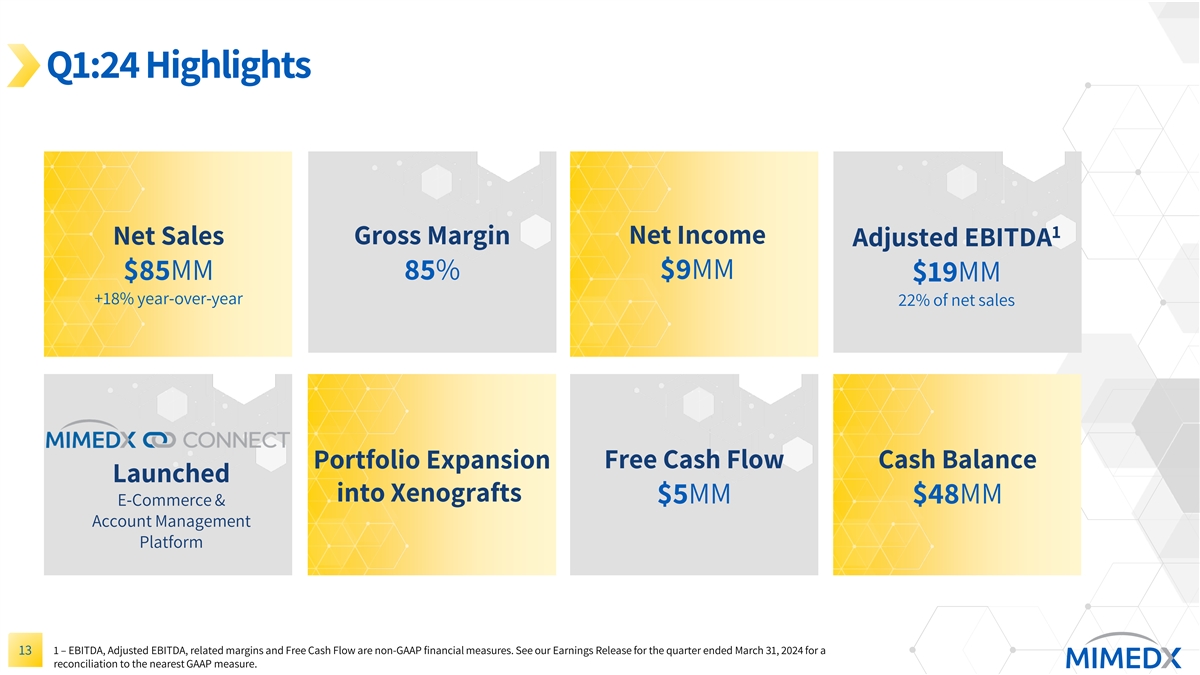
Q1:24 Highlights 1 Net Income Net Sales Gross Margin Adjusted EBITDA $9MM $85MM 85% $19MM +18% year-over-year 22% of net sales Portfolio Expansion Free Cash Flow Cash Balance Launched into Xenografts $5MM $48MM E-Commerce & Account Management Platform 1 – EBITDA, Adjusted EBITDA, related margins and Free Cash Flow are non-GAAP financial measures. See our Earnings Release for the quarter ended March 31, 2024 for a 13 reconciliation to the nearest GAAP measure.
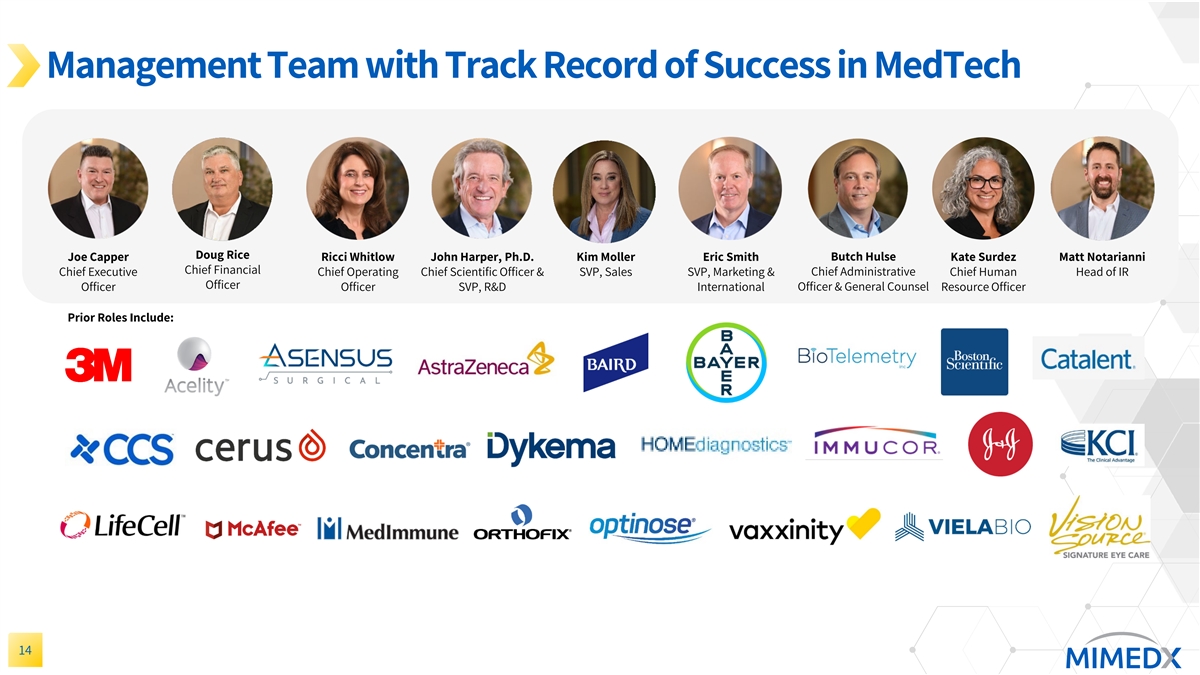
Management Team with Track Record of Success in MedTech Doug Rice Joe Capper Ricci Whitlow John Harper, Ph.D. Kim Moller Eric Smith Butch Hulse Kate Surdez Matt Notarianni Chief Financial Chief Executive Chief Operating Chief Scientific Officer & SVP, Sales SVP, Marketing & Chief Administrative Chief Human Head of IR Officer Officer Officer SVP, R&D International Officer & General Counsel Resource Officer Prior Roles Include: 14
Conclusion Pioneer and Expanding Large and Committed to leader in pipeline in growing delivering above- Advanced Wound Wound & market market growth Care Surgical opportunities and profitability helping humans heal. 15