UNITED STATES
SECURITIES AND EXCHANGE COMMISSION
WASHINGTON, D.C. 20549
FORM 8-K
CURRENT REPORT
PURSUANT TO SECTION 13 OR 15(D)
OF THE SECURITIES EXCHANGE ACT OF 1934
Date of Report (Date of earliest event reported): November 28, 2023
JACOBS SOLUTIONS INC.
(Exact Name of Registrant as Specified in Its Charter)
| Delaware | File No. 1-7463 | 88-1121891 | ||
| (State or other jurisdiction of incorporation) |
(Commission File Number) |
(IRS Employer Identification No.) |
||
| 1999 Bryan Street, Suite 3500, Dallas, Texas | 75201 | |||
| (Address of Principal Executive Offices) | (Zip Code) | |||
(Registrant’s Telephone Number, Including Area Code) (214) 583-8500
Not Applicable
(Former Name or Former Address, if Changed Since Last Report)
Check the appropriate box below if the Form 8-K filing is intended to simultaneously satisfy the filing obligation of the registrant under any of the following provisions (see General Instruction A.2. below):
| ☐ | Written communications pursuant to Rule 425 under the Securities Act (17 CFR 230.425) |
| ☐ | Soliciting material pursuant to Rule 14a-12 under the Exchange Act (17 CFR 240.14a-12) |
| ☐ | Pre-commencement communications pursuant to Rule 14d-2(b) under the Exchange Act (17 CFR 240.14d-2(b)) |
| ☐ | Pre-commencement communications pursuant to Rule 13e-4(c) under the Exchange Act (17 CFR 240.13e-4(c)) |
Securities registered pursuant to Section 12(b) of the Act:
| Title of Class |
Trading |
Name of Exchange |
||
| Common Stock, $1 par value | J | New York Stock Exchange |
Indicate by check mark whether the registrant is an emerging growth company as defined in Rule 405 of the Securities Act of 1933 (§230.405 of this chapter) or Rule 12b-2 of the Securities Exchange Act of 1934 (§240.12b-2 of this chapter).
Emerging growth company ☐
If an emerging growth company, indicate by check mark if the registrant has elected not to use the extended transition period for complying with any new or revised financial accounting standards provided pursuant to Section 13(a) of the Exchange Act. ☐
| Item 7.01. | Regulation FD Disclosure. |
On November 20, 2023, Jacobs Solutions Inc. (the “Company”) announced the execution of certain definitive agreements providing for a combination of its Critical Mission Solutions and Cyber & Intelligence government services businesses with Amentum Parent Holdings LLC in a Reverse Morris Trust transaction, on the terms and conditions set forth in such agreements (the “Transaction”). The Company has updated its monthly investor presentation, which the Company intends to use in one or more meetings with investors and analysts, to include certain additional information about the Transaction. A copy of the investor presentation is furnished as Exhibit 99.1 to this Form 8-K.
| Item 9.01 | Financial Statements and Exhibits. |
(d) Exhibits.
| Exhibit |
Description |
|
| 99.1 | Investor Presentation | |
| 104 | The cover page from this Current Report on Form 8-K, formatted in Inline XBRL | |
-2-
SIGNATURES
Pursuant to the requirements of the Securities Exchange Act of 1934, the registrant has duly caused this report to be signed on its behalf by the undersigned hereunto duly authorized.
Dated: November 28, 2023
| JACOBS SOLUTIONS INC. | ||
| By: | /s/ Claudia Jaramillo |
|
| Name: | Claudia Jaramillo | |
| Title: | Chief Financial Officer | |
-3-

Exhibit 99.1 Jacobs Investor Presentation November/December 2023
Disclaimer Forward-Looking Statement Disclaimer Non-GAAP Financial Measures and Operating Metrics Certain statements contained in this presentation constitute forward looking statements within the meaning of the United States Private Securities Litigation Reform Act of 1995. Forward looking statements are statements that do not directly relate to any historical or current fact. When used herein, words such as “expects,” “anticipates,” To supplement the financial results presented in accordance “believes,” “seeks,” “estimates,” “plans,” “intends,” “future,” “will,” “would,” “could,” “can,” “may,” target, goal and similar words are intended to identify forward looking with generally accepted accounting principles in the United States (“GAAP”), we statements. Examples of forward looking statements include, but are not limited to, statements we make concerning our expectations as to our future growth, prospects, present certain non-GAAP financial measures within the meaning of Regulation financial outlook and business strategy, including our expectations for our fiscal year 2024 adjusted EBITDA and adjusted EPS, free cash flow conversion, net interest expense, G under the Securities Exchange Act of 1934, as amended. These measures are multi year earnings growth, as well as our expectations for our fiscal year 2024 effective tax rate, our plans to implement a cost optimization plan, including our ability to not, and should not be viewed as, substitutes for GAAP financial measures. reduce corporate unallocated costs and eliminate stranded costs and our expectations regarding adjusted EBITDA margin expansion in connection therewith, our plans to spin off and merge with Amentum our Critical Missions Solutions ( CMS ) business and a portion of our Divergent Solutions business in a proposed transaction that is This presentation contains certain operating metrics which management intended to be tax free to stockholders for U.S. federal income tax purposes, our and our stockholders respective ownership percentages of the combined company, the believes are useful in evaluating the transaction. We generally explain these amount of cash payment and value to be derived from the disposition of Jacobs’ stake in the combined company, the expected timing, structure and tax treatment of the metrics in footnotes when used. Backlog represents revenue the company proposed transaction, the ability of the parties to complete the proposed transaction, and the potential benefits and synergies of the proposed transaction, including the expects to realize for work to be completed, including work to be completed by future financial and operating results and strategic benefits, and any assumptions underlying any of the foregoing. their consolidated subsidiaries. Backlog to revenue represents the ratio of combined backlog to the revenue of the separated businesses plus Amentum’s Although such statements are based on Jacobs’ and Amentum’s current estimates and expectations, and/or currently available competitive, financial, and economic data, revenue. Leverage equals the sum of indebtedness of Amentum and the forward-looking statements are inherently uncertain, and you should not place undue reliance on such statements as actual results may differ materially. We caution the separated businesses expected to be outstanding at a point in time less cash reader that there are a variety of risks, uncertainties and other factors that could cause actual results to differ materially from what is contained, projected or implied by our and cash equivalents as of the same point in time, divided by the adjusted forward-looking statements. earnings before interest, taxes, depreciation and amortization for the 12-month period ending on that date. We regularly monitor these operating metrics to Such factors include uncertainties as to the structure and timing of the proposed transaction, the impact of the proposed transaction on Jacobs and the combined company if the proposed transaction is completed, the possibility that the proposed transaction may not qualify for the expected tax treatment, the ability to obtain all required evaluate our business, identify trends affecting our business, and make regulatory approvals, the possibility that closing conditions for the proposed transaction may not be satisfied or waived, on a timely basis or otherwise, the risk that any strategic decisions, and expect the combined company to similarly consents or approvals required in connection with the proposed transaction may not be received, the risk that the proposed transaction may not be completed on the terms evaluate these metrics. or in the time-frame expected by the parties, unexpected costs, charges or expenses resulting from the proposed transaction, business and management strategies and the growth expectations of the combined company, the ability of the parties to combine the combined company and to implement its business strategy and realize the expected Disclaimer of Amentum Information: Certain information contained herein, in benefits, including the ability to realize the estimated synergies, the inability of the Company and the combined company to retain and hire key personnel, customers or cluding the combined company’s expected revenue, the percentage of revenu suppliers while the proposed transaction is pending or after it is completed, as well as other factors related to the combined company business, such as competition from e derived from prime contracts, and the combined backlog and pipeline,is existing and future competitors in its target markets, financial market risks that may affect Jacobs or the combined company, including by affecting Jacobs’ or the combined based in part on information provided by company’s access to capital, as well as general economic conditions, including inflation and the actions taken by monetary authorities in response to inflation, changes in Amentum in connection with the proposed transaction. Jacobs has not indepen interest rates and foreign currency exchange rates, changes in capital markets, the impact of a possible recession or economic downturn on our results, prospects and dently verified this information. Information regarding Amentum’s and CMS’s f opportunities, and geopolitical events and conflicts, the risk that disruptions from the proposed transaction will impact the Jacobs’ or Amentum’s business, the risk that the uture expectations of performance, including projected Adj. EBITDA margin, separation of the CMS business from the Company is more difficult than expected, the risk of a disruption in the Company’s business as a result of the pending proposed and projected leverage ratios, are based on estimates and assumptions. There transaction, a possible decrease in the trading price of the Company’s and/or the combined company’s shares, as well as factors related to our business or detailed from time can be no assurance that these estimates and assumptions are correct, and to time in the Company’s reports filed with the U.S. Securities and Exchange Commission (“SEC”). The foregoing factors and potential future developments are inherently you should not unduly rely upon them. uncertain, unpredictable and, in many cases, beyond our control. For a description of these and additional factors that may occur that could cause actual results to differ from our forward-looking statements see our Annual Report on Form 10-K for the year ended September 29, 2023, and in particular the discussions contained therein under Item 1—Business; Item 1A—Risk Factors; Item 3—Legal Proceedings; and Item 7—Management's Discussion and Analysis of Financial Condition and Results of Operations, our Quarterly Reports on Form 10-Q, as well as the Company’s other filings with the SEC. The Company is not under any duty to update any of the forward-looking statements after the date of this presentation to conform to actual results, except as required by applicable law. We encourage you to read carefully the risk factors, as well as the financial and business disclosures contained in our Annual Report on Form 10-K, our Quarterly Report on Form 10-Q and in other documents we file from time to time with the United States Securities and Exchange Commission. ©Jacobs 2023

Portfolio Overview FY23 1, 2 2 By Sector By Region Jacobs today Advanced Manufacturing APAC & Other 5% 9% § Workforce: ~60,000 Cities & Places 8% Infrastructure § Currently operates across four reporting segments that provide UK & 32% Europe Space a full spectrum of professional services including consulting, technical, 22% 9% scientific and project delivery for the government and private sectors: Health & Life − People & Places Solutions (P&PS) – critical infrastructure Sciences 8% − Majority investment in PA Consulting (PA) − Divergent Solutions (DVS) – data & software solutions (certain segments, including Cyber & Intel. to be separated) − Critical Mission Solutions (CMS) (to be separated) National Security Energy & North America 20% Environment § Targeting higher growth / margin sub-segments 69% 18% § Client segments expected to outpace industry growth rates – critical 2 3 By Mix By Segment infrastructure, water & environment, semiconductors, life sciences, digitally-enabled solutions PA Fixed-price at risk 9% 5% DVS 7% FY24 Strategic Targets Fixed-price limited risk 21% CMS 35% 100% 10,000 30% Client Consulting Revenue from projects with ESG & Advisory consulting, data P&PS scope talent base and technology 49% Reimbursable Solutions 74% 1 Excludes PA Consulting 2 Based on Revenue per applicable 10K filing 3 3 Reflects Adj. Net Revenue, defined as Revenue minus pass-through Revenue, for FY23 Adj. Net Revenue is a non-GAAP financial measure. Please see Appendix for a reconciliation to the nearest GAAP measure

Transformation to less volatile and higher value services and solutions PA Consulting PA Consulting 7% Government Services 18% Energy, Chemicals Critical CMS/C&I Infrastructure and Resources 34% 54% 1 1 FY14 FY23 FY25E $12.7B $16.3B Standalone Critical Critical Infrastructure Infrastructure 28% 59% 2 + 13.8% 10.8% 7.8% Adj EBITDA At least 300 bps of margin expansion Margins expected post CMS separation FY23 FY25E FY14 2015-2016 2017-2023 Today & future Assess and Focus De-risk and Shift to Higher Value Services Challenging Today. Reinventing Tomorrow. § New management team joins Jacobs§ Acquired CH2M to accelerate growth in high value infrastructure§ Foundation of efficient, competitive businesses § Developed strategy aligned to secular growth § Divested energy, chemical and resources business§ Global, premier high-end solutions provider opportunities § Acquired majority ownership in PA Consulting§ Positioning two leading businesses for success § Margin improvement runway for Standalone Jacobs 1 Based on Revenue per applicable 10K filing 4 2 § Standalone Jacobs over-capitalized after separation proceeds Post-Separation Adj. EBITDA Margin, dependent on successful completion of CMS separation
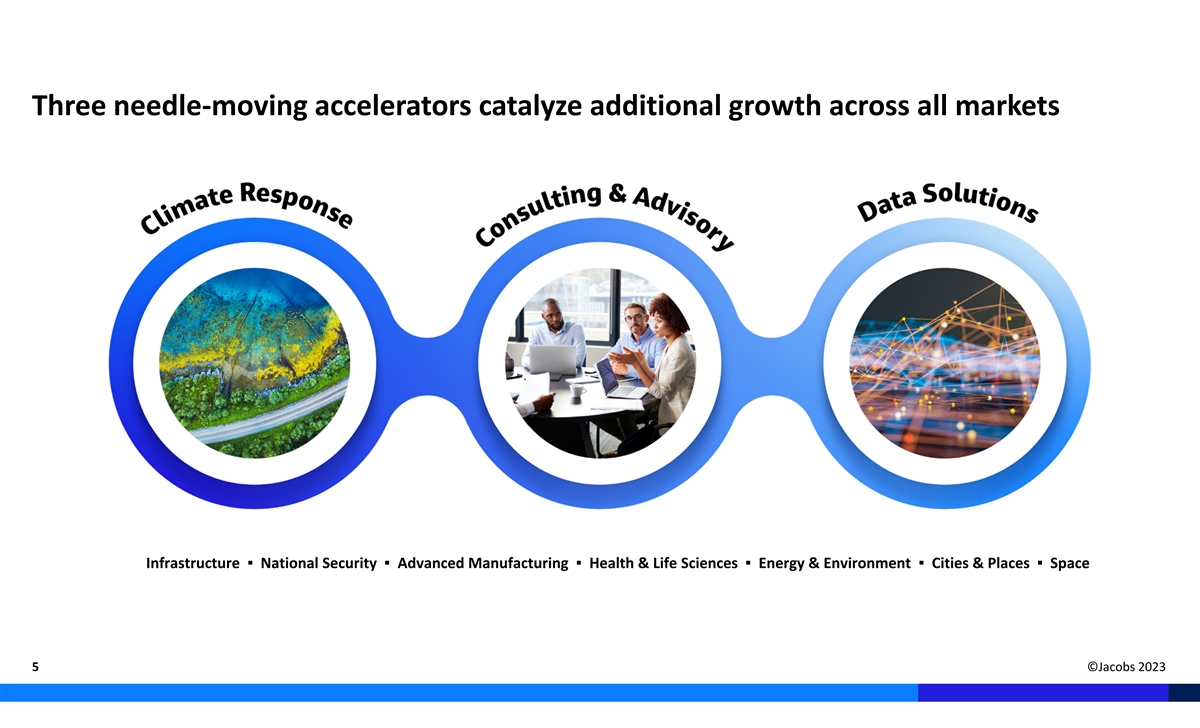
Three needle-moving accelerators catalyze additional growth across all markets Infrastructure ▪ National Security ▪ Advanced Manufacturing ▪ Health & Life Sciences ▪ Energy & Environment ▪ Cities & Places ▪ Space 5 ©Jacobs 2023

P&PS playing in key sectors aligned to critical infrastructure and sustainability Transportation Water Cities & Places Energy & Environmental Health and Life Sciences Advanced Manufacturing § Market leading position in Mass § Unique OneWater end-to-end § Integrating data, technology, § Responding to challenges § Largest professional services § Capturing unprecedented Transit & Rail, Marine & Port approach providing social value mobility and connectivity to driven by climate change, provider to the multi-year super-cycle in Facilities, Highways & Bridges, across the complete water improve economic and social urbanization, resource scarcity, biopharmaceutical industry semiconductors in response to and Airports cycle equity and the resiliency of energy security & digital global supply chain disruption § Health System Governance, cities & communities proliferation § PMCM capabilities delivering § Drinking water and reuse, Health Infrastructure and Health § Trusted advisor to many world’s largest Transportation wastewater, conveyancing and § Architecture, Structures, § Supporting global energy Operations Advisory Electronics and Specialized megaprojects storage and water resources Building Systems, Interiors & diversification and transition Manufacturing clients § Digital Health: data solutions Strategies efforts across all sectors § Transportation Advisory & § Water-Energy nexus and cyber expertise, telehealth§ Data centers, driving Planning§ Market leaders in Defense and § Renewables and hydrogen decarbonization and cloud § Digital Water including OT Government buildings condo strategies § Decarbonization Cyber§ Environmental planning, § Industry leading PMCM remediation, regeneration, § Electric Vehicle Manufacturing § Data & Cyber solutions§ Nature based solutions capabilities operational excellence and PFAS solutions § EV charging § Sustainable and intelligent buildings Empowered by digitally enabled solutions across all end sectors 6

Jacobs holds leading positions Overall Infrastructure Health & Life Sciences № 1 Wastewater Treatment № 1 Pharmaceuticals № Top 500 in Design Firms 1 № 1 Sanitary & Storm Sewers № 1 Healthcare № Top 100 Pure Designers № 1 Sewer & Waste 1 Advanced Manufacturing № 1 Transmission Lines & Cabling № Top 20 Firms in Combined Design and CM-PM № 1 Operation & Maintenance 1 Professional Services Revenue № 1 Data Centers № 1 Telecommunications № 1 Semiconductors Energy & Environment № 2 Water № 1 Manufacturing № 1 Environmental Consulting № 2 Transportation № 1 Industrial Process № 1 Clean Air Compliance № 2 Bridges № 1 Pulp & Paper № 1 Solar Power № 2 Mass Transit & Rail № 2 Electronic Assembly № 2 Chemical & Soil Remediation № 2 Marine & Port Facilities № 2 Site Assessment & Compliance № 2 Airports Cities & Places № 2 Wind Power № 2 Water Treatment, Desalination Plants № 2 Government Offices № 2 Co-Generation № 2 Highways № 2 Entertainment № 2 Power 7 *Source: Engineering News-Record: 2023 Top 500 Design Firms and Source Books ©Jacobs 2023

People & Places Solutions – Infrastructure & sustainability leader Approx. revenue by sector (FY 2023) Business Breakdown FY’23 Business breakdown FY’22 revenue Gross Revenue $9,554 million Adj. Net Revenue* $6,567 million Advanced Manufacturing, (% of Total Adj. Net Revenue) (49%) $8,570 million Revenue (% of Total Net Revenue) 7% (50%) US / International 62% / 38% Transportation, Cities & Places, 29% US / International 62% / 38% Public / Private 60% / 40% 14% Public / Private 61% / 39% Reimbursable / Fixed Price Services 72% / 28% Energy & % Operating Profit Margin (% of Adj. Net Revenue*) 14.6% Reimbursable / Fixed Price Services 72% / 28% Environment, 11% End‐to‐end Solutions % Operating Profit Margin 13.2% National § Climate change§ Integrated water management Security, 2% § Energy transition§ Smart cities Water, 23% § Connected mobility§ Vaccine manufacturing Health & Life Sciences, 14% Infrastructure Infrastructure‐enabling markets * Adj. Net Revenue is a non‐GAAP financial measure. Please see Appendix for a reconciliation to the nearest GAAP measure Key Customers 8
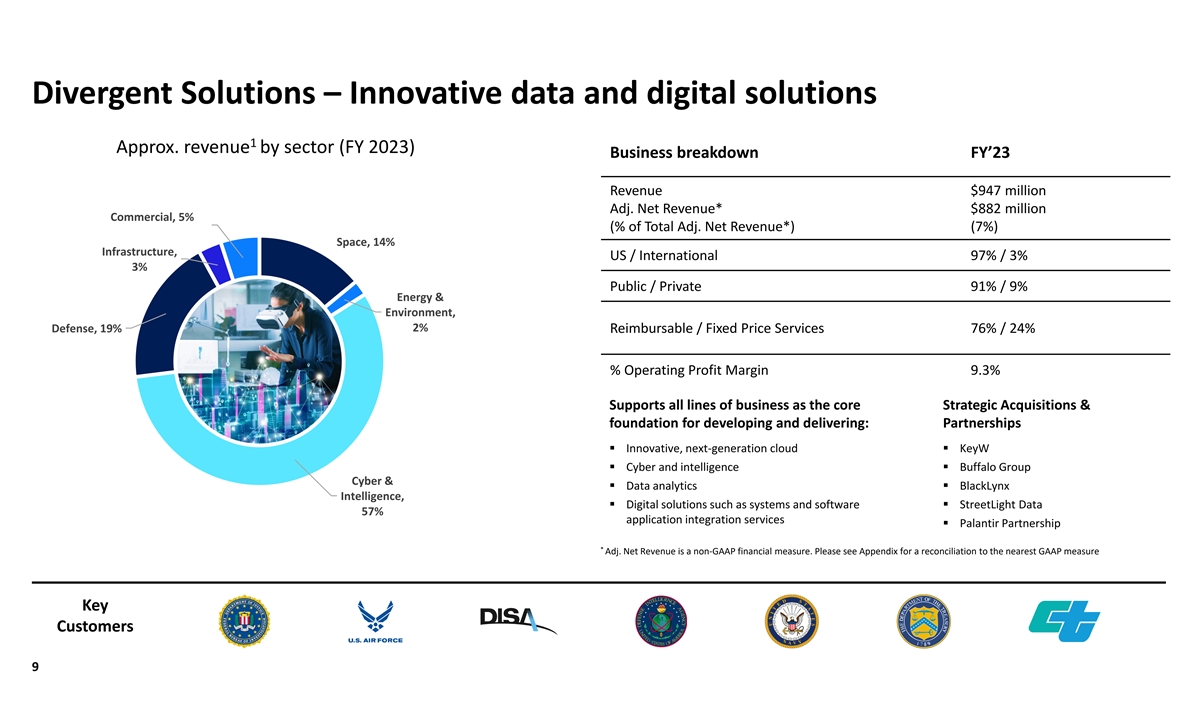
Divergent Solutions – Innovative data and digital solutions 1 Approx. revenue by sector (FY 2023) Business breakdown FY’23 Revenue $947 million Adj. Net Revenue* $882 million Commercial, 5% (% of Total Adj. Net Revenue*) (7%) Space, 14% Infrastructure, US / International 97% / 3% 3% Public / Private 91% / 9% Energy & Environment, 2% Defense, 19% Reimbursable / Fixed Price Services 76% / 24% % Operating Profit Margin 9.3% Supports all lines of business as the core Strategic Acquisitions & foundation for developing and delivering: Partnerships § Innovative, next-generation cloud§ KeyW § Cyber and intelligence§ Buffalo Group Cyber & § Data analytics§ BlackLynx Intelligence, § Digital solutions such as systems and software § StreetLight Data 57% application integration services § Palantir Partnership * Adj. Net Revenue is a non-GAAP financial measure. Please see Appendix for a reconciliation to the nearest GAAP measure Key Customers 9
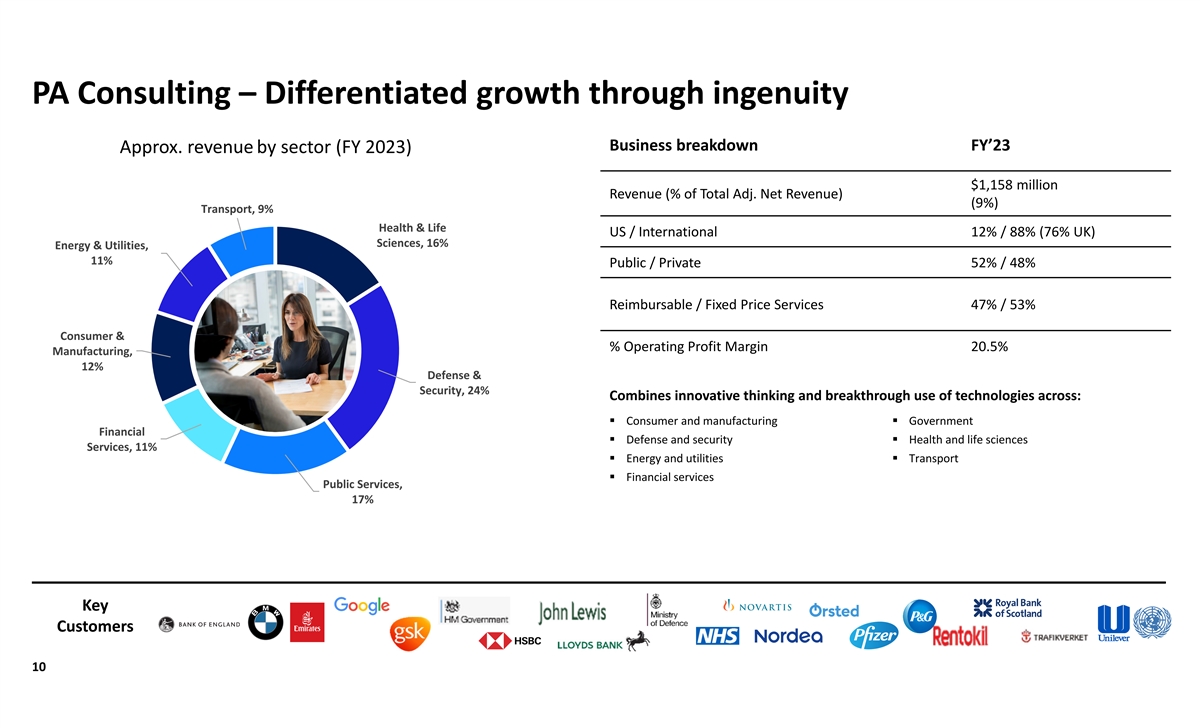
PA Consulting – Differentiated growth through ingenuity Business breakdown FY’23 Approx. revenue by sector (FY 2023) $1,158 million Revenue (% of Total Adj. Net Revenue) (9%) Transport, 9% Health & Life US / International 12% / 88% (76% UK) Sciences, 16% Energy & Utilities, 11% Public / Private 52% / 48% Reimbursable / Fixed Price Services 47% / 53% Consumer & % Operating Profit Margin 20.5% Manufacturing, 12% Defense & Security, 24% Combines innovative thinking and breakthrough use of technologies across: § Consumer and manufacturing§ Government Financial § Defense and security§ Health and life sciences Services, 11% § Energy and utilities§ Transport § Financial services Public Services, 17% Key Customers 10

Critical Mission Solutions – Poised to thrive independently Approx. revenue by sector (FY 2023) Business breakdown FY’23 $4,693 million Revenue (% of Total Adj. Net Revenue) (35%) Advanced Manufactureing, 2% Infrastructure, 7% US / International 76% / 24% (Auto test and diagnostics) (Telecom) Public / Private 82% / 18% National Security Space, 22% Reimbursable, T&M / Fixed Price Services 82% / 18% % Operating Profit Margin 8.1% Provides a full spectrum of solutions for our government clients: § Cyber, data analytics, systems and § Enterprise operations and maintenance Defense & software application integration services § Program management Intelligence, Energy & § Consulting § Other highly technical consulting solutions 35% Environment, § Enterprise level O&M and mission IT § Space exploration and intelligence 34% § Engineering and design Key Combatant U.S. Intelligence Commands Community Customers 11

Creating a New Government Services Leader: Jacobs To Spin-off and Merge Its CMS and C&I Businesses with Amentum ©Jacobs 2023

Transaction rationale § Jacobs to spin-off and merge its CMS business with Amentum, creating a new independent, publicly-traded company § Transaction perimeter includes Jacobs CMS segment plus the closely related Cyber and Intelligence unit (“C&I”) from Divergent Solutions (“DVS”) § Culmination of a comprehensive review to determine highest value alternative for Jacobs’ shareholders following th inbound inquiries received after spin-off announcement of the CMS segment on May 9 –Creates a scaled pure-play government services engineering and technology leader with an enhanced strategic and financial profile – Drives higher growth by combining portfolios with complementary capabilities and client sets – Benefits from $50-70M of expected net cost synergies –Preserves tax efficiency of a spin for Jacobs’ shareholders § Transaction marks a critical milestone in Jacobs’ strategic portfolio transformation to a more focused, higher margin portfolio aligned to critical infrastructure tailwinds § Achieves objective of creating two independent companies after the separation, each positioned for greater success 13 ©Jacobs 2023

Transaction summary § Reverse Morris Trust that is intended to be tax-free to shareholders for U.S. federal income tax purposes § Jacobs and Jacobs shareholders to own up to 63% of combined company – Jacobs shareholders: 51% – Jacobs company retained stake: 7.5% - 12% based on achievement of operating profit targets prior to close Transaction Structure § $1.0B cash dividend to Jacobs at closing § Combined FY24 Adj. EBITDA of approximately $1.1B including $50-70M of expected net cost synergies § Additional value to Jacobs through disposition of retained stake in combined company § ~$4.2B of expected net debt at close, implying ~3.8x net leverage at close with clear path to deleveraging below 3.0x § Steve Demetriou will serve as Executive Chair of the combined company § John Heller (current CEO of Amentum) will serve as CEO of the combined company Management § Dr. Steve Arnette (EVP and President of CMS) will serve as COO of the combined company and Governance § Board initially split 50/50 between Jacobs and Amentum nominees including John Heller § Additional members of the combined company’s senior management team will be drawn from both companies § Transaction expected to close in second half of FY2024 § Closing will be subject to regulatory approvals and other customary closing conditions Timing § Post-closing, combined company will be publicly traded 14 ©Jacobs 2023
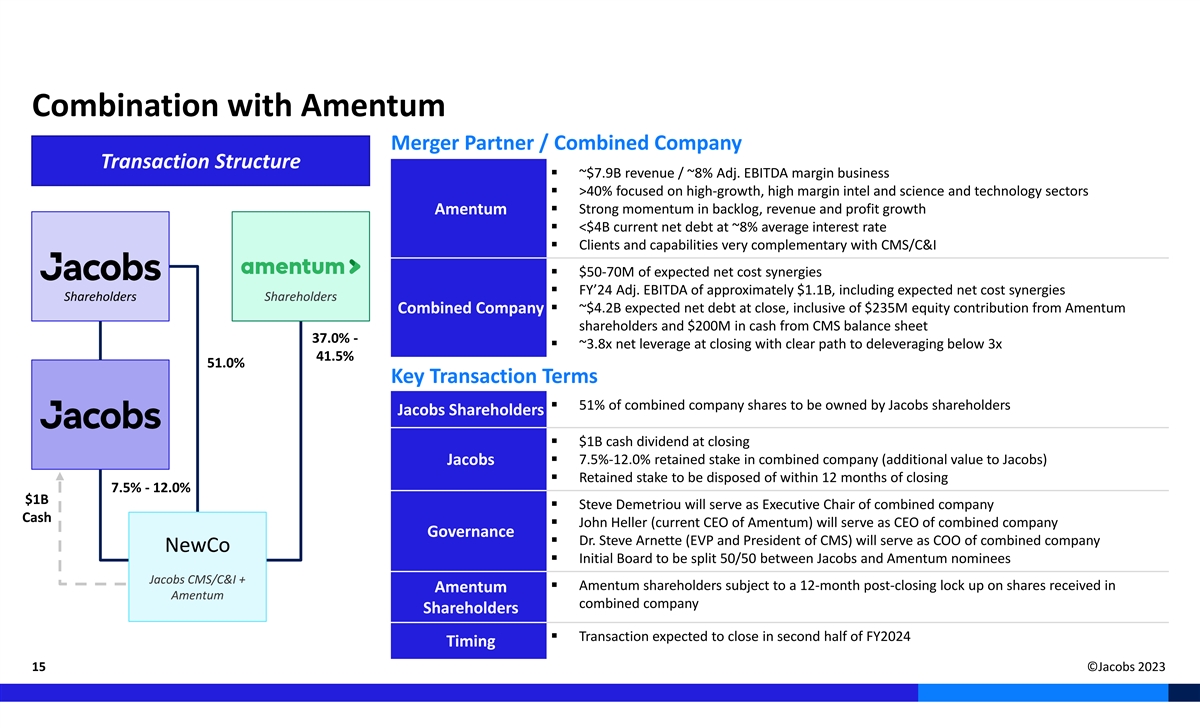
Combination with Amentum Merger Partner / Combined Company Transaction Structure § ~$7.9B revenue / ~8% Adj. EBITDA margin business § >40% focused on high-growth, high margin intel and science and technology sectors Amentum§ Strong momentum in backlog, revenue and profit growth § <$4B current net debt at ~8% average interest rate § Clients and capabilities very complementary with CMS/C&I § $50-70M of expected net cost synergies § FY’24 Adj. EBITDA of approximately $1.1B, including expected net cost synergies Shareholders Shareholders § ~$4.2B expected net debt at close, inclusive of $235M equity contribution from Amentum Combined Company shareholders and $200M in cash from CMS balance sheet 37.0% - § ~3.8x net leverage at closing with clear path to deleveraging below 3x 41.5% 51.0% Key Transaction Terms § 51% of combined company shares to be owned by Jacobs shareholders Jacobs Shareholders § $1B cash dividend at closing § 7.5%-12.0% retained stake in combined company (additional value to Jacobs) Jacobs § Retained stake to be disposed of within 12 months of closing 7.5% - 12.0% $1B § Steve Demetriou will serve as Executive Chair of combined company Cash § John Heller (current CEO of Amentum) will serve as CEO of combined company Governance § Dr. Steve Arnette (EVP and President of CMS) will serve as COO of combined company NewCo § Initial Board to be split 50/50 between Jacobs and Amentum nominees Jacobs CMS/C&I + § Amentum shareholders subject to a 12-month post-closing lock up on shares received in Amentum Amentum combined company Shareholders § Transaction expected to close in second half of FY2024 Timing 15 ©Jacobs 2023
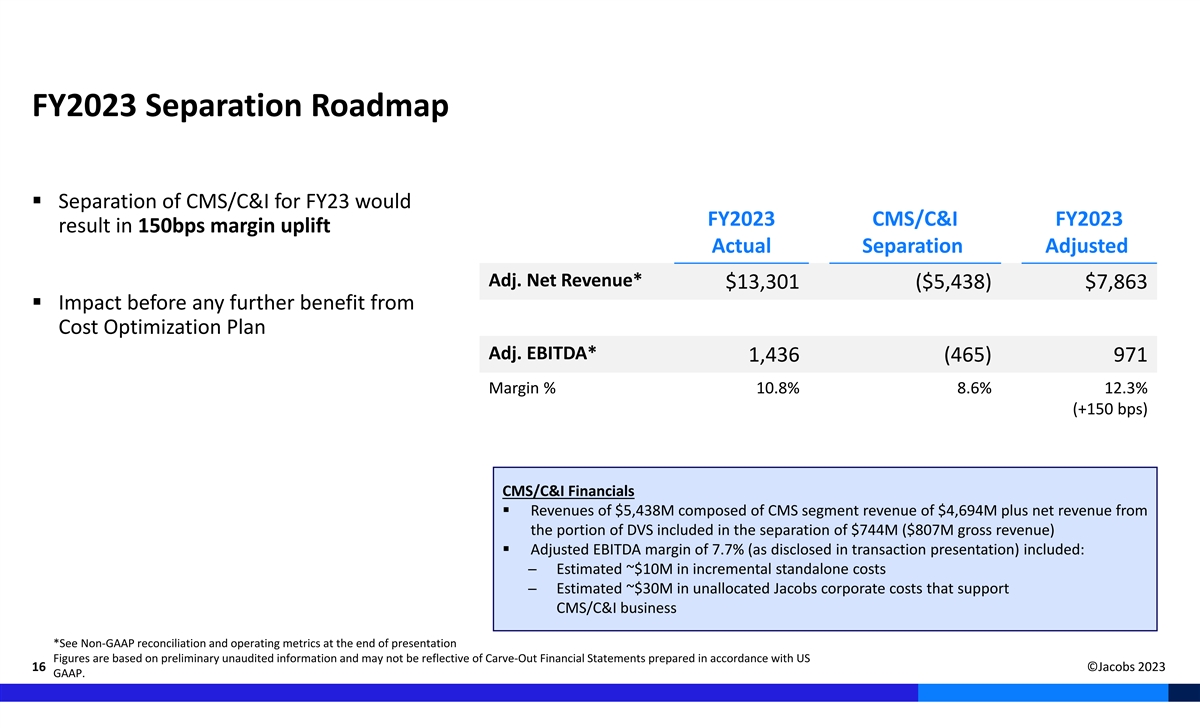
FY2023 Separation Roadmap § Separation of CMS/C&I for FY23 would FY2023 CMS/C&I FY2023 result in 150bps margin uplift Actual Separation Adjusted Adj. Net Revenue* $13,301 ($5,438) $7,863 § Impact before any further benefit from Cost Optimization Plan Adj. EBITDA* 1,436 (465) 971 Margin % 10.8% 8.6% 12.3% (+150 bps) CMS/C&I Financials § Revenues of $5,438M composed of CMS segment revenue of $4,694M plus net revenue from the portion of DVS included in the separation of $744M ($807M gross revenue) § Adjusted EBITDA margin of 7.7% (as disclosed in transaction presentation) included: ─ Estimated ~$10M in incremental standalone costs ─ Estimated ~$30M in unallocated Jacobs corporate costs that support CMS/C&I business *See Non-GAAP reconciliation and operating metrics at the end of presentation Figures are based on preliminary unaudited information and may not be reflective of Carve-Out Financial Statements prepared in accordance with US 16 ©Jacobs 2023 GAAP.

Fiscal 2023 Q4 & Full Year Results

Q4 2023 Segment Adj. Net Revenue Strategy: Boldly Moving Forward PA Consulting, 8% § Culture of inclusion, innovation and inspiration creates competitive advantage Divergent People & Places § Diverse sector exposure with recurring revenue provides substantial visibility Solutions, 7% Solutions, 49% § Climate Response, Data Solutions and Consulting & Advisory key accelerators § Solid execution and discipline result in strong cash flow and shareholder value Critical Mission Track record of execution Solutions, 36% § Q4 adjusted net revenue increased 8.9% y/y § Q4 adjusted OP up 10% y/y § Q4 revenue backlog $29.1B, up 4% y/y with gross margin in backlog up 72 bps y/y Q4 2023 § Q4 P&PS adj. net revenue up 11% y/y with adj. OP growth up 12% y/y Segment Operating Profit PA Consulting, 13% Adj. Net Revenue ($ in Billions) Backlog ($ in Billions) People & Places Divergent $3.5 Solutions, 59% Solutions, 5% $3.2 $29.1 $27.9 Critical Mission Solutions, 23% Q4 2022 Q4 2023 Q4 2022 Q4 2023 18 ©Jacobs 2023 See Non-GAAP reconciliation and operating metrics at the end of presentation

Fiscal 2023 Q4 results Revenue up 10.5% y/y, adjusted net revenue increased 8.9% y/y and up 7.3% in constant currency GAAP Operating Profit (OP) of $278M and OP Margin of 6.5% Adj. OP of $383M up 10% and up 9% in constant currency; Adj. OP Margin (% of Adj. Net Revenue) of 11% GAAP Net Earnings from Continuing Operations of $150M GAAP EPS from Continuing Operations of $1.25 includes: § $0.27 of expense net of NCI related to the amortization of acquired intangibles § $0.05 of a non-cash charge related to reduction in real estate footprint § $0.23 of transaction, restructuring and other related costs 2 § $0.10 tax adjustment to align to expected annual effective tax rate Adj. EPS of $1.90 Adjusted EBITDA of $384M, with adjusted EBITDA margin 11.1% of Adj. Net Revenue Q4 revenue book-to-bill 1.04x and gross profit in backlog up over 8% y/y U.S. GAAP and adjusted effective tax rates for the quarter and year include certain tax adjustments for deferred tax valuation allowances and audit assessments amounting to a negative EPS impact of $0.06 per share. 1 See Non-GAAP reconciliation and operating metrics at the end of presentation 2 Beginning with our first fiscal quarter in 2024, the Company will be revising the adjustments it makes to adjusted net earnings from continuing 19 ©Jacobs 2023 operations and adjusted EPS. It is expected that the Company will no longer make an adjustment to align these non-GAAP measures to its annual effective tax rate. More information will be provided with our first quarter earnings materials.

Fiscal 2023 results Revenue up 10% y/y, adjusted net revenue up 7% y/y GAAP Operating Profit (OP) of $1,075M and OP Margin of 6.6% Adj. OP of $1,433M up 9% and up 11% in constant currency; Adj. OP Margin of 10.8% GAAP Net Earnings from Continuing Operations of $667M GAAP EPS from Continuing Operations of $5.31, impacted by: § $1.06 of expense net of NCI related to the amortization of acquired intangibles § $0.28 of a non-cash charge related to reduction in real estate footprint § $0.55 of transaction, restructuring and other related costs Adj. EPS of $7.20 Adjusted EBITDA of $1,436M, up 5% y/y and up 7% in constant currency Adjusted EBITDA was 10.8% as a of percentage Adj. Net Revenue TTM revenue book-to-bill 1.08x 20 ©Jacobs 2023
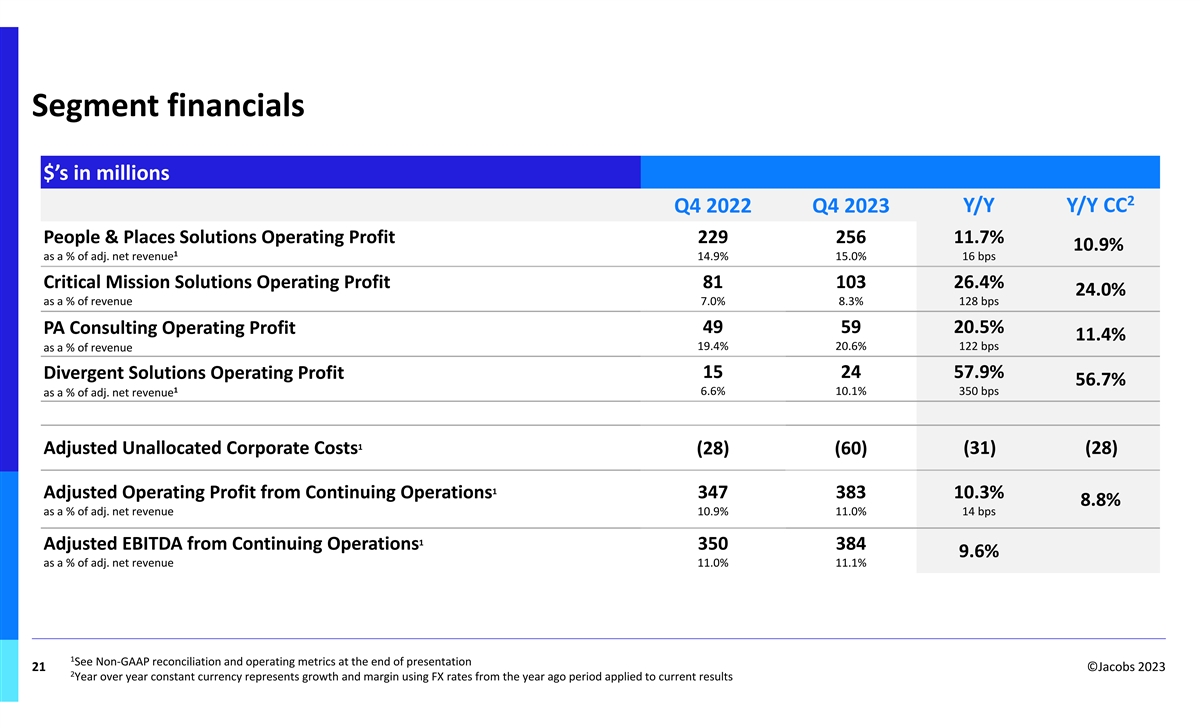
Segment financials $’s in millions 2 Y/Y Y/Y CC Q4 2022 Q4 2023 People & Places Solutions Operating Profit 229 256 11.7% 10.9% 1 as a % of adj. net revenue 14.9% 15.0% 16 bps Critical Mission Solutions Operating Profit 81 103 26.4% 24.0% as a % of revenue 7.0% 8.3% 128 bps 49 59 20.5% PA Consulting Operating Profit 11.4% 19.4% 20.6% 122 bps as a % of revenue 15 24 57.9% Divergent Solutions Operating Profit 56.7% 1 6.6% 10.1% 350 bps as a % of adj. net revenue 1 Adjusted Unallocated Corporate Costs (28) (60) (31) (28) 1 Adjusted Operating Profit from Continuing Operations 347 383 10.3% 8.8% as a % of adj. net revenue 10.9% 11.0% 14 bps 1 Adjusted EBITDA from Continuing Operations 350 384 9.6% as a % of adj. net revenue 11.0% 11.1% 1 See Non-GAAP reconciliation and operating metrics at the end of presentation 21 ©Jacobs 2023 2 Year over year constant currency represents growth and margin using FX rates from the year ago period applied to current results
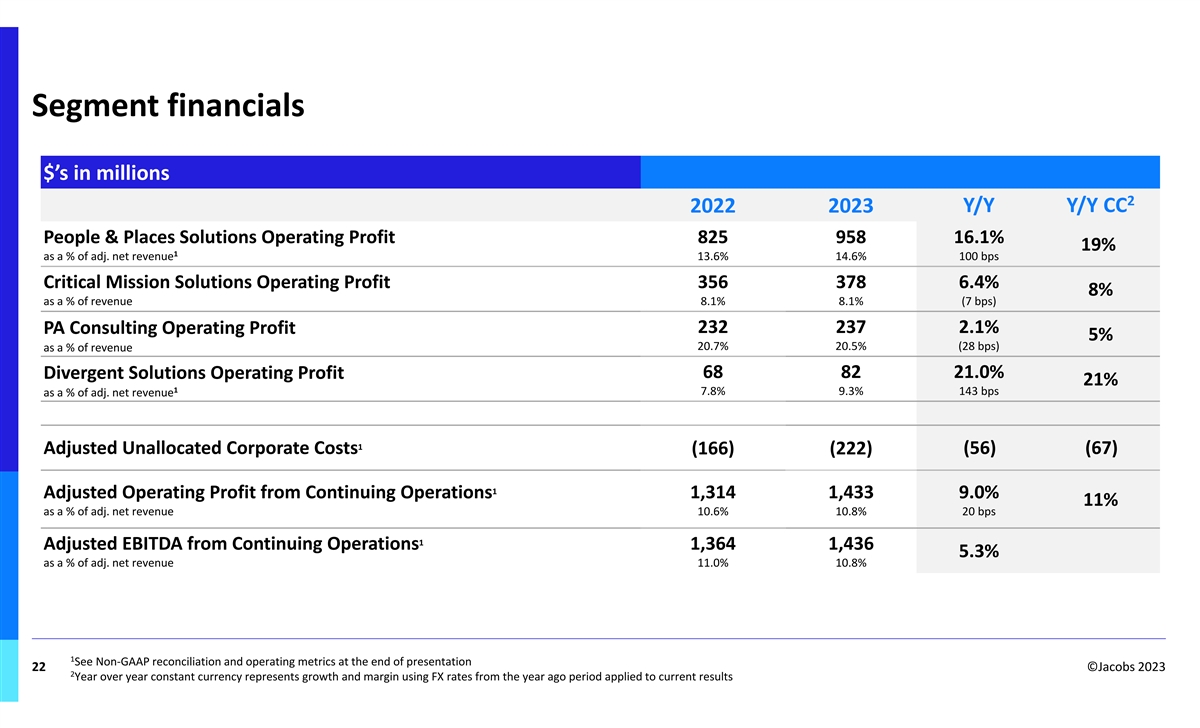
Segment financials $’s in millions 2 Y/Y Y/Y CC 2022 2023 People & Places Solutions Operating Profit 825 958 16.1% 19% 1 as a % of adj. net revenue 13.6% 14.6% 100 bps Critical Mission Solutions Operating Profit 356 378 6.4% 8% as a % of revenue 8.1% 8.1% (7 bps) 232 237 2.1% PA Consulting Operating Profit 5% 20.7% 20.5% (28 bps) as a % of revenue 68 82 21.0% Divergent Solutions Operating Profit 21% 1 7.8% 9.3% 143 bps as a % of adj. net revenue 1 Adjusted Unallocated Corporate Costs (166) (222) (56) (67) 1 Adjusted Operating Profit from Continuing Operations 1,314 1,433 9.0% 11% as a % of adj. net revenue 10.6% 10.8% 20 bps 1 Adjusted EBITDA from Continuing Operations 1,364 1,436 5.3% as a % of adj. net revenue 11.0% 10.8% 1 See Non-GAAP reconciliation and operating metrics at the end of presentation 22 ©Jacobs 2023 2 Year over year constant currency represents growth and margin using FX rates from the year ago period applied to current results

Balance sheet and cash flow Strong cash flow generation 1 § Q4 cash flow from operations (CFFO) $219M and FCF of $180M § Generated $837M in FY23 FCF resulting in YTD 126% FCF conversion of Net Income § 104% underlying FY23 FCF conversion to adjusted net income; expect >100% underlying FY24 conversion excluding the impact of restructuring, transaction and separation costs § Balance sheet strength affords prudent capital deployment § Expect to maintain an investment grade credit profile § Q4 dividend of $0.26/share, an increase of 13% y/y, paid on November 9, 2023 Leverage Metrics ($ billions) FY23 Q4 Cash/debt $0.9B/$2.9B Net Debt Position $1.9B Net debt to LTM adjusted FY23 EBITDA 1.4x Fixed/Floating debt ~65%/35% Ending Q4 weighted interest rate ~5.0% 1 Free cash flow (FCF) calculated as reported cash flow from operations minus CAPEX. 23 ©Jacobs 2023 See Non-GAAP reconciliation and operating metrics at the end of presentation

Balance sheet and capital allocation § Committed to an investment grade credit profile § CMS/C&I transaction benefits balance sheet − Dividend proceeds from CMS/C&I separation used to pay down debt − Additional benefit from disposition of Jacobs retained stake within 12 months of transaction close § Transaction proceeds and strong FCF generation supports consistent return of capital to shareholders − FY2024 guidance for >100% underlying free cash flow conversion − Priority for organic investment and return of capital to shareholders through share repurchases and dividends 24
Cost Optimization Plan and Outlook ©Jacobs 2023

Cost Optimization Plan Streamlining operating model and eliminating stranded costs Driving >300 bps in margin expansion Over 300 bps of Standalone Jacobs Adj. EBITDA Margin § $40M corporate unallocated cost reduction initiative expected Adj. EBITDA ~$90M of Cost § $50M in costs related to independent Jacobs operating Margin expansion Optimization model including technology and global delivery achieved through: 13.8%+ (Run Rate) platform § Separation of 10.8% lower margin business § $140M of cost optimization § Eliminating ~$50M in stranded costs associated with initiatives ~$50M of the CMS separation Stranded Costs § Operating § Stranded costs are not incremental to operating profit leverage 1 FY23 As-Reported FY25E Total Cost Optimization: > $140M including $90M+ in run-rate savings 1 26 Assumes $90M of cost optimization and successful completion of CMS separation in FY24. ©Jacobs 2023
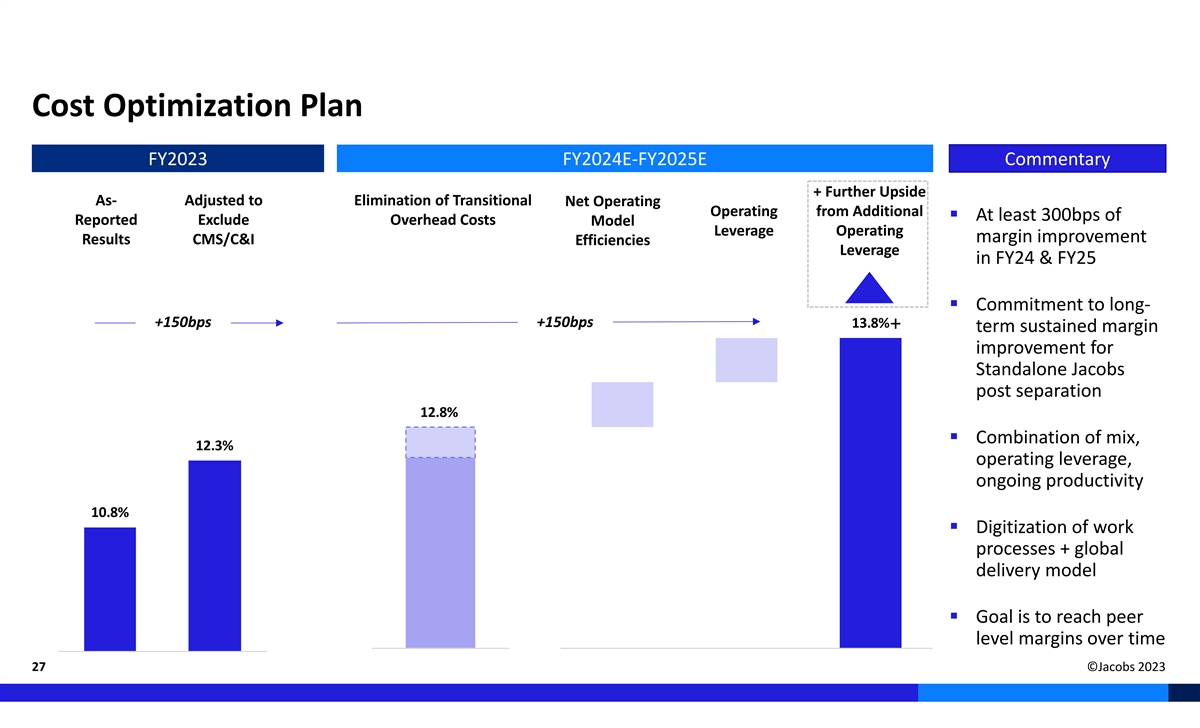
Cost Optimization Plan FY2023 FY2024E-FY2025E Commentary + Further Upside As- Adjusted to Elimination of Transitional Net Operating Operating from Additional § At least 300bps of Reported Exclude Overhead Costs Model Leverage Operating margin improvement Results CMS/C&I Efficiencies Leverage in FY24 & FY25 § Commitment to long- +150bps +150bps 13.8% + term sustained margin improvement for Standalone Jacobs post separation 12.8% § Combination of mix, 12.3% operating leverage, ongoing productivity 10.8% § Digitization of work processes + global delivery model § Goal is to reach peer level margins over time 27 ©Jacobs 2023

Outlook & Summary 1 Initiating Fiscal 2024 Outlook Full Year 2024 Assumptions 2 FY23 FY24E Y/Y Growth (at mid-point) § FY 2024 fully diluted average share count: ~127M FY Adjusted EBITDA $1.44B $1.53B - $1.60B 9% § Annual CAPEX: ~1% of net revenue FY Adjusted EPS $7.20 $7.70 - $8.20 10% § Depreciation: ~$110M Net Interest Expense $142M $130M - $140M (5%) Adj. Non-Controlling Interest $80M $75M - $85M — Q1 FY2024 Assumptions Effective Tax Rate 21.6% 22.0% § Approximately 10% negative year-over-year adjusted EPS decline 3 Underlying FCF Conversion 104% >100% § ~$0.25 year-over-year headwind associated § Remain committed to double-digit multi-year earnings growth driven by accelerating revenue, improving margin with one-time favorable impact from performance, strong backlog and a robust global sales pipeline aligned with our strategic accelerators. Additional Considerations employee benefit plan change in § Incorporates full-year contribution of businesses to be separated. comparison period plus higher other § FY24 expected effective tax rate of 22% has an impact as compared to our FY23 effective tax rate of 21.6%. employee related costs during current period § Strong underlying growth 1 See Non-GAAP reconciliation and operating metrics at the end of presentation. 2 Reconciliation of expected fiscal year 2024 adjusted EPS and adjusted EBITDA, and net interest expense and adjusted non-controlling interests for fiscal year 2024 to the most directly comparable GAAP measure is not available without unreasonable efforts because the Company cannot predict with sufficient certainty all the components required to provide such reconciliation. 28 ©Jacobs 2023 3 Before the impact of restructuring, transaction and separation costs.

FY24 EBITDA and EPS Guidance Recap Fiscal 2024 Outlook Illustrative FY24 Excl. Transitional Overhead 1 2 FY24 Guidance Transitional Overhead Costs FY23 (% Growth) Costs (% Growth) FY Adjusted EBITDA $1.44B $1.53B - $1.60B $40M $1.57B - $1.64B 6% - 11% 9% - 14% FY Adjusted EPS $7.20 $7.70 - $8.20 $7.95 - $8.45 $0.25 7% - 14% 10% - 17% 1 Reconciliation of expected fiscal year 2024 adjusted EPS and adjusted EBITDA for fiscal year 2024 to the most directly comparable GAAP measure is not available without unreasonable efforts because the Company cannot predict with sufficient certainty all the components required to provide such reconciliation. 2 Represents illustrative FY24 Adj. EBITDA and FY24 Adj. EPS if separation transaction was completed at the outset of FY24, which would enable elimination of 29 ©Jacobs 2023 Transitional Overhead Costs.

Appendix

Debt & interest overview Debt Breakdown Fixed vs Floating Debt Trend As of September 29, 2023 Tranche 9/29 Debt Q3 ’23 Rate Q4 ’23 Rate Revolver ($2.25B) $10M 6.5% 6.7% $36.0 $36.1 $37.1 $33.0 USD Term Loans $197M 6.5% 6.7% $31.1 $25.1 $21.6 GBP Term Loans $799M 6.2% 6.5% Total Floating $1,006M 6.3% 6.5% Sustainability-Linked Bond $500M 5.0% 5.0% $0.9 Public Bond – 5Y $600M - 6.4% $1.4 $1.4 $1.4 Swapped $769M 2.0% 2.1% $1.4 $1.4 Total Fixed $1,869M 3.1% 4.3% $1.9 Total Debt $2,875M 5.0% 5.0% $2.6 $2.2 $2.0 $2.1 $1.8 $1.8 Notional $1.0 1 Hedge Fair Value Fixed Rate Maturity (USD) 10 YR USD Floating $200M $37M 1.116% + Spread Apr ’30 Q2’22 Q3’22 Q4’22 Q1’23 Q2’23 Q3’23 Q4’23 5 YR USD Floating $325M $20M 0.704% + Spread Feb ’25 Fixed Debt ($B’s) 10 YR GBP Floating $244M $50M 0.82% + Spread Apr ’30 Floating Debt ($B’s) Total $769M $102M Net Interest Expense ($M’s) 1 31 ©Jacobs 2023 Fixed Rates and spread includes new amendments
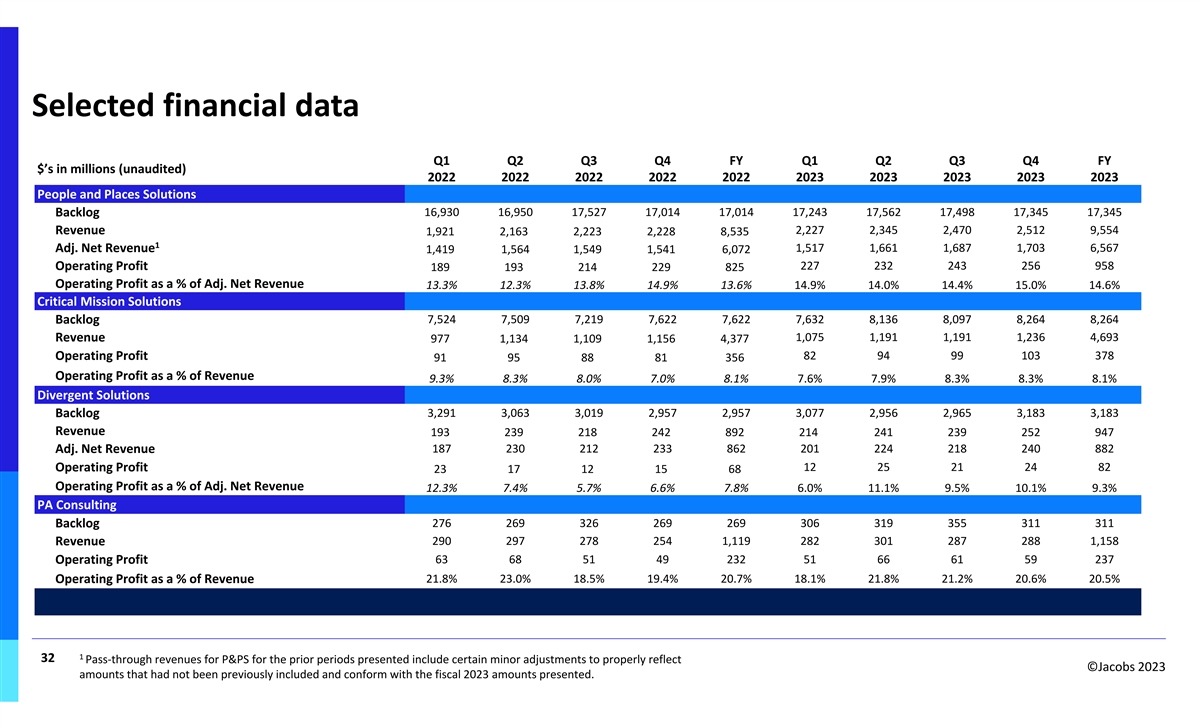
Selected financial data Q1 Q2 Q3 Q4 FY Q1 Q2 Q3 Q4 FY $’s in millions (unaudited) 2022 2022 2022 2022 2022 2023 2023 2023 2023 2023 People and Places Solutions Backlog 16,930 16,950 17,527 17,014 17,014 17,243 17,562 17,498 17,345 17,345 Revenue 2,227 2,345 2,470 2,512 9,554 1,921 2,163 2,223 2,228 8,535 1 Adj. Net Revenue 1,517 1,661 1,687 1,703 6,567 1,419 1,564 1,549 1,541 6,072 Operating Profit 227 232 243 256 958 189 193 214 229 825 Operating Profit as a % of Adj. Net Revenue 13.3% 12.3% 13.8% 14.9% 13.6% 14.9% 14.0% 14.4% 15.0% 14.6% Critical Mission Solutions Backlog 7,524 7,509 7,219 7,622 7,622 7,632 8,136 8,097 8,264 8,264 Revenue 1,075 1,191 1,191 1,236 4,693 977 1,134 1,109 1,156 4,377 82 94 99 103 378 Operating Profit 91 95 88 81 356 Operating Profit as a % of Revenue 9.3% 8.3% 8.0% 7.0% 8.1% 7.6% 7.9% 8.3% 8.3% 8.1% Divergent Solutions Backlog 3,291 3,063 3,019 2,957 2,957 3,077 2,956 2,965 3,183 3,183 Revenue 193 239 218 242 892 214 241 239 252 947 Adj. Net Revenue 187 230 212 233 862 201 224 218 240 882 Operating Profit 12 25 21 24 82 23 17 12 15 68 Operating Profit as a % of Adj. Net Revenue 12.3% 7.4% 5.7% 6.6% 7.8% 6.0% 11.1% 9.5% 10.1% 9.3% PA Consulting 276 269 326 269 269 306 319 355 311 311 Backlog 290 297 278 254 1,119 282 301 287 288 1,158 Revenue Operating Profit 63 68 51 49 232 51 66 61 59 237 Operating Profit as a % of Revenue 21.8% 23.0% 18.5% 19.4% 20.7% 18.1% 21.8% 21.2% 20.6% 20.5% 1 32 Pass-through revenues for P&PS for the prior periods presented include certain minor adjustments to properly reflect ©Jacobs 2023 amounts that had not been previously included and conform with the fiscal 2023 amounts presented.
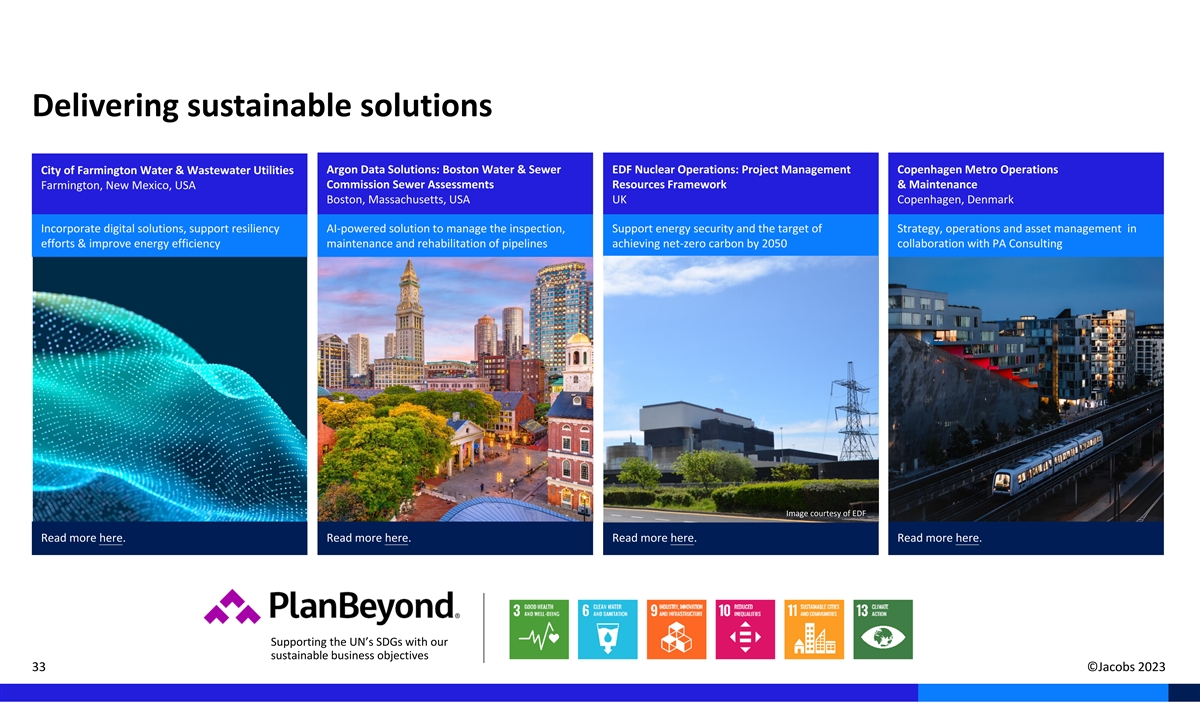
Delivering sustainable solutions Argon Data Solutions: Boston Water & Sewer EDF Nuclear Operations: Project Management Copenhagen Metro Operations City of Farmington Water & Wastewater Utilities Commission Sewer Assessments Resources Framework & Maintenance Farmington, New Mexico, USA Boston, Massachusetts, USA UK Copenhagen, Denmark Incorporate digital solutions, support resiliency AI-powered solution to manage the inspection, Support energy security and the target of Strategy, operations and asset management in efforts & improve energy efficiency maintenance and rehabilitation of pipelines achieving net-zero carbon by 2050 collaboration with PA Consulting Image courtesy of EDF Read more here. Read more here. Read more here. Read more here. Supporting the UN’s SDGs with our sustainable business objectives 33 ©Jacobs 2023

Environmental, Social & Governance (ESG) at Jacobs Aligned with the United Nations Sustainable Development Goals, Jacobs is focused on creating positive social and economic impact while protecting our environment and improving resilience. § Since 2019 we have voluntarily reported on a wide range of sustainability matters § In 2023 we launched our inaugural Sustainability-Linked Bond to through our annual ESG Disclosures. These have been reported in alignment with incorporate sustainability into our financing strategy. the Sustainability Accounting Standards Board framework and informed by § Every year, we invest in and partner with local communities – not only Global Reporting Initiative standards. We also disclose aspects of our where our employees live and work, but globally, collaborating with performance in our Integrated Annual Report, Form 10-K, Proxy Statement and charities and not-for-profit organizations to make a positive impact and live other public materials. our values. § Annually we disclose to CDP, the S&P Global Corporate Sustainability § We are committed to respecting the rights and dignity of individuals within Assessment, and conduct a Climate Risk Assessment in line with the our operations and where we do business. We require our partners and Task Force on Climate-related Financial Disclosures (TCFD). supply chain to uphold the same level of commitment and due diligence to § Our overarching commitments: the human rights standards we hold ourselves accountable to. − Target every project to become a climate response opportunity and/or contribute to the UN Sustainable Development Goals by fiscal 2025 Governance Overview and ESG Documents − Achieve net-zero greenhouse gas emissions across the value chain by 2040 Placed on Dow Jones Sustainability World Index 2022 Received the World Environment Center’s prestigious 2023 Gold Medal Award for International Corporate Achievement in Sustainable Placed on CDP's A List for Climate in 2022 Highlights Development Gold medal in the EcoVadis Sustainability Ratings 2022 Executive Chair of Jacobs Board of Directors and former CEO Steve Demetriou Achieved ISS Prime Status for our ESG corporate rating received the Individual Leadership Award at the Climate Registry’s 2023 Climate Leadership Awards 34 ©Jacobs 2023

Our foundation is strong Purpose To create a more connected, sustainable world. Values We do things right. We challenge the accepted. We aim higher. We live inclusion. Employee Value Jacobs. A world where you can. Statement Where you Where you Where you can do. can be you. can grow. 35
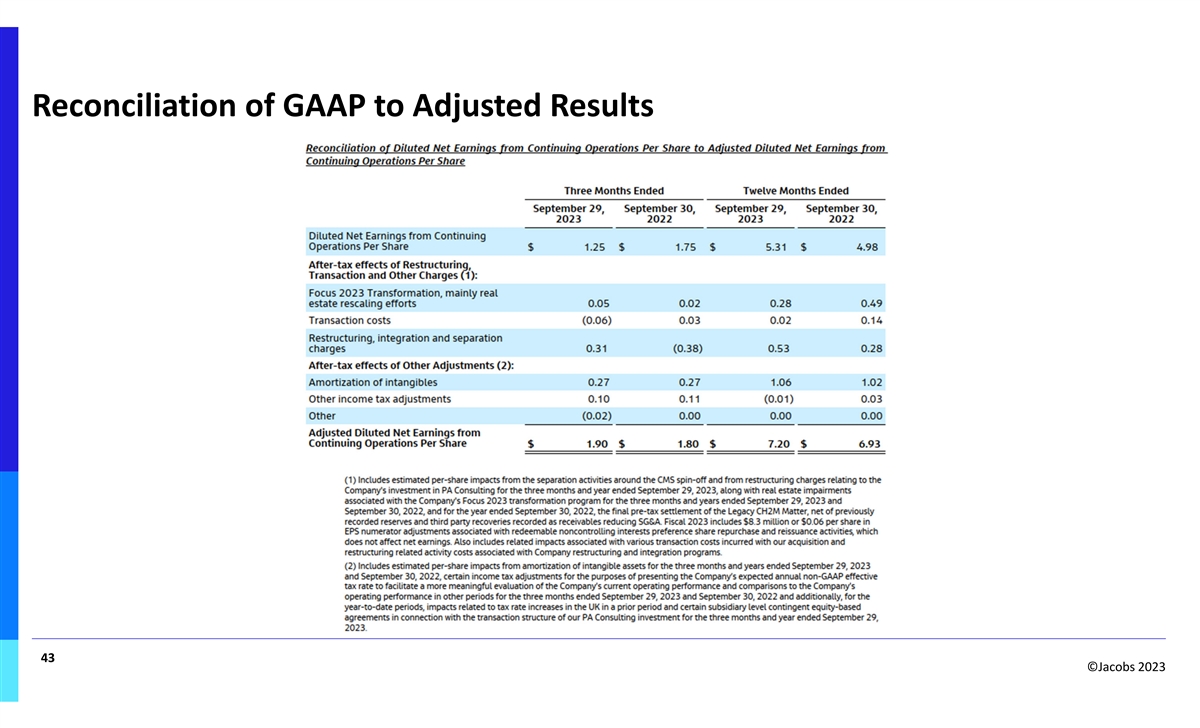
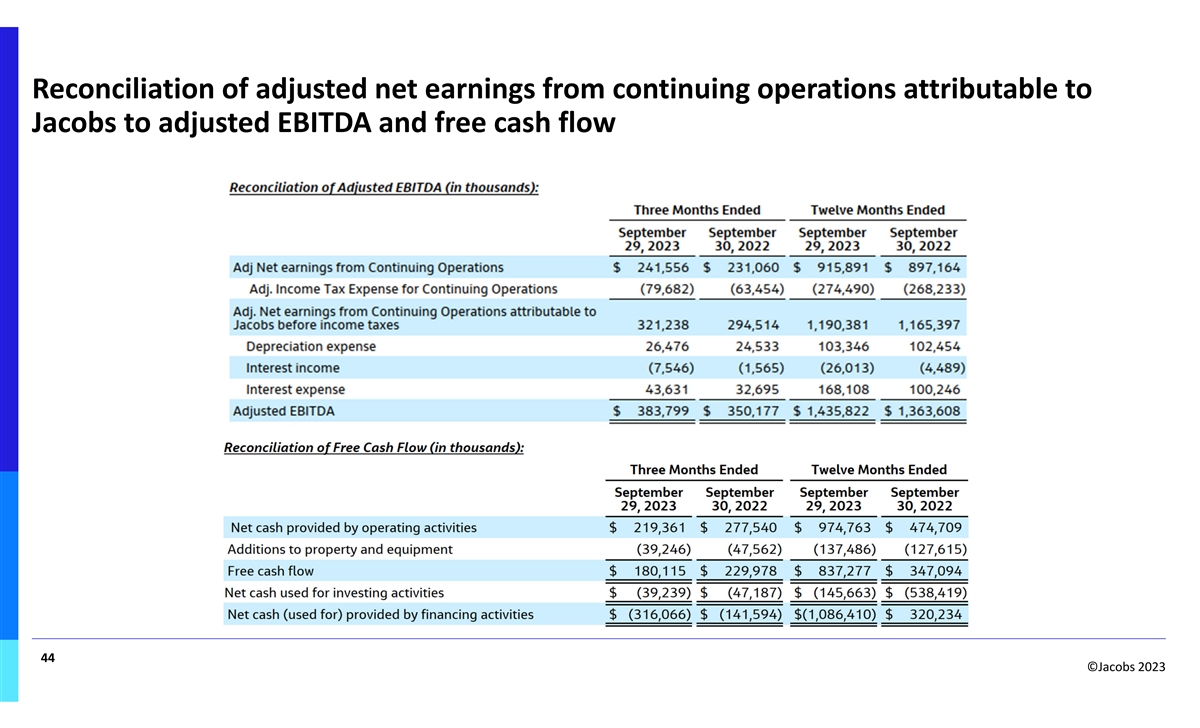
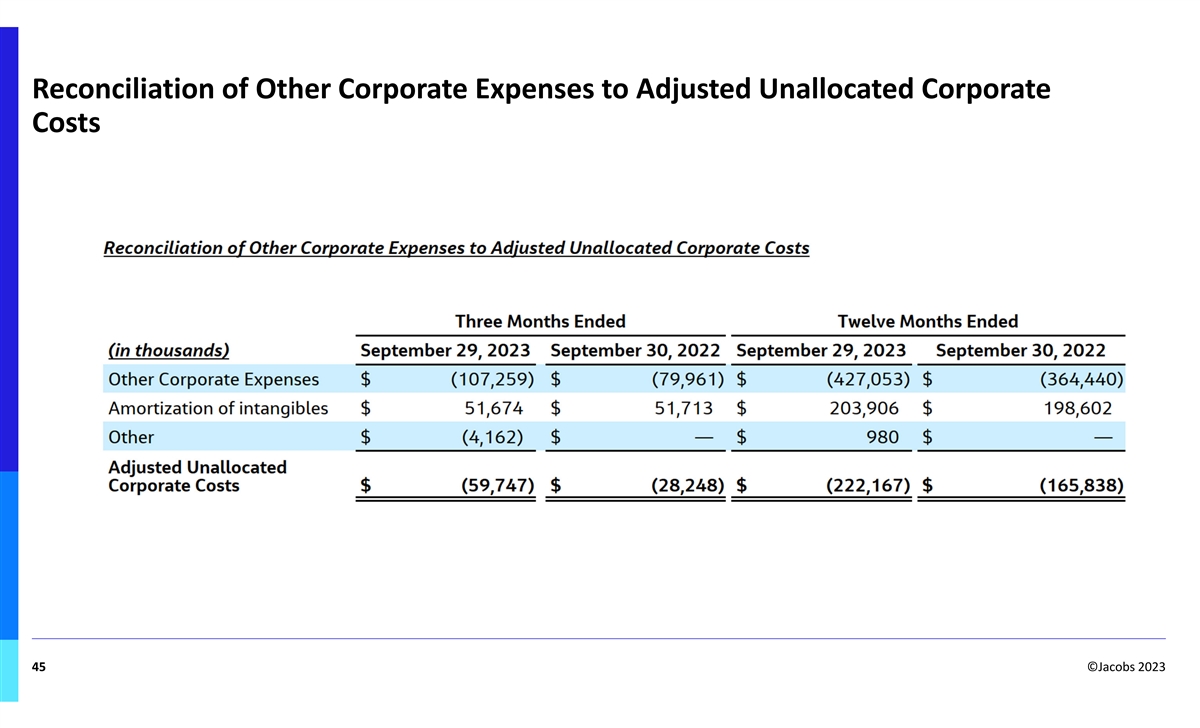
Use of Non-GAAP financial measures and operating metrics (cont.) Adjustments to derive adjusted net earnings from continuing operations and adjusted EPS from continuing operations are calculated on an after-tax basis. Free cash flow is calculated using the reported statement of cash flows, net cash provided by operating activities less additions to property and equipment. Adjusted EBITDA is calculated by adding income tax expense, depreciation expense and adjusted interest expense, and deducting interest income from adjusted net earnings from continuing operations. Cash conversion is the ratio of net cash provided by operating activities to GAAP net earnings from continuing operations. Certain percentage changes are quantified on a constant currency basis, which provides information assuming that foreign currency exchange rates have not changed between the prior and current periods. For purposes of constant currency calculations, we use the prior period average exchange rates as applied to the current period adjusted amounts. We believe that the measures listed above are useful to management, investors and other users of our financial information in evaluating the Company’s operating results and understanding the Company’s operating trends by excluding or adding back the effects of the items described above and below, the inclusion or exclusion of which can obscure underlying trends. Additionally, management uses such measures in its own evaluation of the Company’s performance, particularly when comparing performance to past periods, and believes these measures are useful for investors because they facilitate a comparison of our financial results from period to period. This presentation also contains certain operating metrics which management believes are useful in evaluating the Company's performance. Backlog represents revenue or gross margin, as applicable, we expect to realize for work to be completed by our consolidated subsidiaries and our proportionate share of work to be performed by unconsolidated joint ventures. For more information on how we determine our backlog, see our Backlog Information in our most recent annual report filed with the Securities and Exchange Commission. Book-to-bill ratio is an operational measure representing the ratio of change in backlog revenue, or backlog gross margin, since the prior reporting period plus reported revenue or reported gross margin for the reporting period to the reported revenues or gross margin for the same period. We regularly monitor these operating metrics to evaluate our business, identify trends affecting our business, and make strategic decisions. The Company provides non-GAAP measures to supplement U.S. GAAP measures, as they provide additional insight into the Company’s financial results. However, non-GAAP measures have limitations as analytical tools and should not be considered in isolation and are not in accordance with, or a substitute for, U.S. GAAP measures. In addition, other companies may define non-GAAP measures differently, which limits the ability of investors to compare non-GAAP measures of the Company to those used by our peer companies. The following tables reconcile the components and values of U.S. GAAP earnings from continuing operations before taxes, income taxes from continuing operations, net earnings attributable to Jacobs from continuing operations and Diluted Net Earnings from Continuing Operations Per Share (which we refer to as EPS from continuing operations) to the corresponding adjusted amount and revenue to adjusted net revenue. For the comparable periods presented below, such adjustments consist of amounts incurred in connection with the items described above. Amounts are shown in thousands, except for per-share data (note: earnings per share amounts may not add across due to rounding). 36 ©Jacobs 2023

Use of Non-GAAP financial measures and operating metrics In this presentation, the Company has included certain non-GAAP financial measures as defined in Regulation G promulgated under the Securities Exchange Act of 1934, as amended. These non-GAAP measures are described below. Amounts in the following tables may not add due to rounding. Adjusted Net revenue is calculated excluding pass through revenue of the Company’s People & Places Solutions and Divergent Solutions segments from the Company’s revenue from continuing operations. Pass through revenues are amounts we bill to clients on projects where we are procuring subcontract labor or third-party materials and equipment on behalf of the client. These amounts are considered pass throughs because we receive no or only a minimal mark-up associated with the billed amounts. Adjusted net revenue growth is growth expressed as a percentage of adjusted net revenue from the prior comparable period. We have amended our name and convention for revenue, excluding pass-through costs from “net revenue” to “adjusted net revenue.” Note, this is simply a name change intended to make the non-GAAP nature of this measure more prominent and does not impact measurement. Adjusted earnings from continuing operations before taxes, adjusted income taxes from continuing operations, adjusted net earnings from continuing operations and adjusted EPS from continuing operations are calculated by: 1. Excluding items collectively referred to as Restructuring, Transaction and Other Charges, which include: a. costs and other charges associated with our Focus 2023 transformation initiatives, including activities associated with the re-scaling and repurposing of physical office space, employee separations, contractual termination fees and related expenses, referred to as Focus 2023 Transformation, mainly real estate rescaling efforts ; b. transaction costs and other charges incurred in connection with the acquisitions of BlackLynx and StreetLight and the strategic investment in PA Consulting, including advisor fees, change in control payments, and the impact of the quarterly adjustment to the estimated performance based payout of contingent consideration to the sellers in connection with certain acquisitions; impacts resulting from the EPS numerator adjustment relating to the partial recovery of the PA redeemable non-controlling interests preference share redemption value and similar transaction costs and expenses (collectively referred to as Transaction Costs ); c. recoveries, costs and other charges associated with restructuring activities implemented in connection with our announced plan to separate the CMS business, including advisor fees, involuntary terminations and related costs, the acquisitions of CH2M, BlackLynx, and StreetLight, the strategic investment in PA Consulting, the sale of the ECR business and other related cost reduction initiatives, which included involuntary terminations, costs associated with co-locating offices of acquired companies, separating physical locations of continuing operations, professional services and personnel costs, amounts relating to certain commitments and contingencies relating to discontinued operations of the CH2M business, including the final settlement charges relating to the Legacy CH2M Matter, net of previously recorded reserves and charges associated with the impairment and final closing activities of our AWE ML joint venture (collectively referred to as “Restructuring, integration, separation and other charges ). 2. Excluding items collectively referred to as Other adjustments, which include: a. adding back amortization of intangible assets; b. impact of certain subsidiary level contingent equity-based agreements in connection with the transaction structure of our PA Consulting investment; c. impacts related to tax rate increases in the UK in a prior period; d. certain non-routine income tax adjustments for the purposes of calculating the Company's annual non-GAAP effective tax rate to facilitate a more meaningful evaluation of the Company’s current operating performance and comparisons to the Company's operating performance in other periods. 37 ©Jacobs 2023
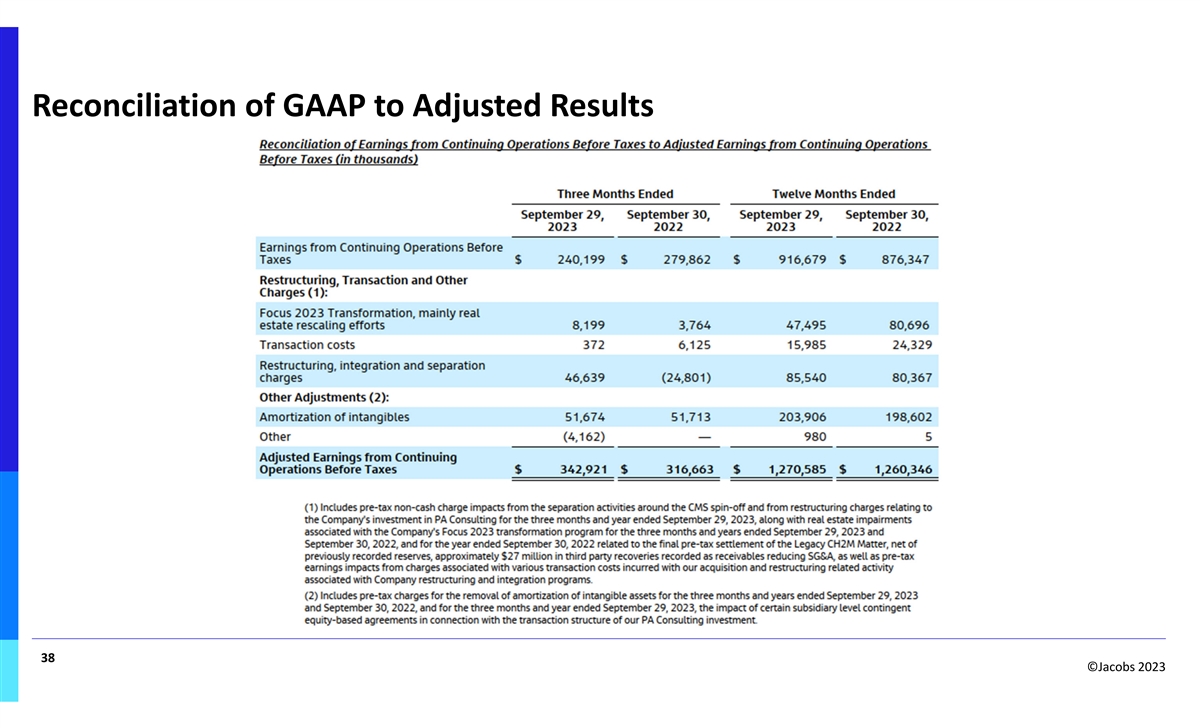
Reconciliation of GAAP to Adjusted Results 38 ©Jacobs 2023
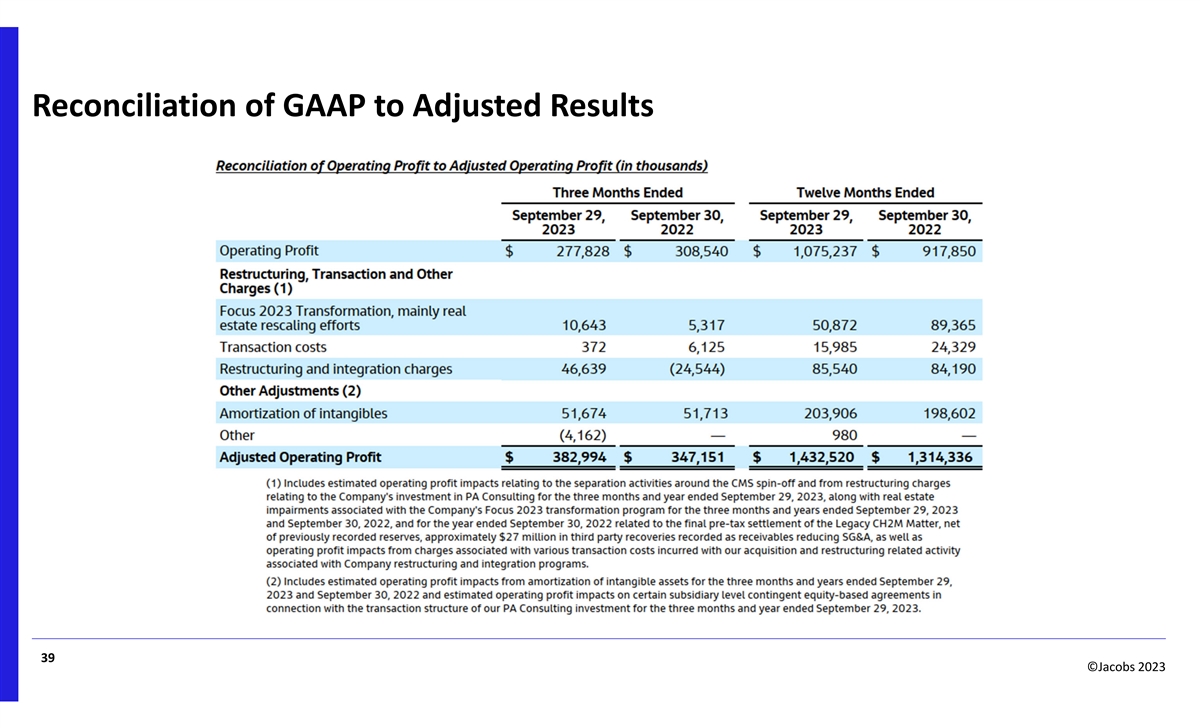
Reconciliation of GAAP to Adjusted Results 39 ©Jacobs 2023

Reconciliation of GAAP to Adjusted Results 40 ©Jacobs 2023

Reconciliation of GAAP to Adjusted Results 41 ©Jacobs 2023
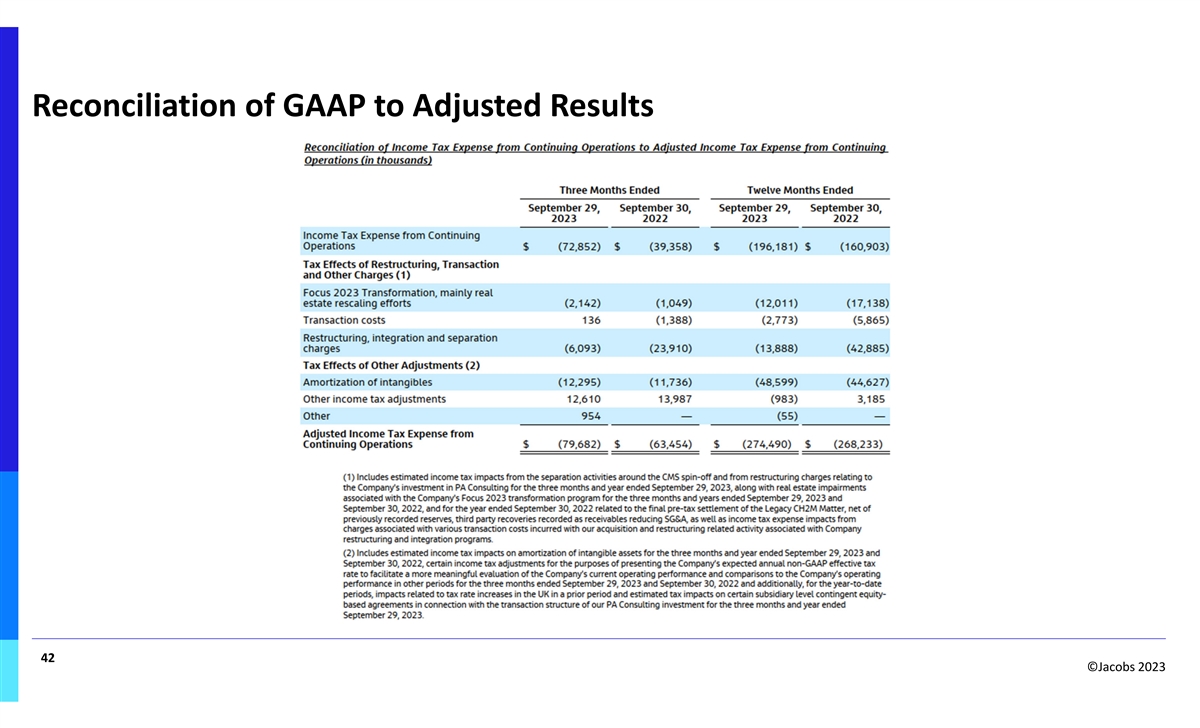
Reconciliation of GAAP to Adjusted Results 42 ©Jacobs 2023
Reconciliation of GAAP to Adjusted Results 43 ©Jacobs 2023
Reconciliation of adjusted net earnings from continuing operations attributable to Jacobs to adjusted EBITDA and free cash flow 44 ©Jacobs 2023
Reconciliation of Other Corporate Expenses to Adjusted Unallocated Corporate Costs 45 ©Jacobs 2023
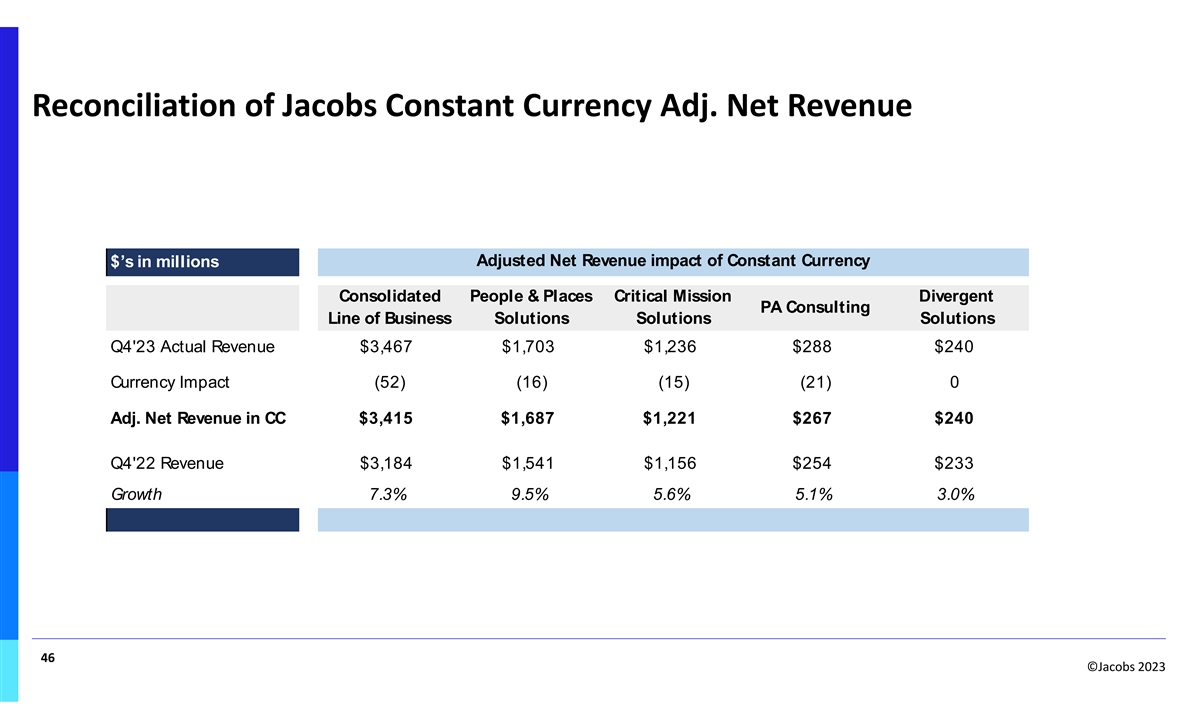
Reconciliation of Jacobs Constant Currency Adj. Net Revenue Adjusted Net Revenue impact of Constant Currency $’s in millions Consolidated People & Places Critical Mission Divergent PA Consulting Line of Business Solutions Solutions Solutions Q4'23 Actual Revenue $3,467 $1,703 $1,236 $288 $240 Currency Impact (52) (16) (15) (21) 0 Adj. Net Revenue in CC $3,415 $1,687 $1,221 $267 $240 Q4'22 Revenue $3,184 $1,541 $1,156 $254 $233 Growth 7.3% 9.5% 5.6% 5.1% 3.0% 46 ©Jacobs 2023
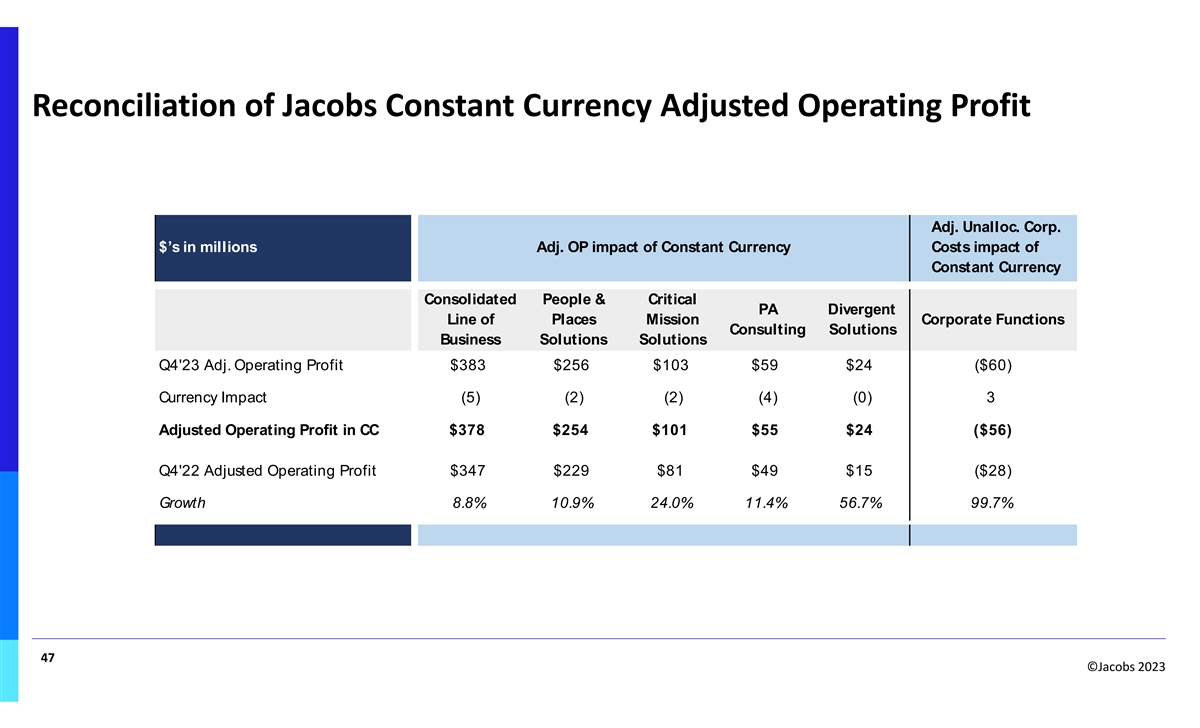
Reconciliation of Jacobs Constant Currency Adjusted Operating Profit Adj. Unalloc. Corp. $’s in millions Adj. OP impact of Constant Currency Costs impact of Constant Currency Consolidated People & Critical PA Divergent Line of Places Mission Corporate Functions Consulting Solutions Business Solutions Solutions Q4'23 Adj. Operating Profit $383 $256 $103 $59 $24 ($60) Currency Impact (5) (2) (2) (4) (0) 3 Adjusted Operating Profit in CC $378 $254 $101 $55 $24 ($56) Q4'22 Adjusted Operating Profit $347 $229 $81 $49 $15 ($28) Growth 8.8% 10.9% 24.0% 11.4% 56.7% 99.7% 47 ©Jacobs 2023
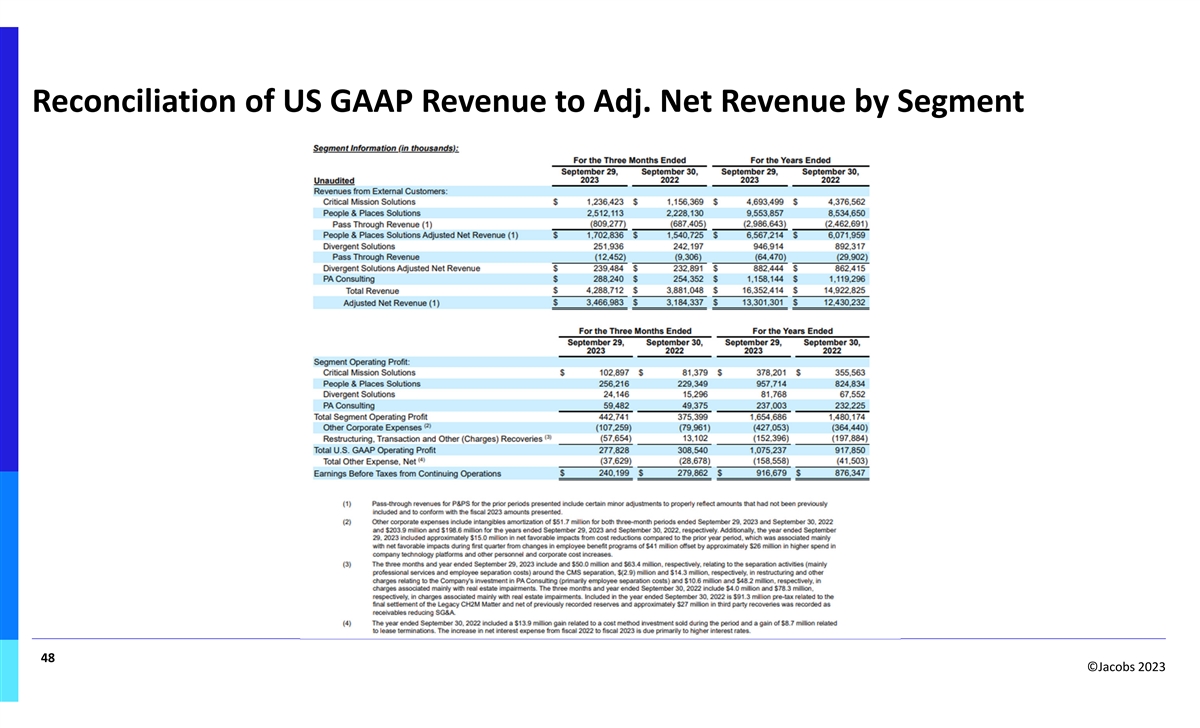
Reconciliation of US GAAP Revenue to Adj. Net Revenue by Segment 48 ©Jacobs 2023
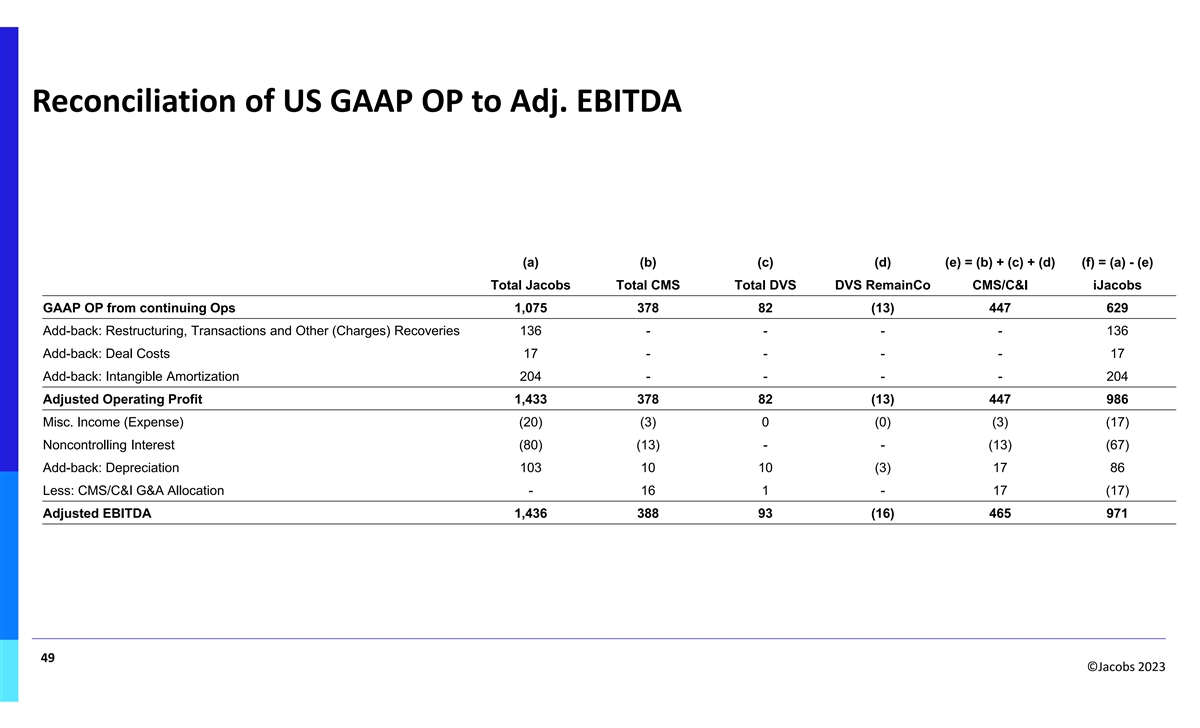
Reconciliation of US GAAP OP to Adj. EBITDA (a) (b) (c) (d) (e) = (b) + (c) + (d) (f) = (a) - (e) Total Jacobs Total CMS Total DVS DVS RemainCo CMS/C&I iJacobs GAAP OP from continuing Ops 1,075 378 82 (13) 447 629 Add-back: Restructuring, Transactions and Other (Charges) Recoveries 136 - - - - 136 Add-back: Deal Costs 17 - - - - 17 Add-back: Intangible Amortization 204 - - - - 204 Adjusted Operating Profit 1,433 378 82 (13) 447 986 Misc. Income (Expense) (20) (3) 0 (0) (3) (17) Noncontrolling Interest (80) (13) - - (13) (67) Add-back: Depreciation 103 10 10 (3) 17 86 Less: CMS/C&I G&A Allocation - 16 1 - 17 (17) Adjusted EBITDA 1,436 388 93 (16) 465 971 49 ©Jacobs 2023
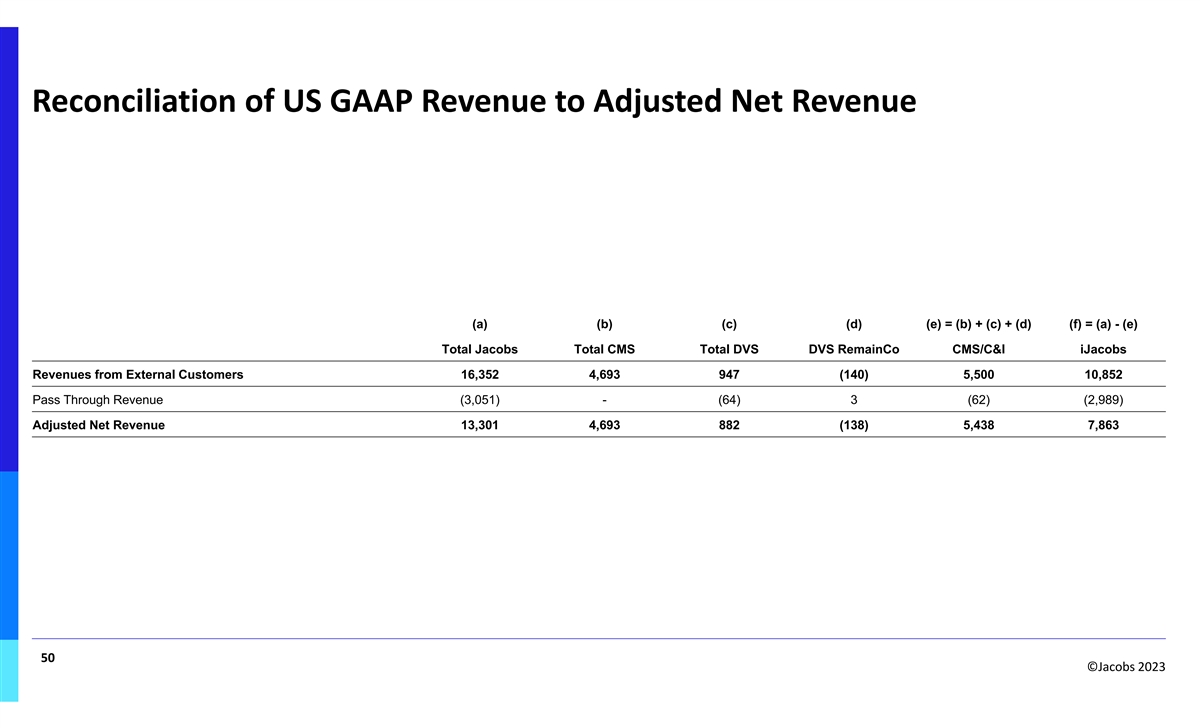
Reconciliation of US GAAP Revenue to Adjusted Net Revenue (a) (b) (c) (d) (e) = (b) + (c) + (d) (f) = (a) - (e) Total Jacobs Total CMS Total DVS DVS RemainCo CMS/C&I iJacobs Revenues from External Customers 16,352 4,693 947 (140) 5,500 10,852 Pass Through Revenue (3,051) - (64) 3 (62) (2,989) Adjusted Net Revenue 13,301 4,693 882 (138) 5,438 7,863 50 ©Jacobs 2023

Copyright notice Important © Copyright Jacobs 2023 . All rights reserved. The content and information contained in this presentation are the property of the Jacobs Group of companies (“Jacobs Group”). Publication, distribution, or reproduction of this presentation in whole or in part without the written permission of Jacobs Group constitutes an infringement of copyright. Jacobs, the Jacobs logo, and all other Jacobs Group trademarks are the property of Jacobs Group. NOTICE: This presentation has been prepared exclusively for the use and benefit of Jacobs Group client. Jacobs Group accepts no liability or responsibility for any use or reliance upon this presentation by any third party. 51 ©Jacobs 2023
