UNITED STATES
SECURITIES AND EXCHANGE COMMISSION
Washington, D.C. 20549
FORM 8-K
CURRENT REPORT
PURSUANT TO SECTION 13 OR 15(D) OF THE
SECURITIES EXCHANGE ACT OF 1934
Date of Report (Date of earliest event reported): May 7, 2025 (May 7, 2025)
Global Medical REIT Inc.
(Exact name of registrant as specified in its charter)
| Maryland | 001-37815 | 46-4757266 |
|
(State or Other Jurisdiction of Incorporation) |
(Commission File Number) |
(I.R.S. Employer Identification No.) |
7373 Wisconsin Avenue, Suite 800
Bethesda, MD
20814
(Address of Principal Executive
Offices)
(Zip Code)
(202) 524-6851
(Registrant’s Telephone Number, Including Area Code)
Not Applicable
(Former name or former address, if changed since last report)
Check the appropriate box below if the Form 8-K filing is intended to simultaneously satisfy the filing obligation of the registrant under any of the following provisions:
| ¨ | Written communications pursuant to Rule 425 under the Securities Act (17 CFR 230.425) |
| ¨ | Soliciting material pursuant to Rule 14a-12 under the Exchange Act (17 CFR 240.14a-12) |
| ¨ | Pre-commencement communications pursuant to Rule 14d-2(b) under the Exchange Act (17 CFR 240.14d-2(b)) |
| ¨ | Pre-commencement communications pursuant to Rule 13e-4(c) under the Exchange Act (17 CFR 240.13e-4(c)) |
Securities registered pursuant to Section 12(b) of the Act:
| Title of each class: | Trading Symbols: | Name of each exchange on which registered: | ||
| Common Stock, par value $0.001 per share | GMRE | NYSE | ||
| Series A Preferred Stock, par value $0.001 per share | GMRE PrA | NYSE |
Indicate by check mark whether the registrant is an emerging growth company as defined in Rule 405 of the Securities Act of 1933 (17 CFR §230.405) or Rule 12b-2 of the Securities Exchange Act of 1934 (17 CFR §240.12b-2).
Emerging growth company ¨
If an emerging growth company, indicate by check mark if the registrant has elected not to use the extended transition period for complying with any new or revised financial accounting standards provided pursuant to Section 13(a) of the Exchange Act. ¨
Item 2.02 Results of Operations and Financial Condition.
On May 7, 2025, Global Medical REIT Inc. (the “Company”) announced its financial position as of March 31, 2025 and operating results for the three months ended March 31, 2025 and other related information (the “Earnings Release”). The Company also posted its First Quarter 2025 Earnings Supplemental (the “Supplemental”) to the Company’s website at www.globalmedicalreit.com. The Earnings Release and Supplemental are furnished as Exhibit 99.1 and Exhibit 99.2, respectively, and are incorporated herein by reference.
The information included in this Item 2.02 of this Current Report on Form 8-K, including the Earnings Release and Supplemental, shall not be deemed “filed” for purposes of Section 18 of the Securities Exchange Act of 1934, as amended (the “Exchange Act”) or otherwise subject to the liabilities of that section, and shall not be incorporated by reference into any filing of the Company under the Securities Act of 1933, as amended, or the Exchange Act, regardless of any general incorporation language in such filing.
Item 9.01 Financial Statements and Exhibits.
(d) Exhibits
| Exhibit No. |
Description | |
| 99.1* | First Quarter 2025 Earnings Release. | |
| 99.2* | First Quarter 2025 Earnings Supplemental. | |
| 104 | Cover Page Interactive Data File (embedded within the Inline XBRL document) |
*Furnished herewith
SIGNATURES
Pursuant to the requirements of the Securities Exchange Act of 1934, the registrant has duly caused this report to be signed on its behalf by the undersigned hereunto duly authorized.
| Global Medical REIT Inc. | ||
| By: | /s/ Jamie A. Barber | |
| Jamie A. Barber | ||
| Secretary and General Counsel | ||
Date: May 7, 2025
Exhibit 99.1

Global Medical REIT Announces First Quarter 2025 Financial Results
– Completes Acquisition of Previously Announced $69.6 Million Five-Property Medical Portfolio –
– Reaffirms Full Year 2025 AFFO Guidance –
Bethesda, MD – May 7, 2025 – (BUSINESS WIRE) – Global Medical REIT Inc. (NYSE: GMRE) (the “Company” or “GMRE”), a net-lease medical real estate investment trust (REIT) that acquires healthcare facilities and leases those facilities to physician groups and regional and national healthcare systems, today announced financial results for the three months ended March 31, 2025 and other data.
Jeffrey M. Busch, Chairman, Chief Executive Officer and President stated, “During the first quarter, we continued to deliver steady results supported by the high quality of our portfolio and stability of our tenant base. I’m pleased to announce we have completed the acquisition of the five-property portfolio we announced in the fourth quarter of last year. These properties are a great strategic fit to our existing portfolio given (i) the procedural-based nature of the tenants’ specialties (including cardiology, gastroenterology, imaging and oncology tenants) and the close proximity of the buildings to hospital campuses, each of which promotes tenant retention, and (ii) that almost 70% of the leases are triple-net leases. We utilized our deep relationships in the industry to win the bidding for this portfolio at an attractive cap rate of 9.0%, which further demonstrates our ability to acquire properties in a higher cost of capital environment. I am extremely proud of this acquisition and, with our strong liquidity position, we will continue to actively monitor the transaction market for acquisition opportunities that meet our disciplined investment criteria. As I transition from my role as CEO, I would like to express my appreciation to the entire GMRE family for their dedication and contributions to our shared success.”
First Quarter 2025 and Other Highlights
| · | Net income attributable to common stockholders was $2.1 million, or $0.03 per diluted share, as compared to $0.8 million, or $0.01 per diluted share, in the comparable prior year period. |
| · | Funds from operations attributable to common stockholders and noncontrolling interest (“FFO”) of $14.8 million, or $0.20 per share and unit, as compared to $14.9 million, or $0.21 per share and unit, in the comparable prior year period. |
| · | Adjusted funds from operations attributable to common stockholders and noncontrolling interest (“AFFO”) of $16.0 million, or $0.22 per share and unit, as compared to $16.5 million, or $0.23 per share and unit, in the comparable prior year period. |
| · | Completed the acquisition of the previously announced five-property portfolio of medical real estate for a purchase price of $69.6 million encompassing an aggregate of 486,598 leasable square feet with aggregate annualized base rent of $6.3 million. Three of the properties closed in February 2025 and the remaining two properties closed in April 2025. |
| · | Completed the disposition of two medical facilities during the quarter, receiving aggregate gross proceeds of $8.2 million, resulting in an aggregate gain of $1.4 million. At the dates of disposition, one facility was occupied and one facility was vacant. The cap rate on the sale of the occupied facility was 6.7%. |
| · | Portfolio leased occupancy was 95.6% at March 31, 2025. |
|
|
Financial Results
Rental revenue for the first quarter of 2025 decreased 1.4% year-over-year to $34.6 million. Total expenses for the first quarter were $32.2 million, compared to $32.8 million for the comparable prior year period.
General and administrative expenses for the first quarter were $3.6 million, compared to $4.4 million for the comparable prior year period. This decrease primarily resulted from a reduction in non-cash LTIP compensation expense resulting from the required accounting treatment of unvested LTIP units held by Mr. Busch, pursuant to the terms of his Transition and Separation Agreement and General Release of Claims, dated January 8, 2025.
Interest expense for the first quarter was $7.2 million, compared to $6.9 million for the comparable prior year period. The increase was primarily due to higher average borrowings, partially offset by lower interest rates, during the first quarter of 2025, compared to the prior year period.
Net income attributable to common stockholders for the first quarter totaled $2.1 million, or $0.03 per diluted share, compared to $0.8 million, or $0.01 per diluted share, in the comparable prior year period.
The Company reported FFO of $14.8 million, or $0.20 per share and unit, and AFFO of $16.0 million, or $0.22 per share and unit, for the first quarter of 2025, compared to FFO of $14.9 million, or $0.21 per share and unit, and AFFO of $16.5 million, or $0.23 per share and unit, in the comparable prior year period.
Investment Activity
As previously announced, in October 2024, the Company entered into a purchase agreement to acquire a five-property portfolio of medical real estate for an aggregate purchase price of $69.6 million at a cap rate of 9.0%. In February 2025, the Company completed the acquisition of three of the five properties encompassing an aggregate of 188,874 leasable square feet for an aggregate purchase price of $31.5 million with aggregate annualized base rent of $2.7 million.
In April 2025, the Company completed the acquisition of the remaining two properties in the five-property portfolio encompassing an aggregate of 297,724 leasable square feet for an aggregate purchase price of $38.1 million with aggregate annualized base rent of $3.6 million. In total the five-property portfolio had a purchase price of $69.6 million with 486,598 leasable square feet and annualized base rent of $6.3 million.
During the quarter the Company completed the disposition of two medical facilities, receiving aggregate gross proceeds of $8.2 million, resulting in an aggregate gain of $1.4 million. At the dates of disposition, one facility was occupied and one facility was vacant. The cap rate on the sale of the occupied facility was 6.7%.
|
|
Portfolio Update
As of March 31, 2025, the Company’s portfolio was 95.6% occupied and comprised of 4.9 million leasable square feet with an annualized base rent of $113.4 million. As of March 31, 2025, the weighted average lease term for the Company’s portfolio was 5.6 years with weighted average annual rent escalations of 2.2%, and the Company’s portfolio rent coverage ratio was 4.4 times.
On January 11, 2025, the Company’s tenant, Prospect Medical Group (“Prospect”), filed for Chapter 11 bankruptcy reorganization. As of January 11, 2025, Prospect owed the Company approximately $2.4 million related to leases at three of the Company’s healthcare facilities, including $2.2 million related to the Company’s facility in East Orange, New Jersey. As of March 31, 2025, the Company and Prospect entered into a Stipulation and Agreed Order (the “Order”) with the bankruptcy courts whereby Prospect rejected its lease at the Company’s East Orange, New Jersey facility (allowing the Company to begin working directly with subtenants to enter into new direct leases with them and begin marketing the remainder of the facility for lease) and the Company agreed to waive all post-petition amounts due for the month of March 2025. Pursuant to the Order, as of May 6, 2025, Prospect has paid the Company $250 thousand, representing all post-petition amounts due through February 28, 2025, at this facility.
As of May 6, 2025, Prospect had not decided if it was going to accept or reject its remaining leases with the Company.
Balance Sheet and Capital
At March 31, 2025, total debt outstanding, including outstanding borrowings on the credit facility and notes payable (both net of unamortized debt issuance costs), was $677.0 million and the Company’s leverage was 46.1%. As of March 31, 2025, the Company’s total debt carried a weighted average interest rate of 3.84% and a weighted average remaining term of 1.8 years.
As of May 6, 2025, the Company’s borrowing capacity under the credit facility was $187 million.
The Company did not issue any shares of common stock under its ATM program during the first quarter of 2025 or from April 1, 2025 through May 6, 2025.
Dividends
As previously announced, on February 26, 2025, the Board of Directors (the “Board”) declared a $0.21 per share cash dividend to common stockholders and unitholders of record as of March 21, 2025, which was paid on April 9, 2025, representing the Company’s first quarter 2025 dividend payment.
|
|
Additionally, on February 26, 2025, the Board declared a $0.46875 per share cash dividend to holders of record as of April 15, 2025, of the Company’s Series A Preferred Stock, which was paid on April 30, 2025. This dividend represents the Company’s quarterly dividend on its Series A Preferred Stock for the period from January 31, 2025 through April 29, 2025.
2025 Guidance
The Company is reaffirming its full year 2025 AFFO per share and unit guidance of $0.89 to $0.93. Guidance is based on the following primary assumptions and other factors:
| · | No additional acquisitions or dispositions other than activity that has been either completed or announced. |
| · | No additional equity or debt issuances other than normal course Revolver borrowing/repayments. |
| · | AFFO guidance excludes one-time obligations related to the CEO succession plan. |
The Company’s 2025 guidance is based on the above and additional assumptions that are subject to change many of which are outside of the Company’s control. There can be no assurance that the Company’s actual results will not be materially different than these expectations. If actual results vary from these assumptions, the Company’s expectations may change.
AFFO is a non-GAAP financial measure. The Company does not provide a reconciliation of such forward-looking non-GAAP measure to the most directly comparable financial measure calculated and presented in accordance with GAAP because certain information required for such reconciliation is not available without unreasonable efforts due to the difficulty of projecting event-driven transactional and other non-core operating items in any future period. The magnitude of these items, however, may be significant.
SUPPLEMENTAL INFORMATION
Details regarding these results can be found in the Company’s supplemental financial package available on the Investor Relations section of the Company’s website at http://investors.globalmedicalreit.com/.
CONFERENCE CALL AND WEBCAST INFORMATION
The Company will host a live webcast and conference call on Thursday, May 8, 2025 at 9:00 a.m. Eastern Time. The webcast is located on the “Investor Relations” section of the Company’s website at http://investors.globalmedicalreit.com/.
To Participate via Telephone:
Dial in at least five minutes prior to start time and reference Global Medical REIT Inc.
Domestic: 1-877-704-4453
International: 1-201-389-0920
Replay:
An audio replay of the conference call will be posted on the Company’s website.
|
|
NON-GAAP FINANCIAL MEASURES
General
Management considers certain non-GAAP financial measures to be useful supplemental measures of the Company's operating performance. For the Company, non-GAAP measures consist of Funds From Operations attributable to common stockholders and noncontrolling interest (“FFO”) and Adjusted Funds From Operations attributable to common stockholders and noncontrolling interest (“AFFO”) and Earnings Before Interest, Taxes, Depreciation and Amortization for Real Estate (“EBITDAre” and “Adjusted EBITDAre”). A non-GAAP financial measure is generally defined as one that purports to measure financial performance, financial position or cash flows, but excludes or includes amounts that would not be so adjusted in the most comparable measure determined in accordance with GAAP. The Company reports non-GAAP financial measures because these measures are observed by management to also be among the most predominant measures used by the REIT industry and by industry analysts to evaluate REITs. For these reasons, management deems it appropriate to disclose and discuss these non-GAAP financial measures.
The non-GAAP financial measures presented herein are not necessarily identical to those presented by other real estate companies due to the fact that not all real estate companies use the same definitions. These measures should not be considered as alternatives to net income, as indicators of the Company's financial performance, or as alternatives to cash flow from operating activities as measures of the Company's liquidity, nor are these measures necessarily indicative of sufficient cash flow to fund all of the Company's needs. Management believes that in order to facilitate a clear understanding of the Company's historical consolidated operating results, these measures should be examined in conjunction with net income and cash flows from operations as presented elsewhere herein.
FFO and AFFO
FFO and AFFO are non-GAAP financial measures within the meaning of the rules of the United States Securities and Exchange Commission (“SEC”). The Company considers FFO and AFFO to be important supplemental measures of its operating performance and believes FFO is frequently used by securities analysts, investors, and other interested parties in the evaluation of REITs, many of which present FFO when reporting their results. In accordance with the National Association of Real Estate Investment Trusts’ (“NAREIT”) definition, FFO means net income or loss computed in accordance with GAAP before noncontrolling interests of holders of OP units and LTIP units, excluding gains (or losses) from sales of property and extraordinary items, property impairment losses, less preferred stock dividends, plus real estate-related depreciation and amortization (excluding amortization of debt issuance costs and the amortization of above and below market leases), and after adjustments for unconsolidated partnerships and joint ventures calculated to reflect FFO on the same basis. Because FFO excludes real estate-related depreciation and amortization (other than amortization of debt issuance costs and above and below market lease amortization expense), the Company believes that FFO provides a performance measure that, when compared period-over-period, reflects the impact to operations from trends in occupancy rates, rental rates, operating costs, development activities and interest costs, providing perspective not immediately apparent from the closest GAAP measurement, net income or loss.
|
|
AFFO is a non-GAAP measure used by many investors and analysts to measure a real estate company’s operating performance by removing the effect of items that do not reflect ongoing property operations. Management calculates AFFO by modifying the NAREIT computation of FFO by adjusting it for certain cash and non-cash items and certain recurring and non-recurring items. For the Company these items include: (a) recurring acquisition and disposition costs, (b) loss on the extinguishment of debt, (c) recurring straight line deferred rental revenue, (d) recurring stock-based compensation expense, (e) recurring amortization of above and below market leases, (f) recurring amortization of debt issuance costs, (g) severance and transition related expense and (h) other items related to unconsolidated partnerships and joint ventures.
Management believes that reporting AFFO in addition to FFO is a useful supplemental measure for the investment community to use when evaluating the operating performance of the Company on a comparative basis.
EBITDAre and Adjusted EBITDAre
We calculate EBITDAre in accordance with standards established by NAREIT and define EBITDAre as net income or loss computed in accordance with GAAP plus depreciation and amortization, interest expense, gain or loss on the sale of investment properties, property impairment losses, and adjustments for unconsolidated partnerships and joint ventures to reflect EBITDAre on the same basis, as applicable.
We define Adjusted EBITDAre as EBITDAre plus loss on extinguishment of debt, non-cash stock compensation expense, non-cash intangible amortization related to above and below market leases, severance and transition related expense, transaction expense, adjustments related to our investments in unconsolidated joint ventures, and other normalizing items. Management considers EBITDAre and Adjusted EBITDAre important measures because they provide additional information to allow management, investors, and our current and potential creditors to evaluate and compare our core operating results and our ability to service debt.
RENT COVERAGE RATIO
For purposes of calculating our portfolio weighted-average EBITDARM coverage ratio (“Rent Coverage Ratio”), we excluded credit-rated tenants or their subsidiaries for which financial statements were either not available or not sufficiently detailed. These ratios are based on the latest available information only. Most tenant financial statements are unaudited and we have not independently verified any tenant financial information (audited or unaudited) and, therefore, we cannot assure you that such information is accurate or complete. Certain other tenants (approximately 21% of our portfolio) are excluded from the calculation due to (i) lack of available financial information or (ii) small tenant size. Additionally, included within 21% of non-reporting tenants is Pipeline Healthcare, LLC, which (i) was sold to Heights Healthcare in October 2023 and is being operated under new management and (ii) occupies our only acute-care hospital asset, which is not one of our core asset classes. Additionally, our Rent Coverage Ratio adds back physician distributions and compensation. Management believes all adjustments are reasonable and necessary.
|
|
ANNUALIZED BASE RENT
Annualized base rent represents monthly base rent for March 2025 (or, for recent acquisitions, monthly base rent for the month of acquisition), multiplied by 12 (or base rent net of annualized expenses for properties with gross leases). Accordingly, this methodology produces an annualized amount as of a point in time but does not take into account future (i) contractual rental rate increases, (ii) leasing activity or (iii) lease expirations. Additionally, leases that are accounted for on a cash-collected basis or that are in a free rent period are not included in annualized base rent.
CAPITALIZATION RATE
The capitalization rate (“cap rate”) for an acquisition is calculated by dividing current Annualized Base Rent by contractual purchase price. For the portfolio cap rate, certain adjustments, including for subsequent capital invested, are made to the contractual purchase price.
FORWARD-LOOKING STATEMENTS
Certain statements contained herein may be considered “forward-looking statements” within the meaning of the Private Securities Litigation Reform Act of 1995, and it is the Company’s intent that any such statements be protected by the safe harbor created thereby. These forward-looking statements are identified by their use of terms and phrases such as "anticipate," "believe," "could," "estimate," "expect," "intend," "may," "should," "plan," "predict," "project," "will," "continue" and other similar terms and phrases, including references to assumptions and forecasts of future results. Except for historical information, the statements set forth herein including, but not limited to, any statements regarding our earnings, our liquidity, our tenants’ ability to pay rent to us, expected financial performance (including future cash flows associated with our joint venture or new tenants or the expansion of current properties), 2025 AFFO guidance, future dividends or other financial items; any other statements concerning our plans, strategies, objectives and expectations for future operations and future portfolio occupancy rates, our pipeline of acquisition opportunities and expected acquisition activity, including the timing and/or successful completion of any acquisitions and expected rent receipts on these properties, our expected disposition activity, including the timing and/or successful completion of any dispositions and the expected use of proceeds therefrom, and any statements regarding future economic conditions or performance are forward-looking statements. These forward-looking statements are based on our current expectations, estimates and assumptions and are subject to certain risks and uncertainties. Although the Company believes that the expectations, estimates and assumptions reflected in its forward-looking statements are reasonable, actual results could differ materially from those projected or assumed in any of the Company’s forward-looking statements. Additional information concerning us and our business, including additional factors that could materially and adversely affect our financial results, include, without limitation, the risks described under Part I, Item 1A - Risk Factors, in our Annual Report on Form 10-K, our Quarterly Reports on Form 10-Q, and in our other filings with the SEC. You are cautioned not to place undue reliance on forward-looking statements. The Company does not intend, and undertakes no obligation, to update any forward-looking statement.
Investor Relations Contact:
Stephen Swett
stephen.swett@icrinc.com
203.682.8377
|
|
GLOBAL MEDICAL REIT INC.
Condensed Consolidated Balance Sheets
(unaudited, and in thousands, except par values)
| As of | ||||||||
| March 31, 2025 |
December 31, 2024 |
|||||||
| Assets | ||||||||
| Investment in real estate: | ||||||||
| Land | $ | 173,293 | $ | 174,300 | ||||
| Building | 1,064,782 | 1,044,019 | ||||||
| Site improvements | 24,266 | 23,973 | ||||||
| Tenant improvements | 75,023 | 69,679 | ||||||
| Acquired lease intangible assets | 141,828 | 138,945 | ||||||
| 1,479,192 | 1,450,916 | |||||||
| Less: accumulated depreciation and amortization | (301,190 | ) | (288,921 | ) | ||||
| Investment in real estate, net | 1,178,002 | 1,161,995 | ||||||
| Cash and cash equivalents | 5,412 | 6,815 | ||||||
| Restricted cash | 2,176 | 2,127 | ||||||
| Tenant receivables, net | 8,104 | 7,424 | ||||||
| Due from related parties | 420 | 270 | ||||||
| Escrow deposits | 915 | 711 | ||||||
| Deferred assets | 28,251 | 28,208 | ||||||
| Derivative asset | 13,713 | 18,613 | ||||||
| Goodwill | 5,903 | 5,903 | ||||||
| Investment in unconsolidated joint venture | 1,992 | 2,066 | ||||||
| Other assets | 24,667 | 22,354 | ||||||
| Total assets | $ | 1,269,555 | $ | 1,256,486 | ||||
| Liabilities and Equity | ||||||||
| Liabilities: | ||||||||
| Credit Facility, net of unamortized debt issuance costs of $4,318 and $4,868 at March 31, 2025 and December 31, 2024, respectively | $ | 662,782 | $ | 631,732 | ||||
| Notes payable, net of unamortized debt issuance costs of $13 and $22 at March 31, 2025 and December 31, 2024, respectively | 14,248 | 14,399 | ||||||
| Accounts payable and accrued expenses | 14,519 | 16,468 | ||||||
| Dividends payable | 16,597 | 16,520 | ||||||
| Security deposits | 3,374 | 3,324 | ||||||
| Other liabilities | 16,030 | 14,191 | ||||||
| Acquired lease intangible liability, net | 3,902 | 3,936 | ||||||
| Total liabilities | 731,452 | 700,570 | ||||||
| Commitments and Contingencies | ||||||||
| Equity: | ||||||||
| Preferred stock, $0.001 par value, 10,000 shares authorized; 3,105 issued and outstanding at March 31, 2025 and December 31, 2024, respectively (liquidation preference of $77,625 at March 31, 2025 and December 31, 2024, respectively) | 74,959 | 74,959 | ||||||
| Common stock, $0.001 par value, 500,000 shares authorized; 66,879 shares and 66,871 shares issued and outstanding at March 31, 2025 and December 31, 2024, respectively | 67 | 67 | ||||||
| Additional paid-in capital | 734,290 | 734,223 | ||||||
| Accumulated deficit | (305,677 | ) | (293,736 | ) | ||||
| Accumulated other comprehensive income | 13,713 | 18,613 | ||||||
| Total Global Medical REIT Inc. stockholders' equity | 517,352 | 534,126 | ||||||
| Noncontrolling interest | 20,751 | 21,790 | ||||||
| Total equity | 538,103 | 555,916 | ||||||
| Total liabilities and equity | $ | 1,269,555 | $ | 1,256,486 | ||||
|
|
GLOBAL MEDICAL REIT INC.
Condensed Consolidated Statements of Operations
(unaudited, and in thousands, except per share amounts)
| Three Months
Ended March 31, |
||||||||
| 2025 | 2024 | |||||||
| Revenue | ||||||||
| Rental revenue | $ | 34,595 | $ | 35,069 | ||||
| Other income | 23 | 49 | ||||||
| Total revenue | 34,618 | 35,118 | ||||||
| Expenses | ||||||||
| General and administrative | 3,620 | 4,446 | ||||||
| Operating expenses | 7,585 | 7,384 | ||||||
| Depreciation expense | 10,307 | 10,113 | ||||||
| Amortization expense | 3,520 | 3,971 | ||||||
| Interest expense | 7,167 | 6,890 | ||||||
| Total expenses | 32,199 | 32,804 | ||||||
| Income before other income (expense) | 2,419 | 2,314 | ||||||
| Gain on sale of investment properties | 1,358 | — | ||||||
| Equity loss from unconsolidated joint venture | (40 | ) | — | |||||
| Net income | $ | 3,737 | $ | 2,314 | ||||
| Less: Preferred stock dividends | (1,455 | ) | (1,455 | ) | ||||
| Less: Net income attributable to noncontrolling interest | (178 | ) | (65 | ) | ||||
| Net income attributable to common stockholders | $ | 2,104 | $ | 794 | ||||
| Net income attributable to common stockholders per share – basic and diluted | $ | 0.03 | $ | 0.01 | ||||
| Weighted average shares outstanding – basic and diluted | 66,873 | 65,573 | ||||||
|
|
Global Medical REIT Inc.
Reconciliation of Net Income to FFO and AFFO
(unaudited, and in thousands, except per share and unit amounts)
| Three Months Ended March 31, |
||||||||
| 2025 | 2024 | |||||||
| Net income | $ | 3,737 | $ | 2,314 | ||||
| Less: Preferred stock dividends | (1,455 | ) | (1,455 | ) | ||||
| Depreciation and amortization expense | 13,806 | 14,024 | ||||||
| Depreciation and amortization expense from unconsolidated joint venture | 49 | — | ||||||
| Gain on sale of investment properties | (1,358 | ) | — | |||||
| FFO attributable to common stockholders and noncontrolling interest | $ | 14,779 | $ | 14,883 | ||||
| Amortization of above market leases, net | 452 | 251 | ||||||
| Straight line deferred rental revenue | (57 | ) | (400 | ) | ||||
| Stock-based compensation expense | 151 | 1,233 | ||||||
| Amortization of debt issuance costs and other | 559 | 562 | ||||||
| Severance and transition related expense | 104 | — | ||||||
| Other adjustments from unconsolidated joint venture | 31 | — | ||||||
| AFFO attributable to common stockholders and noncontrolling interest | $ | 16,019 | $ | 16,529 | ||||
| Net income attributable to common stockholders per share – basic and diluted | $ | 0.03 | $ | 0.01 | ||||
| FFO attributable to common stockholders and noncontrolling interest per share and unit | $ | 0.20 | $ | 0.21 | ||||
| AFFO attributable to common stockholders and noncontrolling interest per share and unit | $ | 0.22 | $ | 0.23 | ||||
| Weighted Average Shares and Units Outstanding – basic and diluted | 72,375 | 70,757 | ||||||
| Weighted Average Shares and Units Outstanding: | ||||||||
| Weighted Average Common Shares | 66,873 | 65,573 | ||||||
| Weighted Average OP Units | 2,244 | 2,244 | ||||||
| Weighted Average LTIP Units | 3,258 | 2,940 | ||||||
| Weighted Average Shares and Units Outstanding – basic and diluted | 72,375 | 70,757 | ||||||
|
|
Global Medical REIT Inc.
Reconciliation of Net Income to EBITDAre and Adjusted EBITDAre
(unaudited, and in thousands)
| Three Months Ended March 31, |
||||||||
| 2025 | 2024 | |||||||
| Net income | $ | 3,737 | $ | 2,314 | ||||
| Interest expense | 7,167 | 6,890 | ||||||
| Depreciation and amortization expense | 13,827 | 14,084 | ||||||
| Unconsolidated joint venture EBITDAre adjustments (1) | 85 | — | ||||||
| Gain on sale of investment properties | (1,358 | ) | — | |||||
| EBITDAre | $ | 23,458 | $ | 23,288 | ||||
| Stock-based compensation expense | 151 | 1,233 | ||||||
| Amortization of above market leases, net | 452 | 251 | ||||||
| Severance and transition related expense | 104 | — | ||||||
| Interest rate swap mark-to-market at unconsolidated joint venture | 35 | — | ||||||
| Adjusted EBITDAre | $ | 24,200 | $ | 24,772 | ||||
| (1) | Includes joint venture interest, depreciation and amortization and gain on sale of investment properties, if applicable, included in joint venture net income or loss. |
|
|
Exhibit 99.2

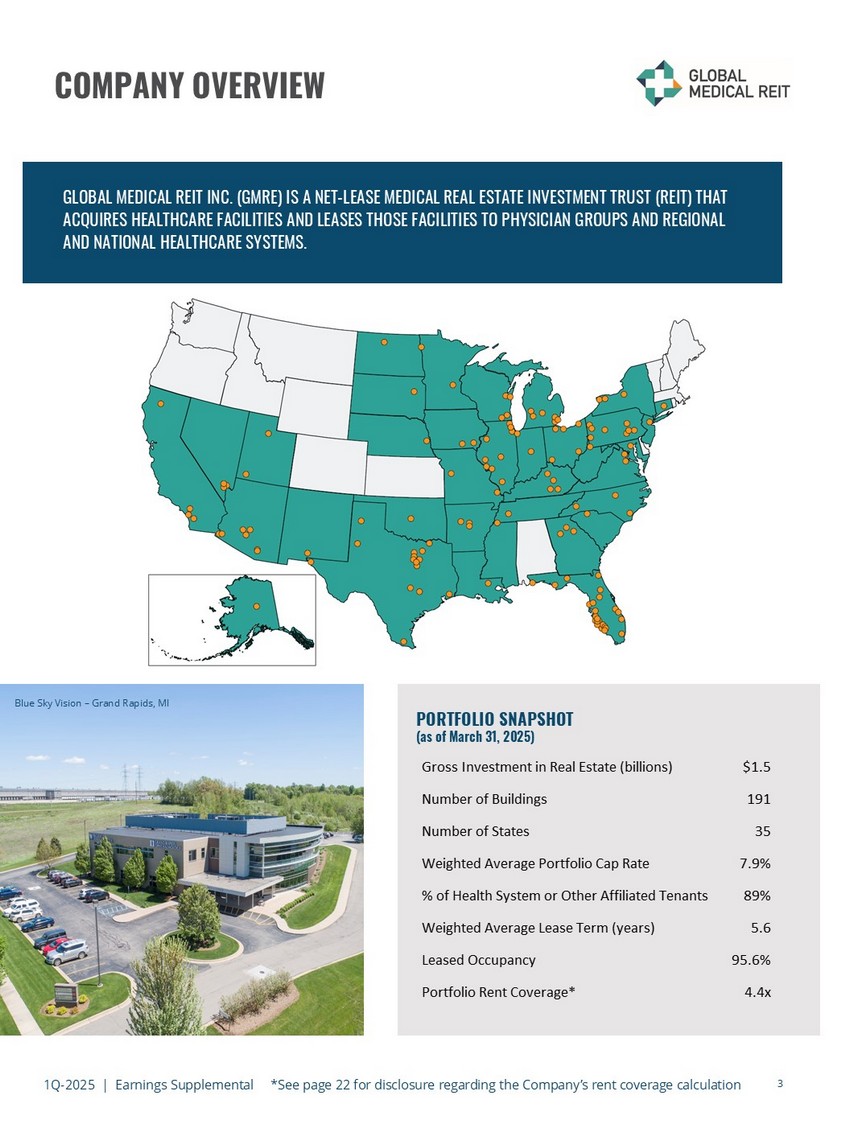
FIRST QUARTER 2025 EARNINGS SUPPLEMENTAL www.globalmedicalreit.com NYSE: GMRE Atrium Health – Winston - Salem, NC Forward - Looking Statements Certain statements contained herein may be considered “forward - looking statements” within the meaning of the Private Securities Litigation Reform Act of 1995 , and it is the Company’s intent that any such statements be protected by the safe harbor created thereby . These forward - looking statements are identified by their use of terms and phrases such as "anticipate," "believe," "could," "estimate," "expect," "intend," "may," "should," "plan," "predict," "project," "will," "continue" and other similar terms and phrases, including references to assumptions and forecasts of future results . Except for historical information, the statements set forth herein including, but not limited to, any statements regarding our earnings, our liquidity, our tenants’ ability to pay rent to us, expected financial performance (including future cash flows associated with our joint venture, new tenants or the expansion of current properties), future dividends or other financial items ; any other statements concerning our plans, strategies, objectives and expectations for future operations and future portfolio occupancy rates, our pipeline of acquisition opportunities and expected acquisition activity, including the timing and/or successful completion of any acquisitions and expected rent receipts on these properties, our expected disposition activity, including the timing and/or successful completion of any dispositions and the expected use of proceeds therefrom, and any statements regarding future economic conditions or performance are forward - looking statements . These forward - looking statements are based on our current expectations, estimates and assumptions and are subject to certain risks and uncertainties . Although the Company believes that the expectations, estimates and assumptions reflected in its forward - looking statements are reasonable, actual results could differ materially from those projected or assumed in any of the Company’s forward - looking statements . Additional information concerning us and our business, including additional factors that could materially and adversely affect our financial results, include, without limitation, the risks described under Part I, Item 1 A - Risk Factors, in our Annual Report on Form 10 - K, our Quarterly Reports on Form 10 - Q, and in our other filings with the SEC . You are cautioned not to place undue reliance on forward - looking statements . The Company does not intend, and undertakes no obligation, to update any forward - looking statement . TABLE OF CONTENTS 3 Company Overview 6 Select Quarterly Financial Data 7 Business Summary 8 Acquisitions / Dispositions 9 Portfolio Summary 12 Key Tenants 13 Debt and Hedging Summary 15 Total Capitalization and Equity Summary 16 Sustainability Summary 17 Condensed Consolidated Statements of Operations 18 Condensed Consolidated Balance Sheets 19 Condensed Consolidated Statements of Cash Flows 20 Non - GAAP Reconciliations 21 Reporting Definitions and Other Disclosures Legent Hospital for Special Surgery – Plano, TX 1Q - 2025 | Earnings Supplemental 2 3 1Q - 2025 | Earnings Supplemental *See page 22 for disclosure regarding the Company’s rent coverage calculation COMPANY OVERVIEW GLOBAL MEDICAL REIT INC. (GMRE) IS A NET - LEASE MEDICAL REAL ESTATE INVESTMENT TRUST (REIT) THAT ACQUIRES HEALTHCARE FACILITIES AND LEASES THOSE FACILITIES TO PHYSICIAN GROUPS AND REGIONAL AND NATIONAL HEALTHCARE SYSTEMS. PORTFOLIO SNAPSHOT (as of March 31, 2025) Blue Sky Vision – Grand Rapids, MI Gross Investment in Real Estate (billions) $1.5 Number of Buildings 191 Number of States 35 Weighted Average Portfolio Cap Rate 7.9% % of Health System or Other Affiliated Tenants 89% Weighted Average Lease Term (years) 5.6 Leased Occupancy 95.6% Portfolio Rent Coverage* 4.4x
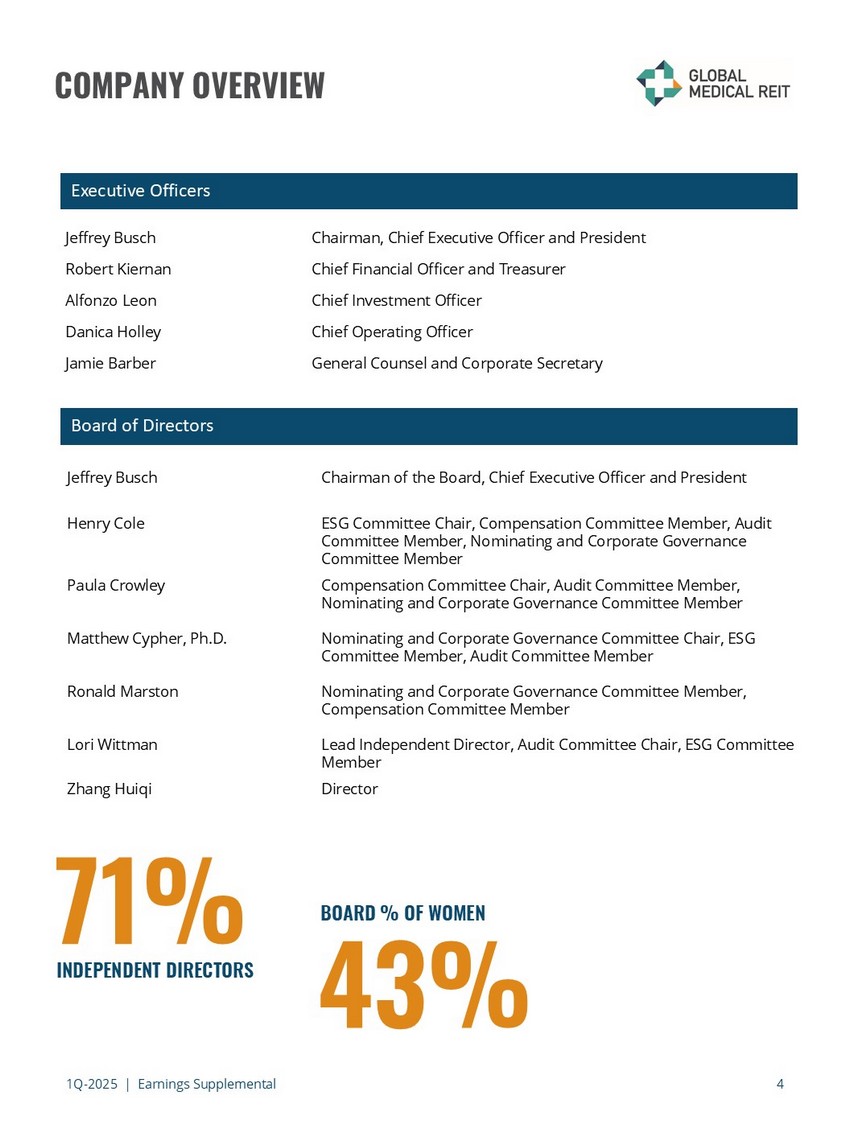
1Q - 2025 | Earnings Supplemental 4 Chairman, Chief Executive Officer and President Jeffrey Busch Chief Financial Officer and Treasurer Robert Kiernan Chief Investment Officer Alfonzo Leon Chief Operating Officer Danica Holley General Counsel and Corporate Secretary Jamie Barber Board of Directors Chairman of the Board, Chief Executive Officer and President Jeffrey Busch ESG Committee Chair, Compensation Committee Member, Audit Committee Member, Nominating and Corporate Governance Committee Member Henry Cole Compensation Committee Chair, Audit Committee Member, Nominating and Corporate Governance Committee Member Paula Crowley Nominating and Corporate Governance Committee Chair, ESG Committee Member, Audit Committee Member Matthew Cypher, Ph.D.
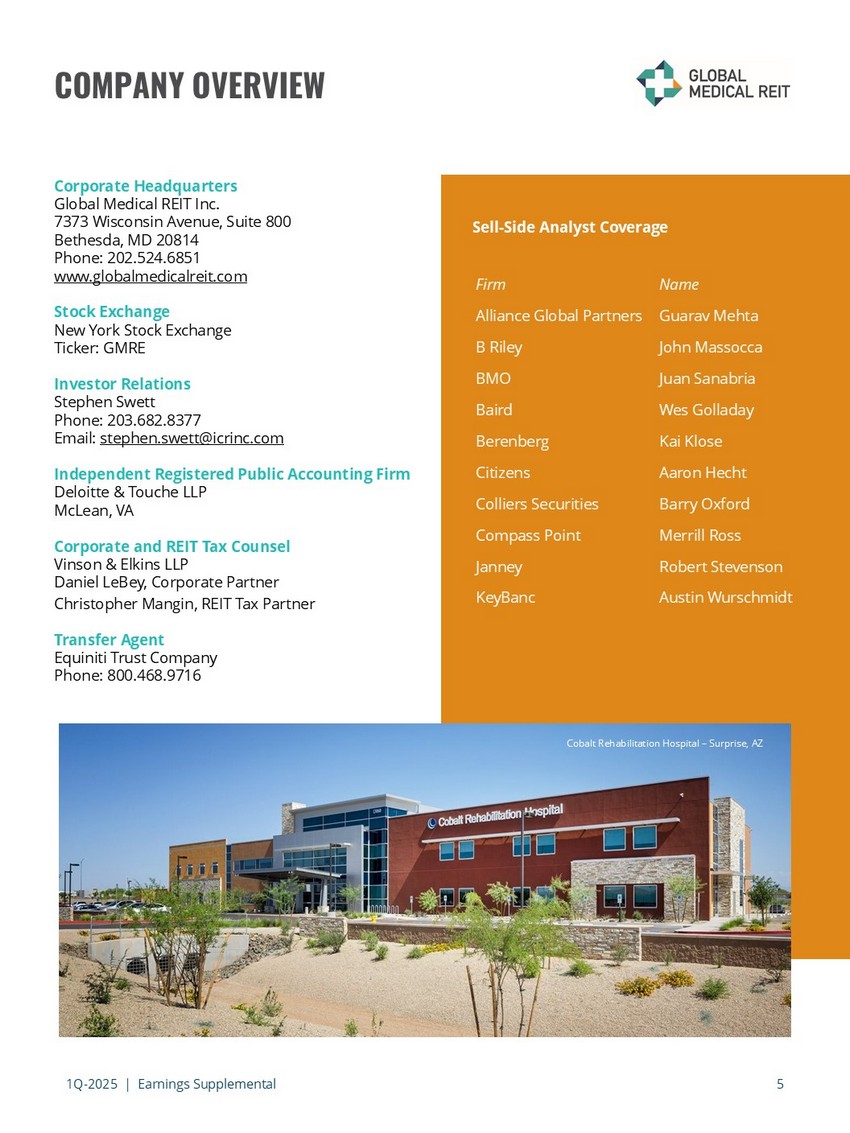
Nominating and Corporate Governance Committee Member, Compensation Committee Member Ronald Marston Lead Independent Director, Audit Committee Chair, ESG Committee Member Lori Wittman Director Zhang Huiqi INDEPENDENT DIRECTORS 71% BOARD % OF WOMEN COMPANY OVERVIEW 43% Executive Officers 1Q - 2025 | Earnings Supplemental 5 COMPANY OVERVIEW Corporate Headquarters Global Medical REIT Inc.
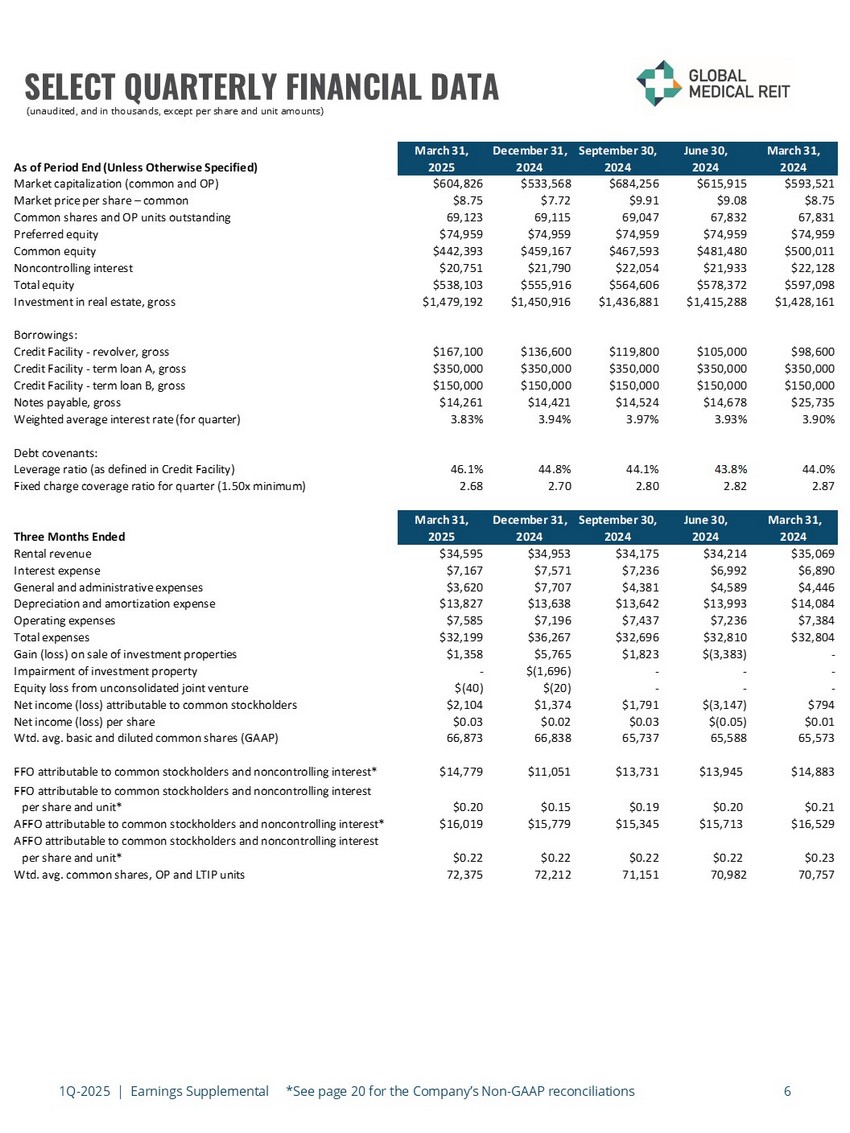
7373 Wisconsin Avenue, Suite 800 Bethesda, MD 20814 Phone: 202.524.6851 www.globalmedicalreit.com Stock Exchange New York Stock Exchange Ticker: GMRE Investor Relations Stephen Swett Phone: 203.682.8377 Email: stephen.swett@icrinc.com Independent Registered Public Accounting Firm Deloitte & Touche LLP McLean, VA Corporate and REIT Tax Counsel Vinson & Elkins LLP Daniel LeBey, Corporate Partner Christopher Mangin, REIT Tax Partner Transfer Agent Equiniti Trust Company Phone: 800.468.9716 Cobalt Rehabilitation Hospital – Surprise, AZ Name Firm Guarav Mehta Alliance Global Partners John Massocca B Riley Juan Sanabria BMO Wes Golladay Baird Kai Klose Berenberg Aaron Hecht Citizens Barry Oxford Colliers Securities Merrill Ross Compass Point Robert Stevenson Janney Austin Wurschmidt KeyBanc Sell - Side Analyst Coverage 1Q - 2025 | Earnings Supplemental *See page 20 for the Company’s Non - GAAP reconciliations 6 (unaudited, and in thousands, except per share and unit amounts) SELECT QUARTERLY FINANCIAL DATA March 31, December 31, September 30, June 30, March 31, As of Period End (Unless Otherwise Specified) 2025 2024 2024 2024 2024 Market capitalization (common and OP) $604,826 $533,568 $684,256 $615,915 $593,521 Market price per share – common $8.75 $7.72 $9.91 $9.08 $8.75 Common shares and OP units outstanding 69,123 69,115 69,047 67,832 67,831 Preferred equity $74,959 $74,959 $74,959 $74,959 $74,959 Common equity $442,393 $459,167 $467,593 $481,480 $500,011 Noncontrolling interest $20,751 $21,790 $22,054 $21,933 $22,128 Total equity $538,103 $555,916 $564,606 $578,372 $597,098 Investment in real estate, gross $1,479,192 $1,450,916 $1,436,881 $1,415,288 $1,428,161 Borrowings: Credit Facility - revolver, gross $167,100 $136,600 $119,800 $105,000 $98,600 Credit Facility - term loan A, gross $350,000 $350,000 $350,000 $350,000 $350,000 Credit Facility - term loan B, gross $150,000 $150,000 $150,000 $150,000 $150,000 Notes payable, gross $14,261 $14,421 $14,524 $14,678 $25,735 Weighted average interest rate (for quarter) 3.83% 3.94% 3.97% 3.93% 3.90% Debt covenants: Leverage ratio (as defined in Credit Facility) 46.1% 44.8% 44.1% 43.8% 44.0% Fixed charge coverage ratio for quarter (1.50x minimum) 2.68 2.70 2.80 2.82 2.87 March 31, December 31, September 30, June 30, March 31, Three Months Ended 2025 2024 2024 2024 2024 Rental revenue $34,595 $34,953 $34,175 $34,214 $35,069 Interest expense $7,167 $7,571 $7,236 $6,992 $6,890 General and administrative expenses $3,620 $7,707 $4,381 $4,589 $4,446 Depreciation and amortization expense $13,827 $13,638 $13,642 $13,993 $14,084 Operating expenses $7,585 $7,196 $7,437 $7,236 $7,384 Total expenses $32,199 $36,267 $32,696 $32,810 $32,804 Gain (loss) on sale of investment properties $1,358 $5,765 $1,823 $(3,383) - Impairment of investment property - $(1,696) - - - Equity loss from unconsolidated joint venture $(40) $(20) - - - Net income (loss) attributable to common stockholders $2,104 $1,374 $1,791 $(3,147) $794 Net income (loss) per share $0.03 $0.02 $0.03 $(0.05) $0.01 Wtd. avg. basic and diluted common shares (GAAP) 66,873 66,838 65,737 65,588 65,573 FFO attributable to common stockholders and noncontrolling interest* $14,779 $11,051 $13,731 $13,945 $14,883 FFO attributable to common stockholders and noncontrolling interest per share and unit* $0.20 $0.15 $0.19 $0.20 $0.21 AFFO attributable to common stockholders and noncontrolling interest* $16,019 $15,779 $15,345 $15,713 $16,529 AFFO attributable to common stockholders and noncontrolling interest per share and unit* $0.22 $0.22 $0.22 $0.22 $0.23 Wtd. avg.
common shares, OP and LTIP units 72,375 72,212 71,151 70,982 70,757 1Q - 2025 | Earnings Supplemental 7 BUSINESS SUMMARY FIRST QUARTER 2025 OPERATING SUMMARY • Net income attributable to common stockholders was $2.1 million, or $0.03 per diluted share, as compared to $0.8 million, or $0.01 per diluted share, in the comparable prior year period. • Funds from operations attributable to common stockholders and noncontrolling interest (“FFO”) of $14.8 million, or $0.20 per share and unit, as compared to $14.9 million, or $0.21 per share and unit, in the comparable prior year period. • Adjusted funds from operations attributable to common stockholders and noncontrolling interest (“AFFO”) of $16.0 million, or $0.22 per share and unit, as compared to $16.5 million, or $0.23 per share and unit, in the comparable prior year period. INVESTMENT AND PORTFOLIO ACTIVITY • As previously announced, the Company entered into a purchase agreement to acquire a five - property portfolio, with an aggregate of 486,598 of leasable square feet for an aggregate purchase price of $69.6 million and aggregate annualized base rent of $6.3 million at a cap rate of 9.0%. o In February 2025, the Company completed the acquisition of three of the five properties encompassing an aggregate of 188,874 leasable square feet for an aggregate purchase price of $31.5 million with aggregate annualized base rent of $2.7 million. o In April 2025, the Company completed the acquisition of the remaining two properties in the five - property portfolio encompassing an aggregate of 297,724 leasable square feet for an aggregate purchase price of $38.1 million with aggregate annualized base rent of $3.6 million. • During the quarter the Company completed the disposition of two medical facilities, receiving aggregate gross proceeds of $8.2 million, resulting in an aggregate gain of $1.4 million. At the dates of disposition, one facility was occupied and one facility was vacant. The cap rate on the sale of the occupied facility was 6.7%. • On January 11, 2025, the Company’s tenant, Prospect Medical Group (“Prospect”), filed for Chapter 11 bankruptcy reorganization. As of January 11, 2025, Prospect owed the Company approximately $2.4 million related to leases at three of the Company’s healthcare facilities, including $2.2 million related to the Company’s facility in East Orange, New Jersey. As of March 31, 2025, the Company and Prospect entered into a Stipulation and Agreed Order (the “Order”) with the bankruptcy courts whereby Prospect rejected its lease at the Company’s East Orange, New Jersey facility (allowing the Company to begin working directly with subtenants to enter into new direct leases with them and begin marketing the remainder of the facility for lease) and the Company agreed to waive all post - petition amounts due for the month of March 2025. Pursuant to the Order, as of May 6, 2025, Prospect has paid the Company $250 thousand, representing all post - petition amounts due through February 28, 2025, at this facility. As of May 6, 2025, Prospect had not decided if it was going to accept or reject its remaining leases with the Company. CAPITAL MARKETS AND DEBT ACTIVITY • Leverage was 46.1% as of March 31, 2025. • As of May 6, 2025, the Company’s borrowing capacity under the credit facility was $187 million. • The Company did not issue any shares of common stock under its ATM program during the first quarter of 2025 or from April 1, 2025 through May 6, 2025.
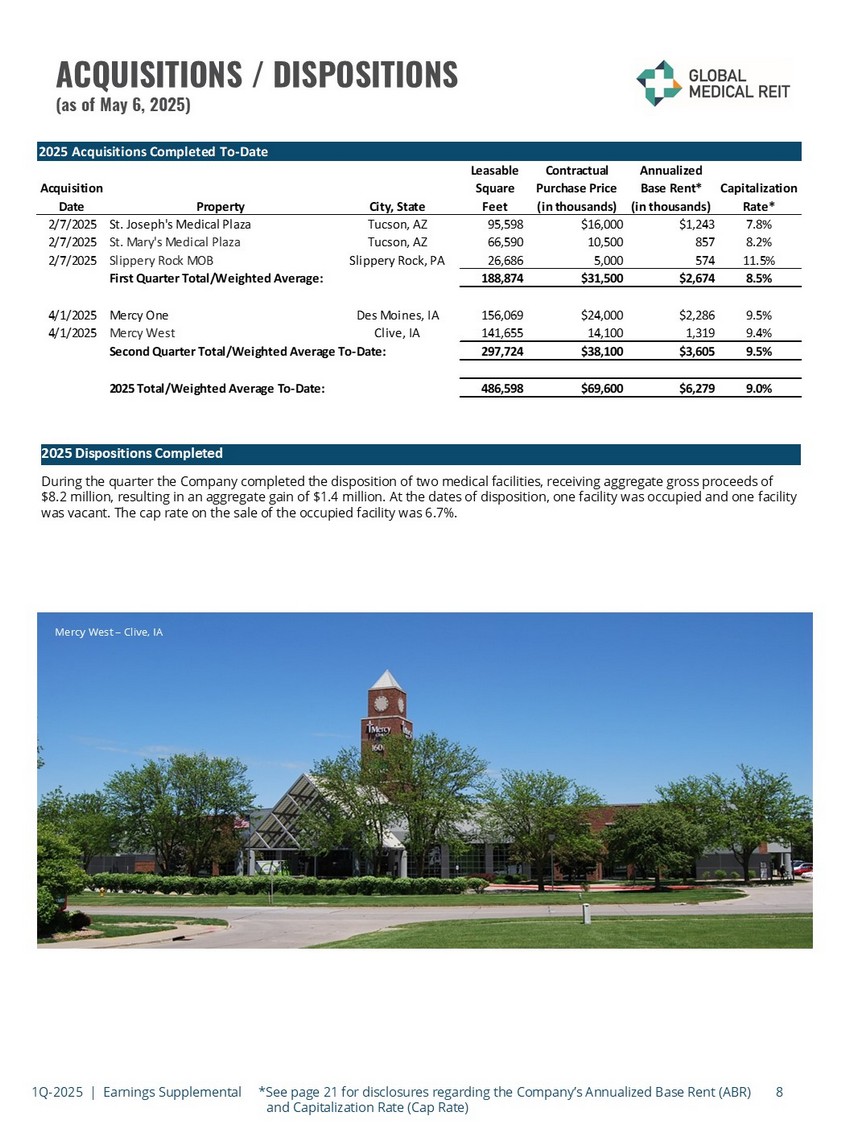
1Q - 2025 | Earnings Supplemental *See page 21 for disclosures regarding the Company’s Annualized Base Rent (ABR) and Capitalization Rate (Cap Rate) 8 ACQUISITIONS / DISPOSITIONS (as of May 6, 2025) Pediatrics Plus – Russellville, AR 2025 Dispositions Completed During the quarter the Company completed the disposition of two medical facilities, receiving aggregate gross proceeds of $8.2 million, resulting in an aggregate gain of $1.4 million. At the dates of disposition, one facility was occupied and one fac ility was vacant. The cap rate on the sale of the occupied facility was 6.7%. Mercy West – Clive, IA Acquisition Date Property City, State Leasable Square Feet Contractual Purchase Price (in thousands) Annualized Base Rent* (in thousands) Capitalization Rate* 2/7/2025 St. Joseph's Medical Plaza Tucson, AZ 95,598 $16,000 $1,243 7.8% 2/7/2025 St.
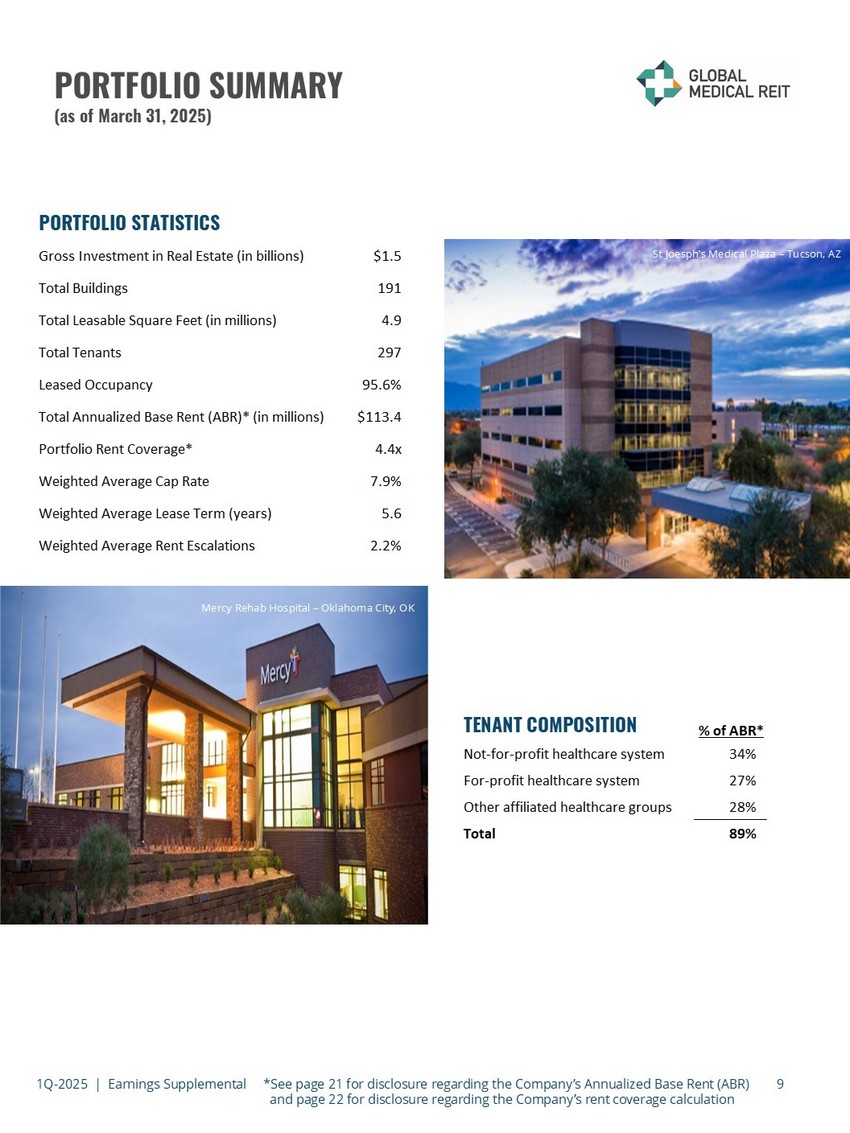
Mary's Medical Plaza Tucson, AZ 66,590 10,500 857 8.2% 2/7/2025 Slippery Rock MOB Slippery Rock, PA 26,686 5,000 574 11.5% First Quarter Total/Weighted Average: 188,874 $31,500 $2,674 8.5% 4/1/2025 Mercy One Des Moines, IA 156,069 $24,000 $2,286 9.5% 4/1/2025 Mercy West Clive, IA 141,655 14,100 1,319 9.4% Second Quarter Total/Weighted Average To-Date: 297,724 $38,100 $3,605 9.5% 2025 Total/Weighted Average To-Date: 486,598 $69,600 $6,279 9.0% 2025 Acquisitions Completed To-Date 1Q - 2025 | Earnings Supplemental *See page 21 for disclosure regarding the Company’s Annualized Base Rent (ABR) and page 22 for disclosure regarding the Company’s rent coverage calculation 9 PORTFOLIO SUMMARY (as of March 31, 2025) PORTFOLIO STATISTICS TENANT COMPOSITION Texas Digestive Disease Consultants – Ft. Worth, TX Indiana Eye Clinic – Greenwood, IN Mercy Rehab Hospital – Oklahoma City, OK St Joesph’s Medical Plaza – Tucson, AZ % of ABR* Not-for-profit healthcare system 34% For-profit healthcare system 27% Other affiliated healthcare groups 28% Total 89% Gross Investment in Real Estate (in billions) $1.5 Total Buildings 191 Total Leasable Square Feet (in millions) 4.9 Total Tenants 297 Leased Occupancy 95.6% Total Annualized Base Rent (ABR)* (in millions) $113.4 Portfolio Rent Coverage* 4.4x Weighted Average Cap Rate 7.9% Weighted Average Lease Term (years) 5.6 Weighted Average Rent Escalations 2.2% 10 PORTFOLIO SUMMARY (as of March 31, 2025) LEASE TYPE RENT COVERAGE* (1) Includes surgical hospitals, long - term acute care hospitals (LTACH) and behavioral hospitals.
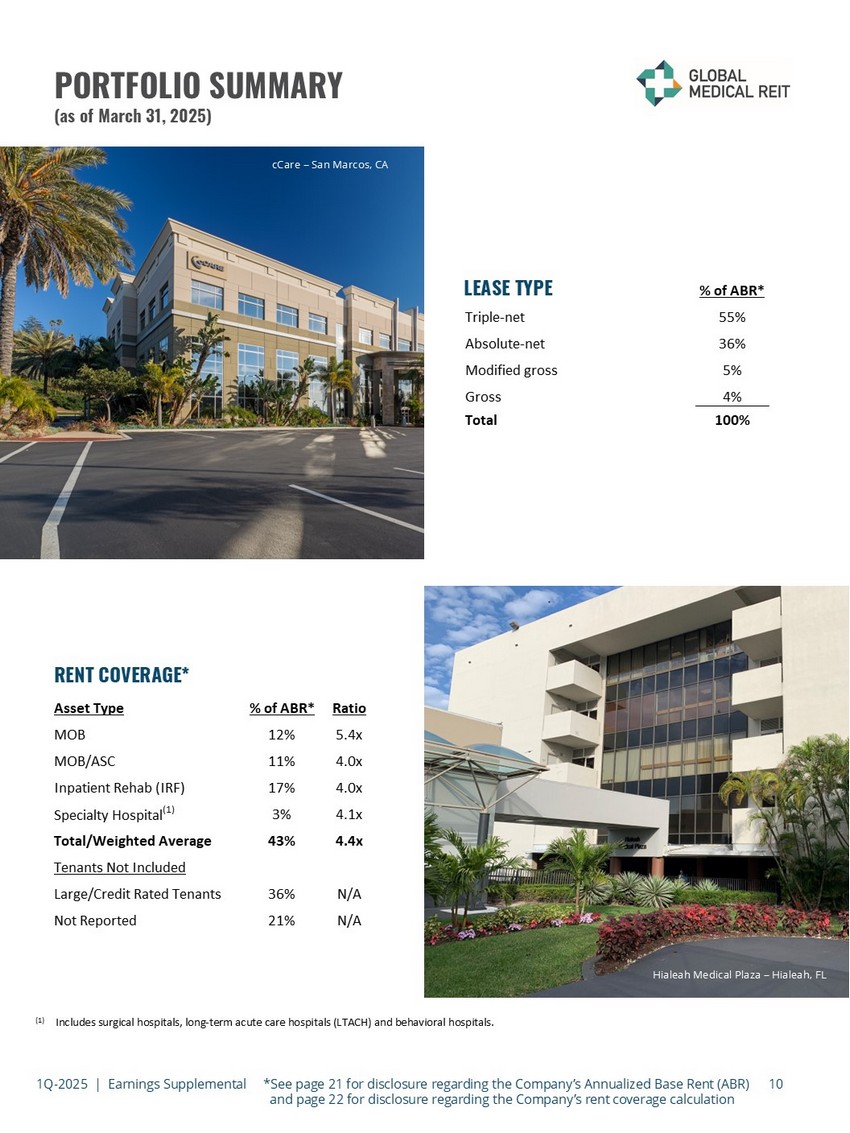
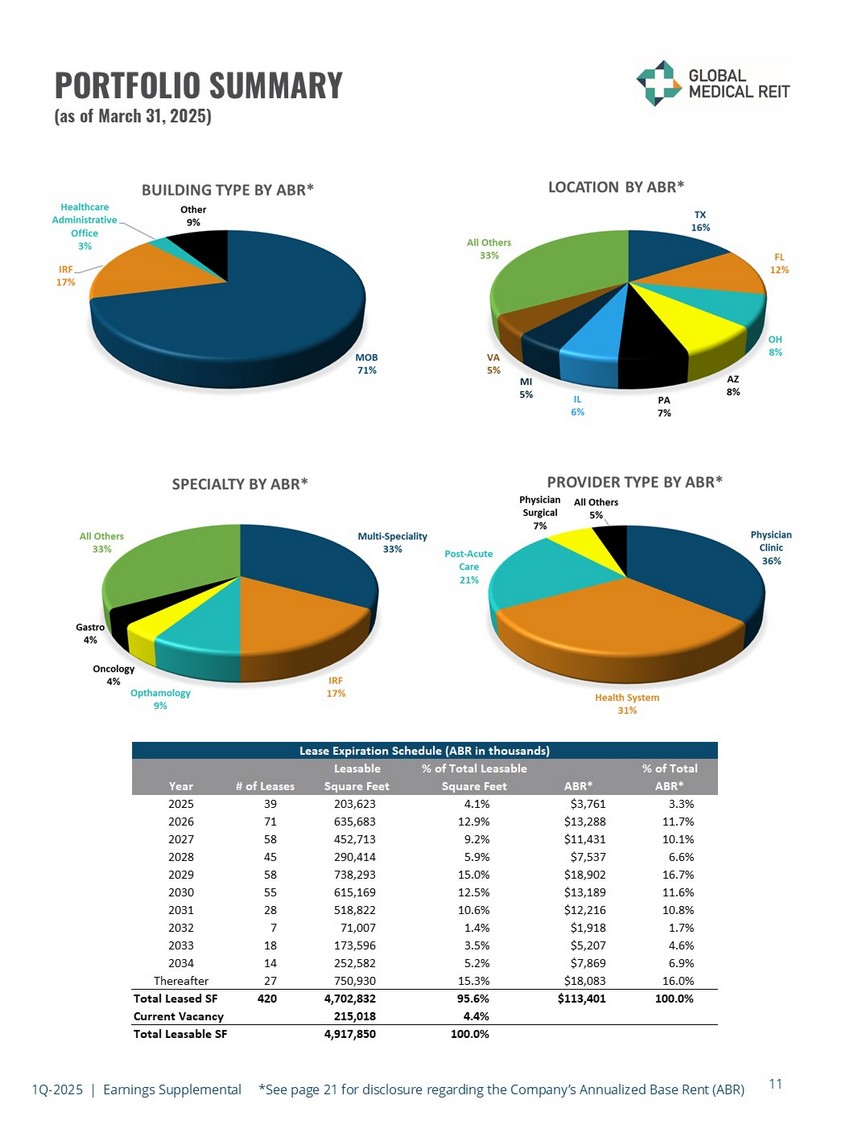
cCare – San Marcos, CA Hialeah Medical Plaza – Hialeah, FL 1Q - 2025 | Earnings Supplemental *See page 21 for disclosure regarding the Company’s Annualized Base Rent (ABR) and page 22 for disclosure regarding the Company’s rent coverage calculation % of ABR* Triple-net 55% Absolute-net 36% Modified gross 5% Gross 4% Total 100% Asset Type % of ABR* Ratio MOB 12% 5.4x MOB/ASC 11% 4.0x Inpatient Rehab (IRF) 17% 4.0x Specialty Hospital (1) 3% 4.1x Total/Weighted Average 43% 4.4x Tenants Not Included Large/Credit Rated Tenants 36% N/A Not Reported 21% N/A 11 PORTFOLIO SUMMARY (as of March 31, 2025) 1Q - 2025 | Earnings Supplemental *See page 21 for disclosure regarding the Company’s Annualized Base Rent (ABR) Leasable % of Total Leasable % of Total Year # of Leases Square Feet Square Feet ABR* ABR* 2025 39 203,623 4.1% $3,761 3.3% 2026 71 635,683 12.9% $13,288 11.7% 2027 58 452,713 9.2% $11,431 10.1% 2028 45 290,414 5.9% $7,537 6.6% 2029 58 738,293 15.0% $18,902 16.7% 2030 55 615,169 12.5% $13,189 11.6% 2031 28 518,822 10.6% $12,216 10.8% 2032 7 71,007 1.4% $1,918 1.7% 2033 18 173,596 3.5% $5,207 4.6% 2034 14 252,582 5.2% $7,869 6.9% Thereafter 27 750,930 15.3% $18,083 16.0% Total Leased SF 420 4,702,832 95.6% $113,401 100.0% Current Vacancy 215,018 4.4% Total Leasable SF 4,917,850 100.0% Lease Expiration Schedule (ABR in thousands)
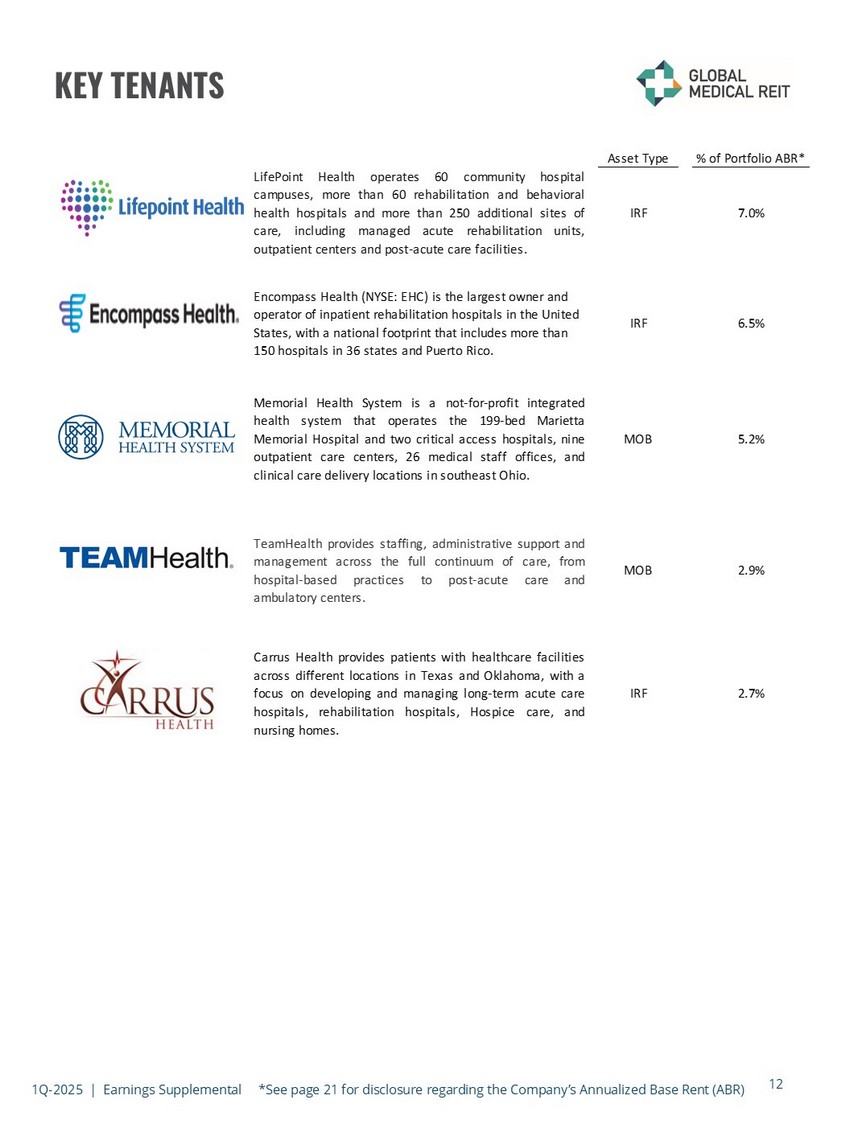
12 KEY TENANTS 1Q - 2025 | Earnings Supplemental *See page 21 for disclosure regarding the Company’s Annualized Base Rent (ABR) Asset Type % of Portfolio ABR* LifePoint Health operates 60 community hospital campuses, more than 60 rehabilitation and behavioral healthhospitalsandmorethan250additionalsitesof care, including managed acute rehabilitation units, outpatient centers and post-acute care facilities. IRF 7.0% Encompass Health (NYSE: EHC) is the largest owner and operator of inpatient rehabilitation hospitals in the United States, with a national footprint that includes more than 150 hospitals in 36 states and Puerto Rico. IRF 6.5% Memorial Health System is a not-for-profit integrated health system that operates the 199-bed Marietta MemorialHospitalandtwocriticalaccesshospitals,nine outpatient care centers, 26 medical staff offices, and clinical care delivery locations in southeast Ohio. MOB 5.2% TeamHealthprovidesstaffing,administrativesupportand management across the full continuum of care, from hospital-based practices to post-acute care and ambulatory centers. MOB 2.9% CarrusHealthprovidespatientswithhealthcarefacilities acrossdifferentlocationsinTexasandOklahoma,witha focusondevelopingandmanaginglong-termacutecare hospitals, rehabilitation hospitals, Hospice care, and nursing homes.
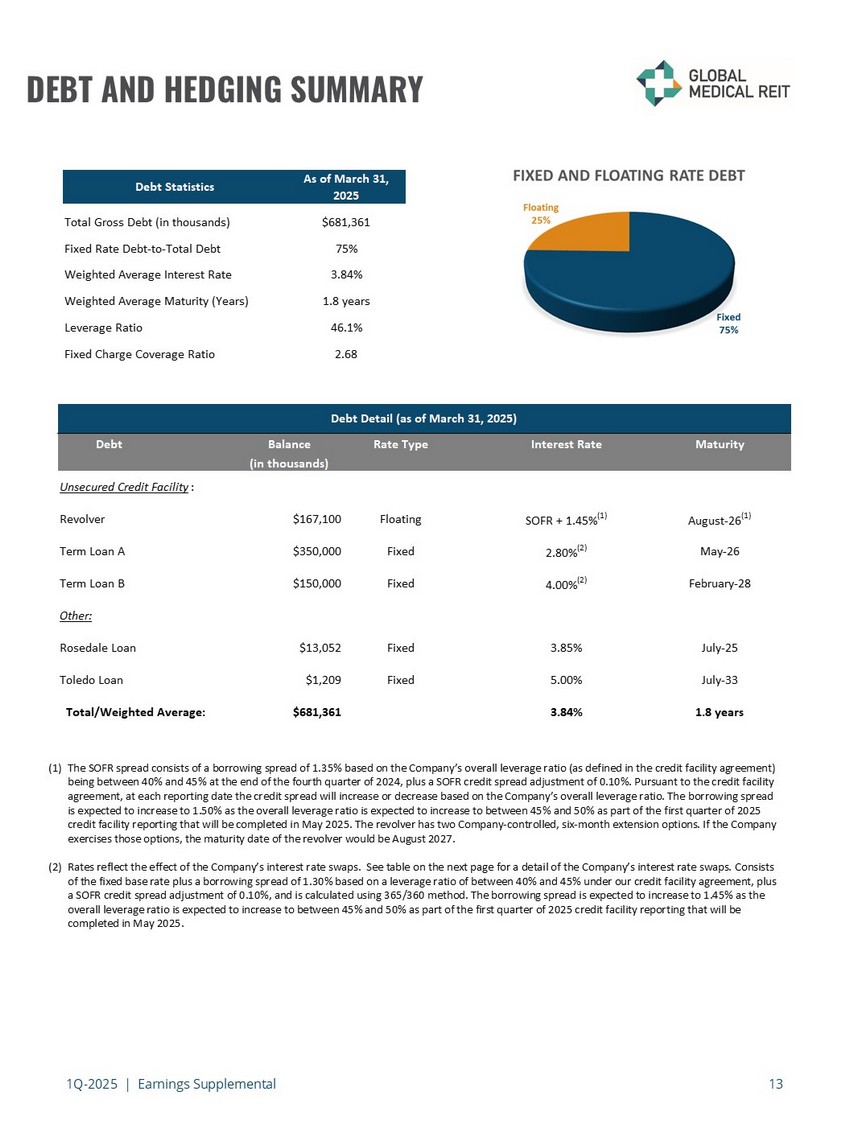
IRF 2.7% 1Q - 2025 | Earnings Supplemental 13 DEBT AND HEDGING SUMMARY (1) The SOFR spread consists of a borrowing spread of 1.35% based on the Company’s overall leverage ratio (as defined in the cred it facility agreement) being between 40% and 45% at the end of the fourth quarter of 2024, plus a SOFR credit spread adjustment of 0.10%. Pursuant t o t he credit facility agreement, at each reporting date the credit spread will increase or decrease based on the Company’s overall leverage ratio. The borrowing spread is expected to increase to 1.50% as the overall leverage ratio is expected to increase to between 45% and 50% as part of the fir st quarter of 2025 credit facility reporting that will be completed in May 2025. The revolver has two Company - controlled, six - month extension optio ns. If the Company exercises those options, the maturity date of the revolver would be August 2027. (2) Rates reflect the effect of the Company’s interest rate swaps. See table on the next page for a detail of the Company’s inte res t rate swaps. Consists of the fixed base rate plus a borrowing spread of 1.30% based on a leverage ratio of between 40% and 45 % under our credit facility agreement, plus a SOFR credit spread adjustment of 0.10%, and is calculated using 365/360 method . T he borrowing spread is expected to increase to 1.45% as the overall leverage ratio is expected to increase to between 45% and 50% as part of the first quarter of 2025 credit facility re por ting that will be completed in May 2025. Debt Balance Rate Type Interest Rate Maturity (in thousands) Unsecured Credit Facility: Revolver $167,100 Floating SOFR + 1.45% (1) August-26 (1) Term Loan A $350,000 Fixed 2.80% (2) May-26 Term Loan B $150,000 Fixed 4.00% (2) February-28 Other: Rosedale Loan $13,052 Fixed 3.85% July-25 Toledo Loan $1,209 Fixed 5.00% July-33 Total/Weighted Average: $681,361 3.84% 1.8 years Debt Detail (as of March 31, 2025) Debt Statistics As of March 31, 2025 Total Gross Debt (in thousands) $681,361 Fixed Rate Debt-to-Total Debt 75% Weighted Average Interest Rate 3.84% Weighted Average Maturity (Years) 1.8 years Leverage Ratio 46.1% Fixed Charge Coverage Ratio 2.68 1Q - 2025 | Earnings Supplemental 14 DEBT AND HEDGING SUMMARY (1) Consists of a total of nine interest rates swaps whereby we pay the fixed base rate listed in the table above and receive the on e - month SOFR, which is the reference rate for the outstanding loans in our credit facility.
(2) Consists of the fixed base rate plus a borrowing spread of 1.30% based on a leverage ratio of between 40% and 45% under our c red it facility agreement, plus a SFOR credit spread adjustment of 0.10%, and is calculated using 365/360 method. T he borrowing spread is expected to increase to 1.45% as the overall leverage ratio is expected to increase to between 45% and 50% as part of the first quarter of 2025 cr edi t facility reporting that will be completed in May 2025. Citrus Valley Medical Associates – Corona, CA Notional Term Term Loan A - $350,000 Current – 4/2026 Fixed base rate: 1.36% Effective interest rate: 2.80% (2) Term Loan B - $150,000 Current – 2/2028 Fixed base rate: 2.54% Effective interest rate: 4.00% (2) Interest Rate Swap Detail (as of March 31, 2025) (1) Weighted Average Interest Rates 1Q - 2025 | Earnings Supplemental 15 TOTAL CAPITALIZATION AND EQUITY SUMMARY (unaudited, and in thousands, except per share data) (1) Based on the closing price of the Company’s common stock on March 31, 2025 of $8.75 per share.
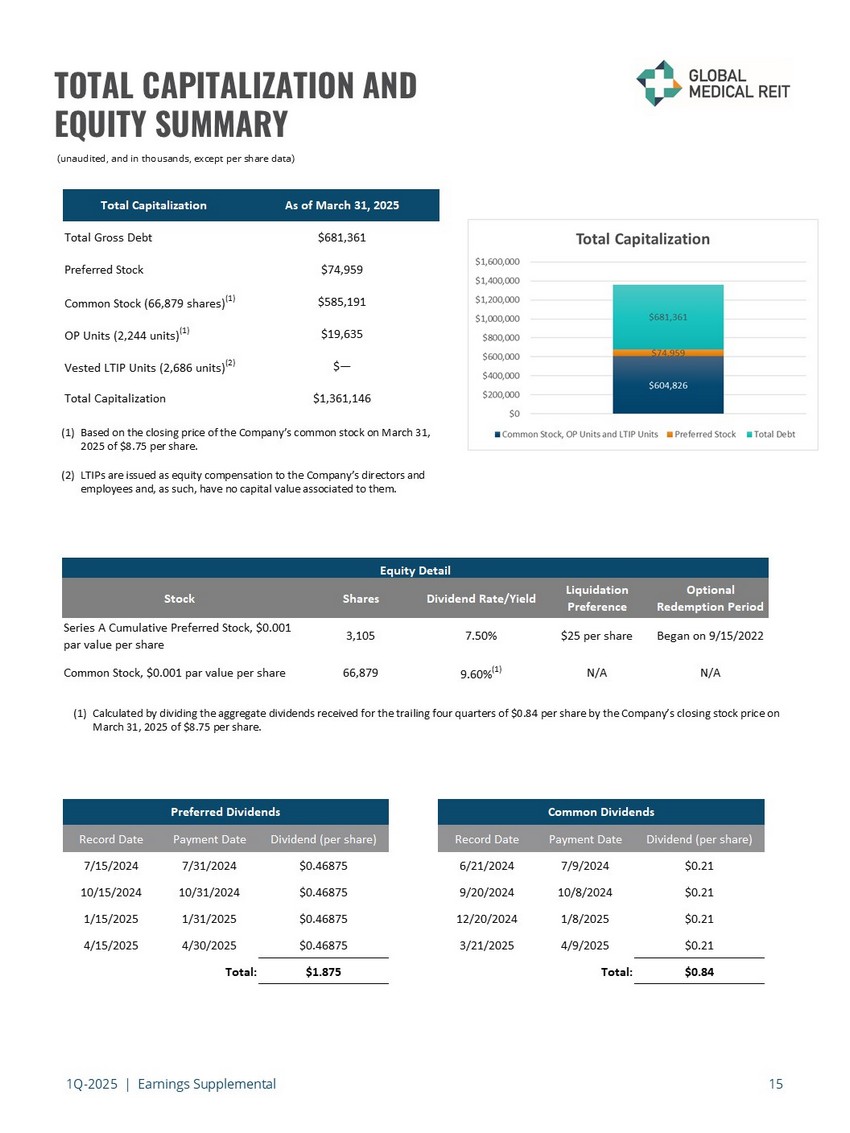
(2) LTIPs are issued as equity compensation to the Company’s directors and employees and, as such, have no capital value associated to them. (1) Calculated by dividing the aggregate dividends received for the trailing four quarters of $0.84 per share by the Company’s cl osi ng stock price on March 31, 2025 of $8.75 per share.
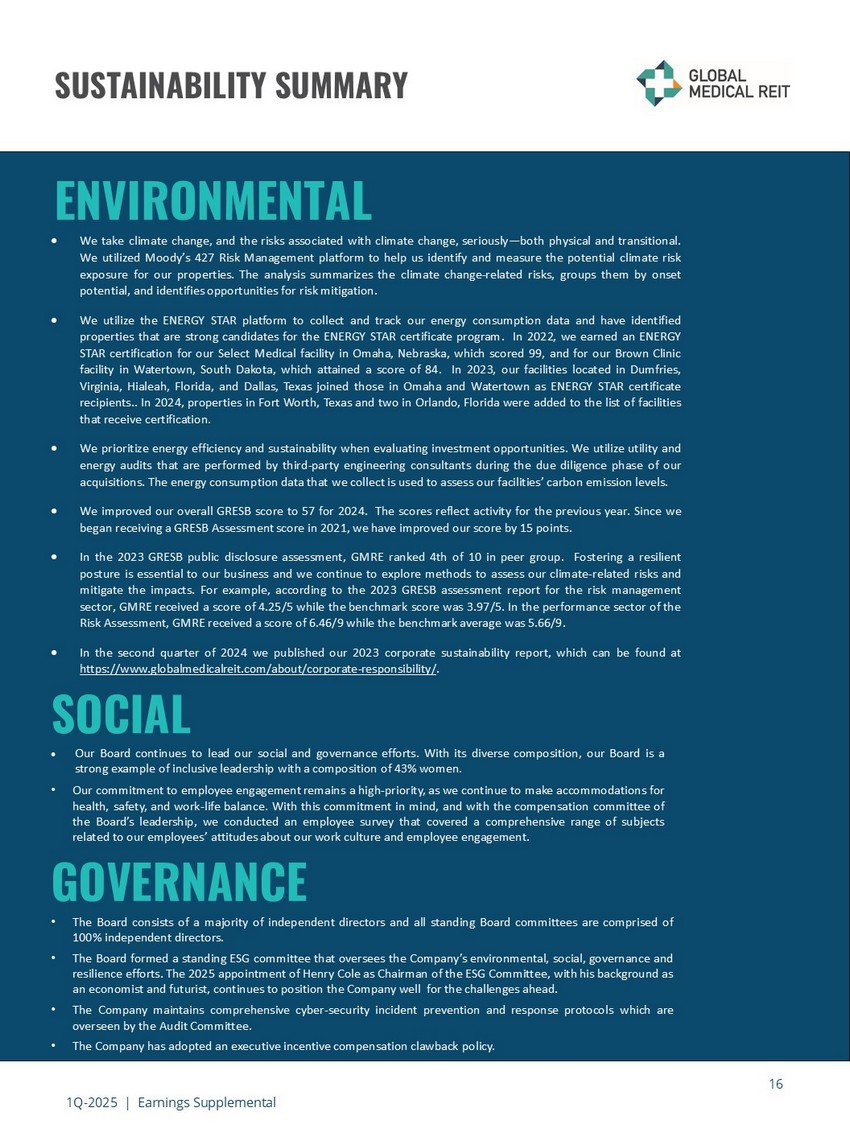
Stock Shares Dividend Rate/Yield Liquidation Preference Optional Redemption Period Series A Cumulative Preferred Stock, $0.001 par value per share 3,105 7.50% $25 per share Began on 9/15/2022 Common Stock, $0.001 par value per share 66,879 9.60% (1) N/A N/A Equity Detail Record Date Payment Date Dividend (per share) Record Date Payment Date Dividend (per share) 7/15/2024 7/31/2024 $0.46875 6/21/2024 7/9/2024 $0.21 10/15/2024 10/31/2024 $0.46875 9/20/2024 10/8/2024 $0.21 1/15/2025 1/31/2025 $0.46875 12/20/2024 1/8/2025 $0.21 4/15/2025 4/30/2025 $0.46875 3/21/2025 4/9/2025 $0.21 Total: $1.875 Total: $0.84 Preferred Dividends Common Dividends Total Capitalization As of March 31, 2025 Total Gross Debt $681,361 Preferred Stock $74,959 Common Stock (66,879 shares) (1) $585,191 OP Units (2,244 units) (1) $19,635 Vested LTIP Units (2,686 units) (2) $— Total Capitalization $1,361,146 1Q - 2025 | Earnings Supplemental 16 SUSTAINABILITY SUMMARY We take climate change, and the risks associated with climate change, seriously — both physical and transitional . We utilized Moody’s 427 Risk Management platform to help us identify and measure the potential climate risk exposure for our properties . The analysis summarizes the climate change - related risks, groups them by onset potential, and identifies opportunities for risk mitigation . We utilize the ENERGY STAR platform to collect and track our energy consumption data and have identified properties that are strong candidates for the ENERGY STAR certificate program . In 2022 , we earned an ENERGY STAR certification for our Select Medical facility in Omaha, Nebraska, which scored 99 , and for our Brown Clinic facility in Watertown, South Dakota, which attained a score of 84 . In 2023 , our facilities located in Dumfries, Virginia, Hialeah, Florida, and Dallas, Texas joined those in Omaha and Watertown as ENERGY STAR certificate recipients .. In 2024 , properties in Fort Worth, Texas and two in Orlando, Florida were added to the list of facilities that receive certification . We prioritize energy efficiency and sustainability when evaluating investment opportunities . We utilize utility and energy audits that are performed by third - party engineering consultants during the due diligence phase of our acquisitions . The energy consumption data that we collect is used to assess our facilities’ carbon emission levels . We improved our overall GRESB score to 57 for 2024 . The scores reflect activity for the previous year . Since we began receiving a GRESB Assessment score in 2021 , we have improved our score by 15 points . In the 2023 GRESB public disclosure assessment, GMRE ranked 4 th of 10 in peer group . Fostering a resilient posture is essential to our business and we continue to explore methods to assess our climate - related risks and mitigate the impacts . For example, according to the 2023 GRESB assessment report for the risk management sector, GMRE received a score of 4 . 25 / 5 while the benchmark score was 3 . 97 / 5 . In the performance sector of the Risk Assessment, GMRE received a score of 6 . 46 / 9 while the benchmark average was 5 . 66 / 9 . In the second quarter of 2024 we published our 2023 corporate sustainability report, which can be found at https : //www . globalmedicalreit . com/about/corporate - responsibility/ . ENVIRONMENTAL SOCIAL Our Board continues to lead our social and governance efforts . With its diverse composition, our Board is a strong example of inclusive leadership with a composition of 43 % women . • Our commitment to employee engagement remains a high - priority, as we continue to make accommodations for health, safety, and work - life balance . With this commitment in mind, and with the compensation committee of the Board’s leadership, we conducted an employee survey that covered a comprehensive range of subjects related to our employees’ attitudes about our work culture and employee engagement . GOVERNANCE • The Board consists of a majority of independent directors and all standing Board committees are comprised of 100 % independent directors . • The Board formed a standing ESG committee that oversees the Company’s environmental, social, governance and resilience efforts . The 2025 appointment of Henry Cole as Chairman of the ESG Committee, with his background as an economist and futurist, continues to position the Company well for the challenges ahead . • The Company maintains comprehensive cyber - security incident prevention and response protocols which are overseen by the Audit Committee . • The Company has adopted an executive incentive compensation clawback policy . • GMRE is a member of the National Association of Corporate Directors .
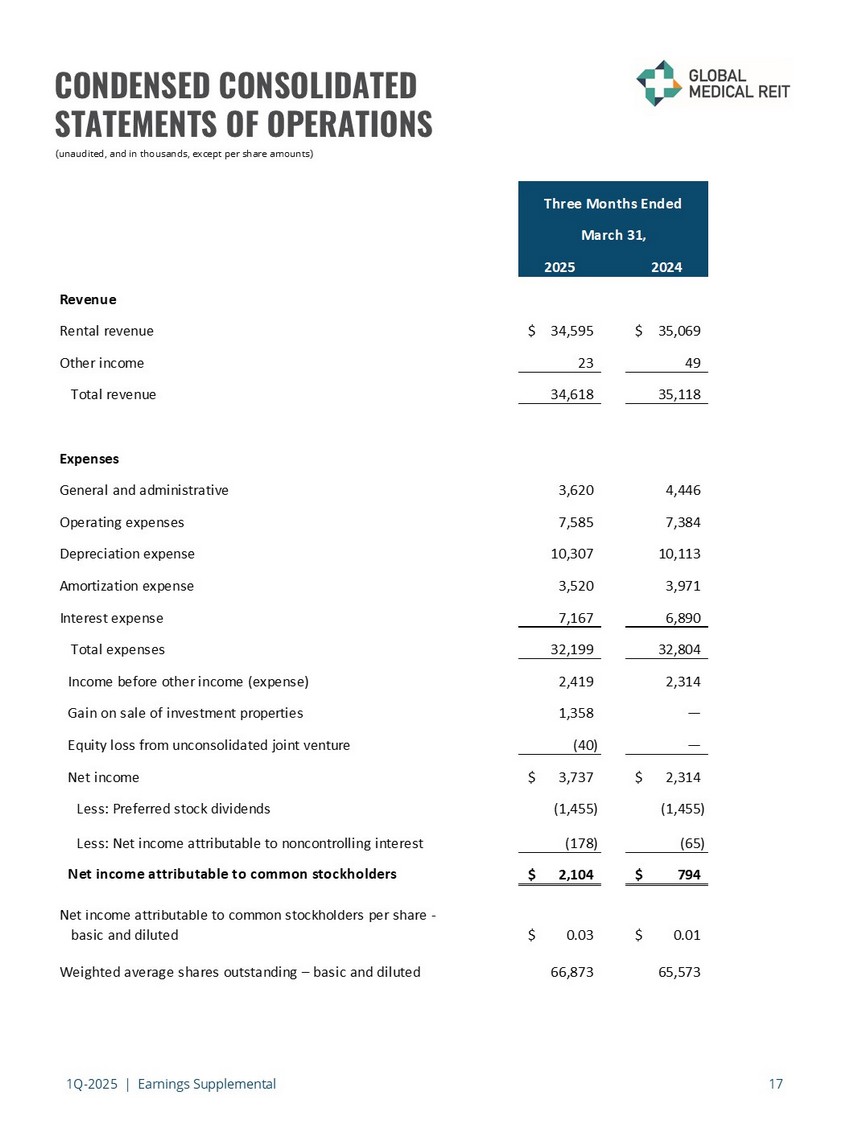
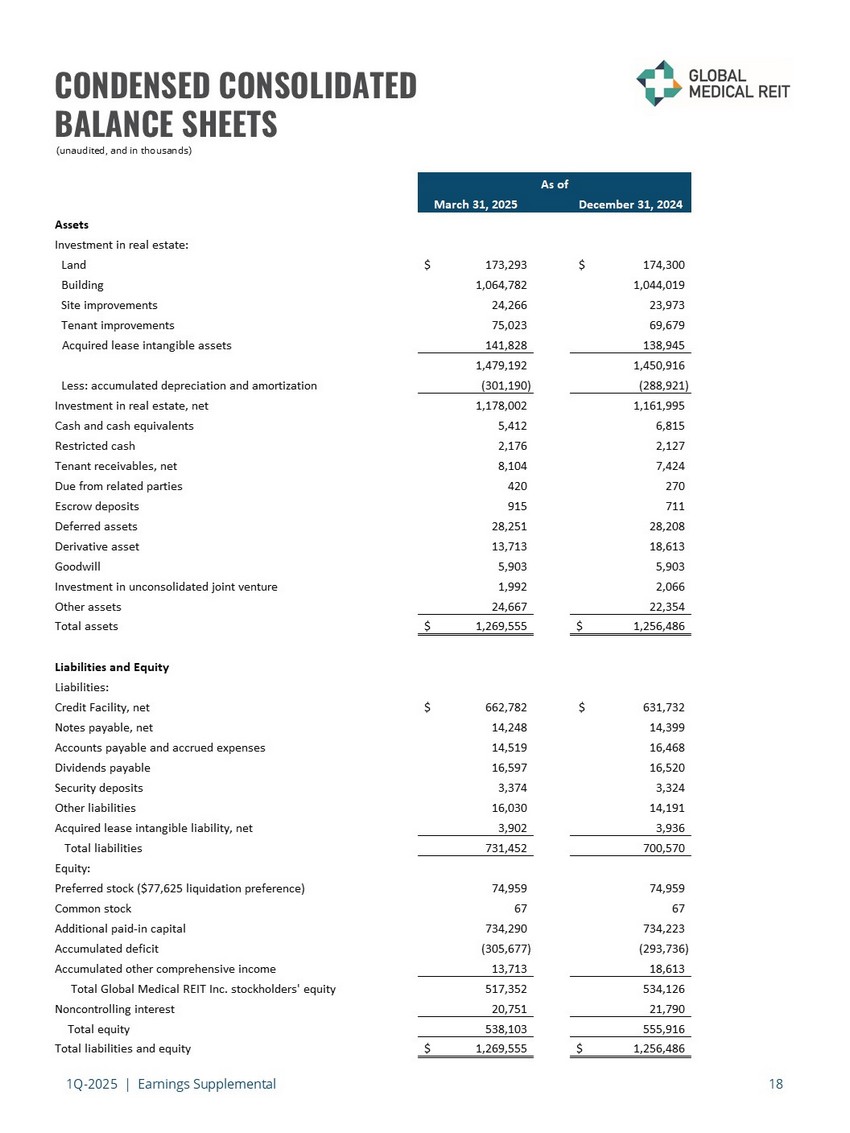
1Q - 2025 | Earnings Supplemental 17 CONDENSED CONSOLIDATED STATEMENTS OF OPERATIONS (unaudited, and in thousands, except per share amounts) 2025 2024 Revenue Rental revenue 34,595$ 35,069$ Other income 23 49 Total revenue 34,618 35,118 Expenses General and administrative 3,620 4,446 Operating expenses 7,585 7,384 Depreciation expense 10,307 10,113 Amortization expense 3,520 3,971 Interest expense 7,167 6,890 Total expenses 32,199 32,804 Income before other income (expense) 2,419 2,314 Gain on sale of investment properties 1,358 — Equity loss from unconsolidated joint venture (40) — Net income 3,737$ 2,314$ Less: Preferred stock dividends (1,455) (1,455) Less: Net income attributable to noncontrolling interest (178) (65) Net income attributable to common stockholders 2,104$ 794$ Net income attributable to common stockholders per share - basic and diluted 0.03$ 0.01$ Weighted average shares outstanding – basic and diluted 66,873 65,573 Three Months Ended March 31, 1Q - 2025 | Earnings Supplemental 18 CONDENSED CONSOLIDATED BALANCE SHEETS (unaudited, and in thousands) March 31, 2025 December 31, 2024 Assets Investment in real estate: Land 173,293$ 174,300$ Building 1,064,782 1,044,019 Site improvements 24,266 23,973 Tenant improvements 75,023 69,679 Acquired lease intangible assets 141,828 138,945 1,479,192 1,450,916 Less: accumulated depreciation and amortization (301,190) (288,921) Investment in real estate, net 1,178,002 1,161,995 Cash and cash equivalents 5,412 6,815 Restricted cash 2,176 2,127 Tenant receivables, net 8,104 7,424 Due from related parties 420 270 Escrow deposits 915 711 Deferred assets 28,251 28,208 Derivative asset 13,713 18,613 Goodwill 5,903 5,903 Investment in unconsolidated joint venture 1,992 2,066 Other assets 24,667 22,354 Total assets 1,269,555$ 1,256,486$ Liabilities and Equity Liabilities: Credit Facility, net 662,782$ 631,732$ Notes payable, net 14,248 14,399 Accounts payable and accrued expenses 14,519 16,468 Dividends payable 16,597 16,520 Security deposits 3,374 3,324 Other liabilities 16,030 14,191 Acquired lease intangible liability, net 3,902 3,936 Total liabilities 731,452 700,570 Equity: Preferred stock ($77,625 liquidation preference) 74,959 74,959 Common stock 67 67 Additional paid-in capital 734,290 734,223 Accumulated deficit (305,677) (293,736) Accumulated other comprehensive income 13,713 18,613 Total Global Medical REIT Inc.
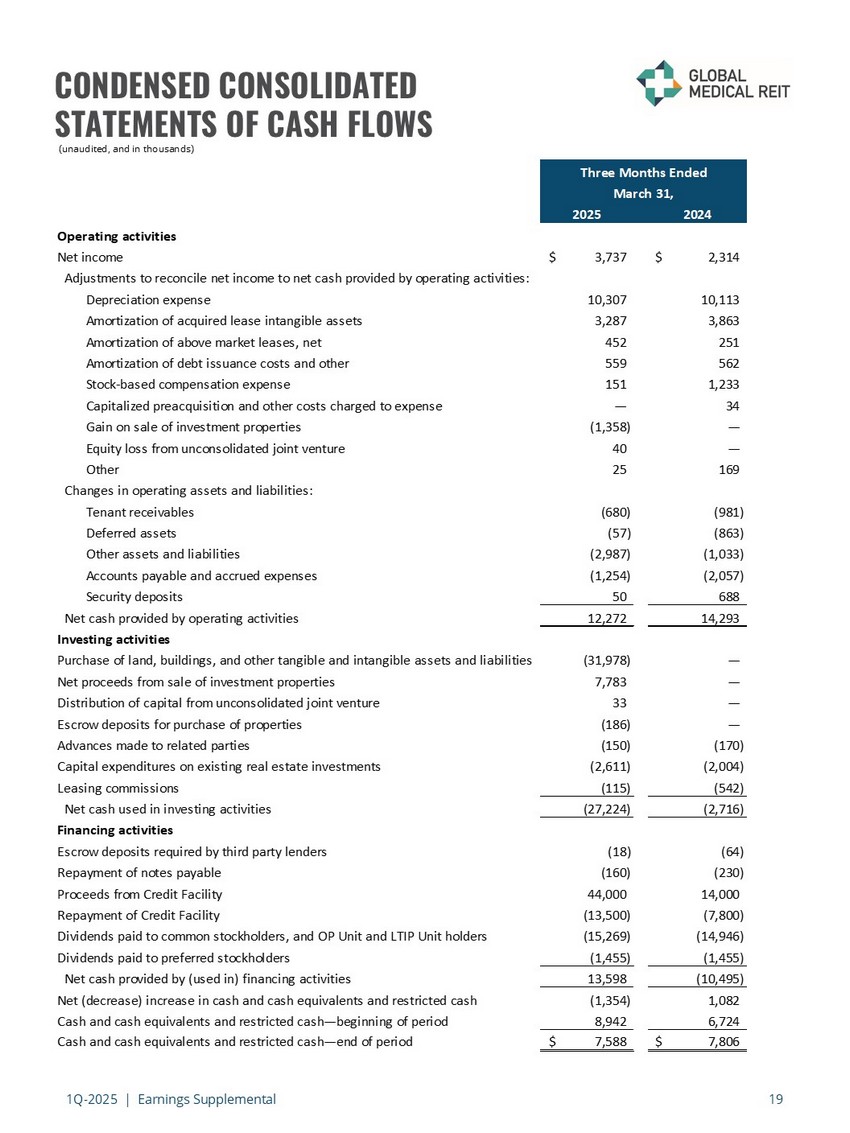
stockholders' equity 517,352 534,126 Noncontrolling interest 20,751 21,790 Total equity 538,103 555,916 Total liabilities and equity 1,269,555$ 1,256,486$ As of 1Q - 2025 | Earnings Supplemental 19 CONDENSED CONSOLIDATED STATEMENTS OF CASH FLOWS (unaudited, and in thousands) 2025 2024 Operating activities Net income 3,737$ 2,314$ Adjustments to reconcile net income to net cash provided by operating activities: Depreciation expense 10,307 10,113 Amortization of acquired lease intangible assets 3,287 3,863 Amortization of above market leases, net 452 251 Amortization of debt issuance costs and other 559 562 Stock-based compensation expense 151 1,233 Capitalized preacquisition and other costs charged to expense — 34 Gain on sale of investment properties (1,358) — Equity loss from unconsolidated joint venture 40 — Other 25 169 Changes in operating assets and liabilities: Tenant receivables (680) (981) Deferred assets (57) (863) Other assets and liabilities (2,987) (1,033) Accounts payable and accrued expenses (1,254) (2,057) Security deposits 50 688 Net cash provided by operating activities 12,272 14,293 Investing activities Purchase of land, buildings, and other tangible and intangible assets and liabilities (31,978) — Net proceeds from sale of investment properties 7,783 — Distribution of capital from unconsolidated joint venture 33 — Escrow deposits for purchase of properties (186) — Advances made to related parties (150) (170) Capital expenditures on existing real estate investments (2,611) (2,004) Leasing commissions (115) (542) Net cash used in investing activities (27,224) (2,716) Financing activities Escrow deposits required by third party lenders (18) (64) Repayment of notes payable (160) (230) Proceeds from Credit Facility 44,000 14,000 Repayment of Credit Facility (13,500) (7,800) Dividends paid to common stockholders, and OP Unit and LTIP Unit holders (15,269) (14,946) Dividends paid to preferred stockholders (1,455) (1,455) Net cash provided by (used in) financing activities 13,598 (10,495) Net (decrease) increase in cash and cash equivalents and restricted cash (1,354) 1,082 Cash and cash equivalents and restricted cash—beginning of period 8,942 6,724 Cash and cash equivalents and restricted cash—end of period 7,588$ 7,806$ Three Months Ended March 31, 1Q - 2025 | Earnings Supplemental *See pages 21 and 22 for definitions of FFO, AFFO, EBITDAre and Adjusted EBITDAre 20 NON - GAAP RECONCILIATIONS* (unaudited, and in thousands, except per share and unit amounts) (1) Includes joint venture interest, depreciation and amortization and gain on sale of investment properties, if applicable, incl ude d in joint venture net income or loss.
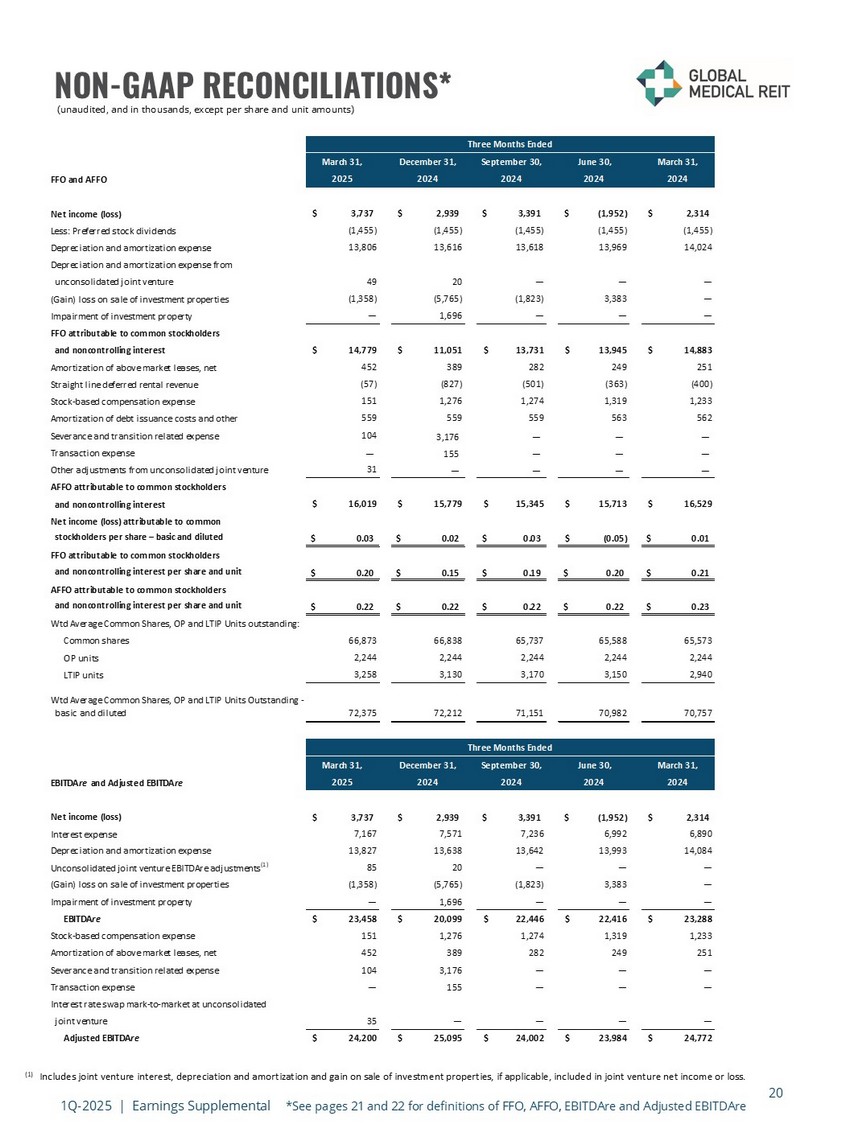
March 31, December 31, September 30, June 30, March 31, FFO and AFFO 2025 2024 2024 2024 2024 Net income (loss) 3,737$ 2,939$ 3,391$ (1,952)$ 2,314$ Less: Preferred stock dividends (1,455) (1,455) (1,455) (1,455) (1,455) Depreciation and amortization expense 13,806 13,616 13,618 13,969 14,024 Depreciation and amortization expense from unconsolidated joint venture 49 20 — — — (Gain) loss on sale of investment properties (1,358) (5,765) (1,823) 3,383 — Impairment of investment property — 1,696 — — — FFO attributable to common stockholders and noncontrolling interest $ 14,779 $ 11,051 $ 13,731 $ 13,945 $ 14,883 Amortization of above market leases, net 452 389 282 249 251 Straight line deferred rental revenue (57) (827) (501) (363) (400) Stock-based compensation expense 151 1,276 1,274 1,319 1,233 Amortization of debt issuance costs and other 559 559 559 563 562 Severance and transition related expense 104 3,176 — — — Transaction expense — 155 — — — Other adjustments from unconsolidated joint venture 31 — — — — AFFO attributable to common stockholders and noncontrolling interest $ 16,019 $ 15,779 $ 15,345 $ 15,713 $ 16,529 Net income (loss) attributable to common stockholders per share – basic and diluted 0.03$ 0.02$ 0.03$ (0.05)$ 0.01$ FFO attributable to common stockholders and noncontrolling interest per share and unit 0.20$ 0.15$ 0.19$ 0.20$ 0.21$ AFFO attributable to common stockholders and noncontrolling interest per share and unit 0.22$ 0.22$ 0.22$ 0.22$ 0.23$ Wtd Average Common Shares, OP and LTIP Units outstanding: Common shares 66,873 66,838 65,737 65,588 65,573 OP units 2,244 2,244 2,244 2,244 2,244 LTIP units 3,258 3,130 3,170 3,150 2,940 Wtd Average Common Shares, OP and LTIP Units Outstanding - basic and diluted 72,375 72,212 71,151 70,982 70,757 March 31, December 31, September 30, June 30, March 31, EBITDAre and Adjusted EBITDAre 2025 2024 2024 2024 2024 Net income (loss) 3,737$ 2,939$ 3,391$ (1,952)$ 2,314$ Interest expense 7,167 7,571 7,236 6,992 6,890 Depreciation and amortization expense 13,827 13,638 13,642 13,993 14,084 Unconsolidated joint venture EBITDAre adjustments (1) 85 20 — — — (Gain) loss on sale of investment properties (1,358) (5,765) (1,823) 3,383 — Impairment of investment property — 1,696 — — — EBITDAre $ 23,458 $ 20,099 $ 22,446 $ 22,416 $ 23,288 Stock-based compensation expense 151 1,276 1,274 1,319 1,233 Amortization of above market leases, net 452 389 282 249 251 Severance and transition related expense 104 3,176 — — — Transaction expense — 155 — — — Interest rate swap mark-to-market at unconsolidated joint venture 35 — — — — Adjusted EBITDAre $ 24,200 $ 25,095 $ 24,002 $ 23,984 $ 24,772 Three Months Ended Three Months Ended 1Q - 2025 | Earnings Supplemental 21 REPORTING DEFINITIONS AND OTHER DISCLOSURES Annualized Base Rent Annualized base rent represents monthly base rent for March 2025 (or, for recent acquisitions, monthly base rent for the month of acquisition), multiplied by 12 (or base rent net of annualized expenses for properties with gross leases).
Accordingly, this methodology produces an annualized amount as of a point in time but does not take into account future ( i ) contractual rental rate increases, (ii) leasing activity or (iii) lease expirations. Additionally, leases that are accounte d f or on a cash - collected basis, or that are in a free rent period, are not included in annualized base rent. Capitalization Rate The capitalization rate (“Cap Rate”) for an acquisition is calculated by dividing current Annualized Base Rent by contractual purchase price. For the portfolio cap rate, certain adjustments, including for subsequent capital invested, are made to the contractual purchase price. Funds from Operations Attributable to Common Stockholders and Noncontrolling Interest and Adjusted Funds from Operations Attributable to Common Stockholders and Noncontrolling Interest Funds from operations attributable to common stockholders and noncontrolling interest (“FFO”) and adjusted funds from operations attributable to common stockholders and noncontrolling interest (“AFFO”) are non - GAAP financial measures within the meaning of the rules of the SEC. The Company considers FFO and AFFO to be important supplemental measures of its operating performance and believes FFO is frequently used by securities analysts, investors, and other interested parties in the evaluation of REITs, many of which present FFO when reporting their results. In accordance with the National Association of Real Estate Investment Trusts’ (“NAREIT”) definition, FFO means net income or loss computed in accordance with GAAP before noncontrolling interests of holders of OP units and LTIP units, excluding gains (or losses) from sales of property and extraordinary items, property impairment losses, less preferred stock dividends, plus real estate - related depreciation and amortization (excluding amortization of debt issuance costs and the amortization of above and below market leases), and after adjustments for unconsolidated partnerships and joint ventures calculated to reflect FFO on the same basis. Because FFO excludes real estate - related depreciation and amortization (other than amortization of debt issuance costs and above and below market lease amortization expense), the Company believes that FFO provides a performance measure that, when compared period - over - period, reflects the impact to operations from trends in occupancy rates, rental rates, operating costs, development activities and interest costs, providing perspective not immediately apparent from the closest GAAP measurement, net income or loss. AFFO is a non - GAAP measure used by many investors and analysts to measure a real estate company’s operating performance by removing the effect of items that do not reflect ongoing property operations. Management calculates AFFO by modifying the NAREIT computation of FFO by adjusting it for certain cash and non - cash items and certain recurring and non - recurring items. For the Company these items include: (a) recurring acquisition and disposition costs, (b) loss on the extinguishment of debt, (c) recurring straight line deferred rental revenue, (d) recurring stock - based compensation expense, (e) recurring amortization of above and below market leases, (f) recurring amortization of debt issuance costs, (g) severance and transition related expense and (h) other items related to unconsolidated partnerships and joint ventures. Management believes that reporting AFFO in addition to FFO is a useful supplemental measure for the investment community to use when evaluating the operating performance of the Company on a comparative basis. Earnings Before Interest, Taxes, Depreciation and Amortization for Real Estate (“ EBITDAre ” and “Adjusted EBITDAre ”) We calculate EBITDAre in accordance with standards established by NAREIT and define EBITDAre as net income or loss computed in accordance with GAAP plus depreciation and amortization, interest expense, gain or loss on the sale of investment properties, property impairment losses, and adjustments for unconsolidated partnerships and joint ventures, to reflect EBITDAre on the same basis, as applicable. We define Adjusted EBITDAre as EBITDAre plus loss on extinguishment of debt, non - cash stock compensation expense, non - cash intangible amortization related to above and below market leases, severance and transition related expense, transaction expense, adjustments related to our investment in unconsolidated joint ventures, and other normalizing items. Management considers EBITDAre and Adjusted EBITDAre important measures because they provide additional information to allow management, investors, and our current and potential creditors to evaluate and compare our core operating results and our ability to service debt.
1Q - 2025 | Earnings Supplemental 22 REPORTING DEFINITIONS AND OTHER DISCLOSURES Rent Coverage Ratio For purposes of calculating our portfolio weighted - average EBITDARM coverage ratio (“Rent Coverage Ratio”), we excluded credit - rated tenants or their subsidiaries for which financial statements were either not available or not sufficiently detailed. These ratios are based on the latest available information only. Most tenant financial statements are unaudited and we have not independently verified any tenant financial information (audited or unaudited) and, therefore, we cannot assure you that such information is accurate or complete. Certain other tenants (approximately 21% of our portfolio) are excluded from the calculation due to (i) lack of available financial information or (ii) small tenant size. Additionally, included within 21 % of non - reporting tenants is Pipeline Healthcare, LLC, which (i) was sold to Heights Healthcare in October 2023 and is being operated under new management and (ii) occupies our only acute care hospital asset, which is not one of our core asset classes. Additionally, our Rent Coverage Ratio adds back physician distributions and compensation. Management believes all adjustments are reasonable and necessary. Other Disclosures Non - GAAP Financial Measures Management considers certain non - GAAP financial measures to be useful supplemental measures of the Company's operating performance. For the Company, non - GAAP measures consist of FFO attributable to common stockholders and noncontrolling interest, AFFO attributable to common stockholders and noncontrolling interest, EBITDAre and Adjusted EBITDAre . A non - GAAP financial measure is generally defined as one that purports to measure financial performance, financial position or cash flows, but excludes or includes amounts that would not be so adjusted in the most comparable measure determined in accordance with GAAP. The Company reports non - GAAP financial measures because these measures are observed by management to also be among the most predominant measures used by the REIT industry and by industry analysts to evaluate REITs. For these reasons, management deems it appropriate to disclose and discuss these non - GAAP financial measures. The non - GAAP financial measures presented herein are not necessarily identical to those presented by other real estate companies due to the fact that not all real estate companies use the same definitions. These measures should not be considered as alternatives to net income, as indicators of the Company's financial performance, or as alternatives to cash flow from operating activities as measures of the Company's liquidity, nor are these measures necessarily indicative of sufficient cash flow to fund all of the Company's needs. Management believes that in order to facilitate a clear understanding of the Company's historical consolidated operating results, these measures should be examined in conjunction with net income and cash flows from operations as presented elsewhere herein. Additional Information The information in this document should be read in conjunction with the Company’s Annual Report on Form 10 - K, Quarterly Reports on Form 10 - Q, Current Reports on Form 8 - K, and other information filed with, or furnished to, the SEC. You can access the Company’s reports and amendments to those reports filed or furnished to the SEC pursuant to Section 13(a) or 15(d) of the Exchange Act in the “Investor Relations” section on the Company’s website (www.globalmedicalreit.com) under “SEC Filings” as soon as reasonably practicable after they are filed with, or furnished to, the SEC. The information on or connected to the Company’s website is not, and shall not be deemed to be, a part of, or incorporated into, this Earnings Supplemental. You also can review these SEC filings and other information by accessing the SEC’s website at http://www.sec.gov . Certain information contained in this package, including, but not limited to, information contained in our Top 10 tenant profiles is derived from publicly - available third - party sources. The Company has not independently verified this information and there can be no assurance that such information is accurate or complete.

INVESTOR RELATIONS globalmedicalreit.com NYSE: GMRE Stephen Swett 203.682.8377 stephen.swett@icrinc.com