UNITED STATES
SECURITIES AND EXCHANGE COMMISSION
Washington, D.C. 20549
FORM 8-K
CURRENT REPORT
Pursuant to Section 13 or 15(d) of the Securities Exchange Act of 1934
Date of Report (Date of earliest event reported): October 24, 2024
Primis Financial Corp.
(Exact Name of Registrant as Specified in its Charter)
| Virginia | 001-33037 | 20-1417448 |
| (State or Other Jurisdiction of Incorporation) |
(Commission File Number) | (I.R.S. Employer Identification Number) |
1676 International Drive, Suite 900, McLean, Virginia 22102
(Address of Principal Executive Offices) (Zip Code)
(703) 893-7400
(Registrant's telephone number, including area code)
Not Applicable
(Former name or former address, if changed since last report)
Check the appropriate box below if the Form 8-K filing is intended to simultaneously satisfy the filing obligation of the registrant under any of the following provisions:
| ¨ | Written communications pursuant to Rule 425 under the Securities Act (17 CFR 230.425) |
| ¨ | Soliciting material pursuant to Rule 14a-12 under the Exchange Act (17 CFR 240.14a-12) |
| ¨ | Pre-commencement communications pursuant to Rule 14d-2(b) under the Exchange Act (17 CFR 240.14d-2(b)) |
| ¨ | Pre-commencement communications pursuant to Rule 13e-4(c) under the Exchange Act (17 CFR 240.13e-4(c)) |
Securities registered pursuant to Section 12(b) of the Act:
| Title of each class | Trading Symbol(s) | Name of each exchange on which registered | ||
| COMMON STOCK | FRST | NASDAQ |
Indicate by check mark whether the registrant is an emerging growth company as defined in Rule 405 of the Securities Act of 1933 (§230.405 of this chapter) or Rule 12b-2 of the Securities Exchange Act of 1934 (§240.12b-2 of this chapter). Emerging growth company ¨
If an emerging growth company, indicate by check mark if the registrant has elected not to use the extended transition period for complying with any new or revised financial accounting standards provided pursuant to Section 13(a) of the Exchange Act. ¨
Item 2.02. Results of Operations and Financial Condition.
On October 24, 2024, Primis Financial Corp. (“Primis” or the “Company”) issued a press release announcing its financial results for the three months ended September 30, 2024. A copy of the press release is furnished and attached hereto as Exhibit 99.1 to this Current Report on Form 8-K and incorporated herein by reference.
Item 7.01. Regulation FD Disclosure.
The Company has prepared presentation materials (the “Investor Presentation”) that management intends to use from time to time hereafter in presentations about the Company’s operations and performance. The Company may use the Investor Presentation, possibly with modifications, in presentations to current and potential investors, analysts, lenders, business partners, acquisition candidates, customers, employees and others with an interest in the Company and its business.
A copy of the Investor Presentation is furnished as Exhibit 99.2 to this Current Report on Form 8-K and incorporated herein by reference. The Investor Presentation is also available on the Company's website at www.primisbank.com. Materials on the Company’s website are not part of or incorporated by reference into this report.
In accordance with General Instruction B.2 of Form 8-K, the information in this Current Report on Form 8-K, including Exhibits 99.1 and 99.2 attached hereto, shall not be deemed to be “filed” for purposes of Section 18 of the Securities Exchange Act of 1934, as amended (the “Exchange Act”), or otherwise subject to the liability of that section, and shall not be incorporated by reference into any filing under the Securities Act of 1933, as amended, or the Exchange Act, except as shall be expressly set forth by specific reference in such filing.
Item 8.01. Other Events.
On October 24, 2024, Primis issued a press release announcing the declaration of a dividend payable on November 22, 2024 to shareholders of record as of November 8, 2024. A copy of the press release is filed as Exhibit 99.1 to this Current Report on Form 8-K and incorporated herein by reference.
Item 9.01. Financial Statements and Exhibits.
(d) Exhibits
| 99.1 | Press Release dated October 24, 2024 |
| 99.2 | Primis Financial Corp. Third Quarter 2024 Investor Presentation |
| 104 | Cover Page Interactive Data File - the cover page XBRL tags are embedded within the Inline XBRL document |
SIGNATURE
Pursuant to the requirements of the Securities Exchange Act of 1934, the registrant has duly caused this report to be signed on its behalf by the undersigned hereunto duly authorized.
| Primis Financial Corp. | ||
| Date: October 24, 2024 | By: | /s/ Matthew A. Switzer |
| Matthew A. Switzer | ||
| Chief Financial Officer | ||
Exhibit 99.1

Primis Financial Corp. Reports Earnings per Share for the Third Quarter of 2024
Announces Sale of Life Premium Finance Division
Announces Expansion of Mortgage Warehouse Lending Team
Declares Quarterly Cash Dividend of $0.10 Per Share
For immediate release
Thursday, October 24, 2024
McLean, Virginia, October 24, 2024 – Primis Financial Corp. (NASDAQ: FRST) (“Primis” or the “Company”), and its wholly-owned subsidiary, Primis Bank (the “Bank”), today reported net income available to common shareholders of $1.2 million or $0.05 per diluted share for the quarter ended September 30, 2024, compared to a net loss available to common shareholders of $6.0 million or $0.24 per diluted share for the quarter ended September 30, 2023. For the year-to-date period in 2024, the Company reported earnings available to common and diluted earnings per share of $7.5 million and $0.30, respectively, compared to $0.3 million and $0.01, respectively, in the same period in 2023. Earnings for the three month and year-to-date periods are highly affected by the Company’s corrected accounting for a third-party originated consumer portfolio.
Earnings for the three month and year-to-date period in 2024 include $0.8 million and $2.2 million, respectively, or $0.03 and $0.09 per diluted share, respectively, of after-tax nonrecurring charges versus $11.3 million and $12.5 million, respectively, or $0.45 and $0.51 per diluted share, respectively in the comparable 2023 periods and inclusive of the goodwill impairment in the third quarter of 2023. Adjusting for these items, operating net income available to common shareholders was $2.0 million(1) or $0.08 per diluted share(1) for the quarter ended September 30, 2024, compared to net operating income available to common shareholders of $5.3 million(1) or $0.21 per diluted share(1) for the quarter ended September 30, 2023. For the year-to-date period in 2024 when adjusting for these items, earnings available to common and diluted earnings per share was $9.6 million(1) and $0.39(1), respectively, compared to $12.8 million(1) and $0.52(1), respectively, in the same period in 2023.
Sale of Life Premium Finance Division
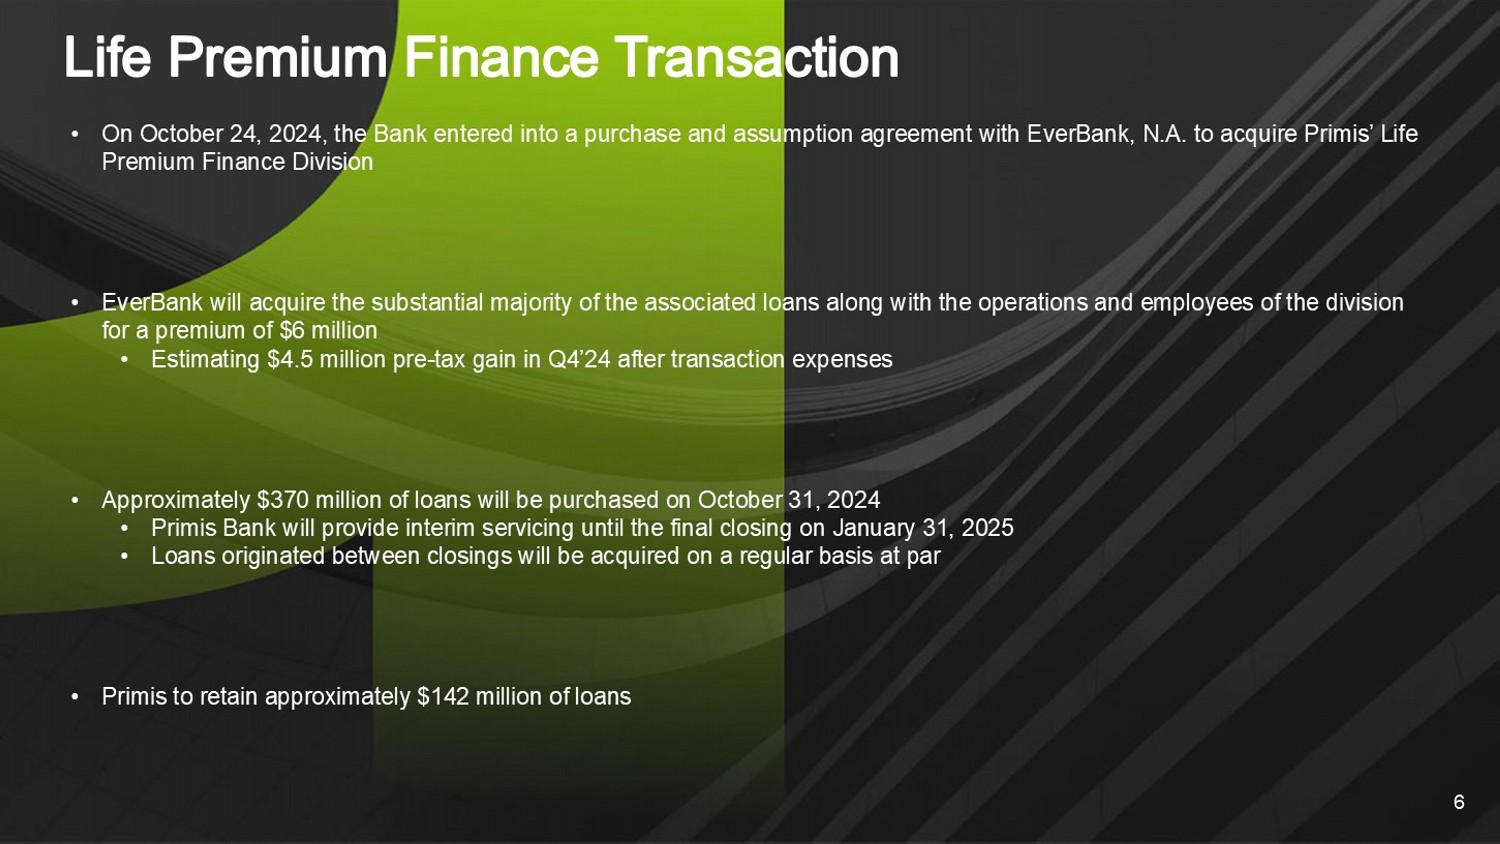
On October 24, 2024, Primis Bank and EverBank, N.A. (“EverBank”) entered into a purchase and assumption agreement whereby EverBank will acquire the Life Premium Finance Division from Primis Bank including all the associated loans, except for a subset of mostly fixed rate and rate-capped loans retained by the Bank, and the operations of the division, including its employees, for a premium of $6.0 million. Primis Bank expects to record a pre-tax gain of $4.5 million net of advisory and legal fees in the fourth quarter of 2024.
On October 31, 2024, EverBank will acquire approximately $370 million of loans from the division with Primis Bank providing interim servicing until the transition of the business at the final closing which is expected on January 31, 2025. Between the first and second closings, EverBank will purchase loans generated by the division in ordinary course at par. After the second closing, EverBank will service the Bank’s retained portfolio for the duration of the portfolio.
(1) Non-GAAP financial measure. Please see “Reconciliation of Non-GAAP Items” in the financial tables for more information and for a reconciliation to GAAP.
Dennis J. Zember, Jr., President and Chief Executive Officer of Primis commented, “Three years ago we hired a set of professionals with a vision to build a tech-forward solution for life insurance premium finance. This platform has been widely accepted and used by the industry’s facilitators to such a degree that its opportunity is bigger than our balance sheet. EverBank is known for investing in scalable businesses with attractive risk-adjusted returns which makes our life premium finance team a perfect fit.”
Mortgage Warehouse Lending Team Expansion
In early October of 2024, Primis hired a seasoned team of mortgage warehouse lending professionals from a larger bank with a very successful track record in this space. While Primis Bank has had mortgage warehouse lending capabilities for some time, production had been limited while the Bank searched for the right leadership. Four key individuals have joined the Bank comprising sales, operations and portfolio management with another four to five support staff expected in the coming months.
Commented Mr. Zember, “Mortgage warehouse lending as an asset class has very attractive returns and limited losses. With several very large banks exiting the space and mortgage volumes projected to increase substantially, we believe this is a perfect time to expand our capabilities. Knowing the team we hired and having visited quite a few of their customers, I believe we can replace all of the life premium business we are selling with yields that are 125bps to 150bps higher. I expect the credit results and operating expense burdens to be similar so we believe the bottom-line impact will be significant as we scale this operation.”
Discussion of Results
The following table highlights selected financial data for the last five quarters:
| 3Q 2024 | 2Q 2024 | 1Q 2024 | 4Q 2023 | 3Q 2023 | ||||||||||||||||
| Return on average assets | 0.12 | % | 0.39 | % | 0.26 | % | (0.85 | )% | (0.62 | )% | ||||||||||
| Operating return on average assets(1) | 0.20 | % | 0.50 | % | 0.29 | % | (0.79 | )% | 0.54 | % | ||||||||||
| Pre-tax pre-provision return on average assets(1) | 0.85 | % | 0.78 | % | 1.02 | % | 0.96 | % | (0.33 | )% | ||||||||||
| Pre-tax pre-prov. operating return on average assets(1) | 0.95 | % | 0.92 | % | 1.05 | % | 1.01 | % | (0.30 | )% | ||||||||||
| Return on average common equity | 1.28 | % | 4.06 | % | 2.62 | % | (8.43 | )% | (6.11 | )% | ||||||||||
| Operating return on average common equity(1) | 2.11 | % | 5.18 | % | 2.99 | % | (7.91 | )% | 5.35 | % | ||||||||||
| Operating return on avg. tangible common equity(1) | 2.80 | % | 6.93 | % | 3.98 | % | (10.53 | )% | 7.35 | % | ||||||||||
| Cost of funds | 3.25 | % | 3.16 | % | 2.97 | % | 2.85 | % | 2.75 | % | ||||||||||
| Net interest margin | 2.97 | % | 2.72 | % | 2.84 | % | 2.86 | % | 2.70 | % | ||||||||||
| Gross loans to deposits | 89.68 | % | 98.95 | % | 97.37 | % | 98.45 | % | 96.37 | % | ||||||||||
| Efficiency ratio | 83.22 | % | 82.62 | % | 77.41 | % | 81.31 | % | 108.50 | % | ||||||||||
| Operating efficiency ratio(1) | 80.35 | % | 78.86 | % | 76.17 | % | 79.43 | % | 75.17 | % | ||||||||||
As disclosed in our recent filings with the SEC, the Company has corrected its method for accounting for a third-party originated and serviced consumer loan portfolio (the “Consumer Program”) and in which the separate agreements comprising the portfolio are treated as separate units of account (See “Critical Accounting Estimates and Policies” in the Company’s 2023 Form 10-K). A subset of the Consumer Program has promotional characteristics where interest is deferred during the promotional period and is waived if the customer pays off the loan prior to the period end. In that event, the third-party reimburses the Bank for the waived interest. Until the end of the promotional period, the Company is unable to accrue interest on the loan under GAAP but does record a derivative representing the fair value of expected interest reimbursements from the third-party. Credit costs are also fully included in the Company’s results, including estimated life of loan losses required by ASC 326 while potential credit enhancements from the Consumer Program are only reflected as received. Total outstanding balances in the Consumer Program were $180 million as of September 30, 2024 versus $194 million at June 30, 2024.
(1) Non-GAAP financial measure. Please see “Reconciliation of Non-GAAP Items” in the financial tables for more information and for a reconciliation to GAAP.
Net Interest Income
Net interest income increased approximately $3.2 million, or 13%, to $28.0 million during the third quarter of 2024 compared to the second quarter of 2024 largely due to increased interest recognition on previously deferring loans. For the third quarter of 2024, the Company reported a net interest margin of 2.97% versus 2.72% for the second quarter of 2024.
Interest income increased 9.4% to $57.1 million in the third quarter of 2024 compared to $52.2 million during the second quarter of 2024. At September 30, 2024, $60 million of loans were deferring interest due to a promotional feature. The Company recognized $3.0 million of interest in the third quarter of 2024 from promotional loans that were deferring interest and then began amortizing. In addition, in the third quarter of 2024, payoff of promotional loans triggered reimbursement of $2.5 million of deferred interest that was recognized in noninterest income. Promotional loan balances of $17 million and $21 million will reach the end of their promotional periods in the fourth quarter of 2024 and first quarter of 2025, respectively, after which loans with a promotional feature will decline to a nominal amount of the Bank’s portfolio by the end of 2025. Yield on earning assets and loans held for investment were 6.06% and 6.31%, respectively, in the third quarter of 2024 versus 5.72% and 5.91%, respectively, in the second quarter of 2024.
Interest expense increased $1.7 million to $29.1 million in the third quarter of 2024 compared to the second quarter of 2024 largely due to an increased reliance on FHLB funding during the third quarter. Cost of deposits increased 6 basis points to 3.04% in the third quarter of 2024 from 2.98% in the second quarter of 2024. Cost of funds was 3.25% in the third quarter of 2024, an increase of 9 basis points linked-quarter.
Noninterest Income
Noninterest income decreased during the third quarter of 2024 to $9.3 million compared to $11.2 million in the second quarter of 2024. Included in the second quarter of 2024 is approximately $0.9 million of bank-owned life insurance income due to a death benefit payout. Income from mortgage banking activity increased $0.4 million during the third quarter. Offsetting the increase in mortgage banking income was a reduction of $0.4 million in service fees and $1.2 million reduction in income related to the Consumer Program.
Noninterest Expense
Noninterest expense was $31.0 million for the third quarter of 2024, compared to $29.8 million for the second quarter of 2024. Noninterest expense also includes consolidated expenses from Panacea Financial Holdings (“PFH”). Management considers the core expense burden of the Bank that adjusts for certain items such as those that are volume dependent (e.g., mortgage banking related) or nonoperational (e.g., changes in the reserve for unfunded commitments). The following table illustrates the degree to which the Company has managed its operating expense burden during 2024:
| 3Q 2024 | 2Q 2024 | 1Q 2024 | 4Q 2023 | 3Q 2023 | ||||||||||||||||
| Reported Noninterest Expense | 31,045 | 29,786 | 27,538 | 27,780 | 36,950 | |||||||||||||||
| PFH Consolidated Expenses | (2,666 | ) | (2,347 | ) | (2,119 | ) | (2,813 | ) | - | |||||||||||
| Noninterest Expense Excl. PFH | 28,379 | 27,439 | 25,419 | 24,967 | 36,950 | |||||||||||||||
| Nonrecurring / Goodwill Impair. | (1,352 | ) | (1,453 | ) | (438 | ) | (165 | ) | (11,350 | ) | ||||||||||
| Mortgage Expenses | (6,436 | ) | (6,084 | ) | (5,122 | ) | (4,785 | ) | (5,108 | ) | ||||||||||
| Consumer Program Servicing Fee | (699 | ) | (312 | ) | (312 | ) | (312 | ) | (312 | ) | ||||||||||
| Reserve for Unfunded Commitment | (96 | ) | 546 | 2 | (554 | ) | 257 | |||||||||||||
| Total Adjustments | (8,583 | ) | (7,303 | ) | (5,870 | ) | (5,816 | ) | (16,513 | ) | ||||||||||
| Core Operating Expense Burden | 19,796 | 20,136 | 19,550 | 19,151 | 20,437 | |||||||||||||||
(1) Non-GAAP financial measure. Please see “Reconciliation of Non-GAAP Items” in the financial tables for more information and for a reconciliation to GAAP.
As noted above, the core expense burden decreased $0.3 million in the third quarter of 2024 from the second quarter of 2024. Core expense burden was $19.8 million, in line with the average for the last five quarters.
Loan Portfolio and Asset Quality
Loans held for investment decreased to $2.97 billion at September 30, 2024, compared to $3.30 billion at June 30, 2024. As noted above, the Bank has entered into an agreement to sell approximately $370 million of life premium finance loans and which have been reclassified to loans held for sale at September 30, 2024. Including these balances, loans held for investment would have increased 1.1% unannualized in the third quarter of 2024. The Panacea and Life Premium Finance divisions had loan growth of 4.4% and 11.1%, respectively, in the third quarter of 2024.
Nonperforming assets, excluding portions guaranteed by the SBA, were only 0.25% of total assets, or $10.2 million at September 30, 2024, compared to 0.25% or $9.9 million at June 30, 2024. Loans rated substandard were $47.6 million in the third quarter of 2024 compared to $15.5 million in the second quarter of 2024. The increase was largely driven by a single commercial credit that has experienced slower lease activity past its construction phase. Management evaluated and valued the property using conservative cap rates and lengthy times to lease and included the shortfall in its specific reserve. The Bank had no other real estate owned at the end of the third quarter of 2024.
The Company recorded a provision for loan losses of $7.5 million for the third quarter of 2024 versus $3.1 million for the second quarter of 2024. Of this provision, $4.0 million was due to Consumer Program activity. The remaining provision was due to specific reserves established on individually evaluated credits, approximately $2.2 million of which was tied to the commercial credit described above. As a percentage of loans, including life premium finance loans classified as held-for-sale at the end of the third quarter, the allowance for credit losses was 1.53% and 1.56% at the end of the third and second quarter of 2024, respectively.
Net charge-offs were $8.0 million for the third quarter of 2024, up from $5.0 million for the second quarter of 2024. Consumer Program net charge-offs were $6.7 million in the third quarter versus $4.4 million in the second quarter of 2024. Core net charge-offs, excluding those losses from the Consumer Program, were $1.3 million, or 0.15% of average loans, in the third quarter of 2024 compared to $0.6 million, or 0.07%, in the second quarter of 2024.
Deposits and Funding
Total deposits at September 30, 2024 decreased slightly to $3.31 billion from $3.34 billion at June 30, 2024. Importantly, noninterest bearing deposits were $421 million at September 30, 2024, up slightly from $420 million at June 30, 2024 and in the face of substantial remixing activity towards interest bearing accounts.
Deposit growth in the Bank continues to benefit from better technology and unique convenience factors. V1BE, the Bank’s proprietary invitation-only delivery tool, increased total users by 5% during the third quarter of 2024, and now has over 2,400 users on the platform as of September 30, 2024.
During the third quarter of 2024, the Bank opened approximately $32.5 million new deposit accounts on the digital platform with very modest marketing expenses. At quarter end, the Bank had over 17,000 digital accounts with $911 million in total deposits and average balances of approximately $53 thousand.
As of September 30, 2024, the Bank has $75.0 million of brokered CDs that mature at the end of 2024 and $165.0 million of short-term FHLB advances.
Lines of Business
The Panacea Financial Division continues to experience substantial growth alongside the development of the nationally-recognized Panacea Financial brand. The Panacea Financial Division finished the third quarter of 2024 with approximately $392 million in outstanding loans, an increase of $16.5 million from June 30, 2024. Panacea-related deposits were $90 million at September 30, 2024 with a weighted average cost of 2.00%. Panacea continues to roll out innovative technology capabilities that is expected to continue increasing the amount with which it self-funds its balance sheet.
(1) Non-GAAP financial measure. Please see “Reconciliation of Non-GAAP Items” in the financial tables for more information and for a reconciliation to GAAP.
Primis Mortgage had pre-tax income of $1.0 million in the third quarter of 2024 up from $0.9 million in the previous quarter. Locked loan volumes averaged $56.1 million per month in the third quarter of 2024, up from $52.0 million per month in the second quarter of 2024. Primis Mortgage continues to aggressively manage costs to preserve profitability in a lower volume environment while selectively adding talent to grow production.
Shareholders’ Equity
Book value per common share as of September 30, 2024 was $15.43, an increase of $0.20 from June 30, 2024. Tangible book value per common share(1) at the end of the third quarter of 2024 was $11.61, an increase of $0.21 from June 30, 2024. Common shareholders’ equity was $381 million, or 9.48% of total assets, at September 30, 2024. Tangible common equity(1) at September 30, 2024 was $287 million, or 7.30% of tangible assets(1). After-tax unrealized losses on the Company’s available-for-sale securities portfolio decreased by $6.0 million to $17.1 million due to decreases in market interest rates during the third quarter of 2024. The Company has the intent and ability to hold these securities until maturity or recovery of the value and does not anticipate realizing any losses on the investments.
The Board of Directors declared a dividend of $0.10 per share payable on November 22, 2024 to shareholders of record on November 8, 2024. This is Primis’ fifty-second consecutive quarterly dividend.
About Primis Financial Corp.
As of September 30, 2024, Primis had $4.0 billion in total assets, $2.9 billion in total loans held for investment and $3.3 billion in total deposits. Primis Bank provides a range of financial services to individuals and small- and medium-sized businesses through twenty-four full-service branches in Virginia and Maryland and provides services to customers through certain online and mobile applications.
| Contacts: | Address: |
| Dennis J. Zember, Jr., President and CEO | Primis Financial Corp. |
| Matthew A. Switzer, EVP and CFO | 1676 International Drive, Suite 900 |
| Phone: (703) 893-7400 | McLean, VA 22102 |
Primis Financial Corp., NASDAQ Symbol FRST
Website: www.primisbank.com
Conference Call
The Company’s management will host a conference call to discuss its third quarter results on Friday, October 25, 2024 at 10:00 a.m. (ET). A live Webcast of the conference call is available at the following website: https://events.q4inc.com/attendee/853860984. Participants may also call 1-888-330-3573 and ask for the Primis Financial Corp. call. A replay of the teleconference will be available for 7 days by calling 1-800-770-2030 and providing Replay Access Code 4440924.
Non-GAAP Measures
Statements included in this press release include non-GAAP financial measures and should be read along with the accompanying tables. Primis uses non-GAAP financial measures to analyze its performance. The measures entitled net income adjusted for nonrecurring income and expenses; pre-tax pre-provision operating earnings; operating return on average assets; pre-tax pre-provision operating return on average assets; operating return on average equity; operating return on average tangible equity; operating efficiency ratio; operating earnings per share – basic; operating earnings per share – diluted; tangible book value per share; tangible common equity; tangible common equity to tangible assets; and core net interest margin are not measures recognized under GAAP and therefore are considered non-GAAP financial measures. We use the term “operating” to describe a financial measure that excludes income or expense considered to be non-recurring in nature. Items identified as non-operating are those that, when excluded from a reported financial measure, provide management or the reader with a measure that may be more indicative of forward-looking trends in our business. A reconciliation of these non-GAAP financial measures to the most comparable GAAP measures is provided in the Reconciliation of Non-GAAP Items table.
(1) Non-GAAP financial measure. Please see “Reconciliation of Non-GAAP Items” in the financial tables for more information and for a reconciliation to GAAP.
Management believes that these non-GAAP financial measures provide additional useful information about Primis that allows management and investors to evaluate the ongoing operating results, financial strength and performance of Primis and provide meaningful comparison to its peers. Non-GAAP financial measures should not be considered as an alternative to any measure of performance or financial condition as promulgated under GAAP, and investors should consider Primis’ performance and financial condition as reported under GAAP and all other relevant information when assessing the performance or financial condition of Primis. Non-GAAP financial measures are not standardized and, therefore, it may not be possible to compare these measures with other companies that present measures having the same or similar names.
Non-GAAP financial measures have limitations as analytical tools, and investors should not consider them in isolation or as a substitute for analysis of the results or financial condition as reported under GAAP.
Forward-Looking Statements
This press release and certain of our other filings with the Securities and Exchange Commission contain statements that constitute “forward-looking statements” within the meaning of, and subject to the protections of, Section 27A of the Securities Act of 1933, as amended, and Section 21E of the Securities Exchange Act of 1934, as amended. All statements other than statements of historical fact are forward-looking statements. Such statements can generally be identified by such words as "may," "plan," "contemplate," "anticipate," "believe," "intend," "continue," "expect," "project," "predict," "estimate," "could," "should," "would," "will," and other similar words or expressions of the future or otherwise regarding the outlook for the Company’s future business and financial performance and/or the performance of the banking industry and economy in general. These forward-looking statements include, but are not limited to, our expectations regarding our future operating and financial performance, including the preliminary estimated financial and operating information presented herein, which is subject to adjustment; our outlook and long-term goals for future growth and new offerings and services; our expectations regarding net interest margin; expectations on our growth strategy, expense management, capital management and future profitability; expectations on credit quality and performance; and the assumptions underlying our expectations.
Prospective investors are cautioned that any such forward-looking statements are not guarantees of future performance and involve known and unknown risks and uncertainties which may cause the actual results, performance or achievements of the Company to be materially different from the future results, performance or achievements expressed or implied by such forward-looking statements. Forward-looking statements are based on the information known to, and current beliefs and expectations of, the Company’s management and are subject to significant risks and uncertainties. Actual results may differ materially from those contemplated by such forward-looking statements. Factors that might cause such differences include, but are not limited to: the result of the “pre-clearance” process with the Office of the Chief Accountant of the SEC and the impact on the Company’s financial statements; the possibility that the Company is unable to regain compliance with, or thereafter continue to comply with, applicable Nasdaq Listing Rules, or experience violations of additional Nasdaq Listing Rules; the possibility that Nasdaq may deny the Company’s appeal and delist the Company’s securities; the Company’s ability to implement its various strategic and growth initiatives, including the sale of the Life Premium Finance Division and the impact on the Company’s operating results and its recently established Panacea Financial Division, digital banking platform, V1BE fulfillment service and Primis Mortgage Company; competitive pressures among financial institutions increasing significantly; changes in applicable laws, rules, or regulations, including changes to statutes, regulations or regulatory policies or practices; changes in management’s plans for the future; credit risk associated with our lending activities; the impact of current and future economic and market conditions generally (including seasonality) and in the financial services industry, nationally and within our primary market areas; changes in interest rates, inflation, loan demand, real estate values, or competition, as well as labor shortages and supply chain disruptions; changes in accounting principles, policies, or guidelines; adverse results from current or future litigation, regulatory examinations or other legal and/or regulatory actions; potential impacts of adverse developments in the banking industry highlighted by high-profile bank failures, including impacts on customer confidence, deposit outflows, liquidity and the regulatory response thereto; potential increases in the provision for credit losses; our ability to identify and address increased cybersecurity risks, including those impacting vendors and other third parties; fraud or misconduct by internal or external actors, which we may not be able to prevent, detect or mitigate; acts of God or of war or other conflicts, including the current Ukraine/Russia conflict and Israel/Hamas conflict, acts of terrorism, pandemics or other catastrophic events that may affect general economic conditions; and other general competitive, economic, political, and market factors, including those affecting our business, operations, pricing, products, or services.
Forward-looking statements speak only as of the date on which such statements are made. These forward-looking statements are based upon information presently known to the Company’s management and are inherently subjective, uncertain and subject to change due to any number of risks and uncertainties, including, without limitation, the risks and other factors set forth in the Company’s filings with the Securities and Exchange Commission, the Company’s Annual Report on Form 10-K for the year ended December 31, 2023, under the captions “Cautionary Note Regarding Forward-Looking Statements” and “Risk Factors,” and in the Company’s Quarterly Reports on Form 10-Q and Current Reports on Form 8-K. The Company undertakes no obligation to update any forward-looking statement to reflect events or circumstances after the date on which such statement is made, or to reflect the occurrence of unanticipated events. Readers are cautioned not to place undue reliance on these forward-looking statements.
| Primis Financial Corp. | ||||||||||||||||||||||||||||
| Financial Highlights (unaudited) | ||||||||||||||||||||||||||||
| (Dollars in thousands, except per share data) | For Three Months Ended: | For Nine Months Ended: | ||||||||||||||||||||||||||
| Selected Performance Ratios: | 3Q 2024 | 2Q 2024 | 1Q 2024 | 4Q 2023 | 3Q 2023 | 3Q 2024 | 3Q 2023 | |||||||||||||||||||||
| Return on average assets | 0.12 | % | 0.39 | % | 0.26 | % | (0.85 | )% | (0.62 | )% | 0.25 | % | 0.01 | % | ||||||||||||||
| Operating return on average assets(1) | 0.20 | % | 0.50 | % | 0.29 | % | (0.79 | )% | 0.54 | % | 0.33 | % | 0.43 | % | ||||||||||||||
| Pre-tax pre-provision return on average assets(1) | 0.85 | % | 0.78 | % | 1.02 | % | 0.96 | % | (0.33 | )% | 0.88 | % | 0.48 | % | ||||||||||||||
| Pre-tax pre-provision operating return on average assets(1) | 0.95 | % | 0.92 | % | 1.05 | % | 1.01 | % | (0.30 | )% | 0.98 | % | 0.91 | % | ||||||||||||||
| Return on average common equity | 1.28 | % | 4.06 | % | 2.62 | % | (8.43 | )% | (6.11 | )% | 2.66 | % | 0.11 | % | ||||||||||||||
| Operating return on average common equity(1) | 2.11 | % | 5.18 | % | 2.99 | % | (7.91 | )% | 5.35 | % | 3.44 | % | 4.32 | % | ||||||||||||||
| Operating return on average tangible common equity(1) | 2.80 | % | 6.93 | % | 3.98 | % | (10.53 | )% | 7.35 | % | 4.60 | % | 5.92 | % | ||||||||||||||
| Cost of funds | 3.25 | % | 3.16 | % | 2.97 | % | 2.85 | % | 2.75 | % | 3.13 | % | 2.61 | % | ||||||||||||||
| Net interest margin | 2.97 | % | 2.72 | % | 2.84 | % | 2.86 | % | 2.70 | % | 2.85 | % | 2.61 | % | ||||||||||||||
| Gross loans to deposits | 89.68 | % | 98.95 | % | 97.37 | % | 98.45 | % | 96.37 | % | 89.68 | % | 96.37 | % | ||||||||||||||
| Efficiency ratio | 83.22 | % | 82.62 | % | 77.41 | % | 81.31 | % | 108.50 | % | 81.12 | % | 86.30 | % | ||||||||||||||
| Operating efficiency ratio(1) | 80.35 | % | 78.86 | % | 76.17 | % | 79.43 | % | 75.17 | % | 78.49 | % | 74.56 | % | ||||||||||||||
| Per Common Share Data: | ||||||||||||||||||||||||||||
| Earnings per common share - Basic | $ | 0.05 | $ | 0.15 | $ | 0.10 | $ | (0.33 | ) | $ | (0.24 | ) | $ | 0.30 | $ | 0.01 | ||||||||||||
| Operating earnings per common share - Basic(1) | $ | 0.08 | $ | 0.20 | $ | 0.11 | $ | (0.31 | ) | $ | 0.21 | $ | 0.39 | $ | 0.52 | |||||||||||||
| Earnings per common share - Diluted | $ | 0.05 | $ | 0.15 | $ | 0.10 | $ | (0.33 | ) | $ | (0.24 | ) | $ | 0.30 | $ | 0.01 | ||||||||||||
| Operating earnings per common share - Diluted(1) | $ | 0.08 | $ | 0.20 | $ | 0.11 | $ | (0.31 | ) | $ | 0.21 | $ | 0.39 | $ | 0.52 | |||||||||||||
| Book value per common share | $ | 15.43 | $ | 15.23 | $ | 15.16 | $ | 15.23 | $ | 15.30 | $ | 15.43 | $ | 15.30 | ||||||||||||||
| Tangible book value per common share(1) | $ | 11.61 | $ | 11.40 | $ | 11.31 | $ | 11.37 | $ | 11.42 | $ | 11.61 | $ | 11.42 | ||||||||||||||
| Cash dividend per common share | $ | 0.10 | $ | 0.10 | $ | 0.10 | $ | 0.10 | $ | 0.10 | $ | 0.30 | $ | 0.30 | ||||||||||||||
| Weighted average shares outstanding - Basic | 24,695,685 | 24,683,734 | 24,673,857 | 24,647,728 | 24,641,981 | 24,683,556 | 24,635,535 | |||||||||||||||||||||
| Weighted average shares outstanding - Diluted | 24,719,920 | 24,708,484 | 24,707,113 | 24,687,993 | 24,641,981 | 24,710,345 | 24,635,535 | |||||||||||||||||||||
| Shares outstanding at end of period | 24,722,734 | 24,708,234 | 24,708,588 | 24,693,172 | 24,686,764 | 24,722,734 | 24,686,764 | |||||||||||||||||||||
| Asset Quality Ratios: | ||||||||||||||||||||||||||||
| Non-performing assets as a percent of total assets, excluding SBA guarantees | 0.25 | % | 0.25 | % | 0.23 | % | 0.20 | % | 0.51 | % | 0.25 | % | 0.51 | % | ||||||||||||||
| Net charge-offs (recoveries) as a percent of average loans (annualized) | 0.93 | % | 0.60 | % | 0.64 | % | 0.61 | % | 0.53 | % | 0.52 | % | 0.32 | % | ||||||||||||||
| Core net charge-offs (recoveries) as a percent of average loans (annualized)(2) | 0.15 | % | 0.07 | % | 0.11 | % | 0.24 | % | 0.27 | % | (0.10 | )% | 0.12 | % | ||||||||||||||
| Allowance for credit losses to total loans | 1.72 | % | 1.56 | % | 1.66 | % | 1.62 | % | 1.13 | % | 1.72 | % | 1.13 | % | ||||||||||||||
| Capital Ratios: | ||||||||||||||||||||||||||||
| Common equity to assets | 9.48 | % | 9.49 | % | 9.63 | % | 9.75 | % | 9.84 | % | ||||||||||||||||||
| Tangible common equity to tangible assets(1) | 7.30 | % | 7.27 | % | 7.36 | % | 7.46 | % | 7.53 | % | ||||||||||||||||||
| Leverage ratio(3) | 8.06 | % | 8.25 | % | 8.38 | % | 8.37 | % | 8.60 | % | ||||||||||||||||||
| Common equity tier 1 capital ratio(3) | 8.98 | % | 8.85 | % | 8.97 | % | 8.96 | % | 9.36 | % | ||||||||||||||||||
| Tier 1 risk-based capital ratio(3) | 9.28 | % | 9.14 | % | 9.26 | % | 9.25 | % | 9.66 | % | ||||||||||||||||||
| Total risk-based capital ratio(3) | 12.66 | % | 12.45 | % | 12.61 | % | 13.44 | % | 13.05 | % | ||||||||||||||||||
(1) See Reconciliation of Non-GAAP financial measures.
(2) Excludes third-party charge-offs.
(3) Ratios are estimated and may be subject to change pending the final filing of the FR Y-9C.
| Primis Financial Corp. | ||||||||||||||||||||
| (Dollars in thousands) | As Of : | |||||||||||||||||||
| Condensed Consolidated Balance Sheets (unaudited) | 3Q 2024 | 2Q 2024 | 1Q 2024 | 4Q 2023 | 3Q 2023 | |||||||||||||||
| Assets | ||||||||||||||||||||
| Cash and cash equivalents | $ | 77,274 | $ | 66,580 | $ | 88,717 | $ | 77,553 | $ | 93,865 | ||||||||||
| Investment securities-available for sale | 242,543 | 232,867 | 230,617 | 228,420 | 216,875 | |||||||||||||||
| Investment securities-held to maturity | 9,766 | 10,649 | 10,992 | 11,650 | 11,975 | |||||||||||||||
| Loans held for sale | 467,325 | 94,644 | 72,217 | 57,691 | 66,266 | |||||||||||||||
| Loans receivable, net of deferred fees | 2,965,120 | 3,300,562 | 3,227,665 | 3,219,414 | 3,173,788 | |||||||||||||||
| Allowance for credit losses | (51,132 | ) | (51,574 | ) | (53,456 | ) | (52,209 | ) | (35,862 | ) | ||||||||||
| Net loans | 2,913,988 | 3,248,988 | 3,174,209 | 3,167,205 | 3,137,926 | |||||||||||||||
| Stock in Federal Reserve Bank and Federal Home Loan Bank | 20,875 | 16,837 | 14,225 | 14,246 | 12,796 | |||||||||||||||
| Bank premises and equipment, net | 19,668 | 19,946 | 20,412 | 20,611 | 24,878 | |||||||||||||||
| Operating lease right-of-use assets | 10,465 | 10,293 | 10,206 | 10,646 | 11,402 | |||||||||||||||
| Goodwill and other intangible assets | 94,444 | 94,768 | 95,092 | 95,417 | 95,741 | |||||||||||||||
| Assets held for sale, net | 3,898 | 5,136 | 6,359 | 6,735 | 3,115 | |||||||||||||||
| Bank-owned life insurance | 67,010 | 66,578 | 67,685 | 67,588 | 67,176 | |||||||||||||||
| Deferred tax assets, net | 25,582 | 25,232 | 24,513 | 22,395 | 24,179 | |||||||||||||||
| Consumer Program derivative asset | 9,763 | 9,929 | 10,685 | 10,806 | 12,818 | |||||||||||||||
| Other assets | 62,002 | 63,917 | 64,050 | 65,583 | 59,847 | |||||||||||||||
| Total assets | $ | 4,024,603 | $ | 3,966,364 | $ | 3,889,979 | $ | 3,856,546 | $ | 3,838,859 | ||||||||||
| Liabilities and stockholders' equity | ||||||||||||||||||||
| Demand deposits | $ | 421,231 | $ | 420,241 | $ | 463,190 | $ | 472,941 | $ | 490,719 | ||||||||||
| NOW accounts | 748,833 | 793,608 | 771,116 | 773,028 | 803,276 | |||||||||||||||
| Money market accounts | 835,099 | 831,834 | 834,514 | 794,530 | 800,951 | |||||||||||||||
| Savings accounts | 873,810 | 866,279 | 823,325 | 783,758 | 746,608 | |||||||||||||||
| Time deposits | 427,458 | 423,501 | 422,778 | 445,898 | 451,850 | |||||||||||||||
| Total deposits | 3,306,431 | 3,335,463 | 3,314,923 | 3,270,155 | 3,293,404 | |||||||||||||||
| Securities sold under agreements to repurchase - short term | 3,677 | 3,273 | 3,038 | 3,044 | 3,838 | |||||||||||||||
| Federal Home Loan Bank advances | 165,000 | 80,000 | 25,000 | 30,000 | - | |||||||||||||||
| Secured borrowings | 17,495 | 21,069 | 21,298 | 20,393 | 29,649 | |||||||||||||||
| Subordinated debt and notes | 95,808 | 95,737 | 95,666 | 95,595 | 95,524 | |||||||||||||||
| Operating lease liabilities | 11,704 | 11,488 | 11,353 | 11,686 | 12,347 | |||||||||||||||
| Other liabilities | 27,168 | 24,777 | 24,102 | 28,080 | 26,487 | |||||||||||||||
| Total liabilities | 3,627,283 | 3,571,807 | 3,495,380 | 3,458,953 | 3,461,249 | |||||||||||||||
| Total Primis common stockholders' equity | 381,352 | 376,393 | 374,577 | 376,161 | 377,610 | |||||||||||||||
| Noncontrolling interest | 15,968 | 18,164 | 20,022 | 21,432 | - | |||||||||||||||
| Total stockholders' equity | 397,320 | 394,557 | 394,599 | 397,593 | 377,610 | |||||||||||||||
| Total liabilities and stockholders' equity | $ | 4,024,603 | $ | 3,966,364 | $ | 3,889,979 | $ | 3,856,546 | $ | 3,838,859 | ||||||||||
| Tangible common equity(1) | $ | 286,908 | $ | 281,625 | $ | 279,485 | $ | 280,744 | $ | 281,869 | ||||||||||
| Primis Financial Corp. | ||||||||||||||||||||||||||||
| (Dollars in thousands) | For Three Months Ended: | For Nine Months Ended: | ||||||||||||||||||||||||||
| Condensed Consolidated Statement of Operations (unaudited) | 3Q 2024 | 2Q 2024 | 1Q 2024 | 4Q 2023 | 3Q 2023 | 3Q 2024 | 3Q 2023 | |||||||||||||||||||||
| Interest and dividend income | $ | 57,112 | $ | 52,199 | $ | 50,345 | $ | 50,163 | $ | 48,027 | $ | 159,656 | $ | 142,485 | ||||||||||||||
| Interest expense | 29,089 | 27,346 | 25,076 | 24,437 | 23,697 | 81,511 | 69,499 | |||||||||||||||||||||
| Net interest income | 28,023 | 24,853 | 25,269 | 25,726 | 24,330 | 78,145 | 72,986 | |||||||||||||||||||||
| Provision for credit losses | 7,511 | 3,119 | 6,508 | 21,310 | 1,616 | 17,138 | 11,231 | |||||||||||||||||||||
| Net interest income after provision for credit losses | 20,512 | 21,734 | 18,761 | 4,416 | 22,714 | 61,007 | 61,755 | |||||||||||||||||||||
| Account maintenance and deposit service fees | 1,468 | 1,861 | 1,393 | 1,518 | 1,534 | 4,722 | 4,215 | |||||||||||||||||||||
| Income from bank-owned life insurance | 431 | 1,327 | 564 | 420 | 787 | 2,322 | 1,601 | |||||||||||||||||||||
| Mortgage banking income | 6,803 | 6,402 | 5,574 | 3,210 | 4,922 | 18,779 | 14,435 | |||||||||||||||||||||
| Gain (loss) on sale of loans | - | (29 | ) | 336 | 526 | 217 | 307 | 268 | ||||||||||||||||||||
| Consumer Program derivative | 79 | 1,272 | 2,041 | 2,886 | 2,033 | 3,392 | 15,233 | |||||||||||||||||||||
| Gain (loss) on other investments | 51 | 136 | 206 | 190 | 30 | 393 | (6 | ) | ||||||||||||||||||||
| Gain (loss) on bank premises and equipment | 352 | 124 | - | (478 | ) | 2 | 476 | 2 | ||||||||||||||||||||
| Other | 99 | 105 | 193 | 169 | 201 | 397 | 584 | |||||||||||||||||||||
| Noninterest income | 9,283 | 11,198 | 10,307 | 8,441 | 9,726 | 30,788 | 36,332 | |||||||||||||||||||||
| Employee compensation and benefits | 16,764 | 16,088 | 15,735 | 14,645 | 13,809 | 48,587 | 44,120 | |||||||||||||||||||||
| Occupancy and equipment expenses | 3,071 | 3,099 | 3,106 | 2,982 | 3,170 | 9,276 | 9,637 | |||||||||||||||||||||
| Amortization of intangible assets | 318 | 317 | 317 | 317 | 317 | 952 | 952 | |||||||||||||||||||||
| Goodwill impairment | - | - | - | - | 11,150 | - | 11,150 | |||||||||||||||||||||
| Virginia franchise tax expense | 631 | 632 | 631 | 849 | 849 | 1,894 | 2,546 | |||||||||||||||||||||
| Data processing expense | 2,552 | 2,347 | 2,231 | 2,216 | 2,250 | 7,130 | 7,329 | |||||||||||||||||||||
| Marketing expense | 449 | 499 | 459 | 352 | 377 | 1,407 | 1,467 | |||||||||||||||||||||
| Telecommunication and communication expense | 330 | 341 | 346 | 358 | 356 | 1,017 | 1,149 | |||||||||||||||||||||
| Professional fees | 2,914 | 2,976 | 1,365 | 1,586 | 1,118 | 7,255 | 3,055 | |||||||||||||||||||||
| Miscellaneous lending expenses | 1,098 | 285 | 451 | 1,128 | 424 | 1,834 | 1,878 | |||||||||||||||||||||
| Other expenses | 2,918 | 3,202 | 2,897 | 3,347 | 3,130 | 9,017 | 11,060 | |||||||||||||||||||||
| Noninterest expense | 31,045 | 29,786 | 27,538 | 27,780 | 36,950 | 88,369 | 94,343 | |||||||||||||||||||||
| Income (loss) before income taxes | (1,250 | ) | 3,146 | 1,530 | (14,923 | ) | (4,510 | ) | 3,426 | 3,744 | ||||||||||||||||||
| Income tax expense (benefit) | (304 | ) | 1,265 | 718 | (4,472 | ) | 1,519 | 1,679 | 3,405 | |||||||||||||||||||
| Net Income (loss) | (946 | ) | 1,881 | 812 | (10,451 | ) | (6,029 | ) | 1,747 | 339 | ||||||||||||||||||
| Noncontrolling interest | 2,158 | 1,901 | 1,654 | 2,280 | - | 5,713 | - | |||||||||||||||||||||
| Net income (loss) attributable to Primis' common shareholders | $ | 1,212 | $ | 3,782 | $ | 2,466 | $ | (8,171 | ) | $ | (6,029 | ) | $ | 7,460 | $ | 339 | ||||||||||||
(1) See Reconciliation of Non-GAAP financial measures.
| Primis Financial Corp. | ||||||||||||||||||||
| (Dollars in thousands) | As Of: | |||||||||||||||||||
| Loan Portfolio Composition | 3Q 2024 | 2Q 2024 | 1Q 2024 | 4Q 2023 | 3Q 2023 | |||||||||||||||
| Loans held for sale | $ | 467,325 | $ | 94,644 | $ | 72,217 | $ | 57,691 | $ | 66,266 | ||||||||||
| Loans secured by real estate: | ||||||||||||||||||||
| Commercial real estate - owner occupied | 463,848 | 463,328 | 458,026 | 455,397 | 432,367 | |||||||||||||||
| Commercial real estate - non-owner occupied | 609,743 | 612,428 | 577,752 | 578,600 | 605,508 | |||||||||||||||
| Secured by farmland | 4,356 | 4,758 | 4,341 | 5,044 | 5,082 | |||||||||||||||
| Construction and land development | 105,541 | 104,886 | 146,908 | 164,742 | 170,849 | |||||||||||||||
| Residential 1-4 family | 607,313 | 608,049 | 602,124 | 606,226 | 600,389 | |||||||||||||||
| Multi-family residential | 169,368 | 171,512 | 128,599 | 127,857 | 129,586 | |||||||||||||||
| Home equity lines of credit | 62,421 | 62,138 | 57,765 | 59,670 | 59,996 | |||||||||||||||
| Total real estate loans | 2,022,590 | 2,027,099 | 1,975,515 | 1,997,536 | 2,003,777 | |||||||||||||||
| Commercial loans | 526,772 | 619,365 | 623,804 | 602,623 | 603,637 | |||||||||||||||
| Paycheck Protection Program loans | 1,941 | 1,969 | 2,003 | 2,023 | 2,105 | |||||||||||||||
| Consumer loans | 408,378 | 646,590 | 620,745 | 611,583 | 558,277 | |||||||||||||||
| Total Non-PCD loans | 2,959,681 | 3,295,023 | 3,222,067 | 3,213,765 | 3,167,796 | |||||||||||||||
| PCD loans | 5,439 | 5,539 | 5,598 | 5,649 | 5,992 | |||||||||||||||
| Total loans receivable, net of deferred fees | $ | 2,965,120 | $ | 3,300,562 | $ | 3,227,665 | $ | 3,219,414 | $ | 3,173,788 | ||||||||||
| Loans by Risk Grade: | ||||||||||||||||||||
| Pass, not graded | $ | - | $ | - | $ | - | $ | - | $ | - | ||||||||||
| Pass Grade 1 - Highest Quality | 820 | 692 | 633 | 875 | 851 | |||||||||||||||
| Pass Grade 2 - Good Quality | 169,285 | 488,728 | 412,593 | 405,019 | 383,306 | |||||||||||||||
| Pass Grade 3 - Satisfactory Quality | 1,509,280 | 1,503,918 | 1,603,053 | 1,626,380 | 1,632,256 | |||||||||||||||
| Pass Grade 4 - Pass | 1,184,671 | 1,204,268 | 1,177,065 | 1,154,971 | 1,095,264 | |||||||||||||||
| Pass Grade 5 - Special Mention | 53,473 | 87,471 | 19,454 | 14,930 | 33,299 | |||||||||||||||
| Grade 6 - Substandard | 47,591 | 15,485 | 14,867 | 17,239 | 28,812 | |||||||||||||||
| Grade 7 - Doubtful | - | - | - | - | - | |||||||||||||||
| Grade 8 - Loss | - | - | - | - | - | |||||||||||||||
| Total loans | $ | 2,965,120 | $ | 3,300,562 | $ | 3,227,665 | $ | 3,219,414 | $ | 3,173,788 | ||||||||||
| (Dollars in thousands) | As Of or For Three Months Ended: | |||||||||||||||||||
| Asset Quality Information | 3Q 2024 | 2Q 2024 | 1Q 2024 | 4Q 2023 | 3Q 2023 | |||||||||||||||
| Allowance for Credit Losses: | ||||||||||||||||||||
| Balance at beginning of period | $ | (51,574 | ) | $ | (53,456 | ) | $ | (52,209 | ) | $ | (35,862 | ) | $ | (38,541 | ) | |||||
| Provision for for credit losses | (7,511 | ) | (3,119 | ) | (6,508 | ) | (21,310 | ) | (1,616 | ) | ||||||||||
| Net charge-offs | 7,953 | 5,001 | 5,261 | 4,963 | 4,295 | |||||||||||||||
| Ending balance | $ | (51,132 | ) | $ | (51,574 | ) | $ | (53,456 | ) | $ | (52,209 | ) | $ | (35,862 | ) | |||||
| Reserve for Unfunded Commitments: | ||||||||||||||||||||
| Balance at beginning of period | $ | (1,031 | ) | $ | (1,577 | ) | $ | (1,579 | ) | $ | (1,025 | ) | $ | (1,282 | ) | |||||
| (Expense for) / recovery of unfunded loan commitment reserve | (96 | ) | 546 | 2 | (554 | ) | 257 | |||||||||||||
| Total Reserve for Unfunded Commitments | $ | (1,127 | ) | $ | (1,031 | ) | $ | (1,577 | ) | $ | (1,579 | ) | $ | (1,025 | ) | |||||
| As Of: | ||||||||||||||||||||
| Non-Performing Assets: | 3Q 2024 | 2Q 2024 | 1Q 2024 | 4Q 2023 | 3Q 2023 | |||||||||||||||
| Nonaccrual loans | $ | 14,424 | $ | 11,289 | $ | 10,139 | $ | 9,095 | $ | 20,171 | ||||||||||
| Accruing loans delinquent 90 days or more | 1,714 | 1,897 | 1,714 | 1,714 | 1,625 | |||||||||||||||
| Total non-performing assets | $ | 16,138 | $ | 13,186 | $ | 11,853 | $ | 10,809 | $ | 21,796 | ||||||||||
| SBA guaranteed portion of non-performing loans | $ | 5,954 | $ | 3,268 | $ | 3,095 | $ | 3,115 | $ | 2,290 | ||||||||||
| Primis Financial Corp. | ||||||||||||||||||||||||||||
| (Dollars in thousands) | For Three Months Ended: | For Nine Months Ended: | ||||||||||||||||||||||||||
| Average Balance Sheet | 3Q 2024 | 2Q 2024 | 1Q 2024 | 4Q 2023 | 3Q 2023 | 3Q 2024 | 3Q 2023 | |||||||||||||||||||||
| Assets | ||||||||||||||||||||||||||||
| Loans held for sale | $ | 98,110 | $ | 84,389 | $ | 58,896 | $ | 48,380 | $ | 55,775 | $ | 80,530 | $ | 43,384 | ||||||||||||||
| Loans, net of deferred fees | 3,324,157 | 3,266,651 | 3,206,888 | 3,208,295 | 3,193,236 | 3,266,111 | 3,099,225 | |||||||||||||||||||||
| Investment securities | 242,631 | 244,308 | 241,179 | 228,335 | 234,601 | 242,706 | 240,525 | |||||||||||||||||||||
| Other earning assets | 83,405 | 73,697 | 77,067 | 79,925 | 93,159 |
|
78,076 | 348,831 | ||||||||||||||||||||
| Total earning assets | 3,748,303 | 3,669,045 | 3,584,030 | 3,564,935 | 3,576,771 | 3,667,423 | 3,731,965 | |||||||||||||||||||||
| Other assets | 243,972 | 243,200 | 248,082 | 262,977 | 268,038 | 244,913 | 260,474 | |||||||||||||||||||||
| Total assets | $ | 3,992,275 | $ | 3,912,245 | $ | 3,832,112 | $ | 3,827,912 | $ | 3,844,809 | $ | 3,912,336 | $ | 3,992,439 | ||||||||||||||
| Liabilities and equity | ||||||||||||||||||||||||||||
| Demand deposits | $ | 421,908 | $ | 433,315 | $ | 458,306 | $ | 473,750 | $ | 472,485 | $ | 440,172 | $ | 500,459 | ||||||||||||||
| Interest-bearing liabilities: | ||||||||||||||||||||||||||||
| NOW and other demand accounts | 748,202 | 778,458 | 773,943 | 782,305 | 806,339 | 766,800 | 785,480 | |||||||||||||||||||||
| Money market accounts | 859,988 | 823,156 | 814,147 | 790,971 | 850,892 | 832,531 | 844,752 | |||||||||||||||||||||
| Savings accounts | 866,375 | 866,652 | 800,328 | 783,432 | 703,809 | 844,531 | 775,024 | |||||||||||||||||||||
| Time deposits | 425,238 | 423,107 | 431,340 | 451,521 | 460,961 | 426,557 | 481,813 | |||||||||||||||||||||
| Total Deposits | 3,321,711 | 3,324,688 | 3,278,064 | 3,281,979 | 3,294,486 | 3,310,591 | 3,387,528 | |||||||||||||||||||||
| Borrowings | 238,994 | 158,919 | 120,188 | 120,213 | 119,797 | 172,942 | 172,662 | |||||||||||||||||||||
| Total Funding | 3,560,705 | 3,483,607 | 3,398,252 | 3,402,192 | 3,414,283 | 3,483,533 | 3,560,190 | |||||||||||||||||||||
| Other Liabilities | 36,527 | 34,494 | 34,900 | 39,056 | 39,303 | 35,344 | 35,457 | |||||||||||||||||||||
| Total liabilites | 3,597,232 | 3,518,101 | 3,433,152 | 3,441,248 | 3,453,586 | 3,518,877 | 3,595,647 | |||||||||||||||||||||
| Primis common stockholders' equity | 377,595 | 374,735 | 378,008 | 384,332 | 391,223 | 374,189 | 396,792 | |||||||||||||||||||||
| Noncontrolling interest | 17,448 | 19,409 | 20,952 | 2,332 | - | 19,270 | - | |||||||||||||||||||||
| Total stockholders' equity | 395,043 | 394,144 | 398,960 | 386,664 | 391,223 | 393,459 | 396,792 | |||||||||||||||||||||
| Total liabilities and stockholders' equity | $ | 3,992,275 | $ | 3,912,245 | $ | 3,832,112 | $ | 3,827,912 | $ | 3,844,809 | $ | 3,912,336 | $ | 3,992,439 | ||||||||||||||
| Net Interest Income | ||||||||||||||||||||||||||||
| Loans held for sale | $ | 1,589 | $ | 1,521 | $ | 907 | $ | 842 | $ | 873 | $ | 4,017 | $ | 1,964 | ||||||||||||||
| Loans | 52,707 | 48,032 | 46,825 | 46,723 | 44,439 | 147,564 | 123,289 | |||||||||||||||||||||
| Investment securities | 1,799 | 1,805 | 1,715 | 1,645 | 1,593 | 5,319 | 4,728 | |||||||||||||||||||||
| Other earning assets | 1,017 | 841 | 898 | 953 | 1,122 | 2,756 | 12,504 | |||||||||||||||||||||
| Total Earning Assets Income | 57,112 | 52,199 | 50,345 | 50,163 | 48,027 | 159,656 | 142,485 | |||||||||||||||||||||
| Non-interest bearing DDA | - | - | - | - | - | - | - | |||||||||||||||||||||
| NOW and other interest-bearing demand accounts | 4,630 | 4,827 | 4,467 | 4,334 | 4,460 | 13,924 | 11,070 | |||||||||||||||||||||
| Money market accounts | 7,432 | 6,788 | 6,512 | 6,129 | 6,555 | 20,732 | 17,587 | |||||||||||||||||||||
| Savings accounts | 8,918 | 8,912 | 8,045 | 7,860 | 6,760 | 25,876 | 21,915 | |||||||||||||||||||||
| Time deposits | 4,371 | 4,095 | 3,990 | 3,964 | 3,801 | 12,455 | 10,831 | |||||||||||||||||||||
| Total Deposit Costs | 25,351 | 24,622 | 23,014 | 22,287 | 21,576 | 72,987 | 61,403 | |||||||||||||||||||||
| Borrowings | 3,738 | 2,724 | 2,062 | 2,150 | 2,121 | 8,524 | 8,096 | |||||||||||||||||||||
| Total Funding Costs | 29,089 | 27,346 | 25,076 | 24,437 | 23,697 | 81,511 | 69,499 | |||||||||||||||||||||
| Net Interest Income | $ | 28,023 | $ | 24,853 | $ | 25,269 | $ | 25,726 | $ | 24,330 | $ | 78,145 | $ | 72,986 | ||||||||||||||
| Net Interest Margin | ||||||||||||||||||||||||||||
| Loans held for sale | 6.44 | % | 7.25 | % | 6.19 | % | 6.90 | % | 6.21 | % | 6.66 | % | 6.05 | % | ||||||||||||||
| Loans | 6.31 | % | 5.91 | % | 5.87 | % | 5.78 | % | 5.52 | % | 6.04 | % | 5.32 | % | ||||||||||||||
| Investments | 2.95 | % | 2.97 | % | 2.86 | % | 2.86 | % | 2.69 | % | 2.93 | % | 2.63 | % | ||||||||||||||
| Other Earning Assets | 4.85 | % | 4.59 | % | 4.69 | % | 4.73 | % | 4.78 | % | 4.72 | % | 4.79 | % | ||||||||||||||
| Total Earning Assets | 6.06 | % | 5.72 | % | 5.65 | % | 5.58 | % | 5.33 | % | 5.82 | % | 5.10 | % | ||||||||||||||
| NOW | 2.46 | % | 2.49 | % | 2.32 | % | 2.20 | % | 2.19 | % | 2.43 | % | 1.88 | % | ||||||||||||||
| MMDA | 3.44 | % | 3.32 | % | 3.22 | % | 3.07 | % | 3.06 | % | 3.33 | % | 2.78 | % | ||||||||||||||
| Savings | 4.10 | % | 4.14 | % | 4.04 | % | 3.98 | % | 3.81 | % | 4.09 | % | 3.78 | % | ||||||||||||||
| CDs | 4.09 | % | 3.89 | % | 3.72 | % | 3.48 | % | 3.27 | % | 3.90 | % | 3.01 | % | ||||||||||||||
| Cost of Interest Bearing Deposits | 3.48 | % | 3.42 | % | 3.28 | % | 3.15 | % | 3.03 | % | 3.40 | % | 2.84 | % | ||||||||||||||
| Cost of Deposits | 3.04 | % | 2.98 | % | 2.82 | % | 2.69 | % | 2.60 | % | 2.94 | % | 2.42 | % | ||||||||||||||
| Other Funding | 6.22 | % | 6.89 | % | 6.90 | % | 7.10 | % | 7.02 | % | 6.58 | % | 6.27 | % | ||||||||||||||
| Total Cost of Funds | 3.25 | % | 3.16 | % | 2.97 | % | 2.85 | % | 2.75 | % | 3.13 | % | 2.61 | % | ||||||||||||||
| Net Interest Margin | 2.97 | % | 2.72 | % | 2.84 | % | 2.86 | % | 2.70 | % | 2.85 | % | 2.61 | % | ||||||||||||||
| Net Interest Spread | 2.37 | % | 2.12 | % | 2.22 | % | 2.27 | % | 2.13 | % | 2.24 | % | 2.49 | % | ||||||||||||||
| Primis Financial Corp. | ||||||||||||||||||||||||||||
| (Dollars in thousands, except per share data) | For Three Months Ended: | For Nine Months Ended: | ||||||||||||||||||||||||||
| Reconciliation of Non-GAAP items: | 3Q 2024 | 2Q 2024 | 1Q 2024 | 4Q 2023 | 3Q 2023 | 3Q 2024 | 3Q 2023 | |||||||||||||||||||||
| Net income (loss) attributable to Primis' common shareholders | $ | 1,212 | $ | 3,782 | $ | 2,466 | $ | (8,171 | ) | $ | (6,029 | ) | $ | 7,460 | $ | 339 | ||||||||||||
| Non-GAAP adjustments to Net Income: | ||||||||||||||||||||||||||||
| Branch Consolidation / Other restructuring | - | - | - | 449 | - | - | 1,488 | |||||||||||||||||||||
| Loan officer fraud, operational losses | - | - | - | - | 200 | - | 200 | |||||||||||||||||||||
| Professional fee expenses related to the SEC pre-clear process and financial reporting restatements | 1,352 | 1,453 | 438 | - | - | 3,243 | - | |||||||||||||||||||||
| Professional fee expenses related to Panacea investment | - | - | - | 194 | - | - | - | |||||||||||||||||||||
| Goodwill impairment | - | - | - | - | 11,150 | - | 11,150 | |||||||||||||||||||||
| Gains on sale of closed bank branch buildings | (352 | ) | (124 | ) | - | - | - | (476 | ) | - | ||||||||||||||||||
| Income tax effect | (216 | ) | (287 | ) | (95 | ) | (139 | ) | (44 | ) | (598 | ) | (365 | ) | ||||||||||||||
| Net income (loss) attributable to Primis' common shareholders adjusted for nonrecurring income and expenses | $ | 1,996 | $ | 4,824 | $ | 2,809 | $ | (7,667 | ) | $ | 5,277 | $ | 9,629 | $ | 12,813 | |||||||||||||
| Net income (loss) attributable to Primis' common shareholders | $ | 1,212 | $ | 3,782 | $ | 2,466 | $ | (8,171 | ) | $ | (6,029 | ) | $ | 7,460 | $ | 339 | ||||||||||||
| Income tax expense (benefit) | (304 | ) | 1,265 | 718 | (4,472 | ) | 1,519 | 1,679 | 3,405 | |||||||||||||||||||
| Provision for credit losses (incl. unfunded commitment expense) | 7,607 | 2,573 | 6,506 | 21,864 | 1,359 | 16,686 | 10,685 | |||||||||||||||||||||
| Pre-tax pre-provision earnings | $ | 8,515 | $ | 7,620 | $ | 9,690 | $ | 9,221 | $ | (3,151 | ) | $ | 25,825 | $ | 14,429 | |||||||||||||
| Effect of adjustment for nonrecurring income and expenses | 1,000 | 1,329 | 438 | 643 | 11,350 | 2,767 | 12,838 | |||||||||||||||||||||
| Pre-tax pre-provision operating earnings | $ | 9,515 | $ | 8,949 | $ | 10,128 | $ | 9,864 | $ | 8,199 | $ | 28,592 | $ | 27,267 | ||||||||||||||
| Return on average assets | 0.12 | % | 0.39 | % | 0.26 | % | (0.85 | )% | (0.62 | )% | 0.25 | % | 0.01 | % | ||||||||||||||
| Effect of adjustment for nonrecurring income and expenses | 0.08 | % | 0.11 | % | 0.04 | % | 0.05 | % | 1.17 | % | 0.07 | % | 0.42 | % | ||||||||||||||
| Operating return on average assets | 0.20 | % | 0.50 | % | 0.29 | % | (0.79 | )% | 0.54 | % | 0.33 | % | 0.43 | % | ||||||||||||||
| Return on average assets | 0.12 | % | 0.39 | % | 0.26 | % | (0.85 | )% | (0.62 | )% | 0.25 | % | 0.01 | % | ||||||||||||||
| Effect of tax expense | (0.03 | )% | 0.13 | % | 0.08 | % | (0.46 | )% | 0.16 | % | 0.06 | % | 0.11 | % | ||||||||||||||
| Effect of provision for credit losses (incl. unfunded commitment expense) | 0.76 | % | 0.26 | % | 0.68 | % | 2.27 | % | 0.14 | % | 0.57 | % | 0.36 | % | ||||||||||||||
| Pre-tax pre-provision return on average assets | 0.85 | % | 0.78 | % | 1.02 | % | 0.96 | % | (0.33 | )% | 0.88 | % | 0.48 | % | ||||||||||||||
| Effect of adjustment for nonrecurring income and expenses and expenses | 0.10 | % | 0.14 | % | 0.04 | % | 0.05 | % | 0.02 | % | 0.09 | % | 0.43 | % | ||||||||||||||
| Pre-tax pre-provision operating return on average assets | 0.95 | % | 0.92 | % | 1.05 | % | 1.01 | % | (0.30 | )% | 0.98 | % | 0.91 | % | ||||||||||||||
| Return on average common equity | 1.28 | % | 4.06 | % | 2.62 | % | (8.43 | )% | (6.11 | )% | 2.66 | % | 0.11 | % | ||||||||||||||
| Effect of adjustment for nonrecurring income and expenses | 0.83 | % | 1.12 | % | 0.37 | % | 0.52 | % | 11.47 | % | 0.77 | % | 4.20 | % | ||||||||||||||
| Operating return on average common equity | 2.11 | % | 5.18 | % | 2.99 | % | (7.91 | )% | 5.35 | % | 3.44 | % | 4.32 | % | ||||||||||||||
| Effect of goodwill and other intangible assets | 0.69 | % | 1.75 | % | 0.99 | % | (2.61 | )% | 2.00 | % | 1.17 | % | 1.60 | % | ||||||||||||||
| Operating return on average tangible common equity | 2.80 | % | 6.93 | % | 3.98 | % | (10.53 | )% | 7.35 | % | 4.60 | % | 5.92 | % | ||||||||||||||
| Efficiency ratio | 83.22 | % | 82.62 | % | 77.41 | % | 81.31 | % | 108.50 | % | 81.12 | % | 86.30 | % | ||||||||||||||
| Effect of adjustment for nonrecurring income and expenses | (2.87 | )% | (3.76 | )% | (1.23 | )% | (1.88 | )% | (33.33 | )% | (2.63 | )% | (11.74 | )% | ||||||||||||||
| Operating efficiency ratio | 80.35 | % | 78.86 | % | 76.17 | % | 79.43 | % | 75.17 | % | 78.49 | % | 74.56 | % | ||||||||||||||
| Earnings per common share - Basic | $ | 0.05 | $ | 0.15 | $ | 0.10 | $ | (0.33 | ) | $ | (0.24 | ) | $ | 0.30 | $ | 0.01 | ||||||||||||
| Effect of adjustment for nonrecurring income and expenses | 0.03 | 0.05 | 0.01 | 0.02 | 0.45 | 0.09 | 0.51 | |||||||||||||||||||||
| Operating earnings per common share - Basic | $ | 0.08 | $ | 0.20 | $ | 0.11 | $ | (0.31 | ) | $ | 0.21 | $ | 0.39 | $ | 0.52 | |||||||||||||
| Earnings per common share - Diluted | $ | 0.05 | $ | 0.15 | $ | 0.10 | $ | (0.33 | ) | $ | (0.24 | ) | $ | 0.30 | $ | 0.01 | ||||||||||||
| Effect of adjustment for nonrecurring income and expenses | 0.03 | 0.05 | 0.01 | 0.02 | 0.45 | 0.09 | 0.51 | |||||||||||||||||||||
| Operating earnings per common share - Diluted | $ | 0.08 | $ | 0.20 | $ | 0.11 | $ | (0.31 | ) | $ | 0.21 | $ | 0.39 | $ | 0.52 | |||||||||||||
| Book value per common share | $ | 15.43 | $ | 15.23 | $ | 15.16 | $ | 15.23 | $ | 15.30 | $ | 15.43 | $ | 15.30 | ||||||||||||||
| Effect of goodwill and other intangible assets | (3.82 | ) | (3.83 | ) | (3.85 | ) | (3.86 | ) | (3.88 | ) | (3.82 | ) | (3.88 | ) | ||||||||||||||
| Tangible book value per common share | $ | 11.61 | $ | 11.40 | $ | 11.31 | $ | 11.37 | $ | 11.42 | $ | 11.61 | $ | 11.42 | ||||||||||||||
| Total Primis common stockholders' equity | $ | 381,352 | $ | 376,393 | $ | 374,577 | $ | 376,161 | $ | 377,610 | $ | 381,352 | $ | 377,610 | ||||||||||||||
| Less goodwill and other intangible assets | (94,444 | ) | (94,768 | ) | (95,093 | ) | (95,417 | ) | (95,741 | ) | (94,444 | ) | (95,741 | ) | ||||||||||||||
| Tangible common equity | $ | 286,908 | $ | 281,625 | $ | 279,484 | $ | 280,744 | $ | 281,869 | $ | 286,908 | $ | 281,869 | ||||||||||||||
| Common equity to assets | 9.48 | % | 9.49 | % | 9.63 | % | 9.75 | % | 9.84 | % | 9.48 | % | 9.84 | % | ||||||||||||||
| Effect of goodwill and other intangible assets | (2.18 | )% | (2.22 | )% | (2.27 | )% | (2.29 | )% | (2.31 | )% | (2.18 | )% | (2.31 | )% | ||||||||||||||
| Tangible common equity to tangible assets | 7.30 | % | 7.27 | % | 7.36 | % | 7.46 | % | 7.53 | % | 7.30 | % | 7.53 | % | ||||||||||||||
Exhibit 99.2


Third Quarter 2024 NASDAQ: FRST This presentation and certain of our other filings with the Securities and Exchange Commission contain statements that consti tut e “forward - looking statements” within the meaning of, and subject to the protections of, Section 27A of the Securities Act of 1933, as amended, and Section 21E of the Securities E xch ange Act of 1934, as amended. All statements other than statements of historical fact are forward - looking statements. Such statements can generally be identified by such words as "may," "plan," "contemplate," "anticipate," "believe," "intend," "continue," "expect," "project," "predict," "estimate," "could," "should," "would," "will," and other similar words or expressions of the future or otherwise regarding the outlook for the Company’s future business and financial performance and/or the performance of the banking industry and economy in general . T hese forward - looking statements include, but are not limited to, our expectations regarding our future operating and financial performance, including the preliminary estimate d f inancial and operating information presented herein, which is subject to adjustment; our outlook and long - term goals for future growth and new offerings and services; our expectatio ns regarding net interest margin; expectations on our growth strategy, expense management, capital management and future profitability; expectations on credit quality and performa nce ; and the assumptions underlying our expectations. Prospective investors are cautioned that any such forward - looking statements are not guarantees of future performance and involv e known and unknown risks and uncertainties which may cause the actual results, performance or achievements of the Company to be materially different from the future results, per formance or achievements expressed or implied by such forward - looking statements. Forward - looking statements are based on the information known to, and current beliefs and expec tations of, the Company’s management and are subject to significant risks and uncertainties. Actual results may differ materially from those contemplated by such forward - loo king statements. Factors that might cause such differences include, but are not limited to: the result of the “pre - clearance” process with the Office of the Chief Accountant o f the SEC and the impact on the Company’s financial statements; the possibility that the Company is unable to regain compliance with, or thereafter continue to comply with, appl ica ble Nasdaq Listing Rules, or experience violations of additional Nasdaq Listing Rules; the possibility that Nasdaq may deny the Company’s appeal and delist the Company’s securitie s; the Company’s ability to implement its various strategic and growth initiatives, including [the sale of the Life Premium Finance Division and the impact on our operating re sul ts] and its recently established Panacea Financial Division and digital banking platform, V1BE fulfillment service and Primis Mortgage Company; competitive pressures among fina nci al institutions increasing significantly; changes in applicable laws, rules, or regulations, including changes to statutes, regulations or regulatory policies or practices; chang es in management’s plans for the future; credit risk associated with our lending activities; the impact of current and future economic and market conditions generally (including seasonality ) a nd in the financial services industry, nationally and within our primary market areas; changes in interest rates, inflation, loan demand, real estate values, or competition, as well as l abo r shortages and supply chain disruptions; changes in accounting principles, policies, or guidelines; adverse results from current or future litigation, regulatory examinations or ot her legal and/or regulatory actions; potential impacts of adverse developments in the banking industry highlighted by high - profile bank failures, including impacts on customer confidence , deposit outflows, liquidity and the regulatory response thereto; potential increases in the provision for credit losses; our ability to identify and address increased cyber sec urity risks, including those impacting vendors and other third parties; fraud or misconduct by internal or external actors, which we may not be able to prevent, detect or mitigate; a cts of God or of war or other conflicts, including the current Ukraine/Russia conflict and Israel/Hamas conflict, acts of terrorism, pandemics or other catastrophic events that may affect gen eral economic conditions; and other general competitive, economic, political, and market factors, including those affecting our business, operations, pricing, products, or services. Forward - looking statements speak only as of the date on which such statements are made. These forward - looking statements are bas ed upon information presently known to the Company’s management and are inherently subjective, uncertain and subject to change due to any number of risks and uncertaint ies , including, without limitation, the risks and other factors set forth in the Company’s filings with the Securities and Exchange Commission, the Company’s Annual Report on Form 1 0 - K for the year ended December 31, 2023, under the captions “Cautionary Note Regarding Forward - Looking Statements” and “Risk Factors,” and in the Company’s Quarterly Reports o n Form 10 - Q and Current Reports on Form 8 - K. The Company undertakes no obligation to update any forward - looking statement to reflect events or circumstances after the date o n which such statement is made, or to reflect the occurrence of unanticipated events. Readers are cautioned not to place undue reliance on these forward - looking statements. 2 Statements included in this presentation include non - GAAP financial measures and should be read along with the accompanying tabl es.
Primis uses non - GAAP financial measures to analyze its performance. The measures entitled net income adjusted for nonrecurring income a nd expenses; pre - tax pre - provision operating earnings; operating return on average assets; pre - tax pre - provision operating return o n average assets; operating return on average equity; operating return on average tangible equity; operating efficiency ratio; operating earnin gs per share – basic; operating earnings per share – diluted; tangible book value per share; tangible common equity; tangible common equity to tangibl e assets; and core net interest margin are not measures recognized under GAAP and therefore are considered non - GAAP financial measures. We use the term “operating” to describe a financial measure that excludes income or expense considered to be non - recurring in nature. Items ide ntified as non - operating are those that, when excluded from a reported financial measure, provide management or the reader with a measure th at may be more indicative of forward - looking trends in our business. A reconciliation of these non - GAAP financial measures to the most compara ble GAAP measures is provided in the Reconciliation of Non - GAAP Items table. Management believes that these non - GAAP financial measures provide additional useful information about Primis that allows manage ment and investors to evaluate the ongoing operating results, financial strength and performance of Primis and provide meaningful comp ari son to its peers. Non - GAAP financial measures should not be considered as an alternative to any measure of performance or financial condition as p romulgated under GAAP, and investors should consider Primis’ performance and financial condition as reported under GAAP and all other re lev ant information when assessing the performance or financial condition of Primis. Non - GAAP financial measures are not standardized a nd, therefore, it may not be possible to compare these measures with other companies that present measures having the same or similar names. Non - GAAP financial measures have limitations as analytical tools, and investors should not consider them in isolation or as a su bstitute for analysis of the results or financial condition as reported under GAAP. 3 Corp.

Headquarters: McLean, VA Bank Headquarters: Glen Allen, VA Branches: 24 Ticker (NASDAQ): FRST Valuation Market Capitalization: $297 million Price / Book Value per Share 0.78x Price / Tangible Book Value (1) : 1.03x Price / 2024 Estimated EPS (2) : 7.28x Price / 2025 Estimated EPS (2) : 6.67x Dividend Yield (3) : 3.33% 4 Pricing as of October 22, 2024. Financial data as of or for the three months ended September 30, 2024. (1) See reconciliation of Non - GAAP financial measures on slide 21. (2) Mean analyst estimates per Bloomberg. (3) Assumes $0.40 annualized dividend.

5 • Attractive community bank deposit base with core bank cost of deposits of only 2.29% in Q3 • V1BE adoption/utilization continues to build with users up 5% in Q3, primarily due to addition of small - business customers Deposits per Branch (2) Dollars in Millions. (1) V1BE is a proprietary bank delivery app for on - demand ordering of branch services (2) Deposits per branch includes balances that were swept off balance sheet in the respective period.
2,497 Users with 131 added in Q3’24 ~$189 million Deposit balance of V1BE users 82% % of active V1BE Users are SMBs V1BE Update (1) 11,268 Q3 Transactions Branch V1BE Customer $137.8 $139.0 $138.1 $136.3 $102.9 Q3'24 Q2'24 Q1'24 Q4'23 Q3'23 6 • On October 24, 2024, the Bank entered into a purchase and assumption agreement with EverBank, N.A.

to acquire Primis’ Life Premium Finance Division • EverBank will acquire the substantial majority of the associated loans along with the operations and employees of the divisio n for a premium of $6 million • Estimating $4.5 million pre - tax gain in Q4’24 after transaction expenses • Approximately $370 million of loans will be purchased on October 31, 2024 • Primis Bank will provide interim servicing until the final closing on January 31, 2025 • Loans originated between closings will be acquired on a regular basis at par • Primis to retain approximately $142 million of loans • Hired a seasoned team of professionals in October 2024 to lead an expanded Mortgage Warehouse Lending effort • Long track record in the space and most recently at a large bank that is exiting the business due to its pending sale • Four key leadership individuals covering sales, operations, credit and portfolio management • Anticipate another 4 to 5 hires as the business ramps • Attractive asset class with low losses and attractive yields • Potentially 125 bps to 150 bps higher effective yields than premium finance loans • Primis already had mortgage warehouse lending capabilities and systems in place but with limited production • Limited incremental expense burden anticipated for systems and infrastructure • Receptivity has been strong due to multiple parties existing the space in recent months • 27 customers already in the pipeline with initial fundings anticipated by the end of October 2024 • By the end of Q2 2025, anticipate outstandings of $250 - 350 million 7 • Life - to - date loan originations of ~ $550 mil.
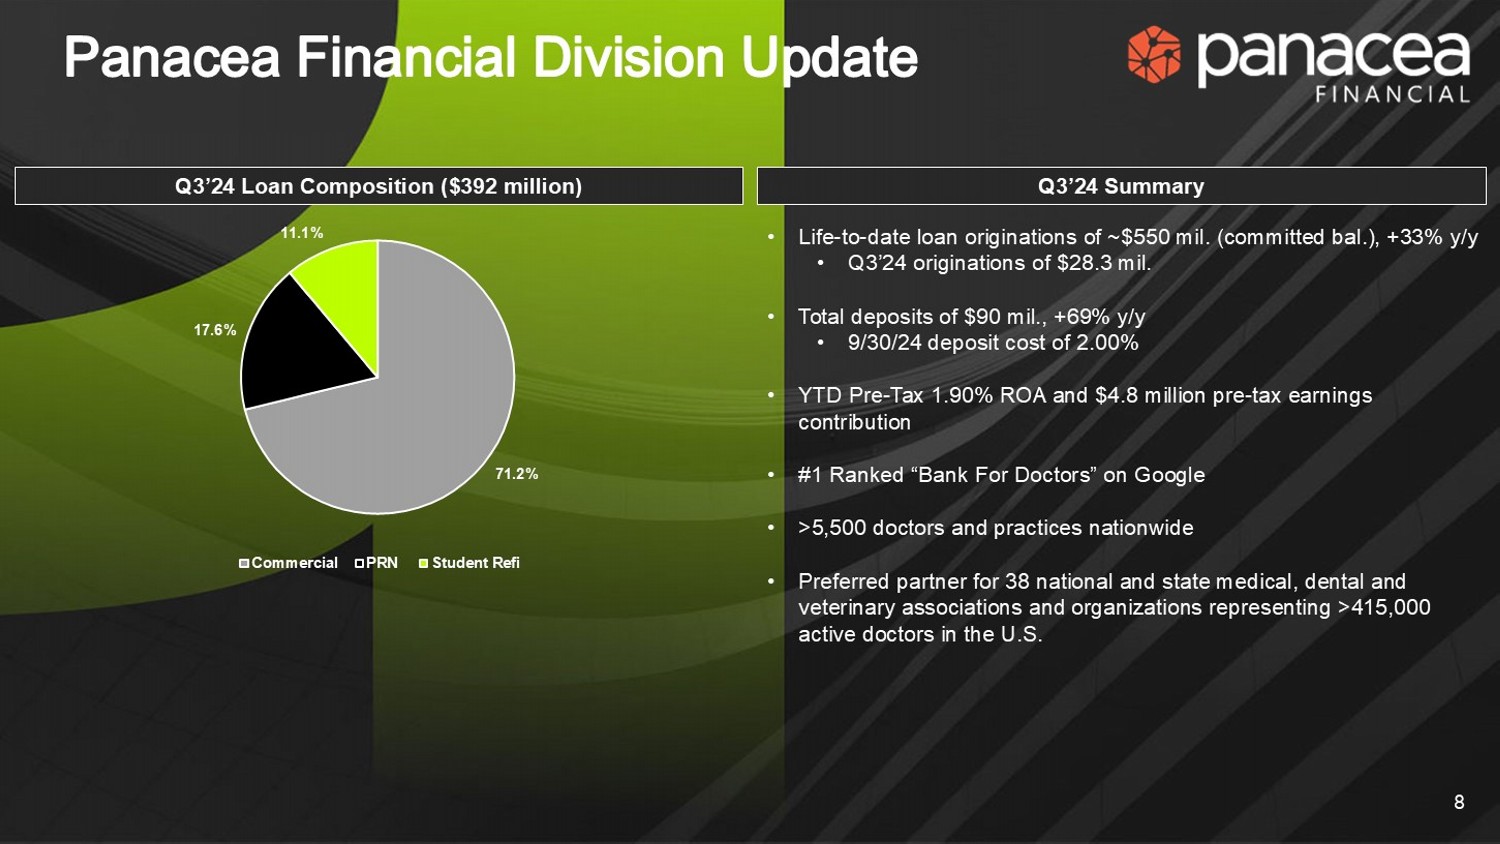
(committed bal.) , +33% y/y • Q3’24 originations of $ 28.3 mil. • Total deposits of $ 90 mil., + 69 % y/y • 9 /30/24 deposit cost of 2.00% • YTD Pre - Tax 1.90% ROA and $4.8 million pre - tax earnings contribution • #1 Ranked “Bank For Doctors” on Google • >5,500 doctors and practices nationwide • Preferred partner for 38 national and state medical, dental and veterinary associations and organizations representing >415,000 active doctors in the U.S.

Q3’24 Summary Q3’24 Loan Composition ($392 million) 8 71.2% 17.6% 11.1% Commercial PRN Student Refi 9 • Pre - tax earnings for Q3: $1.0MM • Aggressively managing costs to preserve profitability in lower volume environment • Funded production of $230 million in Q3’24 • Now licensed in 43 states and D.C. • Continue to add reliable performers using our culture and commitment to the industry versus signing bonuses and financial commitments.

Third Quarter Results

Dollars in millions. (1) See reconciliation of Non - GAAP financial measures on slide 21. (2) Gross Loans does not include Life Premium Finance loans that are held for sale 11 (1) (2) $4,025 $3,966 $3,890 $3,857 $3,839 $2,965 $3,301 $3,228 $3,219 $3,174 $3,306 $3,335 $3,315 $3,270 $3,293 7.30% 7.27% 7.36% 7.46% 7.53% Q3'24 Q2'24 Q1'24 Q4'23 Q3'23 Total Assets Gross Loans Deposits TCE/TA (1) See reconciliation of Non - GAAP financial measures on slide 21.

• Results include impact of corrected accounting for a third - party originated consumer loan program (the “Consumer Program”) • Subset of loans with promotional features do not accrue interest until the end of the promotional period • Third - party reimbursement for waived interest on promotional loans that pay off early recorded in fee income • Derivative value representing the fair value of expected interest reimbursements marked - to - market each period with changes in value recognized through noninterest income • All credit costs are fully recognized, including estimated life - of - loan losses under ASC 326, while potential credit enhancement s from the Consumer Program are recognized as received 12 3Q 2023 4Q 2023 1Q 2024 2Q 2024 3Q 2024 (0.62%) (0.85%) 0.26% 0.39% 0.12% Return on average assets 0.54% (0.79%) 0.29% 0.50% 0.20% Operating return on average assets ( 1 ) (0.33%) 0.96% 1.02% 0.78% 0.85% Pre - tax pre - provision return on average assets ( 1 ) (0.30%) 1.01% 1.05% 0.92% 0.95% Pre - tax pre - prov . operating return on average assets ( 1 ) (6.11%) (8.43%) 2.62% 4.06% 1.28% Return on average common equity 5.35% (7.91%) 2.99% 5.18% 2.11% Operating return on average common equity ( 1 ) 7.35% (10.53%) 3.98% 6.93% 2.80% Operating return on avg . tangible common equity ( 1 ) 2.75% 2.85% 2.97% 3.16% 3.25% Cost of funds 2.70% 2.86% 2.84% 2.72% 2.97% Net interest margin 96.37% 98.45% 97.37% 98.95% 89.68% Gross loans to deposits 108.50% 81.31% 77.41% 82.62% 83.22% Efficiency ratio 75.17% 79.43% 76.17% 78.86% 80.35% Operating efficiency ratio ( 1 )

Dollars in thousands. 13 • $3.0 million of interest income recognized in Q3’24 from previously deferred interest on promotional loans that began amortiz ing • Additional $2.5 million of deferred interest reimbursement from payoff of promotional loans recognized in noninterest income • Promotional balances of $17 million and $21 million reach the end of their promotional periods in Q4’24 and Q1’25, respective ly 3Q 2023 4Q 2023 1Q 2024 2Q 2024 3Q 2024 48,027 50,163 50,345 52,199 57,112 Interest Income 23,697 24,437 25,076 27,346 29,089 Interest Expense 24,330 25,726 25,269 24,853 28,023 Net Interest Income 5.52% 5.78% 5.87% 5.91% 6.31% Yield on Loans 5.33% 5.58% 5.65% 5.72% 6.06% Yield on Earning Assets 2.60% 2.69% 2.82% 2.98% 3.04% Cost of Deposits 2.75% 2.85% 2.97% 3.16% 3.25% Cost of Funds 2.70% 2.86% 2.84% 2.72% 2.97% Net Interest Margin Dollars in thousands.

See reconciliation of Non - GAAP financial measures on slide 21. 14 3Q 2023 4Q 2023 1Q 2024 2Q 2024 3Q 2024 36,950 27,780 27,538 29,786 31,045 Reported Noninterest Expense - (2,813) (2,119) (2,347) (2,666) Panacea Fin. Holdings Consolidated Exp. 36,950 24,967 25,419 27,439 28,379 Noninterest Expense Excluding PFH (11,350) (165) (438) (1,453) (1,352) Nonrecurring Items / Goodwill Impair. (5,108) (4,785) (5,122) (6,084) (6,436) Mortgage Expenses (312) (312) (312) (312) (699) Consumer Program Servicing Fee 257 (554) 2 546 (96) Reserve for Unfunded Commitment (16,513) (5,816) (5,870) (7,303) (8,583) Total Adjustments 20,437 19,151 19,550 20,136 19,796 Core Bank Operating Expense Burden • Core operating expense burden remains in line with the five - quarter average as the Company focuses on controlling expenses Dollars in millions.

(1) Core deposits exclude time deposits 15 Deposit Composition – Q3’24 Core Deposit Growth (1) • Total deposits were down slightly compared to Q2 • $75 million brokered deposits, maturing late - 2024, and $165 million of short - term FHLB advances at September 30, 2024 Cost of Deposits: 304 bps Demand Deposits 12.7% NOW Accounts 22.6% Money Market Accounts 25.3% Savings Accounts 26.4% Time Deposits 12.9% $2,458 $2,492 $2,429 $2,351 $2,351 $421 $420 $463 $473 $491 $2,879 $2,912 $2,892 $2,824 $2,842 3.04% 2.98% 2.82% 2.69% 2.60% Q3'24 Q2'24 Q1'24 Q4'23 Q3'23 Demand Interest Bearing Deposits Cost of Deposits NOO CRE By Collateral Type (1) • Hotel portfolio down to $193 million from almost $300 million in early 2020 • Occupancy, RevPAR, and ADR exceeding 2019 performance • Debt coverage over 1.50x • Office non owner - occupied CRE was $136 million at September 30 • LTV across all office is 63% • All guaranteed by very high net worth guarantors • Significant maturities/rate resets don’t begin until 2026 • Retail exposure of $93 million at September 30 • Low weighted - average LTV of 58% • Low average loan size of less than $2 million 16 Dollars in millions.

(1) Loan balances using Book Balances and total loans include loans held for sale for Life Premium Finance transaction Non - Owner Occupied Office CRE $136 4% Non - Owner Occupied Non - Office CRE $468 14% All Other Loans Excl PPP $2,729 82% % of Portfolio Excl PPP Total Outstanding Non - Owner - Occupied CRE by Type 5.8% $193 Hotel 4.1% $136 Office 2.8% $93 Retail 1.8% $61 Assisted Living 1.0% $34 All other 0.7% $22 Warehouse/Industrial 1.5% $50 Mixed Use 18.1% $604 Total Non - Owner Occupied CRE 0.27% 0.24% 0.11% 0.07% 0.15% 0.26% 0.37% 0.53% 0.53% 0.78% 0.53% 0.61% 0.64% 0.60% 0.93% Q3'23 Q4'23 Q1'24 Q2'24 Q3'24 Core C/O's Consumer Program C/O's Classified loans and NPAs exclude guaranteed portion of SBA loans.

Core net charge - offs exclude consumer program charge - offs Loans include Life Premium Finance loans that are held for sale 17 NPAs / Loans (Ex. PPP) + OREO Core NCOs / Average Loans Criticized & Classified Loans / Total Loans (Ex. PPP) • Nonperforming assets, excluding portions guaranteed by the SBA, were $10.2 million at September 30, 2024, compared to $9.9 million at June 30, 2024 • Loans rated substandard or doubtful increased to $47.6 million in the third quarter of 2024 from $15.5 million in the second quarter of 2024 largely due to one credit that was downgraded in the quarter • Net charge - offs were $8.0 million for the third quarter of 2024, up from $5.0 million for the second quarter of 2024 • Includes $6.7 million from Consumer Program • Core net charge - offs of $1.3 million • No OREO as of September 30, 2024 1.88% 0.90% 0.96% 3.02% 2.85% Q3'23 Q4'23 Q1'24 Q2'24 Q3'24 0.62% 0.24% 0.27% 0.30% 0.31% Q3'23 Q4'23 Q1'24 Q2'24 Q3'24 18 ACL Walk Forward ACL / Gross Loans (Ex.

PPP) (1) • Provision for credit losses of $7.5 million in Q3 versus provision of $3.1 million in Q2 • Provision includes $4.0 million related to Consumer Program • ACL coverage of gross loans, including Life Premium Finance loans classified as HFS, was 1.53% at the end of Q3 Dollars in millions (1) Gross Loans include Life Premium Finance loans that are held for sale 4 &RQV3UJP/RDQV3URY &RQV3UJP&2 V &RUH3URY &RUH& 2 V 4 1.06% 0.99% 1.01% 0.94% 1.00% 2.24% 11.38% 11.37% 11.61% 10.87% 1.13% 1.62% 1.66% 1.56% 1.53% Q3'23 Q4'23 Q1'24 Q2'24 Q3'24 Core Consumer Program • Talented management team and board committed to building long - term shareholder value • Attractive core - funded community bank with a complementary digital funding platform • Aggressive and early use of technology positioning the Bank for superior performance as the industry evolves • Significant valuation upside 19


Appendix 20

21 Primis Financial Corp. (Dollars in thousands, except per share data) For Three Months Ended: Reconciliation of Non-GAAP items: 3Q 2024 2Q 2024 1Q 2024 4Q 2023 3Q 2023 3Q 2024 3Q 2023 Net income (loss) attributable to Primis' common shareholders 1,212$ 3,782$ 2,466$ (8,171)$ (6,029)$ 7,460$ 339$ Non-GAAP adjustments to Net Income: Branch Consolidation / Other restructuring - - - 449 - - 1,488 Loan officer fraud, operational losses - - - - 200 - 200 1,352 1,453 438 - - 3,243 - Professional fee expenses related to Panacea investment - - - 194 - - - Goodwill impairment - - - - 11,150 - 11,150 Gains on sale of closed bank branch buildings (352) (124) - - - (476) - - Income tax effect (216) (287) (95) (139) (44) (598) (365) 1,996$ 4,824$ 2,809$ (7,667)$ 5,277$ 9,629$ 12,813$ Net income (loss) attributable to Primis' common shareholders 1,212$ 3,782$ 2,466$ (8,171)$ (6,029)$ 7,460$ 339$ Income tax expense (benefit) (304) 1,265 718 (4,472) 1,519 1,679 3,405 7,607 2,573 6,506 21,864 1,359 16,686 10,685 Pre-tax pre-provision earnings 8,515$ 7,620$ 9,690$ 9,221$ (3,151)$ 25,825$ 14,429$ 1,000 1,329 438 643 11,350 2,767 12,838 Pre-tax pre-provision operating earnings 9,515$ 8,949$ 10,128$ 9,864$ 8,199$ 28,592$ 27,267$ Return on average assets 0.12% 0.39% 0.26% (0.85%) (0.62%) 0.25% 0.01% Effect of adjustment for nonrecurring income and expenses 0.08% 0.11% 0.04% 0.05% 1.17% 0.07% 0.42% Operating return on average assets 0.20% 0.50% 0.29% (0.79%) 0.54% 0.33% 0.43% Return on average assets 0.12% 0.39% 0.26% (0.85%) (0.62%) 0.25% 0.01% Effect of tax expense (0.03%) 0.13% 0.08% (0.46%) 0.16% 0.06% 0.11% 0.76% 0.26% 0.68% 2.27% 0.14% 0.57% 0.36% Pre-tax pre-provision return on average assets 0.85% 0.78% 1.02% 0.96% (0.33%) 0.88% 0.48% 0.10% 0.14% 0.04% 0.05% 0.02% 0.09% 0.43% Pre-tax pre-provision operating return on average assets 0.95% 0.92% 1.05% 1.01% (0.30%) 0.98% 0.91% Return on average common equity 1.28% 4.06% 2.62% (8.43%) (6.11%) 2.66% 0.11% Effect of adjustment for nonrecurring income and expenses 0.83% 1.12% 0.37% 0.52% 11.47% 0.77% 4.20% Operating return on average common equity 2.11% 5.18% 2.99% (7.91%) 5.35% 3.44% 4.32% Effect of goodwill and other intangible assets 0.69% 1.75% 0.99% (2.61%) 2.00% 1.17% 1.60% Operating return on average tangible common equity 2.80% 6.93% 3.98% (10.53%) 7.35% 4.60% 5.92% Efficiency ratio 83.22% 82.62% 77.41% 81.31% 108.50% 81.12% 86.30% (2.87%) (3.76%) (1.23%) (1.88%) (33.33%) (2.63%) (11.74%) Operating efficiency ratio 80.35% 78.86% 76.17% 79.43% 75.17% 78.49% 74.56% Earnings per common share - Basic 0.05$ 0.15$ 0.10$ (0.33)$ (0.24)$ 0.30$ 0.01$ Effect of adjustment for nonrecurring income and expenses 0.03 0.05 0.01 0.02 0.45 0.09 0.51 Operating earnings per common share - Basic 0.08$ 0.20$ 0.11$ (0.31)$ 0.21$ 0.39$ 0.52$ Earnings per common share - Diluted 0.05$ 0.15$ 0.10$ (0.33)$ (0.24)$ 0.30$ 0.01$ Effect of adjustment for nonrecurring income and expenses 0.03 0.05 0.01 0.02 0.45 0.09 0.51 Operating earnings per common share - Diluted 0.08$ 0.20$ 0.11$ (0.31)$ 0.21$ 0.39$ 0.52$ Book value per common share 15.43$ 15.23$ 15.16$ 15.23$ 15.30$ 15.43$ 15.30$ Effect of goodwill and other intangible assets (3.82) (3.83) (3.85) (3.86) (3.88) (3.82) (3.88) Tangible book value per common share 11.61$ 11.40$ 11.31$ 11.37$ 11.42$ 11.61$ 11.42$ Total Primis common stockholders' equity 381,352$ 376,393$ 374,577$ 376,161$ 377,610$ 381,352$ 377,610$ Less goodwill and other intangible assets (94,444) (94,768) (95,093) (95,417) (95,741) (94,444) (95,741) Tangible common equity 286,908$ 281,625$ 279,484$ 280,744$ 281,869$ 286,908$ 281,869$ Common equity to assets 9.48% 9.49% 9.63% 9.75% 9.84% 9.48% 9.84% Effect of goodwill and other intangible assets (2.18%) (2.22%) (2.27%) (2.29%) (2.31%) (2.18%) (2.31%) Tangible common equity to tangible assets 7.30% 7.27% 7.36% 7.46% 7.53% 7.30% 7.53% For Nine Months Ended: Professional fee expenses related to the SEC pre-clear process and financial reporting restatements Net income (loss) attributable to Primis' common shareholders adjusted for Effect of provision for credit losses (incl. unfunded commitment expense) Provision for credit losses (incl. unfunded commitment expense) Effect of adjustment for nonrecurring income and expenses Effect of adjustment for nonrecurring income and expenses Effect of adjustment for nonrecurring income and expenses and expenses