UNITED STATES
SECURITIES AND EXCHANGE COMMISSION
Washington, D.C. 20549
FORM 8-K
CURRENT REPORT
Pursuant to Section 13 or 15(d) of The Securities Exchange Act of 1934
Date of Report (Date of earliest event reported): October 21, 2024
ATLANTIC UNION BANKSHARES CORPORATION
(Exact name of registrant as specified in its charter)
| Virginia | 001-39325 | 54-1598552 |
| (State or other jurisdiction | (Commission | (I.R.S. Employer |
| of incorporation) | File Number) | Identification No.) |
4300 Cox Road
Glen Allen, Virginia 23060
(Address of principal executive offices, including Zip Code)
Registrant’s telephone number, including area code: (804) 633-5031
Check the appropriate box below if the Form 8-K filing is intended to simultaneously satisfy the filing obligation of the registrant under any of the following provisions (see General Instruction A.2. below):
| ¨ | Written communications pursuant to Rule 425 under the Securities Act (17 CFR 230.425) |
| ¨ | Soliciting material pursuant to Rule 14a-12 under the Exchange Act (17 CFR 240.14a-12) |
| ¨ | Pre-commencement communications pursuant to Rule 14d-2(b) under the Exchange Act (17 CFR 240.14d-2(b)) |
| ¨ | Pre-commencement communications pursuant to Rule 13e-4(c) under the Exchange Act (17 CFR 240.13e-4(c)) |
Securities registered pursuant to Section 12(b) of the Act:
| Title of each class | Trading Symbol(s) | Name of each exchange on which registered | ||
| Common Stock, par value $1.33 per share | | AUB | | New York Stock Exchange |
| Depositary Shares, Each Representing a 1/400th Interest in a Share of 6.875% Perpetual Non-Cumulative Preferred Stock, Series A | AUB.PRA | New York Stock Exchange |
Indicate by check mark whether the registrant is an emerging growth company as defined in Rule 405 of the Securities Act of 1933 (§230.405 of this chapter) or Rule 12b-2 of the Securities Exchange Act of 1934 (§240.12b-2 of this chapter).
| Emerging growth company | ¨ |
| If an emerging growth company, indicate by check mark if the registrant has elected not to use the extended transition period for complying with any new or revised financial accounting standards provided pursuant to Section 13(a) of the Exchange Act. | ¨ |
Item 2.02 Results of Operations and Financial Condition
On October 21, 2024, Atlantic Union Bankshares Corporation (the “Company”) issued a press release announcing its financial results for the third quarter of 2024. A copy of the press release is being furnished as Exhibit 99.1 hereto and is incorporated herein by reference. The Company does not incorporate by reference information presented at any website referenced in the press release.
The information provided under Item 2.02 of this Current Report on Form 8-K, including Exhibit 99.1, is being furnished and is not deemed to be “filed” with the Securities and Exchange Commission (“SEC”) for the purposes of Section 18 of the Securities Exchange Act of 1934, as amended (the “Exchange Act”) or otherwise subject to the liabilities of that section and is not incorporated by reference into any filing of the Company under the Securities Act of 1933, as amended (the “Securities Act”) or the Exchange Act, whether made before or after the date hereof, except as shall be expressly set forth by specific reference to this Current Report on Form 8-K in such a filing.
Item 7.01 Regulation FD Disclosure
Attached as Exhibit 99.2 and incorporated herein by reference is an investor presentation, dated October 21, 2024, regarding the Company’s financial results for the third quarter of 2024 that the Company will use in connection with a webcast and conference call for investors and analysts at 9:00 a.m. Eastern Time on Monday, October 21, 2024. This call has been rescheduled from the previously announced date and time. This presentation is also available under the Presentations link in the Investor Relations – News & Events section of the Company’s website at https://investors.atlanticunionbank.com.
The information provided under Item 7.01 of this Current Report on Form 8-K, including Exhibit 99.2, is being furnished and is not deemed to be “filed” with the SEC for the purposes of Section 18 of the Exchange Act or otherwise subject to the liabilities of that section and is not incorporated by reference into any filing of the Company under the Securities Act or the Exchange Act, whether made before or after the date hereof, except as shall be expressly set forth by specific reference to this Current Report on Form 8-K in such a filing. The Company does not incorporate by reference to this Current Report on Form 8-K information presented at any website referenced in this report or in any of the Exhibits attached hereto.
Item 9.01 Financial Statements and Exhibits.
(d) Exhibits
| Exhibit No. |
Description of Exhibit | |
| 99.1 | Press release dated October 21, 2024 regarding the third quarter 2024 results. | |
| 99.2 | Atlantic Union Bankshares Corporation investor presentation, dated October 21, 2024. | |
| 104 | The cover page from this Current Report on Form 8-K, formatted in Inline XBRL. |
SIGNATURES
Pursuant to the requirements of the Securities Exchange Act of 1934, the registrant has duly caused this report to be signed on its behalf by the undersigned hereunto duly authorized.
| ATLANTIC UNION BANKSHARES CORPORATION | ||
| Date: October 21, 2024 | By: | /s/ Robert M. Gorman |
| Robert M. Gorman | ||
| Executive Vice President and | ||
| Chief Financial Officer | ||
Exhibit 99.1

| Contact: | Robert M. Gorman - (804) 523-7828 |
Executive Vice President / Chief Financial Officer
ATLANTIC UNION BANKSHARES REPORTS THIRD QUARTER FINANCIAL RESULTS
Atlantic Union Bankshares investor call today, Monday, October 21, 2024 at 9:00 a.m. (EDT)
Richmond, Va., October 21, 2024 – Atlantic Union Bankshares Corporation (the “Company” or “Atlantic Union”) (NYSE: AUB) reported net income available to common shareholders of $73.4 million and basic and diluted earnings per common share of $0.82 for the third quarter of 2024 and adjusted operating earnings available to common shareholders(1) of $74.5 million and adjusted diluted operating earnings per common share(1) of $0.83 for the third quarter of 2024.
“Atlantic Union delivered solid financial results in the quarter and the enhanced earnings power we envisioned as a result of the American National Bankshares acquisition is now evident,” said John C. Asbury, president and chief executive officer of Atlantic Union. “During the quarter, we completed the integration work associated with American National Bank and added to our teams in our North Carolina markets which we believe offer long term growth and expansion opportunities. October marks the 8-year anniversary of my having joined the Company, and the transformation we have achieved during this time is exactly what we said we’d do at the outset. This would not have been possible without the dedication of our Teammates and support of our customers. We remain excited about what the future holds for Atlantic Union.
“Operating under the mantra of soundness, profitability, and growth – in that order of priority – Atlantic Union remains committed
to generating sustainable, profitable growth, and building long-term value for our shareholders.”
NET INTEREST INCOME
For the third quarter of 2024, net interest income was $182.9 million, a decrease of $1.6 million from $184.5 million in the second quarter of 2024. Net interest income - fully taxable equivalent (“FTE”)(1) was $186.8 million in the third quarter of 2024, a decrease of $1.5 million from $188.3 million in the second quarter of 2024. The decreases from the prior quarter in both net interest income and net interest income (FTE)(1) were primarily the result of increased interest expense due to the $111.3 million increase in average interest bearing liabilities and lower net accretion income and investment securities interest income, partially offset by increased interest income due to the $165.4 million increase in average loans held for investment (“LHFI”). For the third quarter of 2024, both the Company’s net interest margin and the net interest margin (FTE)(1) decreased 8 basis points compared to the prior quarter to 3.31% and to 3.38%, respectively, primarily due to higher cost of funds and lower yields on earning assets. Earning asset yields for the third quarter of 2024 decreased 2 basis points to 5.94% compared to the second quarter of 2024, primarily due to lower yields on securities and lower loan accretion income, partially offset by growth in average LHFI. Cost of funds increased from the prior quarter by 6 basis points to 2.56% for the third quarter of 2024, due primarily to average deposit growth in higher yielding deposit products, partially offset by lower borrowing costs.
The Company’s net interest margin (FTE) (1) includes the impact of acquisition accounting fair value adjustments. Net accretion income related to acquisition accounting declined by $1.6 million to $12.7 million for the quarter ended September 30, 2024, compared to $14.3 million for the quarter ended June 30, 2024. The impact of accretion and amortization for the periods presented are reflected in the following table (dollars in thousands):
| Loan | Deposit | Borrowings | ||||||||||||||
| Accretion | Amortization | Amortization | Total | |||||||||||||
| For the quarter ended June 30, 2024 | $ | 15,660 | $ | (1,035 | ) | $ | (285 | ) | $ | 14,340 | ||||||
| For the quarter ended September 30, 2024 | 13,926 | (913 | ) | (288 | ) | 12,725 | ||||||||||
ASSET QUALITY
Overview
At September 30, 2024, nonperforming assets (“NPAs”) as a percentage of total LHFI was 0.20%, consistent with the prior quarter and included nonaccrual loans of $36.8 million. Accruing past due loans as a percentage of total LHFI totaled 30 basis points at September 30, 2024, an increase of 8 basis points from June 30, 2024, and an increase of 3 basis points from September 30, 2023. Net charge-offs were 0.01% of total average LHFI (annualized) for the third quarter of 2024, a decrease of 3 basis points from June 30, 2024, and consistent with September 30, 2023. The allowance for credit losses (“ACL”) totaled $177.6 million at September 30, 2024, a $1.9 million increase from the prior quarter.
Nonperforming Assets
At September 30, 2024, NPAs totaled $37.3 million, compared to $36.1 million in the prior quarter. The following table shows a summary of NPA balances at the quarters ended (dollars in thousands):
| September 30, | June 30, | March 31, | December 31, | September 30, | ||||||||||||||||
| 2024 | 2024 | 2024 | 2023 | 2023 | ||||||||||||||||
| Nonaccrual loans | $ | 36,847 | $ | 35,913 | $ | 36,389 | $ | 36,860 | $ | 28,626 | ||||||||||
| Foreclosed properties | 404 | 230 | 29 | 29 | 149 | |||||||||||||||
| Total nonperforming assets | $ | 37,251 | $ | 36,143 | $ | 36,418 | $ | 36,889 | $ | 28,775 | ||||||||||
The following table shows the activity in nonaccrual loans for the quarters ended (dollars in thousands):
| September 30, | June 30, | March 31, | December 31, | September 30, | ||||||||||||||||
| 2024 | 2024 | 2024 | 2023 | 2023 | ||||||||||||||||
| Beginning Balance | $ | 35,913 | $ | 36,389 | $ | 36,860 | $ | 28,626 | $ | 29,105 | ||||||||||
| Net customer payments | (2,219 | ) | (6,293 | ) | (1,583 | ) | (2,198 | ) | (1,947 | ) | ||||||||||
| Additions | 5,347 | 6,831 | 5,047 | 10,604 | 1,651 | |||||||||||||||
| Charge-offs | (542 | ) | (759 | ) | (3,935 | ) | (172 | ) | (64 | ) | ||||||||||
| Loans returning to accruing status | (1,478 | ) | (54 | ) | — | — | (119 | ) | ||||||||||||
| Transfers to foreclosed property | (174 | ) | (201 | ) | — | — | — | |||||||||||||
| Ending Balance | $ | 36,847 | $ | 35,913 | $ | 36,389 | $ | 36,860 | $ | 28,626 | ||||||||||
Past Due Loans
At September 30, 2024, past due loans still accruing interest totaled $55.2 million or 0.30% of total LHFI, compared to $40.2 million or 0.22% of total LHFI at June 30, 2024, and $40.6 million or 0.27% of total LHFI at September 30, 2023. The increase in past due loan levels at September 30, 2024 from June 30, 2024 was primarily within the 60-89 days past due category and driven by increases in past due relationships within the Commercial Real Estate (“CRE”) non-owner occupied, CRE owner occupied, and residential 1-4 family consumer as well as increases in Commercial and Industrial (“C&I”) past due relationships within the 30-59 days past due category. Of the total past due loans still accruing interest, $15.2 million or 0.08% of total LHFI were past due 90 days or more at September 30, 2024, compared to $15.6 million or 0.09% of total LHFI at June 30, 2024, and $11.9 million or 0.08% of total LHFI at September 30, 2023.
Allowance for Credit Losses
At September 30, 2024, the ACL was $177.6 million and included an allowance for loan and lease losses (“ALLL”) of $160.7 million and a reserve for unfunded commitments (“RUC”) of $16.9 million. The ACL at September 30, 2024 increased $1.9 million from June 30, 2024, primarily due to the impact of continued uncertainty in the economic outlook on certain portfolios.
The ACL as a percentage of total LHFI was 0.97% at September 30, 2024, compared to 0.96% at June 30, 2024. The ALLL as a percentage of total LHFI was 0.88% at September 30, 2024, compared to 0.86% at June 30, 2024.
Net Charge-offs
Net charge-offs were $0.7 million or 0.01% of total average LHFI on an annualized basis for the third quarter of 2024, compared to $1.7 million or 0.04% (annualized) for the second quarter of 2024, and $0.3 million or 0.01% (annualized) for the third quarter of 2023.
Provision for Credit Losses
For the third quarter of 2024, the Company recorded a provision for credit losses of $2.6 million, compared to $21.8 million in the prior quarter, and $5.0 million in the third quarter of 2023. Included in the provision for credit losses for the second quarter of 2024 was $13.2 million initial provision expense on non-purchased credit deteriorated loans and $1.4 million on unfunded commitments, each acquired from American National Bankshares Inc. (“American National”).
NONINTEREST INCOME
Noninterest income increased $10.5 million to $34.3 million for the third quarter of 2024 from $23.8 million in the prior quarter, primarily driven by $6.5 million of pre-tax losses incurred in the prior quarter on the sale of available for sale (“AFS”) securities as part of the Company’s restructuring of the American National securities portfolio.
Adjusted operating noninterest income,(1) which excludes losses and gains on sale of AFS securities (pre-tax gains of $4,000 in the third quarter and pre-tax losses of $6.5 million in the second quarter), increased $4.0 million to $34.3 million for the third quarter from $30.3 million for the prior quarter, primarily driven by a $1.9 million increase in other operating income due to an increase in equity method investment income, a $1.2 million increase in bank owned life insurance income primarily driven by death benefits received in the third quarter, and a $706,000 seasonal increase in service charges on deposit accounts.
NONINTEREST EXPENSE
Noninterest expense decreased $27.4 million to $122.6 million for the third quarter of 2024 from $150.0 million in the prior quarter, primarily driven by a $28.4 million decrease in pre-tax merger-related expenses associated with the American National acquisition.
Adjusted operating noninterest expense,(1) which excludes merger-related costs ($1.4 million in the third quarter and $29.8 million in the second quarter) and amortization of intangible assets ($5.8 million in the third quarter and $6.0 million in the second quarter), increased $1.2 million to $115.4 million for the third quarter from $114.2 million in the prior quarter, primarily driven by a $923,000 increase in salaries and benefits due to increases in variable incentive compensation expenses and full-time equivalent employees, as well as a $607,000 increase in Federal Deposit Insurance Corporation (“FDIC”) assessment premiums and other insurance driven by an increase in our assessment base as a result of the American National acquisition. These increases were partially offset by a $537,000 decrease in technology and data processing expense.
INCOME TAXES
The Company’s effective tax rate for the three months ended September 30, 2024 and 2023 was 17.0% and 17.6%, respectively, and the effective tax rate for the nine months ended September 30, 2024 and 2023 was 19.7% and 16.3%. respectively. The increase in the effective tax rate for the nine months ended September 30, 2024 was primarily due to a $4.8 million valuation allowance established during the second quarter of 2024, which resulted in a 250 basis points increase in the effective tax rate.
BALANCE SHEET
At September 30, 2024, total assets were $24.8 billion, an increase of $42.3 million or approximately 0.7% (annualized) from June 30, 2024 and $4.1 billion or approximately 19.6% from September 30, 2023. Total assets increased from the prior quarter due to an increase in cash and cash equivalents primarily due to deposit growth, as well as an increase in the investment securities portfolio due to an increase in the market value of the AFS securities portfolio, partially offset by a decrease in other assets driven by decreases in deferred income taxes associated with other comprehensive income fair value changes related to AFS securities and derivatives in the current quarter. The increase in total assets from the prior year was due to growth in LHFI and the AFS securities portfolio, primarily due to the American National acquisition.
As a result of the American National acquisition, the Company’s associated goodwill at September 30, 2024 totaled $287.5 million. During the quarter ended September 30, 2024, the Company adjusted the allocation of the purchase price for certain provisional amounts recognized at the acquisition date to reflect new information obtained about facts and circumstances that existed as of the acquisition date. The measurement period adjustments recorded in this quarter relate to deferred taxes, the fair values of long-term borrowings, and foreclosed properties, which resulted in a $5.2 million increase in the preliminary goodwill recognized during the second quarter of 2024.
At September 30, 2024, LHFI totaled $18.3 billion, a decrease of $9.9 million or 0.2% (annualized) from June 30, 2024, and an increase of $3.1 billion or 20.0% from September 30, 2023. LHFI decreased from the prior quarter primarily due to decreases in the commercial and industrial loan portfolio as a result of loan paydowns and lower revolving credit usage, partially offset by increases in the construction and land development loan portfolio as construction projects continued to fund up. The increase from the same period in the prior year was primarily due to the American National acquisition. Quarterly average LHFI totaled $18.3 billion, an increase of $165.4 million or 3.6% (annualized) from the prior quarter, and an increase of $3.5 billion or 23.8% (annualized) from September 30, 2023. Quarterly average LHFI increased from the prior quarter primarily due to an increase in the CRE owner occupied, multifamily real estate, and construction and land development loan portfolios, partially offset by a decrease in the CRE non-owner occupied loan portfolio. The increase from the same period in the prior year was primarily due to the American National acquisition, as well as loan growth.
At September 30, 2024, total investments were $3.5 billion, an increase of $41.7 million or 4.7% (annualized) from June 30, 2024, and an increase of $500.2 million or 16.5% from September 30, 2023. The increase compared to the prior quarter was primarily due to the increase in the market value of the AFS securities portfolio, and the increase compared to the same period in the prior year was primarily due to the American National acquisition. AFS securities totaled $2.6 billion at both September 30, 2024 and June 30, 2024 and increased from $2.1 billion at September 30, 2023. Total net unrealized losses on the AFS securities portfolio were $334.5 million at September 30, 2024, compared to $420.7 million at June 30, 2024, and $523.1 million at September 30, 2023. Held to maturity securities are carried at cost and totaled $807.1 million at September 30, 2024, $810.5 million at June 30, 2024, and $843.3 million at September 30, 2023 and had net unrealized losses of $30.3 million at September 30, 2024, $44.0 million at June 30, 2024, and $81.2 million at September 30, 2023.
At September 30, 2024, total deposits were $20.3 billion, an increase of $304.4 million or 6.1% (annualized) from the prior quarter. Average deposits at September 30, 2024 increased from the prior quarter by $140.5 million or 2.8% (annualized). Total deposits at September 30, 2024 increased $3.5 billion or 21.0% from September 30, 2023, and quarterly average deposits at September 30, 2024 increased $3.4 billion or 20.1% from the same period in the prior year. The increase in deposit balances from the prior quarter are primarily due to increases in interest bearing customer deposits and brokered deposits of $325.6 million and $83.2 million, respectively, partially offset by decreases of $104.4 million in demand deposits. The increase from the same period in the prior year is primarily related to the addition of the American National acquired deposits, as well as an increase of $901.5 million in brokered deposits.
At September 30, 2024, total borrowings were $852.2 million, a decrease of $354.6 million from June 30, 2024 and a decrease of $168.5 million from September 30, 2023. At September 30, 2024 average borrowings were $855.3 million, a decrease of $188.0 million from June 30, 2024, and a decrease of $49.9 million from September 30, 2023. The decreases in average borrowings from the prior quarter and the same period in the prior year were primarily due to paydowns of short-term borrowings due to deposit growth.
The following table shows the Company’s capital ratios at the quarters ended:
| September 30, | June 30, | September 30, | ||||||||||
| 2024 | 2024 | 2023 | ||||||||||
| Common equity Tier 1 capital ratio (2) | 9.77 | % | 9.47 | % | 9.94 | % | ||||||
| Tier 1 capital ratio (2) | 10.57 | % | 10.26 | % | 10.88 | % | ||||||
| Total capital ratio (2) | 13.33 | % | 12.99 | % | 13.70 | % | ||||||
| Leverage ratio (Tier 1 capital to average assets) (2) | 9.27 | % | 9.05 | % | 9.62 | % | ||||||
| Common equity to total assets | 12.16 | % | 11.62 | % | 10.72 | % | ||||||
| Tangible common equity to tangible assets (1) | 7.29 | % | 6.71 | % | 6.45 | % | ||||||
(1) These are financial measures not calculated in accordance with generally accepted accounting principles (“GAAP”). For a reconciliation of these non-GAAP financial measures, see the “Alternative Performance Measures (non-GAAP)” section of the Key Financial Results.
(2) All ratios at September 30, 2024 are estimates and subject to change pending the Company’s filing of its FR Y9-C. All other periods are presented as filed.
During the third quarter of 2024, the Company declared and paid a quarterly dividend on the outstanding shares of Series A Preferred Stock of $171.88 per share (equivalent to $0.43 per outstanding depositary share), consistent with the second quarter of 2024 and the third quarter of 2023. During the third quarter of 2024, the Company also declared and paid cash dividends of $0.32 per common share, consistent with the second quarter of 2024 and a $0.02 increase or approximately 6.7% from the third quarter of 2023.
ABOUT ATLANTIC UNION BANKSHARES CORPORATION
Headquartered in Richmond, Virginia, Atlantic Union Bankshares Corporation (NYSE: AUB) is the holding company for Atlantic Union Bank. Atlantic Union Bank had 129 branches and approximately 150 ATMs located throughout Virginia and in portions of Maryland and North Carolina as of September 30, 2024. Certain non-bank financial services affiliates of Atlantic Union Bank include: Atlantic Union Equipment Finance, Inc., which provides equipment financing; Atlantic Union Financial Consultants, LLC, which provides brokerage services; and Union Insurance Group, LLC, which offers various lines of insurance products.
THIRD QUARTER 2024 EARNINGS RELEASE CONFERENCE CALL
The Company will hold a conference call and webcast for investors at 9:00 a.m. Eastern Time on Monday, October 21, 2024, during which management will review our financial results for the third quarter 2024 and provide an update on our recent activities. This call has been rescheduled from the previously announced date and time.
The listen-only webcast and the accompanying slides can be accessed at:
https://edge.media-server.com/mmc/p/6q92at5j.
For analysts who wish to participate in the conference call, please register at the following URL:
https://register.vevent.com/register/BI352e42e841fa454e85cc98ae24ac2697. To participate in the conference call, you must use the link to receive an audio dial-in number and an Access PIN.
A replay of the webcast, and the accompanying slides, will be available on the Company’s website for 90 days at: https://investors.atlanticunionbank.com/.
NON-GAAP FINANCIAL MEASURES
In reporting the results as of and for the period ended September 30, 2024, we have provided supplemental performance measures determined by methods other than in accordance with GAAP. These non-GAAP financial measures are a supplement to GAAP, which is used to prepare our financial statements, and should not be considered in isolation or as a substitute for comparable measures calculated in accordance with GAAP. In addition, our non-GAAP financial measures may not be comparable to non-GAAP financial measures of other companies. We use the non-GAAP financial measures discussed herein in its analysis of our performance. Our management believes that these non-GAAP financial measures provide additional understanding of ongoing operations, enhance comparability of results of operations with prior periods and show the effects of significant gains and charges in the periods presented without the impact of items or events that may obscure trends in our underlying performance. For a reconciliation of these measures to their most directly comparable GAAP measures and additional information about these non-GAAP financial measures, see “Alternative Performance Measures (non-GAAP)” in the tables within the section “Key Financial Results.”
FORWARD-LOOKING STATEMENTS
This press release and statements by our management may constitute “forward-looking statements” within the meaning of the Private Securities Litigation Reform Act of 1995. Forward-looking statements are statements that include, without limitation, statements made in Mr. Asbury’s quotations, statements regarding our future ability to recognize the benefits of certain tax assets, our business, financial and operating results, including our deposit base and funding, the impact of future economic conditions, changes in economic conditions, our asset quality, our customer relationships, and statements that include other projections, predictions, expectations, or beliefs about future events or results or otherwise are not statements of historical fact. Such forward-looking statements are based on certain assumptions as of the time they are made, and are inherently subject to known and unknown risks, uncertainties, and other factors, some of which cannot be predicted or quantified, that may cause actual results, performance, or achievements to be materially different from those expressed or implied by such forward-looking statements. Forward-looking statements are often characterized by the use of qualified words (and their derivatives) such as “expect,” “believe,” “estimate,” “plan,” “project,” “anticipate,” “intend,” “will,” “may,” “view,” “opportunity,” “potential,” “continue,” “confidence,” or words of similar meaning or other statements concerning opinions or judgment of the Company and our management about future events. Although we believe that our expectations with respect to forward-looking statements are based upon reasonable assumptions within the bounds of our existing knowledge of our business and operations, there can be no assurance that actual future results, performance, or achievements of, or trends affecting, us will not differ materially from any projected future results, performance, achievements or trends expressed or implied by such forward-looking statements. Actual future results, performance, achievements or trends may differ materially from historical results or those anticipated depending on a variety of factors, including, but not limited to, the effects of or changes in:
| · | market interest rates and their related impacts on macroeconomic conditions, customer and client behavior, our funding costs and our loan and securities portfolios; | |
| · | inflation and its impacts on economic growth and customer and client behavior; | |
| · | adverse developments in the financial industry generally, such as bank failures, responsive measures to mitigate and manage such developments, related supervisory and regulatory actions and costs, and related impacts on customer and client behavior; | |
| · | the sufficiency of liquidity and changes in our capital positions; | |
| · | general economic and financial market conditions, in the United States generally and particularly in the markets in which we operate and which our loans are concentrated, including the effects of declines in real estate values, an increase in unemployment levels and slowdowns in economic growth; | |
| · | the American National acquisition, including the impact of purchase accounting, any change in the assumptions used regarding the assets acquired and liabilities assumed to determine the fair value and credit marks, and the possibility that the anticipated benefits are not realized when expected or at all; | |
| · | potential adverse reactions or changes to business or employee relationships, including those resulting from the American National acquisition; | |
| · | monetary and fiscal policies of the U.S. government, including policies of the U.S. Department of the Treasury and the Federal Reserve; | |
| · | the quality or composition of our loan or investment portfolios and changes therein; | |
| · | demand for loan products and financial services in our market areas; | |
| · | our ability to manage our growth or implement our growth strategy; |
| · | the effectiveness of expense reduction plans; | |
| · | the introduction of new lines of business or new products and services; | |
| · | our ability to recruit and retain key employees; | |
| · | real estate values in our lending area; | |
| · | changes in accounting principles, standards, rules, and interpretations, and the related impact on our financial statements; | |
| · | an insufficient ACL or volatility in the ACL resulting from the CECL methodology, either alone or as that may be affected by changing economic conditions, credit concentrations, inflation, changing interest rates, or other factors; | |
| · | concentrations of loans secured by real estate, particularly commercial real estate; | |
| · | the effectiveness of our credit processes and management of our credit risk; | |
| · | our ability to compete in the market for financial services and increased competition from fintech companies; | |
| · | technological risks and developments, and cyber threats, attacks, or events; | |
| · | operational, technological, cultural, regulatory, legal, credit, and other risks associated with the exploration, consummation and integration of potential future acquisitions, whether involving stock or cash considerations; | |
| · | the potential adverse effects of unusual and infrequently occurring events, such as weather-related disasters, terrorist acts, geopolitical conflicts or public health events (such as pandemics), and of governmental and societal responses thereto; these potential adverse effects may include, without limitation, adverse effects on the ability of our borrowers to satisfy their obligations to us, on the value of collateral securing loans, on the demand for our loans or our other products and services, on supply chains and methods used to distribute products and services, on incidents of cyberattack and fraud, on our liquidity or capital positions, on risks posed by reliance on third-party service providers, on other aspects of our business operations and on financial markets and economic growth; | |
| · | performance by our counterparties or vendors; | |
| · | deposit flows; | |
| · | the availability of financing and the terms thereof; | |
| · | the level of prepayments on loans and mortgage-backed securities; | |
| · | the effects of legislative or regulatory changes and requirements, including changes in federal, state or local tax laws; | |
| · | actual or potential claims, damages, and fines related to litigation or government actions, which may result in, among other things, additional costs, fines, penalties, restrictions on our business activities, reputational harm, or other adverse consequences; | |
| · | any event or development that would cause us to conclude that there was an impairment of any asset, including intangible assets, such as goodwill; and | |
| · | other factors, many of which are beyond our control. |
Please also refer to such other factors as discussed throughout Part I, Item 1A. “Risk Factors” and Part II, Item 7. “Management’s Discussion and Analysis of Financial Condition and Results of Operations” of our Annual Report on Form 10-K for the year ended December 31, 2023 and related disclosures in other filings, which have been filed with the U.S. Securities and Exchange Commission (“SEC”) and are available on the SEC’s website at www.sec.gov. All risk factors and uncertainties described herein and therein should be considered in evaluating forward-looking statements, and all of the forward-looking statements are expressly qualified by the cautionary statements contained or referred to herein and therein. The actual results or developments anticipated may not be realized or, even if substantially realized, they may not have the expected consequences to or effects on the Company or our businesses or operations. Readers are cautioned not to rely too heavily on forward-looking statements. Forward-looking statements speak only as of the date they are made. We do not intend or assume any obligation to update, revise or clarify any forward-looking statements that may be made from time to time by or on behalf of the Company, whether as a result of new information, future events or otherwise, except as required by law.
ATLANTIC UNION BANKSHARES CORPORATION AND SUBSIDIARIES
KEY FINANCIAL RESULTS (UNAUDITED)
(Dollars in thousands, except share data)
| As of & For Three Months Ended | As of & For Nine Months Ended | |||||||||||||||||||
| 9/30/24 | 6/30/24 | 9/30/23 | 9/30/24 | 9/30/23 | ||||||||||||||||
| Results of Operations | ||||||||||||||||||||
| Interest and dividend income | $ | 324,528 | $ | 320,888 | $ | 247,159 | $ | 908,330 | $ | 694,952 | ||||||||||
| Interest expense | 141,596 | 136,354 | 95,218 | 393,040 | 237,483 | |||||||||||||||
| Net interest income | 182,932 | 184,534 | 151,941 | 515,290 | 457,469 | |||||||||||||||
| Provision for credit losses | 2,603 | 21,751 | 4,991 | 32,592 | 22,911 | |||||||||||||||
| Net interest income after provision for credit losses | 180,329 | 162,783 | 146,950 | 482,698 | 434,558 | |||||||||||||||
| Noninterest income | 34,286 | 23,812 | 27,094 | 83,651 | 60,918 | |||||||||||||||
| Noninterest expenses | 122,582 | 150,005 | 108,508 | 377,859 | 322,442 | |||||||||||||||
| Income before income taxes | 92,033 | 36,590 | 65,536 | 188,490 | 173,034 | |||||||||||||||
| Income tax expense | 15,618 | 11,429 | 11,519 | 37,144 | 28,123 | |||||||||||||||
| Net income | 76,415 | 25,161 | 54,017 | 151,346 | 144,911 | |||||||||||||||
| Dividends on preferred stock | 2,967 | 2,967 | 2,967 | 8,901 | 8,901 | |||||||||||||||
| Net income available to common shareholders | $ | 73,448 | $ | 22,194 | $ | 51,050 | $ | 142,445 | $ | 136,010 | ||||||||||
| Interest earned on earning assets (FTE) (1) | $ | 328,427 | $ | 324,702 | $ | 250,903 | $ | 919,766 | $ | 706,150 | ||||||||||
| Net interest income (FTE) (1) | 186,831 | 188,348 | 155,685 | 526,726 | 468,667 | |||||||||||||||
| Total revenue (FTE) (1) | 221,117 | 212,160 | 182,779 | 610,377 | 529,585 | |||||||||||||||
| Pre-tax pre-provision adjusted operating earnings (7) | 95,985 | 94,635 | 81,086 | 261,437 | 228,837 | |||||||||||||||
| Key Ratios | ||||||||||||||||||||
| Earnings per common share, diluted | $ | 0.82 | $ | 0.25 | $ | 0.68 | $ | 1.68 | $ | 1.81 | ||||||||||
| Return on average assets (ROA) | 1.24 | % | 0.41 | % | 1.04 | % | 0.86 | % | 0.95 | % | ||||||||||
| Return on average equity (ROE) | 9.77 | % | 3.35 | % | 8.76 | % | 6.97 | % | 7.93 | % | ||||||||||
| Return on average tangible common equity (ROTCE) (2) (3) | 18.89 | % | 6.99 | % | 15.71 | % | 13.20 | % | 14.22 | % | ||||||||||
| Efficiency ratio | 56.43 | % | 72.00 | % | 60.61 | % | 63.09 | % | 62.20 | % | ||||||||||
| Efficiency ratio (FTE) (1) | 55.44 | % | 70.70 | % | 59.37 | % | 61.91 | % | 60.89 | % | ||||||||||
| Net interest margin | 3.31 | % | 3.39 | % | 3.27 | % | 3.28 | % | 3.35 | % | ||||||||||
| Net interest margin (FTE) (1) | 3.38 | % | 3.46 | % | 3.35 | % | 3.35 | % | 3.43 | % | ||||||||||
| Yields on earning assets (FTE) (1) | 5.94 | % | 5.96 | % | 5.39 | % | 5.85 | % | 5.17 | % | ||||||||||
| Cost of interest-bearing liabilities | 3.40 | % | 3.33 | % | 2.80 | % | 3.32 | % | 2.42 | % | ||||||||||
| Cost of deposits | 2.57 | % | 2.46 | % | 1.97 | % | 2.48 | % | 1.63 | % | ||||||||||
| Cost of funds | 2.56 | % | 2.50 | % | 2.04 | % | 2.50 | % | 1.74 | % | ||||||||||
| Operating Measures (4) | ||||||||||||||||||||
| Adjusted operating earnings | $ | 77,497 | $ | 59,319 | $ | 62,749 | $ | 188,811 | $ | 171,286 | ||||||||||
| Adjusted operating earnings available to common shareholders | 74,530 | 56,352 | 59,782 | 179,910 | 162,385 | |||||||||||||||
| Adjusted operating earnings per common share, diluted | $ | 0.83 | $ | 0.63 | $ | 0.80 | $ | 2.12 | $ | 2.17 | ||||||||||
| Adjusted operating ROA | 1.25 | % | 0.97 | % | 1.21 | % | 1.07 | % | 1.12 | % | ||||||||||
| Adjusted operating ROE | 9.91 | % | 7.90 | % | 10.17 | % | 8.69 | % | 9.37 | % | ||||||||||
| Adjusted operating ROTCE (2) (3) | 19.15 | % | 15.85 | % | 18.31 | % | 16.43 | % | 16.88 | % | ||||||||||
| Adjusted operating efficiency ratio (FTE) (1)(6) | 52.20 | % | 52.24 | % | 52.36 | % | 53.55 | % | 54.55 | % | ||||||||||
| Per Share Data | ||||||||||||||||||||
| Earnings per common share, basic | $ | 0.82 | $ | 0.25 | $ | 0.68 | $ | 1.68 | $ | 1.81 | ||||||||||
| Earnings per common share, diluted | 0.82 | 0.25 | 0.68 | 1.68 | 1.81 | |||||||||||||||
| Cash dividends paid per common share | 0.32 | 0.32 | 0.30 | 0.96 | 0.90 | |||||||||||||||
| Market value per share | 37.67 | 32.85 | 28.78 | 37.67 | 28.78 | |||||||||||||||
| Book value per common share | 33.85 | 32.30 | 29.82 | 33.85 | 29.82 | |||||||||||||||
| Tangible book value per common share (2) | 19.23 | 17.67 | 17.12 | 19.23 | 17.12 | |||||||||||||||
| Price to earnings ratio, diluted | 11.57 | 33.03 | 10.65 | 16.81 | 11.86 | |||||||||||||||
| Price to book value per common share ratio | 1.11 | 1.02 | 0.97 | 1.11 | 0.97 | |||||||||||||||
| Price to tangible book value per common share ratio (2) | 1.96 | 1.86 | 1.68 | 1.96 | 1.68 | |||||||||||||||
| Weighted average common shares outstanding, basic | 89,780,531 | 89,768,466 | 74,999,128 | 84,933,126 | 74,942,851 | |||||||||||||||
| Weighted average common shares outstanding, diluted | 89,780,531 | 89,768,466 | 74,999,128 | 84,933,213 | 74,943,999 | |||||||||||||||
| Common shares outstanding at end of period | 89,774,392 | 89,769,734 | 74,997,132 | 89,774,392 | 74,997,132 | |||||||||||||||
ATLANTIC UNION BANKSHARES CORPORATION AND SUBSIDIARIES
KEY FINANCIAL RESULTS (UNAUDITED)
(Dollars in thousands, except share data)
| As of & For Three Months Ended | As of & For Nine Months Ended | |||||||||||||||||||
| 9/30/24 | 6/30/24 | 9/30/23 | 9/30/24 | 9/30/23 | ||||||||||||||||
| Capital Ratios | ||||||||||||||||||||
| Common equity Tier 1 capital ratio (5) | 9.77 | % | 9.47 | % | 9.94 | % | 9.77 | % | 9.94 | % | ||||||||||
| Tier 1 capital ratio (5) | 10.57 | % | 10.26 | % | 10.88 | % | 10.57 | % | 10.88 | % | ||||||||||
| Total capital ratio (5) | 13.33 | % | 12.99 | % | 13.70 | % | 13.33 | % | 13.70 | % | ||||||||||
| Leverage ratio (Tier 1 capital to average assets) (5) | 9.27 | % | 9.05 | % | 9.62 | % | 9.27 | % | 9.62 | % | ||||||||||
| Common equity to total assets | 12.16 | % | 11.62 | % | 10.72 | % | 12.16 | % | 10.72 | % | ||||||||||
| Tangible common equity to tangible assets (2) | 7.29 | % | 6.71 | % | 6.45 | % | 7.29 | % | 6.45 | % | ||||||||||
| Financial Condition | ||||||||||||||||||||
| Assets | $ | 24,803,723 | $ | 24,761,413 | $ | 20,736,236 | $ | 24,803,723 | $ | 20,736,236 | ||||||||||
| LHFI (net of deferred fees and costs) | 18,337,299 | 18,347,190 | 15,283,620 | 18,337,299 | 15,283,620 | |||||||||||||||
| Securities | 3,533,143 | 3,491,481 | 3,032,982 | 3,533,143 | 3,032,982 | |||||||||||||||
| Earning Assets | 22,180,501 | 22,067,549 | 18,491,561 | 22,180,501 | 18,491,561 | |||||||||||||||
| Goodwill | 1,212,710 | 1,207,484 | 925,211 | 1,212,710 | 925,211 | |||||||||||||||
| Amortizable intangibles, net | 90,176 | 95,980 | 21,277 | 90,176 | 21,277 | |||||||||||||||
| Deposits | 20,305,287 | 20,000,877 | 16,786,505 | 20,305,287 | 16,786,505 | |||||||||||||||
| Borrowings | 852,164 | 1,206,734 | 1,020,669 | 852,164 | 1,020,669 | |||||||||||||||
| Stockholders' equity | 3,182,416 | 3,043,686 | 2,388,801 | 3,182,416 | 2,388,801 | |||||||||||||||
| Tangible common equity (2) | 1,713,173 | 1,573,865 | 1,275,956 | 1,713,173 | 1,275,956 | |||||||||||||||
| Loans held for investment, net of deferred fees and costs | ||||||||||||||||||||
| Construction and land development | $ | 1,588,531 | $ | 1,454,545 | $ | 1,132,940 | $ | 1,588,531 | $ | 1,132,940 | ||||||||||
| Commercial real estate - owner occupied | 2,401,807 | 2,397,700 | 1,975,281 | 2,401,807 | 1,975,281 | |||||||||||||||
| Commercial real estate - non-owner occupied | 4,885,785 | 4,906,285 | 4,148,218 | 4,885,785 | 4,148,218 | |||||||||||||||
| Multifamily real estate | 1,357,730 | 1,353,024 | 947,153 | 1,357,730 | 947,153 | |||||||||||||||
| Commercial & Industrial | 3,799,872 | 3,944,723 | 3,432,319 | 3,799,872 | 3,432,319 | |||||||||||||||
| Residential 1-4 Family - Commercial | 729,315 | 737,687 | 517,034 | 729,315 | 517,034 | |||||||||||||||
| Residential 1-4 Family - Consumer | 1,281,914 | 1,251,033 | 1,057,294 | 1,281,914 | 1,057,294 | |||||||||||||||
| Residential 1-4 Family - Revolving | 738,665 | 718,491 | 599,282 | 738,665 | 599,282 | |||||||||||||||
| Auto | 354,570 | 396,776 | 534,361 | 354,570 | 534,361 | |||||||||||||||
| Consumer | 109,522 | 115,541 | 126,151 | 109,522 | 126,151 | |||||||||||||||
| Other Commercial | 1,089,588 | 1,071,385 | 813,587 | 1,089,588 | 813,587 | |||||||||||||||
| Total LHFI | $ | 18,337,299 | $ | 18,347,190 | $ | 15,283,620 | $ | 18,337,299 | $ | 15,283,620 | ||||||||||
| Deposits | ||||||||||||||||||||
| Interest checking accounts | $ | 5,208,794 | $ | 5,044,503 | $ | 5,055,464 | $ | 5,208,794 | $ | 5,055,464 | ||||||||||
| Money market accounts | 4,250,763 | 4,330,928 | 3,472,953 | 4,250,763 | 3,472,953 | |||||||||||||||
| Savings accounts | 1,037,229 | 1,056,474 | 950,363 | 1,037,229 | 950,363 | |||||||||||||||
| Customer time deposits of $250,000 and over | 1,160,262 | 1,015,032 | 634,950 | 1,160,262 | 634,950 | |||||||||||||||
| Other customer time deposits | 2,807,077 | 2,691,600 | 2,011,106 | 2,807,077 | 2,011,106 | |||||||||||||||
| Time deposits | 3,967,339 | 3,706,632 | 2,646,056 | 3,967,339 | 2,646,056 | |||||||||||||||
| Total interest-bearing customer deposits | 14,464,125 | 14,138,537 | 12,124,836 | 14,464,125 | 12,124,836 | |||||||||||||||
| Brokered deposits | 1,418,253 | 1,335,092 | 516,720 | 1,418,253 | 516,720 | |||||||||||||||
| Total interest-bearing deposits | $ | 15,882,378 | $ | 15,473,629 | $ | 12,641,556 | $ | 15,882,378 | $ | 12,641,556 | ||||||||||
| Demand deposits | 4,422,909 | 4,527,248 | 4,144,949 | 4,422,909 | 4,144,949 | |||||||||||||||
| Total deposits | $ | 20,305,287 | $ | 20,000,877 | $ | 16,786,505 | $ | 20,305,287 | $ | 16,786,505 | ||||||||||
| Averages | ||||||||||||||||||||
| Assets | $ | 24,613,518 | $ | 24,620,198 | $ | 20,596,189 | $ | 23,489,608 | $ | 20,397,518 | ||||||||||
| LHFI (net of deferred fees and costs) | 18,320,122 | 18,154,673 | 15,139,761 | 17,405,814 | 14,799,520 | |||||||||||||||
| Loans held for sale | 13,485 | 12,392 | 10,649 | 11,680 | 10,330 | |||||||||||||||
| Securities | 3,501,879 | 3,476,890 | 3,101,658 | 3,377,896 | 3,247,287 | |||||||||||||||
| Earning assets | 21,983,946 | 21,925,128 | 18,462,505 | 21,003,082 | 18,264,957 | |||||||||||||||
| Deposits | 20,174,158 | 20,033,678 | 16,795,611 | 19,122,193 | 16,499,045 | |||||||||||||||
| Time deposits | 4,758,039 | 4,243,344 | 2,914,004 | 4,155,713 | 2,571,114 | |||||||||||||||
| Interest-bearing deposits | 15,736,797 | 15,437,549 | 12,576,776 | 14,832,042 | 12,071,006 | |||||||||||||||
| Borrowings | 855,306 | 1,043,297 | 905,170 | 970,046 | 1,032,067 | |||||||||||||||
| Interest-bearing liabilities | 16,592,103 | 16,480,846 | 13,481,946 | 15,802,088 | 13,103,073 | |||||||||||||||
| Stockholders' equity | 3,112,509 | 3,021,929 | 2,446,902 | 2,901,666 | 2,443,833 | |||||||||||||||
| Tangible common equity (2) | 1,643,562 | 1,549,876 | 1,332,993 | 1,550,978 | 1,328,385 | |||||||||||||||
ATLANTIC UNION BANKSHARES CORPORATION AND SUBSIDIARIES
KEY FINANCIAL RESULTS (UNAUDITED)
(Dollars in thousands, except share data)
| As of & For Three Months Ended | As of & For Nine Months Ended | |||||||||||||||||||
| 9/30/24 | 6/30/24 | 9/30/23 | 9/30/24 | 9/30/23 | ||||||||||||||||
| Asset Quality | ||||||||||||||||||||
| Allowance for Credit Losses (ACL) | ||||||||||||||||||||
| Beginning balance, Allowance for loan and lease losses (ALLL) | $ | 158,131 | $ | 136,190 | $ | 120,683 | $ | 132,182 | $ | 110,768 | ||||||||||
| Add: Recoveries | 2,053 | 1,348 | 1,335 | 4,378 | 3,537 | |||||||||||||||
| Less: Charge-offs | 2,719 | 3,088 | 1,629 | 11,701 | 9,957 | |||||||||||||||
| Add: Initial Allowance - PCD American National loans | — | 3,896 | — | 3,896 | — | |||||||||||||||
| Add: Initial Provision - Non-PCD American National loans | — | 13,229 | — | 13,229 | — | |||||||||||||||
| Add: Provision for loan losses | 3,220 | 6,556 | 5,238 | 18,701 | 21,279 | |||||||||||||||
| Ending balance, ALLL | $ | 160,685 | $ | 158,131 | $ | 125,627 | $ | 160,685 | $ | 125,627 | ||||||||||
| Beginning balance, Reserve for unfunded commitment (RUC) | $ | 17,557 | $ | 15,582 | $ | 15,548 | $ | 16,269 | $ | 13,675 | ||||||||||
| Add: Initial Provision - RUC American National loans | — | 1,353 | — | 1,353 | — | |||||||||||||||
| Add: Provision for unfunded commitments | (614 | ) | 622 | (246 | ) | (679 | ) | 1,627 | ||||||||||||
| Ending balance, RUC | $ | 16,943 | $ | 17,557 | $ | 15,302 | $ | 16,943 | $ | 15,302 | ||||||||||
| Total ACL | $ | 177,628 | $ | 175,688 | $ | 140,929 | $ | 177,628 | $ | 140,929 | ||||||||||
| ACL / total LHFI | 0.97 | % | 0.96 | % | 0.92 | % | 0.97 | % | 0.92 | % | ||||||||||
| ALLL / total LHFI | 0.88 | % | 0.86 | % | 0.82 | % | 0.88 | % | 0.82 | % | ||||||||||
| Net charge-offs / total average LHFI (annualized) | 0.01 | % | 0.04 | % | 0.01 | % | 0.06 | % | 0.06 | % | ||||||||||
| Provision for loan losses/ total average LHFI (annualized) | 0.07 | % | 0.44 | % | 0.14 | % | 0.25 | % | 0.19 | % | ||||||||||
| Nonperforming Assets | ||||||||||||||||||||
| Construction and land development | $ | 1,945 | $ | 1,144 | $ | 355 | $ | 1,945 | $ | 355 | ||||||||||
| Commercial real estate - owner occupied | 4,781 | 4,651 | 3,882 | 4,781 | 3,882 | |||||||||||||||
| Commercial real estate - non-owner occupied | 9,919 | 10,741 | 5,999 | 9,919 | 5,999 | |||||||||||||||
| Multifamily real estate | — | 1 | — | — | — | |||||||||||||||
| Commercial & Industrial | 3,048 | 3,408 | 2,256 | 3,048 | 2,256 | |||||||||||||||
| Residential 1-4 Family - Commercial | 1,727 | 1,783 | 1,833 | 1,727 | 1,833 | |||||||||||||||
| Residential 1-4 Family - Consumer | 11,925 | 10,799 | 10,368 | 11,925 | 10,368 | |||||||||||||||
| Residential 1-4 Family - Revolving | 2,960 | 3,028 | 3,572 | 2,960 | 3,572 | |||||||||||||||
| Auto | 532 | 354 | 361 | 532 | 361 | |||||||||||||||
| Consumer | 10 | 4 | — | 10 | — | |||||||||||||||
| Nonaccrual loans | $ | 36,847 | $ | 35,913 | $ | 28,626 | $ | 36,847 | $ | 28,626 | ||||||||||
| Foreclosed property | 404 | 230 | 149 | 404 | 149 | |||||||||||||||
| Total nonperforming assets (NPAs) | $ | 37,251 | $ | 36,143 | $ | 28,775 | $ | 37,251 | $ | 28,775 | ||||||||||
| Construction and land development | $ | 82 | $ | 764 | $ | 25 | $ | 82 | $ | 25 | ||||||||||
| Commercial real estate - owner occupied | 1,239 | 1,047 | 2,395 | 1,239 | 2,395 | |||||||||||||||
| Commercial real estate - non-owner occupied | 1,390 | 1,309 | 2,835 | 1,390 | 2,835 | |||||||||||||||
| Multifamily real estate | 53 | 141 | — | 53 | — | |||||||||||||||
| Commercial & Industrial | 862 | 684 | 792 | 862 | 792 | |||||||||||||||
| Residential 1-4 Family - Commercial | 801 | 678 | 817 | 801 | 817 | |||||||||||||||
| Residential 1-4 Family - Consumer | 1,890 | 1,645 | 3,632 | 1,890 | 3,632 | |||||||||||||||
| Residential 1-4 Family - Revolving | 1,186 | 1,449 | 1,034 | 1,186 | 1,034 | |||||||||||||||
| Auto | 401 | 263 | 229 | 401 | 229 | |||||||||||||||
| Consumer | 143 | 176 | 97 | 143 | 97 | |||||||||||||||
| Other Commercial | 7,127 | 7,464 | 15 | 7,127 | 15 | |||||||||||||||
| LHFI ≥ 90 days and still accruing | $ | 15,174 | $ | 15,620 | $ | 11,871 | $ | 15,174 | $ | 11,871 | ||||||||||
| Total NPAs and LHFI ≥ 90 days | $ | 52,425 | $ | 51,763 | $ | 40,646 | $ | 52,425 | $ | 40,646 | ||||||||||
| NPAs / total LHFI | 0.20 | % | 0.20 | % | 0.19 | % | 0.20 | % | 0.19 | % | ||||||||||
| NPAs / total assets | 0.15 | % | 0.15 | % | 0.14 | % | 0.15 | % | 0.14 | % | ||||||||||
| ALLL / nonaccrual loans | 436.09 | % | 440.32 | % | 438.86 | % | 436.09 | % | 438.86 | % | ||||||||||
| ALLL/ nonperforming assets | 431.36 | % | 437.51 | % | 436.58 | % | 431.36 | % | 436.58 | % | ||||||||||
ATLANTIC UNION BANKSHARES CORPORATION AND SUBSIDIARIES
KEY FINANCIAL RESULTS (UNAUDITED)
(Dollars in thousands, except share data)
| As of & For Three Months Ended | As of & For Nine Months Ended | |||||||||||||||||||
| 9/30/24 | 6/30/24 | 9/30/23 | 9/30/24 | 9/30/23 | ||||||||||||||||
| Past Due Detail | ||||||||||||||||||||
| Construction and land development | $ | 1,559 | $ | 1,689 | $ | — | $ | 1,559 | $ | — | ||||||||||
| Commercial real estate - owner occupied | 2,291 | 3,450 | 3,501 | 2,291 | 3,501 | |||||||||||||||
| Commercial real estate - non-owner occupied | 1,085 | 1,316 | 4,573 | 1,085 | 4,573 | |||||||||||||||
| Multifamily real estate | 821 | 1,694 | — | 821 | — | |||||||||||||||
| Commercial & Industrial | 5,876 | 2,154 | 3,049 | 5,876 | 3,049 | |||||||||||||||
| Residential 1-4 Family - Commercial | 656 | 873 | 744 | 656 | 744 | |||||||||||||||
| Residential 1-4 Family - Consumer | 471 | 1,331 | 1,000 | 471 | 1,000 | |||||||||||||||
| Residential 1-4 Family - Revolving | 3,309 | 2,518 | 2,326 | 3,309 | 2,326 | |||||||||||||||
| Auto | 2,796 | 3,463 | 2,703 | 2,796 | 2,703 | |||||||||||||||
| Consumer | 700 | 385 | 517 | 700 | 517 | |||||||||||||||
| Other Commercial | 2 | 289 | 3,545 | 2 | 3,545 | |||||||||||||||
| LHFI 30-59 days past due | $ | 19,566 | $ | 19,162 | $ | 21,958 | $ | 19,566 | $ | 21,958 | ||||||||||
| Construction and land development | $ | 369 | $ | 155 | $ | 386 | 369 | 386 | ||||||||||||
| Commercial real estate - owner occupied | 1,306 | 72 | 1,902 | 1,306 | 1,902 | |||||||||||||||
| Commercial real estate - non-owner occupied | 6,875 | — | 797 | 6,875 | 797 | |||||||||||||||
| Multifamily real estate | 135 | 632 | 150 | 135 | 150 | |||||||||||||||
| Commercial & Industrial | 549 | 192 | 576 | 549 | 576 | |||||||||||||||
| Residential 1-4 Family - Commercial | 736 | 689 | 67 | 736 | 67 | |||||||||||||||
| Residential 1-4 Family - Consumer | 6,950 | 1,960 | 1,775 | 6,950 | 1,775 | |||||||||||||||
| Residential 1-4 Family - Revolving | 2,672 | 795 | 602 | 2,672 | 602 | |||||||||||||||
| Auto | 468 | 565 | 339 | 468 | 339 | |||||||||||||||
| Consumer | 182 | 309 | 164 | 182 | 164 | |||||||||||||||
| Other Commercial | 185 | — | — | 185 | — | |||||||||||||||
| LHFI 60-89 days past due | $ | 20,427 | $ | 5,369 | $ | 6,758 | $ | 20,427 | $ | 6,758 | ||||||||||
| Past Due and still accruing | $ | 55,167 | $ | 40,151 | $ | 40,587 | $ | 55,167 | $ | 40,587 | ||||||||||
| Past Due and still accruing / total LHFI | 0.30 | % | 0.22 | % | 0.27 | % | 0.30 | % | 0.27 | % | ||||||||||
| Alternative Performance Measures (non-GAAP) | ||||||||||||||||||||
| Net interest income (FTE) (1) | ||||||||||||||||||||
| Net interest income (GAAP) | $ | 182,932 | $ | 184,534 | $ | 151,941 | $ | 515,290 | $ | 457,469 | ||||||||||
| FTE adjustment | 3,899 | 3,814 | 3,744 | 11,436 | 11,198 | |||||||||||||||
| Net interest income (FTE) (non-GAAP) | $ | 186,831 | $ | 188,348 | $ | 155,685 | $ | 526,726 | $ | 468,667 | ||||||||||
| Noninterest income (GAAP) | 34,286 | 23,812 | 27,094 | 83,651 | 60,918 | |||||||||||||||
| Total revenue (FTE) (non-GAAP) | $ | 221,117 | $ | 212,160 | $ | 182,779 | $ | 610,377 | $ | 529,585 | ||||||||||
| Average earning assets | $ | 21,983,946 | $ | 21,925,128 | $ | 18,462,505 | $ | 21,003,082 | $ | 18,264,957 | ||||||||||
| Net interest margin | 3.31 | % | 3.39 | % | 3.27 | % | 3.28 | % | 3.35 | % | ||||||||||
| Net interest margin (FTE) | 3.38 | % | 3.46 | % | 3.35 | % | 3.35 | % | 3.43 | % | ||||||||||
| Tangible Assets (2) | ||||||||||||||||||||
| Ending assets (GAAP) | $ | 24,803,723 | $ | 24,761,413 | $ | 20,736,236 | $ | 24,803,723 | $ | 20,736,236 | ||||||||||
| Less: Ending goodwill | 1,212,710 | 1,207,484 | 925,211 | 1,212,710 | 925,211 | |||||||||||||||
| Less: Ending amortizable intangibles | 90,176 | 95,980 | 21,277 | 90,176 | 21,277 | |||||||||||||||
| Ending tangible assets (non-GAAP) | $ | 23,500,837 | $ | 23,457,949 | $ | 19,789,748 | $ | 23,500,837 | $ | 19,789,748 | ||||||||||
| Tangible Common Equity (2) | ||||||||||||||||||||
| Ending equity (GAAP) | $ | 3,182,416 | $ | 3,043,686 | $ | 2,388,801 | $ | 3,182,416 | $ | 2,388,801 | ||||||||||
| Less: Ending goodwill | 1,212,710 | 1,207,484 | 925,211 | 1,212,710 | 925,211 | |||||||||||||||
| Less: Ending amortizable intangibles | 90,176 | 95,980 | 21,277 | 90,176 | 21,277 | |||||||||||||||
| Less: Perpetual preferred stock | 166,357 | 166,357 | 166,357 | 166,357 | 166,357 | |||||||||||||||
| Ending tangible common equity (non-GAAP) | $ | 1,713,173 | $ | 1,573,865 | $ | 1,275,956 | $ | 1,713,173 | $ | 1,275,956 | ||||||||||
| Average equity (GAAP) | $ | 3,112,509 | $ | 3,021,929 | $ | 2,446,902 | $ | 2,901,666 | $ | 2,443,833 | ||||||||||
| Less: Average goodwill | 1,209,590 | 1,208,588 | 925,211 | 1,114,810 | 925,211 | |||||||||||||||
| Less: Average amortizable intangibles | 93,001 | 97,109 | 22,342 | 69,522 | 23,881 | |||||||||||||||
| Less: Average perpetual preferred stock | 166,356 | 166,356 | 166,356 | 166,356 | 166,356 | |||||||||||||||
| Average tangible common equity (non-GAAP) | $ | 1,643,562 | $ | 1,549,876 | $ | 1,332,993 | $ | 1,550,978 | $ | 1,328,385 | ||||||||||
| ROTCE (2)(3) | ||||||||||||||||||||
| Net income available to common shareholders (GAAP) | $ | 73,448 | $ | 22,194 | $ | 51,050 | $ | 142,445 | $ | 136,010 | ||||||||||
| Plus: Amortization of intangibles, tax effected | 4,585 | 4,736 | 1,732 | 10,817 | 5,283 | |||||||||||||||
| Net income available to common shareholders before amortization of intangibles (non-GAAP) | $ | 78,033 | $ | 26,930 | $ | 52,782 | $ | 153,262 | $ | 141,293 | ||||||||||
| Return on average tangible common equity (ROTCE) | 18.89 | % | 6.99 | % | 15.71 | % | 13.20 | % | 14.22 | % | ||||||||||
ATLANTIC UNION BANKSHARES CORPORATION AND SUBSIDIARIES
KEY FINANCIAL RESULTS (UNAUDITED)
(Dollars in thousands, except share data)
| As of & For Three Months Ended | As of & For Nine Months Ended | |||||||||||||||||||
| 9/30/24 | 6/30/24 | 9/30/23 | 9/30/24 | 9/30/23 | ||||||||||||||||
| Operating Measures (4) | ||||||||||||||||||||
| Net income (GAAP) | $ | 76,415 | $ | 25,161 | $ | 54,017 | $ | 151,346 | $ | 144,911 | ||||||||||
| Plus: Merger-related costs, net of tax | 1,085 | 24,236 | 1,965 | 26,884 | 1,965 | |||||||||||||||
| Plus: Strategic cost saving initiatives, net of tax | — | — | 6,851 | — | 9,959 | |||||||||||||||
| Plus: FDIC special assessment, net of tax | — | — | — | 664 | — | |||||||||||||||
| Plus: Legal reserve, net of tax | — | — | — | — | 3,950 | |||||||||||||||
| Plus: Deferred tax asset write-down | — | 4,774 | — | 4,774 | — | |||||||||||||||
| Less: Gain (loss) on sale of securities, net of tax | 3 | (5,148 | ) | (21,799 | ) | (5,143 | ) | (32,384 | ) | |||||||||||
| Less: Gain on sale-leaseback transaction, net of tax | — | — | 21,883 | — | 21,883 | |||||||||||||||
| Adjusted operating earnings (non-GAAP) | 77,497 | 59,319 | 62,749 | 188,811 | 171,286 | |||||||||||||||
| Less: Dividends on preferred stock | 2,967 | 2,967 | 2,967 | 8,901 | 8,901 | |||||||||||||||
| Adjusted operating earnings available to common shareholders (non-GAAP) | $ | 74,530 | $ | 56,352 | $ | 59,782 | $ | 179,910 | $ | 162,385 | ||||||||||
| Operating Efficiency Ratio (1)(6) | ||||||||||||||||||||
| Noninterest expense (GAAP) | $ | 122,582 | $ | 150,005 | $ | 108,508 | $ | 377,859 | $ | 322,442 | ||||||||||
| Less: Amortization of intangible assets | 5,804 | 5,995 | 2,193 | 13,693 | 6,687 | |||||||||||||||
| Less: Merger-related costs | 1,353 | 29,778 | 1,993 | 33,005 | 1,993 | |||||||||||||||
| Less: FDIC special assessment | — | — | — | 840 | — | |||||||||||||||
| Less: Strategic cost saving initiatives | — | — | 8,672 | — | 12,607 | |||||||||||||||
| Less: Legal reserve | — | — | — | — | 5,000 | |||||||||||||||
| Adjusted operating noninterest expense (non-GAAP) | $ | 115,425 | $ | 114,232 | $ | 95,650 | $ | 330,321 | $ | 296,155 | ||||||||||
| Noninterest income (GAAP) | $ | 34,286 | $ | 23,812 | $ | 27,094 | $ | 83,651 | $ | 60,918 | ||||||||||
| Less: Gain (loss) on sale of securities | 4 | (6,516 | ) | (27,594 | ) | (6,510 | ) | (40,992 | ) | |||||||||||
| Less: Gain on sale-leaseback transaction | — | — | 27,700 | — | 27,700 | |||||||||||||||
| Adjusted operating noninterest income (non-GAAP) | $ | 34,282 | $ | 30,328 | $ | 26,988 | $ | 90,161 | $ | 74,210 | ||||||||||
| Net interest income (FTE) (non-GAAP) (1) | $ | 186,831 | $ | 188,348 | $ | 155,685 | $ | 526,726 | $ | 468,667 | ||||||||||
| Adjusted operating noninterest income (non-GAAP) | 34,282 | 30,328 | 26,988 | 90,161 | 74,210 | |||||||||||||||
| Total adjusted revenue (FTE) (non-GAAP) (1) | $ | 221,113 | $ | 218,676 | $ | 182,673 | $ | 616,887 | $ | 542,877 | ||||||||||
| Efficiency ratio | 56.43 | % | 72.00 | % | 60.61 | % | 63.09 | % | 62.20 | % | ||||||||||
| Efficiency ratio (FTE) (1) | 55.44 | % | 70.70 | % | 59.37 | % | 61.91 | % | 60.89 | % | ||||||||||
| Adjusted operating efficiency ratio (FTE) (1)(6) | 52.20 | % | 52.24 | % | 52.36 | % | 53.55 | % | 54.55 | % | ||||||||||
| Operating ROA & ROE (4) | ||||||||||||||||||||
| Adjusted operating earnings (non-GAAP) | $ | 77,497 | $ | 59,319 | $ | 62,749 | $ | 188,811 | $ | 171,286 | ||||||||||
| Average assets (GAAP) | $ | 24,613,518 | $ | 24,620,198 | $ | 20,596,189 | $ | 23,489,608 | $ | 20,397,518 | ||||||||||
| Return on average assets (ROA) (GAAP) | 1.24 | % | 0.41 | % | 1.04 | % | 0.86 | % | 0.95 | % | ||||||||||
| Adjusted operating return on average assets (ROA) (non-GAAP) | 1.25 | % | 0.97 | % | 1.21 | % | 1.07 | % | 1.12 | % | ||||||||||
| Average equity (GAAP) | $ | 3,112,509 | $ | 3,021,929 | $ | 2,446,902 | $ | 2,901,666 | $ | 2,443,833 | ||||||||||
| Return on average equity (ROE) (GAAP) | 9.77 | % | 3.35 | % | 8.76 | % | 6.97 | % | 7.93 | % | ||||||||||
| Adjusted operating return on average equity (ROE) (non-GAAP) | 9.91 | % | 7.90 | % | 10.17 | % | 8.69 | % | 9.37 | % | ||||||||||
| Operating ROTCE (2)(3)(4) | ||||||||||||||||||||
| Adjusted operating earnings available to common shareholders (non-GAAP) | $ | 74,530 | $ | 56,352 | $ | 59,782 | $ | 179,910 | $ | 162,385 | ||||||||||
| Plus: Amortization of intangibles, tax effected | 4,585 | 4,736 | 1,732 | 10,817 | 5,283 | |||||||||||||||
| Adjusted operating earnings available to common shareholders before amortization of intangibles (non-GAAP) | $ | 79,115 | $ | 61,088 | $ | 61,514 | $ | 190,727 | $ | 167,668 | ||||||||||
| Average tangible common equity (non-GAAP) | $ | 1,643,562 | $ | 1,549,876 | $ | 1,332,993 | $ | 1,550,978 | $ | 1,328,385 | ||||||||||
| Adjusted operating return on average tangible common equity (non-GAAP) | 19.15 | % | 15.85 | % | 18.31 | % | 16.43 | % | 16.88 | % | ||||||||||
| Pre-tax pre-provision adjusted operating earnings (7) | ||||||||||||||||||||
| Net income (GAAP) | $ | 76,415 | $ | 25,161 | $ | 54,017 | $ | 151,346 | $ | 144,911 | ||||||||||
| Plus: Provision for credit losses | 2,603 | 21,751 | 4,991 | 32,592 | 22,911 | |||||||||||||||
| Plus: Income tax expense | 15,618 | 11,429 | 11,519 | 37,144 | 28,123 | |||||||||||||||
| Plus: Merger-related costs | 1,353 | 29,778 | 1,993 | 33,005 | 1,993 | |||||||||||||||
| Plus: Strategic cost saving initiatives | — | — | 8,672 | — | 12,607 | |||||||||||||||
| Plus: FDIC special assessment | — | — | — | 840 | — | |||||||||||||||
| Plus: Legal reserve | — | — | — | — | 5,000 | |||||||||||||||
| Less: Gain (loss) on sale of securities, net of tax | 4 | (6,516 | ) | (27,594 | ) | (6,510 | ) | (40,992 | ) | |||||||||||
| Less: Gain on sale-leaseback transaction | — | — | 27,700 | — | 27,700 | |||||||||||||||
| Pre-tax pre-provision adjusted operating earnings (non-GAAP) | $ | 95,985 | $ | 94,635 | $ | 81,086 | $ | 261,437 | $ | 228,837 | ||||||||||
| Less: Dividends on preferred stock | 2,967 | 2,967 | 2,967 | 8,901 | 8,901 | |||||||||||||||
| Pre-tax pre-provision adjusted operating earnings available to common shareholders (non-GAAP) | $ | 93,018 | $ | 91,668 | $ | 78,119 | $ | 252,536 | $ | 219,936 | ||||||||||
| Weighted average common shares outstanding, diluted | 89,780,531 | 89,768,466 | 74,999,128 | 84,933,213 | 74,943,999 | |||||||||||||||
| Pre-tax pre-provision earnings per common share, diluted | $ | 1.04 | $ | 1.02 | $ | 1.04 | $ | 2.97 | $ | 2.93 | ||||||||||
ATLANTIC UNION BANKSHARES CORPORATION AND SUBSIDIARIES
KEY FINANCIAL RESULTS (UNAUDITED)
(Dollars in thousands, except share data)
| As of & For Three Months Ended | As of & For Nine Months Ended | |||||||||||||||||||
| 9/30/24 | 6/30/24 | 9/30/23 | 9/30/24 | 9/30/23 | ||||||||||||||||
| Mortgage Origination Held for Sale Volume | ||||||||||||||||||||
| Refinance Volume | $ | 4,285 | $ | 4,234 | $ | 2,239 | $ | 14,157 | $ | 9,767 | ||||||||||
| Purchase Volume | 56,634 | 48,487 | 35,815 | 136,889 | 100,175 | |||||||||||||||
| Total Mortgage loan originations held for sale | $ | 60,919 | $ | 52,721 | $ | 38,054 | $ | 151,046 | $ | 109,942 | ||||||||||
| % of originations held for sale that are refinances | 7.0 | % | 8.0 | % | 5.9 | % | 9.4 | % | 8.9 | % | ||||||||||
| Wealth | ||||||||||||||||||||
| Assets under management | $ | 6,826,123 | $ | 6,487,087 | $ | 4,675,523 | $ | 6,826,123 | $ | 4,675,523 | ||||||||||
| Other Data | ||||||||||||||||||||
| End of period full-time equivalent employees | 2,122 | 2,083 | 1,788 | 2,122 | 1,788 | |||||||||||||||
| Number of full-service branches | 129 | 129 | 109 | 129 | 109 | |||||||||||||||
| Number of automatic transaction machines (ATMs) | 149 | 149 | 123 | 149 | 123 | |||||||||||||||
| (1) | These are non-GAAP financial measures. The Company believes net interest income (FTE), total revenue (FTE), and total adjusted revenue (FTE), which are used in computing net interest margin (FTE), efficiency ratio (FTE) and adjusted operating efficiency ratio (FTE), provide valuable additional insight into the net interest margin and the efficiency ratio by adjusting for differences in tax treatment of interest income sources. The entire FTE adjustment is attributable to interest income on earning assets, which is used in computing the yield on earning assets. Interest expense and the related cost of interest-bearing liabilities and cost of funds ratios are not affected by the FTE components. | |
| (2) | These are non-GAAP financial measures. Tangible assets and tangible common equity are used in the calculation of certain profitability, capital, and per share ratios. The Company believes tangible assets, tangible common equity and the related ratios are meaningful measures of capital adequacy because they provide a meaningful base for period-to-period and company-to-company comparisons, which the Company believes will assist investors in assessing the capital of the Company and its ability to absorb potential losses. The Company believes tangible common equity is an important indication of its ability to grow organically and through business combinations as well as its ability to pay dividends and to engage in various capital management strategies. | |
| (3) | These are non-GAAP financial measures. The Company believes that ROTCE is a meaningful supplement to GAAP financial measures and is useful to investors because it measures the performance of a business consistently across time without regard to whether components of the business were acquired or developed internally. | |
| (4) | These are non-GAAP financial measures. Adjusted operating measures exclude, as applicable, merger-related costs, strategic cost saving initiatives (principally composed of severance charges related to headcount reductions and charges for exiting leases), FDIC special assessments, legal reserves associated with our previously disclosed settlement with the CFPB, deferred tax asset write-down, gain (loss) on sale of securities, and gain on sale-leaseback transaction. The Company believes these non-GAAP adjusted measures provide investors with important information about the continuing economic results of the Company’s operations. | |
| (5) | All ratios at September 30, 2024 are estimates and subject to change pending the Company’s filing of its FR Y9-C. All other periods are presented as filed. | |
| (6) | The adjusted operating efficiency ratio (FTE) excludes, as applicable, the amortization of intangible assets, merger-related costs, FDIC special assessments, strategic cost saving initiatives (principally composed of severance charges related to headcount reductions and charges for exiting leases), legal reserves associated with our previously disclosed settlement with the CFPB, gain (loss) on sale of securities, and gain on sale-leaseback transaction. This measure is similar to the measure used by the Company when analyzing corporate performance and is also similar to the measure used for incentive compensation. The Company believes this adjusted measure provides investors with important information about the continuing economic results of the Company’s operations. | |
| (7) | These are non-GAAP financial measures. Pre-tax pre-provision adjusted earnings excludes, as applicable, the provision for credit losses, which can fluctuate significantly from period-to-period under the CECL methodology, income tax expense, merger-related costs, strategic cost saving initiatives (principally composed of severance charges related to headcount reductions and charges for exiting leases), FDIC special assessments, legal reserves associated with our previously disclosed settlement with the CFPB, gain (loss) on sale of securities, and gain on sale-leaseback transaction. The Company believes this adjusted measure provides investors with important information about the continuing economic results of the Company’s operations. |
ATLANTIC UNION BANKSHARES CORPORATION AND SUBSIDIARIES
CONSOLIDATED BALANCE SHEETS
(Dollars in thousands, except share data)
| September 30, | December 31, | September 30, | ||||||||||
| 2024 | 2023 | 2023 | ||||||||||
| ASSETS | (unaudited) | (audited) | (unaudited) | |||||||||
| Cash and cash equivalents: | ||||||||||||
| Cash and due from banks | $ | 232,222 | $ | 196,754 | $ | 233,526 | ||||||
| Interest-bearing deposits in other banks | 291,163 | 167,601 | 159,718 | |||||||||
| Federal funds sold | 4,685 | 13,776 | 5,701 | |||||||||
| Total cash and cash equivalents | 528,070 | 378,131 | 398,945 | |||||||||
| Securities available for sale, at fair value | 2,608,182 | 2,231,261 | 2,084,928 | |||||||||
| Securities held to maturity, at carrying value | 807,080 | 837,378 | 843,269 | |||||||||
| Restricted stock, at cost | 117,881 | 115,472 | 104,785 | |||||||||
| Loans held for sale | 11,078 | 6,710 | 6,608 | |||||||||
| Loans held for investment, net of deferred fees and costs | 18,337,299 | 15,635,043 | 15,283,620 | |||||||||
| Less: allowance for loan and lease losses | 160,685 | 132,182 | 125,627 | |||||||||
| Total loans held for investment, net | 18,176,614 | 15,502,861 | 15,157,993 | |||||||||
| Premises and equipment, net | 115,093 | 90,959 | 94,510 | |||||||||
| Goodwill | 1,212,710 | 925,211 | 925,211 | |||||||||
| Amortizable intangibles, net | 90,176 | 19,183 | 21,277 | |||||||||
| Bank owned life insurance | 489,759 | 452,565 | 449,452 | |||||||||
| Other assets | 647,080 | 606,466 | 649,258 | |||||||||
| Total assets | $ | 24,803,723 | $ | 21,166,197 | $ | 20,736,236 | ||||||
| LIABILITIES | ||||||||||||
| Noninterest-bearing demand deposits | $ | 4,422,909 | $ | 3,963,181 | $ | 4,144,949 | ||||||
| Interest-bearing deposits | 15,882,378 | 12,854,948 | 12,641,556 | |||||||||
| Total deposits | 20,305,287 | 16,818,129 | 16,786,505 | |||||||||
| Securities sold under agreements to repurchase | 59,227 | 110,833 | 134,936 | |||||||||
| Other short-term borrowings | 375,000 | 810,000 | 495,000 | |||||||||
| Long-term borrowings | 417,937 | 391,025 | 390,733 | |||||||||
| Other liabilities | 463,856 | 479,883 | 540,261 | |||||||||
| Total liabilities | 21,621,307 | 18,609,870 | 18,347,435 | |||||||||
| Commitments and contingencies | ||||||||||||
| STOCKHOLDERS' EQUITY | ||||||||||||
| Preferred stock, $10.00 par value | 173 | 173 | 173 | |||||||||
| Common stock, $1.33 par value | 118,494 | 99,147 | 99,120 | |||||||||
| Additional paid-in capital | 2,277,024 | 1,782,286 | 1,779,281 | |||||||||
| Retained earnings | 1,079,032 | 1,018,070 | 988,133 | |||||||||
| Accumulated other comprehensive loss | (292,307 | ) | (343,349 | ) | (477,906 | ) | ||||||
| Total stockholders' equity | 3,182,416 | 2,556,327 | 2,388,801 | |||||||||
| Total liabilities and stockholders' equity | $ | 24,803,723 | $ | 21,166,197 | $ | 20,736,236 | ||||||
| Common shares outstanding | 89,774,392 | 75,023,327 | 74,997,132 | |||||||||
| Common shares authorized | 200,000,000 | 200,000,000 | 200,000,000 | |||||||||
| Preferred shares outstanding | 17,250 | 17,250 | 17,250 | |||||||||
| Preferred shares authorized | 500,000 | 500,000 | 500,000 | |||||||||
ATLANTIC UNION BANKSHARES CORPORATION AND SUBSIDIARIES
CONSOLIDATED STATEMENTS OF INCOME (UNAUDITED)
(Dollars in thousands, except share data)
| Three Months Ended | Nine Months Ended | |||||||||||||||||||
| September 30, | June 30, | September 30, | September 30, | September 30, | ||||||||||||||||
| 2024 | 2024 | 2023 | 2024 | 2023 | ||||||||||||||||
| Interest and dividend income: | ||||||||||||||||||||
| Interest and fees on loans | $ | 291,089 | $ | 285,198 | $ | 221,380 | $ | 810,886 | $ | 616,544 | ||||||||||
| Interest on deposits in other banks | 1,060 | 2,637 | 1,309 | 4,977 | 3,815 | |||||||||||||||
| Interest and dividends on securities: | ||||||||||||||||||||
| Taxable | 24,247 | 24,886 | 16,055 | 68,012 | 48,373 | |||||||||||||||
| Nontaxable | 8,132 | 8,167 | 8,415 | 24,455 | 26,220 | |||||||||||||||
| Total interest and dividend income | 324,528 | 320,888 | 247,159 | 908,330 | 694,952 | |||||||||||||||
| Interest expense: | ||||||||||||||||||||
| Interest on deposits | 130,216 | 122,504 | 83,590 | 354,584 | 200,690 | |||||||||||||||
| Interest on short-term borrowings | 5,698 | 8,190 | 6,499 | 22,049 | 22,106 | |||||||||||||||
| Interest on long-term borrowings | 5,682 | 5,660 | 5,129 | 16,407 | 14,687 | |||||||||||||||
| Total interest expense | 141,596 | 136,354 | 95,218 | 393,040 | 237,483 | |||||||||||||||
| Net interest income | 182,932 | 184,534 | 151,941 | 515,290 | 457,469 | |||||||||||||||
| Provision for credit losses | 2,603 | 21,751 | 4,991 | 32,592 | 22,911 | |||||||||||||||
| Net interest income after provision for credit losses | 180,329 | 162,783 | 146,950 | 482,698 | 434,558 | |||||||||||||||
| Noninterest income: | ||||||||||||||||||||
| Service charges on deposit accounts | 9,792 | 9,086 | 8,557 | 27,447 | 24,577 | |||||||||||||||
| Other service charges, commissions and fees | 2,002 | 1,967 | 2,632 | 5,700 | 6,071 | |||||||||||||||
| Interchange fees | 3,371 | 3,126 | 2,314 | 8,791 | 7,098 | |||||||||||||||
| Fiduciary and asset management fees | 6,858 | 6,907 | 4,549 | 18,603 | 13,169 | |||||||||||||||
| Mortgage banking income | 1,214 | 1,193 | 666 | 3,274 | 1,969 | |||||||||||||||
| Gain (loss) on sale of securities | 4 | (6,516 | ) | (27,594 | ) | (6,510 | ) | (40,992 | ) | |||||||||||
| Bank owned life insurance income | 5,037 | 3,791 | 2,973 | 12,074 | 8,671 | |||||||||||||||
| Loan-related interest rate swap fees | 1,503 | 1,634 | 2,695 | 4,353 | 6,450 | |||||||||||||||
| Other operating income | 4,505 | 2,624 | 30,302 | 9,919 | 33,905 | |||||||||||||||
| Total noninterest income | 34,286 | 23,812 | 27,094 | 83,651 | 60,918 | |||||||||||||||
| Noninterest expenses: | ||||||||||||||||||||
| Salaries and benefits | 69,454 | 68,531 | 57,449 | 199,867 | 179,996 | |||||||||||||||
| Occupancy expenses | 7,806 | 7,836 | 6,053 | 22,267 | 18,503 | |||||||||||||||
| Furniture and equipment expenses | 3,685 | 3,805 | 3,449 | 10,799 | 10,765 | |||||||||||||||
| Technology and data processing | 9,737 | 10,274 | 7,923 | 28,138 | 24,631 | |||||||||||||||
| Professional services | 3,994 | 4,377 | 3,291 | 11,452 | 11,138 | |||||||||||||||
| Marketing and advertising expense | 3,308 | 2,983 | 2,219 | 8,609 | 7,387 | |||||||||||||||
| FDIC assessment premiums and other insurance | 5,282 | 4,675 | 4,258 | 15,099 | 12,231 | |||||||||||||||
| Franchise and other taxes | 5,256 | 5,013 | 4,510 | 14,770 | 13,508 | |||||||||||||||
| Loan-related expenses | 1,445 | 1,275 | 1,388 | 4,043 | 4,560 | |||||||||||||||
| Amortization of intangible assets | 5,804 | 5,995 | 2,193 | 13,693 | 6,687 | |||||||||||||||
| Merger-related costs | 1,353 | 29,778 | 1,993 | 33,005 | 1,993 | |||||||||||||||
| Other expenses | 5,458 | 5,463 | 13,782 | 16,117 | 31,043 | |||||||||||||||
| Total noninterest expenses | 122,582 | 150,005 | 108,508 | 377,859 | 322,442 | |||||||||||||||
| Income before income taxes | 92,033 | 36,590 | 65,536 | 188,490 | 173,034 | |||||||||||||||
| Income tax expense | 15,618 | 11,429 | 11,519 | 37,144 | 28,123 | |||||||||||||||
| Net Income | $ | 76,415 | $ | 25,161 | $ | 54,017 | $ | 151,346 | $ | 144,911 | ||||||||||
| Dividends on preferred stock | 2,967 | 2,967 | 2,967 | 8,901 | 8,901 | |||||||||||||||
| Net income available to common shareholders | $ | 73,448 | $ | 22,194 | $ | 51,050 | $ | 142,445 | $ | 136,010 | ||||||||||
| Basic earnings per common share | $ | 0.82 | $ | 0.25 | $ | 0.68 | $ | 1.68 | $ | 1.81 | ||||||||||
| Diluted earnings per common share | $ | 0.82 | $ | 0.25 | $ | 0.68 | $ | 1.68 | $ | 1.81 | ||||||||||
ATLANTIC UNION BANKSHARES CORPORATION AND SUBSIDIARIES
AVERAGE BALANCES, INCOME AND EXPENSES, YIELDS AND RATES (TAXABLE EQUIVALENT BASIS) (UNAUDITED)
(Dollars in thousands)
| For the Quarter Ended | ||||||||||||||||||||||||
| September 30, 2024 | June 30, 2024 | |||||||||||||||||||||||
| Average Balance |
Interest Income / Expense (1) |
Yield / Rate (1)(2) |
Average Balance |
Interest Income / Expense (1) |
Yield / Rate (1)(2) |
|||||||||||||||||||
| Assets: | ||||||||||||||||||||||||
| Securities: | ||||||||||||||||||||||||
| Taxable | $ | 2,248,207 | $ | 24,247 | 4.29 | % | $ | 2,221,486 | $ | 24,886 | 4.51 | % | ||||||||||||
| Tax-exempt | 1,253,672 | 10,293 | 3.27 | % | 1,255,404 | 10,338 | 3.31 | % | ||||||||||||||||
| Total securities | 3,501,879 | 34,540 | 3.92 | % | 3,476,890 | 35,224 | 4.07 | % | ||||||||||||||||
| LHFI, net of deferred fees and costs (3)(4) | 18,320,122 | 292,469 | 6.35 | % | 18,154,673 | 286,391 | 6.34 | % | ||||||||||||||||
| Other earning assets | 161,945 | 1,418 | 3.48 | % | 293,565 | 3,087 | 4.23 | % | ||||||||||||||||
| Total earning assets | 21,983,946 | $ | 328,427 | 5.94 | % | 21,925,128 | $ | 324,702 | 5.96 | % | ||||||||||||||
| Allowance for loan and lease losses | (159,023 | ) | (157,204 | ) | ||||||||||||||||||||
| Total non-earning assets | 2,788,595 | 2,852,274 | ||||||||||||||||||||||
| Total assets | $ | 24,613,518 | $ | 24,620,198 | ||||||||||||||||||||
| Liabilities and Stockholders' Equity: | ||||||||||||||||||||||||
| Interest-bearing deposits: | ||||||||||||||||||||||||
| Transaction and money market accounts | $ | 9,932,247 | $ | 74,996 | 3.00 | % | $ | 10,117,794 | $ | 74,833 | 2.97 | % | ||||||||||||
| Regular savings | 1,046,511 | 579 | 0.22 | % | 1,076,411 | 555 | 0.21 | % | ||||||||||||||||
| Time deposits (5) | 4,758,039 | 54,641 | 4.57 | % | 4,243,344 | 47,116 | 4.47 | % | ||||||||||||||||
| Total interest-bearing deposits | 15,736,797 | 130,216 | 3.29 | % | 15,437,549 | 122,504 | 3.19 | % | ||||||||||||||||
| Other borrowings (6) | 855,306 | 11,380 | 5.29 | % | 1,043,297 | 13,850 | 5.34 | % | ||||||||||||||||
| Total interest-bearing liabilities | $ | 16,592,103 | $ | 141,596 | 3.40 | % | $ | 16,480,846 | $ | 136,354 | 3.33 | % | ||||||||||||
| Noninterest-bearing liabilities: | ||||||||||||||||||||||||
| Demand deposits | 4,437,361 | 4,596,129 | ||||||||||||||||||||||
| Other liabilities | 471,545 | 521,294 | ||||||||||||||||||||||
| Total liabilities | 21,501,009 | 21,598,269 | ||||||||||||||||||||||
| Stockholders' equity | 3,112,509 | 3,021,929 | ||||||||||||||||||||||
| Total liabilities and stockholders' equity | $ | 24,613,518 | $ | 24,620,198 | ||||||||||||||||||||
| Net interest income (FTE) | $ | 186,831 | $ | 188,348 | ||||||||||||||||||||
| Interest rate spread | 2.54 | % | 2.63 | % | ||||||||||||||||||||
| Cost of funds | 2.56 | % | 2.50 | % | ||||||||||||||||||||
| Net interest margin (FTE) | 3.38 | % | 3.46 | % | ||||||||||||||||||||
| (1) | Income and yields are reported on a taxable equivalent basis using the statutory federal corporate tax rate of 21%. | |
| (2) | Rates and yields are annualized and calculated from rounded amounts in thousands, which appear above. | |
| (3) | Nonaccrual loans are included in average loans outstanding. | |
| (4) | Interest income on loans includes $13.9 million and $15.7 million for the three months ended September 30, 2024 and June 30, 2024, respectively, in accretion of the fair market value adjustments related to acquisitions. | |
| (5) | Interest expense on time deposits includes $913,000 and $1.0 million for the three months ended September 30, 2024 and June 30, 2024, respectively, in accretion of the fair market value adjustments related to acquisitions. | |
| (6) | Interest expense on borrowings includes $288,000 and $285,000 for the three months ended September 30, 2024 and June 30, 2024, respectively, in amortization of the fair market value adjustments related to acquisitions. |
Exhibit 99.2

3rd Quarter 2024 Earnings Presentation NYSE: AUB October 21, 2024

2 Forward Looking Statements This presentation and statements by our management may constitute “forward - looking statements” within the meaning of the Private Securities Litigation Reform Act of 1995. Forward - looking statements are statements that include, without limitation, statement s on slides entitled “Q3 2024 Highlights“ and “2024 Financial Outlook,” statements regarding our expectations with regard to the b ene fits of the American National Bankshares Inc. ("American National") acquisition, our business, financial and operating result s, including our deposit base and funding, the impact of future economic conditions, changes in economic conditions, our asset quality, ou r c ustomer relationships, and statements that include other projections, predictions, expectations, or beliefs about future even ts or results or otherwise are not statements of historical fact. Such forward - looking statements are based on certain assumptions as of the time they are made, and are inherently subject to known and unknown risks, uncertainties, and other factors, some of which cannot be predicted or quantified, that may cause actual results, performance, or achievements to be materially different from those ex pre ssed or implied by such forward - looking statements. Forward - looking statements are often characterized by the use of qualified w ords (and their derivatives) such as “expect,” “believe,” “estimate,” “plan,” “project,” “anticipate,” “intend,” “will,” “may,” “v iew ,” “opportunity,” “potential,” “continue,” “confidence,” or words of similar meaning or other statements concerning opinions or judgment of the Atlantic Union Bankshares Corporation (the “Company”) and our management about future events. Although we believe that our expectation s w ith respect to forward - looking statements are based upon reasonable assumptions within the bounds of our existing knowledge of our business and operations, there can be no assurance that actual future results, performance, or achievements of, or trends af fecting, us will not differ materially from any projected future results, performance, achievements or trends expressed or im pli ed by such forward - looking statements. Actual future results, performance, achievements or trends may differ materially from historical res ults or those anticipated depending on a variety of factors, including, but not limited to, the effects of or changes in: • market interest rates and their related impacts on macroeconomic conditions, customer and client behavior, our funding costs and our loan and securities portfolios; • inflation and its impacts on economic growth and customer and client behavior; • adverse developments in the financial industry generally, such as bank failures, responsive measures to mitigate and manage such developments, related supervisory and regulatory actions and costs, and related impacts on customer and client behavior; • the sufficiency of liquidity and changes in our capital position; • general economic and financial market conditions, in the United States generally and particularly in the markets in which we operate and which our loans are concentrated, including the effects of declines in real estate values, an increase in unemployment levels and slowdowns in economic growth; • the American National acquisition, including the impact of purchase accounting, any change in the assumptions used regarding the assets acquired and liabilities assumed to determine the fair value and credit marks, and the possibility that the anticipated benefits are not realized when expected or at all; • potential adverse reactions or changes to business or employee relationships, including those resulting from the American National acquisition; • monetary and fiscal policies of the U.S. government, including policies of the U.S. Department of the Treasury and the Federal Reserve; • the quality or composition of our loan or investment portfolios and changes therein; • demand for loan products and financial services in our market areas; • our ability to manage our growth or implement our growth strategy; • the effectiveness of expense reduction plans; • the introduction of new lines of business or new products and services; • our ability to recruit and retain key employees; • real estate values in our lending area; • changes in accounting principles, standards, rules, and interpretations, and the related impact on our financial statements; • an insufficient ACL or volatility in the ACL resulting from the CECL methodology, either alone or as that may be affected by changing economic conditions, credit concentrations, inflation, changing interest rates, or other factors; • concentrations of loans secured by real estate, particularly commercial real estate; • the effectiveness of our credit processes and management of our credit risk; • our ability to compete in the market for financial services and increased competition from fintech companies; • technological risks and developments, and cyber threats, attacks, or events; • operational, technological, cultural, regulatory, legal, credit, and other risks associated with the exploration, consummatio n and integration of potential future acquisitions, whether involving stock or cash considerations; • the potential adverse effects of unusual and infrequently occurring events, such as weather - related disasters, terrorist acts, geopolitical conflicts or public health events (such as pandemics), and of governmental and societal responses thereto; these potential adverse effects may include, without limitation, adverse effects on the ability of our borrowers to satisfy their obligations to us, on the value of collateral securing loans, on the demand for our loans or our other products and services, on supply chains and methods used to distribute products and services, on incidents of cyberattack and fraud, on our liquidity or capital positions, on risks posed by reliance on third - party service providers, on other aspects of our business operations and on financial markets and economic growth; • performance by our counterparties or vendors; • deposit flows; • the availability of financing and the terms thereof; • the level of prepayments on loans and mortgage - backed securities; • the effects of legislative or regulatory changes and requirements, including changes in federal, state or local tax laws; • actual or potential claims, damages, and fines related to litigation or government actions, which may result in, among other things, additional costs, fines, penalties, restrictions on our business activities, reputational harm, or other adverse consequences; • any event or development that would cause us to conclude that there was an impairment of any asset, including intangible assets, such as goodwill; and • other factors, many of which are beyond our control . Please also refer to such other factors as discussed throughout Part I, Item 1A. “Risk Factors” and Part II, Item 7. “Managem ent ’s Discussion and Analysis of Financial Condition and Results of Operations” of our Annual Report on Form 10 - K for the year ende d December 31, 2023, and related disclosures in other filings, which have been filed with the U.S. Securities and Exchange Commiss ion (“SEC”) and are available on the SEC’s website at www.sec.gov. All risk factors and uncertainties described herein and therein should be considered in evaluating forward - looking statements, and all of the forward - looking statements are expressly q ualified by the cautionary statements contained or referred to herein and therein. The actual results or developments antici pat ed may not be realized or, even if substantially realized, they may not have the expected consequences to or effects on the Comp any or our businesses or operations. Readers are cautioned not to rely too heavily on the forward - looking statements. Forward - looking statements speak only as of the date they are made. We do not intend or assume any obligation to update, revise or cl ari fy any forward - looking statements that may be made from time to time by or on behalf of the Company, whether as a result of new information, future events or otherwise, except as required by law.

3 Additional Information Non - GAAP Financial Measures This presentation contains certain financial information determined by methods other than in accordance with generally accepted accounting principles in the United States (“GAAP”). These non - GAAP financial measures are a supplement to GAAP, which is used to prepare the Company’s financial statements, and should not be considered in isolation or as a substitute for comparable measures calculated in accordance with GAAP. In addition, the Company’s non - GAAP financial measures may not be comparable to non - GAAP financial measures of other companies. The Company uses the non - GAAP financial measures discussed herein in its analysis of the Company’s performance. The Company’s management believes that these non - GAAP financial measures provide additional understanding of ongoing operations, enhance comparability of results of operations with prior periods, show the effects of significant gains and charges in the periods presented without the impact of items or events that may obscure trends in the Company’s underlying performance, or show the potential effects of accumulated other comprehensive income (or AOCI) or unrealized losses on securities on the Company's capital. This presentation also includes certain projections of non - GAAP financial measures. Due to the inherent variability and difficulty associated with making accurate forecasts and projections of information that is excluded from these projected non - GAAP measures, and the fact that some of the excluded information is not currently ascertainable or accessible, the Company is unable to quantify certain amounts that would be required to be included in the most directly comparable projected GAAP financial measures without unreasonable effort. Consequently, no disclosure of projected comparable GAAP measures is included, and no reconciliation of forward - looking non - GAAP financial information is included. Please see “Reconciliation of Non - GAAP Disclosures” at the end of this presentation for a reconciliation to the nearest GAAP financial measure. No Offer or Solicitation This presentation does not constitute an offer to sell or a solicitation of an offer to buy any securities. No offer of securities shall be made except by means of a prospectus meeting the requirements of the Securities Act of 1933, as amended, and no offer to sell or solicitation of an offer to buy shall be made in any jurisdiction in which such offer, solicitation or sale would be unlawful. About Atlantic Union Bankshares Corporation Headquartered in Richmond, Virginia, Atlantic Union Bankshares Corporation (NYSE: AUB) is the holding company for Atlantic Union Bank. Atlantic Union Bank had 129 branches and approximately 150 ATMs located throughout Virginia and in portions of Maryland and North Carolina as of September 30, 2024. Certain non - bank financial services affiliates of Atlantic Union Bank include: Atlantic Union Equipment Finance, Inc., which provides equipment financing; Atlantic Union Financial Consultants, LLC, which provides brokerage services; and Union Insurance Group, LLC, which offers various lines of insurance products.

4 Largest Regional Banking Company Headquartered in Virginia Our Company Soundness | Profitability | Growth * Data as of 9/30/2024, market capitalization as of 10/14/2024 1) Regional bank defined as having less than $100 billion in assets; rank determined by asset size; market share data per S&P Gl obal Market Intelligence as of June 30, 2024 Highlights ($bn) • 129 branches across Virginia, North Carolina and Maryland footprint • #1 regional bank 1 deposit market share in Virginia • Strong balance sheet and capital levels • Committed to top - tier financial performance with a highly experienced management team able to execute change 4 $ 18.3 Loans $ 24.8 Assets $ 3.5 Market Capitalization $ 20.3 Deposits Branch/Office Footprint 5 Our Shareholder Value Proposition Leading Regional Presence Dense, uniquely valuable presence across attractive markets Financial Strength Solid balance sheet & capital levels Attractive Financial Profile Solid dividend yield & payout ratio with earnings upside Strong Growth Potential Organic & acquisition opportunities Peer - Leading Performance Committed to top - tier financial performance


6 Q3 2024 Highlights Loan and Deposit Growth • Loans were relatively flat for the quarter • Deposit growth of approximately 6% annualized for the quarter Asset Quality • Q3 2024 net charge - offs at 1 bps annualized • Nonperforming assets consistent with last two quarters Positioning for Long Term • Lending pipelines remain healthy • Focus on performance of the core banking franchise Differentiated Client Experience • Responsive, strong and capable alternative to large national banks, while competitive with and more capable than smaller banks Improved Financial Ratios • Adjusted operating return on tangible common equity of 19.15% 1 • Adjusted operating return on average assets of 1.25% 1 • Adjusted operating efficiency ratio (FTE) of 52.20% 1 Capitalize on Strategic Opportunities • Selectively adding commercial bankers in North Carolina 6 1 - For non - GAAP financial measures, see reconciliation to most directly comparable GAAP measure in "Appendix - Reconciliation o f Non - GAAP Disclosures 7 Q3 2024 Financial Performance At - a - Glance 1 For non - GAAP financial measures, see reconciliation to most directly comparable GAAP measures in “Appendix – Reconciliation of Non - GAAP Disclosures” Note: all tables presented dollars in thousands, except per share amounts • Reported net income available to common shareholders for the third quarter of 2024 was $73.4 million or $0.82 per share, up $51.3 million or $0.57 per share compared to the prior quarter, primarily driven by the net impact of the following items: • A decrease in net interest income, primarily the result of increased interest expense due to the $111.3 million increase in average interest bearing liabilities and lower net accretion income and investment securities interest income, partially offset by increased interest income due to the $165.4 million increase in average LHFI; • A decrease in the provision for credit losses, due primarily to the prior quarter impact related to the American National acquisition, which included an initial provision expense of $13.2 million on non - PCD loans, and $1.4 million on unfunded commitments; • An increase in noninterest income, primarily driven by $6.5 million of pre - tax losses incurred in the prior quarter on the sale of available for sale ("AFS") securities as part of the Company's restructuring of the American National securities portfolio; • A $27.4 million decrease in noninterest expense, primarily driven by a $28.4 million decrease in pre - tax merger - related costs associated with the American National acquisition; • An increase in income tax expense, primarily the result of an increase in pretax income. • Adjusted operating earnings available to common shareholders 1 increased $18.2 million to $74.5 million at September 30, 2024 compared to the prior quarter, primarily driven by the net impact of the following items: • A decrease in net interest income as described above; • A decrease in the provision for credit losses, due primarily to the American National acquisition as described above; • An increase in adjusted operating noninterest income 1 , primarily driven by increases in other income due to an increase in equity method investment income, bank owned life insurance income, and service charges on deposit accounts; • An increase in adjusted operating noninterest expense 1 , primarily driven by increases in salaries and benefits and Federal Deposit Insurance Corporation (“FDIC”) assessment premiums and other insurance, partially offset by a decrease in technology and data processing expense; • An increase in income tax expense discussed above. 3Q2024 2Q2024 Net interest income $ 182,932 $ 184,534 - Provision for credit losses 2,603 21,751 + Noninterest income 34,286 23,812 - Noninterest expense 122,582 150,005 - Taxes 15,618 11,429 Net income (GAAP) $ 76,415 $ 25,161 - Dividends on preferred stock 2,967 2,967 Net income available to common shareholders (GAAP) $ 73,448 $ 22,194 + Merger-related costs, net of tax 1,085 24,236 + Deferred tax asset write-down — 4,774 - Gain (loss) on sale of securities, net of tax 3 (5,148) Adjusted operating earnings available to common shareholders (non-GAAP) 1 $ 74,530 $ 56,352 Summarized Income Statement 3Q2024 2Q2024 Net Income available to common shareholders $ 73,448 $ 22,194 Common EPS, diluted $ 0.82 $ 0.25 ROE 9.77% 3.35% ROTCE (non-GAAP) 1 18.89% 6.99% ROA 1.24% 0.41% Efficiency ratio 56.43% 72.00% Efficiency ratio (FTE) 1 55.44% 70.70% Net interest margin 3.31% 3.39% Net interest margin (FTE) 1 3.38% 3.46% Earnings Metrics 3Q2024 2Q2024 Adjusted operating earnings available to common shareholders $ 74,530 $ 56,352 Adjusted operating common EPS, diluted $ 0.83 $ 0.63 Adjusted operating ROA 1.25% 0.97% Adjusted operating ROTCE 19.15% 15.85% Adjusted operating efficiency ratio (FTE) 52.20% 52.24% Adjusted operating earnings PTPP $ 95,985 $ 94,635 PTPP = Pre-tax Pre-provision Adjusted Operating Earnings Metrics - non-GAAP 1 8 Q3 2024 Allowance For Credit Losses (ACL) and Provision for Credit Losses 8 Q3 Macroeconomic Forecast Q3 ACL Considerations Numbers may not foot due to rounding.

Moody’s September 2024 Baseline Forecast : • US GDP expected to average ~2.6% growth in 2024 and ~ 2.1 % in 2025. • The national unemployment rate expected to average ~ 4 .1% in 2024 and 2025 . • Utilizes a weighted Moody’s forecast economic scenarios approach in the quantitative model. • Qualitative factors were added for certain portfolios as deemed appropriate. • The reasonable and supportable forecast period is 2 years; followed by reversion to the historical loss average over 2 years . Allowance for Credit Losses Reserve for Unfunded Commitments (RUC) Allowance for Loan & Lease Losses (ALLL) $151.8MM (0.96%) $15.6MM (0.10%) $136.2MM (0.86%) 03/31/2024 Ending Balance % of loans +14.6MM Provision for credit losses +$1.4MM +$13.2MM American National Initial Allowance - Non - PCD recorded via provision expense +3.9MM ─ +3.9MM American National Initial Allowance - PCD recorded via PCD gross up of ALLL +$5.4MM $7.2 million Provision for Credit Losses and $1.7 million net charge - offs +$0.6MM Slight increase from last quarter due to increase in unfunded balances. +$4.8MM Increase due to loan growth and the impact of continued uncertainty in the economic outlook on certain portfolios. Q2 2024 Activity $175.7MM (0.96%) $17.6MM (0.10%) $158.1MM (0.86%) 06/30/2024 Ending Balance % of loans +$2.0MM $2.6 million Provision for Credit Losses and $700 thousand net charge - offs - $0.6MM Slight decrease from last quarter due to decrease in unfunded balances. +$2.6MM Increase due to the impact of continued uncertainty in the economic outlook on certain portfolios.


Q3 2024 Activity $177.6MM (0.97%) $16.9MM (0.09%) $160.7MM (0.88%) 09/30/2024 Ending Balance % of loans 9 &RUH/RDQ<LHOG6HFXULWLHV<LHOGDQG (DUQLQJV$VVHWV0L[ &RUH'HSRVLWV DQG)XQGLQJPL[ 1HW3XUFKDVH$FFRXQWLQJ $FFUHWLRQ 4 Net Interest Margin (FTE): Drivers of Change 2Q 2024 to 3Q 2024 Q3 2024 Net Interest Margin Market Rates 2Q2024 3Q2024 Avg EOP Avg EOP 5.50% 5.50% 5.43% 5.00% Fed funds 8.50% 8.50% 8.44% 8.00% Prime 5.33% 5.34% 5.22% 4.85% 1 - month SOFR 4.83% 4.75% 4.84% 4.75% 2 - year Treasury 4.44% 4.40% 3.95% 3.78% 10 - year Treasury Margin Overview 2Q2024 3Q2024 3.46% 3.38% Net interest margin (FTE) 1 6.34% 6.35% Loan yield 4.07% 3.92% Investment yield 5.96% 5.94% Earning asset yield 2.46% 2.57% Cost of deposits 3.19% 3.29% Cost of interest - bearing deposits 3.33% 3.40% Cost of interest - bearing liabilities 2.50% 2.56% Cost of funds Presented on an FTE basis (non - GAAP) 1 Approximately 15% of the loan portfolio at 9/30/2024 have floors and all are above floors Loan Portfolio Pricing Mix 3Q2024 51% Fixed 39% 1 - month SOFR 7% Prime 4% Other 100% Total 1 For non - GAAP financial measures, see reconciliation to most directly comparable GAAP measures in “Appendix – Reconciliation of N on - GAAP Disclosures” * Core Loan Yield includes Loan Fees and Loan Swaps Numbers may not foot due to rounding 7 bps - 5 bps - 4 bps - 6 bps 10 Adjusted operating noninterest expense 1 increased $1.2 million to $115.4 million for the quarter ended September 30, 2024 from $114.2 million in the prior quarter primarily driven by : • A $923,000 increase in salaries and benefits due to increases in variable incentive compensation expenses and full - time equivalent employees • A $607,000 increase in FDIC assessment premiums and other insurance driven by an increase in our assessment base as a result of the American National acquisition • Partially offset by a $537,000 decrease in technology and data processing expense Adjusted o perating noninterest income 1 in creased $4.0 million to $34.3 million for the quarter ended September 30, 2024 from $30.3 million for the prior quarter primarily driven by: • A $706,000 seasonal increase in service charges on deposit accounts • A $1.2 million increase in bank owned life insurance income primarily driven by death benefits received in the third quarter • A $1.9 million increase in other operating income primarily due to an increase in equity method investment income Q3 2024 Noninterest Income and Noninterest Expense 1 For non - GAAP financial measures, see reconciliation to most directly comparable GAAP measures in “Appendix – Reconciliation of N on - GAAP Disclosures” Noninterest Income ($ thousands) 3Q2024 2Q2024 Service charges on deposit accounts $ 9,792 $ 9,086 Other service charges, commissions and fees 2,002 1,967 Interchange fees 3,371 3,126 Fiduciary and asset management fees 6,858 6,907 Mortgage banking income 1,214 1,193 Gain (loss) on sale of securities 4 (6,516) Bank owned life insurance income 5,037 3,791 Loan-related interest rate swap fees 1,503 1,634 Other operating income 4,505 2,624 Total noninterest income $ 34,286 $ 23,812 Less: Gain (loss) on sale of securities 4 (6,516) Total adjusted operating noninterest income (non-GAAP) 1 $ 34,282 $ 30,328 Noninterest Expense ($ thousands) 3Q2024 2Q2024 Salaries and benefits $ 69,454 $ 68,531 Occupancy expenses 7,806 7,836 Furniture and equipment expenses 3,685 3,805 Technology and data processing 9,737 10,274 Professional services 3,994 4,377 Marketing and advertising expense 3,308 2,983 FDIC assessment premiums and other insurance 5,282 4,675 Franchise and other taxes 5,256 5,013 Loan-related expenses 1,445 1,275 Amortization of intangible assets 5,804 5,995 Merger-related costs 1,353 29,778 Other expenses 5,458 5,463 Total noninterest expenses $ 122,582 $ 150,005 Less: Amortization of intangible assets 5,804 5,995 Less: Merger-related costs 1,353 29,778 Total adjusted operating noninterest expense (non-GAAP) 1 $ 115,425 $ 114,232 11 Q3 2024 Loan and Deposit Growth • At September 30, 2024, LHFI totaled $18.3 billion, a decrease of $9.9 million or 0.2% (annualized) from the prior quarter.
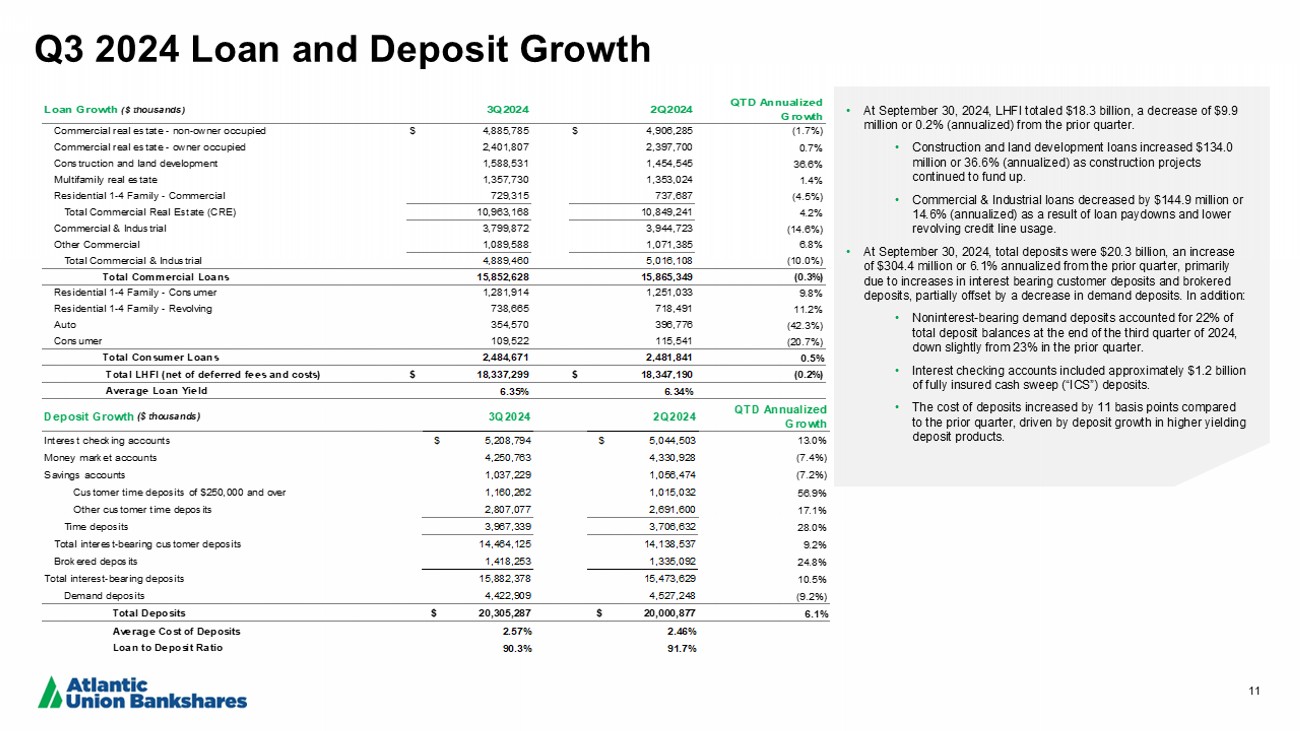
• Construction and land development loans increased $134.0 million or 36.6% (annualized) as construction projects continued to fund up. • Commercial & Industrial loans decreased by $144.9 million or 14.6% (annualized) as a result of loan paydowns and lower revolving credit line usage. • At September 30, 2024, total deposits were $20.3 billion, an increase of $304.4 million or 6.1% annualized from the prior quarter, primarily due to increases in interest bearing customer deposits and brokered deposits, partially offset by a decrease in demand deposits. In addition: • Noninterest - bearing demand deposits accounted for 22% of total deposit balances at the end of the third quarter of 2024, down slightly from 23% in the prior quarter. • Interest checking accounts included approximately $1.2 billion of fully insured cash sweep (“ICS”) deposits. • The cost of deposits increased by 11 basis points compared to the prior quarter, driven by deposit growth in higher yielding deposit products. Loan Growth ($ thousands) 3Q2024 2Q2024 QTD Annualized Growth Commercial real estate - non-owner occupied $ 4,885,785 $ 4,906,285 (1.7%) Commercial real estate - owner occupied 2,401,807 2,397,700 0.7% Construction and land development 1,588,531 1,454,545 36.6% Multifamily real estate 1,357,730 1,353,024 1.4% Residential 1-4 Family - Commercial 729,315 737,687 (4.5%) Total Commercial Real Estate (CRE) 10,963,168 10,849,241 4.2% Commercial & Industrial 3,799,872 3,944,723 (14.6%) Other Commercial 1,089,588 1,071,385 6.8% Total Commercial & Industrial 4,889,460 5,016,108 (10.0%) Total Commercial Loans 15,852,628 15,865,349 (0.3%) Residential 1-4 Family - Consumer 1,281,914 1,251,033 9.8% Residential 1-4 Family - Revolving 738,665 718,491 11.2% Auto 354,570 396,776 (42.3%) Consumer 109,522 115,541 (20.7%) Total Consumer Loans 2,484,671 2,481,841 0.5% Total LHFI (net of deferred fees and costs) $ 18,337,299 $ 18,347,190 (0.2%) Average Loan Yield 6.35% 6.34% Deposit Growth ($ thousands) 3Q2024 2Q2024 QTD Annualized Growth Interest checking accounts $ 5,208,794 $ 5,044,503 13.0% Money market accounts 4,250,763 4,330,928 (7.4%) Savings accounts 1,037,229 1,056,474 (7.2%) Customer time deposits of $250,000 and over 1,160,262 1,015,032 56.9% Other customer time deposits 2,807,077 2,691,600 17.1% Time deposits 3,967,339 3,706,632 28.0% Total interest-bearing customer deposits 14,464,125 14,138,537 9.2% Brokered deposits 1,418,253 1,335,092 24.8% Total interest-bearing deposits 15,882,378 15,473,629 10.5% Demand deposits 4,422,909 4,527,248 (9.2%) Total Deposits $ 20,305,287 $ 20,000,877 6.1% Average Cost of Deposits 2.57% 2.46% Loan to Deposit Ratio 90.3% 91.7% 12 Atlantic Union Bank Atlantic Union Bankshares Atlantic Union Bank Atlantic Union Bankshares Regulatory Well Capitalized Minimums Capital Ratio 10.9% 8.3% 12.3% 9.8% 6.5% Common Equity Tier 1 Ratio (CET1) 10.9% 9.2% 12.3% 10.6% 8.0% Tier 1 Capital Ratio 11.7% 12.0% 13.0% 13.3% 10.0% Total Risk Based Capital Ratio 9.4% 7.9% 10.7% 9.3% 5.0% Leverage Ratio 9.3% 7.9% 9.4% 8.0% - Tangible Equity to Tangible Assets ( non - GAAP) 1 9.3% 7.2% 9.4% 7.3% - Tangible Common Equity Ratio (non - GAAP) 1 Strong Capital Position at September 30, 2024 1) For non - GAAP financial measures, see reconciliation to most directly comparable GAAP measures in “Appendix – Reconciliation o f Non - GAAP Disclosures” *Capital information presented herein is based on estimates and subject to change pending the Company’s fil ing of its regulatory reports Capital Management Strategy Atlantic Union capital management objectives are to: • Maintain designation as a “well capitalized” institution.
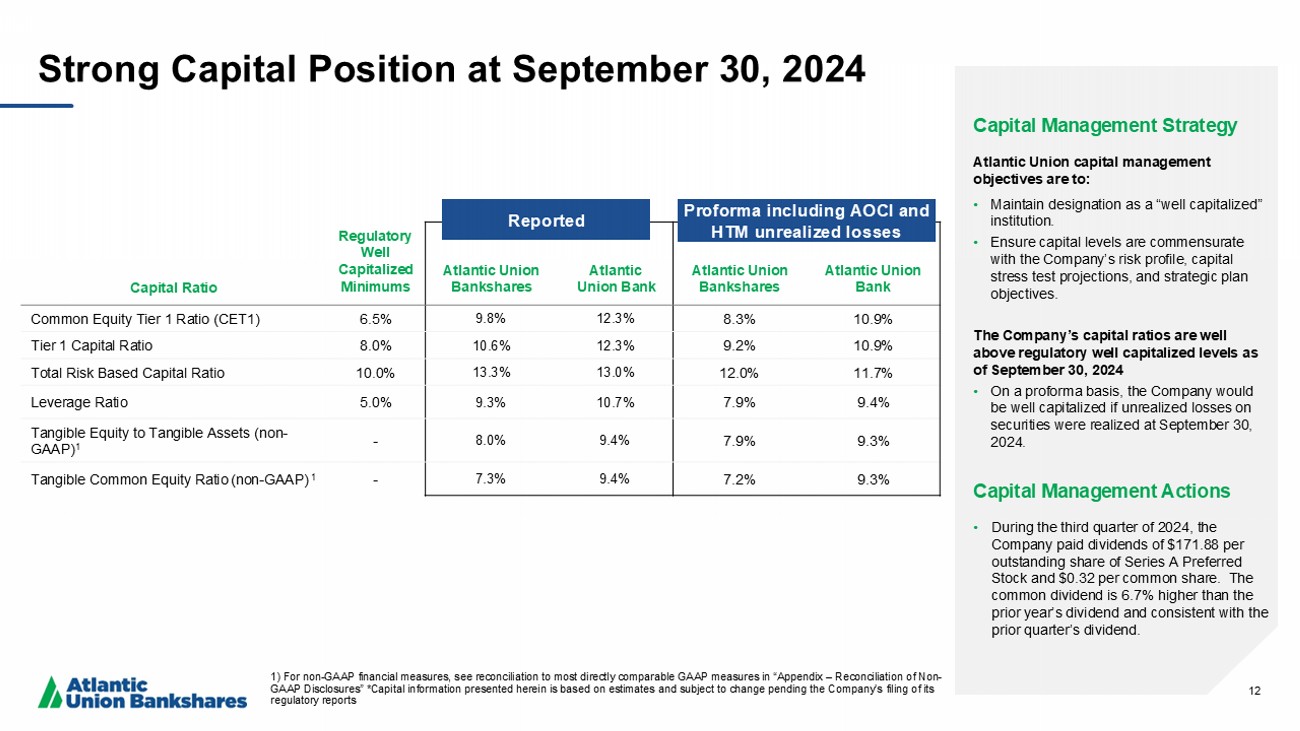
• Ensure capital levels are commensurate with the Company’s risk profile, capital stress test projections, and strategic plan objectives. The Company’s capital ratios are well above regulatory well capitalized levels as of September 30, 2024 • On a proforma basis, the Company would be well capitalized if unrealized losses on securities were realized at September 30, 2024. Capital Management Actions • During the third quarter of 2024, the Company paid dividends of $171.88 per outstanding share of Series A Preferred Stock and $0.32 per common share. The common dividend is 6.7% higher than the prior year’s dividend and consistent with the prior quarter’s dividend.

Reported Proforma including AOCI and HTM unrealized losses 13 2024 Financial Outlook 1 1 Key Assumptions • 2024 outlook includes nine months impact of American National in results • The outlook includes estimates of merger - related purchase accounting adjustments that are subject to change • The Federal Reserve Bank cuts the fed funds rate by 25 bps in November and December 2024 • Increased likelihood of soft landing and expect relatively stable economy in AUB’s Virginia footprint in 2024 • Expect Virginia unemployment rate to remain low and below national unemployment rate in 2024 Notes 1 Full Year 2024 Outlook 1 ~$18.5 - $19.0B Loans (end of period) ~$20.0 - $20.5B Deposits (end of period) ACL to loans: ~95 – 100 bps Net charge - off ratio: ~5 – 7 bps Credit Outlook Targeting ~$190 to $195 million for 4Q24 ~$720 - $725MM Net Interest Income (FTE) 2,3 Targeting ~3.40% - 3.45% for 4Q24 ~3.35% - 3.40% Net Interest Margin (FTE) 2,3 Targeting ~$30 - 35 million for 4Q24 ~$120 - $125MM Adjusted Operating Noninterest Income 2 Targeting ~$115 - $120MM for 4Q24 ~$445 - $450MM Adjusted Operating Noninterest Expense 2 (excludes amortization of intangible assets) Estimated at ~$5 - $7MM for 4Q24 ~$20MM Amortization of intangible assets 1) Information on this slide is presented as of October 21, 2024, reflects the Company’s updated financial outlook, certain of the Company’s financial targets, and key economic assumpti on s, and will not be updated or affirmed unless and until the Company publicly announces such an update or affirmation. The adjusted operating noninterest expense outlook exclud es amortization of intangible assets, merger - related costs, and FDIC special assessments, and the adjusted operating noninterest income outlook excludes gains and losses on the sale of securities. The FY 2024 financial outlook, the Co mpany’s financial targets and the key economic assumptions contain forward - looking statements and actual results or conditions may differ materially. See the information set forth below the heading “Forward Looking Statements” on sl ide 2 of this presentation. 2) Refer to “Additional Information” slide and Appendix for non - GAAP disclosures. 3) Includes estimates of accretion income from the American National acquisition which are subject to change.

14 Appendix

15 Total Non - Owner Occupied CRE 26.6% Owner Occupied CRE 13.1% Construction and Land Development 8.7% Multifamily Real Estate 7.4% Residential 1 - 4 Family - Commercial 4.0% All Other Loans 40.2% Commercial Real Estate (“CRE”) portfolio at September 30, 2024 Figures may not foot due to rounding CRE by class $ in millions Total Outstandings% of Portfolio Hotel/Motel B&B $996 5.4% Industrial/Warehouse $820 4.5% Office $876 4.8% Retail $1,075 5.8% Self Storage $435 2.4% Senior Living $354 1.9% Other $330 1.8% Total Non-Owner Occupied CRE $4,886 26.6% Owner Occupied CRE $2,402 13.1% Construction and Land Development $1,589 8.7% Multifamily Real Estate $1,358 7.4% Residential 1-4 Family - Commercial $729 4.0% Total CRE $10,963 59.8% 16 Other Office 76.3% Medical Office 23.7% Medical vs Other Office By Market ($ millions) Key Portfolio Metrics $309 Carolinas $128 Western VA $114 Fredericksburg Area $98 Central VA $68 Coastal VA $70 Northern VA/Maryland $47 Eastern VA $42 Other $876 Total $1,687 Avg.

Office Loan ($ thousands) $574 Median Office Loan ($ thousands) 2.78% Loan Loss Reserve / Office Loans 0.10% NCOs / Office Loans 1 0.39% Delinquencies / Office Loans 0.34% NPL / Office Loans 9.61% Criticized Loans / Office Loans Non - Owner Occupied Office CRE Portfolio at September 30, 2024 $ 876 MM Non - Owner Occupied Office Portfolio Non - Owner Occupied Office Portfolio Credit Quality Geographically Diverse Non - Owner Occupied Office Portfolio 1 Trailing 4 Quarters Avg NCO/Trailing 4 Quarter Avg Office Portfolio 17 By Market ($ millions) Key Portfolio Metrics $403 Carolinas $273 Central VA $255 Western VA $153 Coastal VA $128 Eastern VA $93 Fredericksburg Area $29 Northern VA/Maryland $23 Other $1,358 Total Multifamily CRE Portfolio at September 30, 2024 Multifamily Portfolio Credit Quality Geographically Diverse Multifamily Portfolio 1 Trailing 4 Quarters Avg NCO/Trailing 4 Quarter Avg Multifamily Portfolio $2,667 Avg.
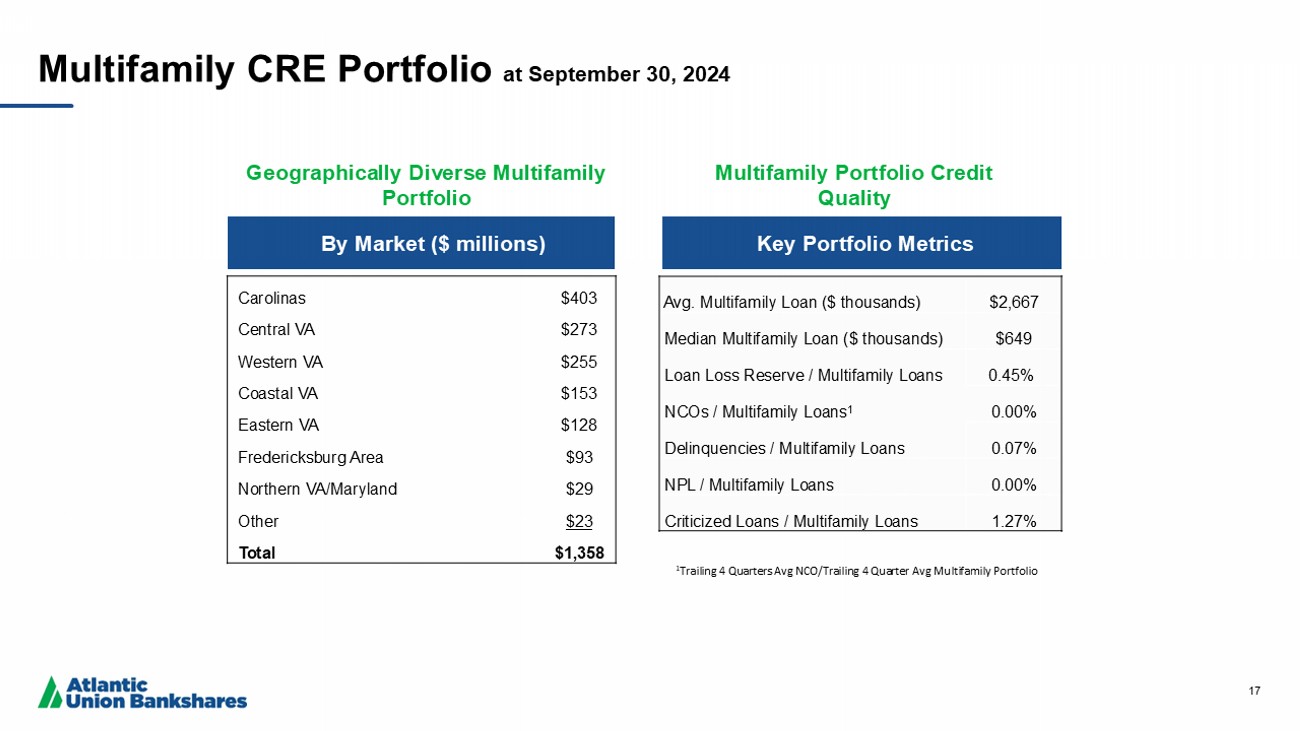
Multifamily Loan ($ thousands) $649 Median Multifamily Loan ($ thousands) 0.45% Loan Loss Reserve / Multifamily Loans 0.00% NCOs / Multifamily Loans 1 0.07% Delinquencies / Multifamily Loans 0.00% NPL / Multifamily Loans 1.27% Criticized Loans / Multifamily Loans 18 Attractive Core Deposit Base Deposit Base Characteristics Deposit Composition at September 30, 2024 — $20.3 billion Cost of deposit data is as of and for the three months ended September 30, 2024 (1) Core deposits defined as total deposits less jumbo time deposits and brokered deposits • Q3 2024 cost of deposits – 2.
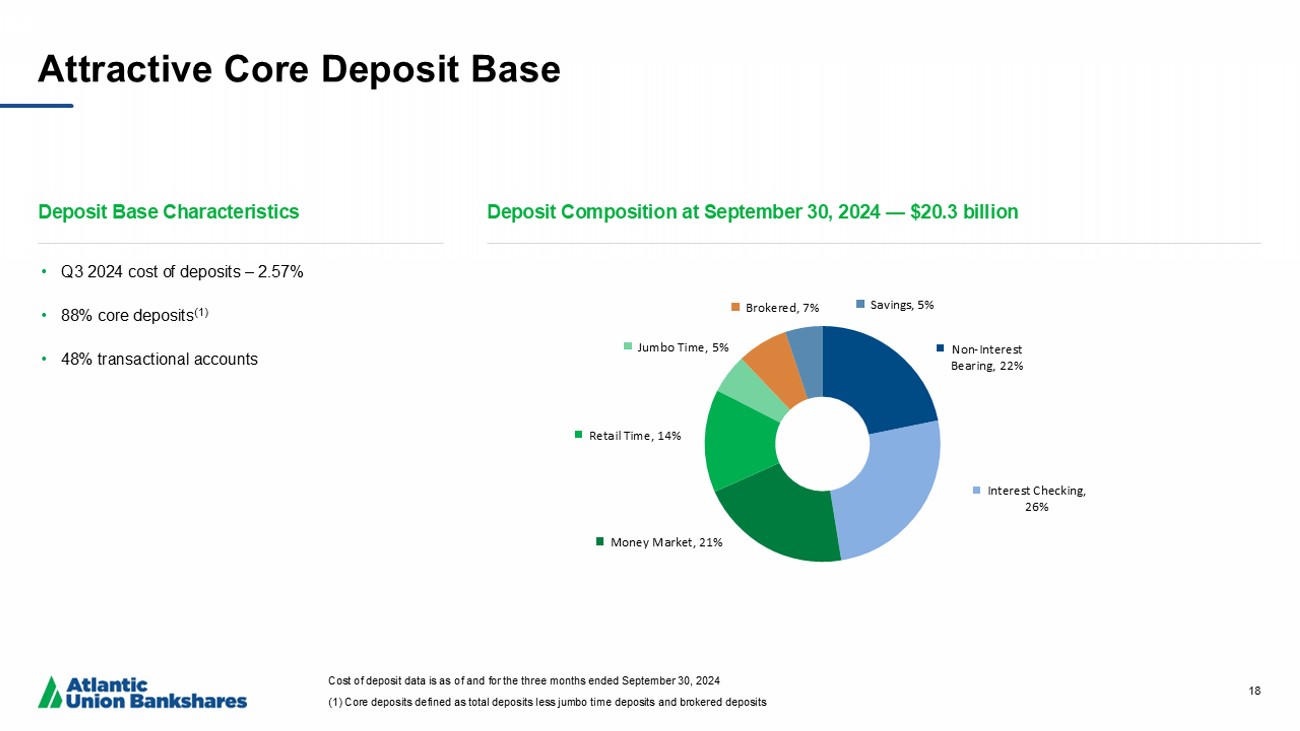
57 % • 88 % core deposits (1) • 48 % transactional accounts Non - Interest Bearing , 22% Interest Checking, 26% Money Market , 21% Retail Time , 14% Jumbo Time , 5% Brokered, 7% Savings, 5% 19 Granular Deposit Base $19,000 $20,000 $19,000 $100,000 $89,000 $92,000 Q3 2023 Q2 2024 Q3 2024 Customer Deposit Granularity Retail Avg.

Deposits Acct Size Business Avg. Deposits Acct Size 27% 29% 29% 27% 27% $4,492 $4,922 $5,094 $5,375 $5,551 Q3 2023 Q4 2023 Q1 2024 Q2 2024 Q3 2024 Period End Uninsured and Uncollateralized Deposits as a Percentage of Total Deposits ($ in Millions)
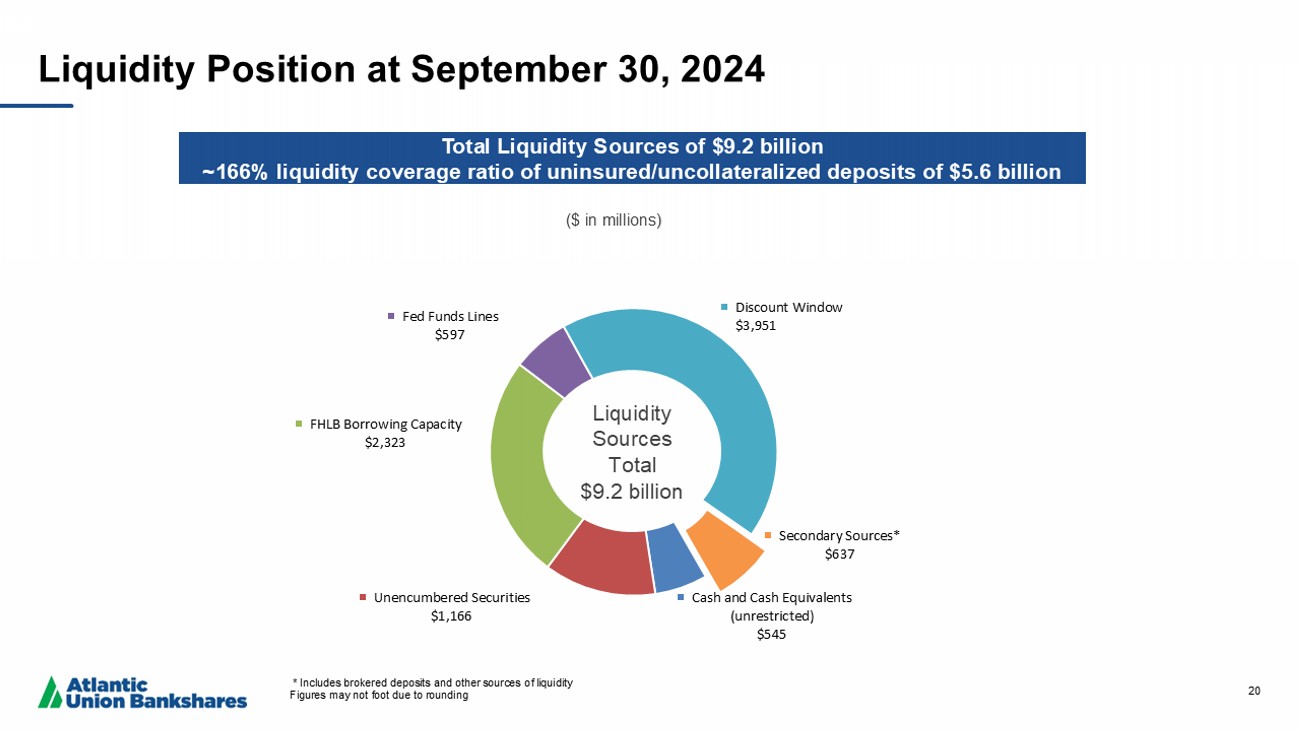
20 Cash and Cash Equivalents (unrestricted) $545 Unencumbered Securities $1,166 FHLB Borrowing Capacity $2,323 Fed Funds Lines $597 Discount Window $3,951 Secondary Sources * $637 ($ in millions) Liquidity Position at September 30, 2024 Total Liquidity Sources of $9.2 billion ~166% liquidity coverage ratio of uninsured/uncollateralized deposits of $5.6 billion * Includes brokered deposits and other sources of liquidity Figures may not foot due to rounding Liquidity Sources Total $9.2 billion 21 Securities Portfolio at September 30, 2024 • Total securities portfolio of $3.4 billion with a total unrealized loss of $364.7 million • 78% of total portfolio in available - for - sale at an unrealized loss of $334.5 million • 22% of total portfolio designated as held - to - maturity with an unrealized loss of $30.2 million • Total effective duration of 4.6 years.

Securities portfolio is used defensively to neutralize overall asset sensitive interest rate risk profile • ~34% municipals, ~61% treasuries, agency MBS/CMOs and ~5% corporates and other investments • Securities to total assets of 13.8% as of September 30, 2024, down from 14.5% on December 31, 2023 • In April 2024, sold $372 million in AFS securities acquired from American National, resulting in a pre - tax loss of $6.5 million. A majority of the proceeds were reinvested into higher yielding securities. $2,928 $3,366 $3,415 3Q 2023 2Q 2024 3Q 2024 Investment Securities Balances (in millions) Total AFS (fair value) and HTM (carrying value) 3.42% Yield 3.92% Yield 4.07% Yield 22 Reconciliation of Non - GAAP Disclosures The Company has provided supplemental performance measures determined by methods other than in accordance with GAAP.

These no n - G AAP financial measures are a supplement to GAAP, which is used to prepare the Company’s financial statements, and should not be c ons idered in isolation or as a substitute for comparable measures calculated in accordance with GAAP. In addition, the Company’s non - GAAP fin ancial measures may not be comparable to non - GAAP financial measures of other companies. The Company uses the non - GAAP financial measur es discussed herein in its analysis of the Company’s performance. The Company’s management believes that these non - GAAP financial m easures provide additional understanding of ongoing operations, enhance comparability of results of operations with prior periods and sh ow the effects of significant gains and charges in the periods presented without the impact of items or events that may obscure trends in the C omp any’s underlying performance.

23 Reconciliation of Non - GAAP Disclosures Adjusted operating measures exclude, as applicable, merger - related costs, a deferred tax asset write - down, and gain (loss) on sale of securities. The Company believes these non - GAAP adjusted measures provide investors with important information about the continuing economic results of the Company’s operations. The Company believes net interest income (FTE), total revenue (FTE), and total adjusted revenue (FTE), which are used in computing net interest margin (FTE), efficiency ratio (FTE) and adjusted operating efficiency ratio (FTE), provide valuable additional insight into the net interest margin and the efficiency ratio by adjusting for differences in tax treatment of interest income sources. The entire FTE adjustment is attributable to interest income on earning assets, which is used in computing the yield on earning assets. Interest expense and the related cost of interest - bearing liabilities and cost of funds ratios are not affected by the FTE components. The adjusted operating efficiency ratio (FTE) excludes, as applicable, the amortization of intangible assets, merger - related costs, and gain (loss) on sale of securities. This measure is similar to the measure used by the Company when analyzing corporate performance and is also similar to the measure used for incentive compensation. The Company believes this adjusted measure provides investors with important information about the continuing economic results of the Company’s operations. (Dollars in thousands, except per share amounts) 3Q2024 2Q2024 Operating Measures Net Income (GAAP) 76,415$ 25,161$ Plus: Merger-related costs, net of tax 1,085 24,236 Plus: Deferred tax asset write-down — 4,774 Less: Gain (loss) on sale of securities, net of tax 3 (5,148) Adjusted operating earnings (non-GAAP) 77,497$ 59,319$ Less: Dividends on preferred stock 2,967 2,967 Adjusted operating earnings available to common shareholders (non-GAAP) 74,530$ 56,352$ Weighted average common shares outstanding, diluted 89,780,531 89,768,466 EPS available to common shareholders, diluted (GAAP) 0.82$ 0.25$ Adjusted operating EPS available to common shareholders (non-GAAP) 0.83$ 0.63$ Operating Efficiency Ratio Noninterest expense (GAAP) 122,582$ 150,005$ Less: Amortization of intangible assets 5,804 5,995 Less: Merger-related costs 1,353 29,778 Adjusted operating noninterest expense (non-GAAP) 115,425$ 114,232$ Noninterest income (GAAP) 34,286$ 23,812$ Less: Gain (loss) on sale of securities 4 (6,516) Adjusted operating noninterest income (non-GAAP) 34,282$ 30,328$ Net interest income (GAAP) 182,932$ 184,534$ Noninterest income (GAAP) 34,286 23,812 Total revenue (GAAP) 217,218$ 208,346$ Net interest income (FTE) (non-GAAP) 186,831$ 188,348$ Adjusted operating noninterest income (non-GAAP) 34,282 30,328 Total adjusted revenue (FTE) (non-GAAP) 221,113$ 218,676$ Efficiency ratio (GAAP) 56.43% 72.00% Efficiency ratio FTE (non-GAAP) 55.44% 70.70% Adjusted operating efficiency ratio (FTE) (non-GAAP) 52.20% 52.24% For the three months ended ADJUSTED OPERATING EARNINGS AND EFFICIENCY RATIO 24 Reconciliation of Non - GAAP Disclosures The Company believes net interest income (FTE), total revenue (FTE), and total adjusted revenue (FTE), which are used in computing net interest margin (FTE), efficiency ratio (FTE) and adjusted operating efficiency ratio (FTE), provide valuable additional insight into the net interest margin and the efficiency ratio by adjusting for differences in tax treatment of interest income sources.
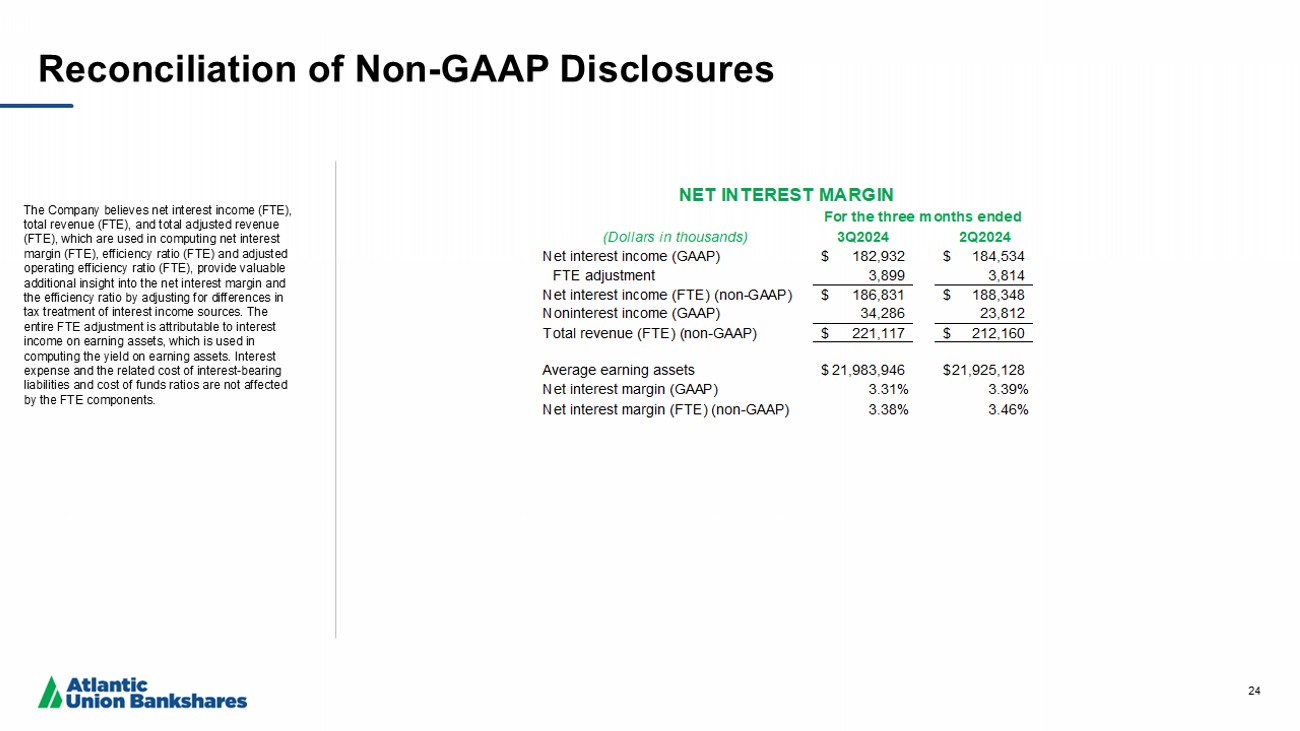
The entire FTE adjustment is attributable to interest income on earning assets, which is used in computing the yield on earning assets. Interest expense and the related cost of interest - bearing liabilities and cost of funds ratios are not affected by the FTE components. (Dollars in thousands) 3Q2024 2Q2024 Net interest income (GAAP) 182,932$ 184,534$ FTE adjustment 3,899 3,814 Net interest income (FTE) (non-GAAP) 186,831$ 188,348$ Noninterest income (GAAP) 34,286 23,812 Total revenue (FTE) (non-GAAP) 221,117$ 212,160$ Average earning assets 21,983,946$ 21,925,128$ Net interest margin (GAAP) 3.31% 3.39% Net interest margin (FTE) (non-GAAP) 3.38% 3.46% NET INTEREST MARGIN For the three months ended 25 Reconciliation of Non - GAAP Disclosures Tangible assets and tangible common equity are used in the calculation of certain profitability, capital, and per share ratios.

The Company believes tangible assets, tangible common equity and the related ratios are meaningful measures of capital adequacy because they provide a meaningful base for period - to - period and company - to - company comparisons, which the Company believes will assist investors in assessing the capital of the Company and its ability to absorb potential losses. The Company believes tangible common equity is an important indication of its ability to grow organically and through business combinations, as well as its ability to pay dividends and to engage in various capital management strategies. The Company also calculates adjusted tangible common equity to tangible assets ratios to exclude AOCI, which is principally comprised of unrealized losses on AFS securities, and to include the impact of unrealized losses on HTM securities. The Company believes that each of these ratios enables investors to assess the Company's capital levels and capital adequacy without the effects of changes in AOCI, some of which are uncertain and difficult to predict, or assuming that the Company realized all previously unrealized losses on HTM securities at the end of the period, as applicable. (Dollars in thousands, except per share amounts) Atlantic Union Bankshares Atlantic Union Bank Tangible Assets Ending Assets (GAAP) 24,803,723$ 24,682,936$ Less: Ending goodwill 1,212,710 1,212,710 Less: Ending amortizable intangibles 90,176 90,176 Ending tangible assets (non-GAAP) 23,500,837$ 23,380,050$ Tangible Common Equity Ending equity (GAAP) 3,182,416$ 3,510,679$ Less: Ending goodwill 1,212,710 1,212,710 Less: Ending amortizable intangibles 90,176 90,176 Less: Perpetual preferred stock 166,357 — Ending tangible common equity (non-GAAP) 1,713,173$ 2,207,793$ Net unrealized losses on HTM securities, net of tax (30,253)$ (30,253)$ Accumulated other comprehensive loss (AOCI) (292,307)$ (292,307)$ Common shares outstanding at end of period 89,774,392 Average equity (GAAP) 3,112,509$ 3,432,314$ Less: Average goodwill 1,209,590 1,209,590 Less: Average amortizable intangibles 93,001 93,001 Less: Average perpetual preferred stock 166,356 — Average tangible common equity (non-GAAP) 1,643,562$ 2,129,723$ Less: Perpetual preferred stock Common equity to total assets (GAAP) 12.2% 14.2% Tangible equity to tangible assets (non-GAAP) 8.0% 9.4% Tangible equity to tangible assets, incl net unrealized losses on HTM securities (non-GAAP) 7.9% 9.3% Tangible common equity to tangible assets (non-GAAP) 7.3% 9.4% Tangible common equity to tangible assets, incl net unrealized losses on HTM securities (non-GAAP) 7.2% 9.3% Tangible common equity to tangible assets, ex AOCI (non-GAAP) 1 8.5% Book value per common share (GAAP) 33.85$ Tangible book value per common share (non-GAAP) 19.23$ Tangible book value per common share, ex AOCI (non-GAAP) 1 22.51$ Leverage Ratio Tier 1 capital 2,192,861$ 2,527,757$ Total average assets for leverage ratio 23,646,246$ 23,529,767$ Leverage ratio 9.3% 10.7% Leverage ratio, incl AOCI and net unrealized losses on HTM securities (non-GAAP) 7.9% 9.4% TANGIBLE ASSETS, TANGIBLE COMMON EQUITY, AND LEVERAGE RATIO As of September 30, 2024 1 Calculation excludes the impact of 680,936 unvested restricted stock awards (RSAs) outstanding as of September 30, 2024 26 Reconciliation of Non - GAAP Disclosures All regulatory capital ratios at September 30, 2024 are estimates and subject to change pending the Company’s filing of its FR Y - 9 C. In addition to these regulatory capital ratios, the Company adjusts certain regulatory capital ratios to include the impacts of AOCI, which the Company has elected to exclude from regulatory capital ratios under applicable regulations, and net unrealized losses on HTM securities, assuming that those unrealized losses were realized at the end of the period, as applicable. The Company believes that each of these ratios help investors to assess the Company's regulatory capital levels and capital adequacy. (Dollars in thousands) Atlantic Union Bankshares Atlantic Union Bank Risk-Based Capital Ratios Net unrealized losses on HTM securities, net of tax (30,253)$ (30,253)$ Accumulated other comprehensive loss (AOCI) (292,307)$ (292,307)$ Common equity tier 1 capital 2,026,505$ 2,527,757$ Tier 1 capital 2,192,861$ 2,527,757$ Total capital 2,766,161$ 2,688,661$ Total risk-weighted assets 20,743,851$ 20,629,534$ Common equity tier 1 capital ratio 9.8% 12.3% Common equity tier 1 capital ratio, incl AOCI and net unrealized losses on HTM securities (non-GAAP) 8.3% 10.9% Tier 1 capital ratio 10.6% 12.3% Tier 1 capital ratio, incl AOCI and net unrealized losses on HTM securities (non-GAAP) 9.2% 10.9% Total capital ratio 13.3% 13.0% Total capital ratio, incl AOCI and net unrealized losses on HTM securities (non-GAAP) 12.0% 11.7% RISK-BASED CAPITAL RATIOS As of September 30, 2024

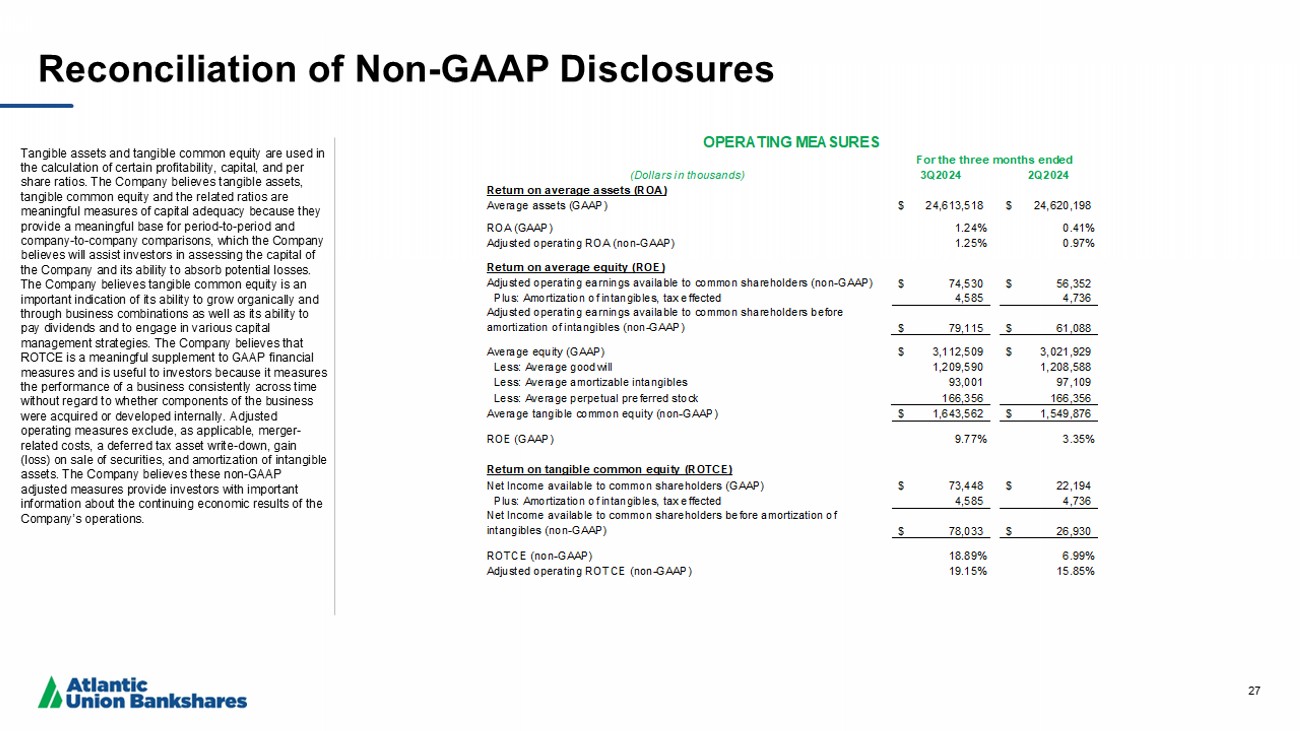
27 Reconciliation of Non - GAAP Disclosures Tangible assets and tangible common equity are used in the calculation of certain profitability, capital, and per share ratios. The Company believes tangible assets, tangible common equity and the related ratios are meaningful measures of capital adequacy because they provide a meaningful base for period - to - period and company - to - company comparisons, which the Company believes will assist investors in assessing the capital of the Company and its ability to absorb potential losses. The Company believes tangible common equity is an important indication of its ability to grow organically and through business combinations as well as its ability to pay dividends and to engage in various capital management strategies. The Company believes that ROTCE is a meaningful supplement to GAAP financial measures and is useful to investors because it measures the performance of a business consistently across time without regard to whether components of the business were acquired or developed internally. Adjusted operating measures exclude, as applicable, merger - related costs, a deferred tax asset write - down, gain (loss) on sale of securities, and amortization of intangible assets. The Company believes these non - GAAP adjusted measures provide investors with important information about the continuing economic results of the Company’s operations. (Dollars in thousands) 3Q2024 2Q2024 Return on average assets (ROA) Average assets (GAAP) 24,613,518$ 24,620,198$ ROA (GAAP) 1.24% 0.41% Adjusted operating ROA (non-GAAP) 1.25% 0.97% Return on average equity (ROE) Adjusted operating earnings available to common shareholders (non-GAAP) 74,530$ 56,352$ Plus: Amortization of intangibles, tax effected 4,585 4,736 Adjusted operating earnings available to common shareholders before amortization of intangibles (non-GAAP) 79,115$ 61,088$ Average equity (GAAP) 3,112,509$ 3,021,929$ Less: Average goodwill 1,209,590 1,208,588 Less: Average amortizable intangibles 93,001 97,109 Less: Average perpetual preferred stock 166,356 166,356 Average tangible common equity (non-GAAP) 1,643,562$ 1,549,876$ ROE (GAAP) 9.77% 3.35% Return on tangible common equity (ROTCE) Net Income available to common shareholders (GAAP) 73,448$ 22,194$ Plus: Amortization of intangibles, tax effected 4,585 4,736 Net Income available to common shareholders before amortization of intangibles (non-GAAP) 78,033$ 26,930$ ROTCE (non-GAAP) 18.89% 6.99% Adjusted operating ROTCE (non-GAAP) 19.15% 15.85% For the three months ended OPERATING MEASURES 28 Reconciliation of Non - GAAP Disclosures Pre - tax pre - provision adjusted earnings excludes, as applicable, the provision for credit losses, which can fluctuate significantly from period - to - period under the CECL methodology, income tax expense, merger - related costs, and gain (loss) on sale of securities.

The Company believes this adjusted measure provides investors with important information about the continuing economic results of the Company’s operations. (Dollars in thousands) 3Q2024 2Q2024 Net income (GAAP) 76,415$ 25,161$ Plus: Provision for credit losses 2,603 21,751 Plus: Income tax expense 15,618 11,429 Plus: Merger-related costs 1,353 29,778 Less: Gain (loss) on sale of securities 4 (6,516) PTPP adjusted operating earnings (non-GAAP) 95,985$ 94,635$ For the three months ended PRE-TAX PRE-PROVISION ADJUSTED OPERATING EARNINGS