UNITED STATES
SECURITIES AND EXCHANGE COMMISSION
Washington, D.C. 20549
FORM 8-K
CURRENT REPORT
PURSUANT TO SECTION 13 OR 15(d) OF THE SECURITIES EXCHANGE ACT OF 1934
Date of Report (Date of earliest event reported): July 24, 2024
UNITED COMMUNITY BANKS, INC.
(Exact name of registrant as specified in its charter)
| Georgia | 001-35095 | 58-1807304 |
| (State or other jurisdiction of incorporation) | (Commission file number) | (IRS Employer Identification No.) |
200 East Camperdown Way
Greenville, South Carolina 29601
(Address of principal executive offices)
Registrant's telephone number,
including area code:
(800) 822-2651
Not applicable
(Former name or former address, if changed since last report)
Check the appropriate box below if the Form 8-K filing is intended to simultaneously satisfy the filing obligation of the registrant under any of the following provisions:
| ¨ | Written communications pursuant to Rule 425 under the Securities Act (17 CFR 230.425) | |
| ¨ | Soliciting material pursuant to Rule 14a-12 under the Exchange Act (17 CFR 240.14a-12) | |
| ¨ | Pre-commencement communications pursuant to Rule 14d-2(b) under the Exchange Act (17 CFR 240.14d-2(b)) | |
| ¨ | Pre-commencement communications pursuant to Rule 13e-4(c) under the Exchange Act (17 CFR 240.13e-4(c)) |
Securities registered pursuant to Section 12(b) of the Act:
| Title of Each Class | Trading Symbol(s) | Name of Each Exchange on Which Registered | ||
| Common stock, par value $1 per share | UCBI | Nasdaq Global Select Market | ||
| Depositary shares, each representing 1/1000th interest in a share of Series I Non-Cumulative Preferred Stock | UCBIO | Nasdaq Global Select Market |
Indicate by check mark whether the registrant is an emerging growth company as defined in as defined in Rule 405 of the Securities Act of 1933 (§230.405 of this chapter) or Rule 12b-2 of the Securities Exchange Act of 1934 (§240.12b-2 of this chapter).
Emerging growth company ¨
If an emerging growth company, indicate by check mark if the registrant has elected not to use the extended transition period for complying with any new or revised financial accounting standards provided pursuant to Section 13(a) of the Exchange Act. ¨
| Item 2.02 | Results of Operations and Financial Condition. |
On July 24, 2024, United Community Banks, Inc. (“United”) issued a press release announcing financial results for its second fiscal quarter of 2024. The press release is furnished as Exhibit 99.1 to this Current Report on Form 8-K.
The information furnished pursuant to this Item 2.02, including Exhibit 99.1, shall not be deemed “filed” for purposes of Section 18 of the Securities Exchange Act of 1934 (the “Exchange Act”) or otherwise subject to the liabilities under Section 18 of the Exchange Act and shall not be deemed to be incorporated by reference into any filing of the Company under the Securities Act of 1933 or the Exchange Act.
| Item 7.01 | Regulation FD Disclosure. |
On July 24, 2024, United will hold an earnings conference call and webcast at 11:00 a.m. (Eastern Time) to discuss financial results for its second fiscal quarter of 2024. The press release referenced above in Item 2.02 contains information about how to access the conference call and webcast. A copy of the slide presentation to be used during the earnings call and webcast is furnished as Exhibit 99.2 to this Current Report on Form 8-K. The slide presentation also will be available on our website, www.ucbi.com, under the “Investor Relations – Events and Presentations” section.
The information furnished pursuant to this Item 7.01, including Exhibit 99.2, shall not be deemed “filed” for purposes of Section 18 of the Exchange Act or otherwise subject to the liabilities under Section 18 of the Exchange Act and shall not be deemed to be incorporated by reference into any filing of the Company under the Securities Act of 1933 or the Exchange Act.
| Item 9.01 | Financial Statements and Exhibits. |
(d) Exhibits
EXHIBIT INDEX
| Exhibit No. | Description |
| 99.1 | United Community Banks, Inc. Press Release, dated July 24, 2024. |
| 99.2 | Slide presentation to be used during July 24, 2024 earnings call. |
| 104 | The cover page from this Current Report on Form 8-K, formatted in Inline XBRL. |
SIGNATURES
Pursuant to the requirements of the Securities Exchange Act of 1934, the registrant has duly caused this report to be signed on its behalf by the undersigned hereunto duly authorized.
| UNITED COMMUNITY BANKS, INC. | ||
| By: | /s/ Jefferson L. Harralson | |
| Jefferson L. Harralson | ||
| Executive Vice President and | ||
| Chief Financial Officer | ||
| Date: July 24, 2024 | ||
Exhibit 99.1

For Immediate Release
For more information:
Jefferson Harralson
Chief Financial Officer
(864) 240-6208
Jefferson_Harralson@ucbi.com
United Community Banks, Inc. Reports Second Quarter Results
Strong Margin Expansion Drives Growth in Net Income
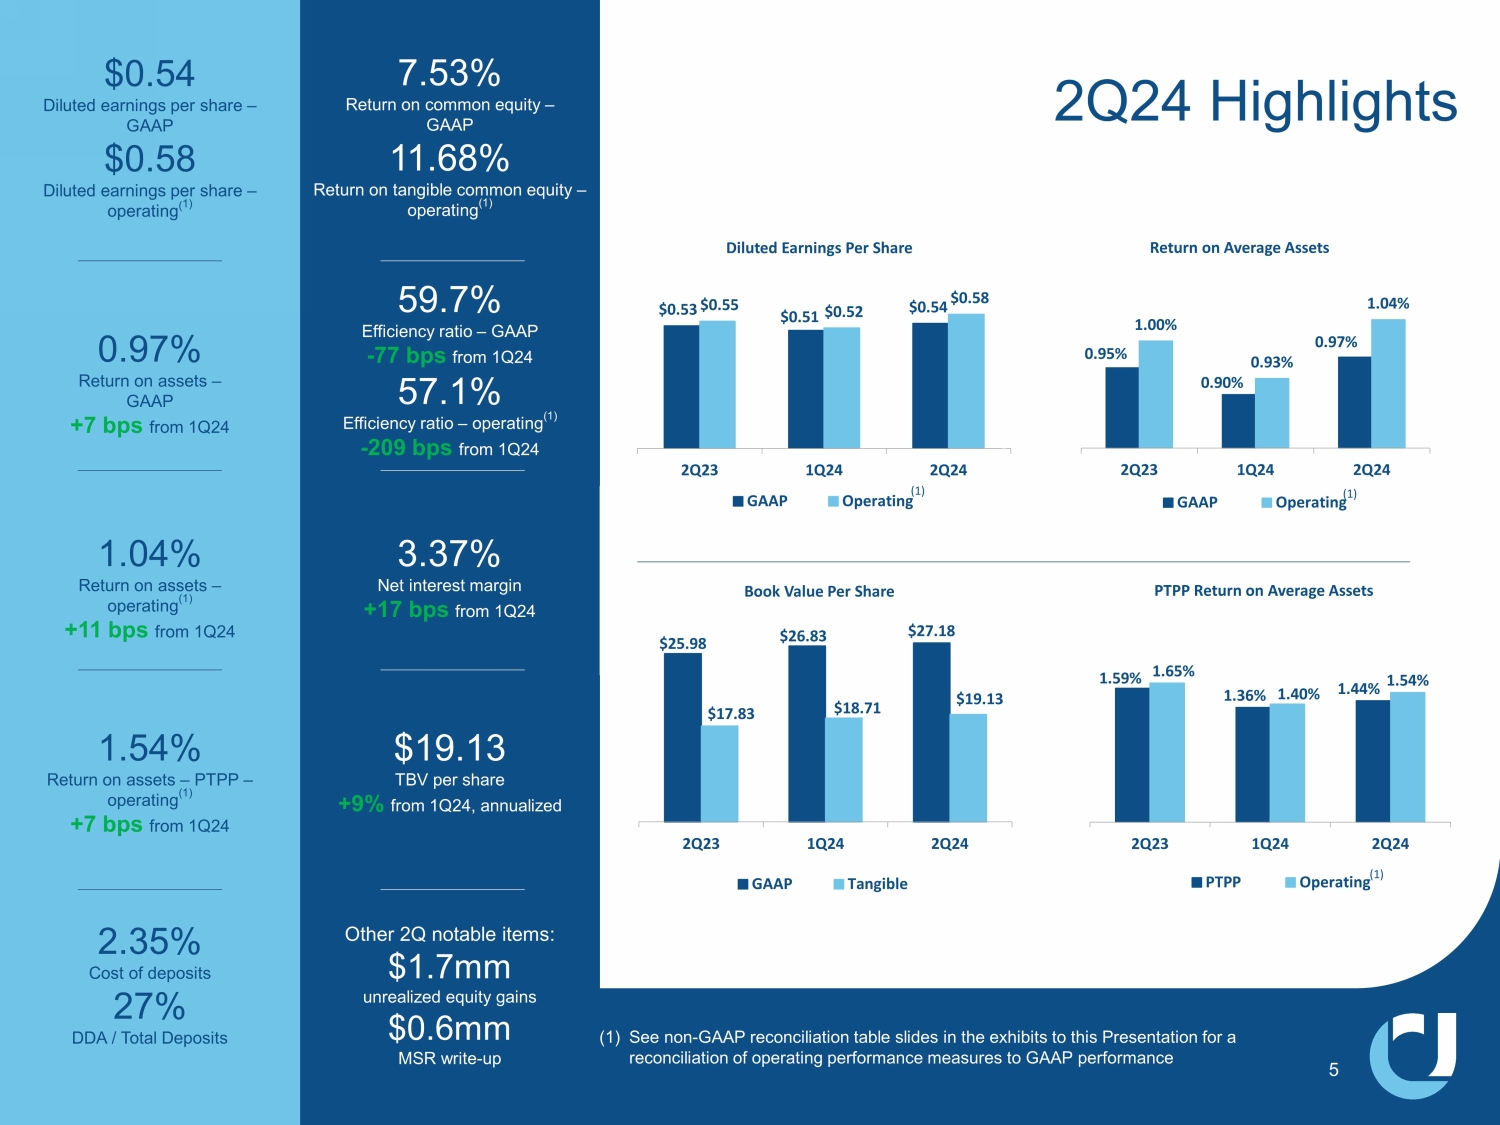
GREENVILLE, SC – July 24, 2024 - United Community Banks, Inc. (NASDAQ: UCBI) (United) today announced that net income for the 2024 second quarter was $66.6 million and pre-tax, pre-provision income was $98.2 million. Diluted earnings per share of $0.54 for the quarter represented an increase of $0.01, or 2%, from the second quarter a year ago and an increase of $0.03, or 6%, from the first quarter of 2024.
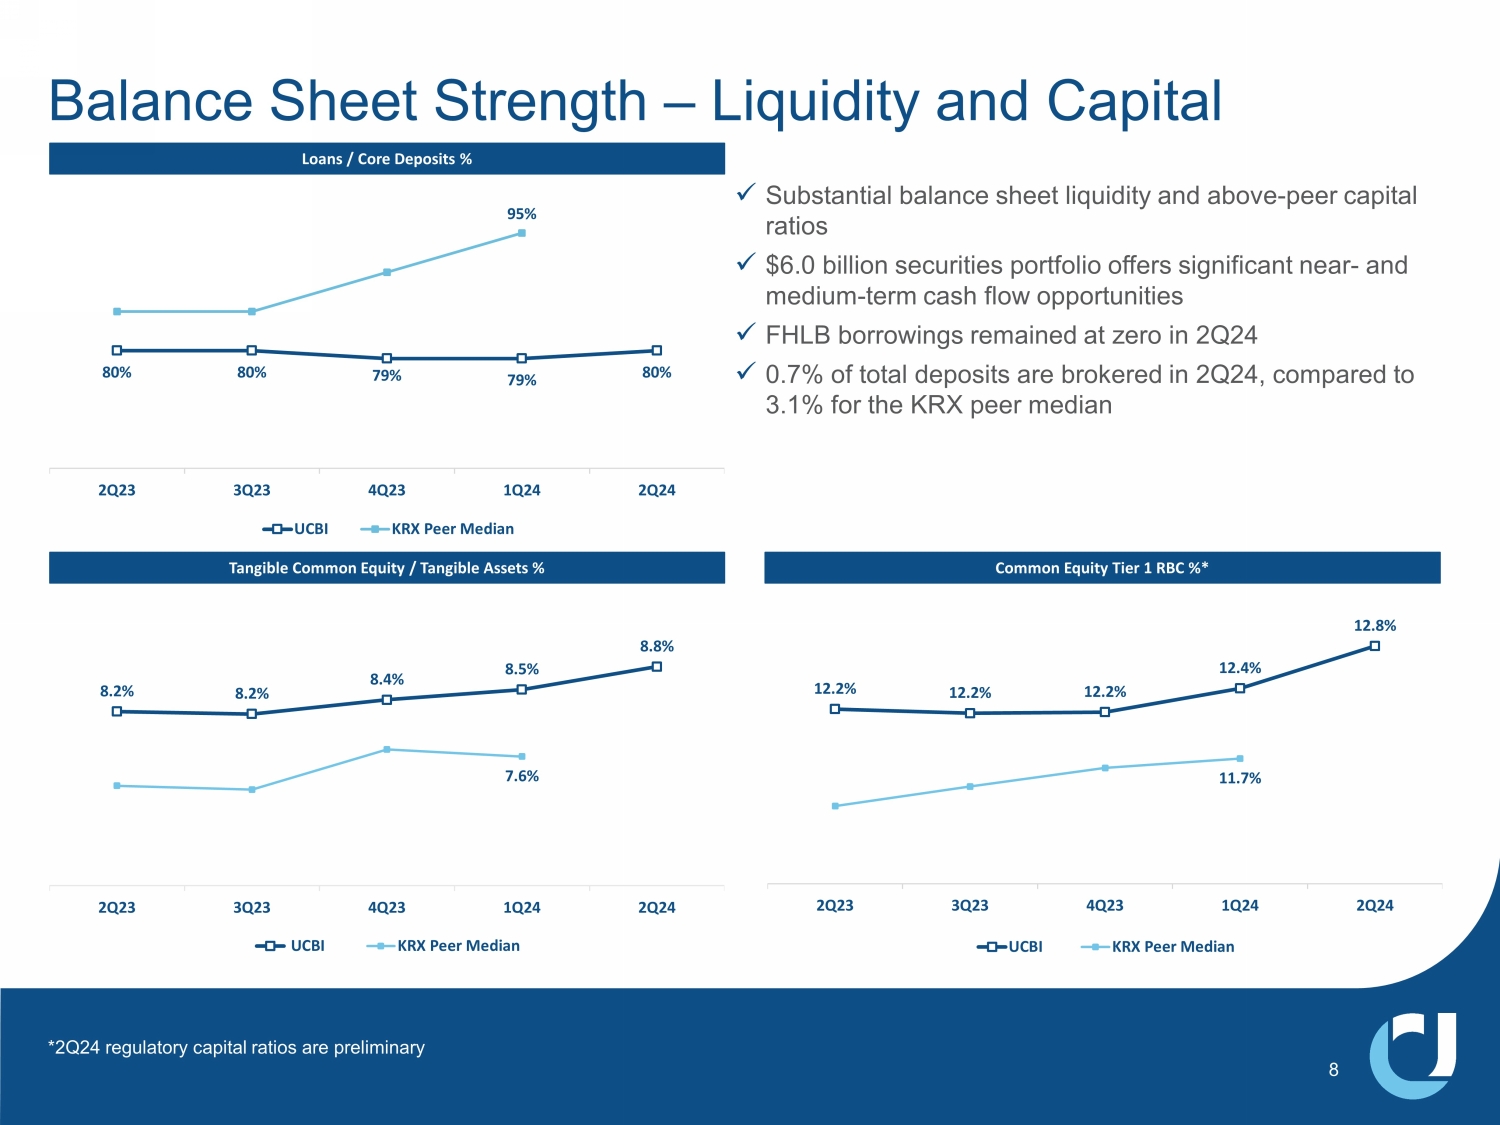
On an operating basis, United’s diluted earnings per share of $0.58 was up 5% from the year-ago quarter. The primary drivers of the increased earnings per share year-over-year were higher net interest income and a lower provision for credit losses. The linked-quarter increase in earnings per share was primarily driven by higher net interest income. United’s return on assets was 0.97%, or 1.04% on an operating basis. Return on equity was 7.53% and return on tangible common equity was 11.68%. On a pre-tax, pre-provision basis, operating return on assets was 1.54% for the quarter. At quarter end, tangible common equity to tangible assets was 8.78%, up 29 basis points from the first quarter of 2024.
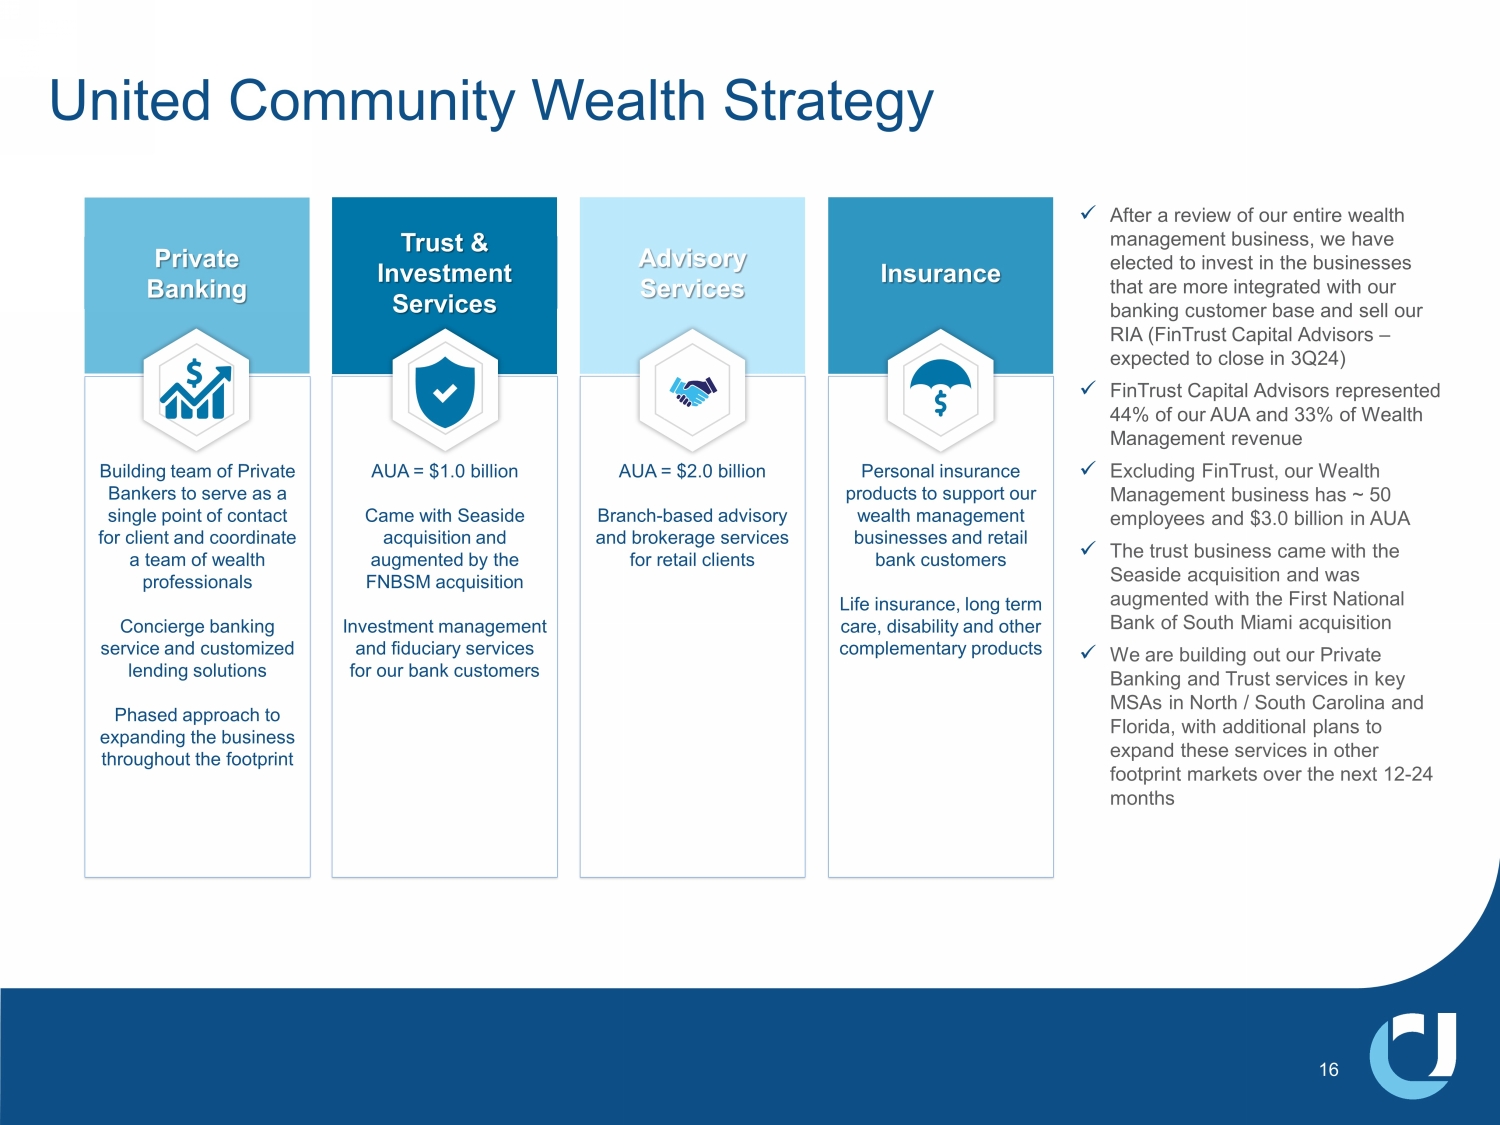
Chairman and CEO Lynn Harton stated, “Our second quarter results showed solid improvement, driven by healthy net interest margin expansion and disciplined expense control. We achieved these results by remaining sharply focused on loan and deposit pricing even if that meant accepting slower growth in the near term. Compared with the first quarter, we saw decreases in both loans and deposits, yet our pricing discipline led to a $9.55 million increase in net interest income. We expect loan growth to be weaker in the near term as customers appear to be taking a conservative approach to economic and election uncertainty.” Harton continued, “On the strategic front, after an evaluation of our entire wealth management business, we made the decision to sell our investment in our Registered Investment Advisor, FinTrust Capital Advisors, LLC (FinTrust), while setting a more aggressive growth course for our Private Banking, Retail, and Trust businesses. We view the Private Banking, Retail and Trust as more attractive in the medium to long term, and decided to focus our Wealth resources in these businesses. We expect the FinTrust transaction to close in the third quarter.”
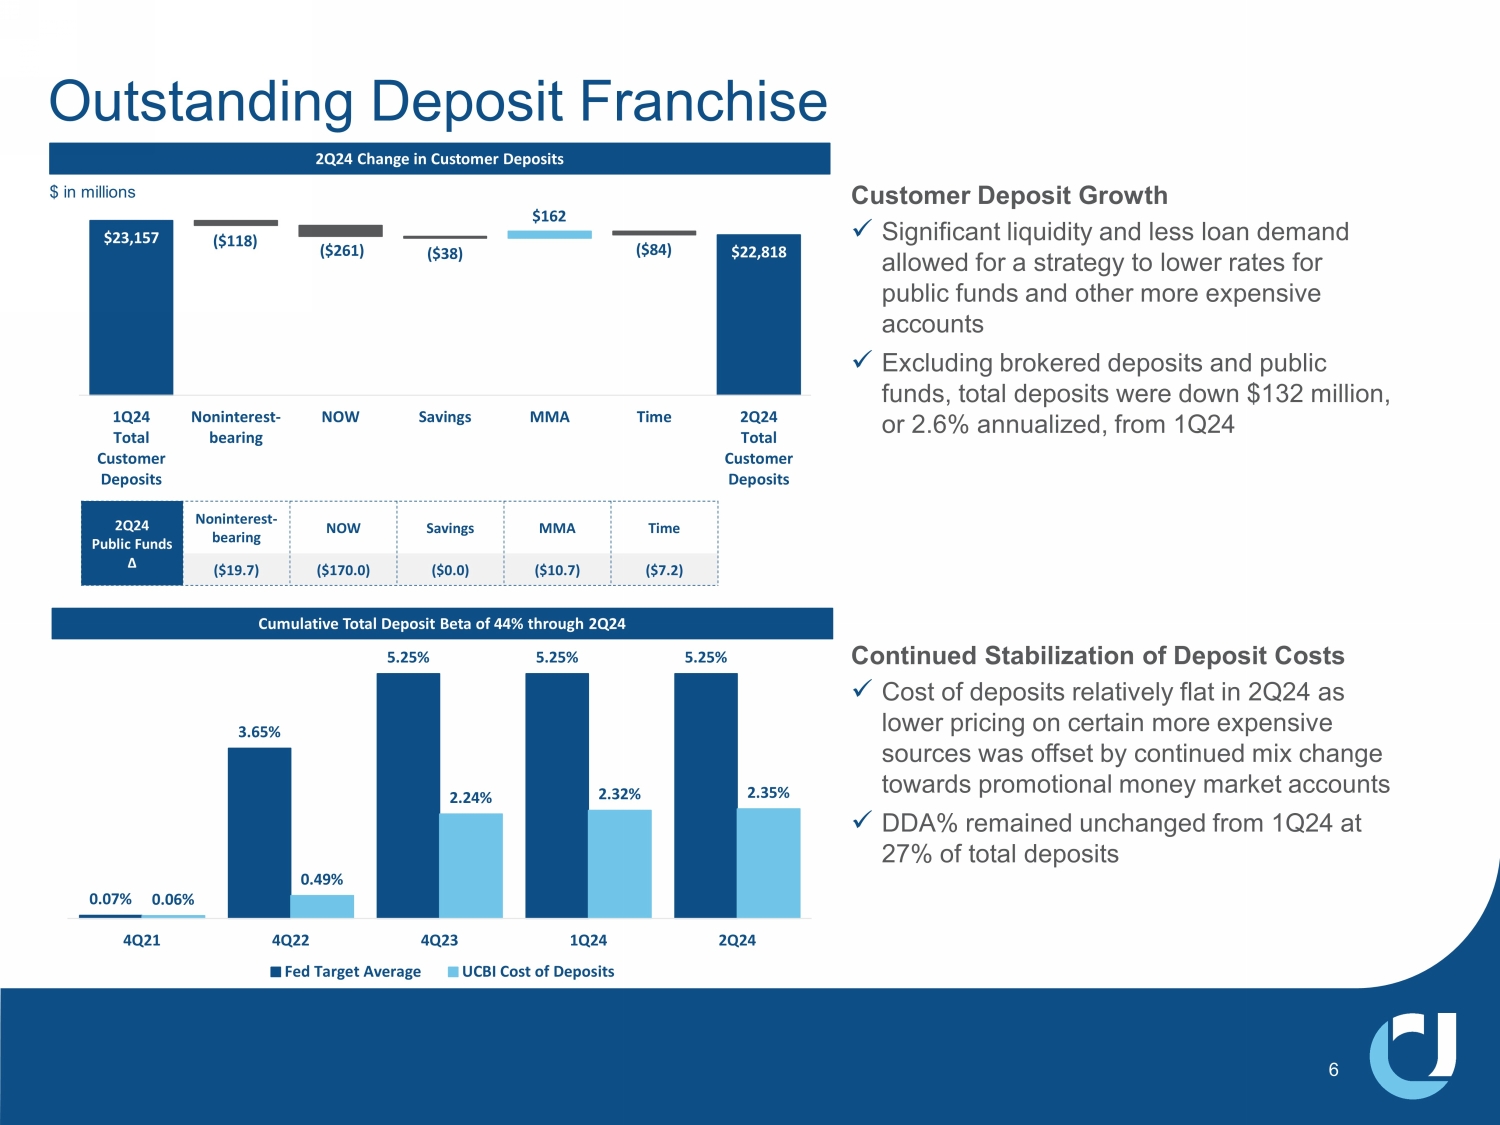
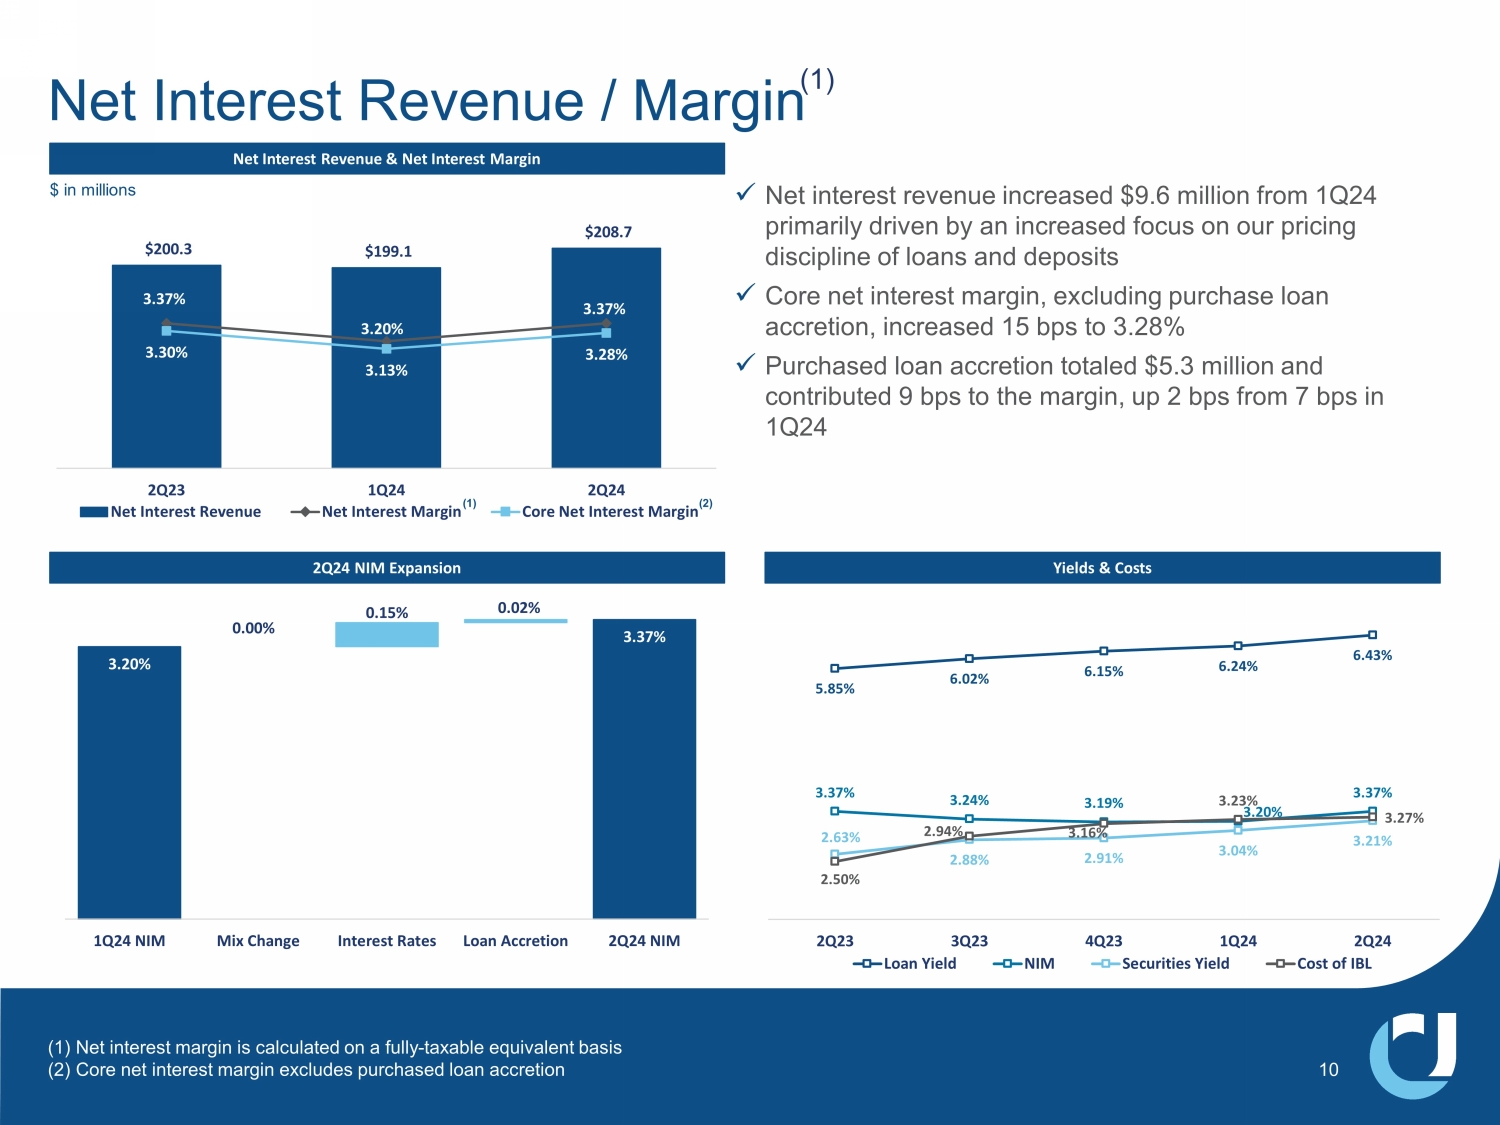
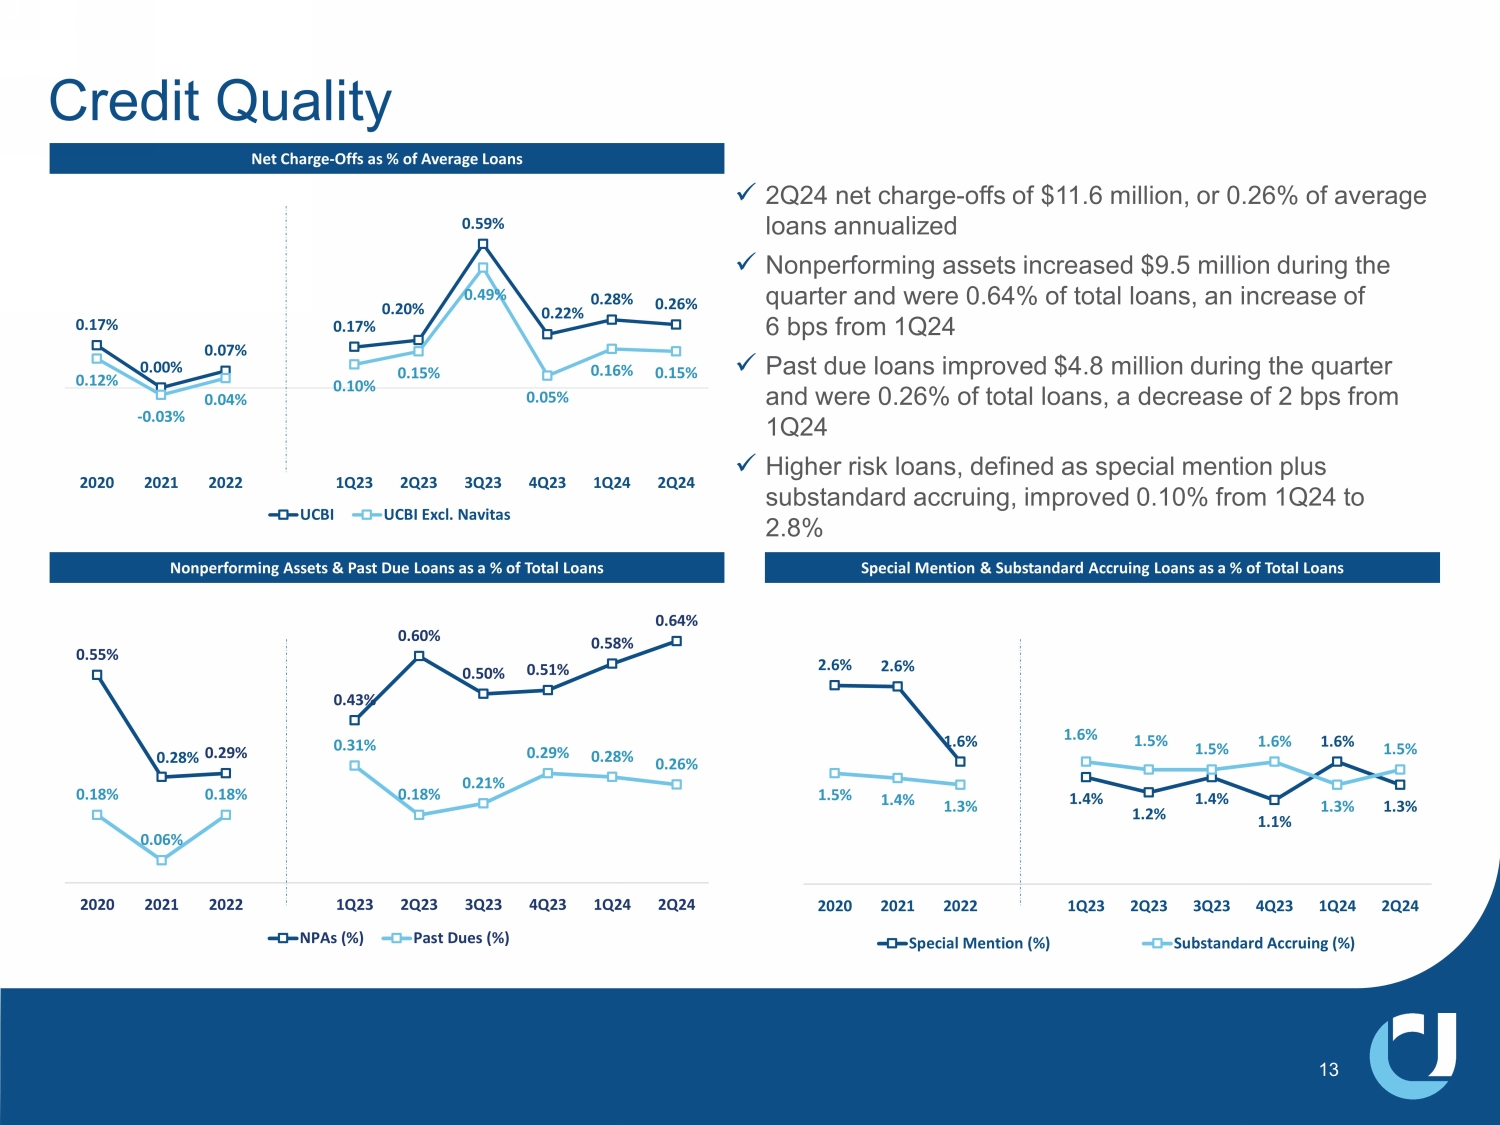
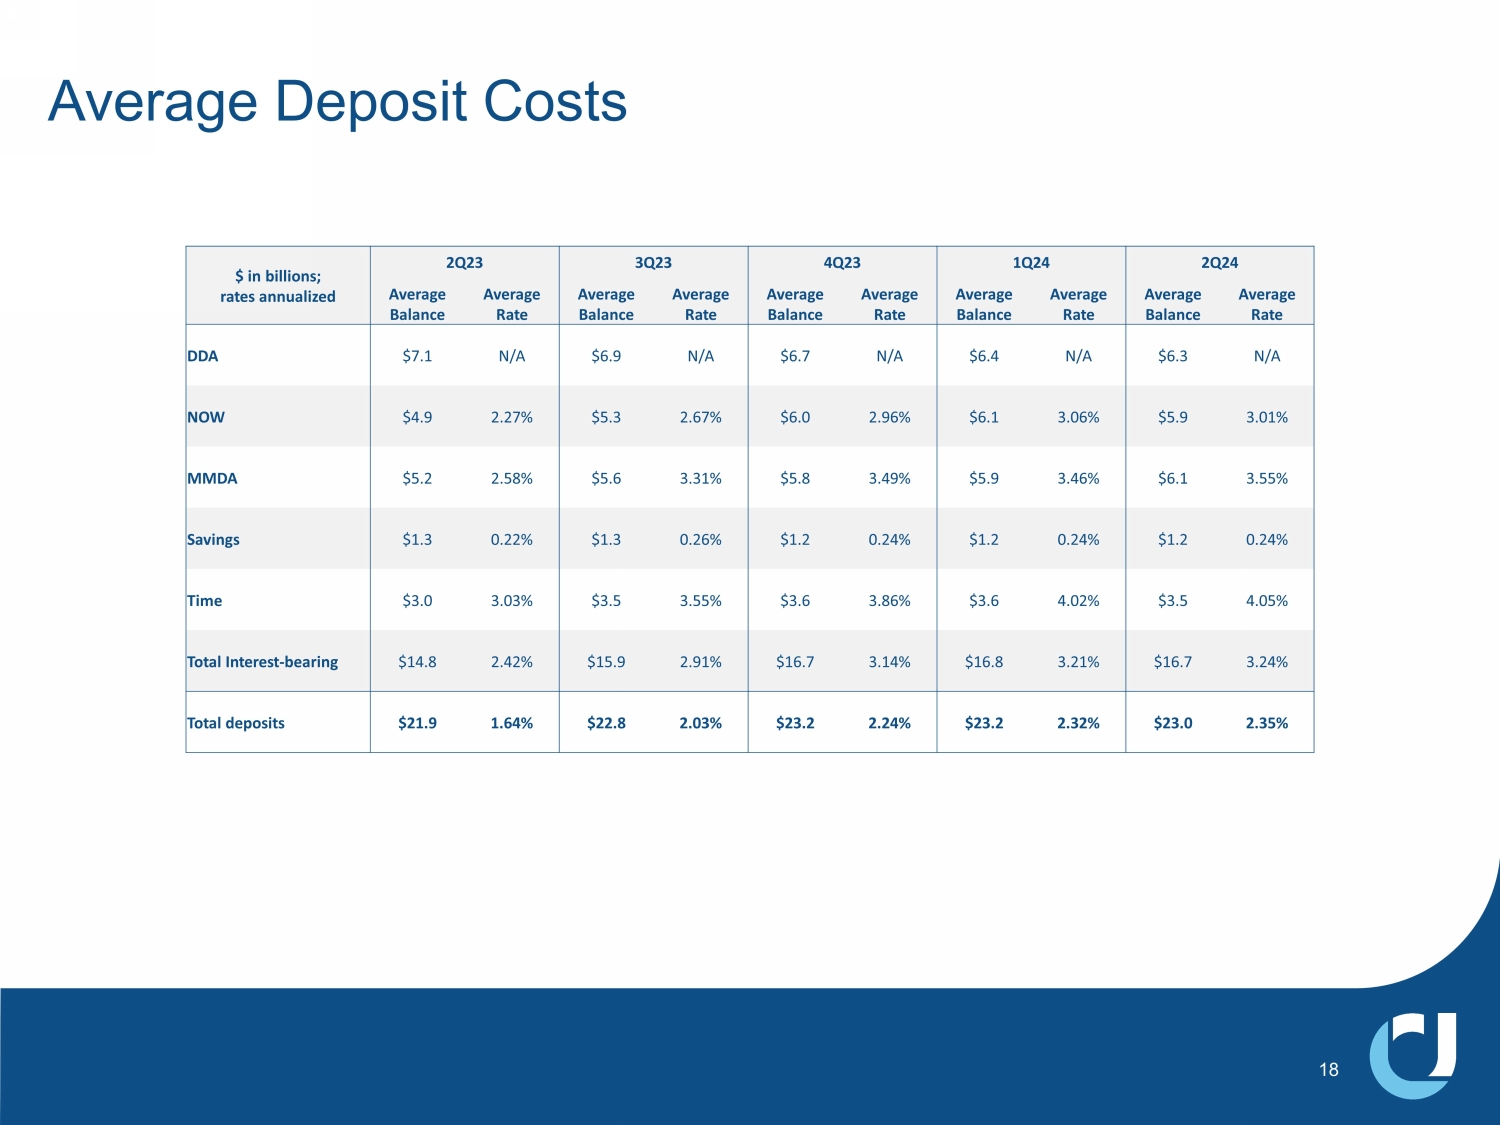
United’s net interest margin increased by 17 basis points to 3.37% from the first quarter. The average yield on United’s interest-earning assets was up 20 basis points to 5.59%, while its cost of deposits increased only three basis points to 2.35%, leading to expansion in the net interest margin. Net charge-offs were $11.6 million or 0.26% of average loans during the quarter, down two basis points compared to the first quarter of 2024, and NPAs were 43 basis points relative to total assets, up four basis points from the previous quarter.
Mr. Harton concluded, “Our second quarter results give me tremendous confidence that 2024 will be a great year for United. We remain focused on being a great partner for our clients and communities; growing our business and remaining disciplined in the face of any challenges that lie ahead. We are steadfast in our commitment to service as well as delivering exceptional value to our shareholders.”
Second Quarter 2024 Financial Highlights:
| · | Net income of $66.6 million and pre-tax, pre-provision income of $98.2 million |
| · | EPS up 2% compared to second quarter 2023 on a GAAP basis and up 5% on an operating basis; compared to first quarter 2024, EPS up 6% on a GAAP basis and 12% on an operating basis |
| · | Return on assets of 0.97%, or 1.04% on an operating basis |
| · | Pre-tax, pre-provision return on assets of 1.54% on an operating basis |
| · | Return on common equity of 7.53% |
| · | Return on tangible common equity of 11.68% on an operating basis |
| · | A provision for credit losses of $12.2 million, which increased the allowance for credit losses-loans to 1.17% of loans from 1.15% in the first quarter. |
| · | Loan production of $989 million, up from $881 million in the first quarter |
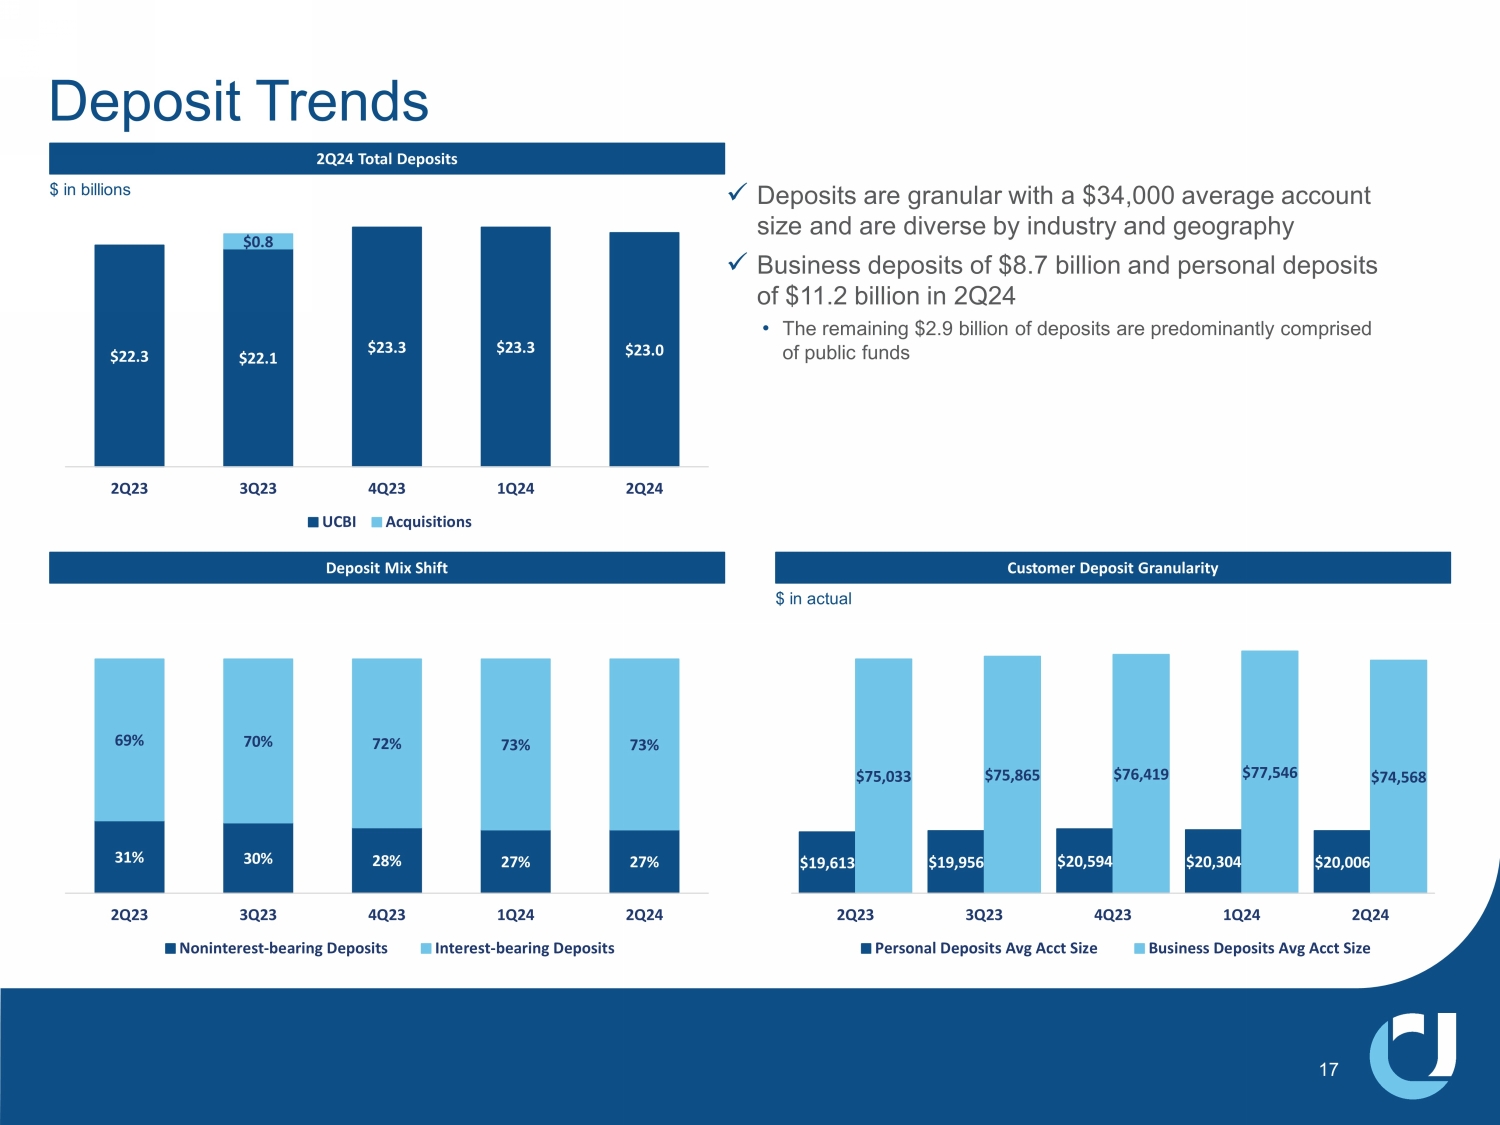
| · | Customer deposits were down $339 million for the quarter, as seasonal public funds deposit outflow combined with more conservative public funds deposit pricing |
| · | Net interest margin of 3.37% increased by 17 basis points from the first quarter mostly due to focus on pricing discipline on loans and deposits |
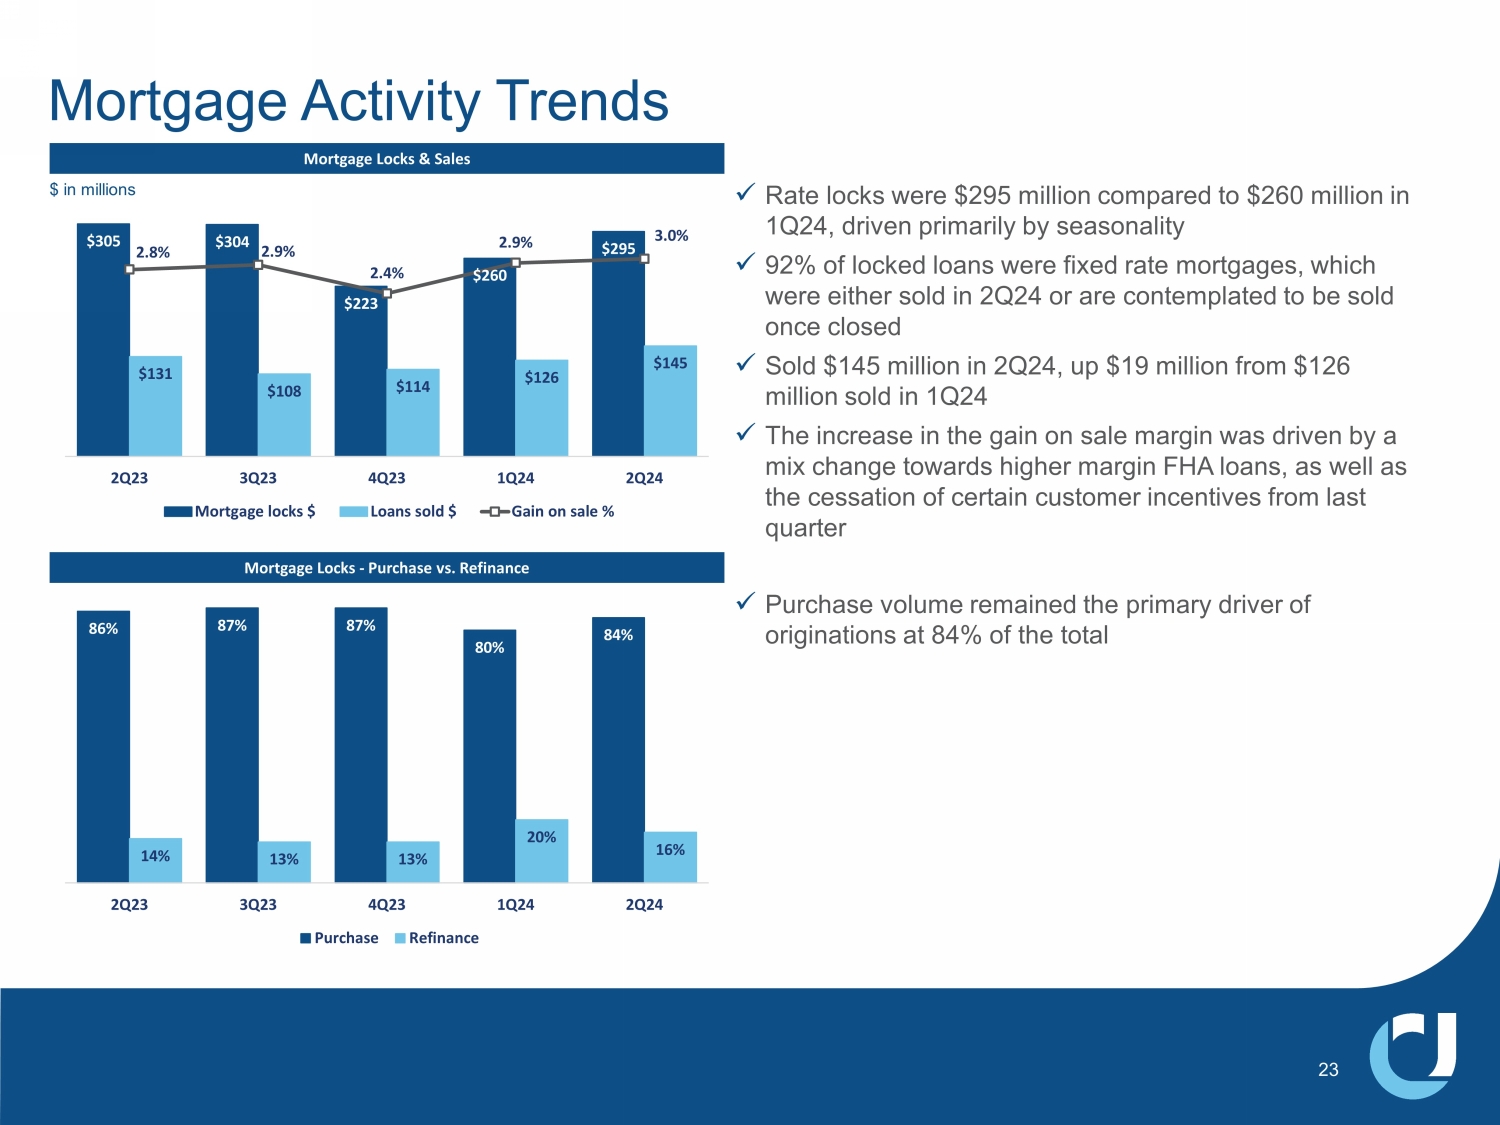
| · | Mortgage closings of $215 million compared to $263 million a year ago; mortgage rate locks of $295 million compared to $305 million a year ago |
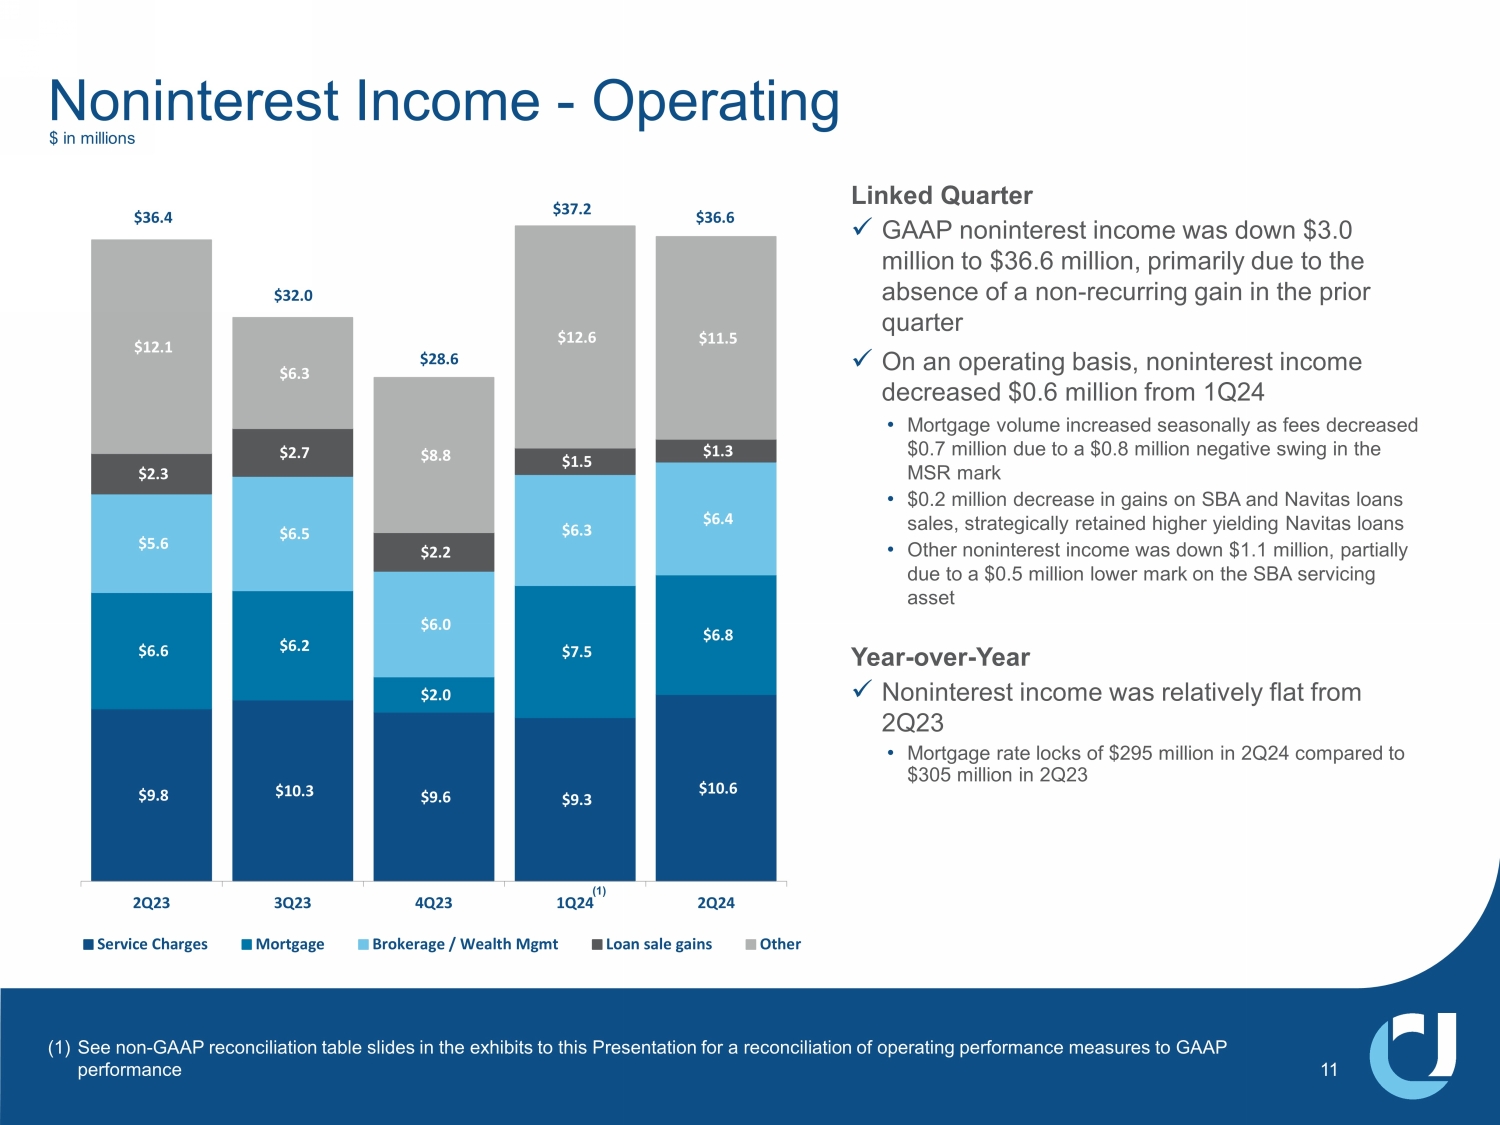
| · | Noninterest income was down $3.0 million on a linked quarter basis, primarily driven by the absence of a $2.4 million gain in the first quarter from terminating an office space lease |
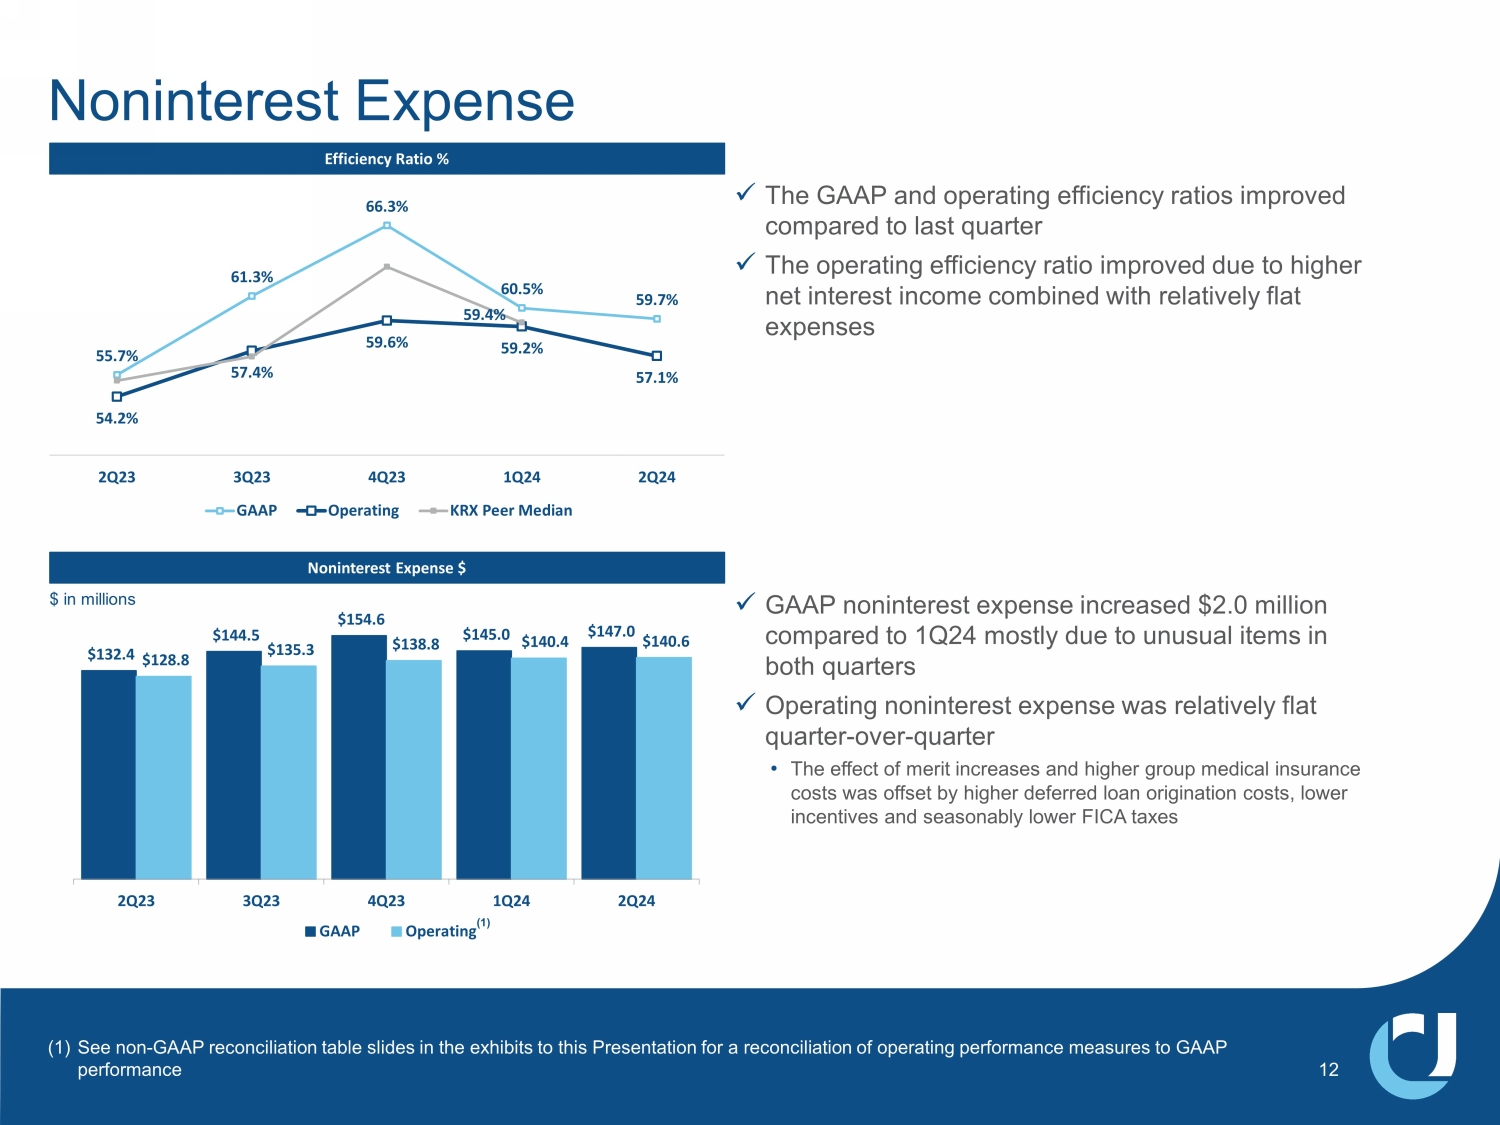
| · | Noninterest expenses increased by $2.0 million compared to the first quarter on a GAAP basis and were flat on an operating basis |
| · | Efficiency ratio of 59.7%, or 57.1% on an operating basis |
| · | Net charge-offs of $11.6 million, or 26 basis points as a percent of average loans, down 2 basis points from the net charge-offs level experienced in the first quarter |
| · | Nonperforming assets of 0.43% of total assets, up four basis points compared to March 31, 2024 |
| · | Quarterly common shareholder dividend of $0.23 per share declared during the quarter, unchanged year-over-year |
| · | We reached an agreement to sell FinTrust and recognized a $5.1 million loss related to the sale in the form of a goodwill impairment charge. The transaction is expected to close in the third quarter. |
Conference Call
United will hold a conference call on Wednesday, July 24, 2024 at 11 a.m. ET to discuss the contents of this press release and to share business highlights for the quarter. Participants can pre-register for the conference call by navigating to https://dpregister.com/sreg/10190532/fcfa86e478. Those without internet access or unable to pre-register may dial in by calling 1-866-777-2509. Participants are encouraged to dial in 15 minutes prior to the call start time. The conference call also will be webcast and can be accessed by selecting “Events and Presentations” under “News and Events” within the Investor Relations section of the company's website, www.ucbi.com.
| UNITED COMMUNITY BANKS, INC. | ||||||||||||||||||
| Selected Financial Information | ||||||||||||||||||
| (in thousands, except per share data) |
| 2024 | 2023 | Second
Quarter 2024 - |
For
the Six Months Ended June 30, |
YTD 2024 - |
|||||||||||||||||||||||
| Second
Quarter |
First
Quarter |
Fourth
Quarter |
Third
Quarter |
Second
Quarter |
2023
Change |
2024 | 2023 | 2023
Change |
|||||||||||||||||||
| INCOME SUMMARY | |||||||||||||||||||||||||||
| Interest revenue | $ | 346,965 | $ | 336,728 | $ | 338,698 | $ | 323,147 | $ | 295,775 | $ | 683,693 | $ | 575,262 | |||||||||||||
| Interest expense | 138,265 | 137,579 | 135,245 | 120,591 | 95,489 | 275,844 | 163,506 | ||||||||||||||||||||
| Net interest revenue | 208,700 | 199,149 | 203,453 | 202,556 | 200,286 | 4 | % | 407,849 | 411,756 | (1 | )% | ||||||||||||||||
| Provision for credit losses | 12,235 | 12,899 | 14,626 | 30,268 | 22,753 | 25,134 | 44,536 | ||||||||||||||||||||
| Noninterest income | 36,556 | 39,587 | (23,090 | ) | 31,977 | 36,387 | — | 76,143 | 66,596 | 14 | |||||||||||||||||
| Total revenue | 233,021 | 225,837 | 165,737 | 204,265 | 213,920 | 9 | 458,858 | 433,816 | 6 | ||||||||||||||||||
| Noninterest expenses | 147,044 | 145,002 | 154,587 | 144,474 | 132,407 | 11 | 292,046 | 272,212 | 7 | ||||||||||||||||||
| Income before income tax expense | 85,977 | 80,835 | 11,150 | 59,791 | 81,513 | 5 | 166,812 | 161,604 | 3 | ||||||||||||||||||
| Income tax expense | 19,362 | 18,204 | (2,940 | ) | 11,925 | 18,225 | 6 | 37,566 | 36,016 | 4 | |||||||||||||||||
| Net income | 66,615 | 62,631 | 14,090 | 47,866 | 63,288 | 5 | 129,246 | 125,588 | 3 | ||||||||||||||||||
| Non-operating items | 6,493 | 2,187 | 67,450 | 9,168 | 3,645 | 8,680 | 12,276 | ||||||||||||||||||||
| Income tax benefit of non-operating items | (1,462 | ) | (493 | ) | (16,714 | ) | (2,000 | ) | (820 | ) | (1,955 | ) | (2,775 | ) | |||||||||||||
| Net income - operating (1) | $ | 71,646 | $ | 64,325 | $ | 64,826 | $ | 55,034 | $ | 66,113 | 8 | $ | 135,971 | $ | 135,089 | 1 | |||||||||||
| Pre-tax pre-provision income (5) | $ | 98,212 | $ | 93,734 | $ | 25,776 | $ | 90,059 | $ | 104,266 | (6 | ) | $ | 191,946 | $ | 206,140 | (7 | ) | |||||||||
| PERFORMANCE MEASURES | |||||||||||||||||||||||||||
| Per common share: | |||||||||||||||||||||||||||
| Diluted net income - GAAP | $ | 0.54 | $ | 0.51 | $ | 0.11 | $ | 0.39 | $ | 0.53 | 2 | $ | 1.05 | $ | 1.05 | — | |||||||||||
| Diluted net income - operating (1) | 0.58 | 0.52 | 0.53 | 0.45 | 0.55 | 5 | 1.10 | 1.13 | (3 | ) | |||||||||||||||||
| Cash dividends declared | 0.23 | 0.23 | 0.23 | 0.23 | 0.23 | — | 0.46 | 0.46 | — | ||||||||||||||||||
| Book value | 27.18 | 26.83 | 26.52 | 25.87 | 25.98 | 5 | 27.18 | 25.98 | 5 | ||||||||||||||||||
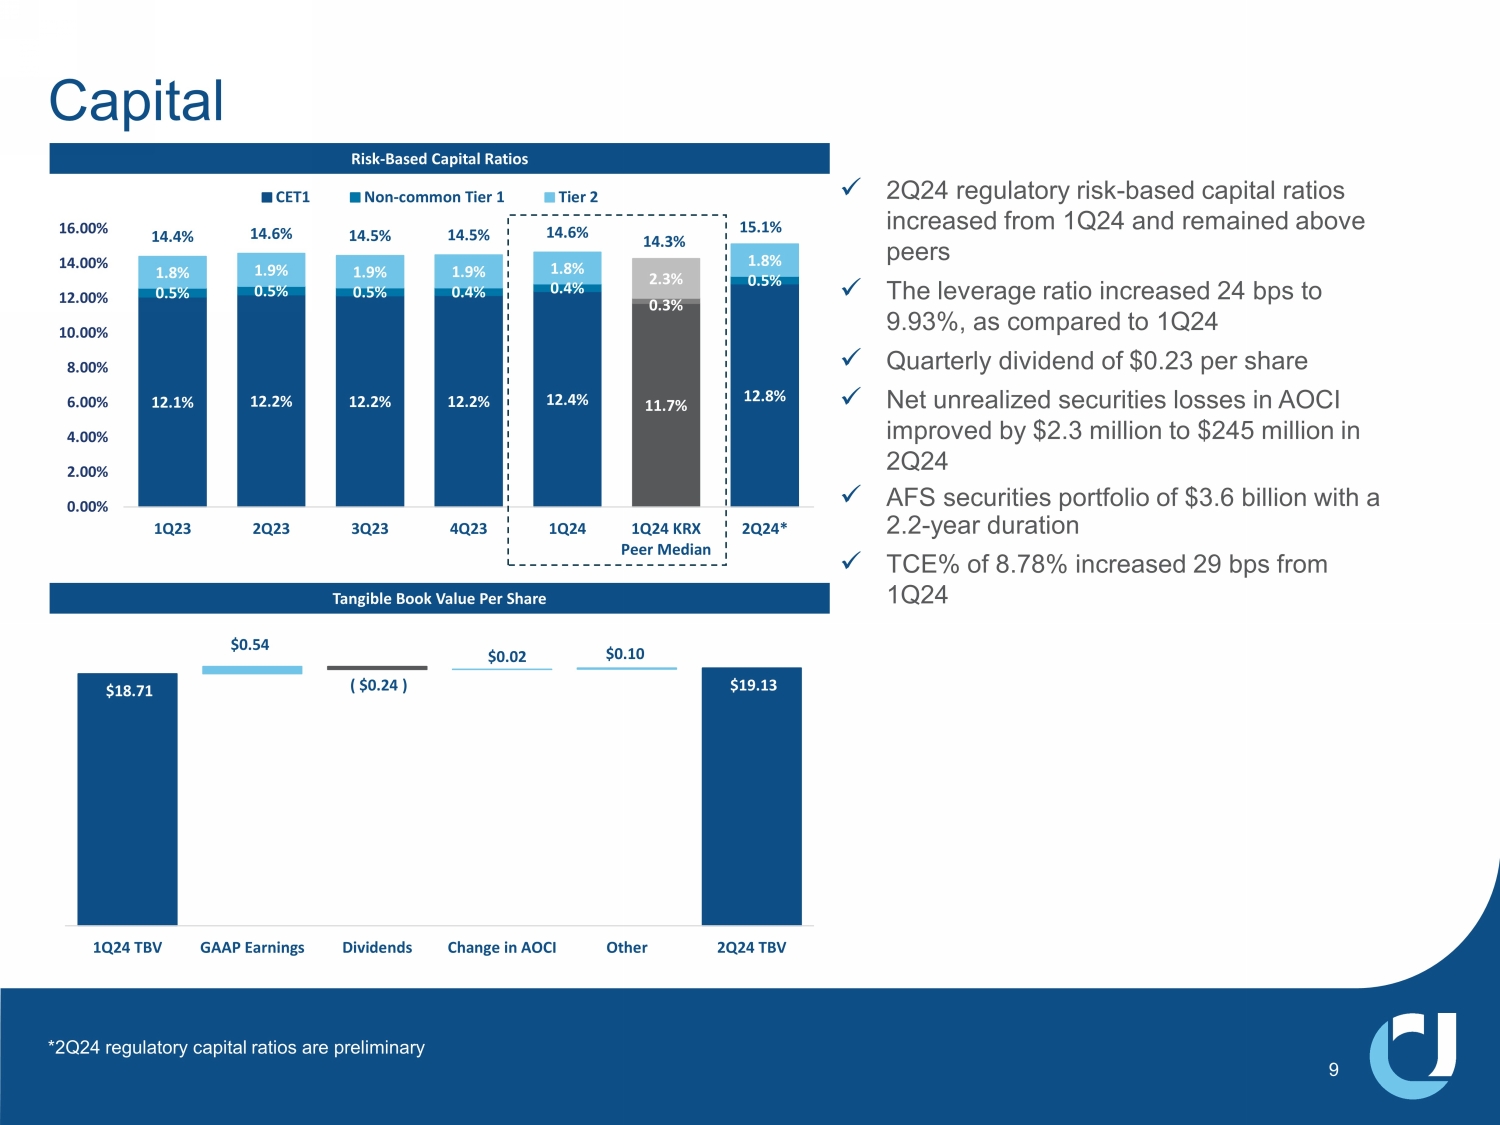
| Tangible book value (3) | 19.13 | 18.71 | 18.39 | 17.70 | 17.83 | 7 | 19.13 | 17.83 | 7 | ||||||||||||||||||
| Key performance ratios: | |||||||||||||||||||||||||||
| Return on common equity - GAAP (2)(4) | 7.53 | % | 7.14 | % | 1.44 | % | 5.32 | % | 7.47 | % | 7.34 | % | 7.41 | % | |||||||||||||
| Return on common equity - operating (1)(2)(4) | 8.12 | 7.34 | 7.27 | 6.14 | 7.82 | 7.73 | 7.98 | ||||||||||||||||||||
| Return on tangible common equity - operating (1)(2)(3)(4) | 11.68 | 10.68 | 10.58 | 9.03 | 11.35 | 11.18 | 11.49 | ||||||||||||||||||||
| Return on assets - GAAP (4) | 0.97 | 0.90 | 0.18 | 0.68 | 0.95 | 0.94 | 0.95 | ||||||||||||||||||||
| Return on assets - operating (1)(4) | 1.04 | 0.93 | 0.92 | 0.79 | 1.00 | 0.99 | 1.03 | ||||||||||||||||||||
| Return on assets - pre-tax pre-provision - operating(1)(4)(5) | 1.54 | 1.40 | 1.33 | 1.44 | 1.65 | 1.47 | 1.68 | ||||||||||||||||||||
| Net interest margin (fully taxable equivalent) (4) | 3.37 | 3.20 | 3.19 | 3.24 | 3.37 | 3.28 | 3.49 | ||||||||||||||||||||
| Efficiency ratio - GAAP | 59.70 | 60.47 | 66.33 | 61.32 | 55.71 | 60.08 | 56.46 | ||||||||||||||||||||
| Efficiency ratio - operating (1) | 57.06 | 59.15 | 59.57 | 57.43 | 54.17 | 58.08 | 53.92 | ||||||||||||||||||||
| Equity to total assets | 12.35 | 12.06 | 11.95 | 11.85 | 11.89 | 12.35 | 11.89 | ||||||||||||||||||||
| Tangible common equity to tangible assets (3) | 8.78 | 8.49 | 8.36 | 8.18 | 8.21 | 8.78 | 8.21 | ||||||||||||||||||||
| ASSET QUALITY | |||||||||||||||||||||||||||
| Nonperforming assets ("NPAs") | $ | 116,722 | $ | 107,230 | $ | 92,877 | $ | 90,883 | $ | 103,737 | 13 | $ | 116,722 | $ | 103,737 | 13 | |||||||||||
| Allowance for credit losses - loans | 213,022 | 210,934 | 208,071 | 201,557 | 190,705 | 12 | 213,022 | 190,705 | 12 | ||||||||||||||||||
| Allowance for credit losses - total | 224,740 | 224,119 | 224,128 | 219,624 | 212,277 | 6 | 224,740 | 212,277 | 6 | ||||||||||||||||||
| Net charge-offs | 11,614 | 12,908 | 10,122 | 26,638 | 8,399 | 24,522 | 15,483 | ||||||||||||||||||||
| Allowance for credit losses - loans to loans | 1.17 | % | 1.15 | % | 1.14 | % | 1.11 | % | 1.10 | % | 1.17 | % | 1.10 | % | |||||||||||||
| Allowance for credit losses - total to loans | 1.23 | 1.22 | 1.22 | 1.21 | 1.22 | 1.23 | 1.22 | ||||||||||||||||||||
| Net charge-offs to average loans (4) | 0.26 | 0.28 | 0.22 | 0.59 | 0.20 | 0.27 | 0.18 | ||||||||||||||||||||
| NPAs to total assets | 0.43 | 0.39 | 0.34 | 0.34 | 0.40 | 0.43 | 0.40 | ||||||||||||||||||||
| AT PERIOD END ($ in millions) | |||||||||||||||||||||||||||
| Loans | $ | 18,211 | $ | 18,375 | $ | 18,319 | $ | 18,203 | $ | 17,395 | 5 | $ | 18,211 | $ | 17,395 | 5 | |||||||||||
| Investment securities | 6,038 | 5,859 | 5,822 | 5,701 | 5,914 | 2 | 6,038 | 5,914 | 2 | ||||||||||||||||||
| Total assets | 27,057 | 27,365 | 27,297 | 26,869 | 26,120 | 4 | 27,057 | 26,120 | 4 | ||||||||||||||||||
| Deposits | 22,982 | 23,332 | 23,311 | 22,858 | 22,252 | 3 | 22,982 | 22,252 | 3 | ||||||||||||||||||
| Shareholders’ equity | 3,343 | 3,300 | 3,262 | 3,184 | 3,106 | 8 | 3,343 | 3,106 | 8 | ||||||||||||||||||
| Common shares outstanding (thousands) | 119,175 | 119,137 | 119,010 | 118,976 | 115,266 | 3 | 119,175 | 115,266 | 3 | ||||||||||||||||||
(1))Excludes non-operating items as detailed on Non-GAAP Performance Measures Reconciliation on next page. (2) Net income less preferred stock dividends, divided by average realized common equity, which excludes accumulated other comprehensive income (loss). (3) Excludes effect of acquisition related intangibles and associated amortization. (4) Annualized. (5) Excludes income tax expense and provision for credit losses.
| UNITED COMMUNITY BANKS, INC. | ||||||||||||||
| Non-GAAP Performance Measures Reconciliation | ||||||||||||||
| (in thousands, except per share data) | ||||||||||||||
| 2024 | 2023 | For the Six Months Ended June 30, |
||||||||||||||||||||||||||
| Second Quarter |
First Quarter |
Fourth Quarter |
Third Quarter |
Second Quarter |
2024 | 2023 | ||||||||||||||||||||||
| Noninterest expense reconciliation | ||||||||||||||||||||||||||||
| Noninterest expenses (GAAP) | $ | 147,044 | $ | 145,002 | $ | 154,587 | $ | 144,474 | $ | 132,407 | $ | 292,046 | $ | 272,212 | ||||||||||||||
| Loss on FinTrust (goodwill impairment) | (5,100 | ) | — | — | — | — | (5,100 | ) | — | |||||||||||||||||||
| FDIC special assessment | 764 | (2,500 | ) | (9,995 | ) | — | — | (1,736 | ) | — | ||||||||||||||||||
| Merger-related and other charges | (2,157 | ) | (2,087 | ) | (5,766 | ) | (9,168 | ) | (3,645 | ) | (4,244 | ) | (12,276 | ) | ||||||||||||||
| Noninterest expenses - operating | $ | 140,551 | $ | 140,415 | $ | 138,826 | $ | 135,306 | $ | 128,762 | $ | 280,966 | $ | 259,936 | ||||||||||||||
| Net income to operating income reconciliation | ||||||||||||||||||||||||||||
| Net income (GAAP) | $ | 66,615 | $ | 62,631 | $ | 14,090 | $ | 47,866 | $ | 63,288 | $ | 129,246 | $ | 125,588 | ||||||||||||||
| Bond portfolio restructuring loss | — | — | 51,689 | — | — | — | — | |||||||||||||||||||||
| Gain on lease termination | — | (2,400 | ) | — | — | — | (2,400 | ) | — | |||||||||||||||||||
| Loss on FinTrust (goodwill impairment) | 5,100 | — | — | — | — | 5,100 | — | |||||||||||||||||||||
| FDIC special assessment | (764 | ) | 2,500 | 9,995 | — | — | 1,736 | — | ||||||||||||||||||||
| Merger-related and other charges | 2,157 | 2,087 | 5,766 | 9,168 | 3,645 | 4,244 | 12,276 | |||||||||||||||||||||
| Income tax benefit of non-operating items | (1,462 | ) | (493 | ) | (16,714 | ) | (2,000 | ) | (820 | ) | (1,955 | ) | (2,775 | ) | ||||||||||||||
| Net income - operating | $ | 71,646 | $ | 64,325 | $ | 64,826 | $ | 55,034 | $ | 66,113 | $ | 135,971 | $ | 135,089 | ||||||||||||||
| Net income to pre-tax pre-provision income reconciliation | ||||||||||||||||||||||||||||
| Net income (GAAP) | $ | 66,615 | $ | 62,631 | $ | 14,090 | $ | 47,866 | $ | 63,288 | $ | 129,246 | $ | 125,588 | ||||||||||||||
| Income tax expense | 19,362 | 18,204 | (2,940 | ) | 11,925 | 18,225 | 37,566 | 36,016 | ||||||||||||||||||||
| Provision for credit losses | 12,235 | 12,899 | 14,626 | 30,268 | 22,753 | 25,134 | 44,536 | |||||||||||||||||||||
| Pre-tax pre-provision income | $ | 98,212 | $ | 93,734 | $ | 25,776 | $ | 90,059 | $ | 104,266 | $ | 191,946 | $ | 206,140 | ||||||||||||||
| Diluted income per common share reconciliation | ||||||||||||||||||||||||||||
| Diluted income per common share (GAAP) | $ | 0.54 | $ | 0.51 | $ | 0.11 | $ | 0.39 | $ | 0.53 | $ | 1.05 | $ | 1.05 | ||||||||||||||
| Bond portfolio restructuring loss | — | — | 0.32 | — | — | — | — | |||||||||||||||||||||
| Gain on lease termination | — | (0.02 | ) | — | — | — | (0.02 | ) | — | |||||||||||||||||||
| Loss on FinTrust (goodwill impairment) | 0.03 | — | — | — | — | 0.03 | — | |||||||||||||||||||||
| FDIC special assessment | — | 0.02 | 0.06 | — | — | 0.02 | — | |||||||||||||||||||||
| Merger-related and other charges | 0.01 | 0.01 | 0.04 | 0.06 | 0.02 | 0.02 | 0.08 | |||||||||||||||||||||
| Diluted income per common share - operating | $ | 0.58 | $ | 0.52 | $ | 0.53 | $ | 0.45 | $ | 0.55 | $ | 1.10 | $ | 1.13 | ||||||||||||||
| Book value per common share reconciliation | ||||||||||||||||||||||||||||
| Book value per common share (GAAP) | $ | 27.18 | $ | 26.83 | $ | 26.52 | $ | 25.87 | $ | 25.98 | $ | 27.18 | $ | 25.98 | ||||||||||||||
| Effect of goodwill and other intangibles | (8.05 | ) | (8.12 | ) | (8.13 | ) | (8.17 | ) | (8.15 | ) | (8.05 | ) | (8.15 | ) | ||||||||||||||
| Tangible book value per common share | $ | 19.13 | $ | 18.71 | $ | 18.39 | $ | 17.70 | $ | 17.83 | $ | 19.13 | $ | 17.83 | ||||||||||||||
| Return on tangible common equity reconciliation | ||||||||||||||||||||||||||||
| Return on common equity (GAAP) | 7.53 | % | 7.14 | % | 1.44 | % | 5.32 | % | 7.47 | % | 7.34 | % | 7.41 | % | ||||||||||||||
| Bond portfolio restructuring loss | — | — | 4.47 | — | — | — | — | |||||||||||||||||||||
| Gain on lease termination | — | (0.22 | ) | — | — | — | (0.11 | ) | — | |||||||||||||||||||
| Loss on FinTrust (goodwill impairment) | 0.46 | — | — | — | — | 0.23 | — | |||||||||||||||||||||
| FDIC special assessment | (0.07 | ) | 0.23 | 0.86 | — | — | 0.08 | — | ||||||||||||||||||||
| Merger-related and other charges | 0.20 | 0.19 | 0.50 | 0.82 | 0.35 | 0.19 | 0.57 | |||||||||||||||||||||
| Return on common equity - operating | 8.12 | 7.34 | 7.27 | 6.14 | 7.82 | 7.73 | 7.98 | |||||||||||||||||||||
| Effect of goodwill and other intangibles | 3.56 | 3.34 | 3.31 | 2.89 | 3.53 | 3.45 | 3.51 | |||||||||||||||||||||
| Return on tangible common equity - operating | 11.68 | % | 10.68 | % | 10.58 | % | 9.03 | % | 11.35 | % | 11.18 | % | 11.49 | % | ||||||||||||||
| Return on assets reconciliation | ||||||||||||||||||||||||||||
| Return on assets (GAAP) | 0.97 | % | 0.90 | % | 0.18 | % | 0.68 | % | 0.95 | % | 0.94 | % | 0.95 | % | ||||||||||||||
| Bond portfolio restructuring loss | — | — | 0.57 | — | — | — | — | |||||||||||||||||||||
| Gain on lease termination | — | (0.03 | ) | — | — | — | (0.01 | ) | — | |||||||||||||||||||
| Loss on FinTrust (goodwill impairment) | 0.06 | — | — | — | — | 0.03 | — | |||||||||||||||||||||
| FDIC special assessment | (0.01 | ) | 0.03 | 0.11 | — | — | 0.01 | — | ||||||||||||||||||||
| Merger-related and other charges | 0.02 | 0.03 | 0.06 | 0.11 | 0.05 | 0.02 | 0.08 | |||||||||||||||||||||
| Return on assets - operating | 1.04 | % | 0.93 | % | 0.92 | % | 0.79 | % | 1.00 | % | 0.99 | % | 1.03 | % | ||||||||||||||
| Return on assets to return on assets- pre-tax pre-provision reconciliation | ||||||||||||||||||||||||||||
| Return on assets (GAAP) | 0.97 | % | 0.90 | % | 0.18 | % | 0.68 | % | 0.95 | % | 0.94 | % | 0.95 | % | ||||||||||||||
| Income tax (benefit) expense | 0.29 | 0.27 | (0.04 | ) | 0.18 | 0.29 | 0.28 | 0.28 | ||||||||||||||||||||
| Provision for credit losses | 0.18 | 0.19 | 0.21 | 0.45 | 0.35 | 0.19 | 0.35 | |||||||||||||||||||||
| Bond portfolio restructuring loss | — | — | 0.75 | — | — | — | — | |||||||||||||||||||||
| Gain on lease termination | — | (0.04 | ) | — | — | — | (0.02 | ) | — | |||||||||||||||||||
| Loss on FinTrust (goodwill impairment) | 0.08 | — | — | — | — | 0.04 | — | |||||||||||||||||||||
| FDIC special assessment | (0.01 | ) | 0.04 | 0.15 | — | — | 0.01 | — | ||||||||||||||||||||
| Merger-related and other charges | 0.03 | 0.04 | 0.08 | 0.13 | 0.06 | 0.03 | 0.10 | |||||||||||||||||||||
| Return on assets - pre-tax pre-provision - operating | 1.54 | % | 1.40 | % | 1.33 | % | 1.44 | % | 1.65 | % | 1.47 | % | 1.68 | % | ||||||||||||||
| Efficiency ratio reconciliation | ||||||||||||||||||||||||||||
| Efficiency ratio (GAAP) | 59.70 | % | 60.47 | % | 66.33 | % | 61.32 | % | 55.71 | % | 60.08 | % | 56.46 | % | ||||||||||||||
| Gain on lease termination | — | 0.60 | — | — | — | 0.29 | — | |||||||||||||||||||||
| Loss on FinTrust (goodwill impairment) | (2.07 | ) | — | — | — | — | (1.05 | ) | — | |||||||||||||||||||
| FDIC special assessment | 0.31 | (1.05 | ) | (4.29 | ) | — | — | (0.36 | ) | — | ||||||||||||||||||
| Merger-related and other charges | (0.88 | ) | (0.87 | ) | (2.47 | ) | (3.89 | ) | (1.54 | ) | (0.88 | ) | (2.54 | ) | ||||||||||||||
| Efficiency ratio - operating | 57.06 | % | 59.15 | % | 59.57 | % | 57.43 | % | 54.17 | % | 58.08 | % | 53.92 | % | ||||||||||||||
| Tangible common equity to tangible assets reconciliation | ||||||||||||||||||||||||||||
| Equity to total assets (GAAP) | 12.35 | % | 12.06 | % | 11.95 | % | 11.85 | % | 11.89 | % | 12.35 | % | 11.89 | % | ||||||||||||||
| Effect of goodwill and other intangibles | (3.24 | ) | (3.25 | ) | (3.27 | ) | (3.33 | ) | (3.31 | ) | (3.24 | ) | (3.31 | ) | ||||||||||||||
| Effect of preferred equity | (0.33 | ) | (0.32 | ) | (0.32 | ) | (0.34 | ) | (0.37 | ) | (0.33 | ) | (0.37 | ) | ||||||||||||||
| Tangible common equity to tangible assets | 8.78 | % | 8.49 | % | 8.36 | % | 8.18 | % | 8.21 | % | 8.78 | % | 8.21 | % | ||||||||||||||
| UNITED COMMUNITY BANKS, INC. | ||||||||||||
| Financial Highlights | ||||||||||||
| Loan Portfolio Composition at Period-End |
| 2024 | 2023 | Linked | Year over | |||||||||||||||||||||||||
| (in millions) | Second Quarter | First Quarter |
Fourth Quarter |
Third Quarter |
Second Quarter |
Quarter Change |
Year Change |
|||||||||||||||||||||
| LOANS BY CATEGORY | ||||||||||||||||||||||||||||
| Owner occupied commercial RE | $ | 3,297 | $ | 3,310 | $ | 3,264 | $ | 3,279 | $ | 3,111 | $ | (13 | ) | $ | 186 | |||||||||||||
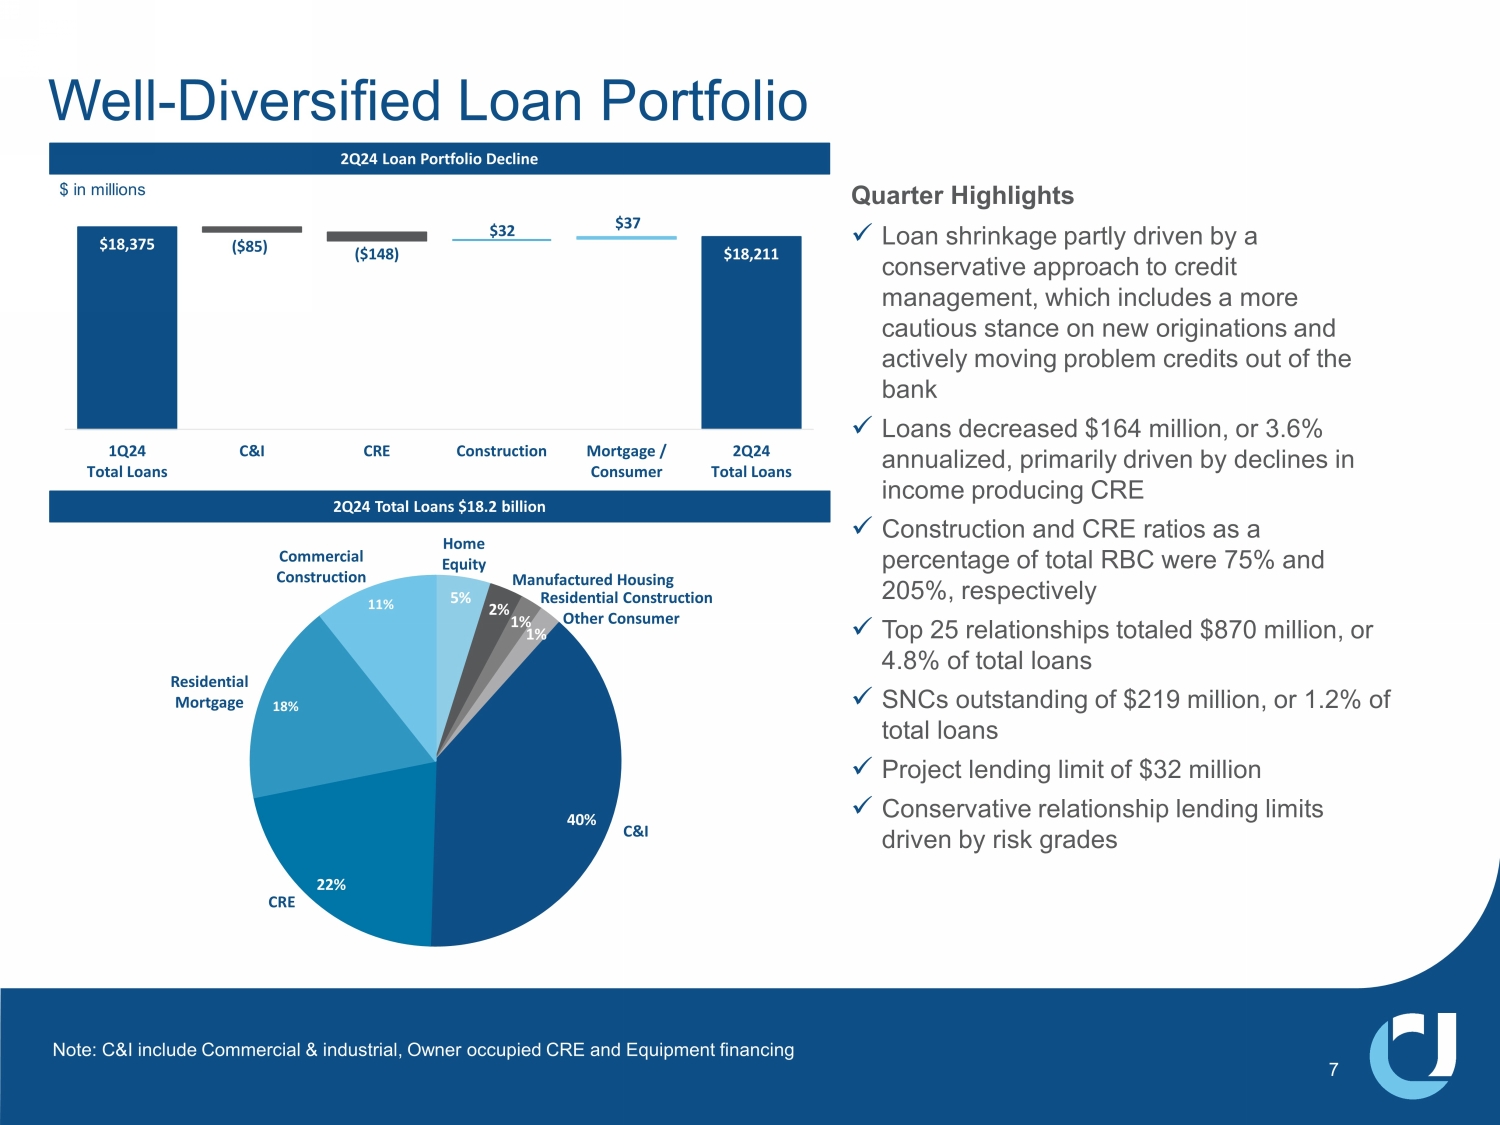
| Income producing commercial RE | 4,058 | 4,206 | 4,264 | 4,130 | 3,670 | (148 | ) | 388 | ||||||||||||||||||||
| Commercial & industrial | 2,299 | 2,405 | 2,411 | 2,504 | 2,550 | (106 | ) | (251 | ) | |||||||||||||||||||
| Commercial construction | 2,014 | 1,936 | 1,860 | 1,850 | 1,739 | 78 | 275 | |||||||||||||||||||||
| Equipment financing | 1,581 | 1,544 | 1,541 | 1,534 | 1,510 | 37 | 71 | |||||||||||||||||||||
| Total commercial | 13,249 | 13,401 | 13,340 | 13,297 | 12,580 | (152 | ) | 669 | ||||||||||||||||||||
| Residential mortgage | 3,266 | 3,240 | 3,199 | 3,043 | 2,905 | 26 | 361 | |||||||||||||||||||||
| Home equity | 985 | 969 | 959 | 941 | 927 | 16 | 58 | |||||||||||||||||||||
| Residential construction | 211 | 257 | 302 | 399 | 463 | (46 | ) | (252 | ) | |||||||||||||||||||
| Manufactured housing | 321 | 328 | 336 | 343 | 340 | (7 | ) | (19 | ) | |||||||||||||||||||
| Consumer | 183 | 180 | 181 | 180 | 180 | 3 | 3 | |||||||||||||||||||||
| Fair value hedge basis adjustment | (4 | ) | — | 2 | — | — | (4 | ) | (4 | ) | ||||||||||||||||||
| Total loans | $ | 18,211 | $ | 18,375 | $ | 18,319 | $ | 18,203 | $ | 17,395 | $ | (164 | ) | $ | 816 | |||||||||||||
| LOANS BY MARKET | ||||||||||||||||||||||||||||
| Georgia | $ | 4,411 | $ | 4,356 | $ | 4,357 | $ | 4,321 | $ | 4,281 | $ | 55 | $ | 130 | ||||||||||||||
| South Carolina | 2,779 | 2,804 | 2,780 | 2,801 | 2,750 | (25 | ) | 29 | ||||||||||||||||||||
| North Carolina | 2,591 | 2,566 | 2,492 | 2,445 | 2,355 | 25 | 236 | |||||||||||||||||||||
| Tennessee | 2,144 | 2,209 | 2,244 | 2,314 | 2,387 | (65 | ) | (243 | ) | |||||||||||||||||||
| Florida | 2,407 | 2,443 | 2,442 | 2,318 | 1,708 | (36 | ) | 699 | ||||||||||||||||||||
| Alabama | 1,021 | 1,068 | 1,082 | 1,070 | 1,062 | (47 | ) | (41 | ) | |||||||||||||||||||
| Commercial Banking Solutions | 2,858 | 2,929 | 2,922 | 2,934 | 2,852 | (71 | ) | 6 | ||||||||||||||||||||
| Total loans | $ | 18,211 | $ | 18,375 | $ | 18,319 | $ | 18,203 | $ | 17,395 | $ | (164 | ) | $ | 816 | |||||||||||||
| UNITED COMMUNITY BANKS, INC. | ||||||||||||
| Financial Highlights | ||||||||||||
| Credit Quality | ||||||||||||
| (in thousands) |
| 2024 | 2023 | ||||||||||||
|
Second Quarter |
First Quarter |
Fourth Quarter |
|||||||||||
| NONACCRUAL LOANS | |||||||||||||
| Owner occupied RE | $ | 4,820 | $ | 2,310 | $ | 3,094 | |||||||
| Income producing RE | 34,285 | 29,186 | 30,128 | ||||||||||
| Commercial & industrial | 17,335 | 20,134 | 13,467 | ||||||||||
| Commercial construction | 6,854 | 1,862 | 1,878 | ||||||||||
| Equipment financing | 8,341 | 8,829 | 8,505 | ||||||||||
| Total commercial | 71,635 | 62,321 | 57,072 | ||||||||||
| Residential mortgage | 18,473 | 16,569 | 13,944 | ||||||||||
| Home equity | 3,779 | 4,984 | 3,772 | ||||||||||
| Residential construction | 163 | 1,244 | 944 | ||||||||||
| Manufactured housing | 20,356 | 19,797 | 15,861 | ||||||||||
| Consumer | 72 | 54 | 94 | ||||||||||
| Total nonaccrual loans | 114,478 | 104,969 | 91,687 | ||||||||||
| OREO and repossessed assets | 2,244 | 2,261 | 1,190 | ||||||||||
| Total NPAs | $ | 116,722 | $ | 107,230 | $ | 92,877 | |||||||
| 2024 | 2023 | |||||||||||||||||||||||
| Second Quarter | First Quarter | Fourth Quarter | ||||||||||||||||||||||
| (in thousands) | Net Charge -Offs |
Net Charge- Offs to Average Loans (1) |
Net Charge- Offs |
Net Charge- Offs to Average Loans (1) |
Net Charge- Offs |
Net Charge- Offs to Average Loans (1) |
||||||||||||||||||
| NET CHARGE-OFFS (RECOVERIES) BY CATEGORY | ||||||||||||||||||||||||
| Owner occupied RE | $ | 163 | 0.02 | % | $ | 202 | 0.02 | % | $ | 35 | — | % | ||||||||||||
| Income producing RE | 2,968 | 0.29 | 205 | 0.02 | (562 | ) | (0.05 | ) | ||||||||||||||||
| Commercial & industrial | 1,281 | 0.22 | 3,906 | 0.65 | 547 | 0.09 | ||||||||||||||||||
| Commercial construction | (48 | ) | (0.01 | ) | 20 | — | 33 | 0.01 | ||||||||||||||||
| Equipment financing | 5,502 | 1.42 | 6,362 | 1.66 | 7,926 | 2.05 | ||||||||||||||||||
| Total commercial | 9,866 | 0.30 | 10,695 | 0.32 | 7,979 | 0.24 | ||||||||||||||||||
| Residential mortgage | (107 | ) | (0.01 | ) | (16 | ) | — | 12 | — | |||||||||||||||
| Home equity | (27 | ) | (0.01 | ) | (54 | ) | (0.02 | ) | (68 | ) | (0.03 | ) | ||||||||||||
| Residential construction | 26 | 0.04 | 119 | 0.17 | (13 | ) | (0.01 | ) | ||||||||||||||||
| Manufactured housing | 1,150 | 1.43 | 1,569 | 1.90 | 1,444 | 1.69 | ||||||||||||||||||
| Consumer | 706 | 1.57 | 595 | 1.33 | 768 | 1.70 | ||||||||||||||||||
| Total | $ | 11,614 | 0.26 | $ | 12,908 | 0.28 | $ | 10,122 | 0.22 | |||||||||||||||
(1) Annualized.
| UNITED COMMUNITY BANKS, INC. |
| Consolidated Balance Sheets (Unaudited) |
| (in thousands, except share and per share data) | June 30, 2024 |
December 31, 2023 |
||||||
| ASSETS | ||||||||
| Cash and due from banks | $ | 198,234 | $ | 200,781 | ||||
| Interest-bearing deposits in banks | 364,629 | 803,094 | ||||||
| Cash and cash equivalents | 562,863 | 1,003,875 | ||||||
| Debt securities available-for-sale | 3,604,769 | 3,331,084 | ||||||
| Debt securities held-to-maturity (fair value $2,004,427 and $2,095,620, respectively) | 2,432,941 | 2,490,848 | ||||||
| Loans held for sale | 49,315 | 33,008 | ||||||
| Loans and leases held for investment | 18,211,193 | 18,318,755 | ||||||
| Allowance for credit losses - loans and leases | (213,022 | ) | (208,071 | ) | ||||
| Loans and leases, net | 17,998,171 | 18,110,684 | ||||||
| Premises and equipment, net | 395,202 | 378,421 | ||||||
| Bank owned life insurance | 344,162 | 345,371 | ||||||
| Goodwill and other intangible assets, net | 978,645 | 990,087 | ||||||
| Other assets | 691,133 | 613,873 | ||||||
| Total assets | $ | 27,057,201 | $ | 27,297,251 | ||||
| LIABILITIES AND SHAREHOLDERS' EQUITY | ||||||||
| Liabilities: | ||||||||
| Deposits: | ||||||||
| Noninterest-bearing demand | $ | 6,291,124 | $ | 6,534,307 | ||||
| NOW and interest-bearing demand | 5,794,085 | 6,155,193 | ||||||
| Money market | 6,077,129 | 5,600,587 | ||||||
| Savings | 1,144,696 | 1,207,807 | ||||||
| Time | 3,510,917 | 3,649,498 | ||||||
| Brokered | 164,171 | 163,219 | ||||||
| Total deposits | 22,982,122 | 23,310,611 | ||||||
| Long-term debt | 324,887 | 324,823 | ||||||
| Accrued expenses and other liabilities | 407,559 | 400,292 | ||||||
| Total liabilities | 23,714,568 | 24,035,726 | ||||||
| Shareholders' equity: | ||||||||
| Preferred stock; $1 par value; 10,000,000 shares authorized; 3,662 shares Series I issued and outstanding; $25,000 per share liquidation preference |
88,266 | 88,266 | ||||||
| Common stock, $1 par value; 200,000,000 shares authorized, 119,174,803 and 119,010,319 shares issued and outstanding, respectively |
119,175 | 119,010 | ||||||
| Common stock issuable; 568,985 and 620,108 shares, respectively | 12,145 | 13,110 | ||||||
| Capital surplus | 2,705,345 | 2,699,112 | ||||||
| Retained earnings | 652,239 | 581,219 | ||||||
| Accumulated other comprehensive loss | (234,537 | ) | (239,192 | ) | ||||
| Total shareholders' equity | 3,342,633 | 3,261,525 | ||||||
| Total liabilities and shareholders' equity | $ | 27,057,201 | $ | 27,297,251 | ||||
| UNITED COMMUNITY BANKS, INC. |
| Consolidated Statements of Income (Unaudited) |
|
Three Months Ended June 30, |
Six Months Ended June 30, |
|||||||||||||||
| (in thousands, except per share data) | 2024 | 2023 | 2024 | 2023 | ||||||||||||
| Interest revenue: | ||||||||||||||||
| Loans, including fees | $ | 291,595 | $ | 250,484 | $ | 575,578 | $ | 486,915 | ||||||||
| Investment securities, including tax exempt of $1,699, $1,731, $3,420 and $3,841, respectively | 50,063 | 41,060 | 96,499 | 81,046 | ||||||||||||
| Deposits in banks and short-term investments | 5,307 | 4,231 | 11,616 | 7,301 | ||||||||||||
| Total interest revenue | 346,965 | 295,775 | 683,693 | 575,262 | ||||||||||||
| Interest expense: | ||||||||||||||||
| Deposits: | ||||||||||||||||
| NOW and interest-bearing demand | 43,910 | 27,597 | 90,121 | 45,196 | ||||||||||||
| Money market | 53,531 | 33,480 | 104,009 | 58,546 | ||||||||||||
| Savings | 687 | 702 | 1,393 | 1,240 | ||||||||||||
| Time | 36,334 | 27,438 | 72,723 | 42,096 | ||||||||||||
| Deposits | 134,462 | 89,217 | 268,246 | 147,078 | ||||||||||||
| Short-term borrowings | 60 | 1,849 | 60 | 2,997 | ||||||||||||
| Federal Home Loan Bank advances | — | 649 | — | 5,761 | ||||||||||||
| Long-term debt | 3,743 | 3,774 | 7,538 | 7,670 | ||||||||||||
| Total interest expense | 138,265 | 95,489 | 275,844 | 163,506 | ||||||||||||
| Net interest revenue | 208,700 | 200,286 | 407,849 | 411,756 | ||||||||||||
| Provision for credit losses | 12,235 | 22,753 | 25,134 | 44,536 | ||||||||||||
| Net interest revenue after provision for credit losses | 196,465 | 177,533 | 382,715 | 367,220 | ||||||||||||
| Noninterest income: | ||||||||||||||||
| Service charges and fees | 10,620 | 9,777 | 19,884 | 18,476 | ||||||||||||
| Mortgage loan gains and other related fees | 6,799 | 6,584 | 14,310 | 11,105 | ||||||||||||
| Wealth management fees | 6,386 | 5,600 | 12,699 | 11,324 | ||||||||||||
| Gains from sales of other loans | 1,296 | 2,305 | 2,833 | 4,221 | ||||||||||||
| Lending and loan servicing fees | 3,328 | 2,978 | 7,538 | 6,994 | ||||||||||||
| Securities losses, net | — | — | — | (1,644 | ) | |||||||||||
| Other | 8,127 | 9,143 | 18,879 | 16,120 | ||||||||||||
| Total noninterest income | 36,556 | 36,387 | 76,143 | 66,596 | ||||||||||||
| Total revenue | 233,021 | 213,920 | 458,858 | 433,816 | ||||||||||||
| Noninterest expenses: | ||||||||||||||||
| Salaries and employee benefits | 85,818 | 76,250 | 170,803 | 154,948 | ||||||||||||
| Communications and equipment | 11,988 | 10,744 | 23,908 | 20,752 | ||||||||||||
| Occupancy | 11,056 | 10,194 | 22,155 | 20,083 | ||||||||||||
| Advertising and public relations | 2,459 | 2,314 | 4,360 | 4,663 | ||||||||||||
| Postage, printing and supplies | 2,251 | 2,382 | 4,899 | 4,919 | ||||||||||||
| Professional fees | 6,044 | 6,592 | 12,032 | 12,664 | ||||||||||||
| Lending and loan servicing expense | 2,014 | 2,530 | 3,841 | 4,849 | ||||||||||||
| Outside services - electronic banking | 2,812 | 2,660 | 5,730 | 6,085 | ||||||||||||
| FDIC assessments and other regulatory charges | 4,467 | 4,142 | 12,033 | 8,143 | ||||||||||||
| Amortization of intangibles | 3,794 | 3,421 | 7,681 | 6,949 | ||||||||||||
| Merger-related and other charges | 2,157 | 3,645 | 4,244 | 12,276 | ||||||||||||
| Other | 12,184 | 7,533 | 20,360 | 15,881 | ||||||||||||
| Total noninterest expenses | 147,044 | 132,407 | 292,046 | 272,212 | ||||||||||||
| Income before income taxes | 85,977 | 81,513 | 166,812 | 161,604 | ||||||||||||
| Income tax expense | 19,362 | 18,225 | 37,566 | 36,016 | ||||||||||||
| Net income | 66,615 | 63,288 | 129,246 | 125,588 | ||||||||||||
| Preferred stock dividends | 1,573 | 1,719 | 3,146 | 3,438 | ||||||||||||
| Earnings allocated to participating securities | 368 | 342 | 713 | 680 | ||||||||||||
| Net income available to common shareholders | $ | 64,674 | $ | 61,227 | $ | 125,387 | $ | 121,470 | ||||||||
| Net income per common share: | ||||||||||||||||
| Basic | $ | 0.54 | $ | 0.53 | $ | 1.05 | $ | 1.05 | ||||||||
| Diluted | 0.54 | 0.53 | 1.05 | 1.05 | ||||||||||||
| Weighted average common shares outstanding: | ||||||||||||||||
| Basic | 119,726 | 115,774 | 119,694 | 115,614 | ||||||||||||
| Diluted | 119,785 | 115,869 | 119,763 | 115,795 | ||||||||||||
| Average Consolidated Balance Sheets and Net Interest Analysis |
| For the Three Months Ended June 30, |
| 2024 | 2023 | |||||||||||||||||||||||
| (dollars in thousands, fully taxable equivalent (FTE)) | Average Balance |
Interest | Average Rate |
Average Balance |
Interest | Average Rate |
||||||||||||||||||
| Assets: | ||||||||||||||||||||||||
| Interest-earning assets: | ||||||||||||||||||||||||
| Loans, net of unearned income (FTE) (1)(2) | $ | 18,213,384 | $ | 291,378 | 6.43 | % | $ | 17,166,129 | $ | 250,472 | 5.85 | % | ||||||||||||
| Taxable securities (3) | 5,952,414 | 48,364 | 3.25 | 5,956,193 | 39,329 | 2.64 | ||||||||||||||||||
| Tax-exempt securities (FTE) (1)(3) | 363,393 | 2,273 | 2.50 | 369,364 | 2,323 | 2.52 | ||||||||||||||||||
| Federal funds sold and other interest-earning assets | 499,565 | 6,011 | 4.84 | 461,022 | 4,658 | 4.05 | ||||||||||||||||||
| Total interest-earning assets (FTE) | 25,028,756 | 348,026 | 5.59 | 23,952,708 | 296,782 | 4.97 | ||||||||||||||||||
| Noninterest-earning assets: | ||||||||||||||||||||||||
| Allowance for credit losses | (215,104 | ) | (181,769 | ) | ||||||||||||||||||||
| Cash and due from banks | 204,792 | 251,691 | ||||||||||||||||||||||
| Premises and equipment | 392,325 | 345,771 | ||||||||||||||||||||||
| Other assets (3) | 1,605,558 | 1,500,827 | ||||||||||||||||||||||
| Total assets | $ | 27,016,327 | $ | 25,869,228 | ||||||||||||||||||||
| Liabilities and Shareholders' Equity: | ||||||||||||||||||||||||
| Interest-bearing liabilities: | ||||||||||||||||||||||||
| Interest-bearing deposits: | ||||||||||||||||||||||||
| NOW and interest-bearing demand | $ | 5,866,038 | 43,910 | 3.01 | $ | 4,879,591 | 27,597 | 2.27 | ||||||||||||||||
| Money market | 6,068,530 | 53,531 | 3.55 | 5,197,789 | 33,480 | 2.58 | ||||||||||||||||||
| Savings | 1,160,708 | 687 | 0.24 | 1,306,394 | 702 | 0.22 | ||||||||||||||||||
| Time | 3,544,327 | 35,695 | 4.05 | 2,976,482 | 22,471 | 3.03 | ||||||||||||||||||
| Brokered time deposits | 50,323 | 639 | 5.11 | 423,536 | 4,967 | 4.70 | ||||||||||||||||||
| Total interest-bearing deposits | 16,689,926 | 134,462 | 3.24 | 14,783,792 | 89,217 | 2.42 | ||||||||||||||||||
| Federal funds purchased and other borrowings | 4,093 | 60 | 5.90 | 145,233 | 1,849 | 5.11 | ||||||||||||||||||
| Federal Home Loan Bank advances | — | — | — | 50,989 | 649 | 5.11 | ||||||||||||||||||
| Long-term debt | 324,870 | 3,743 | 4.63 | 324,740 | 3,774 | 4.66 | ||||||||||||||||||
| Total borrowed funds | 328,963 | 3,803 | 4.65 | 520,962 | 6,272 | 4.83 | ||||||||||||||||||
| Total interest-bearing liabilities | 17,018,889 | 138,265 | 3.27 | 15,304,754 | 95,489 | 2.50 | ||||||||||||||||||
| Noninterest-bearing liabilities: | ||||||||||||||||||||||||
| Noninterest-bearing deposits | 6,283,487 | 7,072,760 | ||||||||||||||||||||||
| Other liabilities | 400,974 | 385,324 | ||||||||||||||||||||||
| Total liabilities | 23,703,350 | 22,762,838 | ||||||||||||||||||||||
| Shareholders' equity | 3,312,977 | 3,106,390 | ||||||||||||||||||||||
| Total liabilities and shareholders' equity | $ | 27,016,327 | $ | 25,869,228 | ||||||||||||||||||||
| Net interest revenue (FTE) | $ | 209,761 | $ | 201,293 | ||||||||||||||||||||
| Net interest-rate spread (FTE) | 2.32 | % | 2.47 | % | ||||||||||||||||||||
| Net interest margin (FTE) (4) | 3.37 | % | 3.37 | % | ||||||||||||||||||||
| (2) | Interest revenue on tax-exempt securities and loans has been increased to reflect comparable interest on taxable securities and loans. The rate used was 25% in 2024 and 26% in 2023, reflecting the statutory federal income tax rate and the federal tax adjusted state income tax rate. |
| (3) | Included in the average balance of loans outstanding are loans on which the accrual of interest has been discontinued and loans that are held for sale. |
| (4) | Unrealized gains and losses on AFS securities, including those related to the transfer from AFS to HTM, have been reclassified to other assets. Pretax unrealized losses of $344 million in 2024 and $389 million in 2023 are included in other assets for purposes of this presentation. |
| (5) | Net interest margin is taxable equivalent net interest revenue divided by average interest-earning assets. |
| Average Consolidated Balance Sheets and Net Interest Analysis |
| For the Six Months Ended June 30, |
| 2024 | 2023 | |||||||||||||||||||||||
| (dollars in thousands, fully taxable equivalent (FTE)) | Average Balance |
Interest | Average Rate |
Average Balance |
Interest | Average Rate |
||||||||||||||||||
| Assets: | ||||||||||||||||||||||||
| Interest-earning assets: | ||||||||||||||||||||||||
| Loans, net of unearned income (FTE) (1)(2) | $ | 18,256,562 | $ | 575,338 | 6.34 | % | $ | 17,032,493 | $ | 487,002 | 5.77 | % | ||||||||||||
| Taxable securities (3) | 5,890,408 | 93,079 | 3.16 | 6,007,471 | 77,205 | 2.57 | ||||||||||||||||||
| Tax-exempt securities (FTE) (1)(3) | 364,873 | 4,584 | 2.51 | 395,827 | 5,157 | 2.61 | ||||||||||||||||||
| Federal funds sold and other interest-earning assets | 587,080 | 12,816 | 4.39 | 466,642 | 8,010 | 3.46 | ||||||||||||||||||
| Total interest-earning assets (FTE) | 25,098,923 | 685,817 | 5.49 | 23,902,433 | 577,374 | 4.87 | ||||||||||||||||||
| Non-interest-earning assets: | ||||||||||||||||||||||||
| Allowance for loan losses | (214,050 | ) | (174,716 | ) | ||||||||||||||||||||
| Cash and due from banks | 212,998 | 261,397 | ||||||||||||||||||||||
| Premises and equipment | 389,173 | 337,499 | ||||||||||||||||||||||
| Other assets (3) | 1,611,928 | 1,492,926 | ||||||||||||||||||||||
| Total assets | $ | 27,098,972 | $ | 25,819,539 | ||||||||||||||||||||
| Liabilities and Shareholders' Equity: | ||||||||||||||||||||||||
| Interest-bearing liabilities: | ||||||||||||||||||||||||
| Interest-bearing deposits: | ||||||||||||||||||||||||
| NOW and interest-bearing demand | $ | 5,972,065 | 90,121 | 3.03 | $ | 4,690,798 | 45,196 | 1.94 | ||||||||||||||||
| Money market | 5,966,374 | 104,009 | 3.51 | 5,210,457 | 58,546 | 2.27 | ||||||||||||||||||
| Savings | 1,176,768 | 1,393 | 0.24 | 1,361,357 | 1,240 | 0.18 | ||||||||||||||||||
| Time | 3,570,407 | 71,639 | 4.03 | 2,664,269 | 34,784 | 2.63 | ||||||||||||||||||
| Brokered time deposits | 50,333 | 1,084 | 4.33 | 316,470 | 7,312 | 4.66 | ||||||||||||||||||
| Total interest-bearing deposits | 16,735,947 | 268,246 | 3.22 | 14,243,351 | 147,078 | 2.08 | ||||||||||||||||||
| Federal funds purchased and other borrowings | 2,054 | 60 | 5.87 | 126,697 | 2,997 | 4.77 | ||||||||||||||||||
| Federal Home Loan Bank advances | 2 | — | — | 250,912 | 5,761 | 4.63 | ||||||||||||||||||
| Long-term debt | 324,854 | 7,538 | 4.67 | 324,721 | 7,670 | 4.76 | ||||||||||||||||||
| Total borrowed funds | 326,910 | 7,598 | 4.67 | 702,330 | 16,428 | 4.72 | ||||||||||||||||||
| Total interest-bearing liabilities | 17,062,857 | 275,844 | 3.25 | 14,945,681 | 163,506 | 2.21 | ||||||||||||||||||
| Noninterest-bearing liabilities: | ||||||||||||||||||||||||
| Noninterest-bearing deposits | 6,340,783 | 7,383,575 | ||||||||||||||||||||||
| Other liabilities | 395,713 | 371,422 | ||||||||||||||||||||||
| Total liabilities | 23,799,353 | 22,700,678 | ||||||||||||||||||||||
| Shareholders' equity | 3,299,619 | 3,118,861 | ||||||||||||||||||||||
| Total liabilities and shareholders' equity | $ | 27,098,972 | $ | 25,819,539 | ||||||||||||||||||||
| Net interest revenue (FTE) | $ | 409,973 | $ | 413,868 | ||||||||||||||||||||
| Net interest-rate spread (FTE) | 2.24 | % | 2.66 | % | ||||||||||||||||||||
| Net interest margin (FTE) (4) | 3.28 | % | 3.49 | % | ||||||||||||||||||||
| (2) | Interest revenue on tax-exempt securities and loans has been increased to reflect comparable interest on taxable securities and loans. The rate used was 25% in 2024 and 26% in 2023, reflecting the statutory federal income tax rate and the federal tax adjusted state income tax rate. |
| (3) | Included in the average balance of loans outstanding are loans on which the accrual of interest has been discontinued and loans that are held for sale. |
| (4) | Unrealized gains and losses on AFS securities, including those related to the transfer from AFS to HTM, have been reclassified to other assets. Pretax unrealized losses of $333 million in 2024 and $404 million in 2023 are included in other assets for purposes of this presentation. |
| (5) | Net interest margin is taxable equivalent net-interest revenue divided by average interest-earning assets. |
About United Community Banks, Inc.
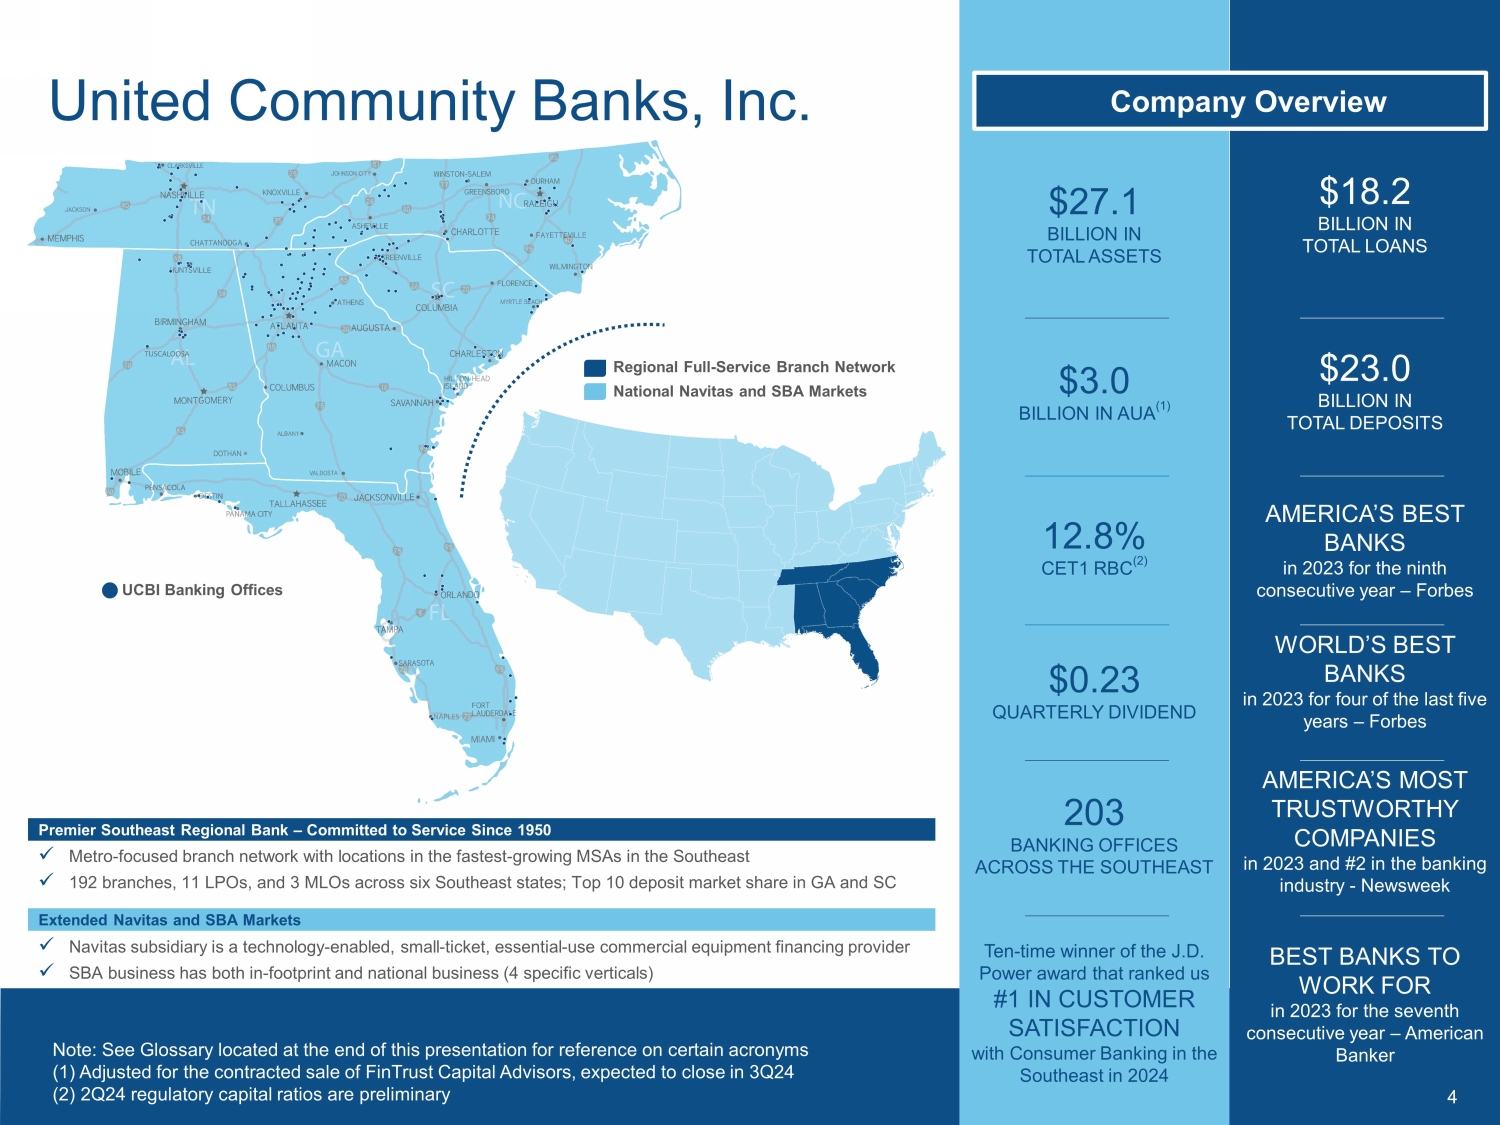
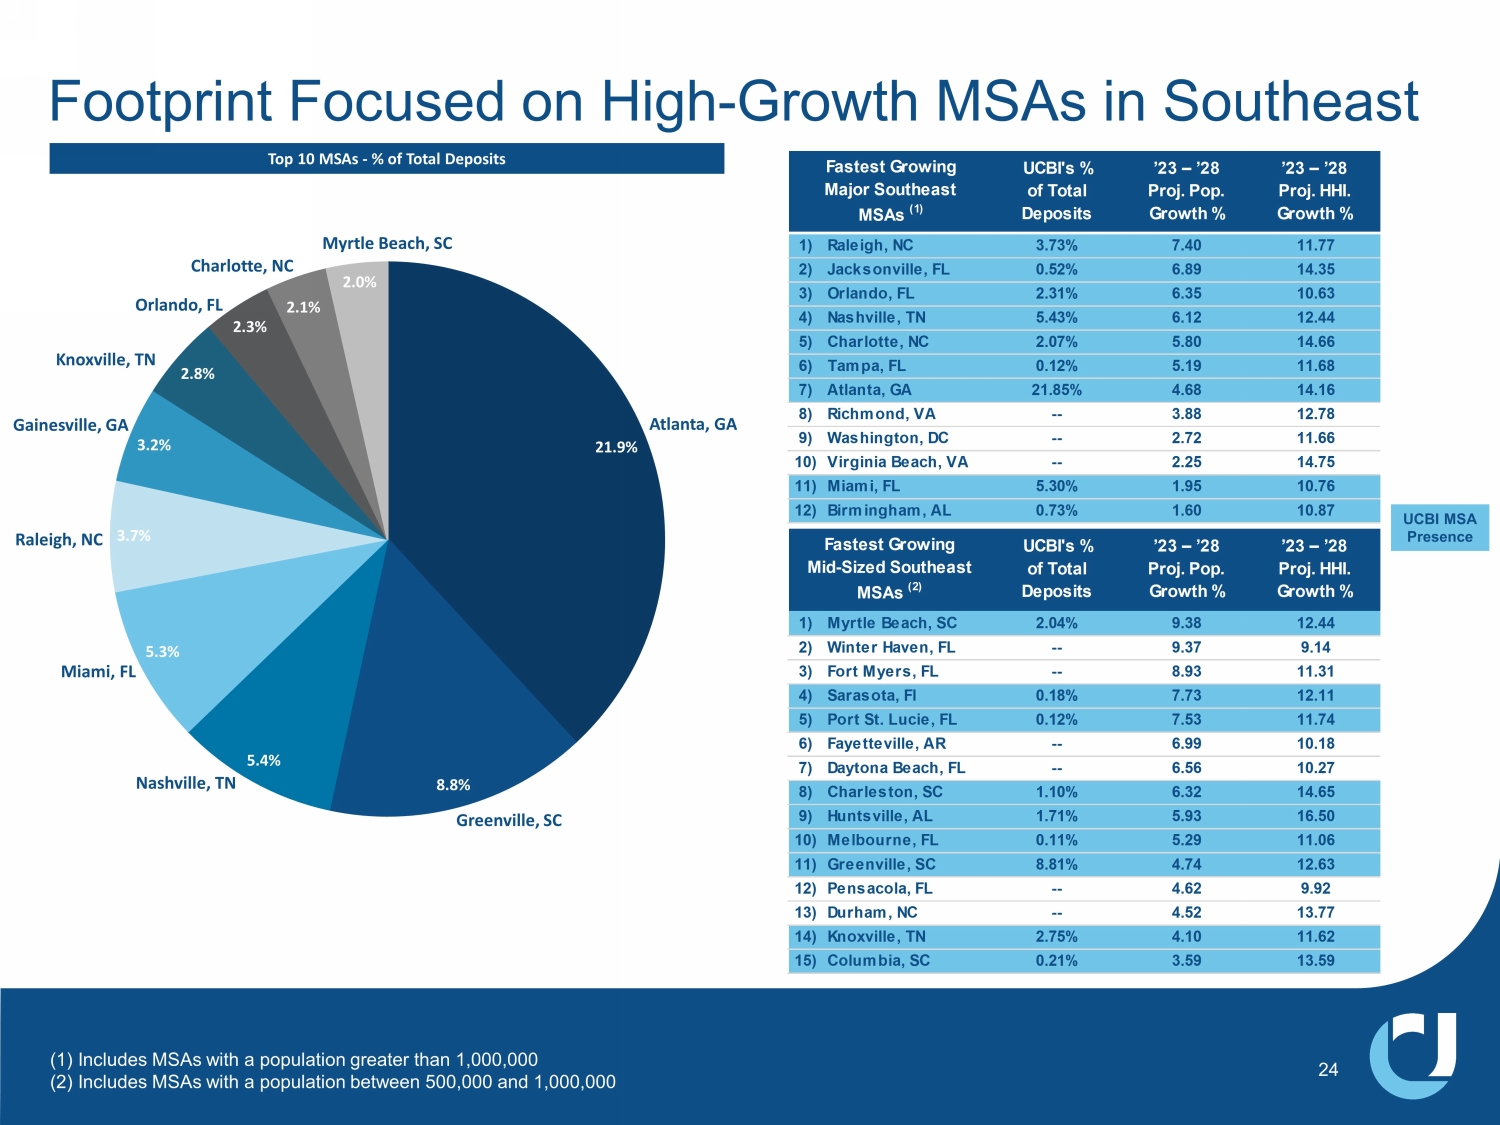
United Community Banks, Inc. (NASDAQ: UCBI) is the financial holding company for United Community, a top 100 U.S. financial institution that is committed to improving the financial health and well-being of its customers and the communities it serves. United Community provides a full range of banking, wealth management and mortgage services. As of June 30, 2024, United Community Banks, Inc. had $27.1 billion in assets, 203 offices across Alabama, Florida, Georgia, North Carolina, South Carolina, and Tennessee, as well as a national SBA lending franchise and a national equipment lending subsidiary. In 2024, United Community became a 10-time winner of J.D. Power’s award for best customer satisfaction among consumer banks in the Southeast region and was recognized as the most trusted bank in the Southeast. In 2023, United Community was named by American Banker as one of the “Best Banks to Work For” for the seventh consecutive year and was recognized in the Greenwich Excellence and Best Brands Awards, receiving 15 awards that included national honors for overall satisfaction in small business banking and middle market banking. Forbes has also consistently listed United Community as one of the World’s Best Banks and one of America’s Best Banks. Additional information about United can be found at www.ucbi.com.
Non-GAAP Financial Measures
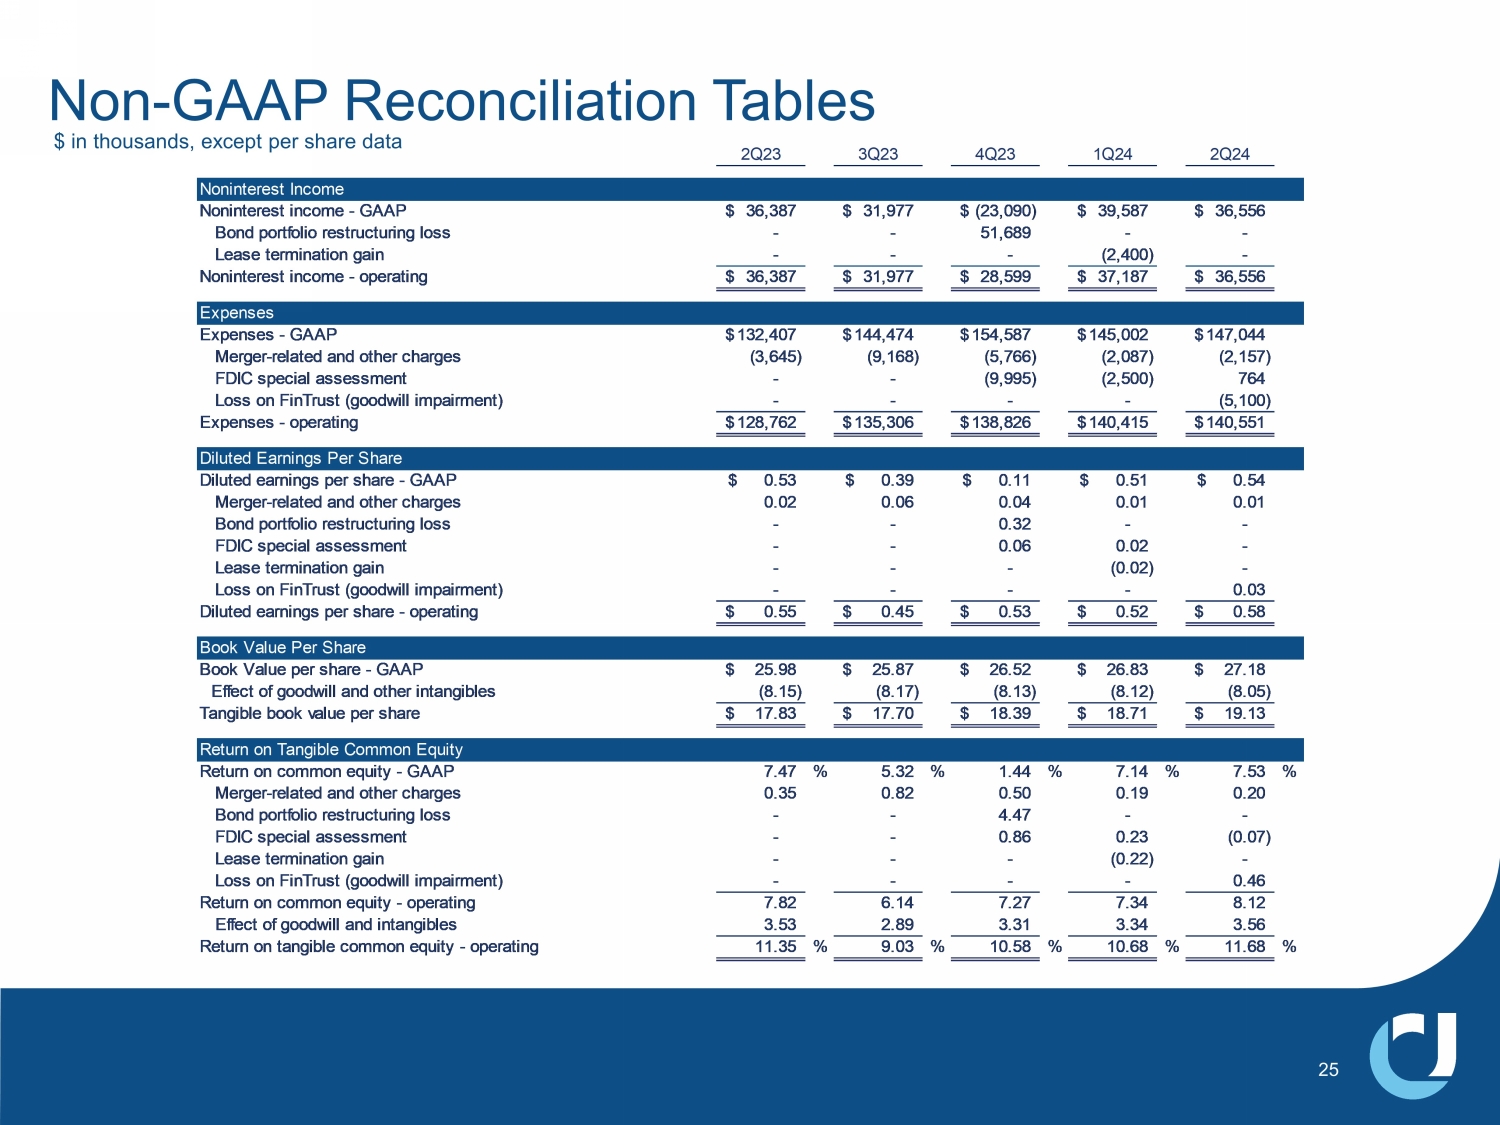
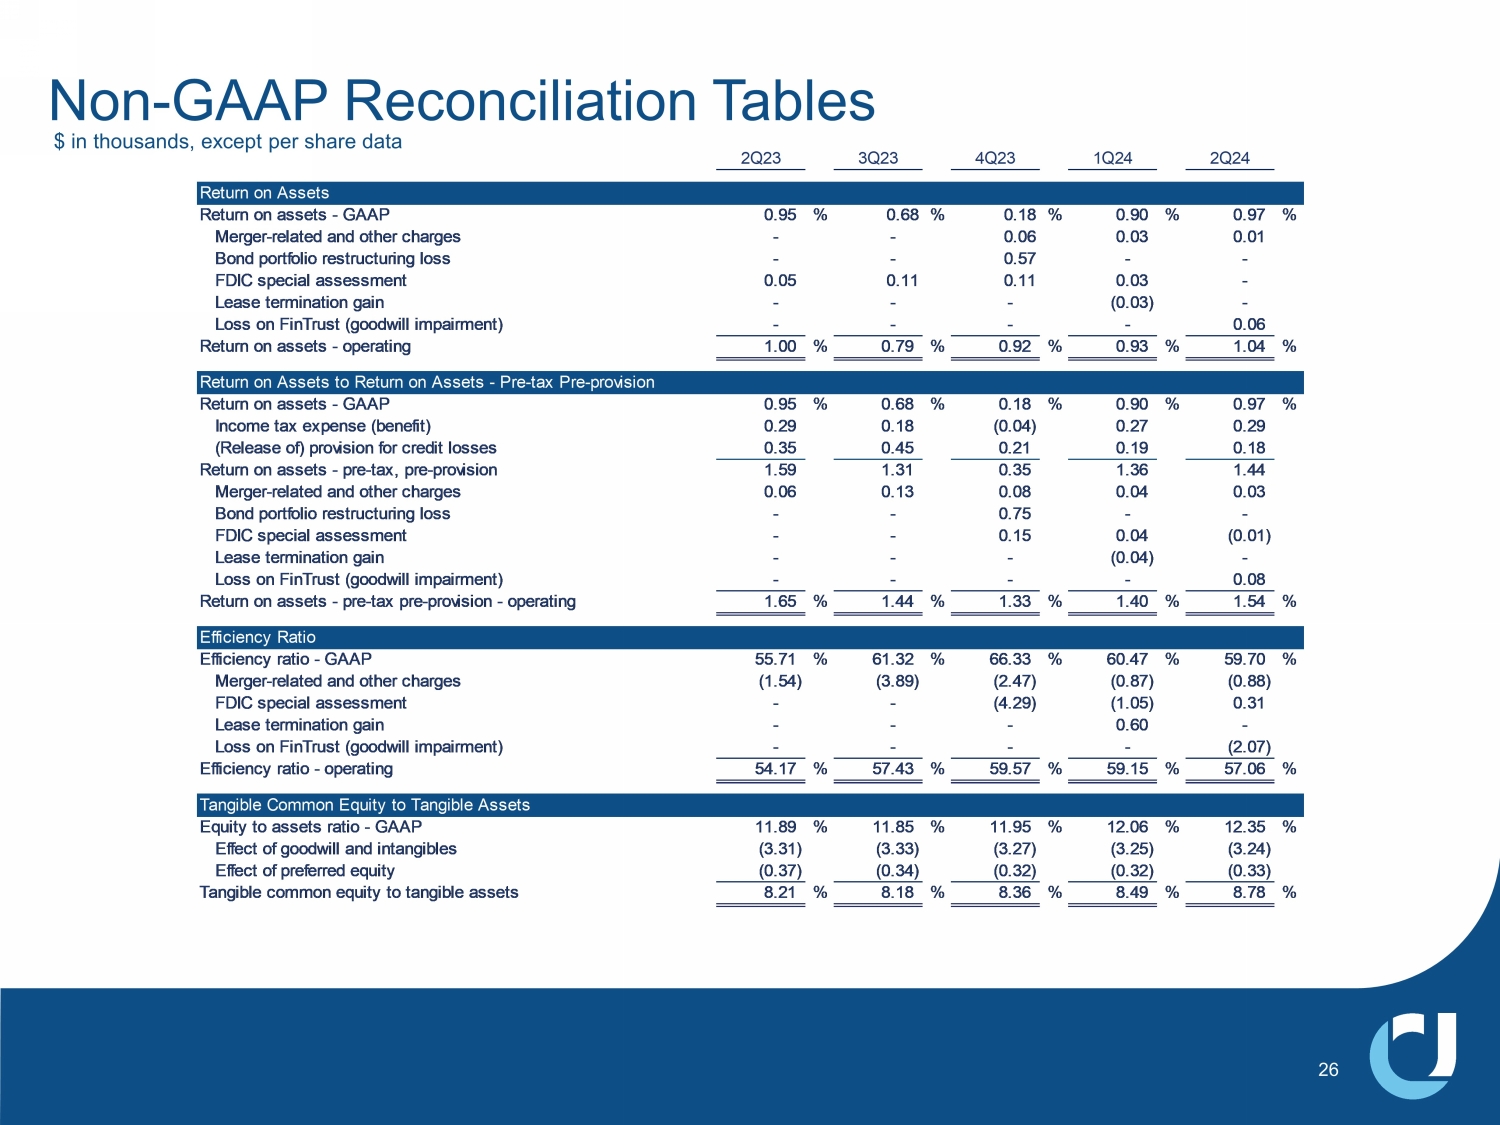
This press release, including the accompanying financial statement tables, contains financial information determined by methods other than in accordance with generally accepted accounting principles, or GAAP. This financial information includes certain operating performance measures, which exclude merger-related and other charges that are not considered part of recurring operations, such as “noninterest expense - operating”, “operating net income,” “pre-tax, pre-provision income,” “operating net income per diluted common share,” “operating earnings per share,” “tangible book value per common share,” “operating return on common equity,” “operating return on tangible common equity,” “operating return on assets,” “return on assets - pre-tax, pre-provision - operating,” “return on assets - pre-tax, pre-provision,” “operating efficiency ratio,” and “tangible common equity to tangible assets.” These non-GAAP measures are included because United believes they may provide useful supplemental information for evaluating United’s underlying performance trends. These measures should be viewed in addition to, and not as an alternative to or substitute for, measures determined in accordance with GAAP, and are not necessarily comparable to non-GAAP measures that may be presented by other companies. To the extent applicable, reconciliations of these non-GAAP measures to the most directly comparable measures as reported in accordance with GAAP are included with the accompanying financial statement tables.
Caution About Forward-Looking Statements
This press release contains “forward-looking statements” within the meaning of Section 27A of the Securities Act of 1933, as amended, and Section 21E of the Securities Exchange Act of 1934, as amended. In general, forward-looking statements usually may be identified through use of words such as “may,” “believe,” “expect,” “anticipate,” “intend,” “will,” “should,” “plan,” “estimate,” “predict,” “continue” and “potential,” or the negative of these terms or other comparable terminology. Forward-looking statements are not historical facts and represent management’s beliefs, based upon information available at the time the statements are made, with regard to the matters addressed; they are not guarantees of future performance. Actual results may prove to be materially different from the results expressed or implied by the forward-looking statements. Forward-looking statements are subject to numerous assumptions, risks and uncertainties that change over time and could cause actual results or financial condition to differ materially from those expressed in or implied by such statements. Factors that could cause or contribute to such differences include, but are not limited to general competitive, economic, political and market conditions. Further information regarding additional factors which could affect the forward-looking statements contained in this press release can be found in the cautionary language included under the headings “Cautionary Note Regarding Forward-Looking Statements” and “Risk Factors” in United’s Annual Report on Form 10-K for the year ended December 31, 2023, and other documents subsequently filed by United with the United States Securities and Exchange Commission (“SEC”).
Many of these factors are beyond United’s ability to control or predict. If one or more events related to these or other risks or uncertainties materialize, or if the underlying assumptions prove to be incorrect, actual results may differ materially from the forward-looking statements. Accordingly, shareholders and investors should not place undue reliance on any such forward-looking statements. Any forward-looking statement speaks only as of the date of this communication, and United undertakes no obligation to update or revise any forward-looking statements, whether as a result of new information, future events or otherwise, except as required by law. New risks and uncertainties may emerge from time to time, and it is not possible for United to predict their occurrence or how they will affect United.
United qualifies all forward-looking statements by these cautionary statements.
# # #
Exhibit 99.2