UNITED STATES
SECURITIES AND EXCHANGE COMMISSION
Washington, D.C. 20549
FORM 8-K
CURRENT REPORT
Pursuant to Section 13 or 15(d) of the Securities Exchange Act of 1934
Date of Report (Date of earliest event reported): January 25, 2024
Primis Financial Corp.
(Exact Name of Registrant as Specified in its Charter)
| Virginia | 001-33037 | 20-1417448 |
| (State or Other Jurisdiction of Incorporation) | (Commission File Number) | (I.R.S. Employer Identification Number) |
1676 International Drive, Suite 900, McLean, Virginia 22102
(Address of Principal Executive Offices) (Zip Code)
(703) 893-7400
(Registrant's telephone number, including area code)
Not Applicable
(Former name or former address, if changed since last report)
Check the appropriate box below if the Form 8-K filing is intended to simultaneously satisfy the filing obligation of the registrant under any of the following provisions:
| ¨ | Written communications pursuant to Rule 425 under the Securities Act (17 CFR 230.425) |
| ¨ | Soliciting material pursuant to Rule 14a-12 under the Exchange Act (17 CFR 240.14a-12) |
| ¨ | Pre-commencement communications pursuant to Rule 14d-2(b) under the Exchange Act (17 CFR 240.14d-2(b)) |
| ¨ | Pre-commencement communications pursuant to Rule 13e-4(c) under the Exchange Act (17 CFR 240.13e-4(c)) |
Securities registered pursuant to Section 12(b) of the Act:
| Title of each class | Trading Symbol(s) | Name of each exchange on which registered | ||
| COMMON STOCK | FRST | NASDAQ |
Indicate by check mark whether the registrant is an emerging growth company as defined in Rule 405 of the Securities Act of 1933 (§230.405 of this chapter) or Rule 12b-2 of the Securities Exchange Act of 1934 (§240.12b-2 of this chapter). Emerging growth company ¨
If an emerging growth company, indicate by check mark if the registrant has elected not to use the extended transition period for complying with any new or revised financial accounting standards provided pursuant to Section 13(a) of the Exchange Act. ¨
Item 2.02. Results of Operations and Financial Condition.
On January 25, 2024, Primis Financial Corp. (“Primis” or the “Company”) issued a press release announcing its financial results for the three months ended December 31, 2023. A copy of the press release is filed as Exhibit 99.1 to this Current Report on Form 8-K and incorporated herein by reference.
Item 7.01. Regulation FD Disclosure.
The Company has prepared presentation materials (the “Investor Presentation”) that management intends to use from time to time hereafter in presentations about the Company’s operations and performance. The Company may use the Investor Presentation, possibly with modifications, in presentations to current and potential investors, analysts, lenders, business partners, acquisition candidates, customers, employees and others with an interest in the Company and its business.
A copy of the Investor Presentation is furnished as Exhibit 99.2 to this Current Report on Form 8-K and incorporated herein by reference. The Investor Presentation is also available on the Company's website at www.primisbank.com. Materials on the Company’s website are not part of or incorporated by reference into this report.
In accordance with General Instruction B.2 of Form 8-K, the information in this Current Report on Form 8-K, including Exhibits 99.1 and 99.2 attached hereto, shall not be deemed to be “filed” for purposes of Section 18 of the Securities Exchange Act of 1934, as amended (the “Exchange Act”), or otherwise subject to the liability of that section, and shall not be incorporated by reference into any filing under the Securities Act of 1933, as amended, or the Exchange Act, except as shall be expressly set forth by specific reference in such filing.
Item 8.01. Other Events.
On January 25, 2024, Primis issued a press release announcing the declaration of a dividend payable on February 23, 2024 to shareholders of record as of February 9, 2024. A copy of the press release is filed as Exhibit 99.1 to this Current Report on Form 8-K and incorporated herein by reference.
Item 9.01. Financial Statements and Exhibits.
(d) Exhibits
99.1 Press Release dated January 25, 2024
99.2 Primis Financial Corp. Fourth Quarter 2023 Investor Presentation
104 Cover Page Interactive Data File (formatted as Inline XBRL and contained in Exhibit 101)
SIGNATURE
Pursuant to the requirements of the Securities Exchange Act of 1934, the registrant has duly caused this report to be signed on its behalf by the undersigned hereunto duly authorized.
| Primis Financial Corp. | ||
| Date: January 25, 2024 | By: | /s/ Matthew A. Switzer |
| Matthew A. Switzer | ||
| Chief Financial Officer | ||
Exhibit 99.1

Primis Financial Corp. Reports Earnings per Share for the Fourth Quarter of 2023
Announces Investment in Panacea Financial Holdings, Inc.
Declares Quarterly Cash Dividend of $0.10 Per Share
For immediate release
Thursday, January 25, 2024
McLean, Virginia, January 25, 2024 – Primis Financial Corp. (NASDAQ: FRST) (“Primis” or the “Company”), and its wholly-owned subsidiary, Primis Bank (the “Bank”), today reported net income available to common shareholders of $8.1 million or $0.33 per diluted share for the quarter ended December 31, 2023, compared to net income available to common shareholders of $3.0 million or $0.12 per diluted share for the quarter ended December 31, 2022. For the year-to-date period in 2023, the Company reported earnings available to common and diluted earnings per share of $9.9 million and $0.40, respectively, compared to $17.5 million and $0.71, respectively, in the same period in 2022. Earnings for the year-to-date period in 2023 include $13.0 million or $0.53 per diluted share of after-tax nonrecurring charges and goodwill impairment.
Investment in Panacea Financial Holdings, Inc.
Panacea Financial Holdings, Inc. (“PFH”) is a separate legal entity that owns the rights to the Panacea Financial brand and intellectual property with a goal of growing and monetizing those assets. The Panacea Financial Division of Primis Bank has a partnership agreement with PFH and is the primary bank partner as of year-end 2023. In late December 2023, PFH completed a $24.5 million Series B financing round lead by a global venture capital firm. Proceeds from the raise will allow PFH to further invest in its strong brand and product offerings including upgraded technology platforms to further serve customers. As part of the financing round, Primis acquired approximately 19% of PFH for an immaterial purchase price due to previous operating losses in the Panacea Financial Division. At December 31, 2023, the implied fair market value of Primis’ investment in PFH based on the capital raise valuation was approximately $20 million.
Dennis J. Zember, Jr., President and Chief Executive Officer of Primis commented, “We are excited that the hard work of the Panacea and Primis Bank teams has resulted in a very successful capital raise with sophisticated investors. This is a tremendous vote of confidence in what we have been building over the past three years and will allow the Panacea team to keep building out their brand and capabilities while taking their business to the next level. Importantly, Panacea’s material improvement in profitability during 2023 combined with this infusion of capital immediately improves the level and reliability of earnings that Primis Bank will enjoy from the relationship and should be very accretive to future operations.”
"Primis has been a tremendous partner since we launched Panacea in late 2020 and we are thrilled to announce the successful completion of our Series B funding round," said Tyler Stafford, CFA, CEO and Co-founder of Panacea Financial. "Our goal is to build a widely diversified and deeply integrated suite of financial products and services for doctors, their practices, and ultimately the broader healthcare industry. Both Panacea and Primis are excited about what we can accomplish together.”
Because of the substantial activities between PFH and the Panacea Financial Division of Primis, and limited activities of PFH outside of its relationship with Primis at December 31, 2023, a thorough analysis of GAAP requires Primis to consolidate PFH for financial reporting purposes. As a result, all PFH balance sheet and income statement items are reflected in the financial statements of Primis. References to noncontrolling interests reflect the interests in PFH of owners other than Primis. The analysis for consolidation is a highly technical exercise and is required to be evaluated regularly as facts and circumstances change. Management anticipates that the increasing level of activity at PFH will ultimately lead to deconsolidation in subsequent quarters.
| (1) | Non-GAAP financial measure. Please see “Reconciliation of Non-GAAP Items” in the financial tables for more information and for a reconciliation to GAAP. |
PFH also elected to reimburse Primis for certain personnel expenses for 2023 to compensate for a profitability target shortfall in the Panacea Financial Division for the 2023 fiscal year as defined in the partnership agreement between PFH and Primis Bank. Total reimbursement was $2.81 million and was reflected in the fourth quarter of 2023. A substantial majority of the loss in noncontrolling interest is primarily attributed to this reimbursement of costs to Primis Bank by PFH.
Financial Highlights
The results of the fourth quarter of 2023 reflected material improvement in operating results across several fronts. Notably, the Company:
| · | Increased operating return on average assets(1) to 89 basis points, up from 81 basis points in the third quarter of 2023 |
| · | Generated a margin of 3.36%, up from 3.01% linked quarter. Excluding accounting adjustments from a third-party managed portfolio discussed below, margin for the fourth quarter was 3.09%. |
| · | Opened over 2,000 new deposit account relationships totaling $75 million with a weighted average cost of only 2.96%. |
| · | Sold approximately $16 million of loans for gains of approximately $0.3 million and participated out another $15 million to manage balance sheet capacity. |
| · | Noninterest expense was $29.8 million for the fourth quarter of 2023, compared to $37.1 million for the third quarter of 2023. The fourth quarter of 2023 was by impacted the consolidation of PFH and higher expenses due to a third party managed portfolio while the third quarter of 2023 included a $11.2 million goodwill impairment expense. Excluding these items and nonrecurring expenses, mortgage expenses and unfunded commitment reserve expense, noninterest expense was $18.7 million in the fourth quarter, down from $20.5 million in the third quarter of 2023 on a comparable basis. |
| · | Maintained peer-group leading liquidity with only $105 million of wholesale funding and $113 million of off-balance sheet funds swept off at December 31, 2023. |
| · | 61% reduction in linked-quarter nonperforming assets to only $7.7 million excluding SBA guarantees |
| · | Grew all capital ratios including TCE/TA which is now at 7.99%. Leverage ratio increased to 8.93%. |
Commenting on the quarterly results, Dennis J. Zember Jr., President and CEO stated, “2023 was a challenging year for the industry and our bank. But through it all, we actually grew revenue by $14 million or 11%. Our work in earlier years positioned us well and allowed us to continue growing loans (by 9.1%) but growing deposits even faster (20.1%). We finished the year with very low NPAs and wholesale borrowings and solid capital levels that we believe can accommodate continued growth at measured levels. Most importantly, we completed a restructuring of the Bank with some branch consolidation that when taken with our other successes points to continued improvement in overall profitability through the coming year.”
Net Interest Income
Net interest income increased approximately $3.1 million to $30.3 million during the fourth quarter compared to the third quarter of 2023 largely due to $2.6 million of accretion in the fourth quarter related to a third-party managed portfolio (largely offset by a comparable amount in noninterest expense) versus $0.3 million in the third quarter of 2023. Excluding this accretion, net interest income increased to $27.7 million in the fourth quarter of 2023 versus $26.8 million linked-quarter. For the year-to-date period in 2023, the Company reported $108 million of net interest income excluding accounting accretion compared to $103 million in 2022, an increase of 4.7%. For the fourth quarter of 2023, the Company reported a net interest margin of 3.36% versus 3.01% for the third quarter of 2023. Excluding accretion, margin increased 10 basis points to 3.09% in the fourth quarter.
| (1) | Non-GAAP financial measure. Please see “Reconciliation of Non-GAAP Items” in the financial tables for more information and for a reconciliation to GAAP. |
Interest income on earning assets increased during the fourth quarter of 2023 to $54.7 million compared to $50.8 million during the third quarter of 2023. Excluding the accretion described above, interest income increased to $52.1 million in the fourth quarter of 2023 compared to $50.5 million during the third quarter of 2023. Yield on earning assets and loans held for investment were 6.08% and 6.33%, respectively. Excluding accretion, yield on earning assets and loans held for investment were 5.79% and 6.01%, up 22 basis points and 21 basis points, respectively, from the third quarter of 2023.
Interest expense increased $0.7 million to $24.4 million in the fourth quarter of 2023 compared to the third quarter of 2023. Cost of deposits increased 9 basis points to 2.69% in the fourth quarter from 2.60% in the third quarter of 2023. Management continues to leverage the strong liquidity generated by the Bank’s digital platform to conservatively manage the cost of deposits in the core bank. As highlighted by the table below, core bank deposit costs increased 3 basis points to 1.94% in the fourth quarter while the cost of wholesale funding options, using three-month FHLB advance rates as a proxy, were 5.56% on average in the quarter.
4Q23 |
3Q23 |
2Q23 |
1Q23 |
4Q22 |
||||||||||||||||
| Core Bank Int. Exp. | $ | 12,125 | $ | 12,380 | $ | 11,823 | $ | 9,343 | $ | 5,183 | ||||||||||
| Digital Platform Int. Exp. | $ | 10,162 | $ | 9,196 | $ | 12,960 | $ | 5,701 | $ | 127 | ||||||||||
| Core Bank Avg. Noninterest-bearing | $ | 472,630 | $ | 471,813 | $ | 472,416 | $ | 555,771 | $ | 648,051 | ||||||||||
| Core Bank Avg. Interest-bearing deposits (IBD) | $ | 2,008,386 | $ | 2,099,617 | $ | 2,155,212 | $ | 2,149,650 | $ | 2,027,211 | ||||||||||
| Digital Platform Avg. IBD | $ | 800,963 | $ | 723,145 | $ | 1,052,603 | $ | 481,072 | $ | 14,691 | ||||||||||
| Core Bank Cost of IBD | 2.40 | % | 2.34 | % | 2.20 | % | 1.76 | % | 1.01 | % | ||||||||||
| Core Bank Cost of Deposits | 1.94 | % | 1.91 | % | 1.80 | % | 1.40 | % | 0.77 | % | ||||||||||
| Digital Platform Cost of IBD | 5.03 | % | 5.05 | % | 4.94 | % | 4.81 | % | 3.42 | % | ||||||||||
| Avg. 3M FHLB Rate | 5.56 | % | 5.54 | % | 5.31 | % | 4.96 | % | 4.40 | % |
Noninterest Income
Noninterest income decreased during the fourth quarter to $9.0 million compared to $9.9 million in the third quarter of 2023. Excluding credit enhancement income from a third-party managed portfolio, noninterest income decreased $2.0 million to $5.9 million in the fourth quarter of 2023, largely due to decreased mortgage banking activity. During the fourth quarter of 2023, the Bank realized $0.3 million of gains associated with the sale of Panacea commercial and consumer loans, down slightly from $0.5 million of gains recognized in the third quarter of 2023.
Noninterest Expense
Noninterest expense was $29.8 million for the fourth quarter of 2023, compared to $37.1 million for the third quarter of 2023. Management considers the core expense burden that adjusts for certain items such as those that are volume dependent (e.g., mortgage banking related) or nonoperational (e.g. accounting accruals for the third-party managed loan portfolio and changes in the reserve for unfunded commitments). The following table illustrates the degree to which the Company has improved its operating expense burden during 2023:
4Q23 |
3Q23 |
4Q22 |
YTD23 |
YTD22 |
||||||||||||||||
| Reported Non-Interest Expense | 29,836 | 37,066 | 29,106 | 124,868 | 92,376 | |||||||||||||||
| Less: | ||||||||||||||||||||
| Goodwill Impairment | (11,150 | ) | (11,150 | ) | ||||||||||||||||
| Mortgage Expenses | (4,785 | ) | (5,108 | ) | (5,357 | ) | (20,152 | ) | (9,361 | ) | ||||||||||
| Branch Closure and Other Nonrecurring | (643 | ) | (200 | ) | (1,175 | ) | (2,331 | ) | (1,175 | ) | ||||||||||
| Effect of Consolidating PFH | (2,813 | ) | (2,813 | ) | ||||||||||||||||
| Effects of Third-Party Managed Portfolio | (2,823 | ) | (337 | ) | (1,369 | ) | (4,548 | ) | (1,369 | ) | ||||||||||
| Reserve for Unfunded Commitment | (67 | ) | 257 | (36 | ) | 325 | (409 | ) | ||||||||||||
| Core Operating Expense Burden | 18,705 | 20,528 | 21,169 | 84,199 | 80,062 |
| (1) | Non-GAAP financial measure. Please see “Reconciliation of Non-GAAP Items” in the financial tables for more information and for a reconciliation to GAAP. |
As noted above, the core expense burden increased $4.1 million or 5.2% during the year. Mr. Zember noted, “The restructuring activities we undertook in the second quarter of 2023 were supplemented in the third and fourth quarter, resulting in a noticeable improvement in expenses. Our run rate on expenses in the fourth quarter mirror levels we experienced in 2022 despite substantially higher revenues and asset levels.”
Taxes
Tax expense for the fourth quarter was $0.4 million versus expense of $1.9 million in the third quarter of 2023. The fourth quarter reflects the recognition of approximately $1.1 million of R&D tax credits the Bank is recovering from development work on the Bank’s digital banking platform over the past three years. The remaining differences are largely due to adjustments to accruals for the 2023 tax year. The Company expects the effective tax rate in 2024 to be approximately 18.5%.
Loan Portfolio and Asset Quality
Loans held for investment increased to $3.21 billion at December 31, 2023, compared to $3.17 billion at September 30, 2023. The Company sold or participated out approximately $31 million of loans in the fourth quarter of 2023. Adjusting for these activities, loans would have increased 2.5% in the fourth quarter of 2023 versus the third quarter of 2023.
Nonperforming assets, excluding portions guaranteed by the SBA, were $7.7 million at December 31, 2023, compared to $19.6 million at September 30, 2023, while loans rated substandard or doubtful decreased to $17.2 million in the fourth quarter of 2023 from $28.8 million in the third quarter of 2023. The decline was largely attributable to one remaining assisted living problem credit outstanding at September 30, 2023 that was resolved in early October. The Bank had no other real estate owned at the end of the fourth quarter of 2023.
The Company recorded a provision for loan losses of $3.1 million for the fourth quarter of 2023 versus $1.6 million for the third quarter of 2023. Of this provision, $3.0 million was due to charge-offs for the loan portfolio with a third-party credit enhancement described previously. This portion of the provision is fully offset by a gain recorded in noninterest income and has no effect on net income. Excluding this provision amount, the provision for loan losses would have been $0.1 million for the fourth quarter of 2023 due lowered modeled losses on certain portfolios, particularly Panacea commercial loans and Life Premium Finance. As a percentage of loans, excluding PPP balances, the allowance for credit losses was 1.06% and 1.13% at the end of the fourth and third quarter of 2023, respectively.
Net charge-offs were $5.0 million for the fourth quarter of 2023, up from $4.3 million for the third quarter of 2023. Excluding the losses that are covered by a third-party, the fourth quarter of 2023 would have experienced $2.0 million of net charge-offs versus $2.2 million of net charge-offs in the third quarter of 2023. Net charge-offs, excluding those losses covered by the third party were $6.5 million, or 0.20%, in 2023 compared to $4.3 million, or 0.16%, in 2022.
Deposits and Funding
Total deposits on the balance sheet at December 31, 2023 decreased to $3.27 billion from $3.29 billion at September 30, 2023 with excess deposits and associated cash balances swept off the balance sheet to optimize liquidity. Swept deposits receive full FDIC coverage, bringing the Bank’s percentage of uninsured or unsecured deposits to 22%. Liquidity sources represent almost 174% of uninsured or unsecured deposits as of December 31, 2023, up substantially from December 31, 2022.
Deposit growth in the Bank continues to benefit from better technology and unique convenience factors. During the fourth quarter, the community bank attracted $58 million in new deposit relationships with a weighted average cost of 2.37%. V1BE, the Bank’s proprietary invitation-only delivery tool, increased total users by 16% during the fourth quarter of 2023, from 1,013 at the end of the third quarter of 2023 to 1,179 at the end of the fourth quarter of 2023.
During the fourth quarter, the Bank opened approximately 1,000 new deposit account on the digital platform with a weighted average cost of 4.94%. This new customer growth is a direct result of referrals made to us by existing customers with no marketing costs incurred. At quarter end, the Bank had over 14,000 digital accounts with $910 million in total deposits and average balances of $63 thousand.
| (1) | Non-GAAP financial measure. Please see “Reconciliation of Non-GAAP Items” in the financial tables for more information and for a reconciliation to GAAP. |
As of December 31, 2023, the Bank has $75 million of brokered CDs that mature in the middle of 2024 and $30 million of overnight FHLB advances. The Bank has no other wholesale funding and has $113 million of deposits currently sweeping to other banks.
Digital Lines of Business
The Panacea Financial Division continues to experience substantial growth alongside the development of the nationally-recognized Panacea Financial brand. The Panacea Financial Division finished the fourth quarter of 2023 with approximately $322 million in outstanding loans, an increase of $4.1 million from September 30, 2023. As highlighted above, the division sold approximately $16 million of loans in the fourth quarter of 2023 for a pre-tax gain of $0.3 million.
Panacea-related customer deposits increased to $56 million at December 31, 2023, up 5% from September 30, 2023 and a higher growth rate than the growth in loans for the fourth quarter of 2023. Coupled with loan sales, the Panacea Financial Division is expected to continue increasing the amount with which it self-funds its balance sheet.
The Life Premium Finance (“LPF”) division ended the fourth quarter of 2023 with outstanding balances, net of deferred fees, of $382 million, compared to $361 million at the end of the third quarter of 2023, or an increase of 5.9%. LPF also participated out approximately $15 million of loans in the fourth quarter.
Primis Mortgage had a pre-tax loss of $733 thousand in the fourth quarter due to the expected seasonal slowdown in mortgage activity and increased hedging costs due to the rate volatility in the quarter. Primis Mortgage continues to aggressively manage costs to preserve profitability in a lower volume environment. The locked loan pipeline decreased at the end of the fourth quarter of 2023 to $23.1 million from $41.6 million at the end of the third quarter of 2023. Activity has increased as expected through January 2024 and the Company expects continued growth in production and profitability throughout 2024.
Shareholders’ Equity
Book value per common share as of December 31, 2023 was $16.09, an increase of $0.60 from September 30, 2023. Tangible book value per common share(1) at the end of the fourth quarter of 2023 was $12.23, an increase of $0.61 from September 30, 2023. Common shareholders’ equity was $397 million, or 10.25% of total assets, at December 31, 2023. Tangible common equity(1) at December 31, 2023 was $302 million, or 7.99% of tangible assets(1). After-tax unrealized losses on the Company’s available-for-sale securities portfolio decreased by $8.7 million to $21.8 million due to decreases in market interest rates during the fourth quarter of 2023. The Company has the intent and ability to hold these securities until maturity or recovery of the value and does not anticipate realizing any losses on the investments.
The Board of Directors declared a dividend of $0.10 per share payable on February 23, 2024 to shareholders of record on February 9, 2024. This is Primis’ forty-ninth consecutive quarterly dividend.
About Primis Financial Corp.
As of December 31, 2023, Primis had $3.9 billion in total assets, $3.2 billion in total loans and $3.3 billion in total deposits. Primis Bank provides a range of financial services to individuals and small- and medium-sized businesses through twenty-four full-service branches in Virginia and Maryland and provides services to customers through certain online and mobile applications.
| Contacts: | Address: |
| Dennis J. Zember, Jr., President and CEO | Primis Financial Corp. |
| Matthew A. Switzer, EVP and CFO | 1676 International Drive, Suite 900 |
| Phone: (703) 893-7400 | McLean, VA 22102 |
Primis Financial Corp., NASDAQ Symbol FRST
Website: www.primisbank.com
| (1) | Non-GAAP financial measure. Please see “Reconciliation of Non-GAAP Items” in the financial tables for more information and for a reconciliation to GAAP. |
Conference Call
The Company’s management will host a conference call to discuss its fourth quarter results on Friday, January 26, 2024 at 10:00 a.m. (ET). A live Webcast of the conference call is available at the following website: https://events.q4inc.com/attendee/441718411. Participants may also call 1-888-330-3573 and ask for the Primis Financial Corp. call. A replay of the teleconference will be available for 7 days by calling 1-800-770-2030 and providing Replay Access Code 4440924.
Non-GAAP Measures
Statements included in this press release include non-GAAP financial measures and should be read along with the accompanying tables. Primis uses non-GAAP financial measures to analyze its performance. The measures entitled net income adjusted for nonrecurring income and expenses; pre-tax pre-provision operating earnings; operating return on average assets; pre-tax pre-provision operating return on average assets; operating return on average equity; operating return on average tangible equity; operating efficiency ratio; operating earnings per share – basic; operating earnings per share – diluted; tangible book value per share; tangible common equity; tangible common equity to tangible assets; and core net interest margin are not measures recognized under GAAP and therefore are considered non-GAAP financial measures. We use the term “operating” to describe a financial measure that excludes income or expense considered to be non-recurring in nature. Items identified as non-operating are those that, when excluded from a reported financial measure, provide management or the reader with a measure that may be more indicative of forward-looking trends in our business. A reconciliation of these non-GAAP financial measures to the most comparable GAAP measures is provided in the Reconciliation of Non-GAAP Items table.
Management believes that these non-GAAP financial measures provide additional useful information about Primis that allows management and investors to evaluate the ongoing operating results, financial strength and performance of Primis and provide meaningful comparison to its peers. Non-GAAP financial measures should not be considered as an alternative to any measure of performance or financial condition as promulgated under GAAP, and investors should consider Primis’ performance and financial condition as reported under GAAP and all other relevant information when assessing the performance or financial condition of Primis. Non-GAAP financial measures are not standardized and, therefore, it may not be possible to compare these measures with other companies that present measures having the same or similar names.
Non-GAAP financial measures have limitations as analytical tools, and investors should not consider them in isolation or as a substitute for analysis of the results or financial condition as reported under GAAP.
Forward-Looking Statements
This press release and certain of our other filings with the Securities and Exchange Commission contain statements that constitute “forward-looking statements” within the meaning of, and subject to the protections of, Section 27A of the Securities Act of 1933, as amended, and Section 21E of the Securities Exchange Act of 1934, as amended. All statements other than statements of historical fact are forward-looking statements. Such statements can generally be identified by such words as "may," "plan," "contemplate," "anticipate," "believe," "intend," "continue," "expect," "project," "predict," "estimate," "could," "should," "would," "will," and other similar words or expressions of the future or otherwise regarding the outlook for the Company’s future business and financial performance and/or the performance of the banking industry and economy in general. These forward-looking statements include, but are not limited to, our expectations regarding our future operating and financial performance, including our outlook and long-term goals for future growth and new offerings and services; our expectations regarding net interest margin; expectations on our growth strategy, expense management, capital management and future profitability; expectations on credit quality and performance; and the assumptions underlying our expectations.
| (1) | Non-GAAP financial measure. Please see “Reconciliation of Non-GAAP Items” in the financial tables for more information and for a reconciliation to GAAP. |
Prospective investors are cautioned that any such forward-looking statements are not guarantees of future performance and involve known and unknown risks and uncertainties which may cause the actual results, performance or achievements of the Company to be materially different from the future results, performance or achievements expressed or implied by such forward-looking statements. Forward-looking statements are based on the information known to, and current beliefs and expectations of, the Company’s management and are subject to significant risks and uncertainties. Actual results may differ materially from those contemplated by such forward-looking statements. Factors that might cause such differences include, but are not limited to: the Company’s ability to implement its various strategic and growth initiatives, including its recently established Panacea Financial and Life Premium Finance Divisions, digital banking platform, V1BE fulfillment service and Primis Mortgage Company; competitive pressures among financial institutions increasing significantly; changes in applicable laws, rules, or regulations, including changes to statutes, regulations or regulatory policies or practices; changes in management’s plans for the future; credit risk associated with our lending activities; the impact of current and future economic and market conditions generally (including seasonality) and in the financial services industry, nationally and within our primary market areas; changes in interest rates, inflation, loan demand, real estate values, or competition, as well as labor shortages and supply chain disruptions; changes in accounting principles, policies, or guidelines; adverse results from current or future litigation, regulatory examinations or other legal and/or regulatory actions; potential impacts of adverse developments in the banking industry highlighted by high-profile bank failures, including impacts on customer confidence, deposit outflows, liquidity and the regulatory response thereto; potential increases in the provision for credit losses; our ability to identify and address increased cybersecurity risks, including those impacting vendors and other third parties; fraud or misconduct by internal or external actors, which we may not be able to prevent, detect or mitigate; acts of God or of war or other conflicts, including the current Ukraine/Russia conflict and Israel/Hamas conflict, acts of terrorism, pandemics or other catastrophic events that may affect general economic conditions; and other general competitive, economic, political, and market factors, including those affecting our business, operations, pricing, products, or services.
Forward-looking statements speak only as of the date on which such statements are made. These forward-looking statements are based upon information presently known to the Company’s management and are inherently subjective, uncertain and subject to change due to any number of risks and uncertainties, including, without limitation, the risks and other factors set forth in the Company’s filings with the Securities and Exchange Commission, the Company’s Annual Report on Form 10-K for the year ended December 31, 2022, under the captions “Cautionary Note Regarding Forward-Looking Statements” and “Risk Factors,” and in the Company’s Quarterly Reports on Form 10-Q and Current Reports on Form 8-K. The Company undertakes no obligation to update any forward-looking statement to reflect events or circumstances after the date on which such statement is made, or to reflect the occurrence of unanticipated events. Readers are cautioned not to place undue reliance on these forward-looking statements.
Primis Financial Corp.
Financial Highlights (unaudited)
(Dollars in thousands, except per share data)
| For Three Months Ended: | Variance - 4Q 2023 vs. | For Twelve Months Ended: | Variance | |||||||||||||||||||||||||||||||||||
| Selected Performance Ratios: | 4Q 2023 | 3Q 2023 | 2Q 2023 | 1Q 2023 | 4Q 2022 | 3Q 2023 | 4Q 2022 | 4Q 2023 | 4Q 2022 | YTD | ||||||||||||||||||||||||||||
| Return on average assets | 0.84 | % | (0.36 | )% | (0.03 | )% | 0.58 | % | 0.35 | % | 120 | bps | 49 | bps | 0.25 | % | 0.53 | % | (28 | )bps | ||||||||||||||||||
| Operating return on average assets(1) | 0.89 | % | 0.81 | % | 0.08 | % | 0.58 | % | 0.08 | % | 8 | 81 | 0.58 | % | 0.50 | % | 8 | |||||||||||||||||||||
| Pre-tax pre-provision return on average assets(1) | 1.22 | % | (0.03 | )% | 0.36 | % | 1.27 | % | 1.32 | % | 124 | (11 | ) | 0.70 | % | 1.02 | % | (32 | ) | |||||||||||||||||||
| Pre-tax pre-provision operating return on average assets(1) | 1.29 | % | 1.14 | % | 0.50 | % | 1.27 | % | 0.98 | % | 16 | 31 | 1.04 | % | 0.89 | % | 15 | |||||||||||||||||||||
| Return on average common equity | 8.37 | % | (3.54 | )% | (0.27 | )% | 5.64 | % | 3.04 | % | 1,191 | 533 | 2.51 | % | 4.35 | % | (184 | ) | ||||||||||||||||||||
| Operating return on average common equity(1) | 8.89 | % | 7.80 | % | 0.90 | % | 5.64 | % | 0.71 | % | 109 | 818 | 5.79 | % | 4.10 | % | 168 | |||||||||||||||||||||
| Operating return on average tangible common equity(1) | 11.82 | % | 10.69 | % | 1.23 | % | 7.69 | % | 0.98 | % | 114 | 1,084 | 7.86 | % | 5.59 | % | 227 | |||||||||||||||||||||
| Cost of funds | 2.85 | % | 2.75 | % | 2.83 | % | 2.20 | % | 1.19 | % | 9 | 165 | 2.66 | % | 0.75 | % | 191 | |||||||||||||||||||||
| Net interest margin | 3.36 | % | 3.01 | % | 2.64 | % | 3.15 | % | 3.67 | % | 36 | (31 | ) | 3.03 | % | 3.39 | % | (35 | ) | |||||||||||||||||||
| Core net interest margin(1) | 3.36 | % | 3.01 | % | 2.64 | % | 3.15 | % | 3.68 | % | 35 | (32 | ) | 3.03 | % | 3.40 | % | (36 | ) | |||||||||||||||||||
| Gross loans to deposits | 98.28 | % | 96.13 | % | 96.30 | % | 83.39 | % | 108.24 | % | 2 | pts | (10 | )pts | 98.28 | % | 108.24 | % | (10 | )pts | ||||||||||||||||||
| Efficiency ratio | 76.04 | % | 99.97 | % | 88.42 | % | 69.26 | % | 71.82 | % | (24 | ) | 422 | 83.00 | % | 73.50 | % | 950 | ||||||||||||||||||||
| Operating efficiency ratio(1) | 74.40 | % | 69.36 | % | 84.11 | % | 69.26 | % | 76.77 | % | 5 | (237 | ) | 74.04 | % | 75.66 | % | (163 | ) | |||||||||||||||||||
| Per Common Share Data: | ||||||||||||||||||||||||||||||||||||||
| Earnings per common share - Basic | $ | 0.33 | $ | (0.14 | ) | $ | (0.01 | ) | $ | 0.23 | $ | 0.12 | (330.29 | )% | 166.68 | % | $ | 0.40 | $ | 0.71 | (43.54 | )% | ||||||||||||||||
| Operating earnings per common share - Basic(1) | $ | 0.35 | $ | 0.32 | $ | 0.04 | $ | 0.23 | $ | 0.03 | 10.84 | 1,109.37 | $ | 0.93 | $ | 0.67 | 37.84 | |||||||||||||||||||||
| Earnings per common share - Diluted | $ | 0.33 | $ | (0.14 | ) | $ | (0.01 | ) | $ | 0.23 | $ | 0.12 | (329.92 | ) | 167.16 | $ | 0.40 | $ | 0.71 | (43.40 | ) | |||||||||||||||||
| Operating earnings per common share - Diluted(1) | $ | 0.35 | $ | 0.32 | $ | 0.04 | $ | 0.23 | $ | 0.03 | 10.66 | 1,111.55 | $ | 0.93 | $ | 0.67 | 38.18 | |||||||||||||||||||||
| Book value per common share | $ | 16.09 | $ | 15.49 | $ | 15.91 | $ | 16.13 | $ | 15.90 | 3.85 | 1.21 | $ | 16.09 | $ | 15.90 | 1.21 | |||||||||||||||||||||
| Tangible book value per common share(1) | $ | 12.23 | $ | 11.62 | $ | 11.57 | $ | 11.77 | $ | 11.53 | 5.26 | 6.06 | $ | 12.23 | $ | 11.53 | 6.06 | |||||||||||||||||||||
| Cash dividend per common share | $ | 0.10 | $ | 0.10 | $ | 0.10 | $ | 0.10 | $ | 0.10 | - | - | $ | 0.40 | $ | 0.40 | - | |||||||||||||||||||||
| Weighted average shares outstanding - Basic | 24,647,728 | 24,641,981 | 24,638,505 | 24,625,943 | 24,601,108 | 0.02 | 0.19 | 24,638,609 | 24,561,483 | 0.31 | ||||||||||||||||||||||||||||
| Weighted average shares outstanding - Diluted | 24,687,993 | 24,641,981 | 24,638,505 | 24,685,206 | 24,685,663 | 0.19 | 0.01 | 24,686,289 | 24,668,838 | 0.07 | ||||||||||||||||||||||||||||
| Shares outstanding at end of period | 24,693,172 | 24,686,764 | 24,690,064 | 24,685,064 | 24,680,097 | 0.03 | % | 0.05 | % | 24,693,172 | 24,680,097 | 0.05 | % | |||||||||||||||||||||||||
| Asset Quality Ratios: | ||||||||||||||||||||||||||||||||||||||
| Non-performing assets as a percent of total assets, excluding SBA guarantees | 0.20 | % | 0.51 | % | 0.64 | % | 0.78 | % | 0.98 | % | (31 | )bps | (78 | )bps | 0.20 | % | 0.98 | % | (78 | )bps | ||||||||||||||||||
| Net charge-offs (recoveries) as a percent of average loans (annualized) | 0.61 | % | 0.53 | % | 0.20 | % | 0.53 | % | 0.74 | % | 8 | (13 | ) | 0.47 | % | 0.23 | % | 24 | ||||||||||||||||||||
| Core net charge-offs (recoveries) as a percent of average loans (annualized)(2) | 0.24 | % | 0.27 | % | 0.02 | % | 0.28 | % | 0.53 | % | (3 | ) | (29 | ) | 0.20 | % | 0.16 | % | 4 | |||||||||||||||||||
| Allowance for credit losses to total loans | 1.06 | % | 1.13 | % | 1.21 | % | 1.17 | % | 1.17 | % | (7 | ) | (11 | ) | 1.06 | % | 1.17 | % | (11 | ) | ||||||||||||||||||
| Capital Ratios: | ||||||||||||||||||||||||||||||||||||||
| Common equity to assets | 10.25 | % | 9.98 | % | 10.15 | % | 9.43 | % | 10.99 | % | 27 | bps | (74 | )bps | ||||||||||||||||||||||||
| Tangible common equity to tangible assets(1) | 7.99 | % | 7.67 | % | 7.59 | % | 7.06 | % | 8.22 | % | 31 | (23 | ) | |||||||||||||||||||||||||
| Leverage ratio(3) | 8.93 | % | 8.78 | % | 8.14 | % | 8.59 | % | 9.48 | % | 15 | (55 | ) | |||||||||||||||||||||||||
| Common equity tier 1 capital ratio(3) | 10.00 | % | 9.64 | % | 9.38 | % | 10.04 | % | 10.54 | % | 36 | (54 | ) | |||||||||||||||||||||||||
| Tier 1 risk-based capital ratio(3) | 10.31 | % | 9.94 | % | 9.68 | % | 10.36 | % | 10.88 | % | 37 | (57 | ) | |||||||||||||||||||||||||
| Total risk-based capital ratio(3) | 13.75 | % | 13.37 | % | 13.16 | % | 14.20 | % | 14.80 | % | 38 | (105 | ) | |||||||||||||||||||||||||
(1) See Reconciliation of Non-GAAP financial measures.
(2) Excludes third-party charge-offs.
(3) December 31, 2023 ratios are estimated and may be subject to change pending the final filing of the FR Y-9C.
Primis Financial Corp.
(Dollars in thousands)
Condensed Consolidated Balance Sheets (unaudited)
| As Of : | Variance - 4Q 2023 vs. | |||||||||||||||||||||||||||
| 4Q 2023 | 3Q 2023 | 2Q 2023 | 1Q 2023 | 4Q 2022 | 3Q 2023 | 4Q 2022 | ||||||||||||||||||||||
| Assets | ||||||||||||||||||||||||||||
| Cash and cash equivalents | $ | 77,553 | $ | 93,865 | $ | 100,868 | $ | 607,125 | $ | 77,859 | (17.38 | )% | (0.39 | )% | ||||||||||||||
| Investment securities-available for sale | 228,420 | 216,875 | 223,087 | 231,468 | 236,315 | 5.32 | (3.34 | ) | ||||||||||||||||||||
| Investment securities-held to maturity | 11,650 | 11,975 | 12,378 | 13,115 | 13,520 | (2.71 | ) | (13.83 | ) | |||||||||||||||||||
| Loans held for sale | 57,691 | 66,266 | 57,704 | 42,011 | 27,626 | (12.94 | ) | 108.83 | ||||||||||||||||||||
| Loans receivable, net of deferred fees | 3,213,805 | 3,165,830 | 3,194,352 | 3,058,772 | 2,946,637 | 1.52 | 9.07 | |||||||||||||||||||||
| Allowance for credit losses | (34,040 | ) | (35,861 | ) | (38,544 | ) | (35,847 | ) | (34,544 | ) | (5.08 | ) | (1.46 | ) | ||||||||||||||
| Net loans | 3,179,765 | 3,129,969 | 3,155,807 | 3,022,925 | 2,912,093 | 1.59 | 9.19 | |||||||||||||||||||||
| Stock in Federal Reserve Bank and Federal Home Loan Bank | 14,246 | 12,796 | 12,083 | 12,083 | 25,815 | 11.33 | (44.82 | ) | ||||||||||||||||||||
| Bank premises and equipment, net | 20,611 | 24,878 | 25,298 | 25,136 | 25,257 | (17.15 | ) | (18.39 | ) | |||||||||||||||||||
| Operating lease right-of-use assets | 10,646 | 11,402 | 10,707 | 9,352 | 5,335 | (6.63 | ) | 99.55 | ||||||||||||||||||||
| Goodwill and other intangible assets | 95,417 | 95,741 | 107,215 | 107,539 | 107,863 | (0.34 | ) | (11.54 | ) | |||||||||||||||||||
| Assets held for sale, net | 6,735 | 3,115 | 3,115 | 3,115 | 3,115 | 116.21 | 116.21 | |||||||||||||||||||||
| Bank-owned life insurance | 67,588 | 67,176 | 67,985 | 67,591 | 67,201 | 0.61 | 0.58 | |||||||||||||||||||||
| Other real estate owned | - | - | - | - | - | - | - | |||||||||||||||||||||
| Deferred tax assets, net | 19,585 | 22,565 | 20,513 | 18,924 | 18,289 | (13.21 | ) | 7.09 | ||||||||||||||||||||
| Other assets | 86,167 | 76,478 | 71,925 | 59,792 | 49,211 | 12.67 | 75.10 | |||||||||||||||||||||
| Total assets | $ | 3,876,074 | $ | 3,833,101 | $ | 3,868,685 | $ | 4,220,176 | $ | 3,569,499 | 1.12 | % | 8.59 | % | ||||||||||||||
| Liabilities and stockholders' equity | ||||||||||||||||||||||||||||
| Demand deposits | $ | 472,941 | $ | 490,719 | $ | 480,832 | $ | 497,531 | $ | 582,556 | (3.62 | )% | (18.82 | )% | ||||||||||||||
| NOW accounts | 773,028 | 803,276 | 817,725 | 835,348 | 617,687 | (3.77 | ) | 25.15 | ||||||||||||||||||||
| Money market accounts | 794,530 | 800,951 | 850,359 | 865,115 | 811,365 | (0.80 | ) | (2.07 | ) | |||||||||||||||||||
| Savings accounts | 783,758 | 746,608 | 696,750 | 971,439 | 245,713 | 4.98 | 218.97 | |||||||||||||||||||||
| Time deposits | 445,898 | 451,850 | 471,330 | 498,564 | 465,057 | (1.32 | ) | (4.12 | ) | |||||||||||||||||||
| Total deposits | 3,270,155 | 3,293,404 | 3,316,996 | 3,667,997 | 2,722,378 | (0.71 | ) | 20.12 | ||||||||||||||||||||
| Securities sold under agreements to repurchase - short term | 3,044 | 3,838 | 3,921 | 4,346 | 6,445 | (20.69 | ) | (52.77 | ) | |||||||||||||||||||
| Federal Home Loan Bank advances | 30,000 | - | - | - | 325,000 | 100.00 | (90.77 | ) | ||||||||||||||||||||
| Secured borrowings | 20,332 | 19,702 | 20,604 | 17,169 | - | - | 100.00 | |||||||||||||||||||||
| Subordinated debt and notes | 95,595 | 95,524 | 95,453 | 95,382 | 95,312 | 0.07 | 0.30 | |||||||||||||||||||||
| Operating lease liabilities | 11,686 | 12,347 | 11,546 | 9,799 | 5,767 | (5.35 | ) | 102.64 | ||||||||||||||||||||
| Other liabilities | 26,500 | 25,797 | 27,371 | 27,418 | 22,232 | 2.73 | 19.20 | |||||||||||||||||||||
| Total liabilities | 3,457,312 | 3,450,612 | 3,475,891 | 3,822,111 | 3,177,134 | 0.19 | 8.82 | |||||||||||||||||||||
| Total Primis common stockholders' equity | 397,330 | 382,487 | 392,795 | 398,064 | 392,365 | 3.88 | 1.27 | |||||||||||||||||||||
| Noncontrolling interest | 21,432 | - | - | - | - | 100.00 | 100.00 | |||||||||||||||||||||
| Total stockholders' equity | 418,762 | 382,487 | 392,795 | 398,064 | 392,365 | 9.48 | 6.73 | |||||||||||||||||||||
| Total liabilities and stockholders' equity | $ | 3,876,074 | $ | 3,833,100 | $ | 3,868,686 | $ | 4,220,176 | $ | 3,569,499 | 1.12 | % | 8.59 | % | ||||||||||||||
| Tangible common equity(1) | $ | 301,913 | $ | 286,746 | $ | 285,580 | $ | 290,525 | $ | 284,502 | 5.29 | % | 6.12 | % | ||||||||||||||
Primis Financial Corp.
(Dollars in thousands)
Condensed Consolidated Statement of Operations (unaudited)
| For Three Months Ended: | Variance - 4Q 2023 vs. | For Twelve Months Ended: | Variance | |||||||||||||||||||||||||||||||||||||
| 4Q 2023 | 3Q 2023 | 2Q 2023 | 1Q 2023 | 4Q 2022 | 3Q 2023 | 4Q 2022 | 4Q 2023 | 4Q 2022 | YTD | |||||||||||||||||||||||||||||||
| Interest and dividend income | $ | 54,661 | $ | 50,808 | $ | 53,029 | $ | 47,395 | $ | 38,595 | 7.58 | % | 41.63 | % | $ | 205,893 | $ | 125,945 | 63.48 | % | ||||||||||||||||||||
| Interest expense | 24,405 | 23,672 | 26,794 | 18,902 | 9,058 | 3.09 | 169.43 | 93,774 | 21,587 | NM | ||||||||||||||||||||||||||||||
| Net interest income | 30,256 | 27,136 | 26,235 | 28,493 | 29,537 | 11.50 | 2.43 | 112,119 | 104,358 | 7.44 | ||||||||||||||||||||||||||||||
| Provision for credit losses | 3,141 | 1,612 | 4,312 | 5,307 | 7,860 | 94.86 | (60.04 | ) | 14,371 | 11,271 | 27.51 | |||||||||||||||||||||||||||||
| Net interest income after provision for credit losses | 27,115 | 25,524 | 21,923 | 23,186 | 21,677 | 6.23 | 25.09 | 97,748 | 93,087 | 5.01 | ||||||||||||||||||||||||||||||
| Account maintenance and deposit service fees | 1,578 | 1,503 | 1,430 | 1,216 | 1,427 | 4.99 | 10.58 | 5,727 | 5,745 | (0.31 | ) | |||||||||||||||||||||||||||||
| Income from bank-owned life insurance | 420 | 787 | 394 | 420 | 847 | (46.63 | ) | (50.41 | ) | 2,021 | 1,994 | 1.35 | ||||||||||||||||||||||||||||
| Mortgage banking income | 3,210 | 4,922 | 5,198 | 4,315 | 2,264 | (34.78 | ) | 41.78 | 17,645 | 5,054 | 249.13 | |||||||||||||||||||||||||||||
| Gain on sale of loans | 290 | 451 | - | 52 | - | (35.76 | ) | - | 793 | - | 100.00 | |||||||||||||||||||||||||||||
| Credit enhancement income | 3,124 | 2,047 | 1,152 | 4,886 | 1,822 | 52.61 | 71.46 | 11,209 | 3,042 | 100.00 | ||||||||||||||||||||||||||||||
| Gain on sale of other investment | 190 | - | - | - | 4,411 | - | (95.69 | ) | 190 | 4,411 | (95.69 | ) | ||||||||||||||||||||||||||||
| Other | 168 | 232 | 130 | 217 | 217 | (27.59 | ) | (22.58 | ) | 747 | 1,082 | (30.96 | ) | |||||||||||||||||||||||||||
| Noninterest income | 8,980 | 9,942 | 8,304 | 11,106 | 10,988 | (9.68 | ) | (18.27 | ) | 38,332 | 21,328 | 79.73 | ||||||||||||||||||||||||||||
| Employee compensation and benefits | 14,645 | 13,809 | 15,283 | 15,028 | 16,213 | 6.05 | (9.67 | ) | 58,765 | 49,005 | 19.92 | |||||||||||||||||||||||||||||
| Occupancy and equipment expenses | 2,982 | 3,170 | 3,445 | 3,022 | 2,899 | (5.93 | ) | 2.86 | 12,619 | 10,859 | 16.21 | |||||||||||||||||||||||||||||
| Amortization of intangible assets | 317 | 317 | 318 | 317 | 317 | - | - | 1,269 | 1,325 | (4.23 | ) | |||||||||||||||||||||||||||||
| Goodwill impairment | - | 11,150 | - | - | - | (100.00 | ) | - | 11,150 | - | 100.00 | |||||||||||||||||||||||||||||
| Virginia franchise tax expense | 849 | 849 | 848 | 849 | 814 | - | 4.30 | 3,395 | 3,254 | 4.33 | ||||||||||||||||||||||||||||||
| Data processing expense | 2,217 | 2,250 | 2,828 | 2,251 | 1,702 | (1.47 | ) | 30.26 | 9,546 | 6,013 | 58.76 | |||||||||||||||||||||||||||||
| Marketing expense | 352 | 377 | 521 | 569 | 933 | (6.63 | ) | (62.27 | ) | 1,819 | 3,067 | (40.69 | ) | |||||||||||||||||||||||||||
| Telecommunication and communication expense | 358 | 356 | 416 | 377 | 343 | 0.56 | 4.37 | 1,507 | 1,433 | 5.16 | ||||||||||||||||||||||||||||||
| Net (gain) loss on other real estate owned | - | - | - | - | 131 | - | (100.00 | ) | - | 72 | (100.00 | ) | ||||||||||||||||||||||||||||
| Loss (gain) on bank premises and equipment | 478 | (2 | ) | - | - | - | NM | 100.00 | 476 | 684 | (30.41 | ) | ||||||||||||||||||||||||||||
| Professional fees | 1,586 | 1,118 | 1,075 | 862 | 1,605 | 41.86 | (1.18 | ) | 4,641 | 4,787 | (3.05 | ) | ||||||||||||||||||||||||||||
| Credit enhancement costs | 2,823 | 337 | 515 | 873 | 1,369 | 737.69 | 106.21 | 4,548 | 1,369 | 100.00 | ||||||||||||||||||||||||||||||
| Other expenses | 3,229 | 3,335 | 5,291 | 3,277 | 2,780 | (3.19 | ) | 16.14 | 15,132 | 10,508 | 44.01 | |||||||||||||||||||||||||||||
| Noninterest expense | 29,836 | 37,066 | 30,540 | 27,425 | 29,106 | (19.51 | ) | 2.51 | 124,868 | 92,376 | 35.17 | |||||||||||||||||||||||||||||
| Income (loss) before income taxes | 6,259 | (1,600 | ) | (313 | ) | 6,866 | 3,559 | NM | 75.87 | 11,212 | 22,039 | (49.13 | ) | |||||||||||||||||||||||||||
| Income tax expense (benefit) | 418 | 1,925 | (46 | ) | 1,254 | 519 | (78.29 | ) | (19.51 | ) | 3,552 | 4,490 | (20.89 | ) | ||||||||||||||||||||||||||
| Net Income (loss) | 5,841 | (3,526 | ) | (268 | ) | 5,612 | 3,040 | (265.68 | ) | 92.17 | 7,660 | 17,549 | (56.35 | ) | ||||||||||||||||||||||||||
| Noncontrolling interest | $ | 2,280 | - | - | - | - | 100.00 | 100.00 | 2,280 | - | 100.00 | |||||||||||||||||||||||||||||
| Net income (loss) attributable to Primis' common shareholders | $ | 8,121 | $ | (3,526 | ) | $ | (268 | ) | $ | 5,612 | $ | 3,040 | (330.35 | ) | 167.18 | $ | 9,940 | $ | 17,549 | (43.36 | ) | |||||||||||||||||||
Primis Financial Corp.
(Dollars in thousands)
| As Of: | Variance - 4Q 2023 vs. | |||||||||||||||||||||||||||
| Loan Portfolio Composition | 4Q 2023 | 3Q 2023 | 2Q 2023 | 1Q 2023 | 4Q 2022 | 3Q 2023 | 4Q 2022 | |||||||||||||||||||||
| Loans held for sale | $ | 57,691 | $ | 66,266 | $ | 57,704 | $ | 42,011 | $ | 27,626 | (12.94 | )% | 108.83 | % | ||||||||||||||
| Loans secured by real estate: | ||||||||||||||||||||||||||||
| Commercial real estate - owner occupied | 456,283 | 439,627 | 455,252 | 465,072 | 461,126 | 3.79 | (1.05 | ) | ||||||||||||||||||||
| Commercial real estate - non-owner occupied | 579,960 | 578,261 | 597,254 | 577,481 | 581,168 | 0.29 | (0.21 | ) | ||||||||||||||||||||
| Secured by farmland | 6,339 | 6,381 | 6,577 | 6,258 | 7,290 | (0.66 | ) | (13.05 | ) | |||||||||||||||||||
| Construction and land development | 164,808 | 172,071 | 175,141 | 151,950 | 148,762 | (4.22 | ) | 10.79 | ||||||||||||||||||||
| Residential 1-4 family | 607,029 | 601,198 | 592,756 | 607,118 | 610,919 | 0.97 | (0.64 | ) | ||||||||||||||||||||
| Multi-family residential | 127,857 | 129,586 | 133,754 | 139,978 | 140,321 | (1.33 | ) | (8.88 | ) | |||||||||||||||||||
| Home equity lines of credit | 59,670 | 59,996 | 62,808 | 64,606 | 65,152 | (0.54 | ) | (8.41 | ) | |||||||||||||||||||
| Total real estate loans | 2,001,946 | 1,987,120 | 2,023,542 | 2,012,463 | 2,014,738 | 0.75 | (0.63 | ) | ||||||||||||||||||||
| Commercial loans | 603,862 | 607,142 | 599,527 | 558,454 | 522,057 | (0.54 | ) | 15.67 | ||||||||||||||||||||
| Paycheck Protection Program loans | 2,023 | 2,105 | 2,143 | 2,603 | 4,564 | (3.90 | ) | (55.67 | ) | |||||||||||||||||||
| Consumer loans | 605,974 | 569,463 | 569,139 | 485,252 | 405,278 | 6.41 | 49.52 | |||||||||||||||||||||
| Loans receivable, net of deferred fees | $ | 3,213,805 | $ | 3,165,830 | $ | 3,194,352 | $ | 3,058,772 | $ | 2,946,637 | 1.52 | % | 9.07 | % | ||||||||||||||
| Loans by Risk Grade: | ||||||||||||||||||||||||||||
| Pass, not graded | $ | - | $ | - | $ | - | $ | - | $ | - | - | % | - | % | ||||||||||||||
| Pass Grade 1 - Highest Quality | 875 | 851 | 743 | 607 | 600 | 2.82 | 45.83 | |||||||||||||||||||||
| Pass Grade 2 - Good Quality | 405,019 | 383,306 | 367,950 | 253,665 | 209,605 | 5.66 | 93.23 | |||||||||||||||||||||
| Pass Grade 3 - Satisfactory Quality | 1,626,380 | 1,609,924 | 1,624,626 | 1,596,091 | 1,590,765 | 1.02 | 2.24 | |||||||||||||||||||||
| Pass Grade 4 - Pass | 1,149,362 | 1,109,638 | 1,134,932 | 1,140,632 | 1,072,352 | 3.58 | 7.18 | |||||||||||||||||||||
| Pass Grade 5 - Special Mention | 14,930 | 33,299 | 32,383 | 28,273 | 32,278 | (55.16 | ) | (53.75 | ) | |||||||||||||||||||
| Grade 6 - Substandard | 17,239 | 28,812 | 33,718 | 39,504 | 41,037 | (40.17 | ) | (57.99 | ) | |||||||||||||||||||
| Grade 7 - Doubtful | - | - | - | - | - | - | - | |||||||||||||||||||||
| Grade 8 - Loss | - | - | - | - | - | - | - | |||||||||||||||||||||
| Total loans | $ | 3,213,805 | $ | 3,165,830 | $ | 3,194,352 | $ | 3,058,772 | $ | 2,946,637 | 1.52 | % | 9.07 | % | ||||||||||||||
| (Dollars in thousands) | As Of or For Three Months Ended: | |||||||||||||||||||||||||||
| Asset Quality Information | 4Q 2023 | 3Q 2023 | 2Q 2023 | 1Q 2023 | 4Q 2022 | |||||||||||||||||||||||
| Allowance for Credit Losses: | ||||||||||||||||||||||||||||
| Balance at beginning of period | $ | (35,861 | ) | $ | (38,544 | ) | $ | (35,847 | ) | $ | (34,544 | ) | $ | (31,956 | ) | |||||||||||||
| Provision for for credit losses | (3,141 | ) | (1,612 | ) | (4,312 | ) | (5,307 | ) | (7,860 | ) | ||||||||||||||||||
| Net charge-offs | 4,962 | 4,295 | 1,614 | 4,004 | 5,272 | |||||||||||||||||||||||
| Ending balance | $ | (34,040 | ) | $ | (35,861 | ) | $ | (38,544 | ) | $ | (35,847 | ) | $ | (34,544 | ) | |||||||||||||
| Reserve for Unfunded Commitments: | ||||||||||||||||||||||||||||
| Balance at beginning of period | $ | (1,024 | ) | $ | (1,281 | ) | $ | (1,527 | ) | $ | (1,416 | ) | $ | (1,380 | ) | |||||||||||||
| (Expense for) / recovery of unfunded loan commitment reserve | (67 | ) | 257 | 246 | (111 | ) | (36 | ) | ||||||||||||||||||||
| Total Reserve for Unfunded Commitments | $ | (1,091 | ) | $ | (1,024 | ) | $ | (1,281 | ) | $ | (1,527 | ) | $ | (1,416 | ) | |||||||||||||
| As Of: | Variance - 4Q 2023 vs. | |||||||||||||||||||||||||||
| Non-Performing Assets: | 4Q 2023 | 3Q 2023 | 2Q 2023 | 1Q 2023 | 4Q 2022 | 3Q 2023 | 4Q 2022 | |||||||||||||||||||||
| Nonaccrual loans | $ | 9,095 | $ | 20,171 | $ | 25,290 | $ | 33,397 | $ | 35,484 | (54.91 | )% | (74.37 | )% | ||||||||||||||
| Accruing loans delinquent 90 days or more | 1,714 | 1,714 | 1,714 | 1,625 | 3,361 | - | (49.00 | ) | ||||||||||||||||||||
| Total non-performing loans | 10,809 | 21,885 | 27,004 | 35,022 | 38,845 | (50.61 | ) | (72.17 | ) | |||||||||||||||||||
| Other real estate owned | - | - | - | - | - | - | - | |||||||||||||||||||||
| Total non-performing assets | $ | 10,809 | $ | 21,885 | $ | 27,004 | $ | 35,022 | $ | 38,845 | (50.61 | ) | (72.17 | ) | ||||||||||||||
| SBA guaranteed portion of non-performing loans | $ | 3,115 | $ | 2,290 | $ | 2,331 | $ | 2,206 | $ | 3,969 | 36.03 | (21.52 | ) | |||||||||||||||
Primis Financial Corp.
(Dollars in thousands)
| For Three Months Ended: | Variance - 4Q 2023 vs. | For Twelve Months Ended: | Variance | |||||||||||||||||||||||||||||||||||||
| Average Balance Sheet | 4Q 2023 | 3Q 2023 | 2Q 2023 | 1Q 2023 | 4Q 2022 | 3Q 2023 | 4Q 2022 | 4Q 2023 | 4Q 2022 | YTD | ||||||||||||||||||||||||||||||
| Assets | ||||||||||||||||||||||||||||||||||||||||
| Loans held for sale | $ | 48,380 | $ | 55,775 | $ | 48,698 | $ | 25,346 | $ | 22,413 | (13.26 | )% | 115.86 | % | $ | 44,643 | $ | 12,722 | 250.91 | % | ||||||||||||||||||||
| Loans, net of deferred fees | 3,212,140 | 3,195,417 | 3,122,660 | 3,007,005 | 2,822,693 | 0.52 | 13.80 | 3,133,883 | 2,590,602 | 20.97 | ||||||||||||||||||||||||||||||
| Investment securities | 228,335 | 234,601 | 240,700 | 246,402 | 253,345 | (2.67 | ) | (9.87 | ) | 237,452 | 278,162 | (14.64 | ) | |||||||||||||||||||||||||||
| Other earning assets | 79,925 | 93,159 | 568,251 | 388,327 | 92,604 | (14.21 | ) | (13.69 | ) | 281,052 | 200,828 | 39.95 | ||||||||||||||||||||||||||||
| Total earning assets | 3,568,780 | 3,578,952 | 3,980,309 | 3,667,080 | 3,191,055 | (0.28 | ) | 11.84 | 3,697,030 | 3,082,314 | 19.94 | |||||||||||||||||||||||||||||
| Other assets | 264,573 | 267,527 | 258,528 | 253,734 | 246,754 | (1.10 | ) | 7.22 | 261,834 | 234,286 | 11.76 | |||||||||||||||||||||||||||||
| Total assets | $ | 3,833,353 | $ | 3,846,480 | $ | 4,238,836 | $ | 3,920,814 | $ | 3,437,809 | (0.34 | )% | 11.51 | % | $ | 3,958,864 | $ | 3,316,600 | 19.37 | % | ||||||||||||||||||||
| Liabilities and equity | ||||||||||||||||||||||||||||||||||||||||
| Demand deposits | $ | 473,750 | $ | 472,485 | $ | 473,295 | $ | 556,479 | $ | 648,151 | 0.27 | % | (26.91 | )% | $ | 495,105 | $ | 614,285 | (19.40 | )% | ||||||||||||||||||||
| Interest-bearing liabilities: | ||||||||||||||||||||||||||||||||||||||||
| NOW and other demand accounts | 782,305 | 806,339 | 826,598 | 722,584 | 624,868 | (2.98 | ) | 25.20 | 784,680 | 698,907 | 12.27 | |||||||||||||||||||||||||||||
| Money market accounts | 790,971 | 850,892 | 858,532 | 824,541 | 805,303 | (7.04 | ) | (1.78 | ) | 831,196 | 807,330 | 2.96 | ||||||||||||||||||||||||||||
| Savings accounts | 783,432 | 703,809 | 1,026,085 | 593,823 | 232,543 | 11.31 | 236.90 | 777,143 | 224,682 | 245.89 | ||||||||||||||||||||||||||||||
| Time deposits | 451,521 | 460,961 | 495,721 | 489,066 | 379,088 | (2.05 | ) | 19.11 | 474,178 | 350,720 | 35.20 | |||||||||||||||||||||||||||||
| Total Deposits | 3,281,979 | 3,294,486 | 3,680,231 | 3,186,493 | 2,689,953 | (0.38 | ) | 22.01 | 3,362,302 | 2,695,924 | 24.72 | |||||||||||||||||||||||||||||
| Borrowings | 120,913 | 118,806 | 120,398 | 302,115 | 325,100 | 1.77 | (62.81 | ) | 164,488 | 193,050 | (14.80 | ) | ||||||||||||||||||||||||||||
| Total Funding | 3,402,892 | 3,413,292 | 3,800,629 | 3,488,608 | 3,015,053 | (0.30 | ) | 12.86 | 3,526,790 | 2,888,974 | 22.08 | |||||||||||||||||||||||||||||
| Other Liabilities | 38,390 | 37,743 | 37,274 | 28,613 | 26,318 | 1.72 | 45.87 | 35,530 | 23,825 | 49.13 | ||||||||||||||||||||||||||||||
| Total liabilites | 3,441,282 | 3,451,035 | 3,837,903 | 3,517,221 | 3,041,371 | (0.28 | ) | 13.15 | 3,562,320 | 2,912,799 | 22.30 | |||||||||||||||||||||||||||||
| Primis common stockholders' equity | 384,849 | 395,445 | 400,933 | 403,593 | 396,438 | (2.68 | ) | (2.92 | ) | 395,957 | 403,801 | (1.94 | ) | |||||||||||||||||||||||||||
| Noncontrolling interest | 7,222 | — | - | - | - | 100.00 | 100.00 | 587 | - | 100.00 | ||||||||||||||||||||||||||||||
| Total stockholders' equity | 392,071 | 395,445 | 400,933 | 403,593 | 396,438 | (0.85 | ) | (1.10 | ) | 396,544 | 403,801 | (1.80 | ) | |||||||||||||||||||||||||||
| Total liabilities and stockholders' equity | $ | 3,833,353 | $ | 3,846,480 | $ | 4,238,836 | $ | 3,920,814 | $ | 3,437,809 | (0.34 | )% | 11.51 | % | $ | 3,958,864 | $ | 3,316,600 | 19.37 | % | ||||||||||||||||||||
| Memo: Average PPP loans | $ | 2,081 | $ | 2,126 | $ | 2,407 | $ | 3,001 | $ | 5,926 | (2.12 | )% | (64.88 | )% | $ | 2,400 | $ | 23,152 | (89.63 | )% | ||||||||||||||||||||
| Net Interest Income | ||||||||||||||||||||||||||||||||||||||||
| Loans held for sale | $ | 842 | $ | 873 | $ | 700 | $ | 391 | $ | 349 | (3.55 | )% | 141.26 | % | $ | 2,806 | $ | 705 | 298.01 | % | ||||||||||||||||||||
| Loans | 51,220 | 47,220 | 43,620 | 41,196 | 35,841 | 8.47 | 42.91 | 183,256 | 117,033 | 56.58 | ||||||||||||||||||||||||||||||
| Investment securities | 1,646 | 1,593 | 1,551 | 1,584 | 1,571 | 3.33 | 4.77 | 6,374 | 5,964 | 6.87 | ||||||||||||||||||||||||||||||
| Other earning assets | 953 | 1,122 | 7,158 | 4,224 | 834 | (15.06 | ) | 14.27 | 13,457 | 2,243 | NM | |||||||||||||||||||||||||||||
| Total Earning Assets Income | 54,661 | 50,808 | 53,029 | 47,395 | 38,595 | 7.58 | 41.63 | 205,893 | 125,945 | 63.48 | ||||||||||||||||||||||||||||||
| Non-interest bearing DDA | - | - | - | - | - | - | - | - | - | - | ||||||||||||||||||||||||||||||
| NOW and other interest-bearing demand accounts | 4,334 | 4,460 | 4,343 | 2,267 | 544 | (2.83 | ) | NM | 15,404 | 2,303 | NM | |||||||||||||||||||||||||||||
| Money market accounts | 6,129 | 6,555 | 6,231 | 4,801 | 2,894 | (6.50 | ) | 111.78 | 23,717 | 6,357 | 273.08 | |||||||||||||||||||||||||||||
| Savings accounts | 7,860 | 6,760 | 10,405 | 4,750 | 305 | 16.27 | NM | 29,774 | 737 | NM | ||||||||||||||||||||||||||||||
| Time deposits | 3,964 | 3,801 | 3,804 | 3,226 | 1,567 | 4.29 | 152.97 | 14,795 | 3,884 | 280.92 | ||||||||||||||||||||||||||||||
| Total Deposit Costs | 22,287 | 21,576 | 24,783 | 15,044 | 5,310 | 3.30 | NM | 83,690 | 13,281 | NM | ||||||||||||||||||||||||||||||
| Borrowings | 2,118 | 2,096 | 2,011 | 3,858 | 3,748 | 1.03 | (43.49 | ) | 10,084 | 8,306 | 21.41 | |||||||||||||||||||||||||||||
| Total Funding Costs | 24,405 | 23,672 | 26,794 | 18,902 | 9,058 | 3.09 | 169.43 | 93,774 | 21,587 | NM | ||||||||||||||||||||||||||||||
| Net Interest Income | $ | 30,256 | $ | 27,136 | $ | 26,235 | $ | 28,493 | $ | 29,537 | 11.50 | % | 2.43 | % | $ | 112,119 | $ | 104,358 | 7.44 | % | ||||||||||||||||||||
| Memo: SBA PPP loan interest and fee income | $ | 5 | $ | 5 | $ | 6 | $ | 3 | $ | 14 | - | % | (64.29 | )% | $ | 19 | $ | 533 | (96.44 | )% | ||||||||||||||||||||
| Memo: SBA PPP loan funding costs | $ | 2 | $ | 2 | $ | 2 | $ | 3 | $ | 5 | - | % | (60.00 | )% | $ | 9 | $ | 81 | (88.89 | )% | ||||||||||||||||||||
| Net Interest Margin | ||||||||||||||||||||||||||||||||||||||||
| Loans held for sale | 6.90 | % | 6.21 | % | 5.77 | % | 6.26 | % | 6.18 | % | 69 | bps | 72 | bps | 6.29 | % | 5.54 | % | 75 | bps | ||||||||||||||||||||
| Loans | 6.33 | % | 5.86 | % | 5.60 | % | 5.56 | % | 5.04 | % | 46 | 129 | 5.85 | % | 4.52 | % | 133 | |||||||||||||||||||||||
| Investments | 2.86 | % | 2.69 | % | 2.58 | % | 2.61 | % | 2.46 | % | 17 | 40 | 2.68 | % | 2.14 | % | 54 | |||||||||||||||||||||||
| Other Earning Assets | 4.73 | % | 4.78 | % | 5.05 | % | 4.41 | % | 3.57 | % | (5 | ) | 116 | 4.79 | % | 1.12 | % | 367 | ||||||||||||||||||||||
| Total Earning Assets | 6.08 | % | 5.63 | % | 5.34 | % | 5.24 | % | 4.80 | % | 44 | 128 | 5.57 | % | 4.09 | % | 148 | |||||||||||||||||||||||
| NOW | 2.20 | % | 2.19 | % | 2.11 | % | 1.27 | % | 0.35 | % | 1 | 185 | 1.96 | % | 0.33 | % | 163 | |||||||||||||||||||||||
| MMDA | 3.07 | % | 3.06 | % | 2.91 | % | 2.36 | % | 1.43 | % | 1 | 164 | 2.85 | % | 0.79 | % | 206 | |||||||||||||||||||||||
| Savings | 3.98 | % | 3.81 | % | 4.07 | % | 3.24 | % | 0.52 | % | 17 | 346 | 3.83 | % | 0.33 | % | 350 | |||||||||||||||||||||||
| CDs | 3.48 | % | 3.27 | % | 3.08 | % | 2.68 | % | 1.64 | % | 21 | 184 | 3.12 | % | 1.11 | % | 201 | |||||||||||||||||||||||
| Cost of Interest Bearing Deposits | 3.15 | % | 3.03 | % | 3.10 | % | 2.32 | % | 1.03 | % | 12 | 212 | 2.92 | % | 0.64 | % | 228 | |||||||||||||||||||||||
| Cost of Deposits | 2.69 | % | 2.60 | % | 2.70 | % | 1.91 | % | 0.78 | % | 9 | 191 | 2.49 | % | 0.49 | % | 200 | |||||||||||||||||||||||
| Other Funding | 6.95 | % | 7.00 | % | 6.70 | % | 5.18 | % | 4.57 | % | (5 | ) | 238 | 6.13 | % | 4.30 | % | 183 | ||||||||||||||||||||||
| Total Cost of Funds | 2.85 | % | 2.75 | % | 2.83 | % | 2.20 | % | 1.19 | % | 9 | 165 | 2.66 | % | 0.75 | % | 191 | |||||||||||||||||||||||
| Net Interest Margin | 3.36 | % | 3.01 | % | 2.64 | % | 3.15 | % | 3.67 | % | 36 | (31 | ) | 3.03 | % | 3.39 | % | (35 | ) | |||||||||||||||||||||
| Net Interest Spread | 2.77 | % | 2.46 | % | 2.12 | % | 2.63 | % | 3.28 | % | 31 | (51 | ) | 2.48 | % | 3.14 | % | (66 | ) | |||||||||||||||||||||
| Memo: Excluding SBA PPP loans | ||||||||||||||||||||||||||||||||||||||||
| Loans | 6.33 | % | 5.87 | % | 5.61 | % | 5.56 | % | 5.05 | % | 46 | bps | 128 | bps | 5.85 | % | 4.54 | % | 131 | bps | ||||||||||||||||||||
| Total Earning Assets | 6.08 | % | 5.64 | % | 5.35 | % | 5.25 | % | 4.81 | % | 44 | 127 | 5.57 | % | 4.10 | % | 147 | |||||||||||||||||||||||
| Net Interest Margin* | 3.36 | % | 3.01 | % | 2.64 | % | 3.15 | % | 3.68 | % | 35 | (32 | ) | 3.03 | % | 3.40 | % | (36 | ) | |||||||||||||||||||||
*Net interest margin excluding the effect of SBA PPP loans assumes a funding cost of 35bps on average PPP balances in all applicable periods
The company defines "NM" as not meaningful for increases or decreases greater than 300 percent.
| Primis Financial Corp. |
| (Dollars in thousands, except per share data) |
| For Three Months Ended: | For Twelve Months Ended: | |||||||||||||||||||||||||||
| Reconciliation of Non-GAAP items: | 4Q 2023 | 3Q 2023 | 2Q 2023 | 1Q 2023 | 4Q 2022 | 4Q 2023 | 4Q 2022 | |||||||||||||||||||||
| Net income (loss) attributable to Primis' common shareholders | $ | 8,121 | $ | (3,526 | ) | $ | (268 | ) | $ | 5,612 | $ | 3,040 | $ | 9,940 | $ | 17,549 | ||||||||||||
| Non-GAAP adjustments to Net Income: | ||||||||||||||||||||||||||||
| Branch Consolidation / Other restructuring | 449 | - | 1,488 | - | 1,175 | 1,937 | 2,384 | |||||||||||||||||||||
| Professional fee expenses related to Panacea investment | 194 | - | - | - | - | 194 | ||||||||||||||||||||||
| Gain on sale of Infinex investment | - | - | - | - | (4,144 | ) | - | (4,144 | ) | |||||||||||||||||||
| Merger expenses | - | - | - | - | - | - | 516 | |||||||||||||||||||||
| Goodwill impairment | - | 11,150 | - | - | - | 11,150 | - | |||||||||||||||||||||
| Loan officer fraud, operational losses | - | 200 | - | - | - | 200 | - | |||||||||||||||||||||
| Income tax effect | (139 | ) | (44 | ) | (321 | ) | - | 641 | (504 | ) | 269 | |||||||||||||||||
| Net income (loss) attributable to Primis' common shareholders adjusted for nonrecurring income and expenses | $ | 8,625 | $ | 7,780 | $ | 899 | $ | 5,612 | $ | 712 | $ | 22,917 | $ | 16,574 | ||||||||||||||
| Net income (loss) attributable to Primis' common shareholders | $ | 8,121 | $ | (3,526 | ) | $ | (268 | ) | $ | 5,612 | $ | 3,040 | $ | 9,940 | $ | 17,549 | ||||||||||||
| Income tax expense (benefit) | 418 | 1,925 | (46 | ) | 1,254 | 519 | 3,552 | 4,490 | ||||||||||||||||||||
| Provision for credit losses (incl. unfunded commitment expense) | 3,208 | 1,355 | 4,066 | 5,418 | 7,896 | 14,046 | 11,710 | |||||||||||||||||||||
| Pre-tax pre-provision earnings | $ | 11,747 | $ | (246 | ) | $ | 3,752 | $ | 12,284 | $ | 11,455 | $ | 27,538 | $ | 33,749 | |||||||||||||
| Effect of adjustment for nonrecurring income and expenses | 643 | 11,350 | 1,488 | - | (2,969 | ) | 13,481 | (4,286 | ) | |||||||||||||||||||
| Pre-tax pre-provision operating earnings | $ | 12,390 | $ | 11,104 | $ | 5,240 | $ | 12,284 | $ | 8,486 | $ | 41,019 | $ | 29,463 | ||||||||||||||
| Return on average assets | 0.84 | % | (0.36 | )% | (0.03 | )% | 0.58 | % | 0.35 | % | 0.25 | % | 0.53 | % | ||||||||||||||
| Effect of adjustment for nonrecurring income and expenses | 0.05 | % | 1.17 | % | 0.11 | % | 0.00 | % | (0.27 | )% | 0.33 | % | (0.03 | )% | ||||||||||||||
| Operating return on average assets | 0.89 | % | 0.81 | % | 0.08 | % | 0.58 | % | 0.08 | % | 0.58 | % | 0.50 | % | ||||||||||||||
| Return on average assets | 0.84 | % | (0.36 | )% | (0.03 | )% | 0.58 | % | 0.35 | % | 0.25 | % | 0.53 | % | ||||||||||||||
| Effect of tax expense | 0.04 | % | 0.20 | % | (0.00 | )% | 0.13 | % | 0.06 | % | 0.09 | % | 0.14 | % | ||||||||||||||
| Effect of provision for credit losses (incl. unfunded commitment expense) | 0.34 | % | 0.13 | % | 0.39 | % | 0.56 | % | 0.91 | % | 0.36 | % | 0.35 | % | ||||||||||||||
| Pre-tax pre-provision return on average assets | 1.22 | % | (0.03 | )% | 0.36 | % | 1.27 | % | 1.32 | % | 0.70 | % | 1.02 | % | ||||||||||||||
| Effect of adjustment for nonrecurring income and expenses and expenses | 0.07 | % | 1.17 | % | 0.14 | % | 0.00 | % | (0.34 | )% | 0.34 | % | (0.13 | )% | ||||||||||||||
| Pre-tax pre-provision operating return on average assets | 1.29 | % | 1.14 | % | 0.50 | % | 1.27 | % | 0.98 | % | 1.04 | % | 0.89 | % | ||||||||||||||
| Return on average common equity | 8.37 | % | (3.54 | )% | (0.27 | )% | 5.64 | % | 3.04 | % | 2.51 | % | 4.35 | % | ||||||||||||||
| Effect of adjustment for nonrecurring income and expenses | 0.52 | % | 11.34 | % | 1.17 | % | 0.00 | % | (2.33 | )% | 3.28 | % | (0.25 | )% | ||||||||||||||
| Operating return on average common equity | 8.89 | % | 7.80 | % | 0.90 | % | 5.64 | % | 0.71 | % | 5.79 | % | 4.10 | % | ||||||||||||||
| Effect of goodwill and other intangible assets | 2.93 | % | 2.89 | % | 0.33 | % | 2.05 | % | 0.27 | % | 2.07 | % | 1.49 | % | ||||||||||||||
| Operating return on average tangible common equity | 11.82 | % | 10.69 | % | 1.23 | % | 7.69 | % | 0.98 | % | 7.86 | % | 5.59 | % | ||||||||||||||
| Efficiency ratio | 76.04 | % | 99.97 | % | 88.42 | % | 69.26 | % | 71.82 | % | 83.00 | % | 73.50 | % | ||||||||||||||
| Effect of adjustment for nonrecurring income and expenses | (1.64 | )% | (30.61 | )% | (4.31 | )% | 0.00 | % | 4.95 | % | (8.96 | )% | 2.16 | % | ||||||||||||||
| Operating efficiency ratio | 74.40 | % | 69.36 | % | 84.11 | % | 69.26 | % | 76.77 | % | 74.04 | % | 75.66 | % | ||||||||||||||
| Earnings per common share - Basic | $ | 0.33 | $ | (0.14 | ) | $ | (0.01 | ) | $ | 0.23 | $ | 0.12 | $ | 0.40 | $ | 0.71 | ||||||||||||
| Effect of adjustment for nonrecurring income and expenses | 0.02 | 0.46 | 0.05 | - | (0.09 | ) | 0.53 | (0.04 | ) | |||||||||||||||||||
| Operating earnings per common share - Basic | $ | 0.35 | $ | 0.32 | $ | 0.04 | $ | 0.23 | $ | 0.03 | $ | 0.93 | $ | 0.67 | ||||||||||||||
| Earnings per common share - Diluted | $ | 0.33 | $ | (0.14 | ) | $ | (0.01 | ) | $ | 0.23 | $ | 0.12 | $ | 0.40 | $ | 0.71 | ||||||||||||
| Effect of adjustment for nonrecurring income and expenses | 0.02 | 0.46 | 0.05 | - | (0.09 | ) | 0.53 | (0.04 | ) | |||||||||||||||||||
| Operating earnings per common share - Diluted | $ | 0.35 | $ | 0.32 | $ | 0.04 | $ | 0.23 | $ | 0.03 | $ | 0.93 | $ | 0.67 | ||||||||||||||
| Book value per common share | $ | 16.09 | $ | 15.49 | $ | 15.91 | $ | 16.13 | $ | 15.90 | $ | 16.09 | $ | 15.90 | ||||||||||||||
| Effect of goodwill and other intangible assets | (3.86 | ) | (3.87 | ) | (4.34 | ) | (4.36 | ) | (4.37 | ) | (3.86 | ) | (4.37 | ) | ||||||||||||||
| Tangible book value per common share | $ | 12.23 | $ | 11.62 | $ | 11.57 | $ | 11.77 | $ | 11.53 | $ | 12.23 | $ | 11.53 | ||||||||||||||
| Total Primis common stockholders' equity | $ | 397,330 | $ | 382,487 | $ | 392,795 | $ | 398,064 | $ | 392,365 | $ | 397,330 | $ | 392,365 | ||||||||||||||
| Less goodwill and other intangible assets | (95,417 | ) | (95,741 | ) | (107,215 | ) | (107,539 | ) | (107,863 | ) | (95,417 | ) | (107,863 | ) | ||||||||||||||
| Tangible common equity | $ | 301,913 | $ | 286,746 | $ | 285,580 | $ | 290,525 | $ | 284,502 | $ | 301,913 | $ | 284,502 | ||||||||||||||
| Common equity to assets | 10.25 | % | 9.98 | % | 10.15 | % | 9.43 | % | 10.99 | % | 10.25 | % | 10.99 | % | ||||||||||||||
| Effect of goodwill and other intangible assets | (2.26 | )% | (2.31 | )% | (2.56 | )% | (2.37 | )% | (2.77 | )% | (2.27 | )% | (2.77 | )% | ||||||||||||||
| Tangible common equity to tangible assets | 7.99 | % | 7.67 | % | 7.59 | % | 7.06 | % | 8.22 | % | 7.99 | % | 8.22 | % | ||||||||||||||
| Net interest margin | 3.36 | % | 3.01 | % | 2.64 | % | 3.15 | % | 3.67 | % | 3.03 | % | 3.39 | % | ||||||||||||||
| Effect of adjustments for PPP associated balances* | 0.00 | % | 0.00 | % | 0.00 | % | 0.00 | % | 0.01 | % | 0.00 | % | 0.01 | % | ||||||||||||||
| Core net interest margin | 3.36 | % | 3.01 | % | 2.64 | % | 3.15 | % | 3.68 | % | 3.03 | % | 3.40 | % | ||||||||||||||
*Net interest margin excluding the effect of PPP loans assumes a funding cost of 35bps on average PPP balances in all applicable periods
Exhibit 99.2


Fourth Quarter 2023 NASDAQ: FRST This Presentation and certain of our other filings with the Securities and Exchange Commission contain statements that consti tut e “forward - looking statements” within the meaning of, and subject to the protections of, Section 27A of the Securities Act of 1933, as amended, and Section 21E of the Securities E xch ange Act of 1934, as amended. All statements other than statements of historical fact are forward - looking statements. Such statements can generally be identified by such words as "may," "plan," "contemplate," "anticipate," "believe," "intend," "continue," "expect," "project," "predict," "estimate," "could," "should," "would," "will," and other similar words or expressions of the future or otherwise regarding the outlook for the Primis Financial Corp.’s (the “Company”) future business and financial performance and/or the performance of the banking ind ustry and economy in general. These forward - looking statements include, but are not limited to, our expectations regarding our future operating and financial performance , i ncluding our outlook and long - term goals for future growth and new offerings and services; our expectations regarding net interest margin; expectations on our growth strategy, e xpe nse management, capital management and future profitability; expectations on credit quality and performance; and the assumptions underlying our expectations. Prospective investors are cautioned that any such forward - looking statements are not guarantees of future performance and involv e known and unknown risks and uncertainties which may cause the actual results, performance or achievements of the Company to be materially different from the future results, per formance or achievements expressed or implied by such forward - looking statements. Forward - looking statements are based on the information known to, and current beliefs and expec tations of, the Company’s management and are subject to significant risks and uncertainties. Actual results may differ materially from those contemplated by such forward - loo king statements. Factors that might cause such differences include, but are not limited to: the Company’s ability to implement its various strategic and growth initiatives, in cluding its recently established Panacea Financial and Life Premium Finance Divisions, digital banking platform, V1BE fulfillment service and Primis Mortgage Company; competitive pressu res among financial institutions increasing significantly; changes in applicable laws, rules, or regulations, including changes to statutes, regulations or regulatory po lic ies or practices; changes in management’s plans for the future; credit risk associated with our lending activities; the impact of current and future economic and market conditions g ene rally (including seasonality) and in the financial services industry, nationally and within our primary market areas; changes in interest rates, inflation, loan demand, real estate valu es, or competition, as well as labor shortages and supply chain disruptions; changes in accounting principles, policies, or guidelines; adverse results from current or future litigati on, regulatory examinations or other legal and/or regulatory actions; potential impacts of adverse developments in the banking industry highlighted by high - profile bank failures, including impacts on customer confidence, deposit outflows, liquidity and the regulatory response thereto; potential increases in the provision for credit losses; our ability to identif y a nd address increased cybersecurity risks, including those impacting vendors and other third parties; fraud or misconduct by internal or external actors, which we may not be able to pr eve nt, detect or mitigate; acts of God or of war or other conflicts, including the current Ukraine/Russia conflict and Israel/Hamas conflict, acts of terrorism, pandemics or other cat ast rophic events that may affect general economic conditions; and other general competitive, economic, political, and market factors, including those affecting our business, operations, p ric ing, products, or services. Forward - looking statements speak only as of the date on which such statements are made. These forward - looking statements are bas ed upon information presently known to the Company’s management and are inherently subjective, uncertain and subject to change due to any number of risks and uncertaint ies , including, without limitation, the risks and other factors set forth in the Company’s filings with the Securities and Exchange Commission, the Company’s Annual Report on Form 1 0 - K for the year ended December 31, 2022, under the captions “Cautionary Note Regarding Forward - Looking Statements” and “Risk Factors,” and in the Company’s Quarterly Reports o n Form 10 - Q and Current Reports on Form 8 - K. The Company undertakes no obligation to update any forward - looking statement to reflect events or circumstances after the date o n which such statement is made, or to reflect the occurrence of unanticipated events. Readers are cautioned not to place undue reliance on these forward - looking statements. 2 Statements included in this presentation include non - GAAP financial measures and should be read along with the accompanying tabl es.

Primis uses non - GAAP financial measures to analyze its performance. The measures entitled net income adjusted for nonrecurring income a nd expenses; pre - tax pre - provision operating earnings; operating return on average assets; pre - tax pre - provision return on average assets; pre - tax pre - provision operating return on average assets; operating return on average equity; operating return on average tangible equity ; o perating efficiency ratio; operating earnings per share – basic; operating earnings per share – diluted; tangible book value per share; tangible c ommon equity; tangible common equity to tangible assets; and core net interest margin are not measures recognized under GAAP and therefore are considered non - GAAP financial measures. We use the term “operating” to describe a financial measure that excludes income or expense conside red to be non - recurring in nature. Items identified as non - operating are those that, when excluded from a reported financial measure, pro vide management or the reader with a measure that may be more indicative of forward - looking trends in our business. A reconciliation of these n on - GAAP financial measures to the most comparable GAAP measures is provided in the Reconciliation of Non - GAAP Items table. Management believes that these non - GAAP financial measures provide additional useful information about Primis that allows manage ment and investors to evaluate the ongoing operating results, financial strength and performance of Primis and provide meaningful comp ari son to its peers. Non - GAAP financial measures should not be considered as an alternative to any measure of performance or financial condition as p romulgated under GAAP, and investors should consider Primis’ performance and financial condition as reported under GAAP and all other re lev ant information when assessing the performance or financial condition of Primis. Non - GAAP financial measures are not standardized a nd, therefore, it may not be possible to compare these measures with other companies that present measures having the same or similar names. No n - GAAP financial measures have limitations as analytical tools, and investors should not consider them in isolation or as a substitu te for analysis of the results or financial condition as reported under GAAP. 3 Corp.

Headquarters: McLean, VA Bank Headquarters: Glen Allen, VA Branches: 24 Ticker (NASDAQ): FRST Valuation Market Capitalization: $312 million Price / Book Value per Share 0.78x Price / Tangible Book Value (1) : 1.03x Price / 2024 Estimated EPS (2) : 9.22x Price / 2025 Estimated EPS (2) : 7.80x Dividend Yield (3) : 3.17% 4 Pricing as of January 24, 2024. Financial data as of or for the three months ended December 31, 2023. (1) See reconciliation of Non - GAAP financial measures on slide 22. (2) Mean analyst estimates per Bloomberg. (3) Assumes $0.40 annualized dividend.

5 • Operating return on average assets (1) was 89 basis points, up from 81 basis points in the third quarter of 2023 • Generated a margin of 3.36%, up from 3.01% linked quarter. Excluding accounting adjustments from a third - party managed portfolio, margin for the fourth quarter was 3.09%. • Opened over 2,000 new deposit account relationships totaling $75 million with a weighted average cost of only 2.96%. • Sold approximately $16 million of loans for gains of approximately $0.3 million and participated out another $15 million to manage balance sheet capacity. • Noninterest expense was $29.8 million for the fourth quarter of 2023, compared to $37.1 million for the third quarter of 2023 . Excluding mortgage and nonoperational items, noninterest expense was $18.7 million in the fourth quarter, down from $20.5 million in the third quarter of 2023 on a comparable basis. • Maintained peer - group leading liquidity with only $105 million of wholesale funding and $113 million of off - balance sheet funds swept off at December 31, 2023. • 61% reduction in linked - quarter nonperforming assets to only $7.7 million excluding SBA guarantees. • Grew all capital ratios including TCE/TA which is now at 7.99%. Leverage ratio increased to 8.93%.

(1) See reconciliation of Non - GAAP financial measures on slide 22 6 • Attractive community bank deposit base with core bank cost of deposits of only 1.94% in Q4 • Added new core bank deposit customers in Q4 with $58 million of deposits at weighted average cost of 2.37% • V1BE adoption/utilization continues to build with users up 16% in Q4, primarily due to addition of small - business customers Deposits per Branch (2) Dollars in Millions. (1) V1BE is a proprietary bank delivery app for on - demand ordering of branch services (2) Deposits per branch includes balances that were swept off. Pro forma includes branch consolidation.
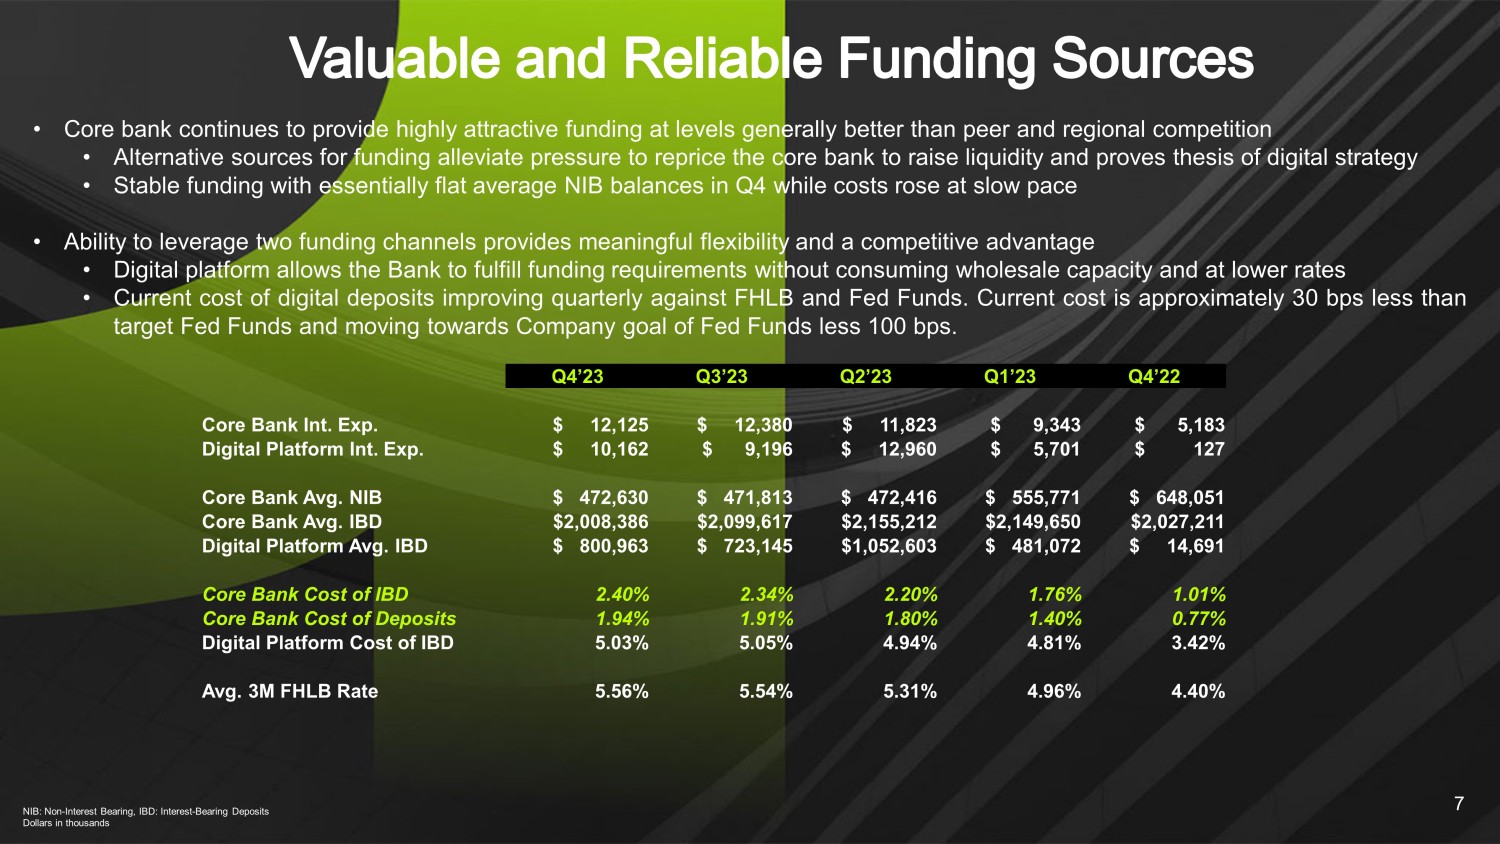
1,179 Users with 166 added in Q4’23 ~$166 million Deposit balance of V1BE users 62% % of V1BE Users that are SMBs V1BE Update (1) 8,765 Q4 Transactions Branch V1BE Customer $140.9 $110.1 $114.5 $114.6 $85.1 Q4'23 Q3'23 Q2'23 Q1'23 Q4'22 7 • Core bank continues to provide highly attractive funding at levels generally better than peer and regional competition • Alternative sources for funding alleviate pressure to reprice the core bank to raise liquidity and proves thesis of digital strategy • Stable funding with essentially flat average NIB balances in Q 4 while costs rose at slow pace • Ability to leverage two funding channels provides meaningful flexibility and a competitive advantage • Digital platform allows the Bank to fulfill funding requirements without consuming wholesale capacity and at lower rates • Current cost of digital deposits improving quarterly against FHLB and Fed Funds . Current cost is approximately 30 bps less than target Fed Funds and moving towards Company goal of Fed Funds less 100 bps . NIB: Non - Interest Bearing, IBD: Interest - Bearing Deposits Dollars in thousands Q4’23 Q3’23 Q2’23 Q1’23 Q4’22 Core Bank Int. Exp. $ 12,125 $ 12,380 $ 11,823 $ 9,343 $ 5,183 Digital Platform Int. Exp. $ 10,162 $ 9,196 $ 12,960 $ 5,701 $ 127 Core Bank Avg. NIB $ 472,630 $ 471,813 $ 472,416 $ 555,771 $ 648,051 Core Bank Avg. IBD $2,008,386 $2,099,617 $2,155,212 $2,149,650 $2,027,211 Digital Platform Avg. IBD $ 800,963 $ 723,145 $1,052,603 $ 481,072 $ 14,691 Core Bank Cost of IBD 2.40% 2.34% 2.20% 1.76% 1.01% Core Bank Cost of Deposits 1.94% 1.91% 1.80% 1.40% 0.77% Digital Platform Cost of IBD 5.03% 5.05% 4.94% 4.81% 3.42% Avg. 3M FHLB Rate 5.56% 5.54% 5.31% 4.96% 4.40% • Life - to - date loan originations of ~$450 mil.

(committed bal.) • Q4’23 originations of $36.7 mil., 7.91% weighted average yield • Sold $16 mil. of loans in Q4’23 with recognized gain of ~$300k • Total deposits of $56 mil., up 15.1%+ un - annualized qtr./qtr. • Opened +300 business and personal deposit accounts in Q4’23 • 12/31/23 deposit cost of 2.95% • 2023 PTPP ROA of 1.18% • Named the exclusive practice finance banking partner for the American Dental Association • Preferred partner for 20 national and state medical, dental and veterinary associations and organizations representing ~40% of all active doctors in the U.S. Q4’23 Summary Q4’23 Loan Composition ($322 million) • +$250 mil. of loan production, +$50 mil. of deposit growth • $50 - $100 mil.
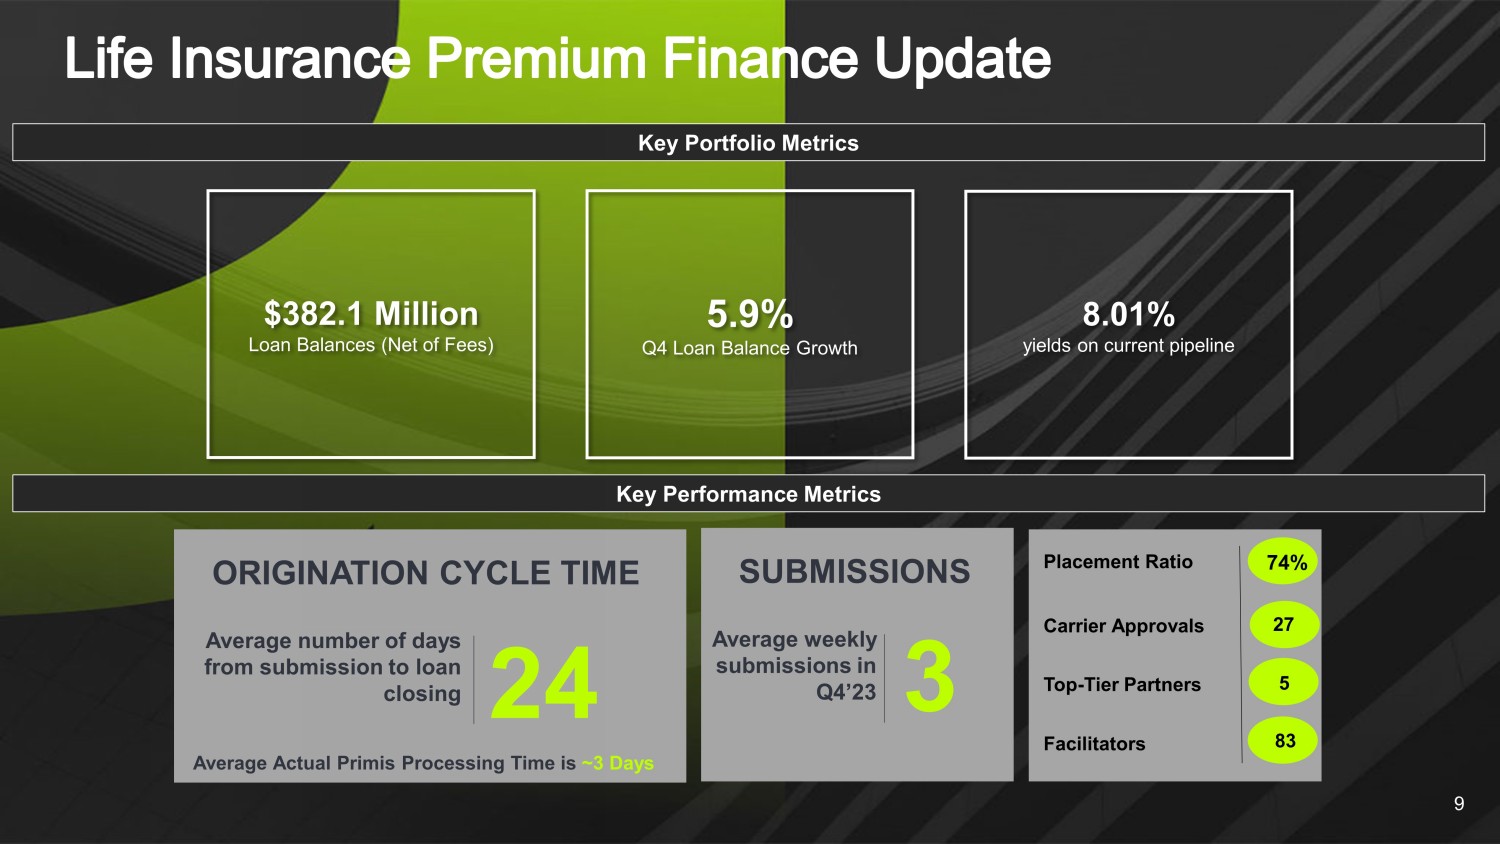
of total loan sales under GOS strategy Commercial Portfolio Statistics 2024 Outlook 2.9x Global DSC 3.4x Practice DSC 792 FICO $1.42mm Net Worth 8 65.9% 19.0% 15.2% Commercial PRN Student Refi 4 9 Key Portfolio Metrics Key Performance Metrics 24 Average number of days from submission to loan closing ORIGINATION CYCLE TIME Average Actual Primis Processing Time is ~3 Days Placement Ratio Carrier Approvals Top - Tier Partners Facilitators 74% 27 83 3 Average weekly submissions in Q4’23 SUBMISSIONS 5 5.9% Q4 Loan Balance Growth 8.01% yields on current pipeline $382.1 Million Loan Balances (Net of Fees)

10 • Pre - tax earnings for 2023: $333K • Aggressively managing costs to preserve profitability in lower volume environment • Funded production of $606 million in 2023 • Now licensed in 42 states and D.C. • Continue to add reliable performers using our culture and commitment to the industry versus signing bonuses and financial commitments.

Fourth Quarter Results

$3,876 $3,833 $3,869 $4,218 $3,569 $3,214 $3,166 $3,194 $3,056 $2,947 $3,270 $3,293 $3,317 $3,668 $2,722 7.99% 7.67% 7.59% 7.07% 8.22% Q4'23 Q3'23 Q2'23 Q1'23 Q4'22 Total Assets Gross Loans Deposits TCE/TA Dollars in millions. (1) See reconciliation of Non - GAAP financial measures on slide 22. 12 (1)

NOO CRE By Collateral Type (1) • Hotel portfolio down to $195 million from almost $300 million in early 2020 • Occupancy, RevPAR, and ADR exceeding 2019 performance • Debt coverage over 1.50x • Office non owner - occupied CRE was $147 million at December with $112 million of that true office building exposure • LTV across all office is 63% • All guaranteed by very high net worth guarantors • Significant maturities/rate resets don’t begin until 2026 • Retail exposure of $92 million at December • Low weighted - average LTV of 59% • Low average loan size of less than $2 million. 13 Dollars in millions. (1) Loan balances using Book Balance Non - Owner - Occupied CRE by Type Total Outstanding % of Portfolio Excl PPP Hotel $195 6.1% Office $147 4.6% Retail $92 2.9% Assisted Living $51 1.6% All other $58 1.4% Warehouse/Industrial $23 0.7% Mixed Use $20 0.6% Total Non - Owner Occupied CRE $585 18.2% Non - Owner Occupied Office CRE $147 4% Non - Owner Occupied Non - Office CRE $439 14% All Other Loans Excl PPP $2,606 82% Classified loans and NPAs exclude guaranteed portion of SBA loans.

Core net charge - offs exclude losses covered by a third party. 14 NPAs / Loans (Ex. PPP) + OREO Core NCOs / Average Loans Criticized & Classified Loans / Total Loans (Ex. PPP) • Nonperforming assets and classified loans decreased by $11.9 million and $9.8 million, respectively, from Q3’23 • Remaining NPLs roughly $7.7 million or 0.20% of assets at Q4 • Net charge - offs of $5.0 million in Q4 • Includes $3.0 million of net charge - offs covered by a third party (offset in noninterest income) • Core net charge - offs of $2.0 million, majority of which related to credits that were previously reserved for • No OREO as of December 31, 2023 0.53% 0.28% 0.02% 0.27% 0.24% Q4'22 Q1'23 Q2'23 Q3'23 Q4'23 2.35% 2.14% 1.99% 1.89% 0.90% Q4'22 Q1'23 Q2'23 Q3'23 Q4'23 1.19% 1.07% 0.77% 0.62% 0.24% Q4'22 Q1'23 Q2'23 Q3'23 Q4'23 15 ACL Walk Forward ACL / Gross Loans (Ex.

PPP) • Provision for credit losses of $3.1 million in Q4 versus provision of $1.6 million in Q3 • Provision includes $3.0 million related to third - party managed portfolio with credit enhancement • Provision offset by gain of equal amount recorded in noninterest income • ACL coverage of gross loans 1.06% at the end of Q4 Dollars in millions 1.17% 1.17% 1.21% 1.13% 1.06% Q4'22 Q1'23 Q2'23 Q3'23 Q4'23 Dollars in millions.

(1) Core deposits exclude time deposits and includes deposits that were swept off at 12/31 16 Deposit Composition – Q4’23 Core Deposit Growth (1) • Total deposits were down slightly compared to Q3 as the balance sheet was managed to minimize excess cash • Uninsured/unsecured deposits make up approximately 22% of total deposits with 173% coverage of those balances from external liquidity sources • $75 million brokered deposits, maturing mid - 2024, and $30 million of short - term FHLB advances at December 31, 2023 Cost of Deposits: 269 bps Demand Deposits 14.5% NOW Accounts 23.6% Money Market Accounts 24.3% Savings Accounts 24.0% Time Deposits 13.6% $1,003 $1,502 $1,872 $1,675 $2,580 $339 $441 $530 $583 $473 $1,342 $1,943 $2,403 $2,257 $2,937 1.43% 0.92% 0.48% 0.78% 2.69% 2019 2020 2021 2022 2023 Interest Bearing Deposits Demand Cost of Deposits Net Interest Income Progression Dollars in thousands.

Core excludes impact of PPP balances 17 • Net interest margin expanded to 3.36% from 3.01% in Q3. • Excluding $2.6 million and $0.4 million of accounting impact from a third - party managed portfolio in Q4 and Q3, respectively, margin increased 10 bps to 3.09% in Q4 • Higher earning asset yield offset funding cost increases as deposit pressures moderated Net Interest Margin Trends $30,256 $27,136 $26,235 $28,493 $29,537 3.36% 3.01% 2.64% 3.15% 3.67% Q4'23 Q3'23 Q2'23 Q1'23 Q4'22 Net Interest Income Net Interest Margin • Noninterest expense includes a number of items that are volatile Q - to - Q such as mortgage expenses (tied to volume), accounting adjustments for third - party managed portfolio (offset in net interest income) and reserve for unfunded commitments • Management prefers to focus on operational expenses excluding volatile items, nonrecurring expenses and effects of PFH consolidation • On this basis, core operational expense burden declined to $18.7 million in Q3 from $20.5 million linked - quarter • Q4 included 2 months of branch savings from late October consolidation of 8 locations.

Dollars in thousands. (1) See reconciliation of Non - GAAP financial measures on slide 22. 18 Q4’23 Q3’23 Q4’22 YTD 2023 YTD 2022 Reported Non - Interest Expense $29,836 $37,066 $29,106 $124,868 $92,376 Less : Goodwill Impairment ($11,150) ($11,150) Mortgage Expenses ($4,785) ($5,108) ($5,357) ($20,152) ($9,361) Branch Closure and Other Nonrecurring ($643) ($200) ($1,175) ($2,331) ($1,175) Effect of Consolidating PFH ($2,813) ($2,813) Effects of Third - Party Managed Portfolio ($2,823) ($337) ($1,369) ($4,548) ($1,369) Reserve for Unfunded Commitment ($67) $257 ($36) $325 ($409) Core Operating Expense Burden $18,705 $20,528 $21,169 $84,199 $80,062 $1.32 $0.61 $1.26 $0.72 $0.40 $1.48 $0.68 $1.26 $0.68 $0.93 2019 2020 2021 2022 2023 EPS Adjusted EPS Tangible Book Value Per Common Share Diluted Earnings Per Common Share and Adjusted Diluted EPS (1) See reconciliation of Non - GAAP financial measures on slide 22.

19 • Q4’23 diluted EPS of $0.33, up 167% versus same period in 2022 • AOCI impact to TBV per share of $0.88 at December 31, 2023, expected to recover over time given our intent and wherewithal to hold until recovery or maturity.

(1) (1) $11.09 $11.60 $12.43 $11.61 $12.23 2019 2020 2021 2022 2023 • Talented management team and board committed to building long - term shareholder value • Attractive core - funded community bank with a complementary digital funding platform • Aggressive and early use of technology positioning the Bank for superior performance as the industry evolves • Significant valuation upside as strategic investments mature 20 *Net interest margin excluding the effect of PPP loans assumes a funding cost of 35 bps on average PPP balances in all applic abl e periods.

Appendix 21

22 Primis Financial Corp. (Dollars in thousands, except per share data) For Three Months Ended: Reconciliation of Non-GAAP items: 4Q 2023 3Q 2023 2Q 2023 1Q 2023 4Q 2022 4Q 2023 4Q 2022 Net income (loss) attributable to Primis' common shareholders 8,121$ (3,526)$ (268)$ 5,612$ 3,040$ 9,940$ 17,549$ Non-GAAP adjustments to Net Income: Branch Consolidation / Other restructuring 449 - 1,488 - 1,175 1,937 2,384 Professional fee expenses related to Panacea investment 194 - - - - 194 Gain on sale of Infinex investment - - - - (4,144) - (4,144) Merger expenses - - - - - - 516 Goodwill impairment - 11,150 - - - 11,150 - Loan officer fraud, operational losses - 200 - - - 200 - Income tax effect (139) (44) (321) - 641 (504) 269 8,625$ 7,780$ 899$ 5,612$ 712$ 22,917$ 16,574$ Net income (loss) attributable to Primis' common shareholders 8,121$ (3,526)$ (268)$ 5,612$ 3,040$ 9,940$ 17,549$ Income tax expense (benefit) 418 1,925 (46) 1,254 519 3,552 4,490 3,208 1,355 4,066 5,418 7,896 14,046 11,710 Pre-tax pre-provision earnings 11,747$ (246)$ 3,752$ 12,284$ 11,455$ 27,538$ 33,749$ 643 11,350 1,488 - (2,969) 13,481 (4,286) Pre-tax pre-provision operating earnings 12,390$ 11,104$ 5,240$ 12,284$ 8,486$ 41,019$ 29,463$ Return on average assets 0.84% (0.36%) (0.03%) 0.58% 0.35% 0.25% 0.53% Effect of adjustment for nonrecurring income and expenses 0.05% 1.17% 0.11% 0.00% (0.27%) 0.33% (0.03%) Operating return on average assets 0.89% 0.81% 0.08% 0.58% 0.08% 0.58% 0.50% Return on average assets 0.84% (0.36%) (0.03%) 0.58% 0.35% 0.25% 0.53% Effect of tax expense 0.04% 0.20% (0.00%) 0.13% 0.06% 0.09% 0.14% 0.34% 0.13% 0.39% 0.56% 0.91% 0.36% 0.35% Pre-tax pre-provision return on average assets 1.22% (0.03%) 0.36% 1.27% 1.32% 0.70% 1.02% 0.07% 1.17% 0.14% 0.00% (0.34%) 0.34% (0.13%) Pre-tax pre-provision operating return on average assets 1.29% 1.14% 0.50% 1.27% 0.98% 1.04% 0.89% Return on average common equity 8.37% (3.54%) (0.27%) 5.64% 3.04% 2.51% 4.35% Effect of adjustment for nonrecurring income and expenses 0.52% 11.34% 1.17% 0.00% (2.33%) 3.28% (0.25%) Operating return on average common equity 8.89% 7.80% 0.90% 5.64% 0.71% 5.79% 4.10% Effect of goodwill and other intangible assets 2.93% 2.89% 0.33% 2.05% 0.27% 2.07% 1.49% Operating return on average tangible common equity 11.82% 10.69% 1.23% 7.69% 0.98% 7.86% 5.59% Efficiency ratio 76.04% 99.97% 88.42% 69.26% 71.82% 83.00% 73.50% (1.64%) (30.61%) (4.31%) 0.00% 4.95% (8.96%) 2.16% Operating efficiency ratio 74.40% 69.36% 84.11% 69.26% 76.77% 74.04% 75.66% Earnings per common share - Basic 0.33$ (0.14)$ (0.01)$ 0.23$ 0.12$ 0.40$ 0.71$ Effect of adjustment for nonrecurring income and expenses 0.02 0.46 0.05 - (0.09) 0.53 (0.04) Operating earnings per common share - Basic 0.35$ 0.32$ 0.04$ 0.23$ 0.03$ 0.93$ 0.67$ Earnings per common share - Diluted 0.33$ (0.14)$ (0.01)$ 0.23$ 0.12$ 0.40$ 0.71$ Effect of adjustment for nonrecurring income and expenses 0.02 0.46 0.05 - (0.09) 0.53 (0.04) Operating earnings per common share - Diluted 0.35$ 0.32$ 0.04$ 0.23$ 0.03$ 0.93$ 0.67$ Book value per common share 16.09$ 15.49$ 15.91$ 16.13$ 15.90$ 16.09$ 15.90$ Effect of goodwill and other intangible assets (3.86) (3.87) (4.34) (4.36) (4.37) (3.86) (4.37) Tangible book value per common share 12.23$ 11.62$ 11.57$ 11.77$ 11.53$ 12.23$ 11.53$ Total Primis common stockholders' equity 397,330$ 382,487$ 392,795$ 398,064$ 392,365$ 397,330$ 392,365$ Less goodwill and other intangible assets (95,417) (95,741) (107,215) (107,539) (107,863) (95,417) (107,863) Tangible common equity 301,913$ 286,746$ 285,580$ 290,525$ 284,502$ 301,913$ 284,502$ Common equity to assets 10.25% 9.98% 10.15% 9.43% 10.99% 10.25% 10.99% Effect of goodwill and other intangible assets (2.26%) (2.31%) (2.56%) (2.37%) (2.77%) (2.27%) (2.77%) Tangible common equity to tangible assets 7.99% 7.67% 7.59% 7.06% 8.22% 7.99% 8.22% Net interest margin 3.36% 3.01% 2.64% 3.15% 3.67% 3.03% 3.39% 0.00% 0.00% 0.00% 0.00% 0.01% 0.00% 0.01% Core net interest margin 3.36% 3.01% 2.64% 3.15% 3.68% 3.03% 3.40% Effect of adjustments for PPP associated balances* Effect of provision for credit losses (incl. unfunded commitment expense) Provision for credit losses (incl. unfunded commitment expense) Effect of adjustment for nonrecurring income and expenses Effect of adjustment for nonrecurring income and expenses Effect of adjustment for nonrecurring income and expenses and expenses Net income (loss) attributable to Primis' common shareholders adjusted for For Twelve Months Ended: