UNITED STATES
SECURITIES AND EXCHANGE COMMISSION
Washington, D.C. 20549
FORM 8-K
CURRENT REPORT
Pursuant
to Section 13 or 15(d) of
the Securities Exchange Act of 1934
Date of Report (Date of earliest event reported): November 9, 2023
MORNINGSTAR, INC.
(Exact name of registrant as specified in its charter)
| Illinois | 000-51280 | 36-3297908 |
| (State
or other jurisdiction of incorporation) |
(Commission
File Number) |
(I.R.S.
Employer Identification No.) |
| 22 West Washington Street | ||
| Chicago, Illinois | 60602 | |
| (Address of principal executive offices) | (Zip Code) |
(312) 696-6000
(Registrant’s telephone number, including area code)
N/A
(Former name or former address, if changed since last report)
Check the appropriate box below if the Form 8-K filing is intended to simultaneously satisfy the filing obligation of the registrant under any of the following provisions:
| ¨ | Written communications pursuant to Rule 425 under the Securities Act (17 CFR 230.425) |
| ¨ | Soliciting material pursuant to Rule 14a-12 under the Exchange Act (17 CFR 240.14a-12) |
| ¨ | Pre-commencement communications pursuant to Rule 14d-2(b) under the Exchange Act (17 CFR 240.14d-2(b)) |
| ¨ | Pre-commencement communications pursuant to Rule 13e-4(c) under the Exchange Act (17 CFR 240.13e-4(c)) |
Indicate by check mark whether the registrant is an emerging growth company as defined in Rule 405 of the Securities Act of 1933 (§230.405 of this chapter) or Rule 12b-2 of the Securities Exchange Act of 1934 (§240.12b-2 of this chapter).
Emerging growth company ¨
If an emerging growth company, indicate by check mark if the registrant has elected not to use the extended transition period for complying with any new or revised financial accounting standards provided pursuant to Section 13(a) of the Exchange Act. ¨
Securities registered pursuant to Section 12(b) of the Act:
| Title of Each Class | Trading Symbol | Name
of Each Exchange on Which Registered |
| Common stock, no par value | MORN | The Nasdaq Stock Market LLC |
Item 2.02. Results of Operations and Financial Condition.
On November 9, 2023, Morningstar, Inc. (the “Company” or “we”) published a Supplemental Presentation Update. A copy of the Supplemental Presentation Update is attached hereto as Exhibit 99.1. The Supplemental Presentation Update shall be deemed furnished, not filed, for purposes of this Current Report on Form 8-K (this “Report”).
Item 7.01. Regulation FD Disclosure.
The information set forth under Item 2.02, "Results of Operations and Financial Condition" is incorporated herein by reference.
Cautionary Note Regarding Forward-Looking Statements
This Report contains forward-looking statements as that term is used in the Private Securities Litigation Reform Act of 1995. These statements are based on our current expectations about future events or future financial performance. Forward-looking statements by their nature address matters that are, to different degrees, uncertain, and often contain words such as “may,” “could,” “expect,” “intend,” “plan,” “seek,” “anticipate,” “believe,” “estimate,” “predict,” “potential,” “prospects,” or “continue.” These statements involve known and unknown risks and uncertainties that may cause the events we discuss not to occur or to differ significantly from what we expect. For the Company, these risks and uncertainties include, among others, failing to maintain and protect our brand, independence, and reputation; liability related to cybersecurity and the protection of confidential information, including personal information about individuals; compliance failures, regulatory action, or changes in laws applicable to our credit ratings operations, investment advisory, ESG and index businesses; failing to innovate our product and service offerings, or anticipate our clients’ changing needs; prolonged volatility or downturns affecting the financial sector, global financial markets, and the global economy and its effect on our revenue from asset-based fees and our credit ratings business; failing to recruit, develop, and retain qualified employees; liability for any losses that result from errors in our automated advisory tools; inadequacy of our operational risk management and business continuity programs in the event of a material disruptive event; failing to realize the expected business or financial benefits of our acquisitions and investments; failing to scale our operations and increase productivity and its effect on our ability to implement our business plan; artificial intelligence and related new technologies may present business, compliance, and reputational risks; failing to maintain growth across our businesses in today's fragmented geopolitical, regulatory and cultural world; liability relating to the information and data we collect, store, use, create, and distribute or the reports that we publish or are produced by our software products; the potential adverse effect of our indebtedness on our cash flows and financial flexibility; challenges in accounting for complexities in taxes in the global jurisdictions in which we operate that could materially affect our tax rate; failing to protect our intellectual property rights or claims of intellectual property infringement against us; the impact of any litigation, regulatory and other business matters; our new reporting segments and the associated disclosures. A more complete description of these risks and uncertainties can be found in our filings with the Securities and Exchange Commission, including our most recent Annual Report on Form 10-K and Quarterly Reports on Form 10-Q. If any of these risks and uncertainties materialize, our actual future results and other future events may vary significantly from what we expect. We do not undertake to update our forward-looking statements as a result of new information or future events.
Item 9.01. Financial Statements and Exhibits.
(d) Exhibits:
| Exhibit No. | Description |
| 99.1 | Supplemental Presentation Update dated November 9, 2023. |
| 104 | The cover page from this Current Report on Form 8-K formatted in Inline XBRL (included as Exhibit 101). |
EXHIBIT INDEX
| Exhibit No. | Description |
| 99.1 | Supplemental Presentation Update dated November 9, 2023. |
| 104 | The cover page from this Current Report on Form 8-K formatted in Inline XBRL (included as Exhibit 101). |
SIGNATURES
Pursuant to the requirements of the Securities Exchange Act of 1934, the registrant has duly caused this report to be signed on its behalf by the undersigned hereunto duly authorized.
| MORNINGSTAR, INC. | ||
| Date: November 13, 2023 | By: | /s/ Jason Dubinsky |
| Name: | Jason Dubinsky | |
| Title: | Chief Financial Officer | |
|
Third Quarter 2023 Supplemental Presentation Update November 9, 2023 |
|
This presentation dated November 9, 2023 includes an update (the “Update”) to the Morningstar Third Quarter 2023 Supplemental Presentation dated October 25, 2023 (the “Original Supplemental Materials”) to provide detail on the reporting segments reflected in Morningstar’s Quarterly Report on Form 10-Q for the quarter ended September 30, 2023. Except for the Update, the Original Supplemental Materials remain unchanged. This presentation contains forward-looking statements within the meaning of the Private Securities Litigation Reform Act of 1995. These statements are based on our current expectations about future events or future financial performance. Forward-looking statements by their nature address matters that are, to different degrees, uncertain, and often contain words such as “may,” “could,” “expect,” “intend,” “plan,” “seek,” “anticipate,” “believe,” “estimate,” “predict,” “potential,” “prospects,” or “continue.” These statements involve known and unknown risks and uncertainties that may cause the events we discuss not to occur or to differ significantly from what we expect. More information about factors that could affect Morningstar’s business and financial results are in our filings with the SEC, including our most recent 8-K, 10-K, and 10-Q forms. Morningstar undertakes no obligation to publicly update any forward-looking statements as a result of new information, future events, or otherwise, except as required by law. In addition, this presentation references non-GAAP financial measures including, but not limited to, organic revenue, adjusted operating income, adjusted operating margin, adjusted operating expense, and free cash flow. These non-GAAP measures may not be comparable to similarly titled measures reported by other companies. A reconciliation of non-GAAP financial measures to the most directly comparable GAAP financial measures is provided in the appendix to this presentation and in our filings with the SEC, including our most recent Forms 8-K, 10-K and 10-Q. 2 2 |
|
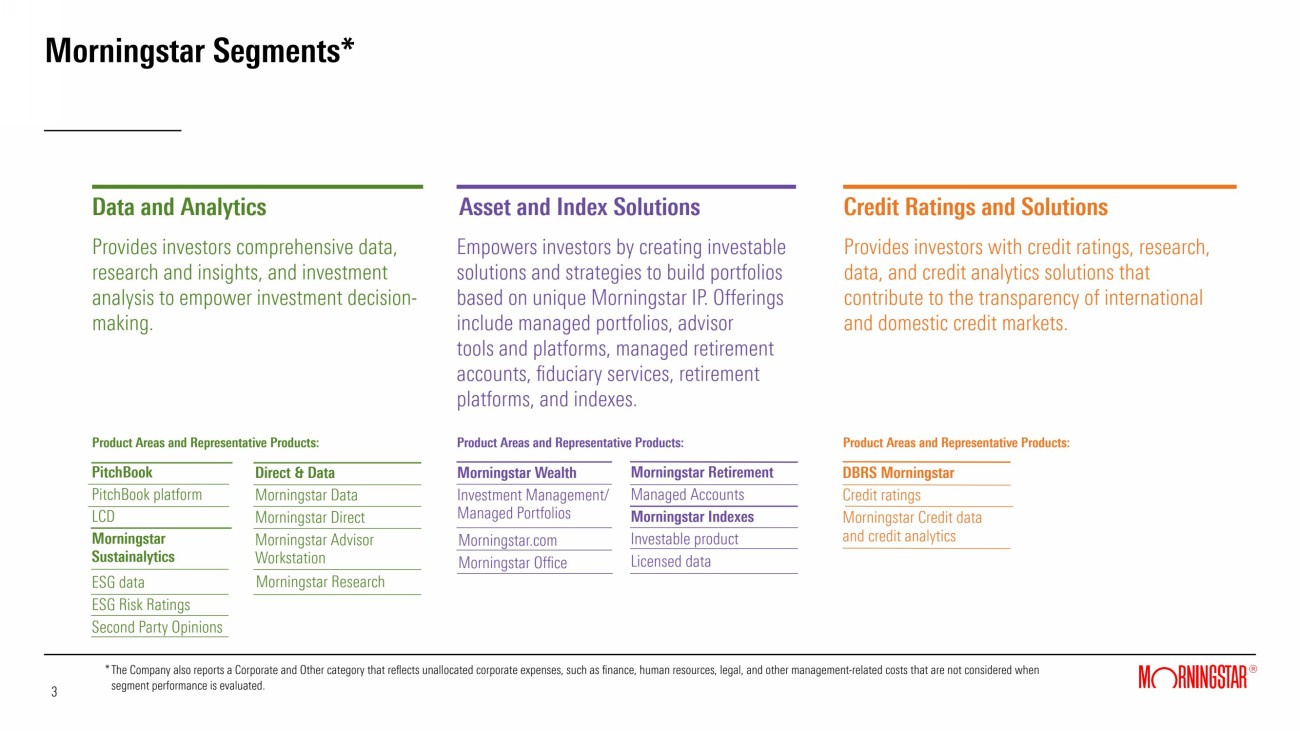
Morningstar Segments* The Company also reports a Corporate and Other category that reflects unallocated corporate expenses, such as finance, human resources, legal, and other management-related costs that are not considered when segment performance is evaluated. 3 3 Data and Analytics Provides investors comprehensive data, research and insights, and investment analysis to empower investment decision-making. PitchBook PitchBook platform LCD Morningstar Sustainalytics Asset and Index Solutions Empowers investors by creating investable solutions and strategies to build portfolios based on unique Morningstar IP. Offerings include managed portfolios, advisor tools and platforms, managed retirement accounts, fiduciary services, retirement platforms, and indexes. Morningstar Wealth Investment Management/ Managed Portfolios Credit Ratings and Solutions Provides investors with credit ratings, research, data, and credit analytics solutions that contribute to the transparency of international and domestic credit markets. DBRS Morningstar Credit ratings Morningstar Credit data and credit analytics * Morningstar Retirement Managed Accounts Morningstar Indexes Investable product Licensed data Product Areas and Representative Products: Morningstar.com Morningstar Office Product Areas and Representative Products: Product Areas and Representative Products: Direct & Data Morningstar Data Morningstar Direct Morningstar Advisor Workstation ESG data ESG Risk Ratings Second Party Opinions Morningstar Research |
|
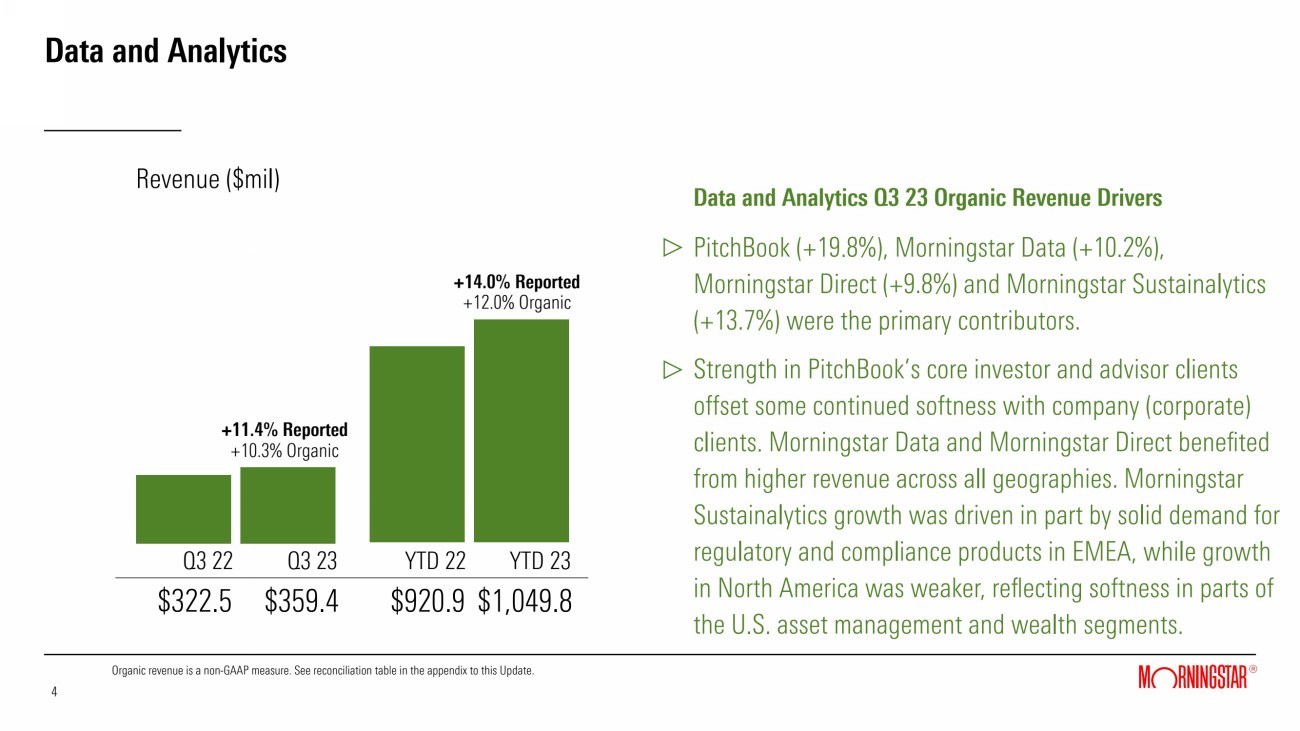
Data and Analytics Q3 22 Q3 23 Data and Analytics Q3 23 Organic Revenue Drivers PitchBook (+19.8%), Morningstar Data (+10.2%), Morningstar Direct (+9.8%) and Morningstar Sustainalytics (+13.7%) were the primary contributors. Strength in PitchBook’s core investor and advisor clients offset some continued softness with company (corporate) clients. Morningstar Data and Morningstar Direct benefited from higher revenue across all geographies. Morningstar Sustainalytics growth was driven in part by solid demand for regulatory and compliance products in EMEA, while growth in North America was weaker, reflecting softness in parts of the U.S. asset management and wealth segments. Organic revenue is a non-GAAP measure. See reconciliation table in the appendix to this Update. $322.5 $359.4 4 4 Revenue ($mil) YTD 22 YTD 23 $920.9 $1,049.8 +11.4% Reported +10.3% Organic +14.0% Reported +12.0% Organic |
|
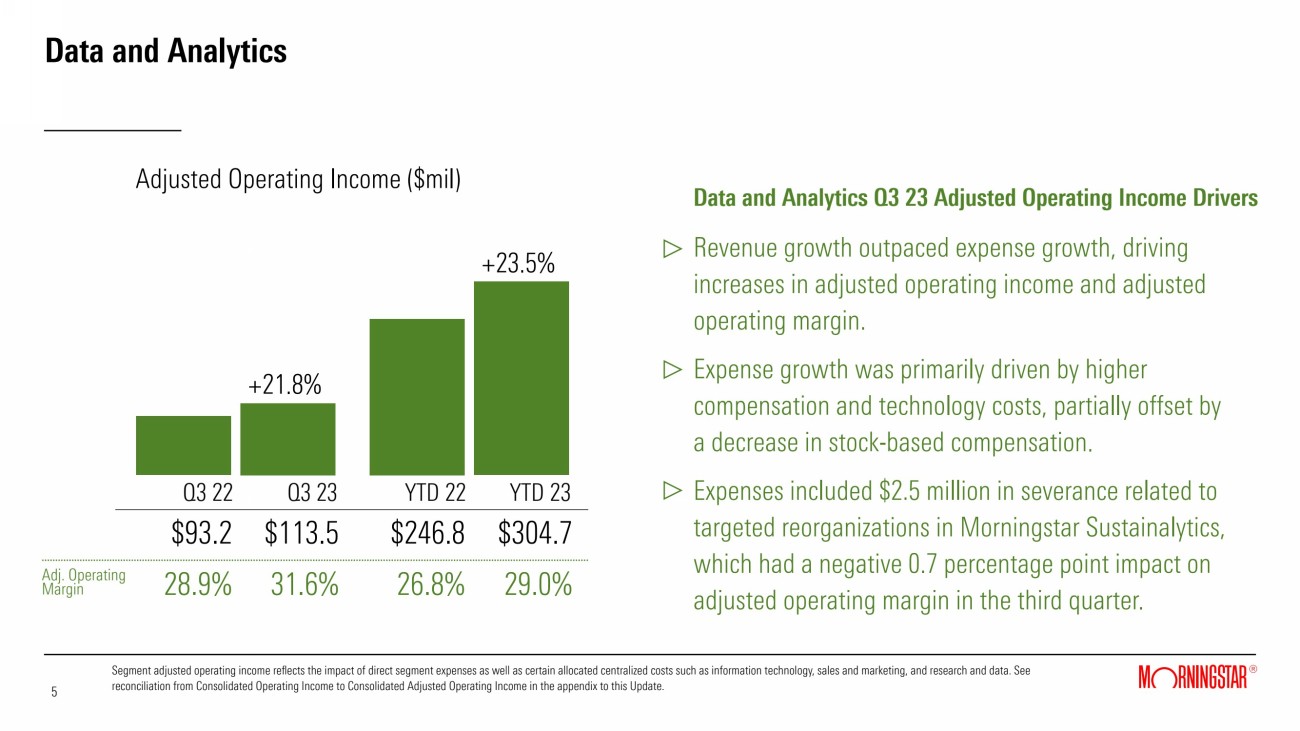
Data and Analytics Data and Analytics Q3 23 Adjusted Operating Income Drivers Revenue growth outpaced expense growth, driving increases in adjusted operating income and adjusted operating margin. Expense growth was primarily driven by higher compensation and technology costs, partially offset by a decrease in stock-based compensation. Expenses included $2.5 million in severance related to targeted reorganizations in Morningstar Sustainalytics, which had a negative 0.7 percentage point impact on adjusted operating margin in the third quarter. Segment adjusted operating income reflects the impact of direct segment expenses as well as certain allocated centralized costs such as information technology, sales and marketing, and research and data. See reconciliation from Consolidated Operating Income to Consolidated Adjusted Operating Income in the appendix to this Update. 5 5 Q3 22 Q3 23 $93.2 $113.5 Adjusted Operating Income ($mil) YTD 22 YTD 23 $246.8 $304.7 +21.8% +23.5% 28.9% 31.6% 26.8% 29.0% Adj. Operating Margin |
|
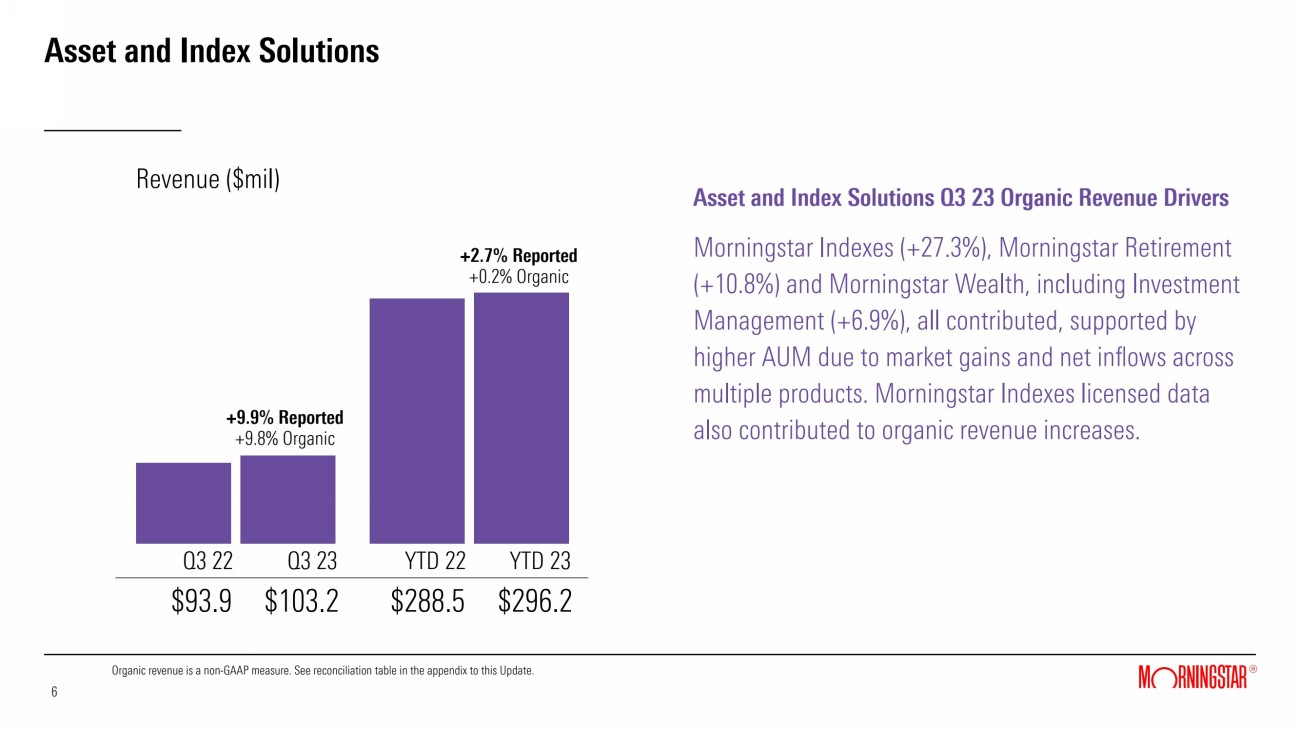
Asset and Index Solutions Q3 22 Q3 23 Asset and Index Solutions Q3 23 Organic Revenue Drivers Morningstar Indexes (+27.3%), Morningstar Retirement (+10.8%) and Morningstar Wealth, including Investment Management (+6.9%), all contributed, supported by higher AUM due to market gains and net inflows across multiple products. Morningstar Indexes licensed data also contributed to organic revenue increases. Organic revenue is a non-GAAP measure. See reconciliation table in the appendix to this Update. $93.9 $103.2 6 6 Revenue ($mil) YTD 22 YTD 23 $288.5 $296.2 +9.9% Reported +9.8% Organic +2.7% Reported +0.2% Organic |
|
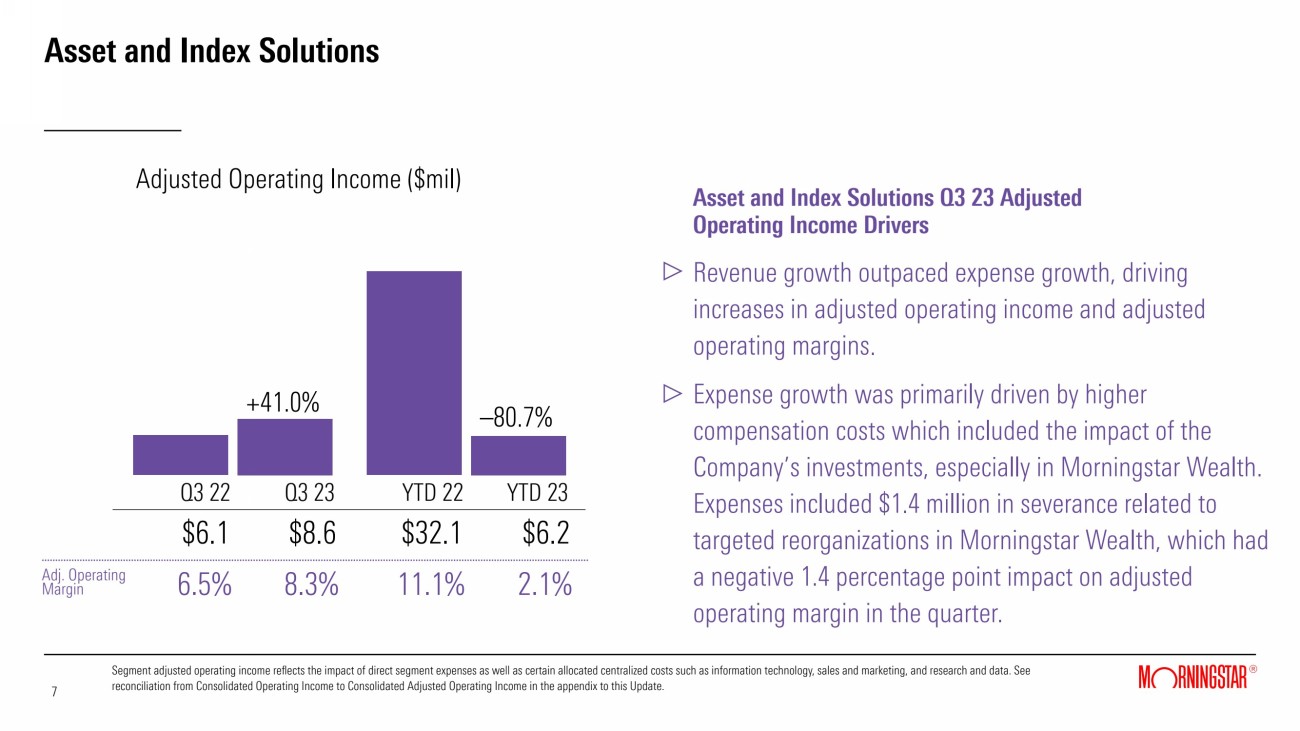
Asset and Index Solutions Q3 22 Q3 23 Asset and Index Solutions Q3 23 Adjusted Operating Income Drivers Revenue growth outpaced expense growth, driving increases in adjusted operating income and adjusted operating margins. Expense growth was primarily driven by higher compensation costs which included the impact of the Company’s investments, especially in Morningstar Wealth. Expenses included $1.4 million in severance related to targeted reorganizations in Morningstar Wealth, which had a negative 1.4 percentage point impact on adjusted operating margin in the quarter. Segment adjusted operating income reflects the impact of direct segment expenses as well as certain allocated centralized costs such as information technology, sales and marketing, and research and data. See reconciliation from Consolidated Operating Income to Consolidated Adjusted Operating Income in the appendix to this Update. $6.1 $8.6 7 7 Adjusted Operating Income ($mil) YTD 22 YTD 23 $32.1 $6.2 +41.0% –80.7% 6.5% 8.3% 11.1% 2.1% Adj. Operating Margin |
|
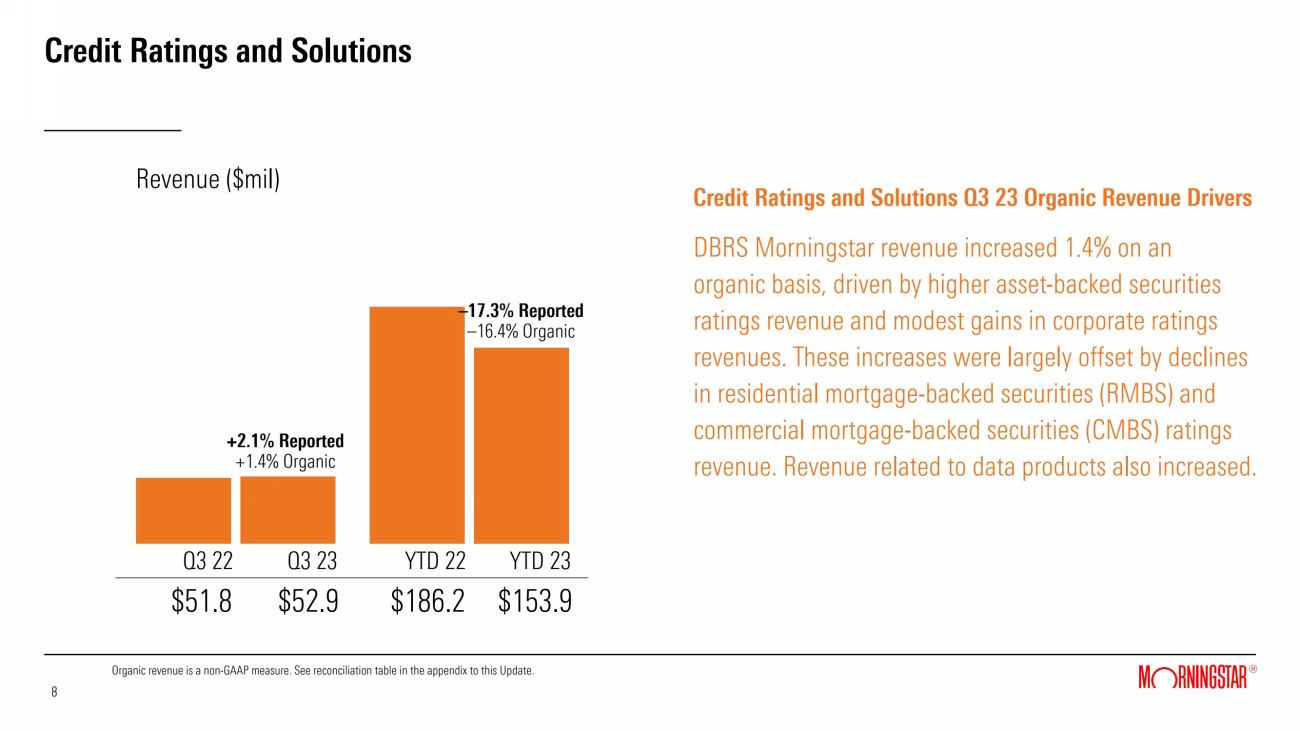
Credit Ratings and Solutions Q3 22 Q3 23 Credit Ratings and Solutions Q3 23 Organic Revenue Drivers DBRS Morningstar revenue increased 1.4% on an organic basis, driven by higher asset-backed securities ratings revenue and modest gains in corporate ratings revenues. These increases were largely offset by declines in residential mortgage-backed securities (RMBS) and commercial mortgage-backed securities (CMBS) ratings revenue. Revenue related to data products also increased. Organic revenue is a non-GAAP measure. See reconciliation table in the appendix to this Update. $51.8 $52.9 8 8 Revenue ($mil) YTD 22 YTD 23 $186.2 $153.9 +2.1% Reported +1.4% Organic –17.3% Reported –16.4% Organic |
|
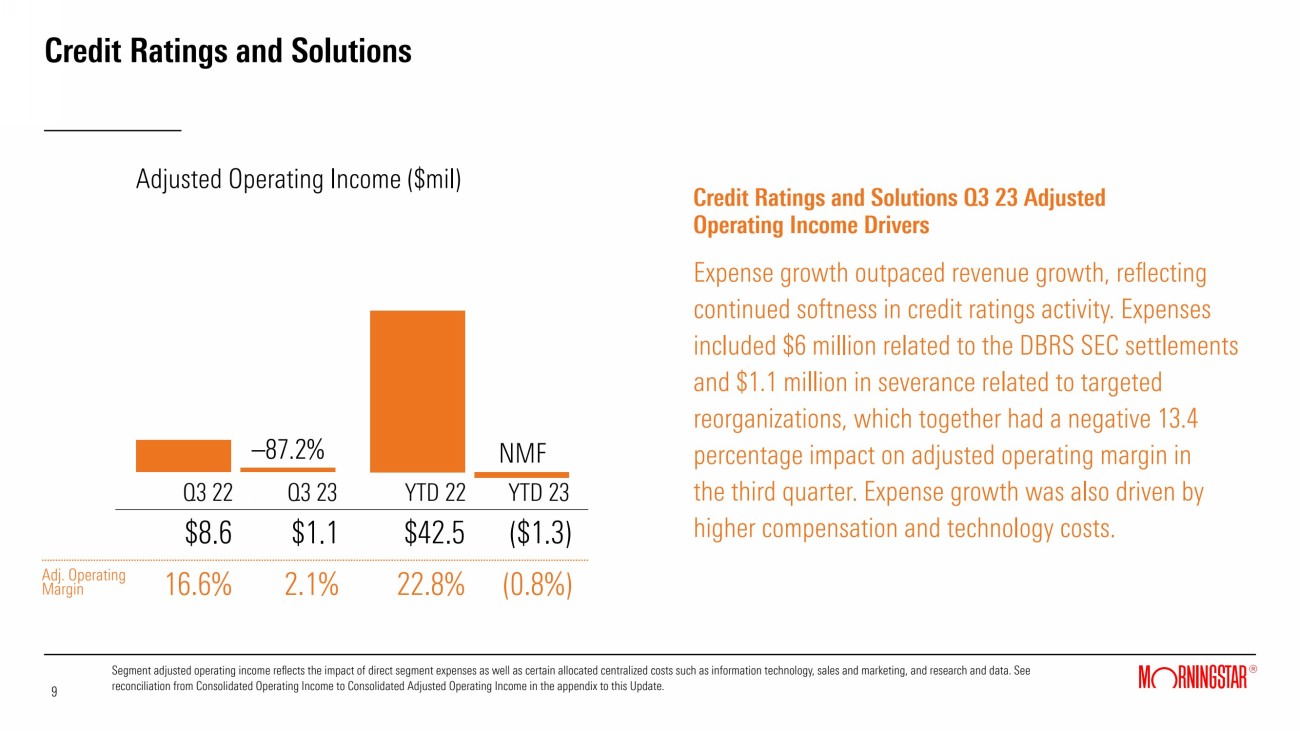
Credit Ratings and Solutions Q3 22 Q3 23 Credit Ratings and Solutions Q3 23 Adjusted Operating Income Drivers Expense growth outpaced revenue growth, reflecting continued softness in credit ratings activity. Expenses included $6 million related to the DBRS SEC settlements and $1.1 million in severance related to targeted reorganizations, which together had a negative 13.4 percentage impact on adjusted operating margin in the third quarter. Expense growth was also driven by higher compensation and technology costs. Segment adjusted operating income reflects the impact of direct segment expenses as well as certain allocated centralized costs such as information technology, sales and marketing, and research and data. See reconciliation from Consolidated Operating Income to Consolidated Adjusted Operating Income in the appendix to this Update. $8.6 $1.1 9 9 Adjusted Operating Income ($mil) YTD 22 YTD 23 $42.5 ($1.3) –87.2% NMF Adj. Operating Margin 16.6% 2.1% 22.8% (0.8%) |
|
Appendix |
|
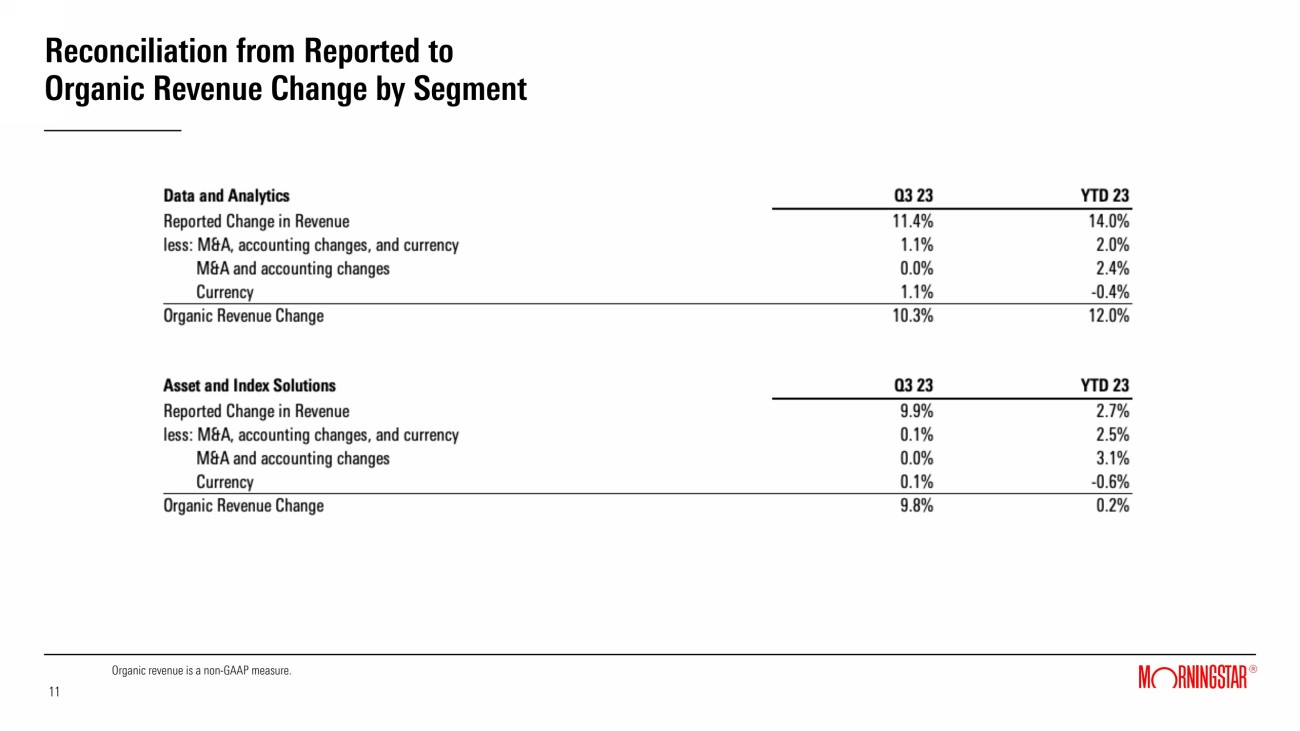
Reconciliation from Reported to Organic Revenue Change by Segment Organic revenue is a non-GAAP measure. 11 11 |
|
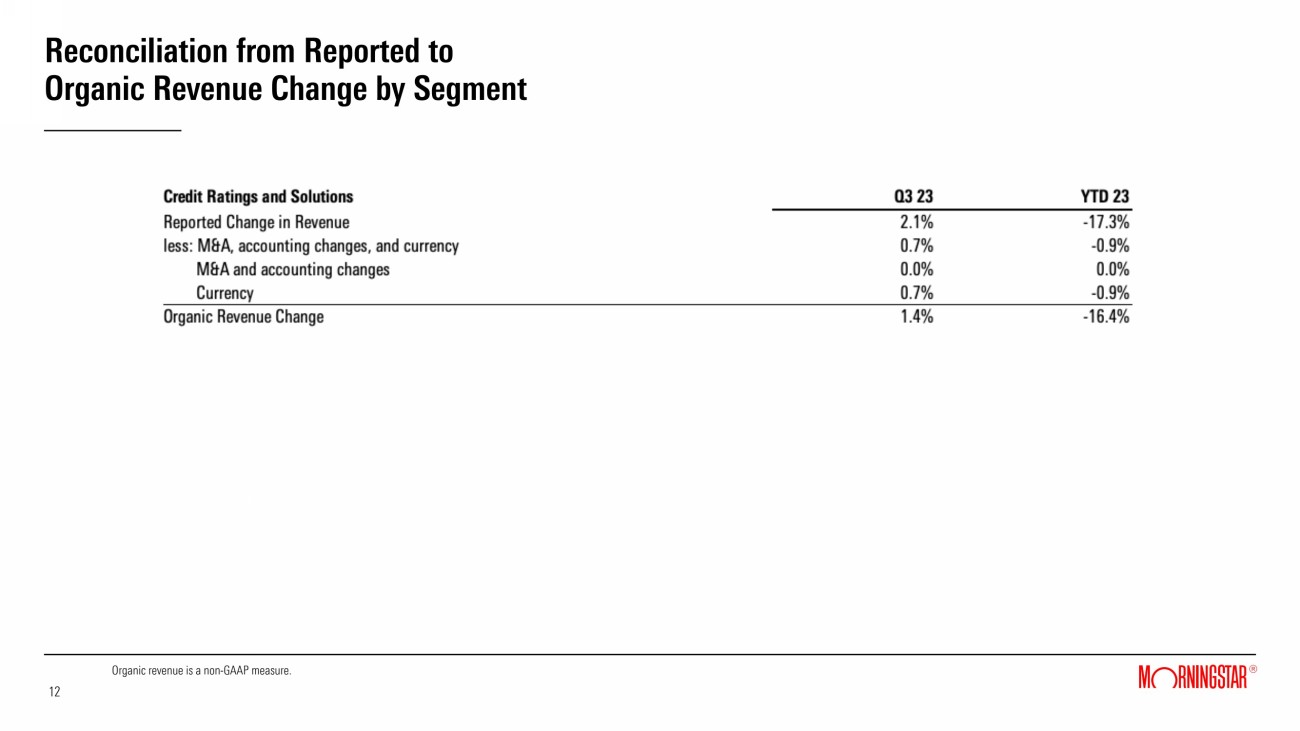
Reconciliation from Reported to Organic Revenue Change by Segment Organic revenue is a non-GAAP measure. 12 12 |
|
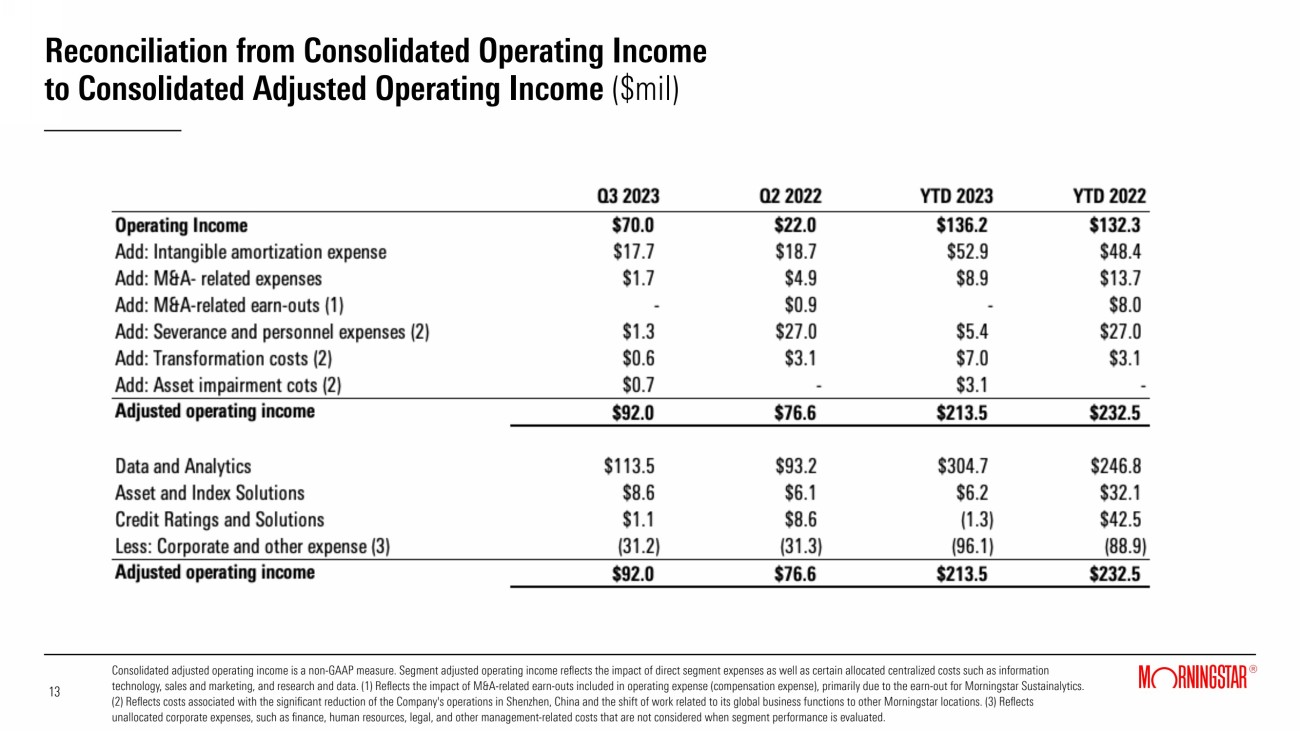
Reconciliation from Consolidated Operating Income to Consolidated Adjusted Operating Income ($mil) Consolidated adjusted operating income is a non-GAAP measure. Segment adjusted operating income reflects the impact of direct segment expenses as well as certain allocated centralized costs such as information technology, sales and marketing, and research and data. (1) Reflects the impact of M&A-related earn-outs included in operating expense (compensation expense), primarily due to the earn-out for Morningstar Sustainalytics. (2) Reflects costs associated with the significant reduction of the Company's operations in Shenzhen, China and the shift of work related to its global business functions to other Morningstar locations. (3) Reflects unallocated corporate expenses, such as finance, human resources, legal, and other management-related costs that are not considered when segment performance is evaluated. 13 13 |
|
Third Quarter 2023 Supplemental Presentation October 25, 2023 |
|
This presentation contains forward-looking statements within the meaning of the Private Securities Litigation Reform Act of 1995. These statements are based on our current expectations about future events or future financial performance. Forward-looking statements by their nature address matters that are, to different degrees, uncertain, and often contain words such as “may,” “could,” “expect,” “intend,” “plan,” “seek,” “anticipate,” “believe,” “estimate,” “predict,” “potential,” “prospects,” or “continue.” These statements involve known and unknown risks and uncertainties that may cause the events we discuss not to occur or to differ significantly from what we expect. More information about factors that could affect Morningstar’s business and financial results are in our filings with the SEC, including our most recent 8-K, 10-K, and 10-Q forms. Morningstar undertakes no obligation to publicly update any forward-looking statements as a result of new information, future events, or otherwise, except as required by law. In addition, this presentation references non-GAAP financial measures including, but not limited to, organic revenue, adjusted operating income, adjusted operating margin, adjusted operating expense, and free cash flow. These non-GAAP measures may not be comparable to similarly titled measures reported by other companies. A reconciliation of non-GAAP financial measures to the most directly comparable GAAP financial measures is provided in the appendix to this presentation and in our filings with the SEC, including our most recent Forms 8-K, 10-K and 10-Q. 15 15 |
|
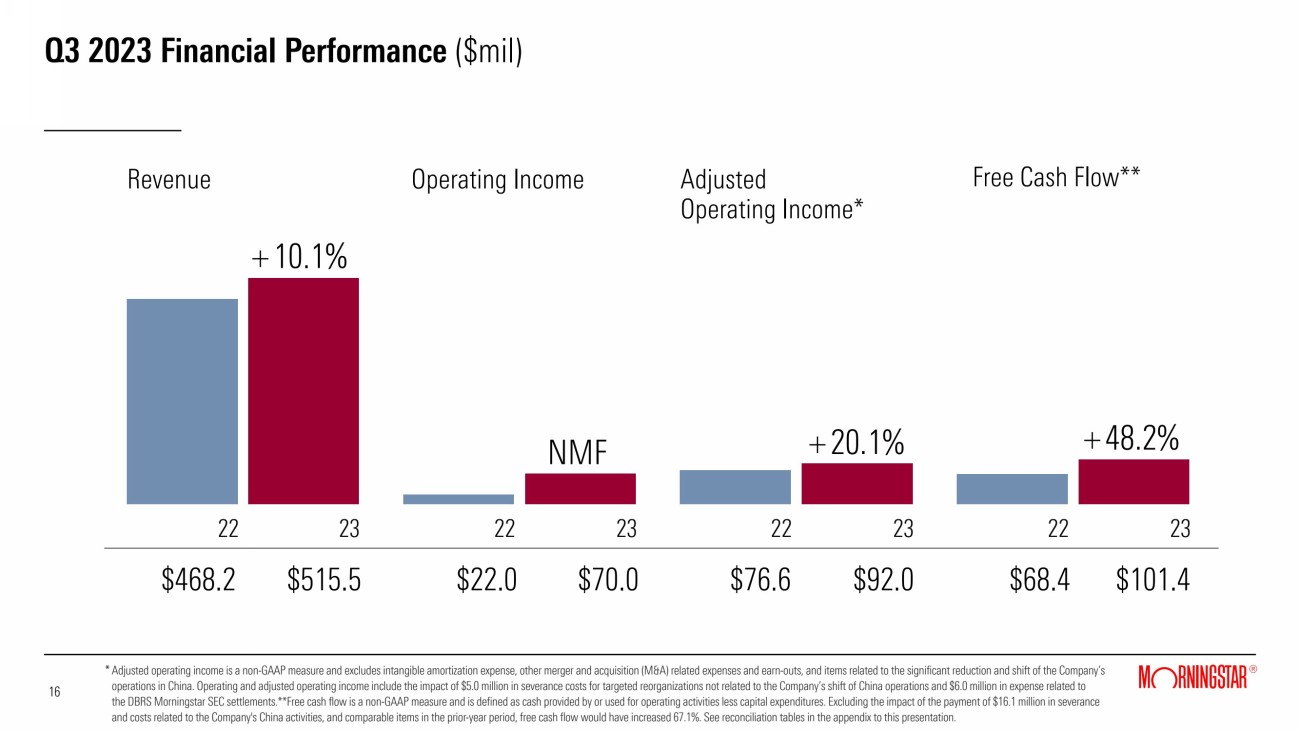
Q3 2023 Financial Performance ($mil) $22.0 $70.0 22 23 $92.0 +10.1% +20.1% 22 23 $468.2 $515.5 22 23 $76.6 $101.4 22 23 $68.4 Revenue Operating Income Adjusted Free Cash Flow** Operating Income* * 16 16 Adjusted operating income is a non-GAAP measure and excludes intangible amortization expense, other merger and acquisition (M&A) related expenses and earn-outs, and items related to the significant reduction and shift of the Company’s operations in China. Operating and adjusted operating income include the impact of $5.0 million in severance costs for targeted reorganizations not related to the Company’s shift of China operations and $6.0 million in expense related to the DBRS Morningstar SEC settlements.**Free cash flow is a non-GAAP measure and is defined as cash provided by or used for operating activities less capital expenditures. Excluding the impact of the payment of $16.1 million in severance and costs related to the Company's China activities, and comparable items in the prior-year period, free cash flow would have increased 67.1%. See reconciliation tables in the appendix to this presentation. +48.2% NMF |
|
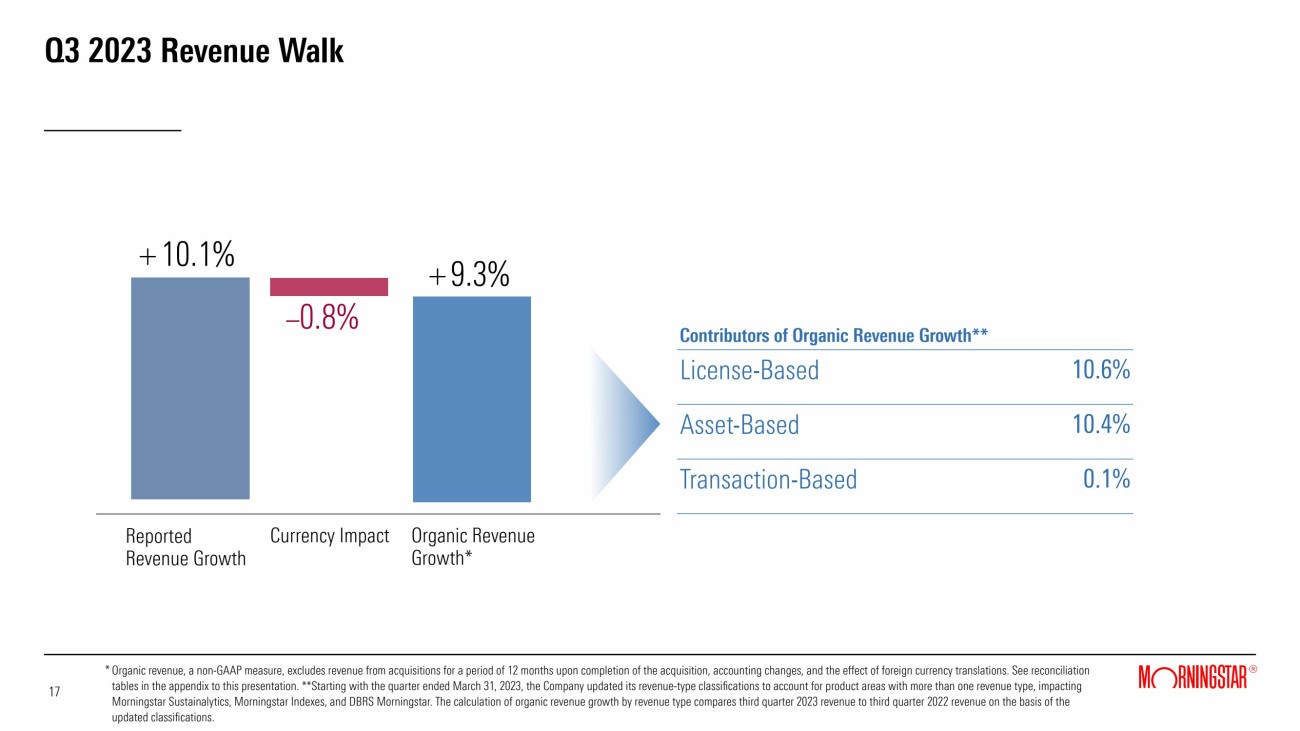
Q3 2023 Revenue Walk Organic revenue, a non-GAAP measure, excludes revenue from acquisitions for a period of 12 months upon completion of the acquisition, accounting changes, and the effect of foreign currency translations. See reconciliation tables in the appendix to this presentation. **Starting with the quarter ended March 31, 2023, the Company updated its revenue-type classifications to account for product areas with more than one revenue type, impacting Morningstar Sustainalytics, Morningstar Indexes, and DBRS Morningstar. The calculation of organic revenue growth by revenue type compares third quarter 2023 revenue to third quarter 2022 revenue on the basis of the updated classifications. 17 17 * +10.1% Reported Revenue Growth +9.3% Contributors of Organic Revenue Growth** License-Based 10.6% Asset-Based 10.4% Transaction-Based 0.1% Organic Revenue Growth* –0.8% Currency Impact |
|
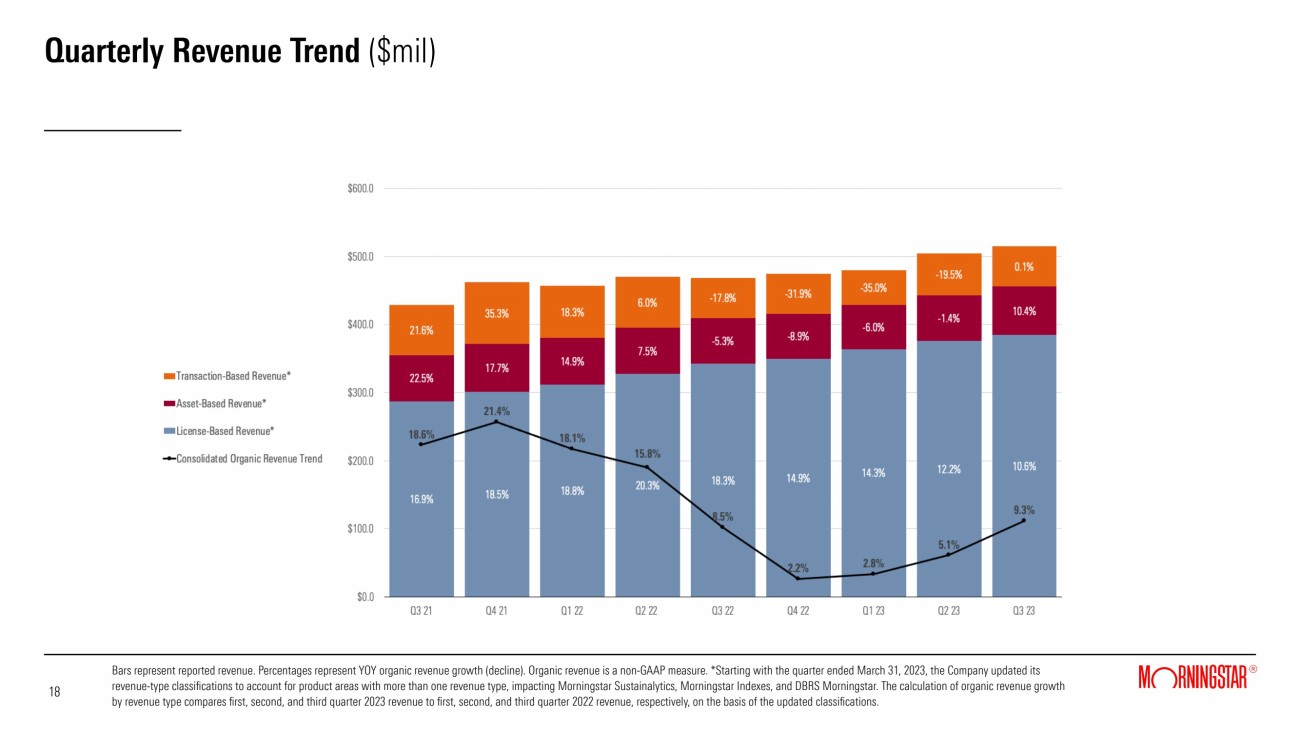
Quarterly Revenue Trend ($mil) Bars represent reported revenue. Percentages represent YOY organic revenue growth (decline). Organic revenue is a non-GAAP measure. *Starting with the quarter ended March 31, 2023, the Company updated its revenue-type classifications to account for product areas with more than one revenue type, impacting Morningstar Sustainalytics, Morningstar Indexes, and DBRS Morningstar. The calculation of organic revenue growth by revenue type compares first, second, and third quarter 2023 revenue to first, second, and third quarter 2022 revenue, respectively, on the basis of the updated classifications. 18 10.6% 12.1% |
|
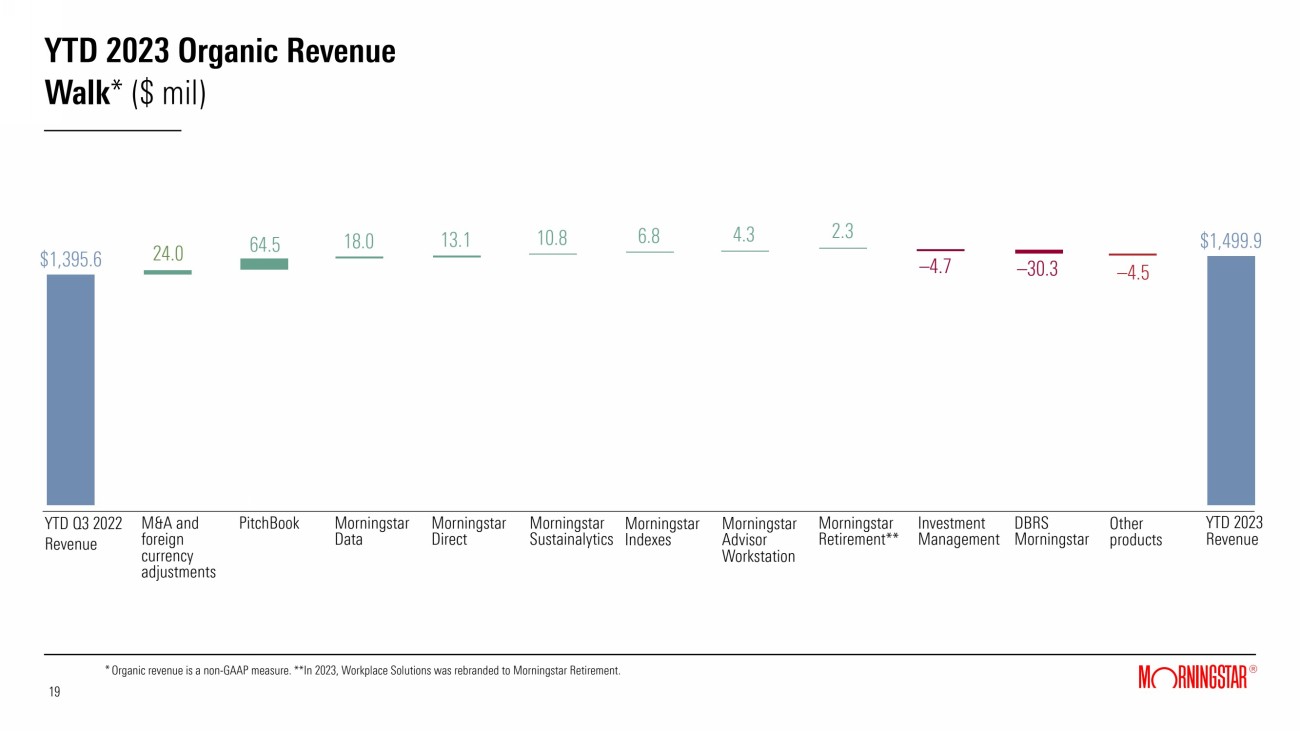
YTD 2023 Organic Revenue Walk* ($ mil) 19 19 YTD Q3 2022 Revenue M&A and foreign currency adjustments PitchBook Morningstar Data Morningstar Direct Morningstar Sustainalytics Morningstar Indexes Morningstar Advisor Workstation Investment Management DBRS Morningstar Morningstar Retirement** Other products YTD 2023 Revenue $1,395.6 24.0 64.5 18.0 13.1 10.8 6.8 2.3 –4.7 –30.3 $1,499.9 * Organic revenue is a non-GAAP measure. **In 2023, Workplace Solutions was rebranded to Morningstar Retirement. –4.5 4.3 |
|
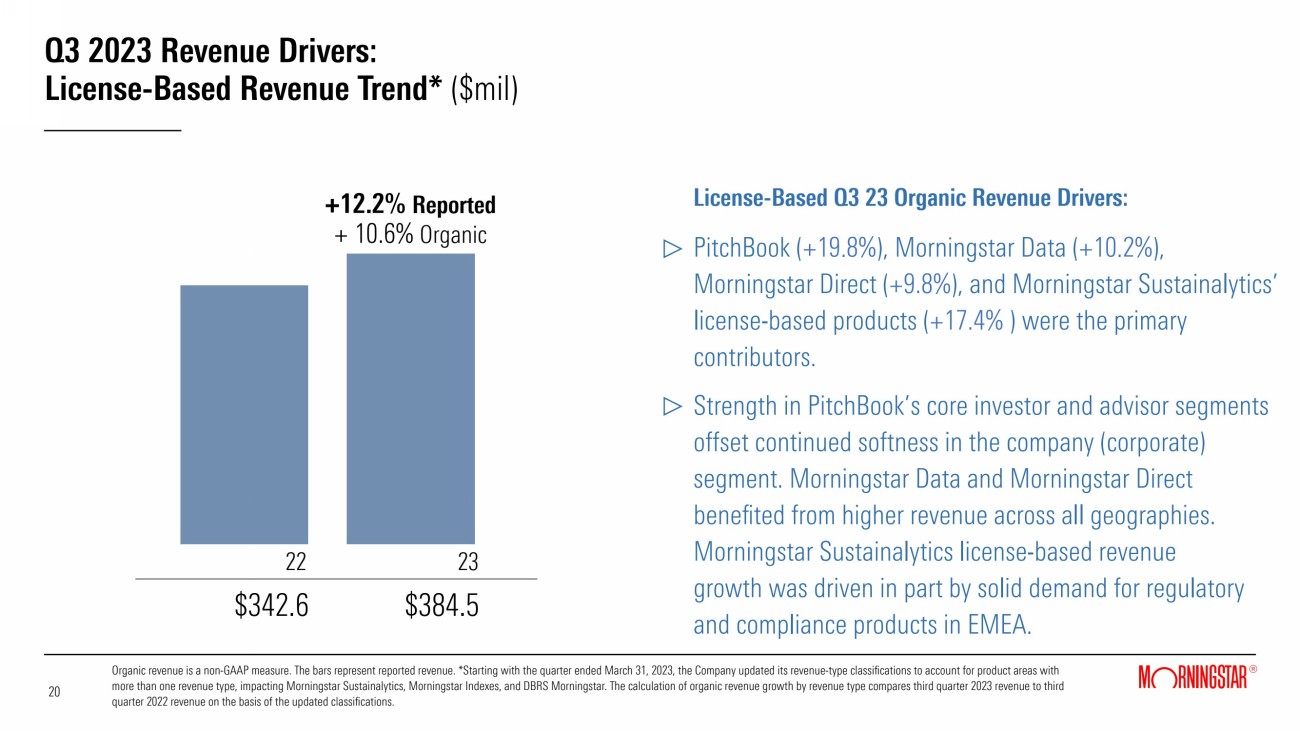
Q3 2023 Revenue Drivers: License-Based Revenue Trend* ($mil) +12.2% Reported + 10.6% Organic 22 23 License-Based Q3 23 Organic Revenue Drivers: PitchBook (+19.8%), Morningstar Data (+10.2%), Morningstar Direct (+9.8%), and Morningstar Sustainalytics’ license-based products (+17.4% ) were the primary contributors. Strength in PitchBook’s core investor and advisor segments offset continued softness in the company (corporate) segment. Morningstar Data and Morningstar Direct benefited from higher revenue across all geographies. Morningstar Sustainalytics license-based revenue growth was driven in part by solid demand for regulatory and compliance products in EMEA. Organic revenue is a non-GAAP measure. The bars represent reported revenue. *Starting with the quarter ended March 31, 2023, the Company updated its revenue-type classifications to account for product areas with more than one revenue type, impacting Morningstar Sustainalytics, Morningstar Indexes, and DBRS Morningstar. The calculation of organic revenue growth by revenue type compares third quarter 2023 revenue to third quarter 2022 revenue on the basis of the updated classifications. $342.6 $384.5 20 20 |
|
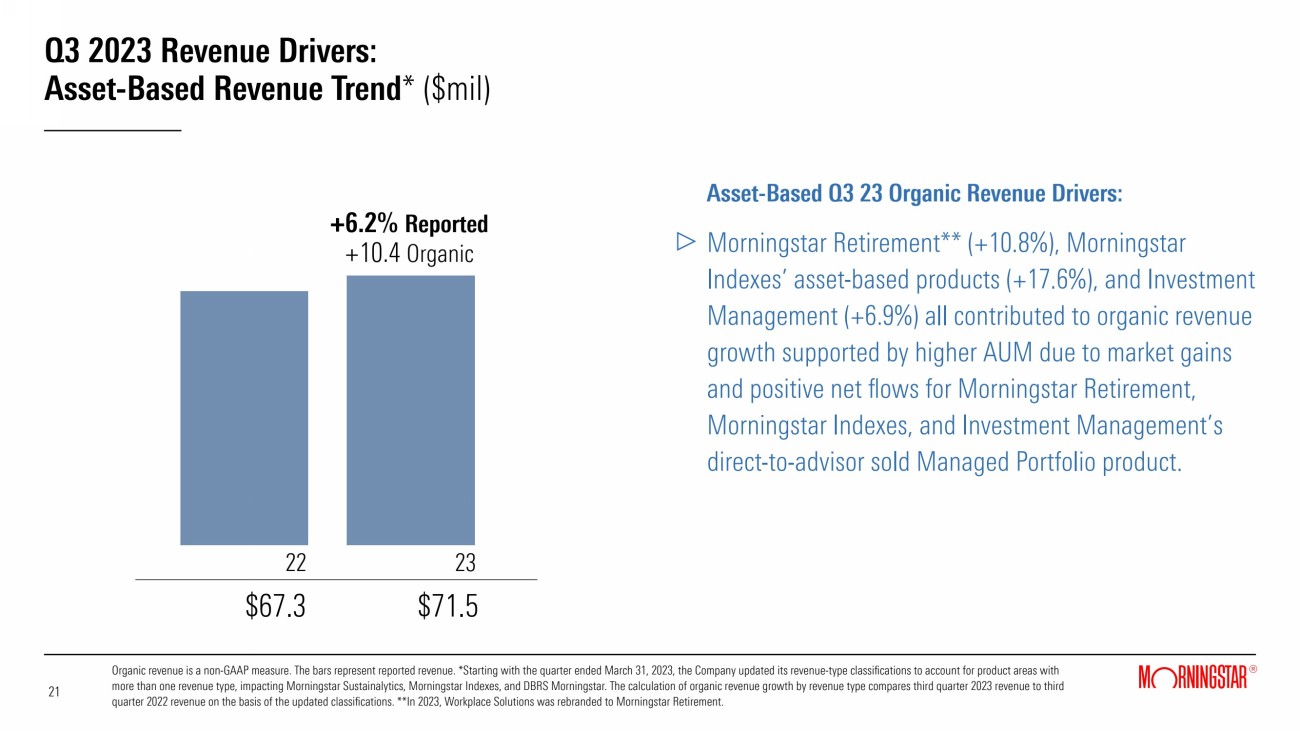
Q3 2023 Revenue Drivers: Asset-Based Revenue Trend* ($mil) Asset-Based Q3 23 Organic Revenue Drivers: Morningstar Retirement** (+10.8%), Morningstar Indexes’ asset-based products (+17.6%), and Investment Management (+6.9%) all contributed to organic revenue growth supported by higher AUM due to market gains and positive net flows for Morningstar Retirement, Morningstar Indexes, and Investment Management’s direct-to-advisor sold Managed Portfolio product. +6.2% Reported +10.4 Organic 22 23 $67.3 $71.5 21 21 Organic revenue is a non-GAAP measure. The bars represent reported revenue. *Starting with the quarter ended March 31, 2023, the Company updated its revenue-type classifications to account for product areas with more than one revenue type, impacting Morningstar Sustainalytics, Morningstar Indexes, and DBRS Morningstar. The calculation of organic revenue growth by revenue type compares third quarter 2023 revenue to third quarter 2022 revenue on the basis of the updated classifications. **In 2023, Workplace Solutions was rebranded to Morningstar Retirement. |
|
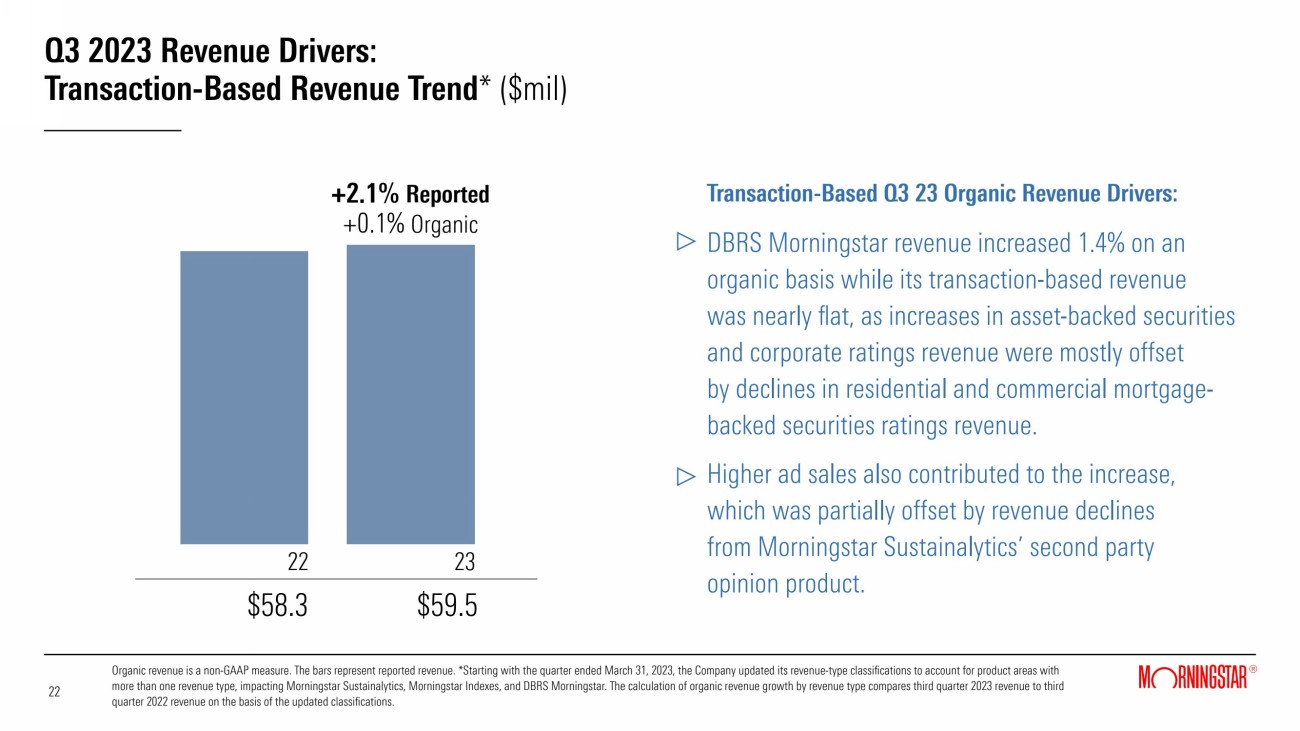
Q3 2023 Revenue Drivers: Transaction-Based Revenue Trend* ($mil) Transaction-Based Q3 23 Organic Revenue Drivers: DBRS Morningstar revenue increased 1.4% on an organic basis while its transaction-based revenue was nearly flat, as increases in asset-backed securities and corporate ratings revenue were mostly offset by declines in residential and commercial mortgage-backed securities ratings revenue. Higher ad sales also contributed to the increase, which was partially offset by revenue declines from Morningstar Sustainalytics’ second party opinion product. +2.1% Reported +0.1% Organic 22 23 $58.3 $59.5 22 22 Organic revenue is a non-GAAP measure. The bars represent reported revenue. *Starting with the quarter ended March 31, 2023, the Company updated its revenue-type classifications to account for product areas with more than one revenue type, impacting Morningstar Sustainalytics, Morningstar Indexes, and DBRS Morningstar. The calculation of organic revenue growth by revenue type compares third quarter 2023 revenue to third quarter 2022 revenue on the basis of the updated classifications. |
|
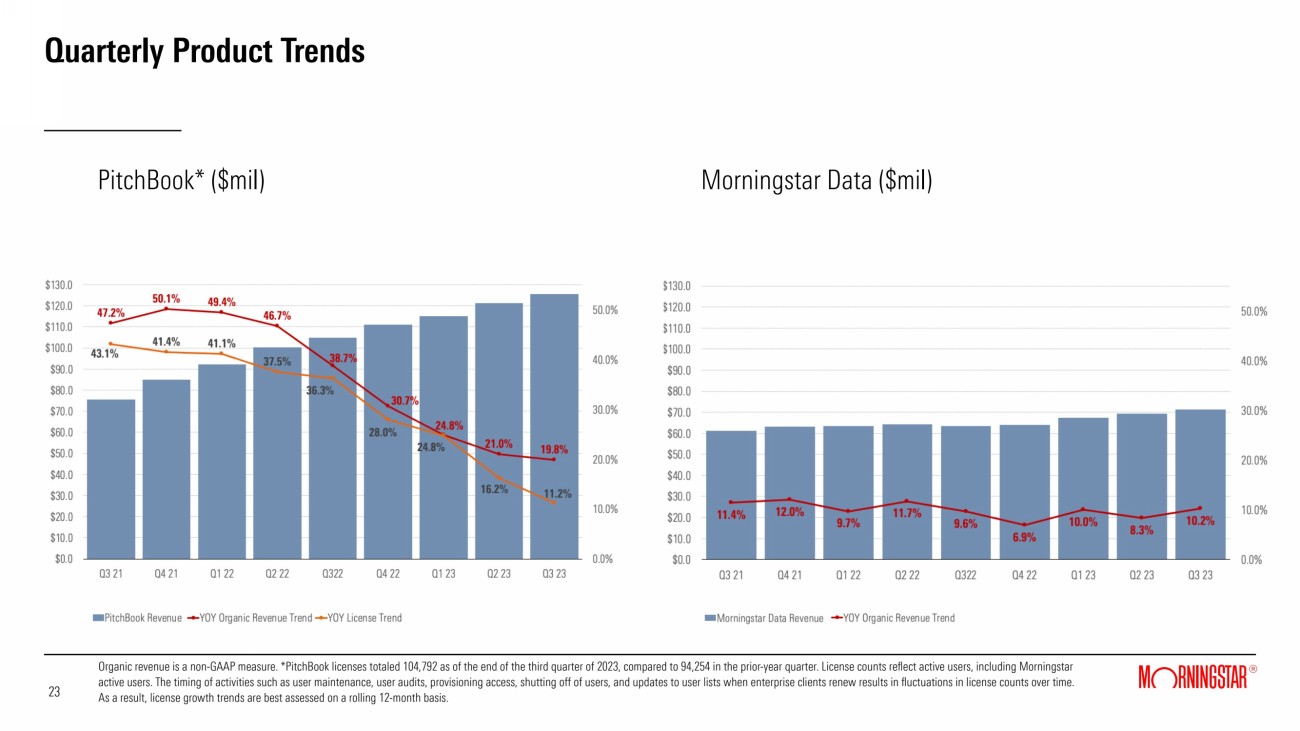
Quarterly Product Trends PitchBook* ($mil) 23 23 Morningstar Data ($mil) Organic revenue is a non-GAAP measure. *PitchBook licenses totaled 104,792 as of the end of the third quarter of 2023, compared to 94,254 in the prior-year quarter. License counts reflect active users, including Morningstar active users. The timing of activities such as user maintenance, user audits, provisioning access, shutting off of users, and updates to user lists when enterprise clients renew results in fluctuations in license counts over time. As a result, license growth trends are best assessed on a rolling 12-month basis. |
|
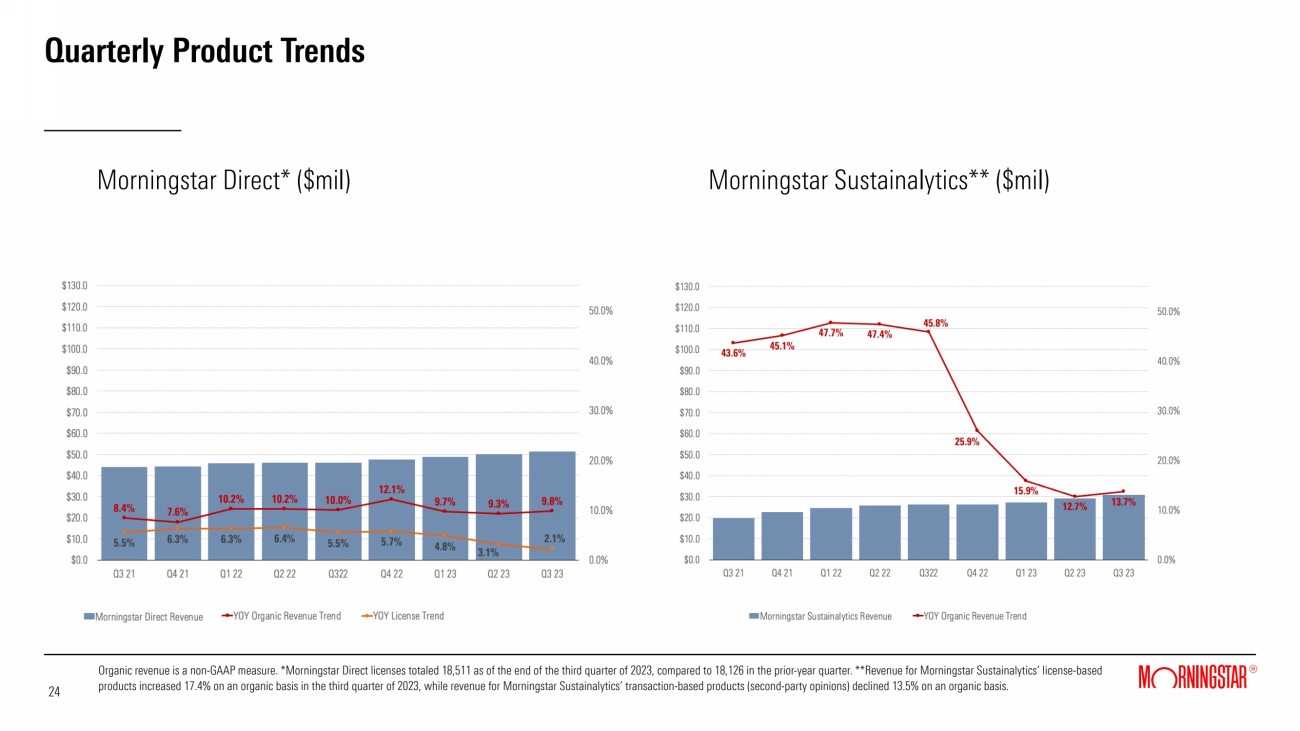
Quarterly Product Trends Morningstar Direct* ($mil) 24 24 Organic revenue is a non-GAAP measure. *Morningstar Direct licenses totaled 18,511 as of the end of the third quarter of 2023, compared to 18,126 in the prior-year quarter. **Revenue for Morningstar Sustainalytics’ license-based products increased 17.4% on an organic basis in the third quarter of 2023, while revenue for Morningstar Sustainalytics’ transaction-based products (second-party opinions) declined 13.5% on an organic basis. Morningstar Sustainalytics** ($mil) |
|
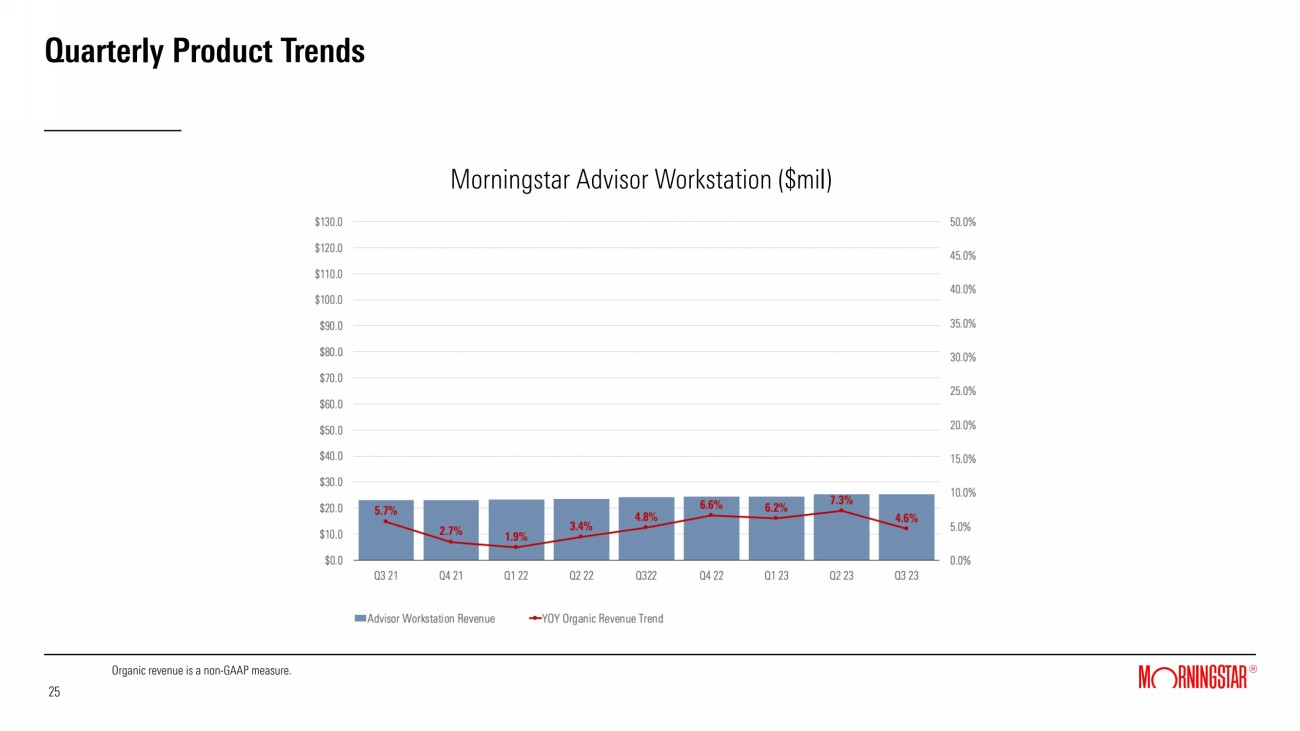
Quarterly Product Trends Morningstar Advisor Workstation ($mil) 25 25 Organic revenue is a non-GAAP measure. |
|
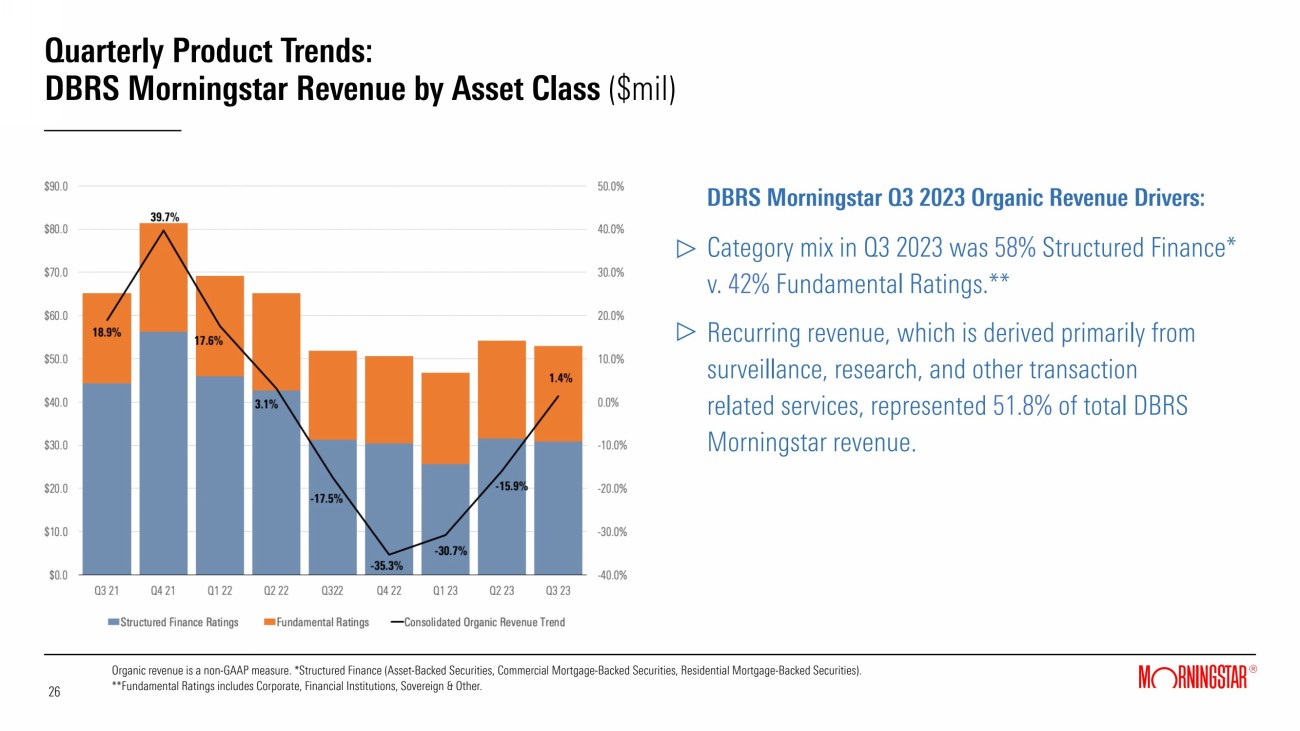
Quarterly Product Trends: DBRS Morningstar Revenue by Asset Class ($mil) DBRS Morningstar Q3 2023 Organic Revenue Drivers: Category mix in Q3 2023 was 58% Structured Finance* v. 42% Fundamental Ratings.** Recurring revenue, which is derived primarily from surveillance, research, and other transaction related services, represented 51.8% of total DBRS Morningstar revenue. Organic revenue is a non-GAAP measure. *Structured Finance (Asset-Backed Securities, Commercial Mortgage-Backed Securities, Residential Mortgage-Backed Securities). **Fundamental Ratings includes Corporate, Financial Institutions, Sovereign & Other. 26 26 |
|
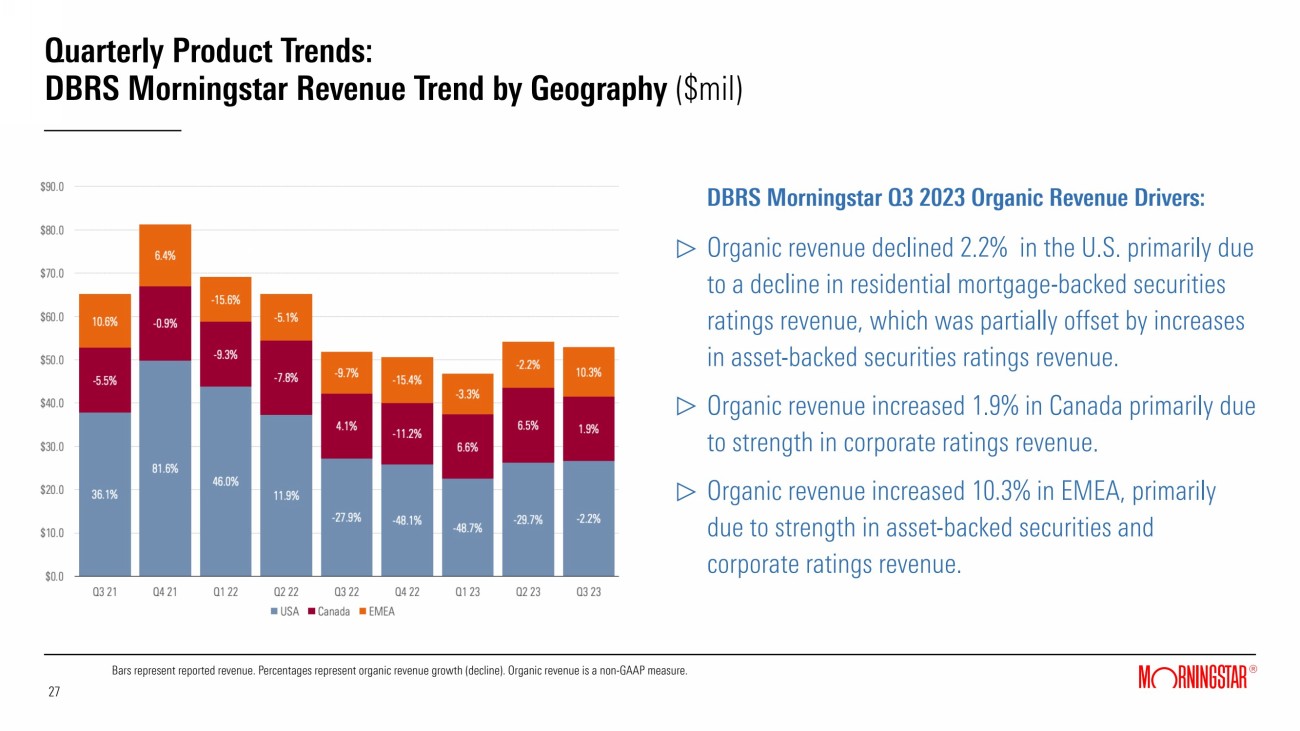
Quarterly Product Trends: DBRS Morningstar Revenue Trend by Geography ($mil) DBRS Morningstar Q3 2023 Organic Revenue Drivers: Organic revenue declined 2.2% in the U.S. primarily due to a decline in residential mortgage-backed securities ratings revenue, which was partially offset by increases in asset-backed securities ratings revenue. Organic revenue increased 1.9% in Canada primarily due to strength in corporate ratings revenue. Organic revenue increased 10.3% in EMEA, primarily due to strength in asset-backed securities and corporate ratings revenue. Bars represent reported revenue. Percentages represent organic revenue growth (decline). Organic revenue is a non-GAAP measure. 27 27 |
|
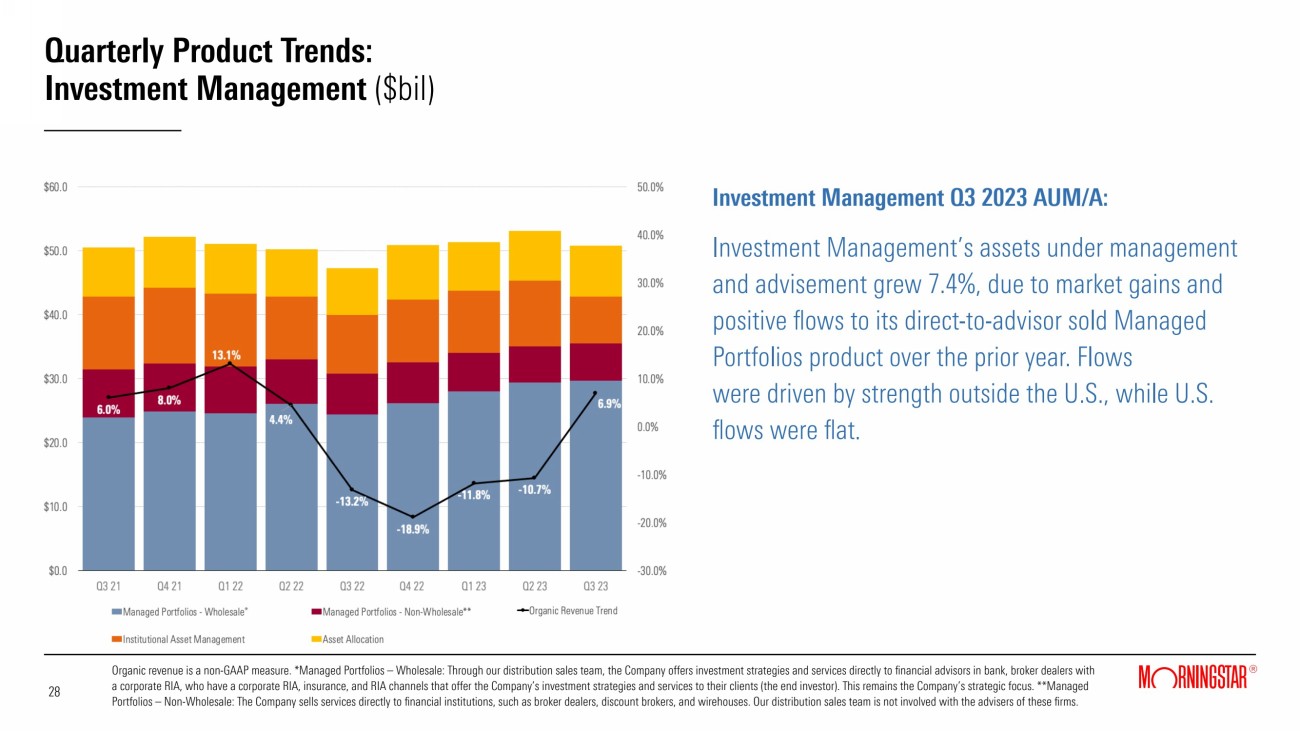
Quarterly Product Trends: Investment Management ($bil) Investment Management Q3 2023 AUM/A: Investment Management’s assets under management and advisement grew 7.4%, due to market gains and positive flows to its direct-to-advisor sold Managed Portfolios product over the prior year. Flows were driven by strength outside the U.S., while U.S. flows were flat. Organic revenue is a non-GAAP measure. *Managed Portfolios – Wholesale: Through our distribution sales team, the Company offers investment strategies and services directly to financial advisors in bank, broker dealers with a corporate RIA, who have a corporate RIA, insurance, and RIA channels that offer the Company’s investment strategies and services to their clients (the end investor). This remains the Company’s strategic focus. **Managed Portfolios – Non-Wholesale: The Company sells services directly to financial institutions, such as broker dealers, discount brokers, and wirehouses. Our distribution sales team is not involved with the advisers of these firms. 28 28 * |
|
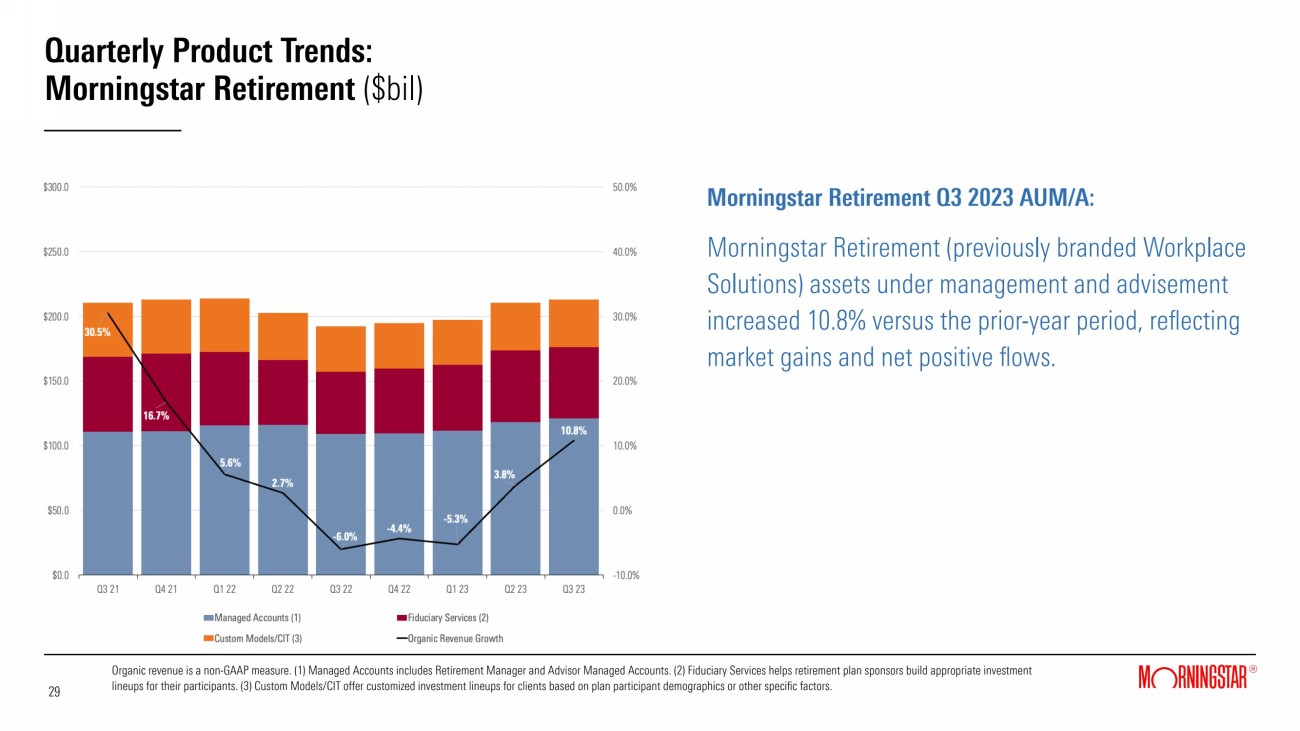
Morningstar Retirement Q3 2023 AUM/A: Morningstar Retirement (previously branded Workplace Solutions) assets under management and advisement increased 10.8% versus the prior-year period, reflecting market gains and net positive flows. Quarterly Product Trends: Morningstar Retirement ($bil) Organic revenue is a non-GAAP measure. (1) Managed Accounts includes Retirement Manager and Advisor Managed Accounts. (2) Fiduciary Services helps retirement plan sponsors build appropriate investment lineups for their participants. (3) Custom Models/CIT offer customized investment lineups for clients based on plan participant demographics or other specific factors. 29 29 |
|
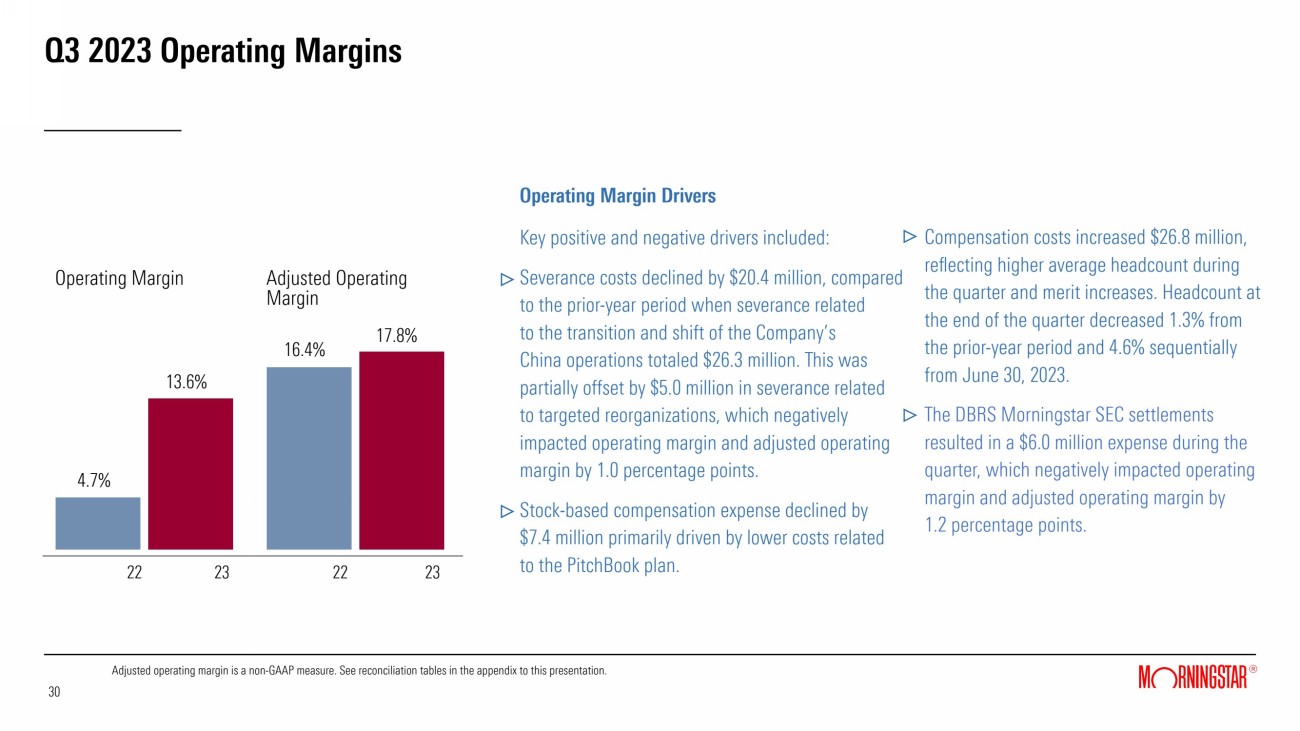
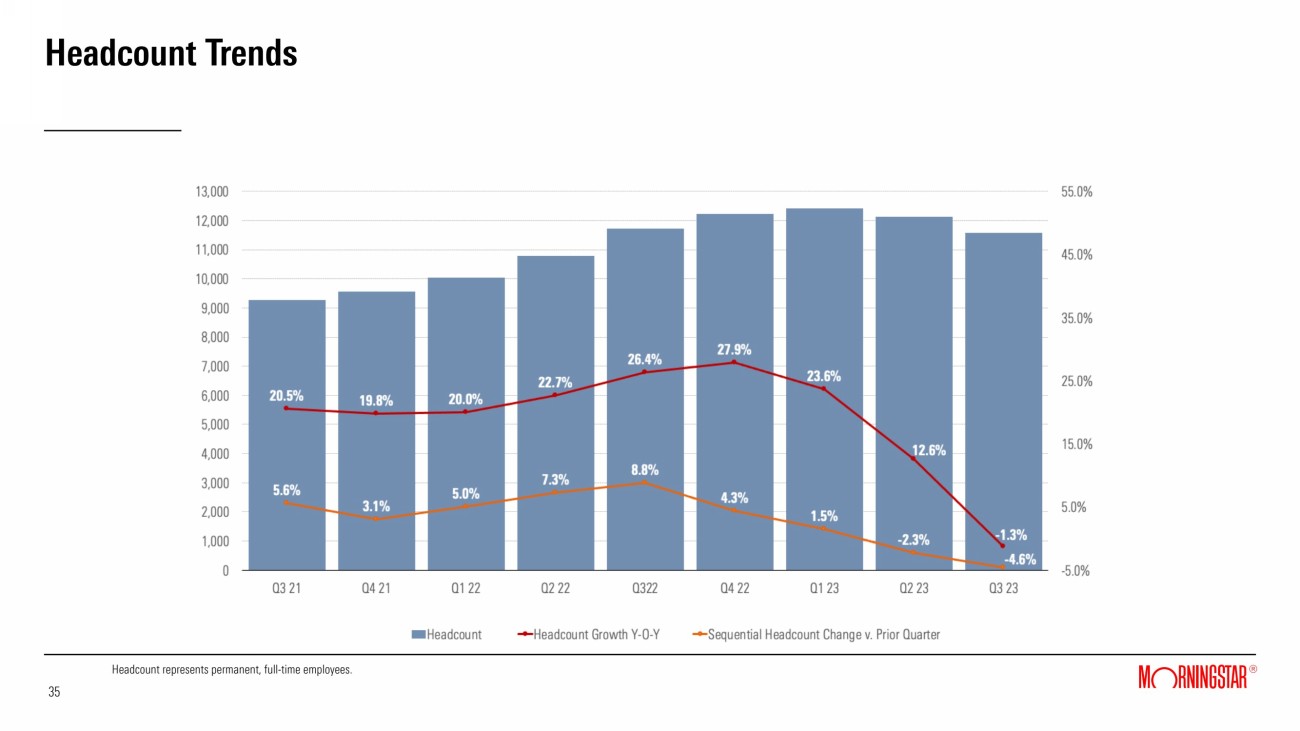
Q3 2023 Operating Margins Operating Margin Drivers Key positive and negative drivers included: Severance costs declined by $20.4 million, compared to the prior-year period when severance related to the transition and shift of the Company’s China operations totaled $26.3 million. This was partially offset by $5.0 million in severance related to targeted reorganizations, which negatively impacted operating margin and adjusted operating margin by 1.0 percentage points. Stock-based compensation expense declined by $7.4 million primarily driven by lower costs related to the PitchBook plan. Compensation costs increased $26.8 million, reflecting higher average headcount during the quarter and merit increases. Headcount at the end of the quarter decreased 1.3% from the prior-year period and 4.6% sequentially from June 30, 2023. The DBRS Morningstar SEC settlements resulted in a $6.0 million expense during the quarter, which negatively impacted operating margin and adjusted operating margin by 1.2 percentage points. 30 30 Adjusted operating margin is a non-GAAP measure. See reconciliation tables in the appendix to this presentation. Adjusted Operating Margin Operating Margin 22 23 13.6% 17.8% 22 23 4.7% 16.4% |
|
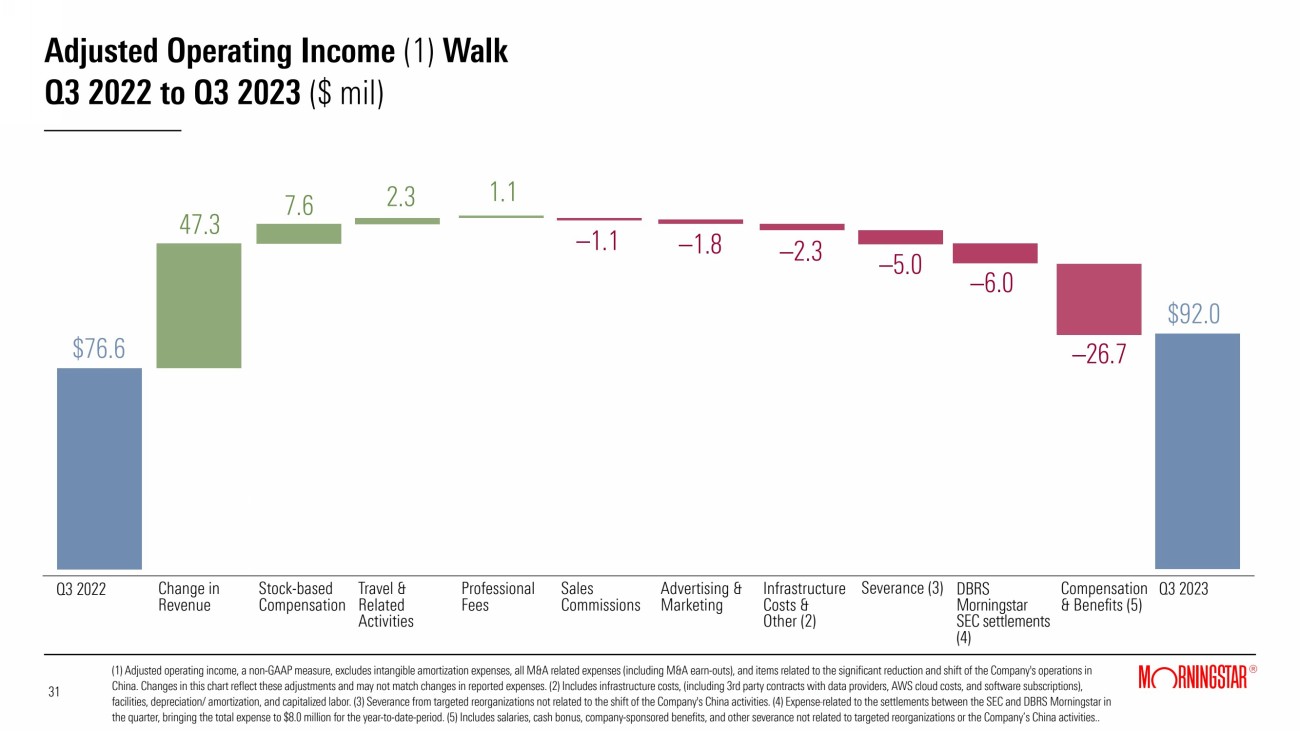
Adjusted Operating Income (1) Walk Q3 2022 to Q3 2023 ($ mil) (1) Adjusted operating income, a non-GAAP measure, excludes intangible amortization expenses, all M&A related expenses (including M&A earn-outs), and items related to the significant reduction and shift of the Company's operations in China. Changes in this chart reflect these adjustments and may not match changes in reported expenses. (2) Includes infrastructure costs, (including 3rd party contracts with data providers, AWS cloud costs, and software subscriptions), facilities, depreciation/ amortization, and capitalized labor. (3) Severance from targeted reorganizations not related to the shift of the Company's China activities. (4) Expense related to the settlements between the SEC and DBRS Morningstar in the quarter, bringing the total expense to $8.0 million for the year-to-date-period. (5) Includes salaries, cash bonus, company-sponsored benefits, and other severance not related to targeted reorganizations or the Company’s China activities.. 31 31 Q3 2022 Change in Revenue DBRS Morningstar SEC settlements (4) Stock-based Compensation Travel & Related Activities Professional Fees Advertising & Marketing Infrastructure Costs & Other (2) Q3 2023 $76.6 7.6 47.3 2.3 –1.1 1.1 –1.8 $92.0 Sales Commissions –6.0 –2.3 Compensation & Benefits (5) –26.7 –5.0 Severance (3) |
|
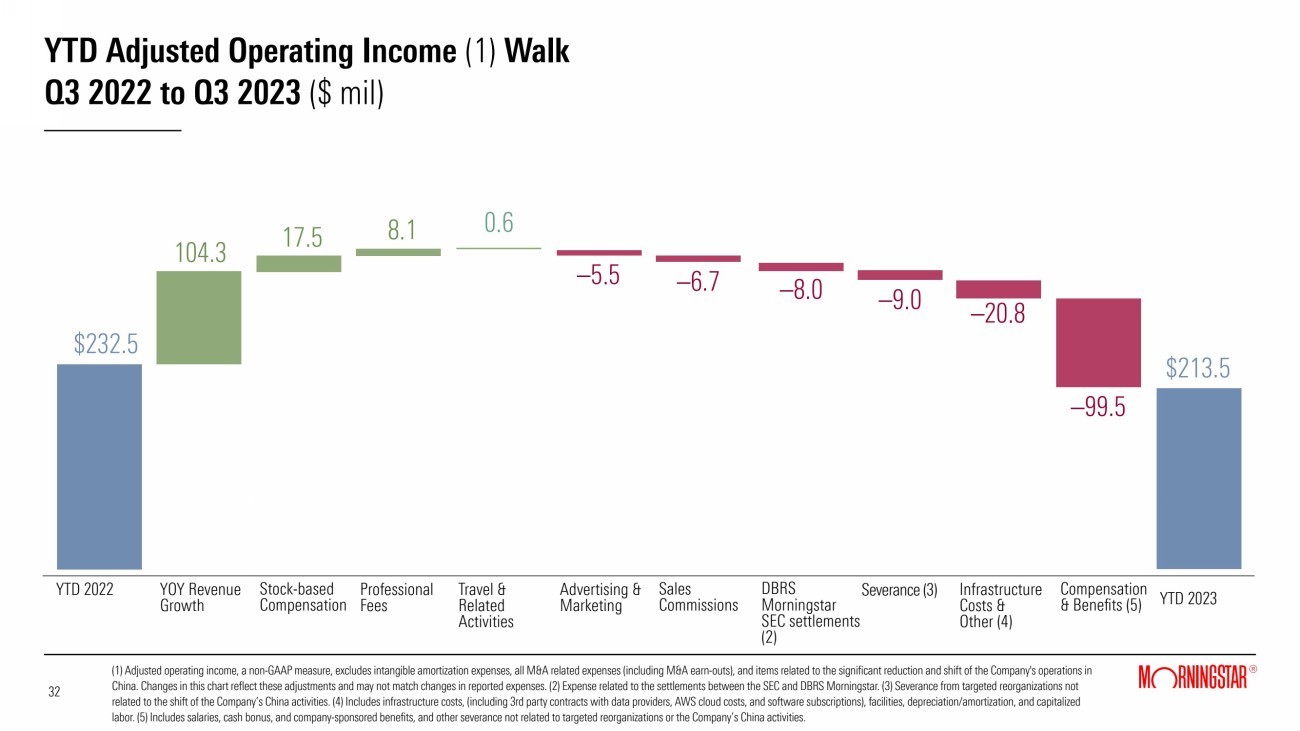
YTD Adjusted Operating Income (1) Walk Q3 2022 to Q3 2023 ($ mil) (1) Adjusted operating income, a non-GAAP measure, excludes intangible amortization expenses, all M&A related expenses (including M&A earn-outs), and items related to the significant reduction and shift of the Company's operations in China. Changes in this chart reflect these adjustments and may not match changes in reported expenses. (2) Expense related to the settlements between the SEC and DBRS Morningstar. (3) Severance from targeted reorganizations not related to the shift of the Company’s China activities. (4) Includes infrastructure costs, (including 3rd party contracts with data providers, AWS cloud costs, and software subscriptions), facilities, depreciation/amortization, and capitalized labor. (5) Includes salaries, cash bonus, and company-sponsored benefits, and other severance not related to targeted reorganizations or the Company’s China activities. 32 32 YTD 2022 YOY Revenue Growth Stock-based Compensation Professional Fees Travel & Related Activities Advertising & Marketing Sales Commissions Infrastructure Costs & Other (4) YTD 2023 $232.5 –20.8 17.5 104.3 8.1 –6.7 0.6 –5.5 $213.5 DBRS Morningstar SEC settlements (2) –8.0 –99.5 Compensation & Benefits (5) –9.0 Severance (3) |
|
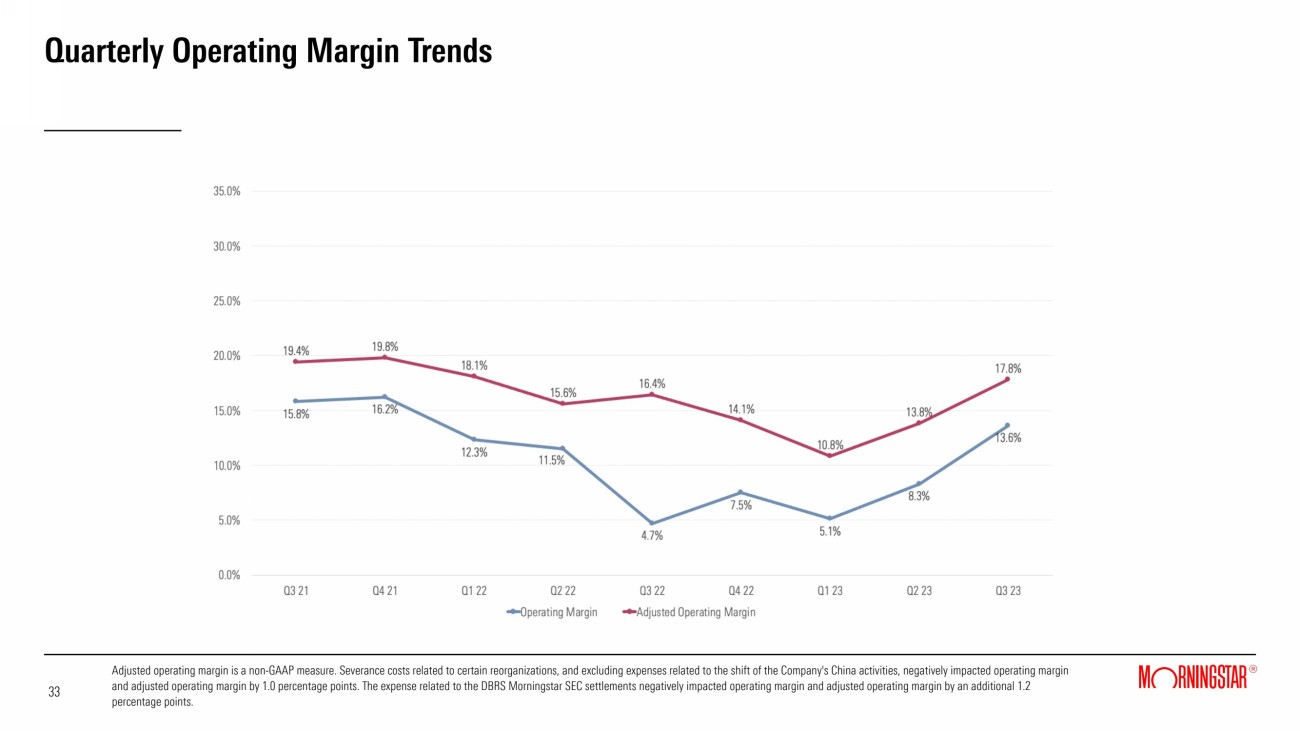
Quarterly Operating Margin Trends Adjusted operating margin is a non-GAAP measure. Severance costs related to certain reorganizations, and excluding expenses related to the shift of the Company's China activities, negatively impacted operating margin and adjusted operating margin by 1.0 percentage points. The expense related to the DBRS Morningstar SEC settlements negatively impacted operating margin and adjusted operating margin by an additional 1.2 percentage points. 33 33 |
|
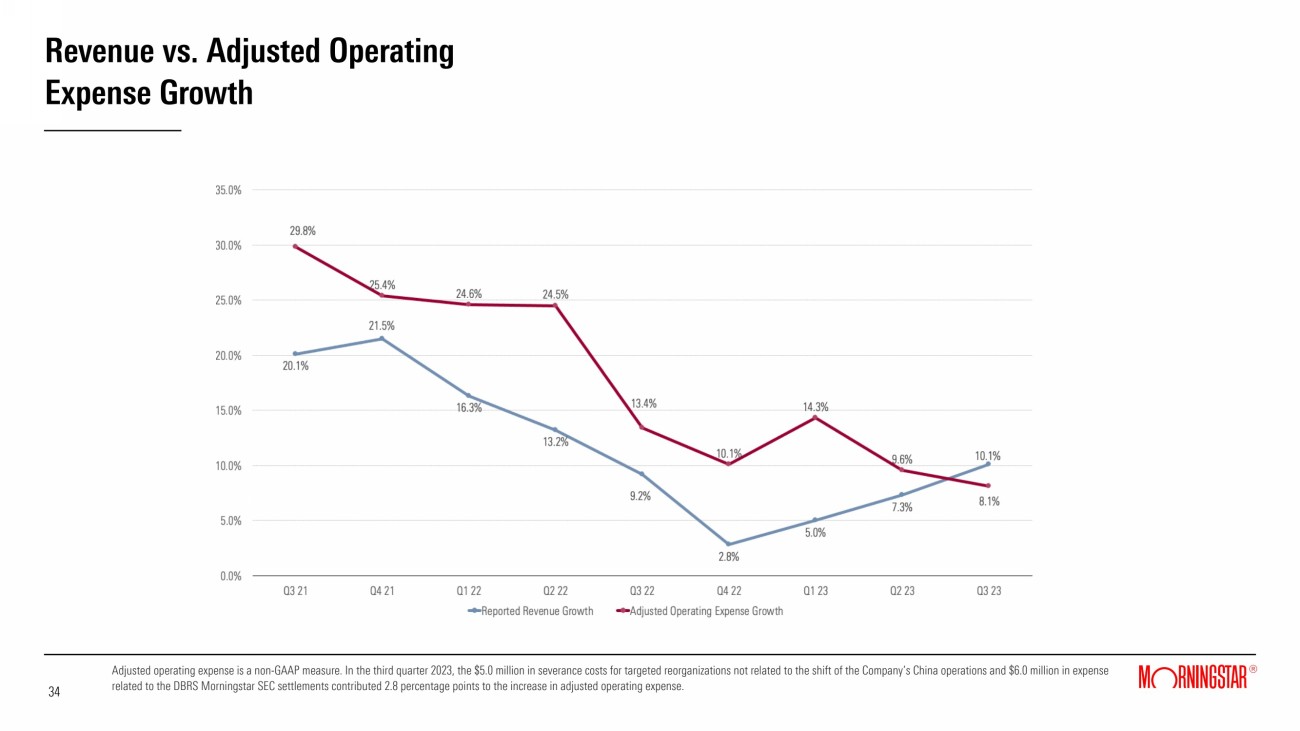
Revenue vs. Adjusted Operating Expense Growth 34 34 Adjusted operating expense is a non-GAAP measure. In the third quarter 2023, the $5.0 million in severance costs for targeted reorganizations not related to the shift of the Company’s China operations and $6.0 million in expense related to the DBRS Morningstar SEC settlements contributed 2.8 percentage points to the increase in adjusted operating expense. |
|
Headcount Trends 35 35 Headcount represents permanent, full-time employees. |
|
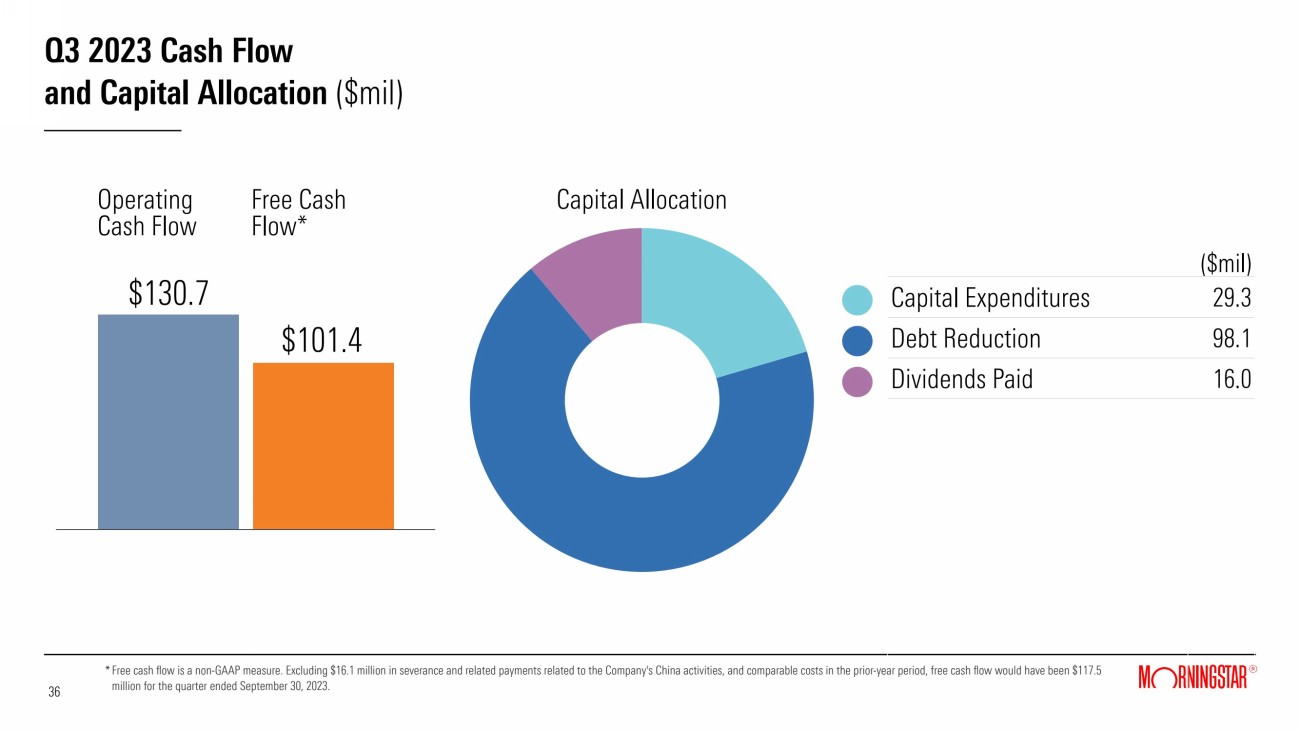
Q3 2023 Cash Flow and Capital Allocation ($mil) 2 $130.7 $101.4 Operating Cash Flow Free Cash Flow* Capital Allocation 36 36 * ($mil) Capital Expenditures 29.3 Debt Reduction 98.1 Dividends Paid 16.0 Investments in Unconsolidated Entities Free cash flow is a non-GAAP measure. Excluding $16.1 million in severance and related payments related to the Company's China activities, and comparable costs in the prior-year period, free cash flow would have been $117.5 million for the quarter ended September 30, 2023. |
|
Appendix |
|
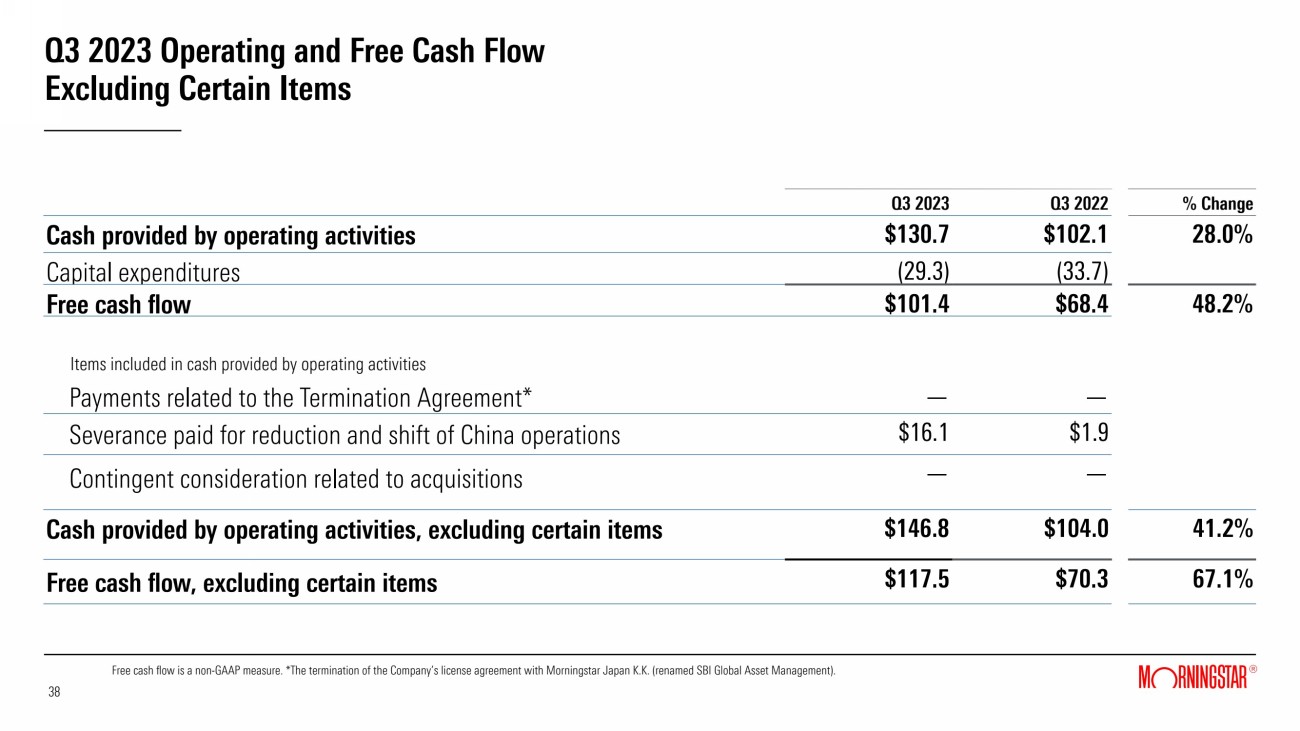
Q3 2023 Operating and Free Cash Flow Excluding Certain Items Free cash flow is a non-GAAP measure. *The termination of the Company’s license agreement with Morningstar Japan K.K. (renamed SBI Global Asset Management). Q3 2023 Q3 2022 % Change Cash provided by operating activities $130.7 $102.1 28.0% Capital expenditures (29.3) (33.7) Free cash flow $101.4 $68.4 48.2% Items included in cash provided by operating activities Payments related to the Termination Agreement* — — Severance paid for reduction and shift of China operations $16.1 $1.9 Contingent consideration related to acquisitions — — Cash provided by operating activities, excluding certain items $146.8 $104.0 41.2% Free cash flow, excluding certain items $117.5 $70.3 67.1% 38 38 |
|
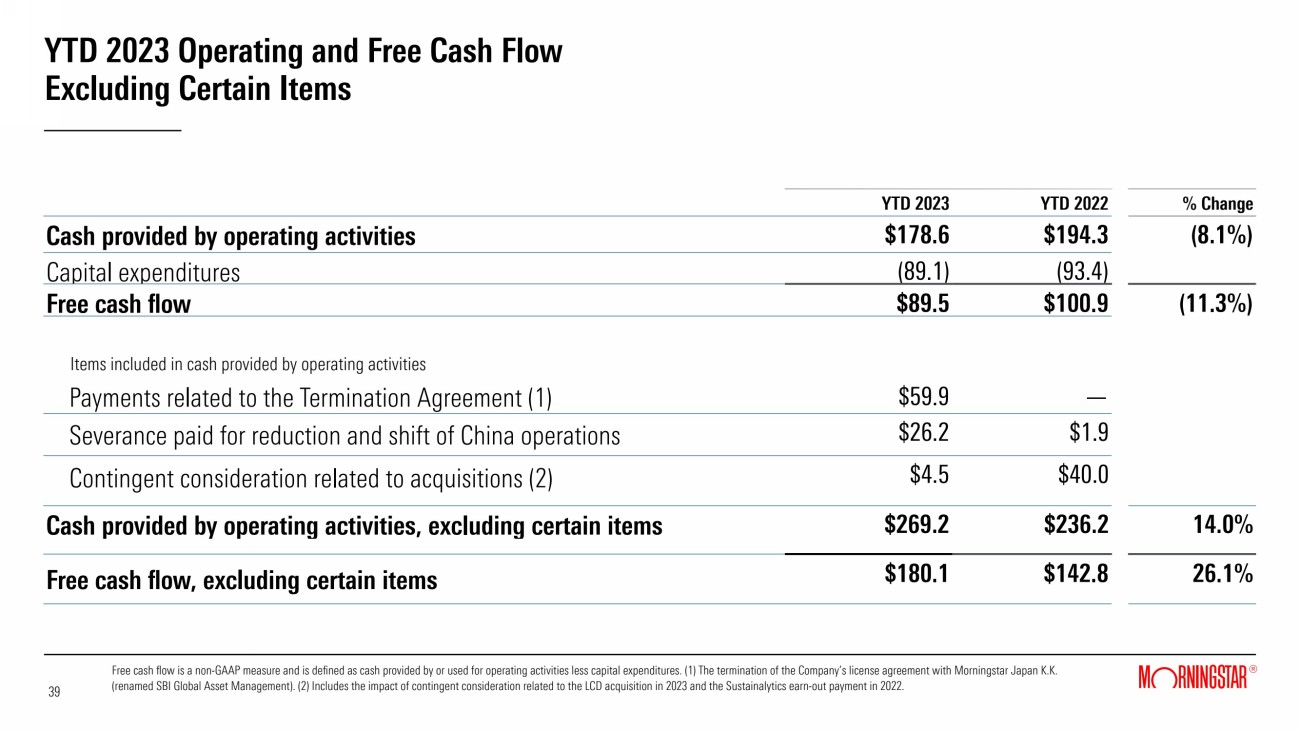
YTD 2023 Operating and Free Cash Flow Excluding Certain Items Free cash flow is a non-GAAP measure and is defined as cash provided by or used for operating activities less capital expenditures. (1) The termination of the Company’s license agreement with Morningstar Japan K.K. (renamed SBI Global Asset Management). (2) Includes the impact of contingent consideration related to the LCD acquisition in 2023 and the Sustainalytics earn-out payment in 2022. YTD 2023 YTD 2022 % Change Cash provided by operating activities $178.6 $194.3 (8.1%) Capital expenditures (89.1) (93.4) Free cash flow $89.5 $100.9 (11.3%) Items included in cash provided by operating activities Payments related to the Termination Agreement (1) $59.9 — Severance paid for reduction and shift of China operations $26.2 $1.9 Contingent consideration related to acquisitions (2) $4.5 $40.0 Cash provided by operating activities, excluding certain items $269.2 $236.2 14.0% Free cash flow, excluding certain items $180.1 $142.8 26.1% 39 39 |
|
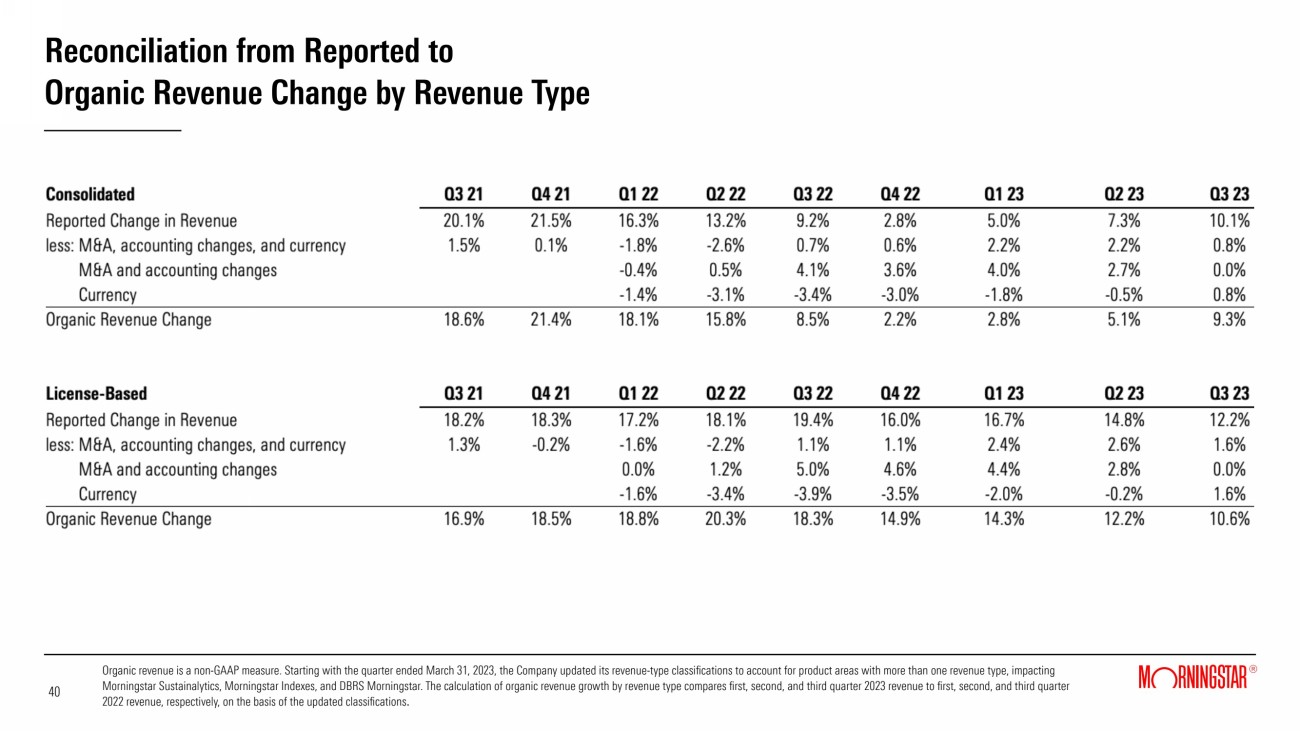
Reconciliation from Reported to Organic Revenue Change by Revenue Type 40 40 Organic revenue is a non-GAAP measure. Starting with the quarter ended March 31, 2023, the Company updated its revenue-type classifications to account for product areas with more than one revenue type, impacting Morningstar Sustainalytics, Morningstar Indexes, and DBRS Morningstar. The calculation of organic revenue growth by revenue type compares first, second, and third quarter 2023 revenue to first, second, and third quarter 2022 revenue, respectively, on the basis of the updated classifications. |
|
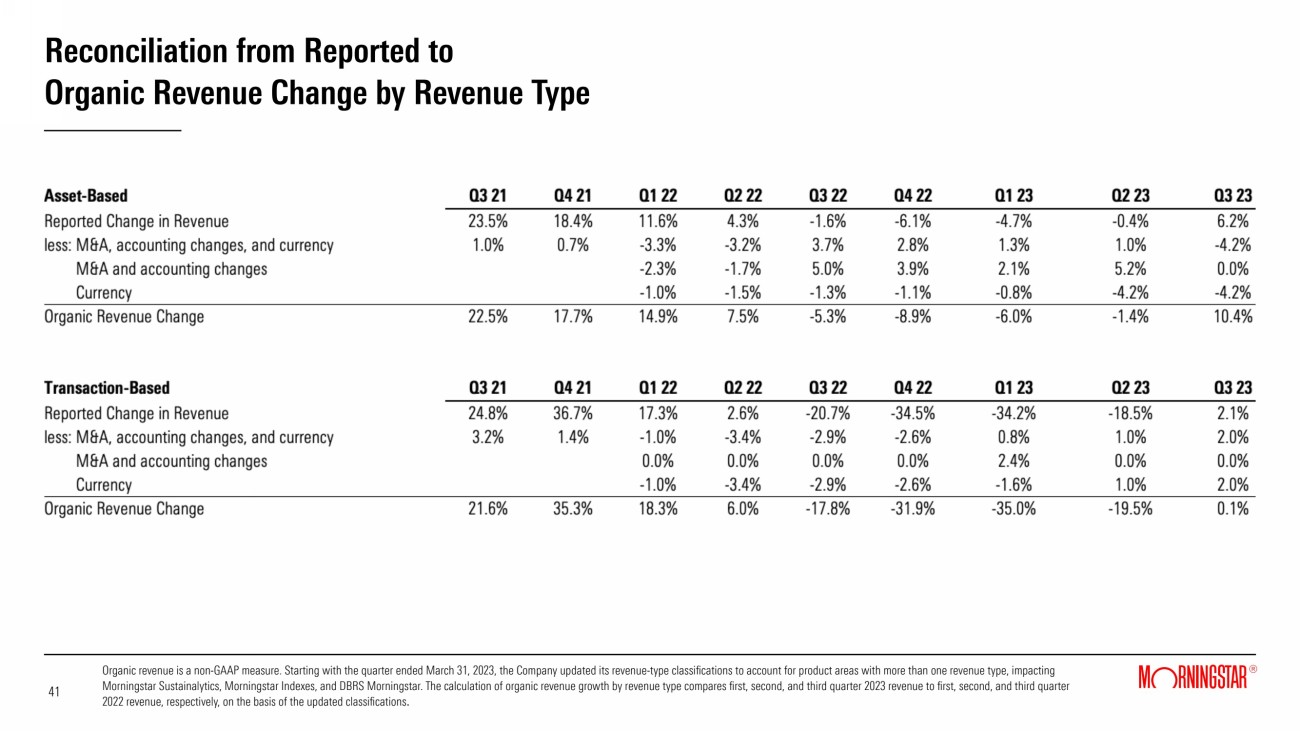
Reconciliation from Reported to Organic Revenue Change by Revenue Type 41 41 Organic revenue is a non-GAAP measure. Starting with the quarter ended March 31, 2023, the Company updated its revenue-type classifications to account for product areas with more than one revenue type, impacting Morningstar Sustainalytics, Morningstar Indexes, and DBRS Morningstar. The calculation of organic revenue growth by revenue type compares first, second, and third quarter 2023 revenue to first, second, and third quarter 2022 revenue, respectively, on the basis of the updated classifications. |
|
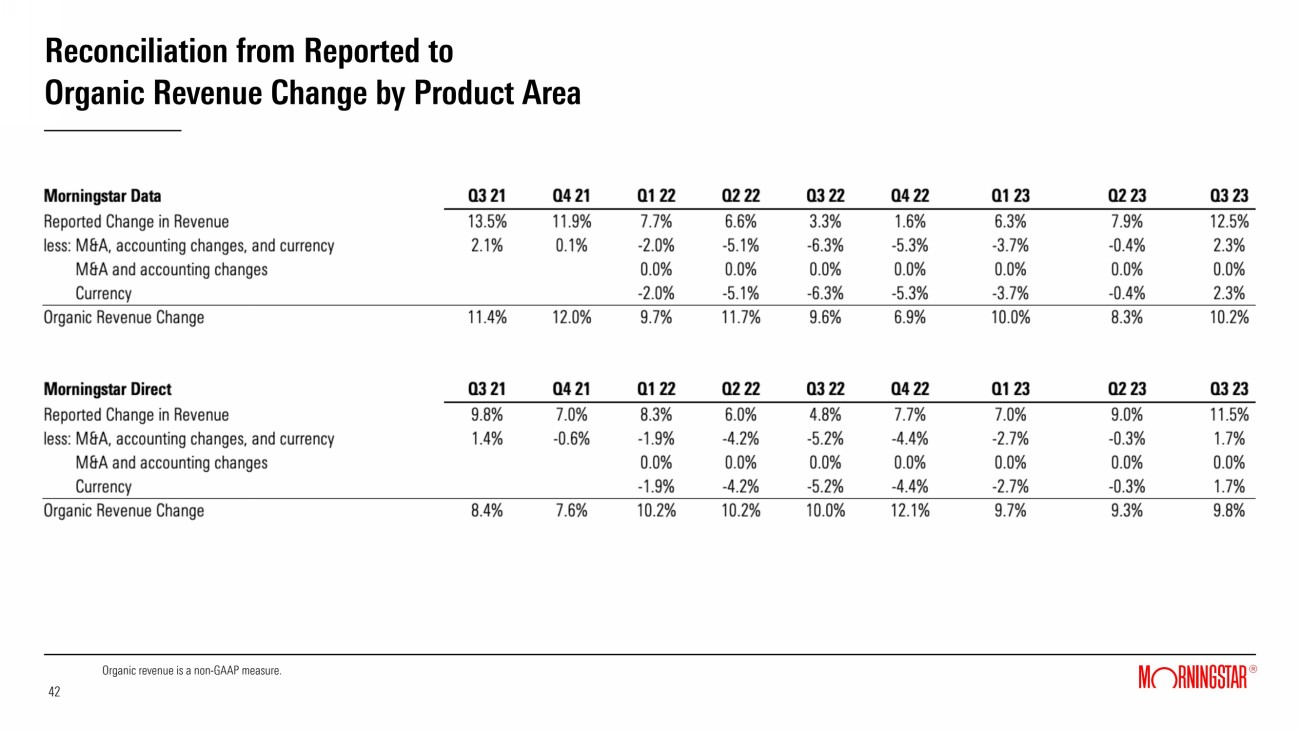
Reconciliation from Reported to Organic Revenue Change by Product Area 42 42 Organic revenue is a non-GAAP measure. |
|
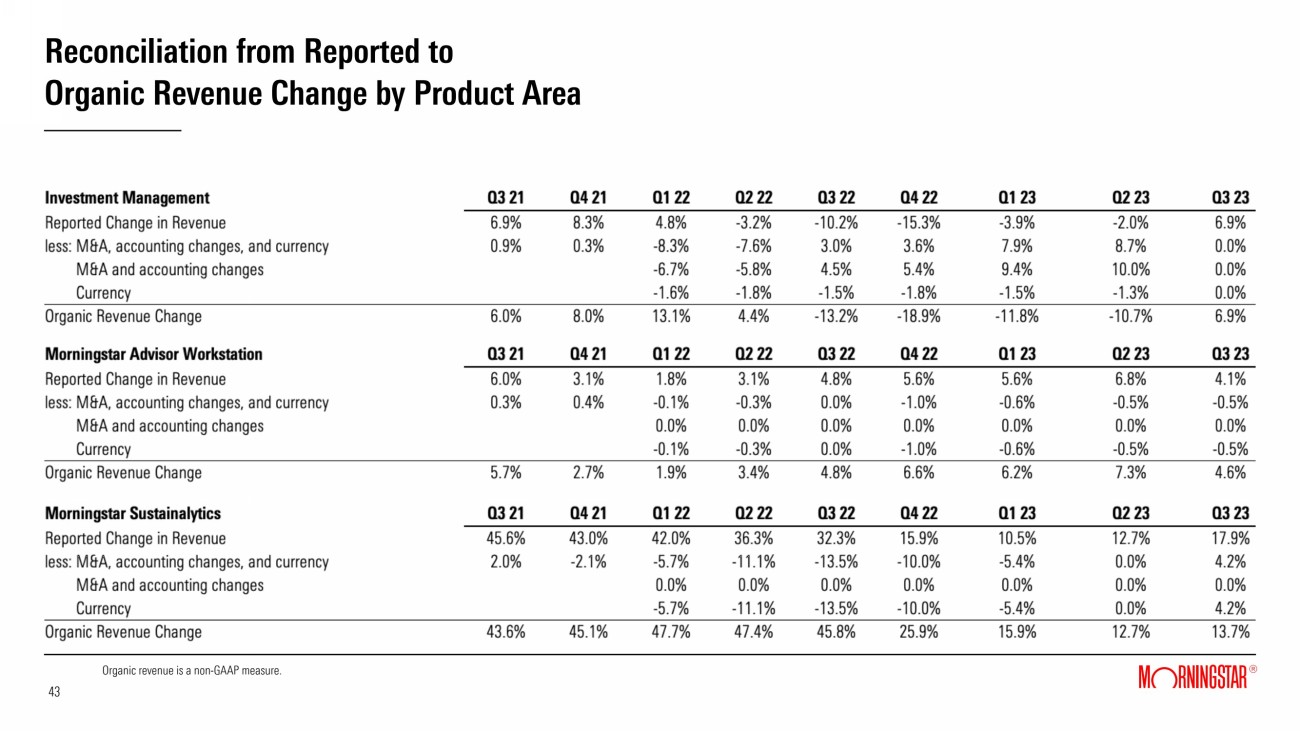
Reconciliation from Reported to Organic Revenue Change by Product Area 43 43 Organic revenue is a non-GAAP measure. |
|
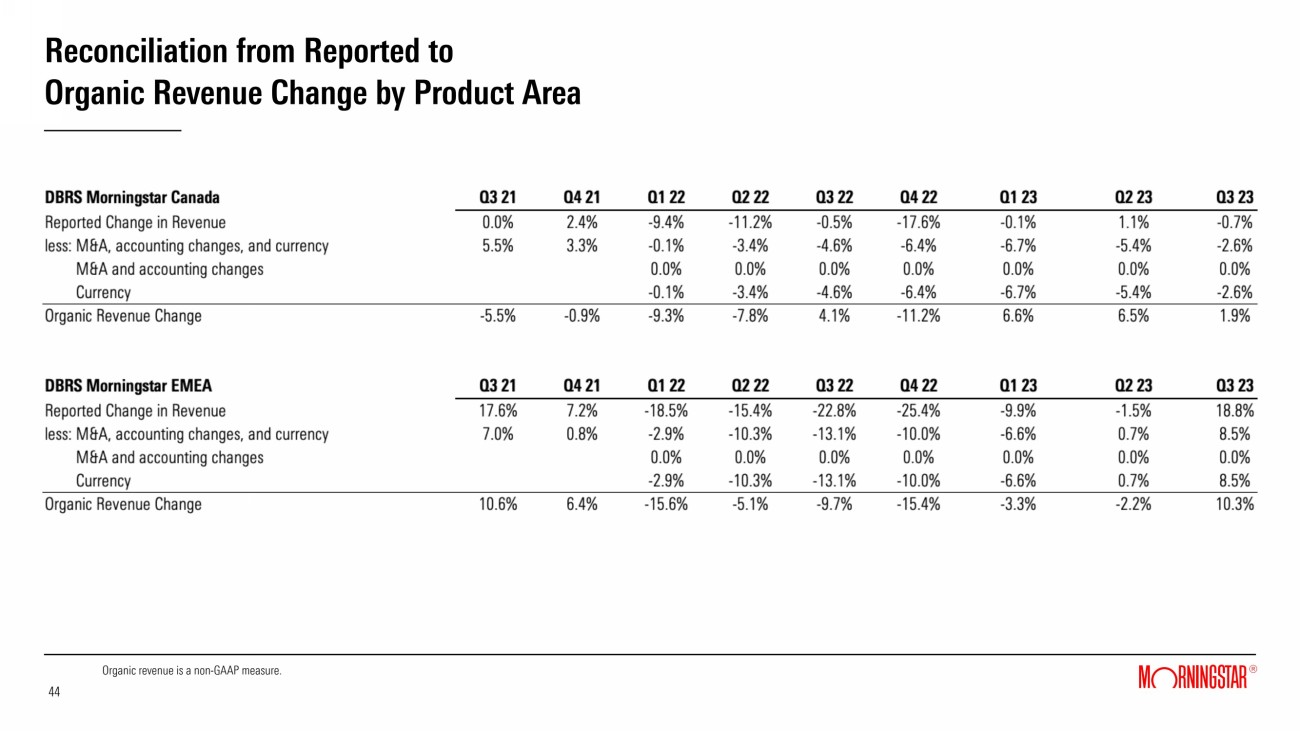
Reconciliation from Reported to Organic Revenue Change by Product Area 44 44 Organic revenue is a non-GAAP measure. |
|
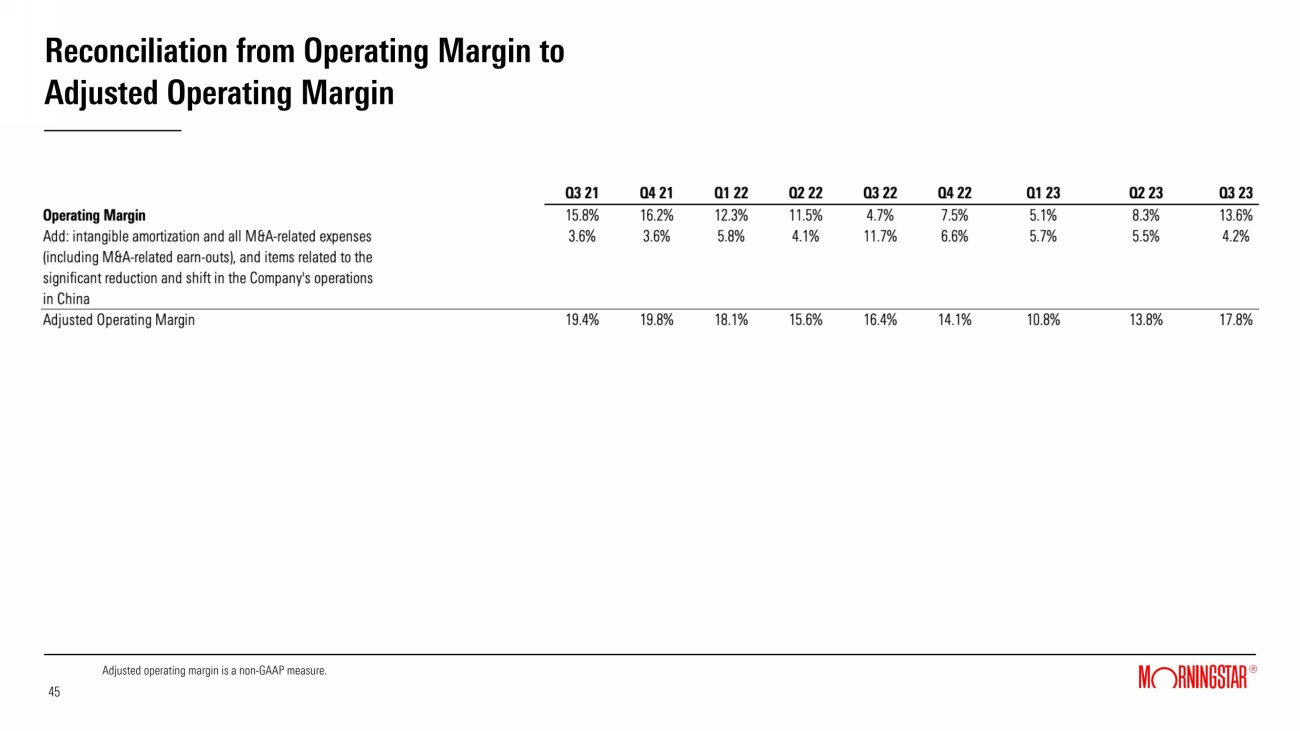
Reconciliation from Operating Margin to Adjusted Operating Margin 45 45 Adjusted operating margin is a non-GAAP measure. |
|
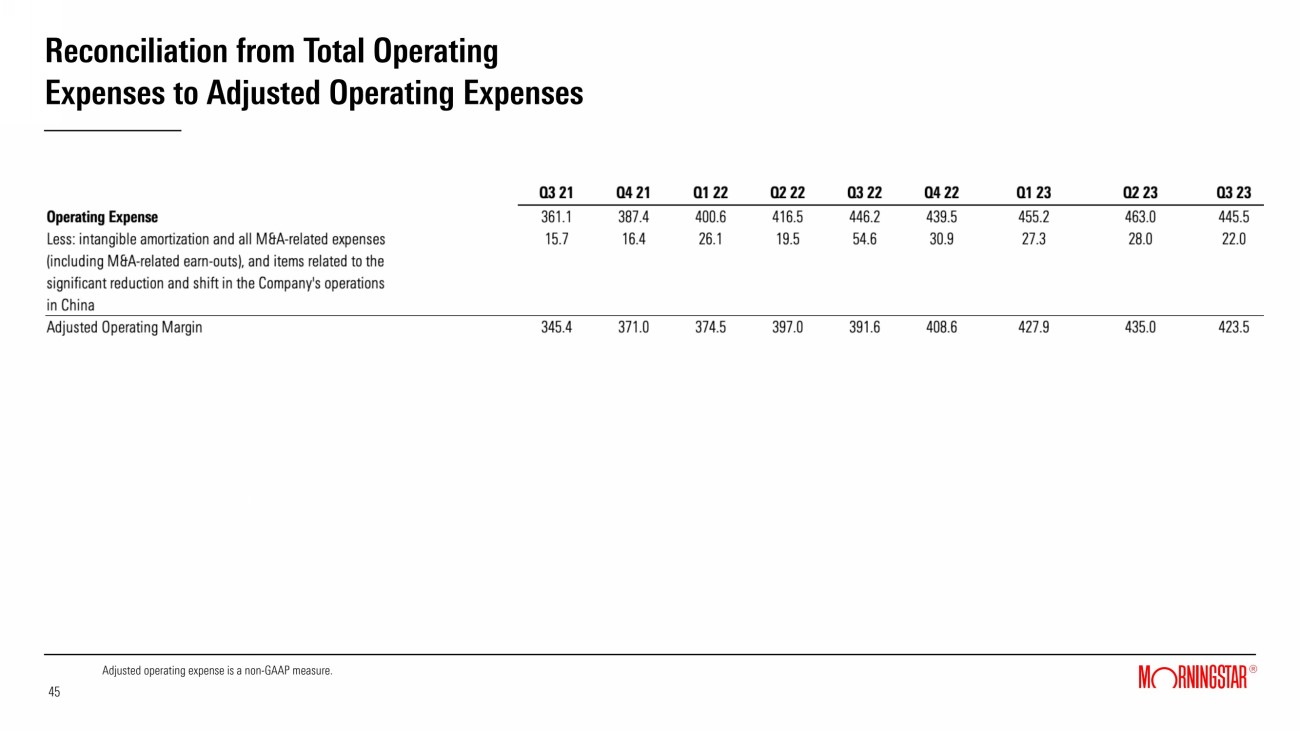
Reconciliation from Total Operating Expenses to Adjusted Operating Expenses 46 45 Adjusted operating expense is a non-GAAP measure. |
|