UNITED STATES
SECURITIES AND EXCHANGE COMMISSION
Washington, D.C. 20549
FORM 8-K
CURRENT REPORT
Pursuant
to Section 13 or 15(d) of
the Securities Exchange Act of 1934
Date of Report (Date of earliest event reported): October 25, 2023
MORNINGSTAR, INC.
(Exact name of registrant as specified in its charter)
| Illinois | 000-51280 | 36-3297908 |
| (State
or other jurisdiction of incorporation) |
(Commission
File Number) |
(I.R.S.
Employer Identification No.) |
| 22 West Washington Street | ||
| Chicago, Illinois | 60602 | |
| (Address of principal executive offices) | (Zip Code) |
(312) 696-6000
(Registrant’s telephone number, including area code)
N/A
(Former name or former address, if changed since last report)
Check the appropriate box below if the Form 8-K filing is intended to simultaneously satisfy the filing obligation of the registrant under any of the following provisions:
| ¨ | Written communications pursuant to Rule 425 under the Securities Act (17 CFR 230.425) |
| ¨ | Soliciting material pursuant to Rule 14a-12 under the Exchange Act (17 CFR 240.14a-12) |
| ¨ | Pre-commencement communications pursuant to Rule 14d-2(b) under the Exchange Act (17 CFR 240.14d-2(b)) |
| ¨ | Pre-commencement communications pursuant to Rule 13e-4(c) under the Exchange Act (17 CFR 240.13e-4(c)) |
Indicate by check mark whether the registrant is an emerging growth company as defined in Rule 405 of the Securities Act of 1933 (§230.405 of this chapter) or Rule 12b-2 of the Securities Exchange Act of 1934 (§240.12b-2 of this chapter).
Emerging growth company ¨
If an emerging growth company, indicate by check mark if the registrant has elected not to use the extended transition period for complying with any new or revised financial accounting standards provided pursuant to Section 13(a) of the Exchange Act. ¨
Securities registered pursuant to Section 12(b) of the Act:
| Title of Each Class | Trading Symbol | Name
of Each Exchange on Which Registered |
| Common stock, no par value | MORN | The Nasdaq Stock Market LLC |
| Item 2.02. | Results of Operations and Financial Condition. |
On October 25, 2023, Morningstar, Inc. (the “Company” or “we”) issued a press release announcing its financial results for the third quarter ended September 30, 2023. A copy of the press release is attached hereto as Exhibit 99.1. Additionally, on October 25, 2023, the Company published a Supplemental Presentation. A copy of the Supplemental Presentation is attached hereto as Exhibit 99.2. The press release and Supplemental Presentation shall be deemed furnished, not filed, for purposes of this Current Report on Form 8-K (this “Report”).
| Item 7.01. | Regulation FD Disclosure. |
On October 25, 2023, the Company published a Shareholder Letter. The Shareholder Letter is included as Exhibit 99.3 to this Report. The Shareholder Letter shall be deemed furnished, not filed, for purposes of this Report.
The information set forth under Item 2.02, "Results of Operations and Financial Condition" is incorporated herein by reference.
Cautionary Note Regarding Forward-Looking Statements
This Report contains forward-looking statements as that term is used in the Private Securities Litigation Reform Act of 1995. These statements are based on our current expectations about future events or future financial performance. Forward-looking statements by their nature address matters that are, to different degrees, uncertain, and often contain words such as “may,” “could,” “expect,” “intend,” “plan,” “seek,” “anticipate,” “believe,” “estimate,” “predict,” “potential,” “prospects,” or “continue.” These statements involve known and unknown risks and uncertainties that may cause the events we discuss not to occur or to differ significantly from what we expect. For the Company, these risks and uncertainties include, among others, failing to maintain and protect our brand, independence, and reputation; liability related to cybersecurity and the protection of confidential information, including personal information about individuals; compliance failures, regulatory action, or changes in laws applicable to our credit ratings operations, investment advisory, ESG and index businesses; failing to innovate our product and service offerings, or anticipate our clients’ changing needs; prolonged volatility or downturns affecting the financial sector, global financial markets, and the global economy and its effect on our revenue from asset-based fees and our credit ratings business; failing to recruit, develop, and retain qualified employees; liability for any losses that result from errors in our automated advisory tools; inadequacy of our operational risk management and business continuity programs in the event of a material disruptive event; failing to realize the expected business or financial benefits of our acquisitions and investments; failing to scale our operations and increase productivity and its effect on our ability to implement our business plan; artificial intelligence and related new technologies may present business, compliance, and reputational risks; failing to maintain growth across our businesses in today's fragmented geopolitical, regulatory and cultural world; liability relating to the information and data we collect, store, use, create, and distribute or the reports that we publish or are produced by our software products; the potential adverse effect of our indebtedness on our cash flows and financial flexibility; challenges in accounting for complexities in taxes in the global jurisdictions in which we operate that could materially affect our tax rate; failing to protect our intellectual property rights or claims of intellectual property infringement against us; the impact of any litigation, regulatory and other business matters; our new reporting segments and the associated disclosures. A more complete description of these risks and uncertainties can be found in our filings with the Securities and Exchange Commission, including our most recent Annual Report on Form 10-K and Quarterly Reports on Form 10-Q. If any of these risks and uncertainties materialize, our actual future results and other future events may vary significantly from what we expect. We do not undertake to update our forward-looking statements as a result of new information or future events.
| Item 9.01. | Financial Statements and Exhibits. |
(d) Exhibits:
| Exhibit No. | Description |
| 99.1 | Press Release dated October 25, 2023. | |
| 99.2 | Supplemental Presentation dated October 25, 2023. | |
| 99.3 | Shareholder letter dated October 25, 2023. | |
| 104 | The cover page from this Current Report on Form 8-K formatted in Inline XBRL (included as Exhibit 101). |
EXHIBIT INDEX
| Exhibit No. | Description |
| 99.1 | Press Release dated October 25, 2023. |
| 99.2 | Supplemental Presentation dated October 25, 2023. |
| 99.3 | Shareholder letter dated October 25, 2023. |
| 104 | The cover page from this Current Report on Form 8-K formatted in Inline XBRL (included as Exhibit 101). |
SIGNATURES
Pursuant to the requirements of the Securities Exchange Act of 1934, the registrant has duly caused this report to be signed on its behalf by the undersigned hereunto duly authorized.
| MORNINGSTAR, INC. | |||
| Date: | October 26, 2023 | By: | /s/ Jason Dubinsky |
| Name: | Jason Dubinsky | ||
| Title: | Chief Financial Officer | ||
Exhibit 99.1
 |
News Release | |
| 22 West Washington Street | Telephone: +1 312 696-6000 | |
| Chicago | Facsimile: +1 312 696-6009 | |
| Illinois 60602 |
FOR IMMEDIATE RELEASE
Morningstar, Inc. Reports Third-Quarter 2023 Financial Results
CHICAGO, Oct. 25, 2023 - Morningstar, Inc. (Nasdaq: MORN), a leading provider of independent investment insights, posted solid third-quarter revenue growth, driven primarily by the performance of its license- and asset-based products.
"We saw strength in the business this quarter as license-based products continued to thrive and our asset-based products rebounded with the markets," said Kunal Kapoor, Morningstar's chief executive officer. "Supported by that growth, as well as careful management of expenses, we made meaningful progress expanding margins. Among other highlights for the quarter, we launched Enterprise Analytics for Morningstar Advisor Workstation, introduced the Intelligence Engine API to help financial services firms build their own generative AI, and announced that ADP, a leading provider of retirement plan services, will offer access to Morningstar Investment Management’s advisor-managed accounts."
Starting with the Company's Form 10-Q for the quarter ended Sept. 30, 2023, the Company will begin to report multiple segments. The Company's quarterly shareholder letter provides more context on its quarterly results and business and can be found at shareholders.morningstar.com.
Third-Quarter 2023 Financial Highlights
| · | Reported revenue increased 10.1% to $515.5 million compared to the prior-year period; organic revenue grew 9.3%. |
| · | Reported operating income increased to $70.0 million from $22.0 million; adjusted operating income increased 20.1%. Operating and adjusted operating income both include a $6.0 million expense related to settlements between DBRS Morningstar and the U.S. Securities and Exchange Commission (SEC) described below and $5.0 million in severance costs related to reorganizations in certain areas of the business, excluding activities related to the Company's China operations. |
| · | Diluted net income (loss) per share increased to $0.91 versus $(0.21); adjusted diluted net income per share increased 66.2% to $1.28. |
| · | Cash provided by operating activities increased 28.0% to $130.7 million. Free cash flow increased 48.2% to $101.4 million. Cash flows were negatively impacted by $16.1 million in severance and related costs paid in the quarter related to the reduction and shift of the Company's China operations. Excluding these items and comparable items in the prior-year period, cash provided by operating activities and free cash flow would have increased by 41.2% and 67.1%, respectively. |
Year-To-Date Financial Highlights
| · | Reported revenue increased 7.5% to $1,499.9 million compared to the prior-year period; organic revenue grew 5.8%. |
| · | Reported operating income increased 2.9% to $136.2 million; adjusted operating income decreased by 8.2%. |
| · | Diluted net income per share increased 1.3% to $1.58; adjusted diluted net income per share decreased by 4.8% to $3.14. |
| · | Cash provided by operating activities decreased 8.1% to $178.6 million. Free cash flow decreased 11.3% to $89.5 million. Cash flows were negatively impacted by certain items described in the Balance Sheet and Capital Allocation section totaling $90.6 million. Excluding these items and comparable items in the prior-year period, cash provided by operating activities and free cash flow would have increased by 14.0% and 26.1%, respectively. |
Third-Quarter 2023 Results
Revenue increased 10.1% to $515.5 million. Organic revenue, which excludes foreign currency effects, increased 9.3% versus the prior-year period, reflecting solid growth in the Company's license- and asset-based product areas.
License-based revenue increased 12.2% versus the prior-year period, or 10.6% on an organic basis. PitchBook, Morningstar Data, Morningstar Direct, and Morningstar Sustainalytics license-based products all provided meaningful contributions to reported and organic revenue growth in the quarter. Asset-based revenue increased 6.2% versus the prior-year period, or 10.4% organically, driven by growth in Morningstar Indexes' asset-based products, Morningstar Retirement (previously branded Workplace Solutions), and Investment Management. This growth was supported by the rebound in global asset values and net inflows across multiple products compared to the prior-year period. Transaction-based revenue increased 2.1% compared to the prior-year period and was roughly flat on an organic basis.
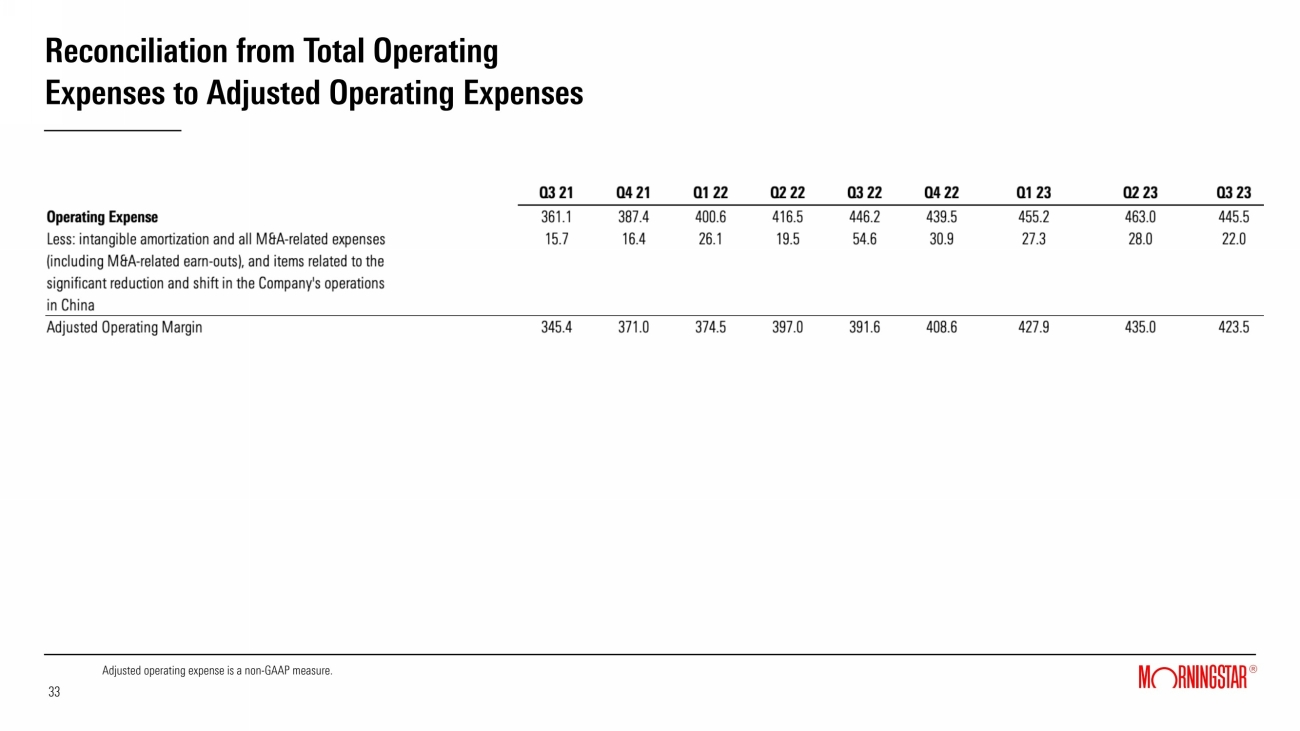
Operating expense decreased slightly to $445.5 million. Costs related to the reduction and shift of the Company's China operations totaled $2.6 million in the quarter, compared to $30.1 million in the prior-year period, as the Company substantially completed these activities in the quarter. Excluding the impact of these costs, M&A-related expenses, and amortization in both periods, operating expense increased 8.1% in the quarter, with the DBRS SEC settlements and targeted reorganizations in certain parts of the business contributing 2.8 percentage points to that increase.
Page
The largest contributors to the decline in reported operating expense were severance, stock-based compensation, and professional fees.
| · | Severance expense decreased by $20.4 million, compared to the prior-year period when severance related to the transition and shift of the Company's China operations totaled $26.3 million. This decline was partially offset by $5.0 million of severance expense related to targeted reorganizations in certain areas of the business during the quarter. |
| · | Stock-based compensation expense decreased by $7.4 million, primarily driven by the PitchBook management bonus plan. The current year of the plan features lower target payouts versus the prior-year plan. In 2022, higher stock-based compensation was driven in large part by the overachievement of targets under the prior-year plan. |
| · | Professional fees decreased by $6.5 million, reflecting efforts to reduce the use of outside professional services as well as lower expenses for third-party resources supporting M&A activity and the transition of the Company's China-based activities. |
The above decreases were partially offset by growth in compensation costs, expense related to the DBRS Morningstar SEC settlements, and higher depreciation expense.
| · | Compensation costs increased $26.8 million, reflecting higher average headcount during the quarter compared to the prior-year period and merit increases. Headcount as of Sept. 30, 2023 decreased 1.3% compared to Sept. 30, 2022, and 4.6% sequentially from June 30, 2023 to 11,566. |
| · | On Sept. 29, 2023, DBRS Morningstar entered into two settlements with the SEC requiring DBRS Morningstar to pay an aggregate of $8.0 million in civil monetary penalties. The SEC settlements resulted in a $6.0 million expense for the quarter, bringing the total expense to $8.0 million for the year-to-date period. The SEC settlements were paid in early October 2023. |
| · | Depreciation expense increased $3.5 million primarily as a result of higher capitalized software costs for product enhancements in prior periods. |
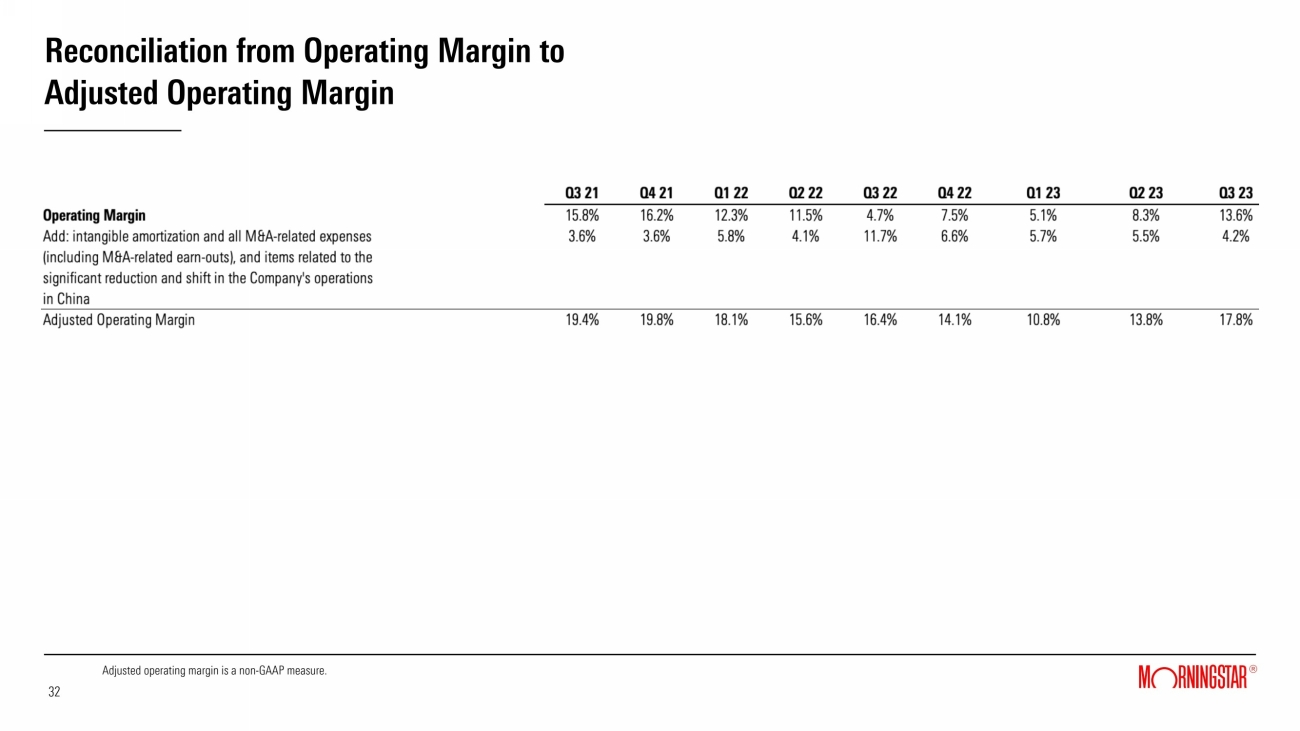
Third-quarter operating income was $70.0 million, compared to $22.0 million in the prior-year period. Adjusted operating income was $92.0 million, an increase of 20.1%. Third-quarter operating margin was 13.6%, compared with 4.7% in the prior-year period. Adjusted operating margin was 17.8% in the third quarter of 2023, versus 16.4% in the prior-year period. During the quarter, the Company engaged in targeted reorganizations and headcount reductions at Morningstar Sustainalytics, Morningstar Wealth, and DBRS Morningstar. The most significant reductions were in Morningstar Sustainalytics.
Page
These reorganizations were in response to slower than anticipated progress versus growth targets due in part to softening demand for ESG solutions for Morningstar Sustainalytics, the impact of sharp market declines in 2022 for Morningstar Wealth, and weak credit issuance activity, especially in U.S. commercial-mortgage backed securities (CMBS), for DBRS Morningstar. Severance costs related to these reorganizations negatively impacted operating margin and adjusted operating margin by 1.0 percentage point. In addition, the DBRS Morningstar SEC settlements negatively impacted operating margin and adjusted operating margin by 1.2 percentage points.
Net income (loss) in the third quarter of 2023 was $39.1 million, or $0.91 per diluted share, compared with net income (loss) of $(9.0) million, or $(0.21) per diluted share, in the third quarter of 2022. Adjusted diluted net income per share increased 66.2% to $1.28 in the third quarter of 2023, compared with $0.77 in the prior-year period.
The Company's effective tax rate was 29.9% in the third quarter of 2023 and was not comparable to the third quarter of 2022 when the tax provision reflected a tax expense against negative pre-tax book income. The Company's effective tax rate for the first nine months of 2023 was 21.8%, compared to 30.9% in the prior-year period. The decrease was primarily due to the recognition of $13.7 million of tax benefits in the second quarter of 2023 related to the approval of a retroactive tax election with respect to our 2021 and 2022 tax periods.
Product Revenue Contributions
PitchBook, Morningstar Data, Morningstar Direct, and Morningstar Sustainalytics were the top four contributors to consolidated and organic revenue growth in the third quarter of 2023. (For more detail on product key metrics, refer to the Supplemental Data table contained in this release and the Supplemental Presentation included on our Investor Relations website at shareholders.morningstar.com under "Financials — Financial Summary".)
Key drivers of the quarterly consolidated revenue trend are provided below. Organic revenue excludes all foreign currency effects, which accounted for the entire difference between reported and organic growth for all product areas.
| · | PitchBook contributed $20.7 million to consolidated revenue growth, with revenue increasing 19.8% on a reported and organic basis, driven by strength in its core investor and advisor segments, which offset some continued softness in the company (corporate) segment. Licenses grew 11.2%, reflecting both new client users and expansion with existing clients, as well as variability driven by user maintenance activities and updates to user lists when enterprise clients renew. During the quarter, PitchBook continued its integration of Leveraged Commentary & Data (LCD), with a meaningful expansion of debt deals and new bond and loan data sets available on the platform. Additional enhancements to the platform included the introduction of Manager Scores, a new tool to uncover top-performing fund managers across vintages and strategies. Results exclude LCD revenues. |
Page
| · | Morningstar Data contributed $7.9 million to consolidated revenue growth, with revenue increasing 12.5%, or 10.2% on an organic basis, supported by growth across all geographies, especially North America. At the product level, fund data continued to be the key driver of higher revenue, followed by growth in equity data and Morningstar Essentials. |
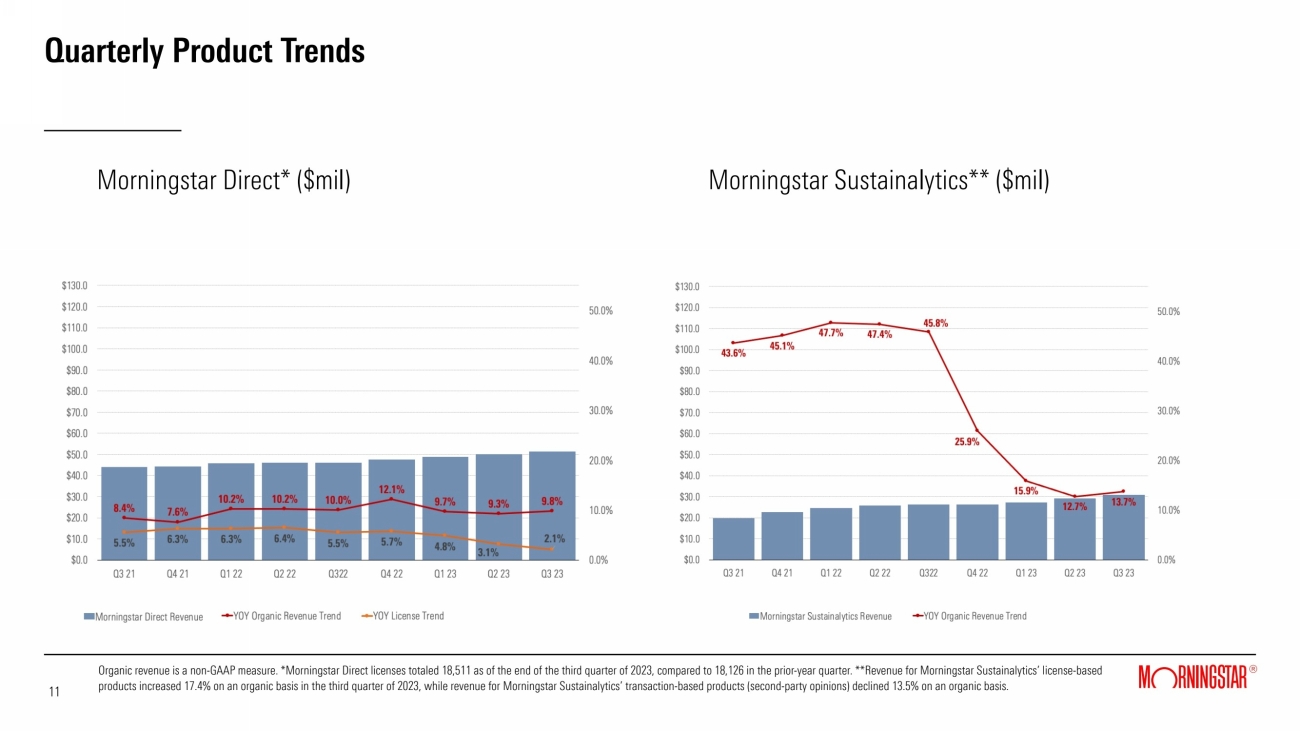
| · | Morningstar Direct contributed $5.3 million to consolidated revenue growth, with revenue increasing 11.5%, or 9.8% on an organic basis, reflecting growth across all geographies. During the quarter, Morningstar Direct launched Direct Lens, which received positive initial feedback and adoption from customers. Direct licenses increased 2.1%. |
| · | DBRS Morningstar contributed $1.1 million to consolidated revenue growth, with revenue increasing 2.1%, or 1.4% on an organic basis, primarily driven by an increase in asset-backed securities (ABS) revenue, including revenue related to ratings activity in nontraditional, niche ("esoteric") securities. Corporate ratings revenue also increased modestly, reflecting gains in Europe and Canada and a decline in the U.S. where market conditions remain challenging for private and middle-market corporate debt issuance. This growth was largely offset by declines in residential mortgage-backed securities ratings revenue and CMBS ratings revenue. Revenue related to data products also increased. Organic revenue increased in Europe, was relatively flat in Canada, and decreased modestly in the U.S. |
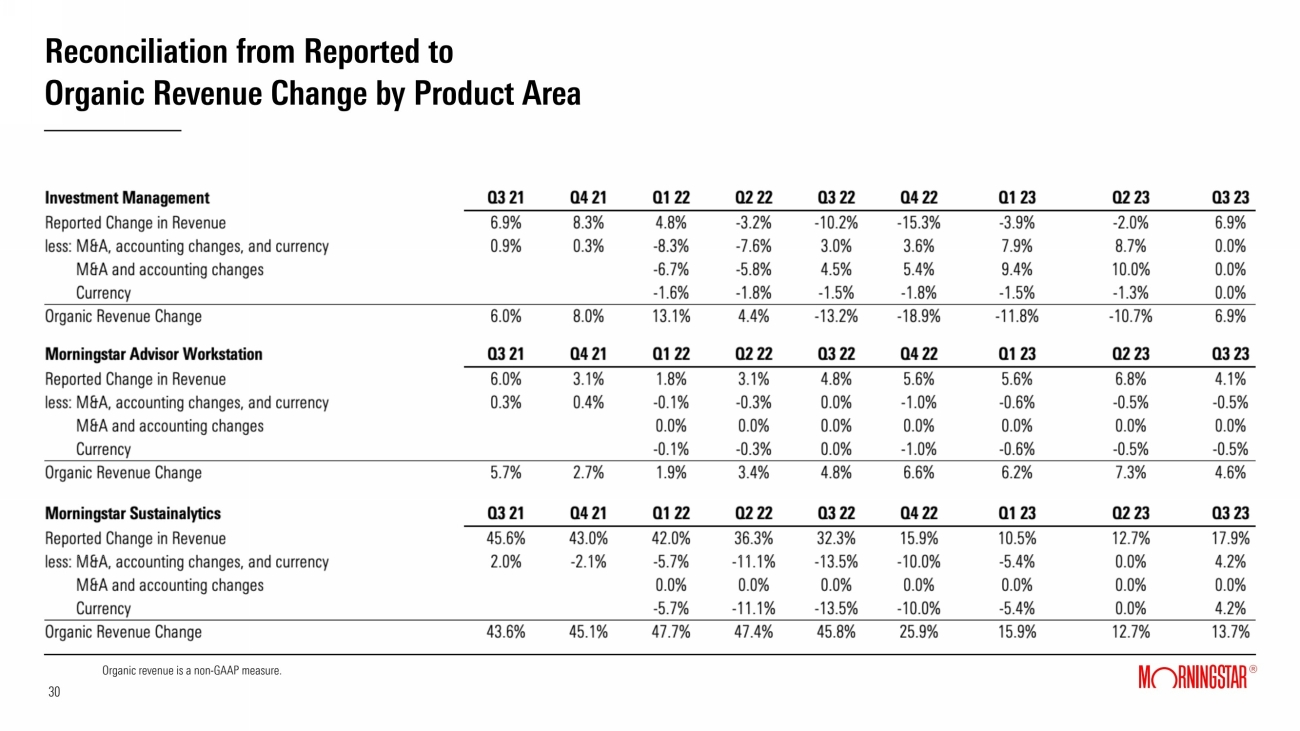
| · | Investment Management contributed $2.0 million to consolidated revenue growth, with revenue increasing 6.9% on a reported and organic basis. Reported assets under management and advisement (AUMA) increased 7.4% to $50.7 billion compared with the prior-year period, primarily due to market gains and positive net flows for direct-to-advisor sold Managed Portfolios, which reflected strong net inflows outside the U.S. and flat flows in the U.S. This offset lower AUMA for the Institutional Asset Management product, which experienced a client loss in the second quarter of 2023. Organic results include contributions from Praemium. |
| · | Morningstar Sustainalytics contributed $4.7 million to consolidated revenue growth, with revenue increasing 17.9% or 13.7% on an organic basis. License-based revenue increased 21.7%, or 17.4% on an organic basis, while transaction-based revenue decreased 11.6%, or 13.5% on an organic basis. While still strong, license-based product revenue growth slowed across regions compared to recent quarters reflecting softer demand for ESG solutions. Growth rates were strongest in EMEA, which continued to benefit from solid demand for regulatory and compliance products, and AsiaPac. Growth in North America was weaker, reflecting softness in parts of the U.S. asset management and wealth segments. Softer demand for new second-party opinions on sustainable bond issuance contributed to the decline in transaction-based revenue. |
Page
| · | Morningstar Retirement (formerly Workplace Solutions) contributed $2.7 million to consolidated revenue growth, with revenue increasing 10.8% on a reported and organic basis. AUMA increased 10.8% to $212.9 billion compared with the prior-year period, reflecting market gains and positive net flows, supported by growth in Advisor Managed Accounts. With the addition of a new large employer in the quarter, Morningstar Retirement now offers its managed retirement accounts to two of the 10 largest defined contribution retirement plans with combined plan assets totaling nearly $1 trillion as of 2022. |
| · | Morningstar Advisor Workstation contributed $1.0 million to consolidated revenue growth, with revenue increasing 4.1%, or 4.6% on an organic basis. The Investment Planning Experience (IPX), launched earlier this year, continued to drive new business and upsells with both advisor and enterprise clients. During the quarter, IPX was enhanced to include goal planning capabilities, which allow advisors to demonstrate how their advice will help investors meet financial goals. In addition, Advisor Workstation launched Enterprise Analytics in mid-September, which offers firms deeper visibility and insights into firmwide advisor activity and has contributed to early sales wins. |
| · | Morningstar Indexes contributed $3.8 million to consolidated revenue growth, with revenue increasing 27.8%, or 27.3% on an organic basis. The increase in revenue was driven in part by higher investable product revenue, supported by market gains and net inflows. Licensed-data revenue also increased. LCD-related revenue was included in organic growth for the quarter. |
Reduction and Shift of China Operations
During the quarter the Company substantially completed the reduction of its operations in Shenzhen, China and the shift of work related to its global business functions. Costs related to this transition totaled $2.6 million in the third quarter of 2023 and $15.5 million for the year-to-date period and included severance and personnel costs; transformation costs, which consisted of professional fees and the temporary duplication of headcount as the Company hired replacement roles in other markets and continued to employ certain Shenzhen-based staff through the transition; and asset impairment costs.
Balance Sheet and Capital Allocation
As of Sept. 30, 2023, the Company had cash, cash equivalents, and investments totaling $363.7 million and $1.1 billion of debt, compared with $414.6 million and $1.1 billion, respectively, as of Dec. 31, 2022.
Page
Cash provided by operating activities increased 28.0% to $130.7 million for the third quarter of 2023, compared to the prior-year period. Free cash flow increased 48.2% to $101.4 million, compared to the prior-year period. The increases in cash provided by operating activities and free cash flow were primarily driven by higher cash earnings. During the third quarter, the Company paid $16.1 million of severance and other costs related to the significant reduction and shift of the Company's operations in China, which was mostly offset by other positive changes in working capital. Excluding the impact of these severance payments and related costs and comparable items in the prior-year period, cash provided by operating activities and free cash flow would have increased by 41.2% and 67.1%, respectively. In addition, the Company paid $16.0 million in dividends in the quarter.
Cash provided by operating activities decreased 8.1% to $178.6 million for the first nine months of 2023 compared to the prior year. Operating cash flow and free cash flow were impacted by the termination of the Company's license agreement with Morningstar Japan K.K (renamed SBI Global Asset Management) and the final $50.0 million contingent payment related to the acquisition of LCD, of which $4.5 million is reflected in operating cash flows and $45.5 million is reflected in financing cash flows. Excluding the $4.5 million LCD contingent payment within operating cash flow, payments related to the termination agreement of $59.9 million, and $26.2 million of severance and other related costs paid for the China transition, which together totaled $90.6 million, as well as comparable items in the prior-year period, cash provided by operating activities and free cash flow would have increased by 14.0% and 26.1%, respectively.
New Reporting Presentation
The Company re-evaluated its operating segments and will begin reporting multiple segments in the Form 10-Q for the quarter ended Sept. 30, 2023, which is expected to be filed with the SEC on or before the statutory filing deadline of Nov. 9, 2023.
At the time the Form 10-Q is filed, the Company will update its supplemental quarterly presentation to provide more detail on its reportable segments. Going forward, the Company is also evaluating how best to communicate to investors under the new segment reporting framework in future press releases reporting financial results. It welcomes questions on the change submitted in writing to investors@morningstar.com and will make written responses to selected inquiries available to all investors at the same time in one or more Form 8-Ks furnished to the SEC.
Use of Non-GAAP Financial Measures
The tables at the end of this press release include a reconciliation of the non-GAAP financial measures used by the Company to comparable GAAP measures and an explanation of why the Company uses them.
Investor Communication
Morningstar encourages all interested parties — including securities analysts, current shareholders, potential shareholders, and others — to submit questions in writing. Investors and others may send questions about Morningstar’s business to investors@morningstar.com. Morningstar will make written responses to selected inquiries available to all investors at the same time in Form 8-Ks furnished to the SEC, periodically.
Page
About Morningstar, Inc.
Morningstar, Inc. is a leading provider of independent investment insights in North America, Europe, Australia, and Asia. The Company offers an extensive line of products and services for individual investors, financial advisors, asset managers and owners, retirement plan providers and sponsors, and institutional investors in the debt and private capital markets. Morningstar provides data and research insights on a wide range of investment offerings, including managed investment products, publicly listed companies, private capital markets, debt securities, and real-time global market data. Morningstar also offers investment management services through its investment advisory subsidiaries, with approximately $264 billion in assets under advisement and management as of Sept. 30, 2023. The Company operates through wholly- or majority-owned subsidiaries in 32 countries. For more information, visit www.morningstar.com/company. Follow Morningstar on Twitter @MorningstarInc.
Caution Concerning Forward-Looking Statements
This press release contains forward-looking statements as that term is used in the Private Securities Litigation Reform Act of 1995. These statements are based on our current expectations about future events or future financial performance. Forward-looking statements by their nature address matters that are, to different degrees, uncertain, and often contain words such as “may,” “could,” “expect,” “intend,” “plan,” “seek,” “anticipate,” “believe,” “estimate,” “predict,” “potential,” “prospects,” or “continue.” These statements involve known and unknown risks and uncertainties that may cause the events we discuss not to occur or to differ significantly from what we expect. For us, these risks and uncertainties include, among others, failing to maintain and protect our brand, independence, and reputation; liability related to cybersecurity and the protection of confidential information, including personal information about individuals; compliance failures, regulatory action, or changes in laws applicable to our credit ratings operations, investment advisory, ESG and index businesses; failing to innovate our product and service offerings, or anticipate our clients’ changing needs; prolonged volatility or downturns affecting the financial sector, global financial markets, and the global economy and its effect on our revenue from asset-based fees and our credit ratings business; failing to recruit, develop, and retain qualified employees; liability for any losses that result from errors in our automated advisory tools; inadequacy of our operational risk management and business continuity programs in the event of a material disruptive event; failing to realize the expected business or financial benefits of our acquisitions and investments; failing to scale our operations and increase productivity and its effect on our ability to implement our business plan; artificial intelligence and related new technologies may present business, compliance, and reputational risks; failing to maintain growth across our businesses in today's fragmented geopolitical, regulatory and cultural world; liability relating to the information and data we collect, store, use, create, and distribute or the reports that we publish or are produced by our software products; the potential adverse effect of our indebtedness on our cash flows and financial flexibility; challenges in accounting for complexities in taxes in the global jurisdictions in which we operate that could materially affect our tax rate; failing to protect our intellectual property rights or claims of intellectual property infringement against us; the impact of any litigation, regulatory, and other business matters; our new reporting segments and the associated disclosures. A more complete description of these risks and uncertainties can be found in our filings with the Securities and Exchange Commission, including our most recent Annual Report on Form 10-K and Quarterly Reports on Form 10-Q. If any of these risks and uncertainties materialize, our actual future results and other future events may vary significantly from what we expect. We do not undertake to update our forward-looking statements as a result of new information or future events.
# # #
Page
Media Relations Contact:
Stephanie Lerdall, +1 312-244-7805, stephanie.lerdall@morningstar.com
Investor Relations Contact:
Sarah Bush, +1 312-384-3754, sarah.bush@morningstar.com
©2023 Morningstar, Inc. All Rights Reserved.
MORN-E
Page
Morningstar, Inc. and Subsidiaries
Unaudited Condensed Consolidated Statements of Income
| Three months ended September 30, | Nine months ended September 30, | ||||||||||||||||||||||
| (in millions, except per share amounts) | 2023 | 2022 | Change | 2023 | 2022 | Change | |||||||||||||||||
| Revenue | $ | 515.5 | $ | 468.2 | 10.1 | % | $ | 1,499.9 | $ | 1,395.6 | 7.5 | % | |||||||||||
| Operating expense: | |||||||||||||||||||||||
| Cost of revenue | 202.9 | 195.4 | 3.8 | % | 638.1 | 584.3 | 9.2 | % | |||||||||||||||
| Sales and marketing | 106.3 | 89.7 | 18.5 | % | 323.4 | 262.9 | 23.0 | % | |||||||||||||||
| General and administrative | 89.7 | 116.9 | (23.3 | )% | 263.8 | 294.3 | (10.4 | )% | |||||||||||||||
| Depreciation and amortization | 46.6 | 44.2 | 5.4 | % | 138.4 | 121.8 | 13.6 | % | |||||||||||||||
| Total operating expense | 445.5 | 446.2 | (0.2 | )% | 1,363.7 | 1,263.3 | 7.9 | % | |||||||||||||||
| Operating income | 70.0 | 22.0 | NMF | 136.2 | 132.3 | 2.9 | % | ||||||||||||||||
| Operating margin | 13.6 | % | 4.7 | % | 8.9 pp | 9.1 | % | 9.5 | % | (0.4) pp | |||||||||||||
| Non-operating income (loss), net: | |||||||||||||||||||||||
| Interest expense, net | (12.8 | ) | (10.5 | ) | 21.9 | % | (40.2 | ) | (17.3 | ) | NMF | ||||||||||||
| Expense from equity method transaction, net | — | — | — | % | (11.8 | ) | — | NMF | |||||||||||||||
| Other income (loss), net | 0.2 | (13.8 | ) | NMF | 7.0 | (15.0 | ) | NMF | |||||||||||||||
| Non-operating income (loss), net | (12.6 | ) | (24.3 | ) | (48.1 | )% | (45.0 | ) | (32.3 | ) | 39.3 | % | |||||||||||
| Income (loss) before income taxes and equity in investments of unconsolidated entities | 57.4 | (2.3 | ) | NMF | 91.2 | 100.0 | (8.8 | )% | |||||||||||||||
| Equity in investments of unconsolidated entities | (1.6 | ) | (1.3 | ) | 23.1 | % | (4.7 | ) | (2.7 | ) | 74.1 | % | |||||||||||
| Income tax expense | 16.7 | 5.4 | NMF | 18.9 | 30.1 | (37.2 | )% | ||||||||||||||||
| Consolidated net income (loss) | $ | 39.1 | $ | (9.0 | ) | NMF | $ | 67.6 | $ | 67.2 | 0.6 | % | |||||||||||
| Net income (loss) per share: | |||||||||||||||||||||||
| Basic | $ | 0.92 | $ | (0.21 | ) | NMF | $ | 1.59 | $ | 1.57 | 1.3 | % | |||||||||||
| Diluted | $ | 0.91 | $ | (0.21 | ) | NMF | $ | 1.58 | $ | 1.56 | 1.3 | % | |||||||||||
| Weighted average shares outstanding: | |||||||||||||||||||||||
| Basic | 42.7 | 42.5 | 0.5 | % | 42.6 | 42.7 | (0.2 | )% | |||||||||||||||
| Diluted | 42.9 | 42.7 | 0.5 | % | 42.8 | 43.0 | (0.5 | )% | |||||||||||||||
NMF - Not meaningful, pp - percentage points
Page
Morningstar, Inc. and Subsidiaries
Unaudited Condensed Consolidated Balance Sheets
| As of September 30, | As of December 31, | |||||||
| (in millions) | 2023 | 2022 | ||||||
| Assets | ||||||||
| Current assets: | ||||||||
| Cash and cash equivalents | $ | 325.0 | $ | 376.6 | ||||
| Investments | 38.7 | 38.0 | ||||||
| Accounts receivable, net | 298.0 | 307.9 | ||||||
| Income tax receivable, net | 8.8 | — | ||||||
| Other current assets | 87.7 | 88.3 | ||||||
| Total current assets | 758.2 | 810.8 | ||||||
| Goodwill | 1,569.0 | 1,571.7 | ||||||
| Intangible assets, net | 495.4 | 548.6 | ||||||
| Property, equipment, and capitalized software, net | 204.3 | 199.4 | ||||||
| Operating lease assets | 163.4 | 191.6 | ||||||
| Investments in unconsolidated entities | 104.8 | 96.0 | ||||||
| Deferred tax assets, net | 10.4 | 10.8 | ||||||
| Other assets | 38.6 | 45.9 | ||||||
| Total assets | $ | 3,344.1 | $ | 3,474.8 | ||||
| Liabilities and equity | ||||||||
| Current liabilities: | ||||||||
| Deferred revenue | $ | 486.9 | $ | 455.6 | ||||
| Accrued compensation | 180.6 | 220.1 | ||||||
| Accounts payable and accrued liabilities | 70.1 | 76.2 | ||||||
| Operating lease liabilities | 36.0 | 37.3 | ||||||
| Current portion of long-term debt | 32.1 | 32.1 | ||||||
| Contingent consideration liability | — | 50.0 | ||||||
| Other current liabilities | 3.8 | 11.2 | ||||||
| Total current liabilities | 809.5 | 882.5 | ||||||
| Operating lease liabilities | 148.7 | 176.7 | ||||||
| Accrued compensation | 23.0 | 20.7 | ||||||
| Deferred tax liabilities, net | 52.3 | 62.9 | ||||||
| Long-term debt | 1,023.4 | 1,077.5 | ||||||
| Other long-term liabilities | 43.1 | 47.4 | ||||||
| Total liabilities | 2,100.0 | 2,267.7 | ||||||
| Total equity | 1,244.1 | 1,207.1 | ||||||
| Total liabilities and equity | $ | 3,344.1 | $ | 3,474.8 | ||||
Page
Morningstar, Inc. and Subsidiaries
Unaudited Condensed Consolidated Statements of Cash Flows
| Three months ended September 30, | Nine months ended September 30, | |||||||||||||||
| (in millions) | 2023 | 2022 | 2023 | 2022 | ||||||||||||
| Operating activities | ||||||||||||||||
| Consolidated net income (loss) | $ | 39.1 | $ | (9.0 | ) | $ | 67.6 | $ | 67.2 | |||||||
| Adjustments to reconcile consolidated net income (loss) to net cash flows from operating activities | 57.9 | 79.2 | 119.3 | 183.1 | ||||||||||||
| Changes in operating assets and liabilities, net | 33.7 | 31.9 | (8.3 | ) | (56.0 | ) | ||||||||||
| Cash provided by operating activities | 130.7 | 102.1 | 178.6 | 194.3 | ||||||||||||
| Investing activities | ||||||||||||||||
| Capital expenditures | (29.3 | ) | (33.7 | ) | (89.1 | ) | (93.4 | ) | ||||||||
| Acquisitions, net of cash acquired | --- | (0.2 | ) | — | (646.8 | ) | ||||||||||
| Purchases of investments in unconsolidated entities | (0.2 | ) | (1.7 | ) | (1.1 | ) | (28.3 | ) | ||||||||
| Other, net | 8.2 | (0.4 | ) | 41.1 | 7.5 | |||||||||||
| Cash used for investing activities | (21.3 | ) | (36.0 | ) | (49.1 | ) | (761.0 | ) | ||||||||
| Financing activities | ||||||||||||||||
| Common shares repurchased | --- | (15.2 | ) | (1.4 | ) | (217.7 | ) | |||||||||
| Dividends paid | (16.0 | ) | (15.3 | ) | (47.9 | ) | (46.2 | ) | ||||||||
| Repayments of debt | (128.1 | ) | (90.0 | ) | (314.4 | ) | (310.9 | ) | ||||||||
| Proceeds from debt | 30.0 | 70.0 | 260.0 | 1,110.0 | ||||||||||||
| Payment of acquisition-related earn-outs | — | — | (45.5 | ) | (16.2 | ) | ||||||||||
| Other, net | (6.0 | ) | (6.6 | ) | (25.8 | ) | (27.2 | ) | ||||||||
| Cash provided by (used for) financing activities | (120.1 | ) | (57.1 | ) | (175.0 | ) | 491.8 | |||||||||
| Effect of exchange rate changes on cash and cash equivalents | (7.6 | ) | (16.5 | ) | (6.1 | ) | (36.2 | ) | ||||||||
| Net decrease in cash and cash equivalents | (18.3 | ) | (7.5 | ) | (51.6 | ) | (111.1 | ) | ||||||||
| Cash and cash equivalents-beginning of period | 343.3 | 380.2 | 376.6 | 483.8 | ||||||||||||
| Cash and cash equivalents-end of period | $ | 325.0 | $ | 372.7 | $ | 325.0 | $ | 372.7 | ||||||||
Page
Morningstar, Inc. and Subsidiaries
Supplemental Data (Unaudited)
| Three months ended September 30, | Nine months ended September 30, | |||||||||||||||||||||||||||||||
| (in millions) | 2023 | 2022 | Change | Organic (2) |
2023 | 2022 | Change | Organic (2) |
||||||||||||||||||||||||
| Revenue by type (1) | ||||||||||||||||||||||||||||||||
| License-based (3) | $ | 384.5 | $ | 342.6 | 12.2 | % | 10.6 | % | $ | 1,124.5 | $ | 982.0 | 14.5 | % | 12.3 | % | ||||||||||||||||
| Asset-based (4) | 71.5 | 67.3 | 6.2 | % | 10.4 | % | 204.1 | 203.4 | 0.3 | % | 1.0 | % | ||||||||||||||||||||
| Transaction-based (5) | 59.5 | 58.3 | 2.1 | % | 0.1 | % | 171.3 | 210.2 | (18.5 | )% | (19.7 | )% | ||||||||||||||||||||
| Product revenue contributors (6) | ||||||||||||||||||||||||||||||||
| PitchBook | $ | 125.4 | $ | 104.7 | 19.8 | % | 19.8 | % | $ | 361.4 | $ | 296.9 | 21.7 | % | 21.7 | % | ||||||||||||||||
| Morningstar Data | 71.2 | 63.3 | 12.5 | % | 10.2 | % | 207.9 | 190.9 | 8.9 | % | 9.5 | % | ||||||||||||||||||||
| DBRS Morningstar (7) | 52.9 | 51.8 | 2.1 | % | 1.4 | % | 153.9 | 186.2 | (17.3 | )% | (16.4 | )% | ||||||||||||||||||||
| Morningstar Direct | 51.2 | 45.9 | 11.5 | % | 9.8 | % | 149.9 | 137.3 | 9.2 | % | 9.6 | % | ||||||||||||||||||||
| Investment Management | 31.1 | 29.1 | 6.9 | % | 6.9 | % | 90.1 | 89.9 | 0.2 | % | (5.3 | )% | ||||||||||||||||||||
| Morningstar Sustainalytics | 30.9 | 26.2 | 17.9 | % | 13.7 | % | 87.4 | 76.8 | 13.8 | % | 14.0 | % | ||||||||||||||||||||
| Morningstar Retirement (8) | 27.6 | 24.9 | 10.8 | % | 10.8 | % | 80.0 | 77.7 | 3.0 | % | 3.0 | % | ||||||||||||||||||||
| Morningstar Advisor Workstation | 25.2 | 24.2 | 4.1 | % | 4.6 | % | 74.9 | 71.0 | 5.5 | % | 6.0 | % | ||||||||||||||||||||
| As of September 30, | ||||||||||||
| Assets under management and advisement (approximate) ($bil) |
2023 | 2022 | Change | |||||||||
| Morningstar Retirement | ||||||||||||
| Managed Accounts | $ | 121.1 | $ | 109.0 | 11.1 | % | ||||||
| Fiduciary Services | 54.9 | 47.9 | 14.6 | % | ||||||||
| Custom Models/CIT | 36.9 | 35.3 | 4.5 | % | ||||||||
| Morningstar Retirement (total) | $ | 212.9 | $ | 192.2 | 10.8 | % | ||||||
| Investment Management | ||||||||||||
| Morningstar Managed Portfolios | $ | 35.4 | $ | 30.7 | 15.3 | % | ||||||
| Institutional Asset Management | 7.3 | 9.2 | (20.7 | )% | ||||||||
| Asset Allocation Services | 8.0 | 7.3 | 9.6 | % | ||||||||
| Investment Management (total) | $ | 50.7 | $ | 47.2 | 7.4 | % | ||||||
| Asset value linked to Morningstar Indexes ($bil) | $ | 166.0 | $ | 133.3 | 24.5 | % | ||||||
| Our employees (approximate) | ||||||||||||
| Worldwide headcount | 11,566 | 11,716 | (1.3 | )% | ||||||||
| Three months ended September 30, | Nine months ended September 30, | |||||||||||||||||||||||
| 2023 | 2022 | Change | 2023 | 2022 | Change | |||||||||||||||||||
| Average assets under management and advisement ($bil) | $ | 263.5 | $ | 246.1 | 7.1 | % | $ | 255.3 | $ | 255.6 | (0.1 | )% | ||||||||||||
(1) Starting with the quarter ended March 31, 2023, the Company updated its revenue-type classifications to account for product areas with more than one revenue type. Prior periods have not been restated to reflect the updated classifications. Revenue from Morningstar Sustainalytics' second-party opinions product was reclassified from license-based to transaction-based. Revenue from Morningstar Indexes data and services products was reclassified from asset-based to license-based. Revenue from DBRS Morningstar's data products was reclassified from transaction-based to license-based.
(2) Organic revenue is a non-GAAP measure that excludes acquisitions, divestitures, the impacts of the adoption of new accounting standards or revisions to accounting practices, and the effect of foreign currency translations. In addition, the calculation of organic revenue growth by product revenue type compares the three and nine months ended Sept. 30, 2023 revenue to the prior periods on the basis of the updated classifications.
(3) License-based revenue includes PitchBook, Morningstar Data, Morningstar Direct, Morningstar Sustainalytics' license-based products, Morningstar Indexes data and services products, DBRS Morningstar's data products, Morningstar Advisor Workstation, and other similar products.
(4) Asset-based revenue includes Investment Management, the majority of Morningstar Retirement (formerly Workplace Solutions), and Morningstar Indexes.
Page
(5) Transaction-based revenue includes DBRS Morningstar, Morningstar Sustainalytics' second-party opinions product, Internet advertising, and Morningstar-sponsored conferences.
(6) The dollar contribution of each product to consolidated revenue growth is provided in the Product Revenue Contributions narrative.
(7) For the three and nine months ended Sept. 30, 2023, DBRS Morningstar recurring revenue derived primarily from surveillance, research, and other transaction-related services was 51.8% and 52.2%, respectively. For the three and nine months ended Sept. 30, 2022, recurring revenue was 48.6% and 40.3%, respectively.
(8) Morningstar Retirement was formerly branded Workplace Solutions.
Morningstar, Inc. and Subsidiaries
Reconciliations of Non-GAAP Measures with the Nearest Comparable GAAP Measures (Unaudited)
To supplement Morningstar’s condensed consolidated financial statements presented in accordance with U.S. Generally Accepted Accounting Principles (GAAP), Morningstar uses the following measures considered as non-GAAP by the Securities and Exchange Commission, including:
| · | consolidated revenue, excluding acquisitions, divestitures, adoption of new accounting standards or revision to accounting practices (accounting changes), and the effect of foreign currency translations (organic revenue), |
| · | consolidated operating income, excluding intangible amortization expense, all mergers and acquisitions (M&A)-related expenses (including M&A-related earn-outs), and items related to the significant reduction and shift of the Company's operations in China (adjusted operating income), |
| · | consolidated operating margin, excluding intangible amortization expense, all M&A-related expenses (including M&A-related earn-outs), and items related to the significant reduction and shift of the Company's operations in China (adjusted operating margin), |
| · | consolidated diluted net income (loss) per share, excluding intangible amortization expense, all M&A-related expenses (including M&A-related earn-outs), items related to the significant reduction and shift of the Company's operations in China, and certain non-operating gains/losses (adjusted diluted net income per share), and |
| · | cash provided by or used for operating activities less capital expenditures (free cash flow). |
These non-GAAP measures may not be comparable to similarly titled measures reported by other companies.
Morningstar presents organic revenue because the Company believes this non-GAAP measure helps investors better compare period-over-period results. Morningstar excludes revenue from acquired businesses from its organic revenue growth calculation for a period of 12 months after it completes the acquisition. For divestitures, Morningstar excludes revenue in the prior-year period for which there is no comparable revenue in the current period.
Morningstar presents adjusted operating income, adjusted operating margin, and adjusted diluted net income per share to show the effect of significant acquisition activity, better compare period-over-period results, and improve overall understanding of the underlying performance of the business absent the impact of acquisitions.
In addition, Morningstar presents free cash flow solely as supplemental disclosure to help investors better understand how much cash is available after making capital expenditures. Morningstar's management team uses free cash flow to evaluate the health of its business. Free cash flow should not be considered an alternative to any measure required to be reported under GAAP (such as cash provided by (used for) operating, investing, and financing activities).
| Three months ended September 30, | Nine months ended September 30, | |||||||||||||||||||||||
| (in millions) | 2023 | 2022 | Change | 2023 | 2022 | Change | ||||||||||||||||||
| Reconciliation from consolidated revenue to organic revenue: | ||||||||||||||||||||||||
| Consolidated revenue | $ | 515.5 | $ | 468.2 | 10.1 | % | $ | 1,499.9 | $ | 1,395.6 | 7.5 | % | ||||||||||||
| Less: acquisitions | — | — | — | % | (30.9 | ) | — | NMF | ||||||||||||||||
| Less: accounting changes | — | — | — | % | — | — | — | % | ||||||||||||||||
| Effect of foreign currency translations | (3.8 | ) | — | NMF | 6.9 | — | NMF | |||||||||||||||||
| Organic revenue | $ | 511.7 | $ | 468.2 | 9.3 | % | $ | 1,475.9 | $ | 1,395.6 | 5.8 | % | ||||||||||||
| Reconciliation from consolidated operating income to adjusted operating income: | ||||||||||||||||||||||||
| Consolidated operating income | $ | 70.0 | $ | 22.0 | NMF | $ | 136.2 | $ | 132.3 | 2.9 | % | |||||||||||||
| Add: Intangible amortization expense | 17.7 | 18.7 | (5.3 | )% | 52.9 | 48.4 | 9.3 | % | ||||||||||||||||
| Add: M&A-related expenses | 1.7 | 4.9 | (65.3 | )% | 8.9 | 13.7 | (35.0 | )% | ||||||||||||||||
| Add: M&A-related earn-outs (1) | — | 0.9 | NMF | — | 8.0 | NMF | ||||||||||||||||||
| Add: Severance and personnel expenses (2) | 1.3 | 27.0 | (95.2 | )% | 5.4 | 27.0 | (80.0 | )% | ||||||||||||||||
Page
| Three months ended September 30, | Nine months ended September 30, | |||||||||||||||||||||||
| (in millions) | 2023 | 2022 | Change | 2023 | 2022 | Change | ||||||||||||||||||
| Add: Transformation costs (2) | 0.6 | 3.1 | (80.6 | )% | 7.0 | 3.1 | NMF | |||||||||||||||||
| Add: Asset impairment costs (2) | 0.7 | — | NMF | 3.1 | — | NMF | ||||||||||||||||||
| Adjusted operating income | $ | 92.0 | $ | 76.6 | 20.1 | % | $ | 213.5 | $ | 232.5 | (8.2 | )% | ||||||||||||
| Reconciliation from consolidated operating margin to adjusted operating margin: | ||||||||||||||||||||||||
| Consolidated operating margin | 13.6 | % | 4.7 | % | 8.9 pp | 9.1 | % | 9.5 | % | (0.4) pp | ||||||||||||||
| Add: Intangible amortization expense | 3.4 | % | 4.0 | % | (0.6) pp | 3.5 | % | 3.5 | % | 0.0 pp | ||||||||||||||
| Add: M&A-related expenses | 0.3 | % | 1.0 | % | (0.7) pp | 0.6 | % | 1.0 | % | (0.4) pp | ||||||||||||||
| Add: M&A-related earn-outs (1) | — | % | 0.2 | % | (0.2) pp | — | % | 0.6 | % | (0.6) pp | ||||||||||||||
| Add: Severance and personnel expenses (2) | 0.3 | % | 5.8 | % | (5.5) pp | 0.4 | % | 1.9 | % | (1.5) pp | ||||||||||||||
| Add: Transformation costs (2) | 0.1 | % | 0.7 | % | (0.6) pp | 0.5 | % | 0.2 | % | 0.3 pp | ||||||||||||||
| Add: Asset impairment costs (2) | 0.1 | % | — | % | 0.1 pp | 0.2 | % | — | % | 0.2 pp | ||||||||||||||
| Adjusted operating margin | 17.8 | % | 16.4 | % | 1.4 pp | 14.3 | % | 16.7 | % | (2.4) pp | ||||||||||||||
| Reconciliation from consolidated diluted net income (loss) per share to adjusted diluted net income per share: | ||||||||||||||||||||||||
| Consolidated diluted net income (loss) per share | $ | 0.91 | $ | (0.21 | ) | NMF | $ | 1.58 | $ | 1.56 | 1.3 | % | ||||||||||||
| Add: Intangible amortization expense | 0.31 | 0.32 | (3.1 | )% | 0.91 | 0.83 | 9.6 | % | ||||||||||||||||
| Add: M&A-related expenses | 0.03 | 0.08 | (62.5 | )% | 0.15 | 0.24 | (37.5 | )% | ||||||||||||||||
| Add: M&A-related earn-outs (1) | — | 0.02 | NMF | — | 0.18 | NMF | ||||||||||||||||||
| Add: Severance and personnel expenses (2) | 0.02 | 0.47 | (95.7 | )% | 0.09 | 0.46 | (80.4 | )% | ||||||||||||||||
| Add: Transformation costs (2) | 0.01 | 0.05 | (80.0 | )% | 0.12 | 0.05 | NMF | |||||||||||||||||
| Add: Asset impairment costs (2) | 0.01 | — | NMF | 0.05 | — | NMF | ||||||||||||||||||
| Less: Non-operating (gains) losses (3) | (0.01 | ) | 0.04 | NMF | 0.24 | (0.02 | ) | NMF | ||||||||||||||||
| Adjusted diluted net income per share | $ | 1.28 | $ | 0.77 | 66.2 | % | $ | 3.14 | $ | 3.30 | (4.8 | )% | ||||||||||||
| Reconciliation from cash provided by operating activities to free cash flow: | ||||||||||||||||||||||||
| Cash provided by operating activities | $ | 130.7 | $ | 102.1 | 28.0 | % | $ | 178.6 | $ | 194.3 | (8.1 | )% | ||||||||||||
| Capital expenditures | (29.3 | ) | (33.7 | ) | (13.1 | )% | (89.1 | ) | (93.4 | ) | (4.6 | )% | ||||||||||||
| Free cash flow | $ | 101.4 | $ | 68.4 | 48.2 | % | $ | 89.5 | $ | 100.9 | (11.3 | )% | ||||||||||||
NMF - Not meaningful, pp - percentage points
(1) Reflects the impact of M&A-related earn-outs included in operating expense (compensation expense), primarily due to the earn-out for Morningstar Sustainalytics.
(2) Reflects costs associated with the significant reduction of the Company's operations in Shenzhen, China, and the shift of work related to its global business functions to other Morningstar locations.
Severance and personnel expenses include severance charges, incentive payments related to early signing of severance agreements, transition bonuses, and stock-based compensation related to the acceleration of vesting of restricted stock unit and market share unit awards. In addition, the reversal of accrued sabbatical liabilities is included in this category.
Transformation costs include professional fees and the temporary duplication of headcount. As the Company hired replacement roles in other markets and shifted capabilities, it employed certain Shenzhen-based staff through the transition period, which resulted in elevated compensation costs on a temporary basis.
Asset impairment costs include the write-off or accelerated depreciation of fixed assets in the Shenzhen, China office that were not redeployed, in addition to lease abandonment costs as the Company downsized its office space prior to the lease termination date.
(3) Non-operating (gains) losses in the three and nine months ended Sept. 30, 2023 and Sept. 30, 2022, related to realized and unrealized gains and losses on investments. In addition, non-operating (gains) losses for the nine months ended Sept. 30, 2023 also includes expense from an equity method transaction, net.
Page
Exhibit 99.2
|
Third Quarter 2023 Supplemental Presentation October 25, 2023 |
|
This presentation contains forward-looking statements within the meaning of the Private Securities Litigation Reform Act of 1995. These statements are based on our current expectations about future events or future financial performance. Forward-looking statements by their nature address matters that are, to different degrees, uncertain, and often contain words such as “may,” “could,” “expect,” “intend,” “plan,” “seek,” “anticipate,” “believe,” “estimate,” “predict,” “potential,” “prospects,” or “continue.” These statements involve known and unknown risks and uncertainties that may cause the events we discuss not to occur or to differ significantly from what we expect. More information about factors that could affect Morningstar’s business and financial results are in our filings with the SEC, including our most recent 8-K, 10-K, and 10-Q forms. Morningstar undertakes no obligation to publicly update any forward-looking statements as a result of new information, future events, or otherwise, except as required by law. In addition, this presentation references non-GAAP financial measures including, but not limited to, organic revenue, adjusted operating income, adjusted operating margin, adjusted operating expense, and free cash flow. These non-GAAP measures may not be comparable to similarly titled measures reported by other companies. A reconciliation of non-GAAP financial measures to the most directly comparable GAAP financial measures is provided in the appendix to this presentation and in our filings with the SEC, including our most recent Forms 8-K, 10-K and 10-Q. 2 2 |
|
Q3 2023 Financial Performance ($mil) $22.0 $70.0 22 23 $92.0 +10.1% +20.1% 22 23 $468.2 $515.5 22 23 $76.6 $101.4 22 23 $68.4 Revenue Operating Income Adjusted Free Cash Flow** Operating Income* * 3 3 Adjusted operating income is a non-GAAP measure and excludes intangible amortization expense, other merger and acquisition (M&A) related expenses and earn-outs, and items related to the significant reduction and shift of the Company’s operations in China. Operating and adjusted operating income include the impact of $5.0 million in severance costs for targeted reorganizations not related to the Company’s shift of China operations and $6.0 million in expense related to the DBRS Morningstar SEC settlements.**Free cash flow is a non-GAAP measure and is defined as cash provided by or used for operating activities less capital expenditures. Excluding the impact of the payment of $16.1 million in severance and costs related to the Company's China activities, and comparable items in the prior-year period, free cash flow would have increased 67.1%. See reconciliation tables in the appendix to this presentation. +48.2% NMF |
|
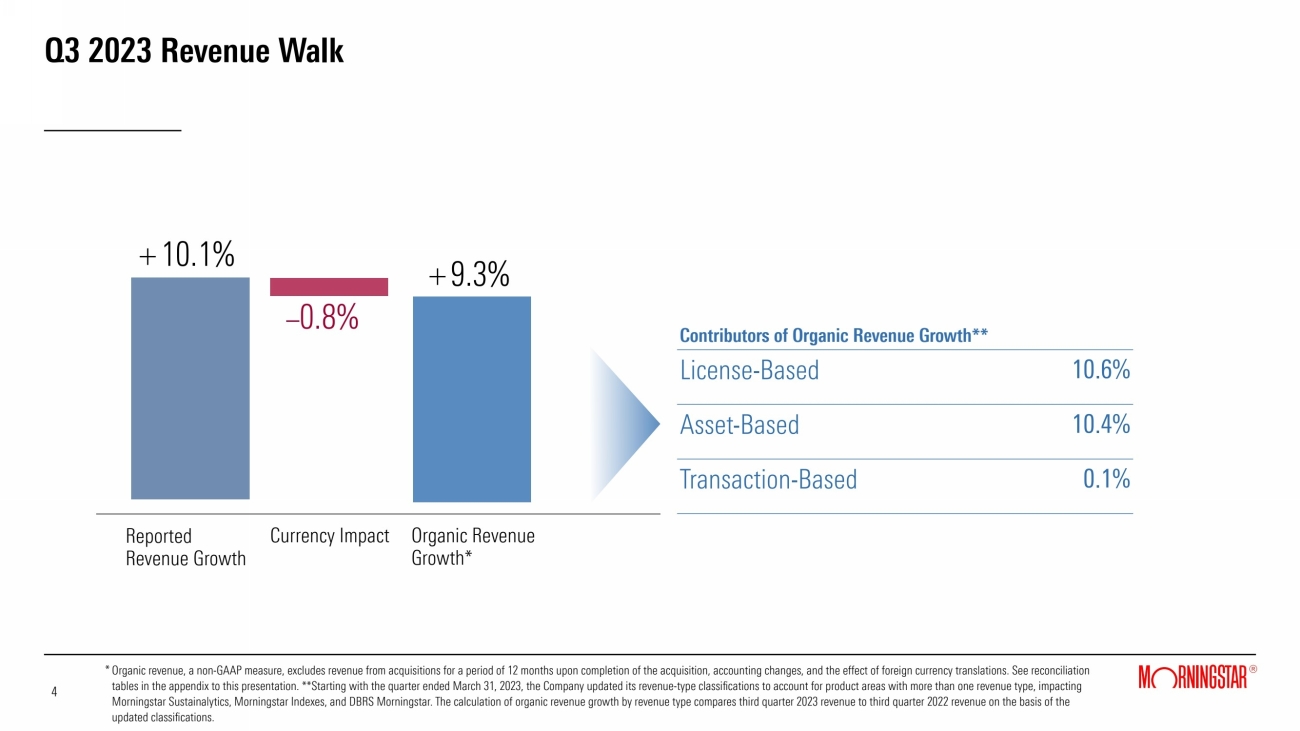
Q3 2023 Revenue Walk Organic revenue, a non-GAAP measure, excludes revenue from acquisitions for a period of 12 months upon completion of the acquisition, accounting changes, and the effect of foreign currency translations. See reconciliation tables in the appendix to this presentation. **Starting with the quarter ended March 31, 2023, the Company updated its revenue-type classifications to account for product areas with more than one revenue type, impacting Morningstar Sustainalytics, Morningstar Indexes, and DBRS Morningstar. The calculation of organic revenue growth by revenue type compares third quarter 2023 revenue to third quarter 2022 revenue on the basis of the updated classifications. 4 4 * +10.1% Reported Revenue Growth +9.3% Contributors of Organic Revenue Growth** License-Based 10.6% Asset-Based 10.4% Transaction-Based 0.1% Organic Revenue Growth* –0.8% Currency Impact |
|
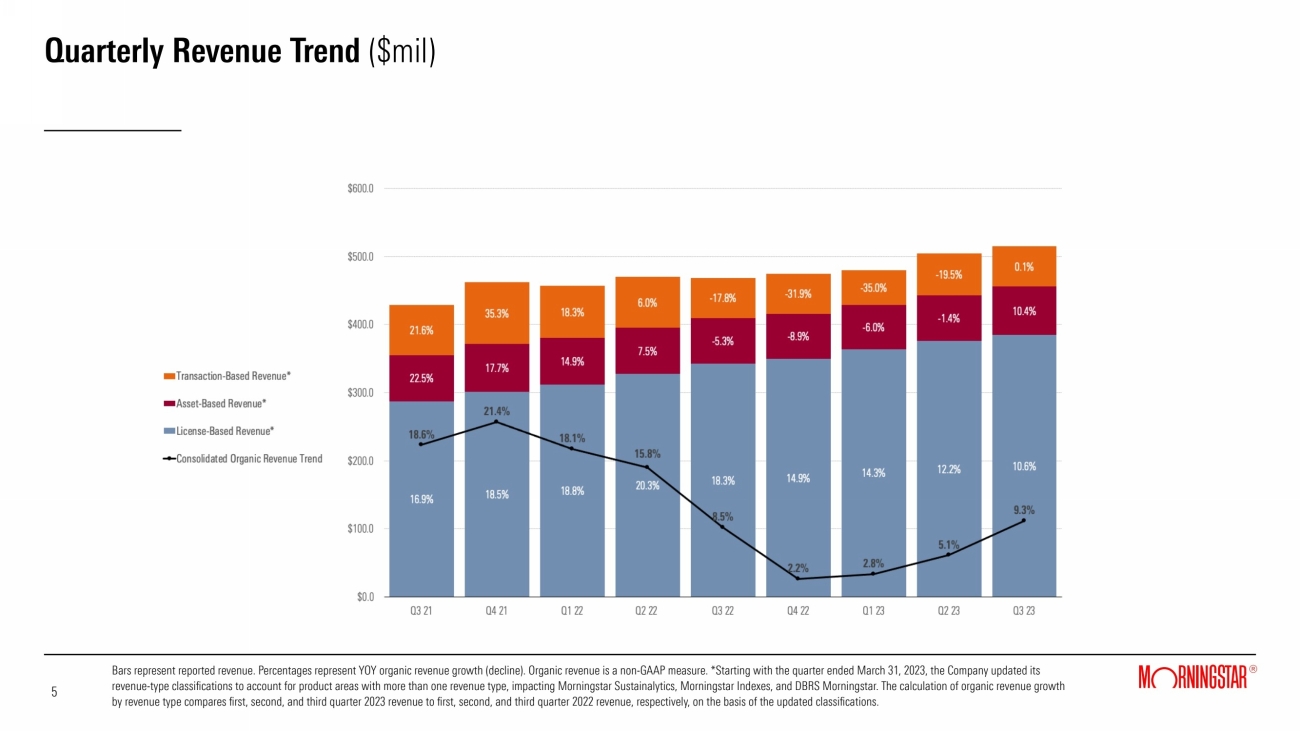
Quarterly Revenue Trend ($mil) Bars represent reported revenue. Percentages represent YOY organic revenue growth (decline). Organic revenue is a non-GAAP measure. *Starting with the quarter ended March 31, 2023, the Company updated its revenue-type classifications to account for product areas with more than one revenue type, impacting Morningstar Sustainalytics, Morningstar Indexes, and DBRS Morningstar. The calculation of organic revenue growth by revenue type compares first, second, and third quarter 2023 revenue to first, second, and third quarter 2022 revenue, respectively, on the basis of the updated classifications. 5 10.6% 12.1% |
|
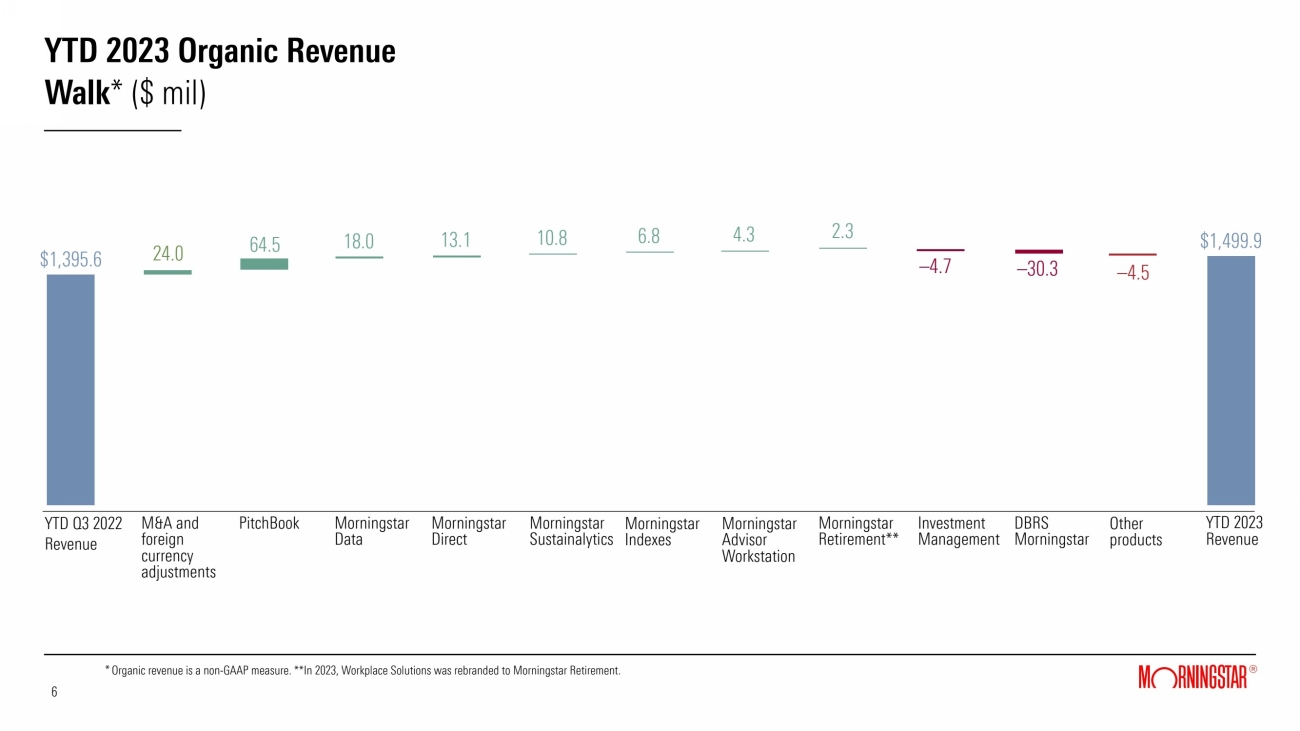
YTD 2023 Organic Revenue Walk* ($ mil) 6 6 YTD Q3 2022 Revenue M&A and foreign currency adjustments PitchBook Morningstar Data Morningstar Direct Morningstar Sustainalytics Morningstar Indexes Morningstar Advisor Workstation Investment Management DBRS Morningstar Morningstar Retirement** Other products YTD 2023 Revenue $1,395.6 24.0 64.5 18.0 13.1 10.8 6.8 2.3 –4.7 –30.3 $1,499.9 * Organic revenue is a non-GAAP measure. **In 2023, Workplace Solutions was rebranded to Morningstar Retirement. –4.5 4.3 |
|
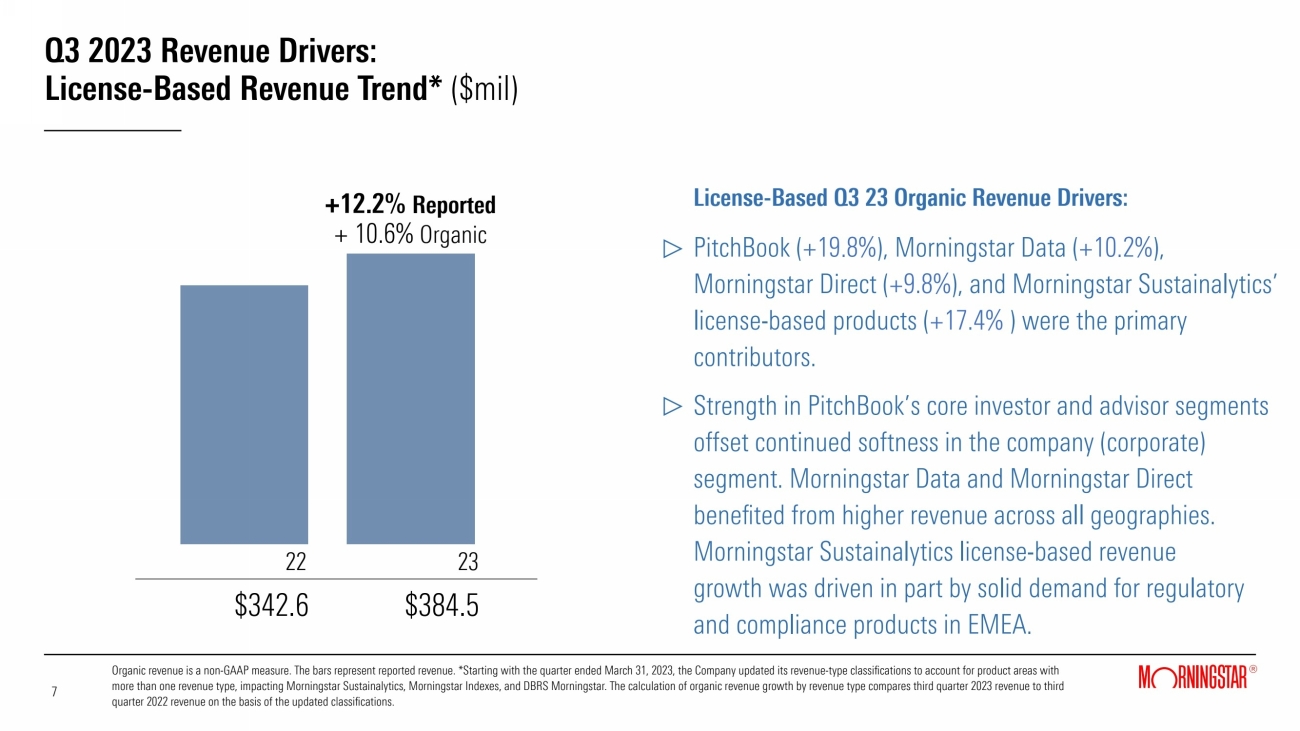
Q3 2023 Revenue Drivers: License-Based Revenue Trend* ($mil) +12.2% Reported + 10.6% Organic 22 23 License-Based Q3 23 Organic Revenue Drivers: PitchBook (+19.8%), Morningstar Data (+10.2%), Morningstar Direct (+9.8%), and Morningstar Sustainalytics’ license-based products (+17.4% ) were the primary contributors. Strength in PitchBook’s core investor and advisor segments offset continued softness in the company (corporate) segment. Morningstar Data and Morningstar Direct benefited from higher revenue across all geographies. Morningstar Sustainalytics license-based revenue growth was driven in part by solid demand for regulatory and compliance products in EMEA. Organic revenue is a non-GAAP measure. The bars represent reported revenue. *Starting with the quarter ended March 31, 2023, the Company updated its revenue-type classifications to account for product areas with more than one revenue type, impacting Morningstar Sustainalytics, Morningstar Indexes, and DBRS Morningstar. The calculation of organic revenue growth by revenue type compares third quarter 2023 revenue to third quarter 2022 revenue on the basis of the updated classifications. $342.6 $384.5 7 7 |
|
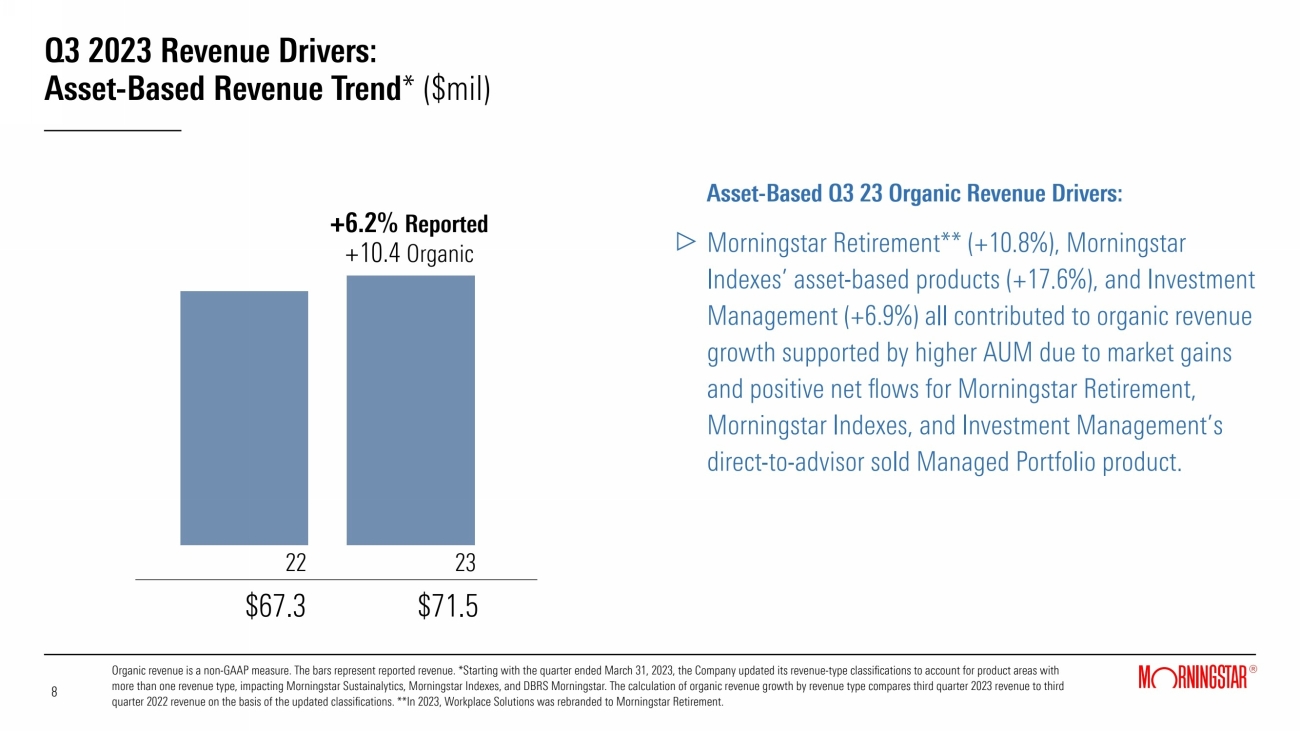
Q3 2023 Revenue Drivers: Asset-Based Revenue Trend* ($mil) Asset-Based Q3 23 Organic Revenue Drivers: Morningstar Retirement** (+10.8%), Morningstar Indexes’ asset-based products (+17.6%), and Investment Management (+6.9%) all contributed to organic revenue growth supported by higher AUM due to market gains and positive net flows for Morningstar Retirement, Morningstar Indexes, and Investment Management’s direct-to-advisor sold Managed Portfolio product. +6.2% Reported +10.4 Organic 22 23 $67.3 $71.5 8 8 Organic revenue is a non-GAAP measure. The bars represent reported revenue. *Starting with the quarter ended March 31, 2023, the Company updated its revenue-type classifications to account for product areas with more than one revenue type, impacting Morningstar Sustainalytics, Morningstar Indexes, and DBRS Morningstar. The calculation of organic revenue growth by revenue type compares third quarter 2023 revenue to third quarter 2022 revenue on the basis of the updated classifications. **In 2023, Workplace Solutions was rebranded to Morningstar Retirement. |
|
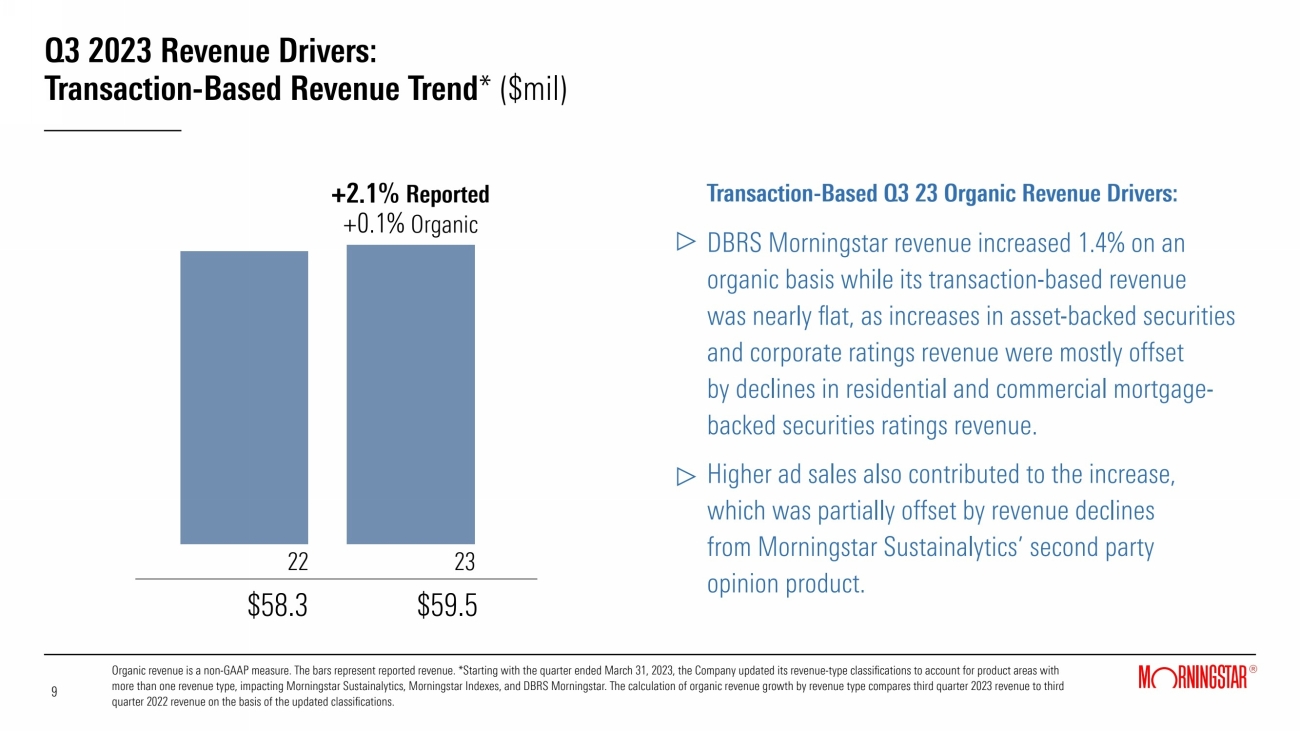
Q3 2023 Revenue Drivers: Transaction-Based Revenue Trend* ($mil) Transaction-Based Q3 23 Organic Revenue Drivers: DBRS Morningstar revenue increased 1.4% on an organic basis while its transaction-based revenue was nearly flat, as increases in asset-backed securities and corporate ratings revenue were mostly offset by declines in residential and commercial mortgage-backed securities ratings revenue. Higher ad sales also contributed to the increase, which was partially offset by revenue declines from Morningstar Sustainalytics’ second party opinion product. +2.1% Reported +0.1% Organic 22 23 $58.3 $59.5 9 9 Organic revenue is a non-GAAP measure. The bars represent reported revenue. *Starting with the quarter ended March 31, 2023, the Company updated its revenue-type classifications to account for product areas with more than one revenue type, impacting Morningstar Sustainalytics, Morningstar Indexes, and DBRS Morningstar. The calculation of organic revenue growth by revenue type compares third quarter 2023 revenue to third quarter 2022 revenue on the basis of the updated classifications. |
|
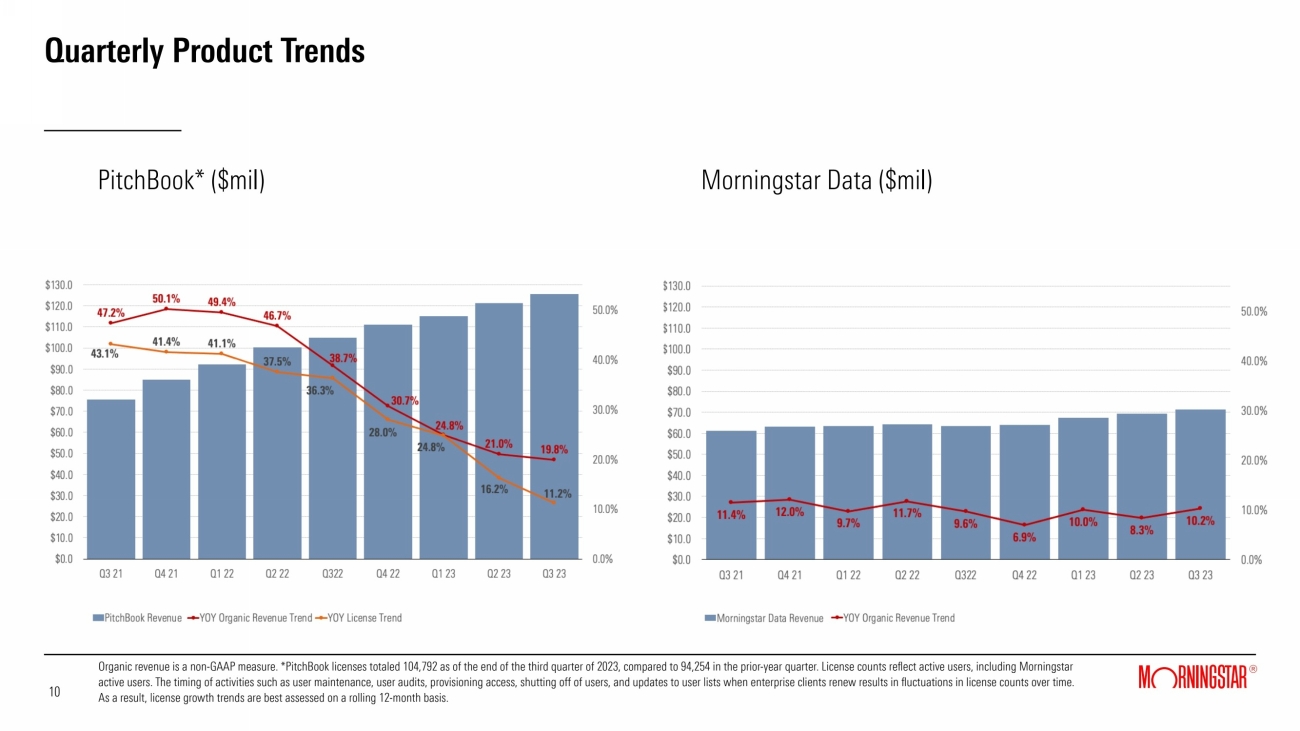
Quarterly Product Trends PitchBook* ($mil) 10 10 Morningstar Data ($mil) Organic revenue is a non-GAAP measure. *PitchBook licenses totaled 104,792 as of the end of the third quarter of 2023, compared to 94,254 in the prior-year quarter. License counts reflect active users, including Morningstar active users. The timing of activities such as user maintenance, user audits, provisioning access, shutting off of users, and updates to user lists when enterprise clients renew results in fluctuations in license counts over time. As a result, license growth trends are best assessed on a rolling 12-month basis. |
|
Quarterly Product Trends Morningstar Direct* ($mil) 11 11 Organic revenue is a non-GAAP measure. *Morningstar Direct licenses totaled 18,511 as of the end of the third quarter of 2023, compared to 18,126 in the prior-year quarter. **Revenue for Morningstar Sustainalytics’ license-based products increased 17.4% on an organic basis in the third quarter of 2023, while revenue for Morningstar Sustainalytics’ transaction-based products (second-party opinions) declined 13.5% on an organic basis. Morningstar Sustainalytics** ($mil) |
|
Quarterly Product Trends Morningstar Advisor Workstation ($mil) 12 12 Organic revenue is a non-GAAP measure. |
|
Quarterly Product Trends: DBRS Morningstar Revenue by Asset Class ($mil) DBRS Morningstar Q3 2023 Organic Revenue Drivers: Category mix in Q3 2023 was 58% Structured Finance* v. 42% Fundamental Ratings.** Recurring revenue, which is derived primarily from surveillance, research, and other transaction related services, represented 51.8% of total DBRS Morningstar revenue. Organic revenue is a non-GAAP measure. *Structured Finance (Asset-Backed Securities, Commercial Mortgage-Backed Securities, Residential Mortgage-Backed Securities). **Fundamental Ratings includes Corporate, Financial Institutions, Sovereign & Other. 13 13 |
|
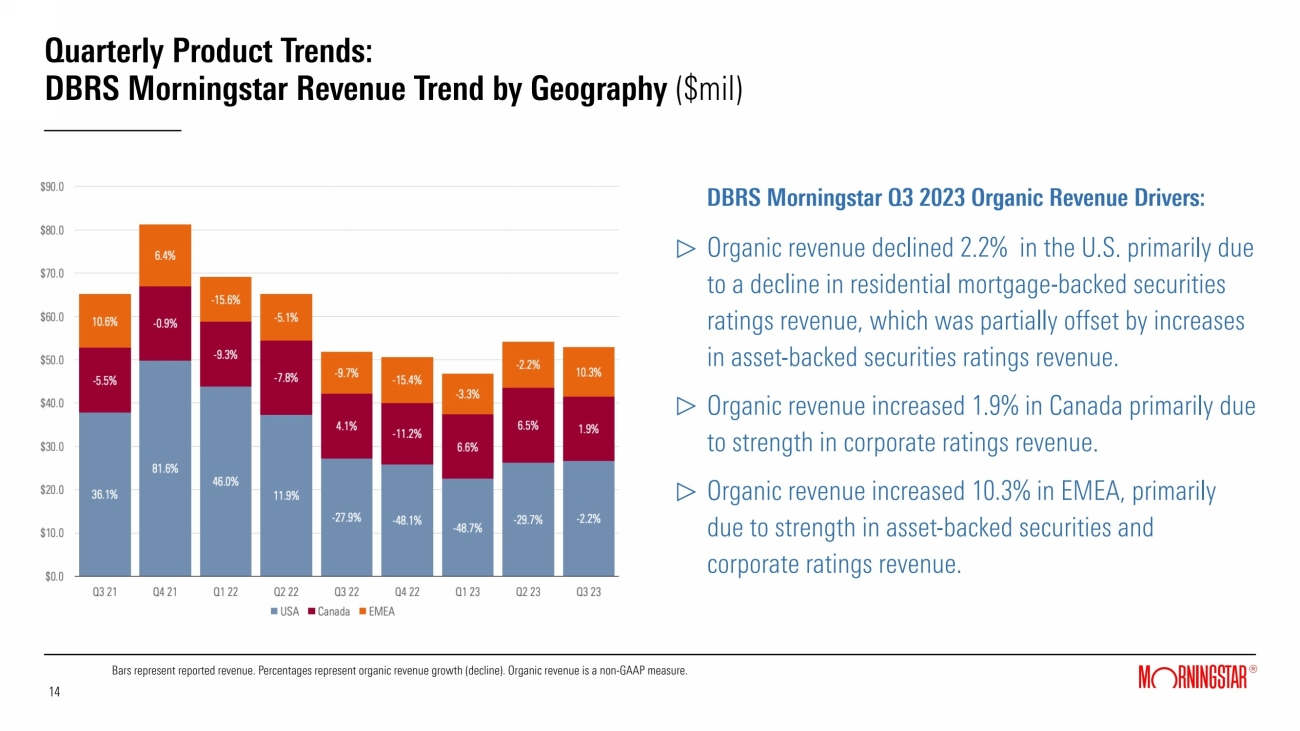
Quarterly Product Trends: DBRS Morningstar Revenue Trend by Geography ($mil) DBRS Morningstar Q3 2023 Organic Revenue Drivers: Organic revenue declined 2.2% in the U.S. primarily due to a decline in residential mortgage-backed securities ratings revenue, which was partially offset by increases in asset-backed securities ratings revenue. Organic revenue increased 1.9% in Canada primarily due to strength in corporate ratings revenue. Organic revenue increased 10.3% in EMEA, primarily due to strength in asset-backed securities and corporate ratings revenue. Bars represent reported revenue. Percentages represent organic revenue growth (decline). Organic revenue is a non-GAAP measure. 14 14 |
|
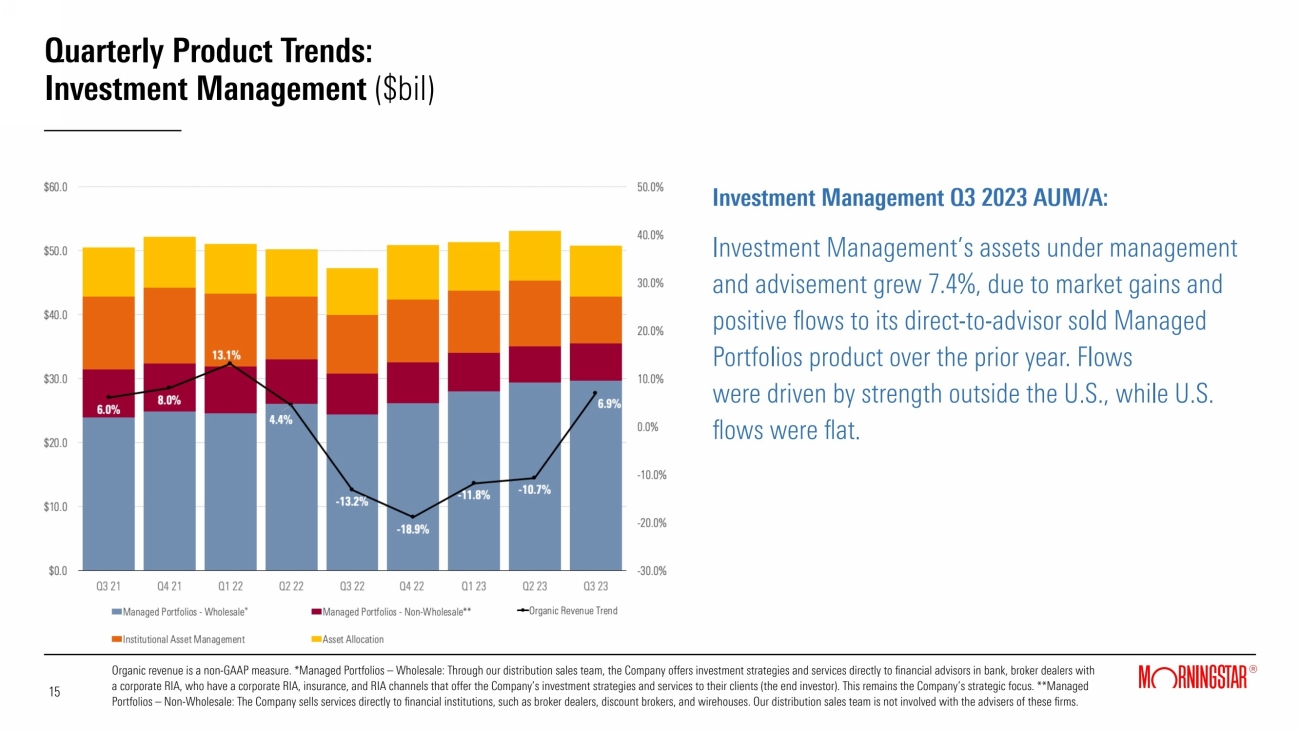
Quarterly Product Trends: Investment Management ($bil) Investment Management Q3 2023 AUM/A: Investment Management’s assets under management and advisement grew 7.4%, due to market gains and positive flows to its direct-to-advisor sold Managed Portfolios product over the prior year. Flows were driven by strength outside the U.S., while U.S. flows were flat. Organic revenue is a non-GAAP measure. *Managed Portfolios – Wholesale: Through our distribution sales team, the Company offers investment strategies and services directly to financial advisors in bank, broker dealers with a corporate RIA, who have a corporate RIA, insurance, and RIA channels that offer the Company’s investment strategies and services to their clients (the end investor). This remains the Company’s strategic focus. **Managed Portfolios – Non-Wholesale: The Company sells services directly to financial institutions, such as broker dealers, discount brokers, and wirehouses. Our distribution sales team is not involved with the advisers of these firms. 15 15 * |
|
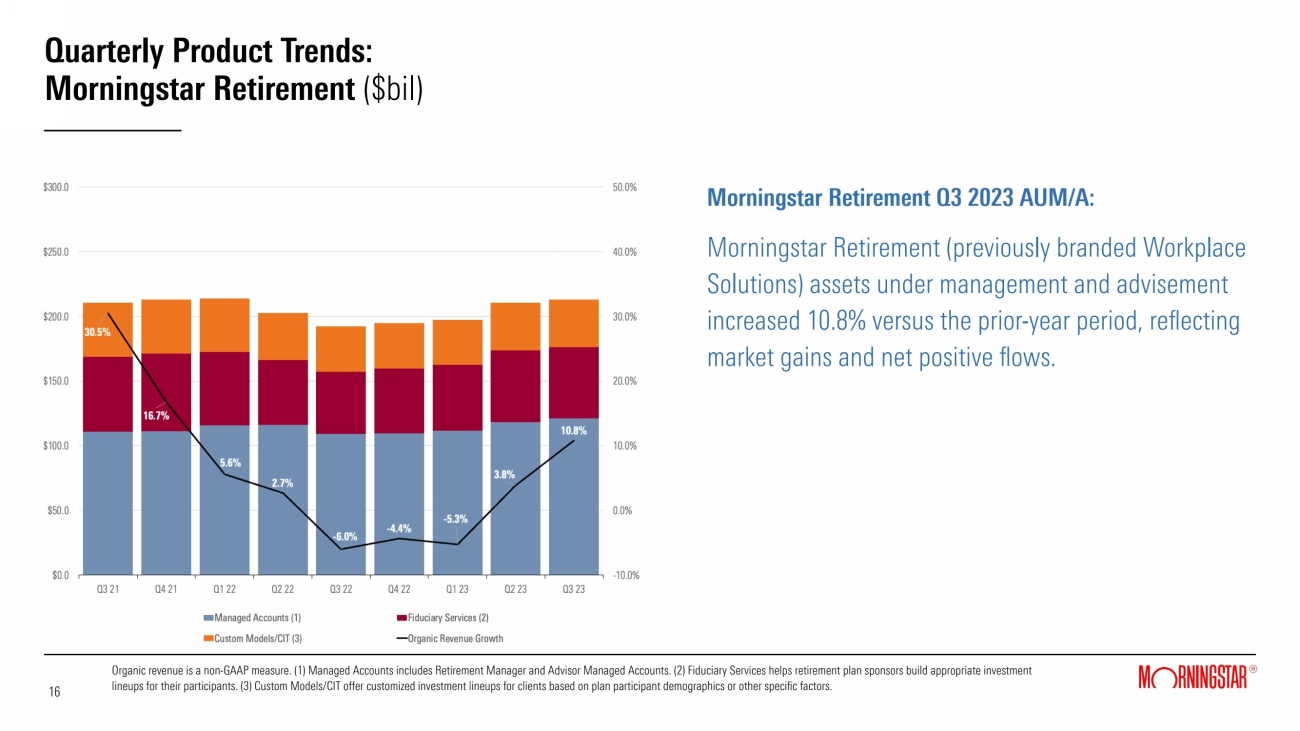
Morningstar Retirement Q3 2023 AUM/A: Morningstar Retirement (previously branded Workplace Solutions) assets under management and advisement increased 10.8% versus the prior-year period, reflecting market gains and net positive flows. Quarterly Product Trends: Morningstar Retirement ($bil) Organic revenue is a non-GAAP measure. (1) Managed Accounts includes Retirement Manager and Advisor Managed Accounts. (2) Fiduciary Services helps retirement plan sponsors build appropriate investment lineups for their participants. (3) Custom Models/CIT offer customized investment lineups for clients based on plan participant demographics or other specific factors. 16 16 |
|
Q3 2023 Operating Margins Operating Margin Drivers Key positive and negative drivers included: Severance costs declined by $20.4 million, compared to the prior-year period when severance related to the transition and shift of the Company’s China operations totaled $26.3 million. This was partially offset by $5.0 million in severance related to targeted reorganizations, which negatively impacted operating margin and adjusted operating margin by 1.0 percentage points. Stock-based compensation expense declined by $7.4 million primarily driven by lower costs related to the PitchBook plan. Compensation costs increased $26.8 million, reflecting higher average headcount during the quarter and merit increases. Headcount at the end of the quarter decreased 1.3% from the prior-year period and 4.6% sequentially from June 30, 2023. The DBRS Morningstar SEC settlements resulted in a $6.0 million expense during the quarter, which negatively impacted operating margin and adjusted operating margin by 1.2 percentage points. 17 17 Adjusted operating margin is a non-GAAP measure. See reconciliation tables in the appendix to this presentation. Adjusted Operating Margin Operating Margin 22 23 13.6% 17.8% 22 23 4.7% 16.4% |
|
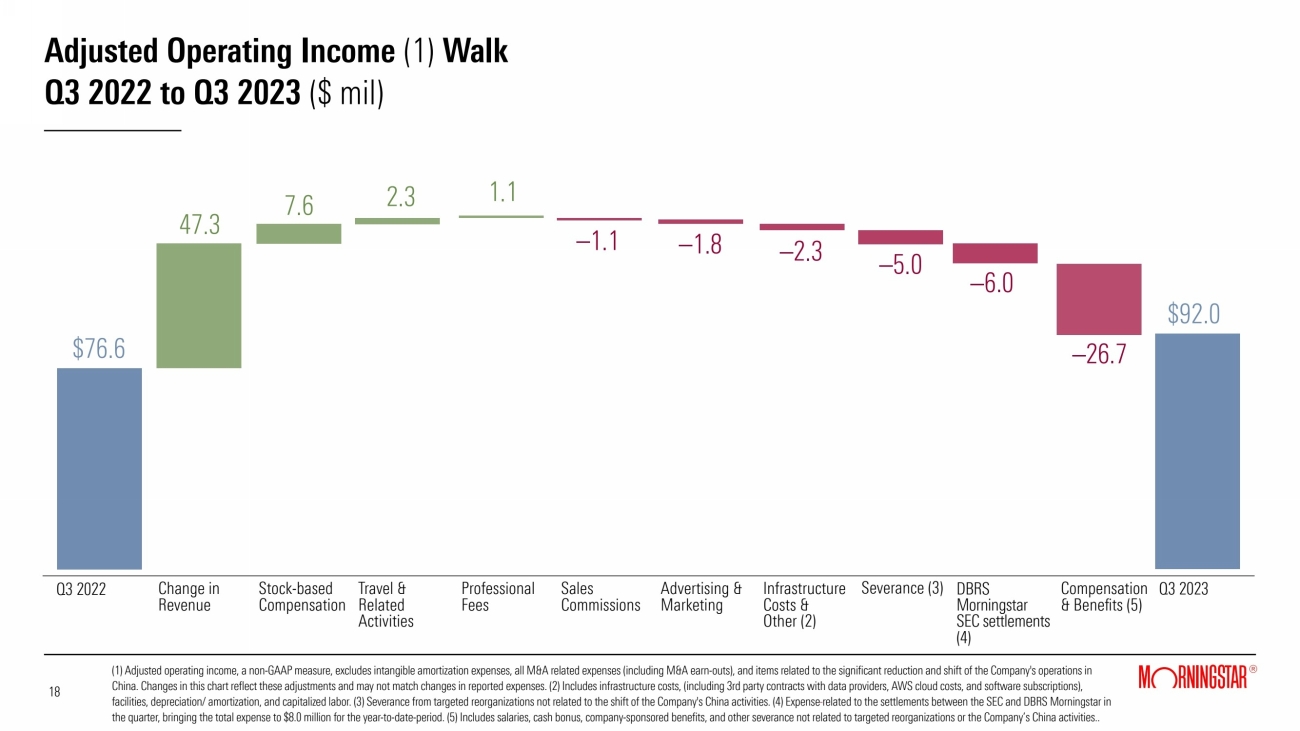
Adjusted Operating Income (1) Walk Q3 2022 to Q3 2023 ($ mil) (1) Adjusted operating income, a non-GAAP measure, excludes intangible amortization expenses, all M&A related expenses (including M&A earn-outs), and items related to the significant reduction and shift of the Company's operations in China. Changes in this chart reflect these adjustments and may not match changes in reported expenses. (2) Includes infrastructure costs, (including 3rd party contracts with data providers, AWS cloud costs, and software subscriptions), facilities, depreciation/ amortization, and capitalized labor. (3) Severance from targeted reorganizations not related to the shift of the Company's China activities. (4) Expense related to the settlements between the SEC and DBRS Morningstar in the quarter, bringing the total expense to $8.0 million for the year-to-date-period. (5) Includes salaries, cash bonus, company-sponsored benefits, and other severance not related to targeted reorganizations or the Company’s China activities.. 18 18 Q3 2022 Change in Revenue DBRS Morningstar SEC settlements (4) Stock-based Compensation Travel & Related Activities Professional Fees Advertising & Marketing Infrastructure Costs & Other (2) Q3 2023 $76.6 7.6 47.3 2.3 –1.1 1.1 –1.8 $92.0 Sales Commissions –6.0 –2.3 Compensation & Benefits (5) –26.7 –5.0 Severance (3) |
|
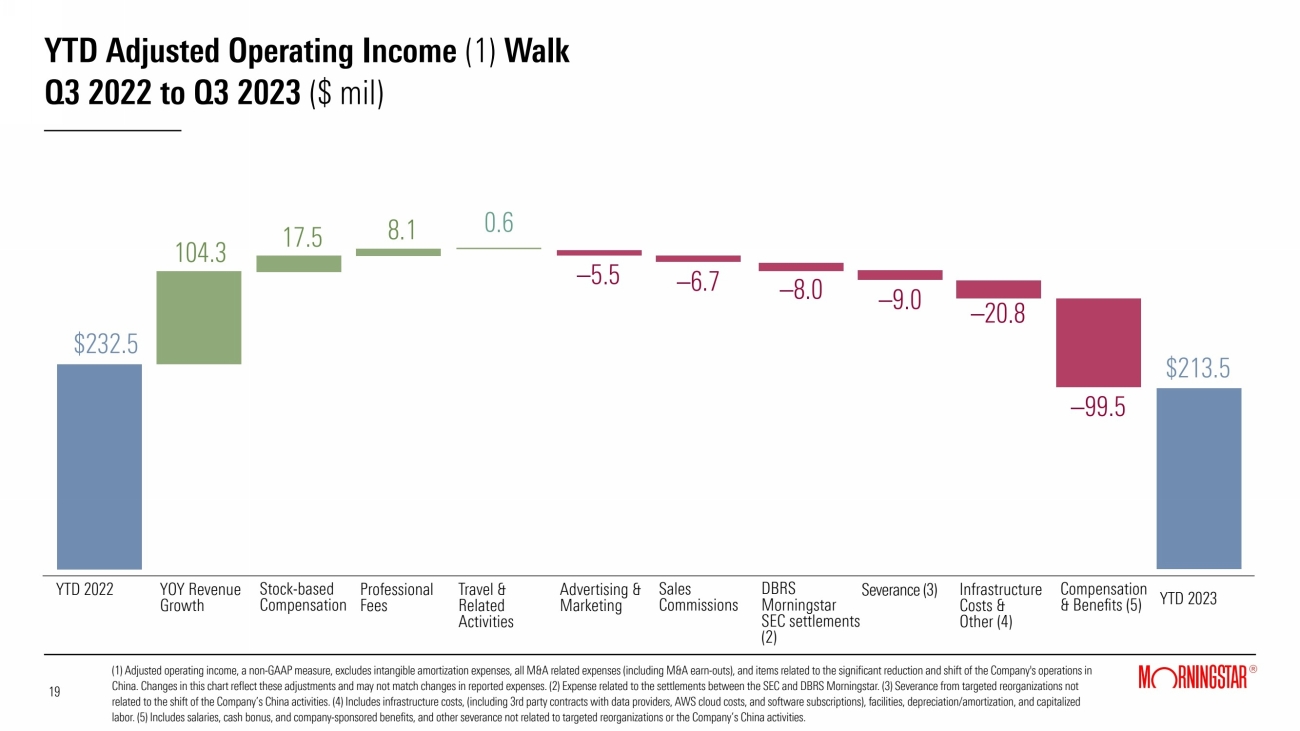
YTD Adjusted Operating Income (1) Walk Q3 2022 to Q3 2023 ($ mil) (1) Adjusted operating income, a non-GAAP measure, excludes intangible amortization expenses, all M&A related expenses (including M&A earn-outs), and items related to the significant reduction and shift of the Company's operations in China. Changes in this chart reflect these adjustments and may not match changes in reported expenses. (2) Expense related to the settlements between the SEC and DBRS Morningstar. (3) Severance from targeted reorganizations not related to the shift of the Company’s China activities. (4) Includes infrastructure costs, (including 3rd party contracts with data providers, AWS cloud costs, and software subscriptions), facilities, depreciation/amortization, and capitalized labor. (5) Includes salaries, cash bonus, and company-sponsored benefits, and other severance not related to targeted reorganizations or the Company’s China activities. 19 19 YTD 2022 YOY Revenue Growth Stock-based Compensation Professional Fees Travel & Related Activities Advertising & Marketing Sales Commissions Infrastructure Costs & Other (4) YTD 2023 $232.5 –20.8 17.5 104.3 8.1 –6.7 0.6 –5.5 $213.5 DBRS Morningstar SEC settlements (2) –8.0 –99.5 Compensation & Benefits (5) –9.0 Severance (3) |
|
Quarterly Operating Margin Trends Adjusted operating margin is a non-GAAP measure. Severance costs related to certain reorganizations, and excluding expenses related to the shift of the Company's China activities, negatively impacted operating margin and adjusted operating margin by 1.0 percentage points. The expense related to the DBRS Morningstar SEC settlements negatively impacted operating margin and adjusted operating margin by an additional 1.2 percentage points. 20 20 |
|
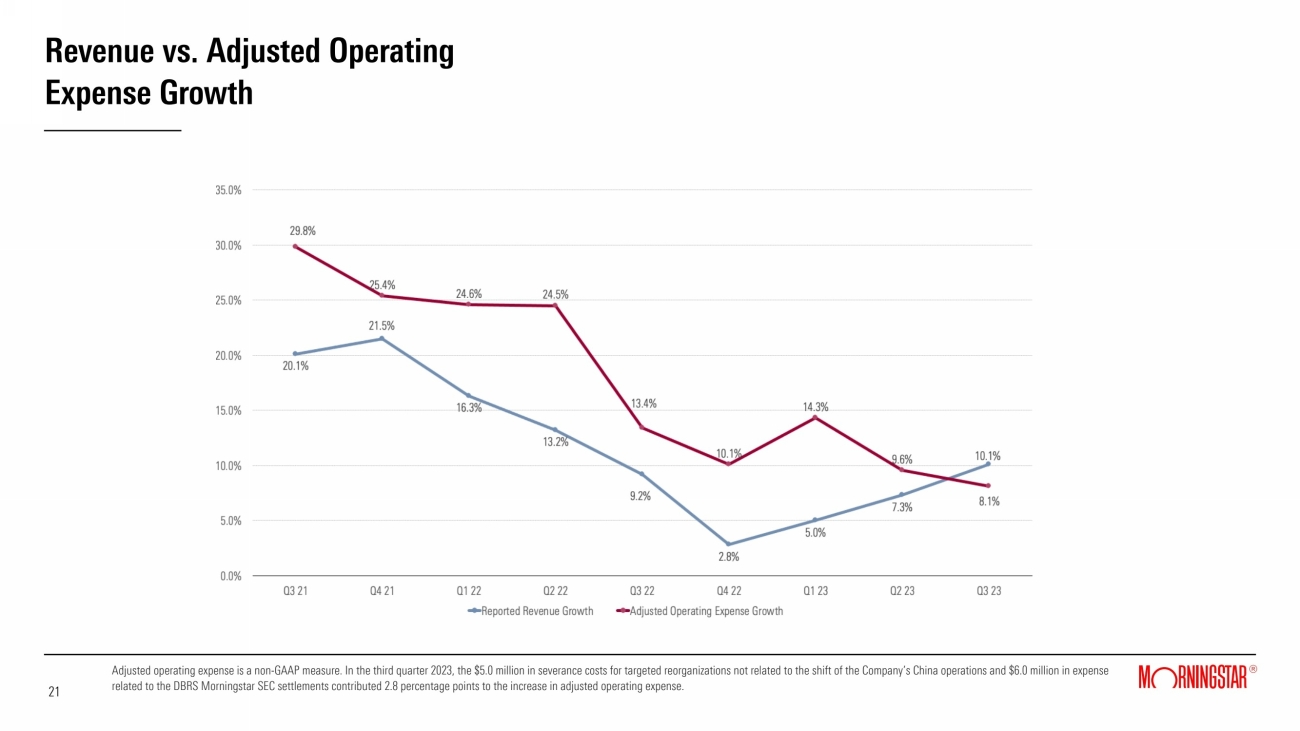
Revenue vs. Adjusted Operating Expense Growth 21 21 Adjusted operating expense is a non-GAAP measure. In the third quarter 2023, the $5.0 million in severance costs for targeted reorganizations not related to the shift of the Company’s China operations and $6.0 million in expense related to the DBRS Morningstar SEC settlements contributed 2.8 percentage points to the increase in adjusted operating expense. |
|
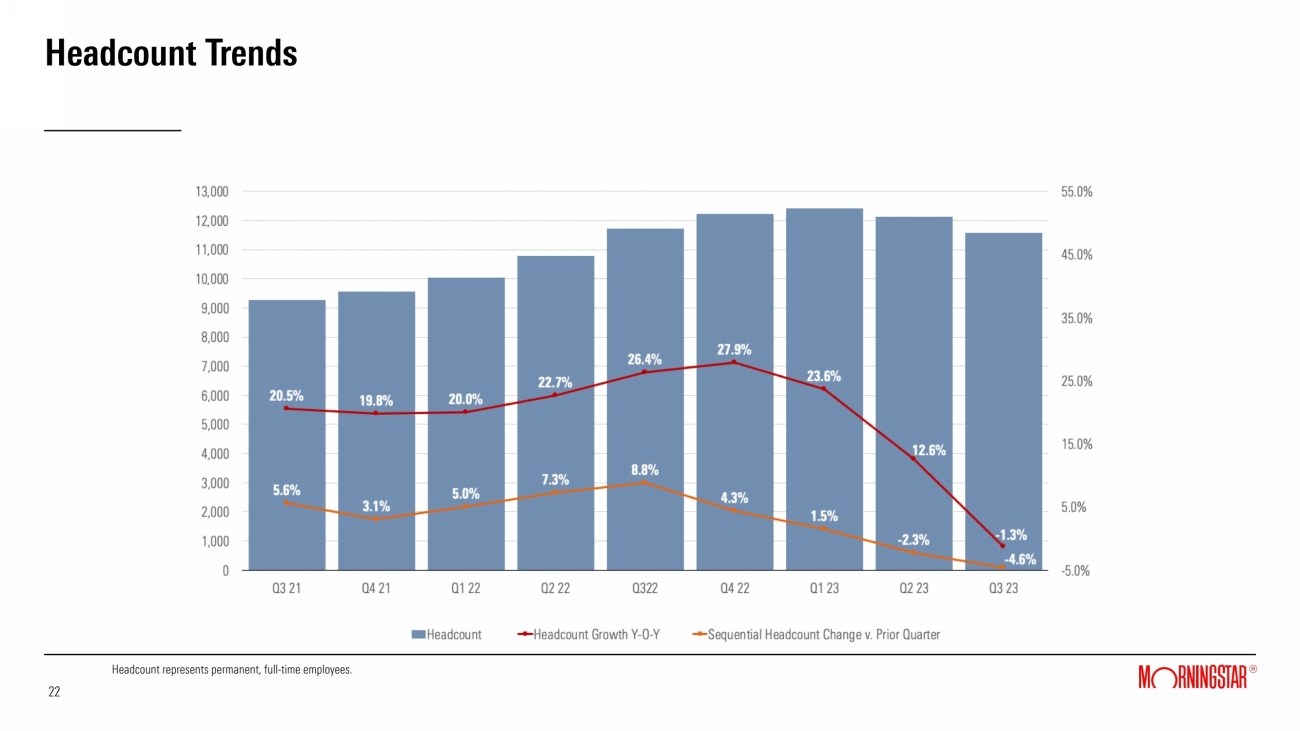
Headcount Trends 22 22 Headcount represents permanent, full-time employees. |
|
Q3 2023 Cash Flow and Capital Allocation ($mil) 2 $130.7 $101.4 Operating Cash Flow Free Cash Flow* Capital Allocation 23 23 * ($mil) Capital Expenditures 29.3 Debt Reduction 98.1 Dividends Paid 16.0 Investments in Unconsolidated Entities Free cash flow is a non-GAAP measure. Excluding $16.1 million in severance and related payments related to the Company's China activities, and comparable costs in the prior-year period, free cash flow would have been $117.5 million for the quarter ended September 30, 2023. |
|
Appendix |
|
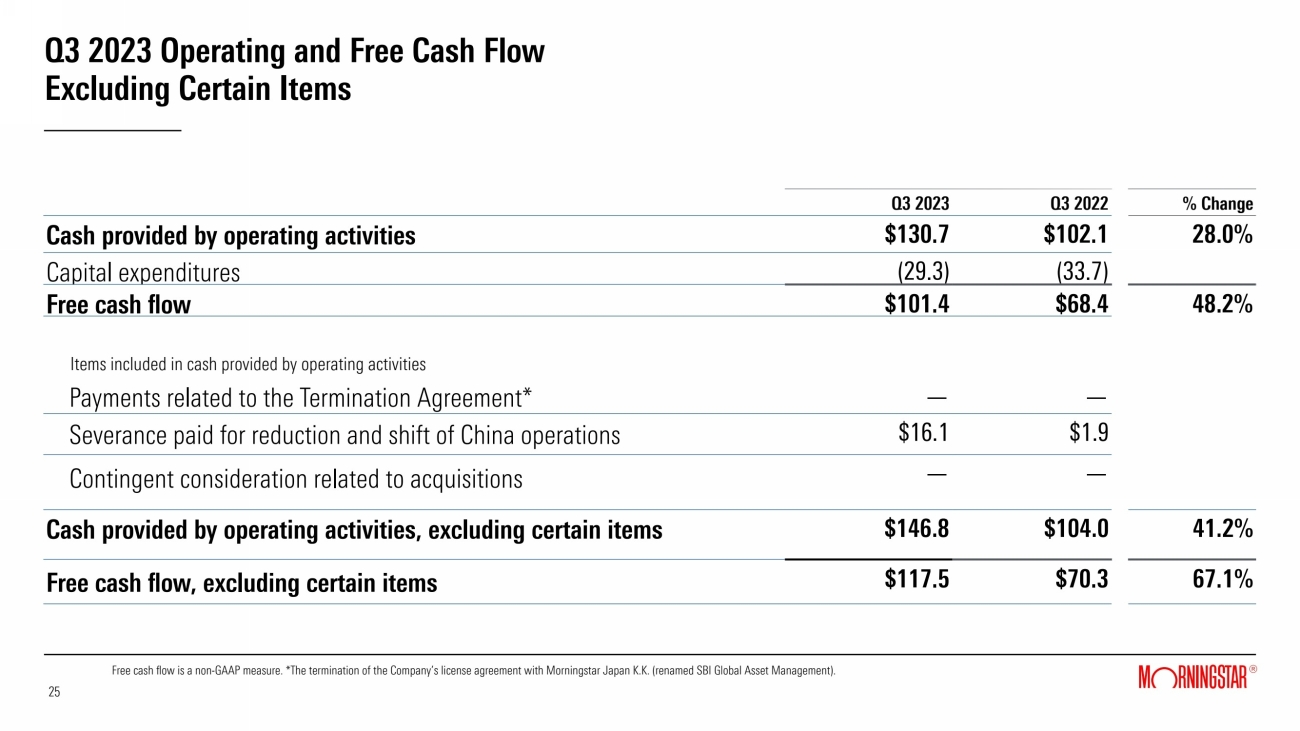
Q3 2023 Operating and Free Cash Flow Excluding Certain Items Free cash flow is a non-GAAP measure. *The termination of the Company’s license agreement with Morningstar Japan K.K. (renamed SBI Global Asset Management). Q3 2023 Q3 2022 % Change Cash provided by operating activities $130.7 $102.1 28.0% Capital expenditures (29.3) (33.7) Free cash flow $101.4 $68.4 48.2% Items included in cash provided by operating activities Payments related to the Termination Agreement* — — Severance paid for reduction and shift of China operations $16.1 $1.9 Contingent consideration related to acquisitions — — Cash provided by operating activities, excluding certain items $146.8 $104.0 41.2% Free cash flow, excluding certain items $117.5 $70.3 67.1% 25 25 |
|
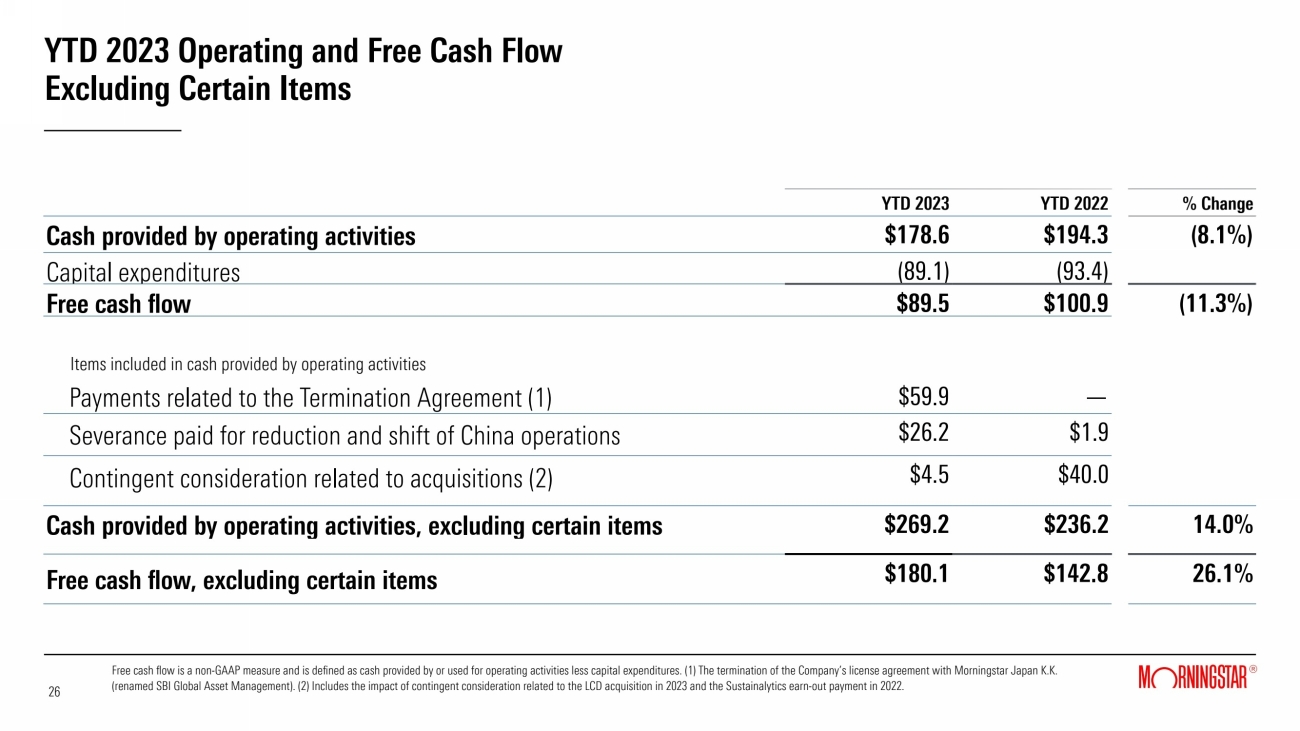
YTD 2023 Operating and Free Cash Flow Excluding Certain Items Free cash flow is a non-GAAP measure and is defined as cash provided by or used for operating activities less capital expenditures. (1) The termination of the Company’s license agreement with Morningstar Japan K.K. (renamed SBI Global Asset Management). (2) Includes the impact of contingent consideration related to the LCD acquisition in 2023 and the Sustainalytics earn-out payment in 2022. YTD 2023 YTD 2022 % Change Cash provided by operating activities $178.6 $194.3 (8.1%) Capital expenditures (89.1) (93.4) Free cash flow $89.5 $100.9 (11.3%) Items included in cash provided by operating activities Payments related to the Termination Agreement (1) $59.9 — Severance paid for reduction and shift of China operations $26.2 $1.9 Contingent consideration related to acquisitions (2) $4.5 $40.0 Cash provided by operating activities, excluding certain items $269.2 $236.2 14.0% Free cash flow, excluding certain items $180.1 $142.8 26.1% 26 26 |
|
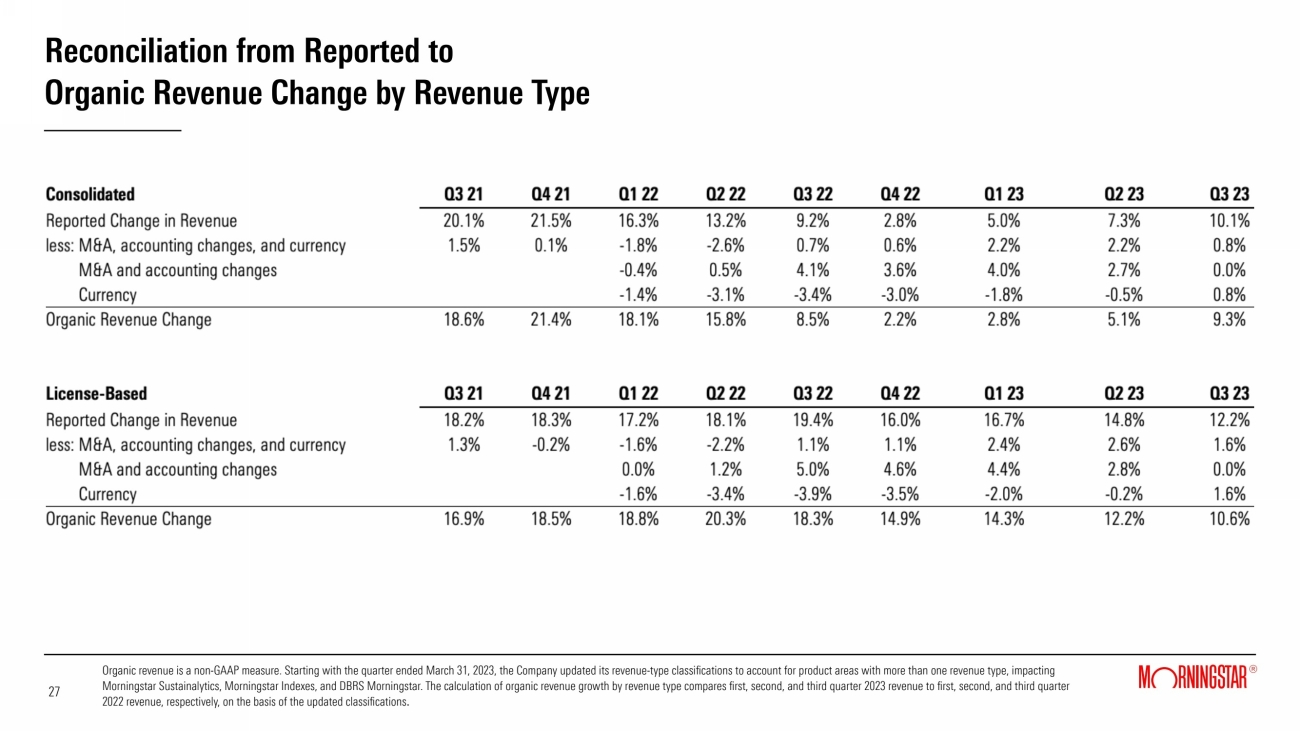
Reconciliation from Reported to Organic Revenue Change by Revenue Type 27 27 Organic revenue is a non-GAAP measure. Starting with the quarter ended March 31, 2023, the Company updated its revenue-type classifications to account for product areas with more than one revenue type, impacting Morningstar Sustainalytics, Morningstar Indexes, and DBRS Morningstar. The calculation of organic revenue growth by revenue type compares first, second, and third quarter 2023 revenue to first, second, and third quarter 2022 revenue, respectively, on the basis of the updated classifications. |
|
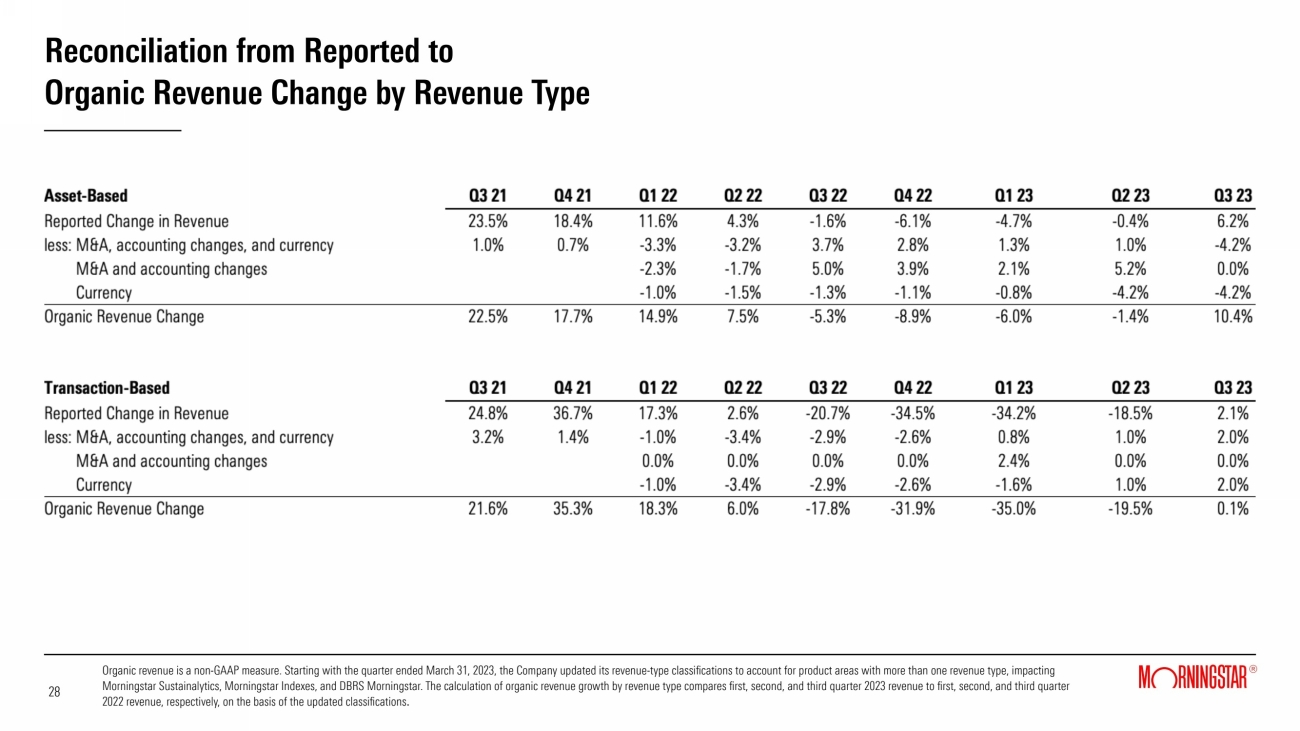
Reconciliation from Reported to Organic Revenue Change by Revenue Type 28 28 Organic revenue is a non-GAAP measure. Starting with the quarter ended March 31, 2023, the Company updated its revenue-type classifications to account for product areas with more than one revenue type, impacting Morningstar Sustainalytics, Morningstar Indexes, and DBRS Morningstar. The calculation of organic revenue growth by revenue type compares first, second, and third quarter 2023 revenue to first, second, and third quarter 2022 revenue, respectively, on the basis of the updated classifications. |
|
Reconciliation from Reported to Organic Revenue Change by Product Area 29 29 Organic revenue is a non-GAAP measure. |
|
Reconciliation from Reported to Organic Revenue Change by Product Area 30 30 Organic revenue is a non-GAAP measure. |
|
Reconciliation from Reported to Organic Revenue Change by Product Area 31 31 Organic revenue is a non-GAAP measure. |
|
Reconciliation from Operating Margin to Adjusted Operating Margin 32 32 Adjusted operating margin is a non-GAAP measure. |
|
Reconciliation from Total Operating Expenses to Adjusted Operating Expenses 33 33 Adjusted operating expense is a non-GAAP measure. |
|
|
© October 25, 2023. Morningstar. All Rights Reserved. Letter from CEO Kunal Kapoor Third-Quarter Results 2023 Dear Morningstar shareholders, Our third-quarter results demonstrate durable growth and increasing profitability. Revenue grew 10.1% to $515.5 million in the quarter (up 9.3% organically) and margins grew meaningfully. I am also pleased that operating cash flow increased 28.0%, to $130.7 million while free cash flow grew 67.1%, after normalizing for severance costs related to the shift of our China operations. I’ll initially focus this quarterly letter on our financials, followed by a discussion around the opportunities we’re seeing in our DBRS Morningstar product area, before concluding with a few thoughts about our shareholder engagement policy. But first, I want to introduce a change in how we communicate our financials to you. With our next 10-Q, which will be released in early November, we will begin reporting multiple segments, which will give investors additional transparency into the business and its evolution. We’ll also provide additional detail in an update to our quarterly supplemental deck at that time. Stay tuned for more on this important development. A continued focus on profitability and durable growth During the quarter, our efforts to grow margins centered on three key building blocks: Executing to realize growth seeded by investments we made in 2021 and 2022, making sure that our teams are properly sized, and carefully managing discretionary costs. We saw strength across most of our product portfolio during the quarter, with five of our largest product areas contributing double-digit or near double-digit organic growth to our overall results. Those gains reflected continued strength across our license-based products, including Morningstar Data and Morningstar Direct, and growth in our asset-based products. It was good to see positive revenue gains for Morningstar Indexes, Morningstar Retirement (previously branded Workplace Solutions), and Investment Management as markets rebounded. The exception to the broader growth story was DBRS Morningstar, with quarterly revenue roughly flat compared to the prior-year period as conditions remained extremely challenging in the U.S. commercial-mortgage-backed securities (CMBS) market. PitchBook remained an important driver of license-based and overall growth in the quarter, and we are encouraged by continued strength in our core investor and advisor segments, which offset some ongoing softness in the company segment. As we look ahead, we expect Leveraged Commentary & Data (LCD), acquired in mid-2022, to be an integral driver of PitchBook’s growth, and we are making good progress post-acquisition to bring the richness of LCD’s data, news, and research onto the PitchBook platform. During the quarter, we integrated LCD news onto the platform, significantly expanded the deals, bonds, and loan data available, and launched The Credit Pitch newsletter to a broad group of leveraged finance market participants. We’ll largely complete the remaining platform integration work in the first half of 2024. Our attention is now shifting to expanding relationships with existing clients and attracting new clients, drawn by the additional use cases we’re supporting, especially in the rapidly growing private credit market. We have seen a number of new opportunities to expand existing client relationships tied to the combined offering, with private equity and private credit fund data, expansive coverage of private equity and debt transactions, and private credit news helping to drive interest. At the same time, the addition of syndicated loan and high-yield bond coverage not previously available on the PitchBook platform has driven new sales. As we proceed, we’re tracking a variety of metrics including existing client retention and expansion and new sales as well as engagement with LCD research and analytics. The LCD acquisition also brought the LCD Leveraged Loan Indexes to our Morningstar Indexes portfolio. The integration of that product suite into Morningstar’s global index product and service platform is fully complete and LCD index data sales were a key contributor to Morningstar Indexes’ strong data product revenue growth in the quarter. Morningstar Sustainalytics also continues to be an important driver of growth although demand for ESG solutions has softened. Despite slowing, growth in our European license-based business remains robust, while North America is growing more slowly, especially in the asset management segment. Stepping back, we see continued strong fundamentals underlying demand for ESG and especially climate data over the long term. The 2023 Voice of the Asset Owner Survey, published by Morningstar Sustainalytics and Morningstar Indexes earlier this month based on responses of 500 asset owners MnRNINGSTAR® |
|
Letter from our CEO Kunal Kapoor Third-Quarter Results 2023 © October 25, 2023. Morningstar. All Rights Reserved. globally representing combined assets under management of over $10.7 trillion, found that more than two-thirds of asset owners believe ESG has become more material to investment policy in the past five years, with environmental factors – and in particular climate – driving materiality. Turning to expense management, we remain focused on matching our team’s size to the market opportunity, and we took additional actions to reduce headcount in Morningstar Sustainalytics, DBRS Morningstar, and Morningstar Wealth in the third quarter. The Morningstar Sustainalytics’ headcount reduction represented roughly 10% of its employee base. Although Morningstar Sustainalytics continues to be an important contributor to companywide growth, it has lagged our expectations and these actions are designed to strengthen its financial profile and position it for future growth by focusing on key offerings. With DBRS Morningstar, the decision to further reduce headcount was in response to continued weak issuance activity, especially in U.S. CMBS. Finally, the sharp declines in global markets in 2022 left us behind our initial goals for Morningstar Wealth, and we’ve re-paced investment spend to reflect that reality. These aren’t easy decisions, and we still believe that these three areas have plenty of runway. In each case, however, the actions were based on our careful assessment of the current operating environment and where we are and aren’t meeting expectations, and reflected what we believe we need to do to support future growth and realize returns on the investments we’ve made to date. (I will spend a bit more time below discussing how we’re currently thinking about DBRS Morningstar’s opportunity set in particular). Overall, headcount at the end of the quarter stood at 11,566. That’s a decrease of 1.3% from the end of the third quarter of 2022 and is down 4.6% sequentially from June 30, 2023. The decline from the second quarter reflected the actions discussed above and was also driven by the substantial completion of the reduction and shift of our China operations. These reductions and the related run rate benefits are important factors to help slow the rate of compensation expense growth in future periods. Finally, we continue to focus on cutting discretionary costs with year-over-year declines in cost categories including professional fees and travel. We also continue to look for savings in our real estate expenses, including the recent consolidation of our footprint in London and the reduction of office space in Shenzhen, China. As leases come up for renewal across the world, we are seeking to manage down our real-estate costs given the hybrid work environment. Taking this all into account, operating income increased to $70.0 million from $22.0 million in the prior-year period, with adjusted operating income increasing 20.1% to $92.0 million. Our third quarter operating margin was 13.6%, compared with 4.7% in the prior-year period and our adjusted operating margin was 17.8%, an increase from 16.4% in the prior-year period. Severance costs associated with the actions I described above negatively impacted operating margin and adjusted operating margin by 1.0 percentage points, while an expense associated with the SEC’s announced settlements with DBRS Morningstar negatively impacted operating and adjusted operating margins by 1.2 percentage points. We intend to keep our focus on expanding margins as we look to the fourth quarter and 2024, but we’re pleased with how we’re progressing. DBRS Morningstar This quarter, I want to share our latest thinking on our strategy in the credit ratings space. First, a quick refresher on DBRS Morningstar’s business. DBRS Morningstar is the fourth-largest credit rating agency globally and the market leader in Canada across multiple asset classes. It has good market share in the structured finance markets (including commercial- and residential mortgage-backed securities) in the U.S. and Europe. Looking across the global business, structured finance accounted for 63% of revenue in 2022—of that, CMBS was the biggest slice. We benefited from nice upside to revenue and operating profits when CMBS issuance reached its highest level in recent years in 2021, but also saw declines as CMBS slowed sharply in 2022. To give you a sense of the scope of the downturn, nonagency CMBS issuance has run at roughly $86 billion over the past 10 years. That number came in at less than $40 billion in 2022 and is projected to top out at a similarly low level in 2023. We have seen slowdowns in CMBS before, but nothing of this scale and duration in recent years. As we look to build the business, we are working to diversify our revenue base by expanding our presence in attractive markets where we can compete well. To that end, we’re focused on three key areas. The first is private and middle-market corporates in the U.S. and Europe. Taken together, this represents a large and growing market (as more companies opt to stay private) without the same barriers to entry that we see in investment-grade public corporate debt, and one in which we believe that we can compete on equal footing with our larger competitors. Once we are in the door with a MnRNINGSTAR® |
|
Letter from our CEO Kunal Kapoor Third-Quarter Results 2023 © October 25, 2023. Morningstar. All Rights Reserved. corporate issuer, there are also additional opportunities to rate more securities as it issues additional debt, while the ongoing revenue related to surveillance also helps make for a more stable revenue stream. In 2022, revenue related to U.S. middle-market and private corporates grew in a difficult year as we issued more than 110 new ratings globally in this asset class. Although private and middle market corporate issuance has seen some challenges year to date in the U.S. as borrowing costs have remained volatile, we’ve seen growth in private and middle-market European corporates through the first three quarters of 2023. The second opportunity is in expanding our asset-backed securities (ABS) effort. We already have a solid market position in ABS in the U.S. and Europe, and in 2022 we added capacity to help expand our coverage in that market, including in nontraditional niche (“esoteric”) ABS which includes securities backed by aircraft and data centers. That investment is paying off as revenue related to ABS ratings grew in the third quarter and for the year to date. Finally, we continue to focus on growing our data product. That’s a license-based revenue stream and one that grows naturally as we expand the reach of our coverage, including into more corporates. On the commercial real estate side of the business, even as issuance is down, there’s a massive amount of surveillance work going on as investors work to understand their exposure to CMBS, which has also helped drive business. Although still small, our data product is one of the few parts of DBRS Morningstar that grew meaningfully in 2022, and it’s also performed strongly for the year to date. I mentioned above that in the third quarter we have taken action to reduce headcount in DBRS Morningstar, building on similar actions in the second quarter. But as we’ve done that, we’ve made sure that we are supporting our efforts in corporates, ABS, and data products, and I’m optimistic that they will help fuel our growth in the years to come. While returns here will be lumpy, the long-term potential payoff remains significant. Our unique approach to shareholder engagement At the shareholder meeting and in recent months, we’ve heard questions from you about our approach to shareholder engagement, so I wanted to share a few thoughts on why we do things the way we do. As we wrote at the time of our IPO in 2005, we strive to communicate with candor and tell you the unvarnished truth about our business. We do not make public financial forecasts or provide guidance for our business. We are uneasy with management forecasts because they are, by their nature, subjective and could have an effect on a company’s stock price. We prefer to avoid this potential conflict and let our results speak for themselves while avoiding any incentive to alter behavior to “make the numbers.” Our goal is to communicate equally with all shareholders, without special treatment for large shareholders or research analysts. Our management team and board of directors are available once a year at our annual meeting. Our executive team doesn’t generally take one on one meetings with investors but instead we respond to your questions about the business in written form on a regular basis and make those answers available to all shareholders at the same time through regular 8-K filings and on our website. In 2022, we answered 133 questions and have shared more than 192 responses through mid-October 2023. Our intent is to keep you fully up-to-speed on what’s happening at Morningstar, but to do so in a way that treats every investor equally. Over the years, we have evolved our shareholder communications to include a quarterly supplemental deck and last quarter we introduced this letter, which reflected feedback we heard from you. We appreciate that feedback and are working hard to make sure that we’re addressing the many good and important questions you’ve raised about the business and its prospects. Please keep the questions coming—we strive to respond to each of them. What I’m reading Here’s recent commentary by our researchers that I especially enjoyed: • Bad Timing Cost Investors One Fifth of Their Funds’ Returns, Jeffrey Ptak, August 2, 2023 • Saudi Pro League Signing Spree Puts the World on Notice: Should European Football Clubs Be Concerned?, Michael Goldberg, Adriana Alvarado, and Alex Sterling, August 23, 2023 • Private Credit Dominates Aviation Financing in 2023, Hylton Heard, David Petu, Mark Hirshorn, August 31, 2023 • Is a Wide Moat Better Than a Well-Managed Company? Here’s What the Data Says., Adam Fleck, September 6, 2023 • The Best and Worst Mutual Fund Bets of the Past 25 Years, Jack Shannon, September 22, 2023 • The Link Between Flows and Fund Ratings, Russel Kinnel and Tony Thorn, September 25, 2023 • Assets in Global Climate Funds March Steadily Higher, Alyssa Stankiewicz, September 26, 2023 MnRNINGSTAR® |
|
Letter from our CEO Kunal Kapoor Third-Quarter Results 2023 © October 25, 2023. Morningstar. All Rights Reserved. • U.S. Leveraged Loan Issuance Hits Highest Level Since Start of Rate Hike Regime, Jonathan Hemingway, September 29, 2023 You may also appreciate these recent pieces that share more about our strategy and recent product innovations: • Harvard Business Review: How to Train Generative AI Using Your Company’s Data, July 6, 2023 • PlanAdviser: ADP, Morningstar Launch Managed Accounts for Small Business 401(k)s, August 15, 2023 • WealthManagement.com: Morningstar Launches Enterprise Analytics Platforms and API For Mo Chatbot, September 11, 2023 • Citywire Asia: Morningstar Asia CEO on Breaking Free from Mutual Funds, September 14, 2023 • Fortune: With New LP and Performance Tools, PitchBook Wants to be More Than Just a Deals Database, September 26, 2023 • Pensions & Investments: Asset Owners Highly Committed to ESG – Morningstar Survey, October 4, 2023 • CEO Keynote at Morningstar Sustainable Investing Summit, October 12, 2023 I hope you found this letter helpful—please do continue to share your feedback. Best regards, Kunal This letter contains forward-looking statements within the meaning of the Private Securities Litigation Reform Act of 1995. These statements are based on our current expectations about future events or future financial performance. Forward-looking statements by their nature address matters that are, to different degrees, uncertain, and often contain words such as “may,” “could,” “expect,” “intend,” “plan,” “seek,” “anticipate,” “believe,” “estimate,” “predict,” “potential,” “prospects,” or “continue.” These statements involve known and unknown risks and uncertainties that may cause the events we discuss not to occur or to differ significantly from what we expect. More information about factors that could affect Morningstar’s business and financial results are in our filings with the SEC, including our most recent reports on Forms 8-K, 10-K and 10-Q. Morningstar undertakes no obligation to publicly update any forward-looking statements as a result of new information, future events, or otherwise, except as required by law. In addition, this letter references non-GAAP financial measures including, but not limited to, organic revenue, adjusted operating income and adjusted operating margin. These non-GAAP measures may not be comparable to similarly titled measures reported by other companies. A discussion of our third quarter results, including a reconciliation of non-GAAP financial measures to the most directly comparable GAAP financial measures described in this letter, is provided in our earnings release for the three months ended September 30, 2023, which has been furnished to the SEC and is available on our website. MnRNINGSTAR® |