UNITED STATES
SECURITIES AND EXCHANGE COMMISSION
Washington, D.C. 20549
FORM 8-K
Current Report Pursuant to Section 13
or 15(d) of
The Securities Exchange Act of 1934
Date of Report (date of earliest event reported): July 27, 2023
CALIFORNIA WATER SERVICE GROUP
(Exact name of Registrant as Specified in its Charter)
| Delaware (State or other jurisdiction of incorporation) |
1-13883 (Commission file number) |
77-0448994 (I.R.S. Employer Identification Number) |
| 1720 North First Street San Jose, California (Address of principal executive offices) |
95112 (Zip Code) |
(408) 367-8200
(Registrant’s telephone number, including area code)
N/A
(Former name or former address, if changed since last report)
Check the appropriate box below if the Form 8-K filing is intended to simultaneously satisfy the filing obligation of the registrant under any of the following provisions:
| ¨ | Written communications pursuant to Rule 425 under the Securities Act (17 CFR 230.425) |
| ¨ | Soliciting material pursuant to Rule 14a-12 under the Exchange Act (17 CFR 240.14a-12) |
| ¨ | Pre-commencement communications pursuant to Rule 14d-2(b) under the Exchange Act (17 CFR 240.14d-2(b)) |
| ¨ | Pre-commencement communications pursuant to Rule 13e-4(c) under the Exchange Act (17 CFR 240.13e-4(c)) |
Securities registered pursuant to Section 12(b) of the Act:
| Title of each class | Trading Symbol(s) | Name of each exchange on which registered | ||
| Common Shares, par value $0.01 | CWT | New York Stock Exchange |
Indicate by check mark whether the registrant is an emerging growth company as defined by Rule 405 of the Securities Act of 1933 (§230.405 of this chapter) or Rule 12b-2 of the Securities Exchange Act of 1934 (§240.12b-2 of this chapter).
Emerging growth company ¨
If an emerging growth company, indicate by check mark if the registrant has elected not to use the extended transition period for complying with any new or revised financial accounting standards provided pursuant to Section 13(a) of the Exchange Act. ¨
| Item 2.02. | Results of Operations and Financial Condition |
On July 27, 2023, California Water Service Group (the “Company”) issued a press release (a copy of which is attached hereto as Exhibit 99.1 and incorporated herein by reference) announcing its financial results for the second quarter of 2023, ended June 30, 2023.
As announced, the Company will host a conference call on Thursday, July 27, 2023 at 11:00 am EST to discuss financial results and management’s business outlook. The financial results announcement contains information about how to access the conference call and webcast. A slide presentation, which includes supplemental information relating to the Company, will be used by management during the conference call. A copy of the slide presentation is attached hereto as Exhibit 99.2 and is incorporated by reference herein. The Exhibits will be posted on the Company’s website at www.calwatergroup.com under the “Investor Relations” tab.
The information furnished pursuant to Item 2.02 of this Current Report shall not be deemed “filed” for the purposes of Section 18 of the Securities Exchange Act of 1934, as amended (the “Exchange Act”), or incorporated by reference in any filing under the Securities Act of 1933, as amended, or the Exchange Act, except as expressly set forth by specific reference in such a filing.
| Item 9.01. | Financial Statements and Exhibits. |
We hereby furnish the following exhibits, which shall not be deemed “filed” for the purposes of Section 18 of the Exchange Act, with this report:
| Exhibit No. | Description | |
| 99.1 | Press Release issued July 27, 2023 | |
| 99.2 | Slide presentation relating to conference call | |
| 104 | Cover Page Interactive Data File (embedded within the Inline XBRL document) |
SIGNATURES
Pursuant to the requirements of the Securities Exchange Act of 1934, the Registrant has duly caused this report to be signed on its behalf by the undersigned hereunto duly authorized.
| CALIFORNIA WATER SERVICE GROUP | ||
| Date: July 27, 2023 | By: | /s/ David B. Healey |
| Name: | David B. Healey | |
| Title: | Vice President, Chief Financial Officer & Treasurer | |
Exhibit 99.1

July 27, 2023
For immediate release
CALIFORNIA WATER SERVICE GROUP ANNOUNCES
SECOND QUARTER 2023 RESULTS
SAN JOSE, CA – California Water Service Group (NYSE: CWT) (“Group”) today announced net income attributable to Group of $9.6 million and diluted earnings per share of $0.17 for the quarter ended June 30, 2023, as compared to net income attributable to Group of $19.5 million and diluted earnings per share of $0.36 for the quarter ended June 30, 2022.
Second quarter results primarily reflect the impact of the delayed proposed decision from the California Public Utilities Commission ("CPUC") on California Water Service Company’s (“Cal Water”) 2021 general rate case (“GRC”). Group currently estimates the temporary impact of the delayed decision on second quarter 2023 operating revenue to be between approximately $19 million and $29 million, based on the current positions of the parties to the 2021 GRC filing and consumption-driven regulatory mechanisms.
On June 29, 2023, the CPUC extended the GRC completion date to December 31, 2023, and on July 13, 2023, the CPUC co-assigned a second Administrative Law Judge (“ALJ”) to the Cal Water GRC to facilitate the process. The final GRC decision, once approved, will be retroactive to January 1, 2023, and a cumulative adjustment will be recorded in the quarter in which final approval is received.
Operating revenue was $194.0 million for the quarter ended June 30, 2023, compared to $206.2 million for the same period in 2022. The $12.2 million, or 5.9%, revenue decrease was primarily due to a $7.1 million decrease in Water Revenue Adjustment Mechanism (WRAM) and Modified Cost Balancing Account (MCBA) revenue and a $6.7 million decrease in customer usage.
Water revenues billed in the second quarter of 2023 included a 4% interim rate increase effective May 5, 2023; however, second quarter 2023 operating revenue does not include any benefit of new revenue mechanisms (Monterey-Style Water Revenue Adjustment Mechanism and Drought Response Memorandum Account) or the full benefit of rate relief (tracked in the Interim Rates Memorandum Account) due to the delay in the 2021 GRC.
Total operating expenses for the second quarter of 2023 were $178.1 million, compared to $178.9 million in 2022, a decrease of $0.8 million or 0.5%, mostly due to decreases in other operations expenses and income taxes, which were partially offset by increases in administrative and general, depreciation and amortization, property and other taxes, and a change in water mix. Administrative and general expenses for the second quarter of 2023 increased $2.3 million, or 7.0%, to $35.0 million during the quarter, primarily due to a $1.9 million increase in labor costs. Other operations expenses for the second quarter of 2023 were $25.8 million, compared to $29.4 million in 2022, a decrease of $3.6 million, or 12.2%, mostly due to the deferral of $2.5 million in costs related to the revenue deferral and a $1.7 million decrease in bad debt expense. Property and other taxes increased $1.1 million, mostly due to an increase in property taxes. Depreciation and amortization increased $1.0 million, primarily due to utility plant placed in service in 2022. Income taxes decreased $1.2 million, mostly due to a reduction in net operating income.
Other income and expenses were $6.2 million in the second quarter of 2023, an increase of $3.3 million, or 111.9%, over the second quarter of 2022. The increase was primarily due to an increase in unrealized gains on certain non-qualified benefit plan investments of $5.2 million in the second quarter of 2023 compared to 2022, partially offset by a $2.2 million decrease related to a gain on company owned life insurance recorded in 2022.
Net interest expense in the second quarter of 2023 increased $1.7 million, or 15.4%, to $12.7 million as compared to the second quarter of 2022, mostly due to an increase in short-term borrowing rates and higher outstanding line of credit balances.
The effective consolidated income tax rate was approximately 14.9% and 11.5% for the quarters ended June 30, 2023, and 2022, respectively. The change in effective tax rates was primarily due to a reduction in the amortization of the Tax Cuts and Jobs Act excess deferred income tax benefits in 2023 as compared to 2022.
According to Chairman and Chief Executive Officer Martin A. Kropelnicki, Group achieved several positive outcomes in the second quarter, despite the regulatory delay.
“The delay in Cal Water’s 2021 GRC clearly had a temporary adverse impact on our results, and I am hopeful that having an additional Administrative Law Judge on the case will expedite the process. However, there is good news to report for the second quarter:
| · | We received a decision on our Cost of Capital filing that is expected to increase our return on equity for California from 9.20% to 9.57% on July 31, 2023. The decision establishes a capital structure of 53.4% equity and 46.6% debt and reaffirms a Cost of Capital Adjustment Mechanism that allows for future changes based on Moody’s Utility Bond Index. We continued to invest diligently in our water system infrastructure to provide reliability and quality to customers. We’ve invested $177.2 million in capital year-to-date. |
| · | We received approval from the New Mexico Public Regulation Commission to acquire Monterey Water Company, a 380-connection system near our Rio Del Oro service area. |
| · | We ranked highest in the west among large water utilities in JD Powers’ Residential Customer Satisfaction Study. |
| · | We published our ESG Report, completed a greenhouse gas emissions inventory, and committed to setting absolute Scope 1 and 2 emissions reduction targets by Q3 2024. |
| · | We received a $4.3 million grant from the Department of Water Resources to connect struggling communities to our Salinas, California system. |
| · | We declared our 313th consecutive quarterly dividend. |
The bottom line is that regulatory delays are eventually resolved, but our focus continues to be on executing our strategy,” Kropelnicki said.
Year-to-Date Results
For the six-month period ended June 30, 2023, net loss attributable to Group was $12.7 million or $0.23 loss per diluted common share, compared to net income attributable to Group of $20.6 million or $0.38 earnings per diluted common share for the six-month period ended June 30, 2022. Results for the six-month period ended June 30, 2023 reflect the impact of the delayed proposed decision from the CPUC on Cal Water’s pending 2021 GRC. We currently estimate the adverse impact of the delayed decision on the six-month period ended June 30, 2023 operating revenue to be between approximately $43.0 million and $63.0 million, which is based on the current positions of the parties to the 2021 GRC Filing and consumption driven regulatory mechanisms.
Operating revenue was $325.1 million for the six-month period ended June 30, 2023, compared to $379.2 million for the same period in 2022. The $54.1 million, or 14.3%, revenue decrease was primarily due to a $21.8 million increase in revenue deferral, a $15.2 million decrease in WRAM and MCBA revenue, and a $22.9 million decrease in customer usage, which was partially offset by rate increases in California of $5.0 million. The increase in revenue deferral was accompanied by a $17.8 million increase in cost deferral.
Operating expenses for the six-month period ended June 30, 2023 were $326.7 million, compared to $342.8 million in 2022, a decrease of $16.0 million or 4.7%. Other operations expenses for the six-month period ended June 30, 2023 were $42.4 million, compared to $55.3 million in 2022, a decrease of 23.2%, or $12.8 million. The decrease was primarily attributed to the deferral of $17.8 million in costs related to the revenue deferral. Water production costs decreased $6.6 million, or 5.0%, to $125.9 million in 2023 compared to $132.4 million in 2022. The decrease in water production costs was primarily attributable to a 9.7% decrease in customer usage. In addition, income taxes decreased $5.4 million due to a reduction in net operating income. These decreases were partially offset by increases in administrative and general expenses of $4.9 million, depreciation and amortization of $2.2 million, and property and other taxes of $1.5 million.
Other income and expenses were $13.4 million for the six-month period ended June 30, 2023, an increase of $7.8 million, or 138.3%, over the same period in 2022. The increase was primarily due to an increase in unrealized gains on certain non-qualified benefit plan investments of $9.8 million, partially offset by a $2.7 million decrease related to a gain on company owned life insurance recorded in 2022.
Net interest expense for the six-month period ended June 30, 2023 increased $2.8 million, or 12.6%, to $24.7 million as compared to the same period in 2022, primarily due to an increase in short-term borrowing rates and higher outstanding line of credit balances.
Liquidity and Financing
Group maintained $89.7 million of cash as of June 30, 2023, of which $34.1 million was classified as restricted, and had additional short-term borrowing capacity of $470.0 million, subject to meeting the borrowing conditions on the Group and Cal Water line of credit facilities. Group’s At-the-Market equity program increased cash by $112.7 million during the first six months of 2023. Group’s aged accounts receivable past due more than 60 days decreased from $17.9 million as of March 31, 2023 to $13.1 million as of June 30, 2023. In 2022, Cal Water began working with an outside service, PromisePay, to provide customers with flexible payment plans to help them pay delinquent bills. Cal Water collected $1.0 million from PromisePay and currently have PromisePay commitments of $2.6 million. Also, the State of California extended its arrearage program to help customers struggling to pay monthly water bills. The program covers delinquent customer balances sixty days past due or written-off during the period from June 16, 2021 to December 31, 2022. Cal Water will file an application with the State Water Resource Control Board to request funds at the end of Q3 2023.
On June 29, 2023, the CPUC approved our COC proceeding with an ROE of 9.05%, which is expected to increase to 9.57% on July 31, 2023 based on our June 30, 2023 WCCM filing. Additionally, our equity structure and WCCM remained unchanged. The next potential WCCM adjustment request would, if triggered, be filed in October 2023 for the WCCM period from October 1, 2022 to September 30, 2023.
Group invested $177.2 million in infrastructure improvements during the six-month period ended June 30, 2023 which was a 22.3% increase from the same period last year. Cal Water proposed to the CPUC spending $1.0 billion on new capital projects in 2022-2024. We evaluate new capital project expenditures in California in the context of the pending GRC filing and these may change as the case moves forward.
On July 26, 2023, the Board of Directors approved a quarterly cash dividend of $0.26 per share of common stock.
Other Information
All stockholders and interested investors are invited to attend the conference call on July 27, 2023 at 8:00 a.m. PT (11:00 a.m. ET) by dialing 1-800-715-9871 or 1-646-307-1963 and keying in ID# 1254947, or you may access the live audio webcast at https://edge.media-server.com/mmc/p/jietaah9. Please join at least 15 minutes in advance to ensure a timely connection to the call. A replay of the call will be available from 3:00 p.m. ET on Thursday, July 27, 2023 through Monday, September 25, 2023, at 1-800-770-2030 or 1-609-800-9909, ID# 1254947, or by accessing the webcast above. The call will be hosted by President and Chief Executive Officer Martin A. Kropelnicki, Vice President and Chief Financial Officer David B. Healey, and Vice President, Rates and Regulatory Affairs, Greg A. Milleman. Prior to the call, Cal Water will furnish a slide presentation on its website at 9:00 a.m. ET.
About California Water Service Group
California Water Service Group is the parent company of regulated utilities California Water Service, Hawaii Water Service, New Mexico Water Service, and Washington Water Service, as well as Texas Water Service, a utility holding company. Together, these companies provide regulated and non-regulated water and wastewater service to more than 2.1 million people in California, Hawaii, New Mexico, Washington, and Texas. California Water Service Group’s common stock trades on the New York Stock Exchange under the symbol “CWT.” Additional information is available online at www.calwatergroup.com.
This news release contains forward-looking statements within the meaning established by the Private Securities Litigation Reform Act of 1995 ("PSLRA"). The forward-looking statements are intended to qualify under provisions of the federal securities laws for "safe harbor" treatment established by the PSLRA. Forward-looking statements in this news release are based on currently available information, expectations, estimates, assumptions and projections, and our management’s beliefs, assumptions, judgments and expectations about us, the water utility industry and general economic conditions. These statements are not statements of historical fact. When used in our documents, statements that are not historical in nature, including words like will, would, expects, intends, plans, believes, may, could, estimates, assumes, anticipates, projects, progress, predicts, hopes, targets, forecasts, should, seeks or variations of these words or similar expressions are intended to identify forward-looking statements. Examples of forward-looking statements in this news release include, but are not limited to, statements describing future rates, expectations regarding the 2021 GRC filing and the regulatory process and the estimated impacts related thereto, and proposed capital expenditures. Forward-looking statements are not guarantees of future performance. They are based on numerous assumptions that we believe are reasonable, but they are open to a wide range of uncertainties and business risks. Consequently, actual results may vary materially from what is contained in a forward-looking statement. Factors that may cause actual results to be different than those expected or anticipated include, but are not limited to: the impact of the ongoing COVID-19 pandemic and related public health measures; our ability to invest or apply the proceeds from the issuance of common stock in an accretive manner; governmental and regulatory commissions' decisions, including decisions on proper disposition of property; consequences of eminent domain actions relating to our water systems; changes in regulatory commissions' policies and procedures, such as the CPUC’s decision in 2020 to preclude companies from proposing fully decoupled WRAMs in their next GRC filing (which impacted our 2021 GRC filing related to our operations commencing in 2023); the outcome and timeliness of regulatory commissions' actions concerning rate relief and other matters, including with respect to our 2021 GRC filing; increased risk of inverse condemnation losses as a result of climate change and drought; our ability to renew leases to operate water systems owned by others on beneficial terms; changes in California State Water Resources Control Board water quality standards; changes in environmental compliance and water quality requirements; electric power interruptions, especially as a result of Public Safety Power Shutoff (PSPS) programs; housing and customer growth; the impact of opposition to rate increases; our ability to recover costs; availability of water supplies; issues with the implementation, maintenance or security of our information technology systems; civil disturbances or terrorist threats or acts; the adequacy of our efforts to mitigate physical and cyber security risks and threats; the ability of our enterprise risk management processes to identify or address risks adequately; labor relations matters as we negotiate with the unions; changes in customer water use patterns and the effects of conservation, including as a result of drought conditions; our ability to complete, in a timely manner or at all, successfully integrate and achieve anticipated benefits from announced acquisitions; the impact of weather, climate change, natural disasters, and actual or threatened public health emergencies, including disease outbreaks, on our operations, water quality, water availability, water sales and operating results and the adequacy of our emergency preparedness; restrictive covenants in or changes to the credit ratings on our current or future debt that could increase our financing costs or affect our ability to borrow, make payments on debt or pay dividends; risks associated with expanding our business and operations geographically; the impact of stagnating or worsening business and economic conditions, including inflationary pressures, general economic slowdown or a recession, increasing interest rates, and changes in monetary policy; the impact of market conditions and volatility on unrealized gains or losses on our non-qualified benefit plan investments and our operating results; the impact of weather and timing of meter reads on our accrued unbilled revenue; and other risks and unforeseen events described in our SEC filings. When considering forward-looking statements, you should keep in mind the cautionary statements included in this paragraph, as well as the Annual 10-K, Quarterly 10-Q, and other reports filed from time-to-time with the Securities and Exchange Commission (SEC). We are not under any obligation, and we expressly disclaim any obligation to update or alter any forward-looking statements, whether as a result of new information, future events or otherwise.
##
Contact
David Healey
(408) 367-8200 (analysts)
Shannon Dean
(408) 367-8243 (media)
| CALIFORNIA WATER SERVICE GROUP | ||||||||
| CONDENSED CONSOLIDATED BALANCE SHEETS | ||||||||
| Unaudited | ||||||||
| (In thousands, except per share data) | June 30 | December 31 | ||||||
| 2023 | 2022 | |||||||
| ASSETS | ||||||||
| Utility plant: | ||||||||
| Utility plant | $ | 4,715,310 | $ | 4,536,272 | ||||
| Less accumulated depreciation and amortization | (1,537,580 | ) | (1,477,402 | ) | ||||
| Net utility plant | 3,177,730 | 3,058,870 | ||||||
| Current assets: | ||||||||
| Cash and cash equivalents | 55,595 | 62,100 | ||||||
| Restricted cash | 34,069 | 22,925 | ||||||
| Receivables: | ||||||||
| Customers,net | 62,978 | 55,079 | ||||||
| Regulatory balancing accounts | 61,333 | 66,826 | ||||||
| Other, net | 22,664 | 20,932 | ||||||
| Unbilled revenue, net | 39,171 | 33,140 | ||||||
| Materials and supplies | 13,862 | 12,564 | ||||||
| Taxes, prepaid expenses, and other assets | 22,184 | 21,969 | ||||||
| Total current assets | 311,856 | 295,535 | ||||||
| Other assets: | ||||||||
| Regulatory assets | 276,592 | 283,620 | ||||||
| Goodwill | 36,814 | 36,814 | ||||||
| Other assets | 187,209 | 175,913 | ||||||
| Total other assets | 500,615 | 496,347 | ||||||
| TOTAL ASSETS | $ | 3,990,201 | $ | 3,850,752 | ||||
| CAPITALIZATION AND LIABILITIES | ||||||||
| Capitalization: | ||||||||
| Common stock, $.01 par value; 136,000 shares authorized, 57,702 and 55,598 outstanding in 2023 and 2022, respectively | $ | 577 | $ | 556 | ||||
| Additional paid-in capital | 873,923 | 760,336 | ||||||
| Retained earnings | 515,016 | 556,698 | ||||||
| Noncontrolling interests | 4,451 | 4,804 | ||||||
| Total equity | 1,393,967 | 1,322,394 | ||||||
| Long-term debt, net | 1,052,070 | 1,052,487 | ||||||
| Total capitalization | 2,446,037 | 2,374,881 | ||||||
| Current liabilities: | ||||||||
| Current maturities of long-term debt, net | 1,825 | 3,310 | ||||||
| Short-term borrowings | 130,000 | 70,000 | ||||||
| Accounts payable | 138,272 | 140,986 | ||||||
| Regulatory balancing accounts | 29,277 | 12,240 | ||||||
| Accrued interest | 7,164 | 6,490 | ||||||
| Accrued expenses and other liabilities | 56,119 | 61,624 | ||||||
| Total current liabilities | 362,657 | 294,650 | ||||||
| Deferred income taxes | 327,856 | 330,251 | ||||||
| Pension | 80,008 | 78,443 | ||||||
| Regulatory liabilities and other | 283,496 | 287,294 | ||||||
| Advances for construction | 200,213 | 199,832 | ||||||
| Contributions in aid of construction | 289,934 | 285,401 | ||||||
| Commitments and contingencies | ||||||||
| TOTAL CAPITALIZATION AND LIABILITIES | $ | 3,990,201 | $ | 3,850,752 | ||||
| CALIFORNIA WATER SERVICE GROUP | ||||||||
| CONDENSED CONSOLIDATED STATEMENTS OF OPERATIONS | ||||||||
| Unaudited | ||||||||
| (In thousands, except per share data) | ||||||||
| For the Three Months ended: | ||||||||
| June 30 | June 30 | |||||||
| 2023 | 2022 | |||||||
| Operating revenue | $ | 194,044 | $ | 206,194 | ||||
| Operating expenses: | ||||||||
| Operations: | ||||||||
| Water production costs | 70,867 | 70,907 | ||||||
| Administrative and general | 34,975 | 32,686 | ||||||
| Other operations | 25,823 | 29,417 | ||||||
| Maintenance | 7,155 | 7,615 | ||||||
| Depreciation and amortization | 29,824 | 28,773 | ||||||
| Income tax expense | 329 | 1,454 | ||||||
| Property and other taxes | 9,122 | 8,053 | ||||||
| Total operating expenses | 178,095 | 178,905 | ||||||
| Net operating income | 15,949 | 27,289 | ||||||
| Other income and expenses: | ||||||||
| Non-regulated revenue | 4,485 | 7,002 | ||||||
| Non-regulated expenses | (2,957 | ) | (8,541 | ) | ||||
| Other components of net periodic benefit credit | 4,756 | 3,765 | ||||||
| Allowance for equity funds used during construction | 1,355 | 1,042 | ||||||
| Income tax expense on other income and expenses | (1,445 | ) | (345 | ) | ||||
| Net other income | 6,194 | 2,923 | ||||||
| Interest expense: | ||||||||
| Interest expense | 13,491 | 11,586 | ||||||
| Allowance for borrowed funds used during construction | (795 | ) | (589 | ) | ||||
| Net interest expense | 12,696 | 10,997 | ||||||
| Net income | 9,447 | 19,215 | ||||||
| Net loss attributable to noncontrolling interests | (109 | ) | (269 | ) | ||||
| Net income attributable to California Water Service Group | $ | 9,556 | $ | 19,484 | ||||
| Earnings per share of common stock | ||||||||
| Basic | $ | 0.17 | $ | 0.36 | ||||
| Diluted | $ | 0.17 | $ | 0.36 | ||||
| Weighted average shares outstanding | ||||||||
| Basic | 56,692 | 54,007 | ||||||
| Diluted | 56,730 | 54,042 | ||||||
| Dividends per share of common stock | $ | 0.26 | $ | 0.25 | ||||
| CALIFORNIA WATER SERVICE GROUP | ||||||||
| CONDENSED CONSOLIDATED STATEMENTS OF OPERATIONS | ||||||||
| Unaudited | ||||||||
| (In thousands, except per share data) | ||||||||
| For the Six Months ended: | ||||||||
| June 30 | June 30 | |||||||
| 2023 | 2022 | |||||||
| Operating revenue | $ | 325,144 | $ | 379,187 | ||||
| Operating expenses: | ||||||||
| Operations: | ||||||||
| Water production costs | 125,875 | 132,445 | ||||||
| Administrative and general | 70,961 | 66,097 | ||||||
| Other operations | 42,427 | 55,269 | ||||||
| Maintenance | 15,133 | 14,956 | ||||||
| Depreciation and amortization | 59,739 | 57,543 | ||||||
| Income tax (benefit) expense | (5,315 | ) | 37 | |||||
| Property and other taxes | 17,899 | 16,413 | ||||||
| Total operating expenses | 326,719 | 342,760 | ||||||
| Net operating (loss) income | (1,575 | ) | 36,427 | |||||
| Other income and expenses: | ||||||||
| Non-regulated revenue | 9,108 | 12,199 | ||||||
| Non-regulated expenses | (5,232 | ) | (15,527 | ) | ||||
| Other components of net periodic benefit credit | 9,977 | 7,779 | ||||||
| Allowance for equity funds used during construction | 2,759 | 2,017 | ||||||
| Income tax expense on other income and expenses | (3,239 | ) | (857 | ) | ||||
| Net other income | 13,373 | 5,611 | ||||||
| Interest expense: | ||||||||
| Interest expense | 26,309 | 23,081 | ||||||
| Allowance for borrowed funds used during construction | (1,624 | ) | (1,152 | ) | ||||
| Net interest expense | 24,685 | 21,929 | ||||||
| Net (loss) income | (12,887 | ) | 20,109 | |||||
| Net loss attributable to noncontrolling interests | (232 | ) | (461 | ) | ||||
| Net (loss) income attributable to California Water Service Group | $ | (12,655 | ) | $ | 20,570 | |||
| (Loss) earnings per share of common stock: | ||||||||
| Basic | $ | (0.23 | ) | $ | 0.38 | |||
| Diluted | $ | (0.23 | ) | $ | 0.38 | |||
| Weighted average shares outstanding | ||||||||
| Basic | 56,182 | 53,870 | ||||||
| Diluted | 56,182 | 53,918 | ||||||
| Dividends per share of common stock | $ | 0.52 | $ | 0.50 | ||||
Exhibit 99.2
0 Second Quarter 2023 Results Presentation July 27, 2023
INVESTOR RELATIONS Forward - Looking Statements This presentation contains forward - looking statements within the meaning established by the Private Securities Litigation Reform Act of 1995 ("PSLRA"). The forward - looking statements are intended to qualify under provisions of the federal securities laws for "safe harbor" treatment established by th e PSLRA. Forward - looking statements in this presentation are based on currently available information, expectations, estimates, assumptions and projections, and our management’s beli ef s, assumptions, judgments and expectations about us, the water utility industry and general economic conditions. These statements are not statements of his tor ical fact. When used in our documents, statements that are not historical in nature, including words like will, would, expects, intends, plans, believes, may, could , e stimates, assumes, anticipates, projects, progress, predicts, hopes, targets, forecasts, should, seeks or variations of these words or similar expressions are intended to identi fy forward - looking statements. Examples of forward - looking statements in this presentation include, but are not limited to, statements describing future rates, effects of DREMA, IRMA, and MWRAM, completion of pending acquisitions, estimated investments and depreciation, rate base estimates, expectations regarding the 2021 GRC filing and the regulatory process and the estimated impacts related thereto, and proposed capital expenditures. Forward - looking statements are not guarantees of future performance. They ar e based on numerous assumptions that we believe are reasonable, but they are open to a wide range of uncertainties and business risks. Consequently, actual results m ay vary materially from what is contained in a forward - looking statement. Factors that may cause actual results to be different than those expected or anticipated include, but are not limited to: the impact of the ongoing COVID - 19 pandemic and related public health measures; our ability to invest or apply the proceeds from the issuance of common st ock in an accretive manner; governmental and regulatory commissions' decisions, including decisions on proper disposition of property; consequences of eminent domain acti ons relating to our water systems; changes in regulatory commissions' policies and procedures , such as the CPUC’s decision in 2020 to preclude companies from proposing fully decoupled WRAMs in their next GRC filing (which impacted our 2021 GRC filing related to our operations commencing in 2023) ; the outcome and timeliness of regulatory commissions' actions concerning rate relief and other matters, including with respect to our 2021 GRC filing; increased risk of inverse condemnation losses as a result of cl ima te change and drought; our ability to renew leases to operate water systems owned by others on beneficial terms; changes in California State Water Resources Control Board water qu ality standards; changes in environmental compliance and water quality requirements; electric power interruptions, especially as a result of Public Safety Power Shutof f ( PSPS) programs; housing and customer growth; the impact of opposition to rate increases; our ability to recover costs; availability of water supplies; issues with the impleme nta tion, maintenance or security of our information technology systems; civil disturbances or terrorist threats or acts; the adequacy of our efforts to mitigate physical and cy ber security risks and threats; the ability of our enterprise risk management processes to identify or address risks adequately; labor relations matters as we negotiate with the unions; c han ges in customer water use patterns and the effects of conservation, including as a result of drought conditions; our ability to complete, in a timely manner or at all, suc cessfully integrate and achieve anticipated benefits from announced acquisitions; the impact of weather, climate change, natural disasters, and actual or threatened public health em ergencies, including disease outbreaks, on our operations, water quality, water availability, water sales and operating results and the adequacy of our emergency preparedne ss; restrictive covenants in or changes to the credit ratings on our current or future debt that could increase our financing costs or affect our ability to borrow, make payments on debt or pay dividends; risks associated with expanding our business and operations geographically; the impact of stagnating or worsening business and economic conditions, in cluding inflationary pressures, general economic slowdown or a recession, increasing interest rates, and changes in monetary policy; the impact of market conditions and volatility on unrealized gains or losses on our non - qualified benefit plan investments and our operating results; the impact of weather and timing of meter reads on our accrued unbilled revenue; and other risks and unforeseen events described in our SEC filings. When considering forward - looking statements, you should keep in mind the caution ary statements included in this paragraph, as well as the Annual 10 - K, Quarterly 10 - Q, and other reports filed from time - to - time with the Securities and Exchange Commission ( SEC). We are not under any obligation, and we expressly disclaim any obligation to update or alter any forward - looking statements, whether as a result of new information, fut ure events or otherwise. 1 INVESTOR RELATIONS David Healey Vice President, CFO & Treasurer Greg Milleman Vice President, Rates & Regulatory Affairs Marty Kropelnicki President & CEO Today’s Participants 2
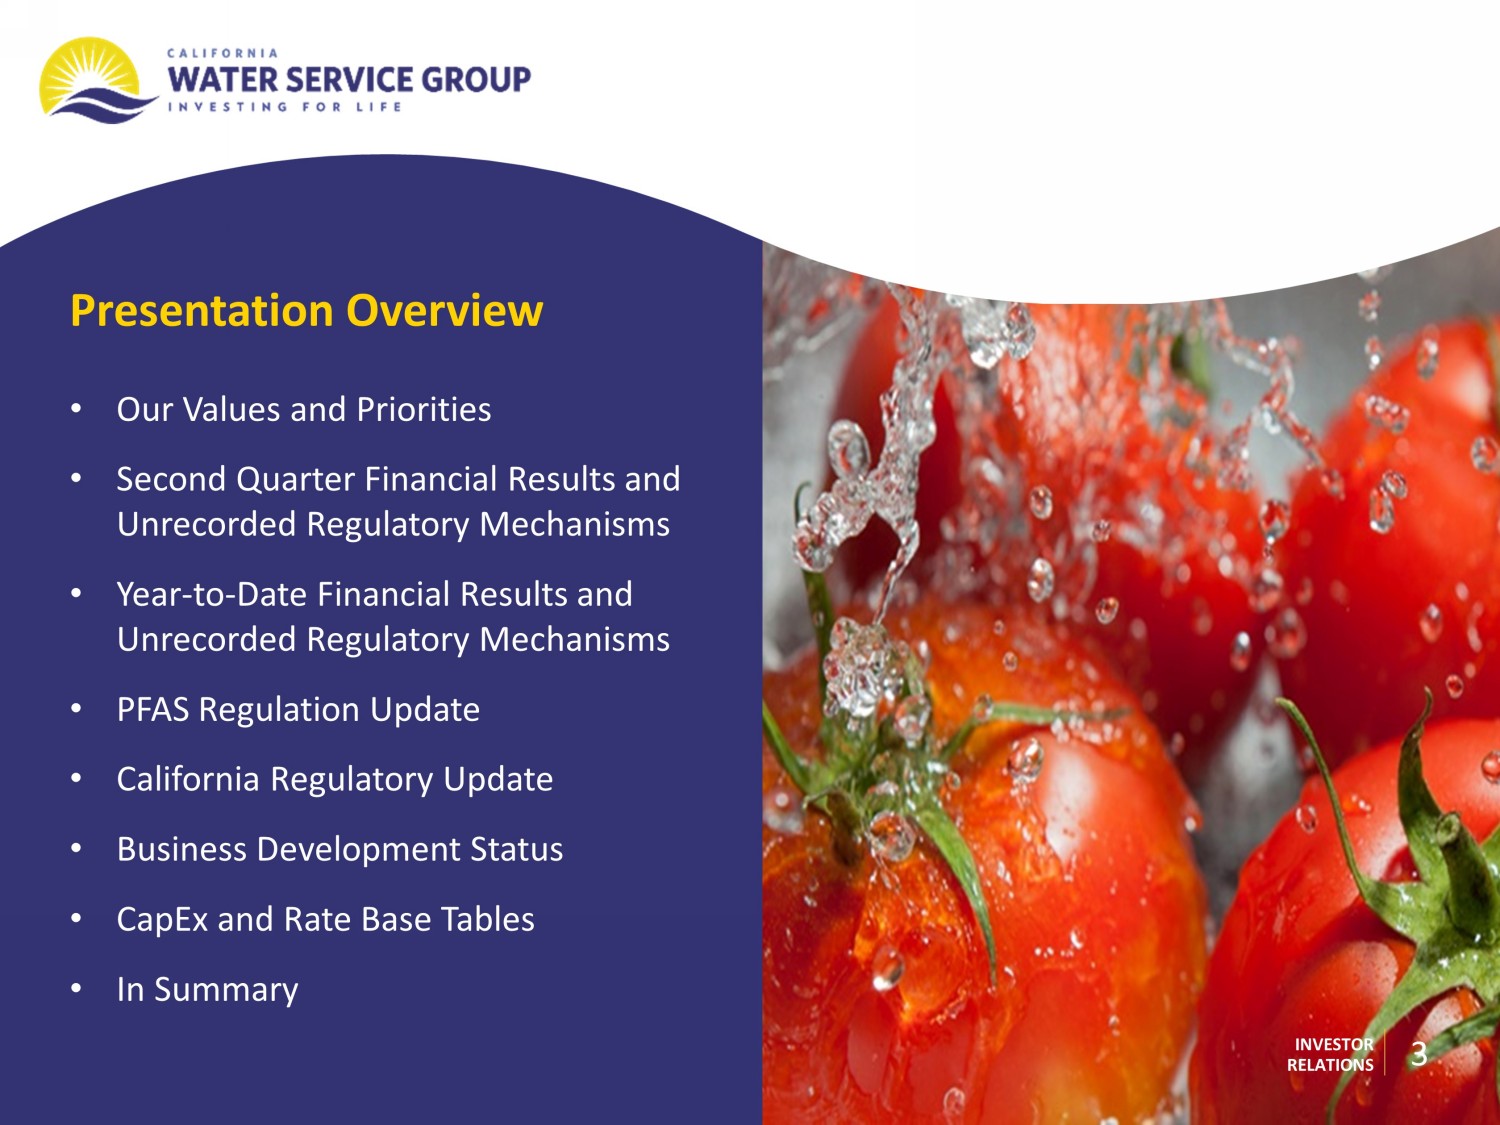
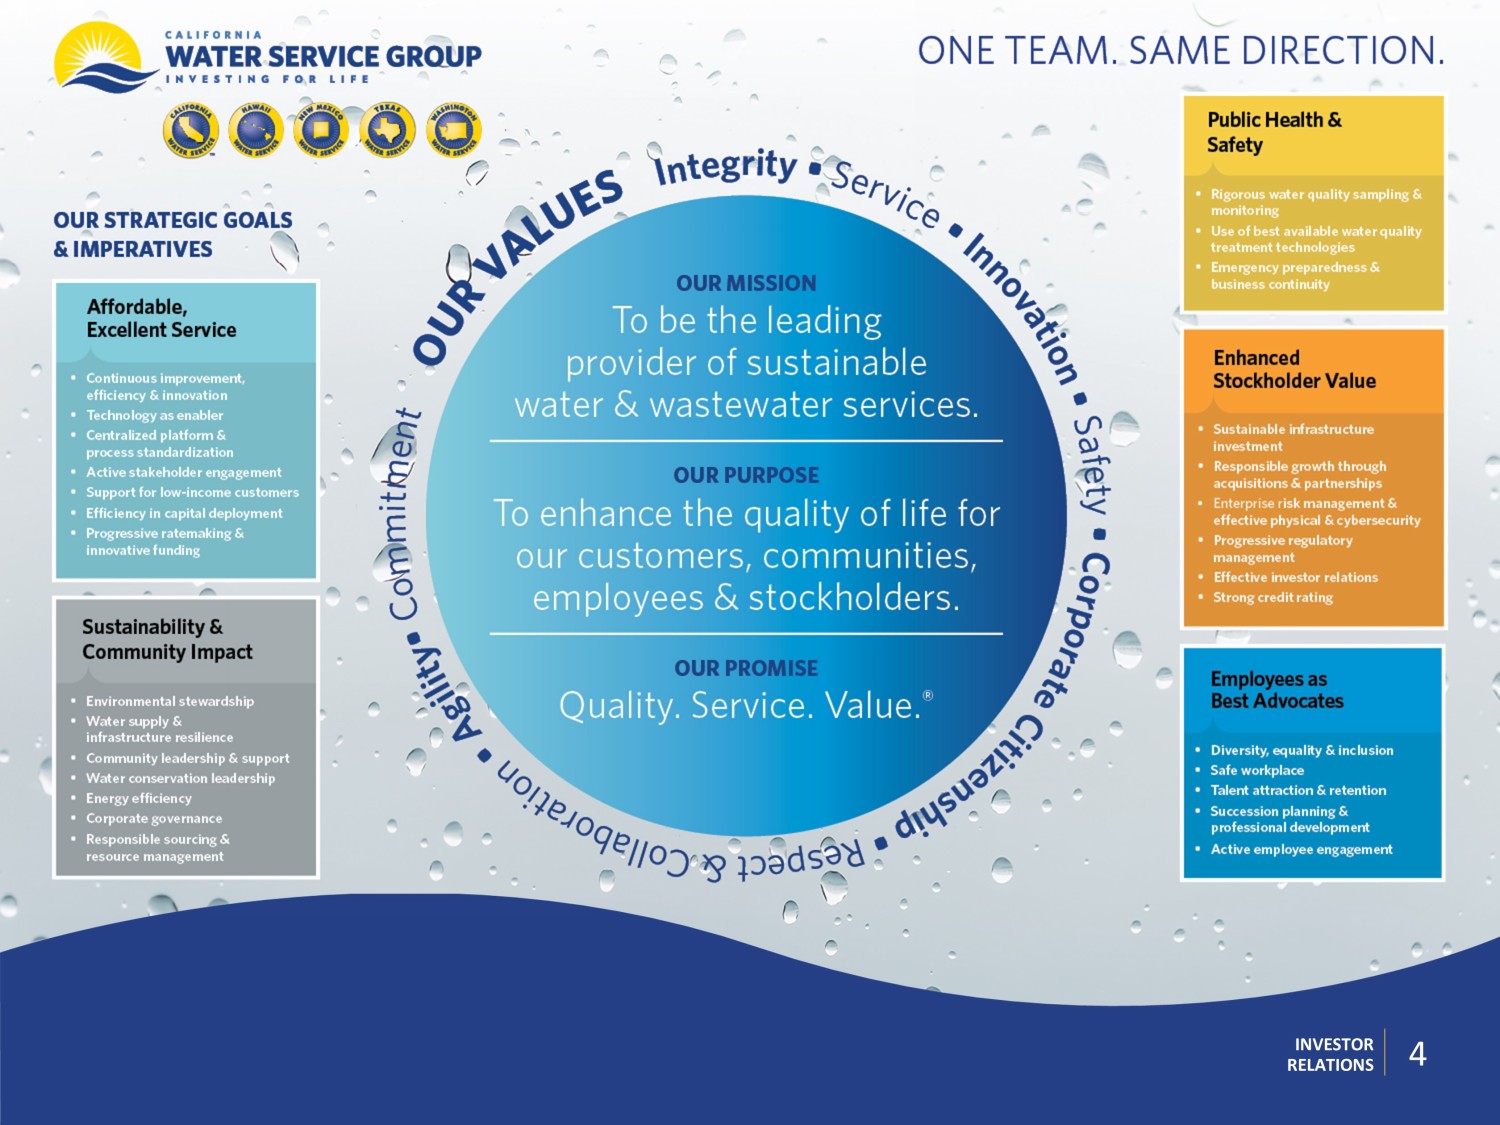
INVESTOR RELATIONS Presentation Overview • Our Values and Priorities • Second Quarter Financial Results and Unrecorded Regulatory Mechanisms • Year - to - Date Financial Results and Unrecorded Regulatory Mechanisms • PFAS Regulation Update • California Regulatory Update • Business Development Status • CapEx and Rate Base Tables • In Summary 3 4 BOARD UPDATE 4 BOARD UPDATE INVESTOR RELATIONS 4
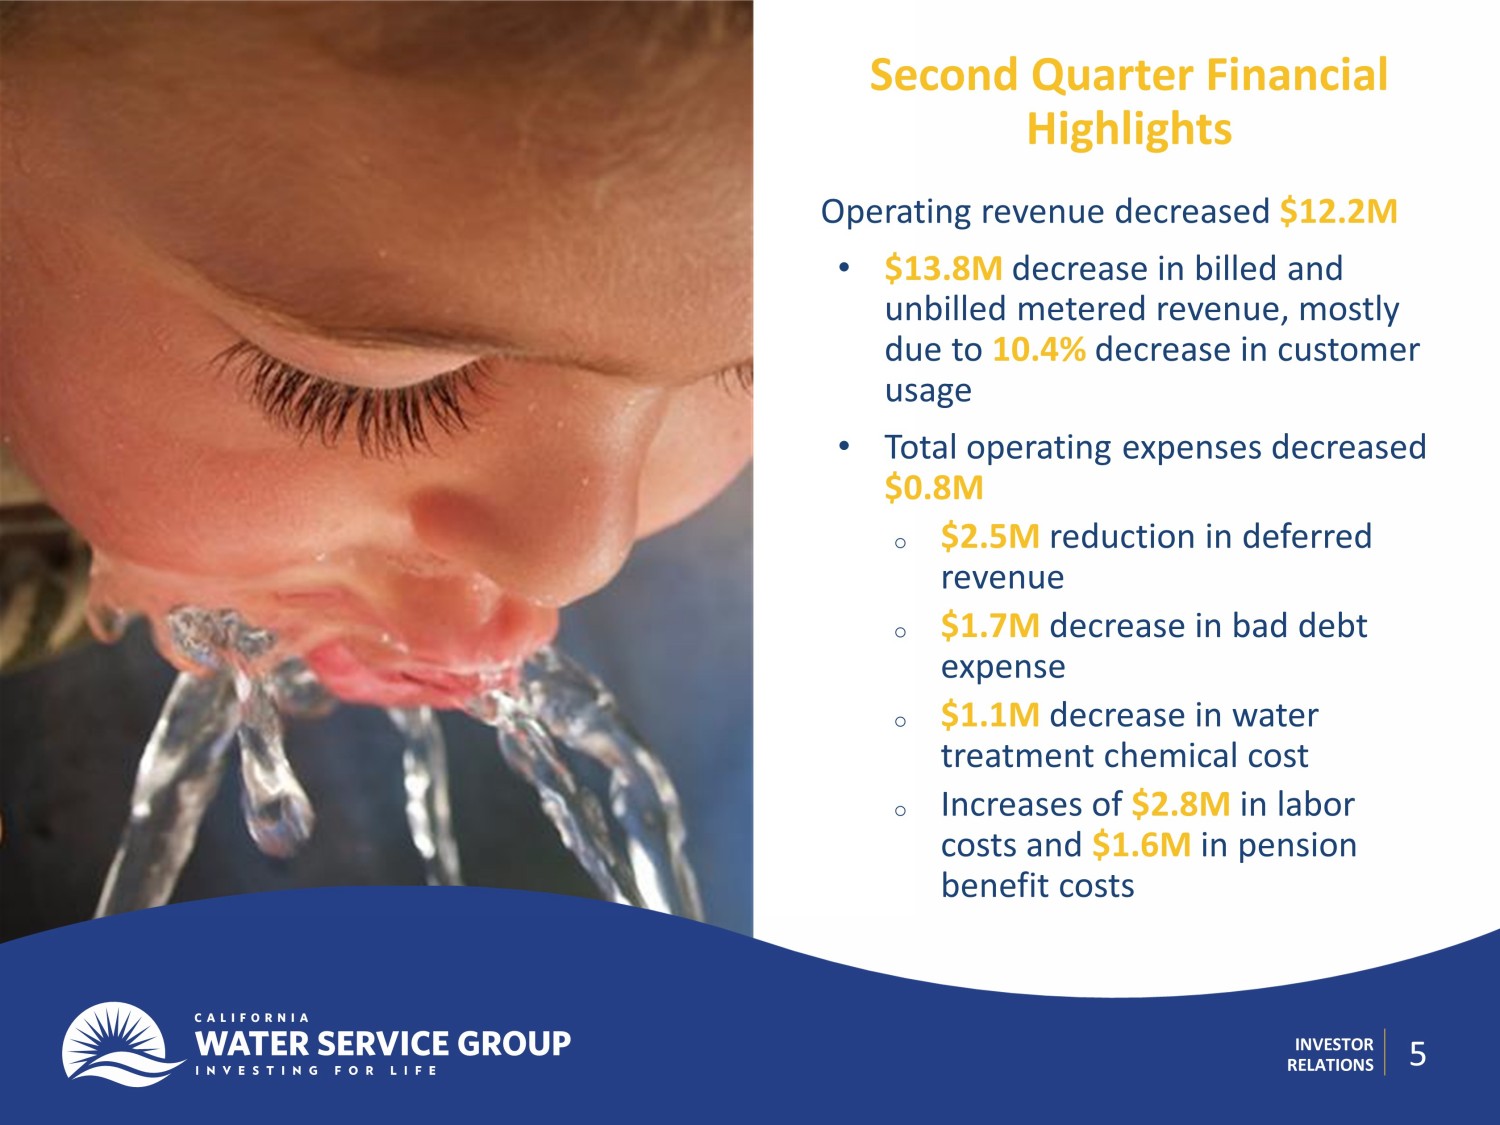
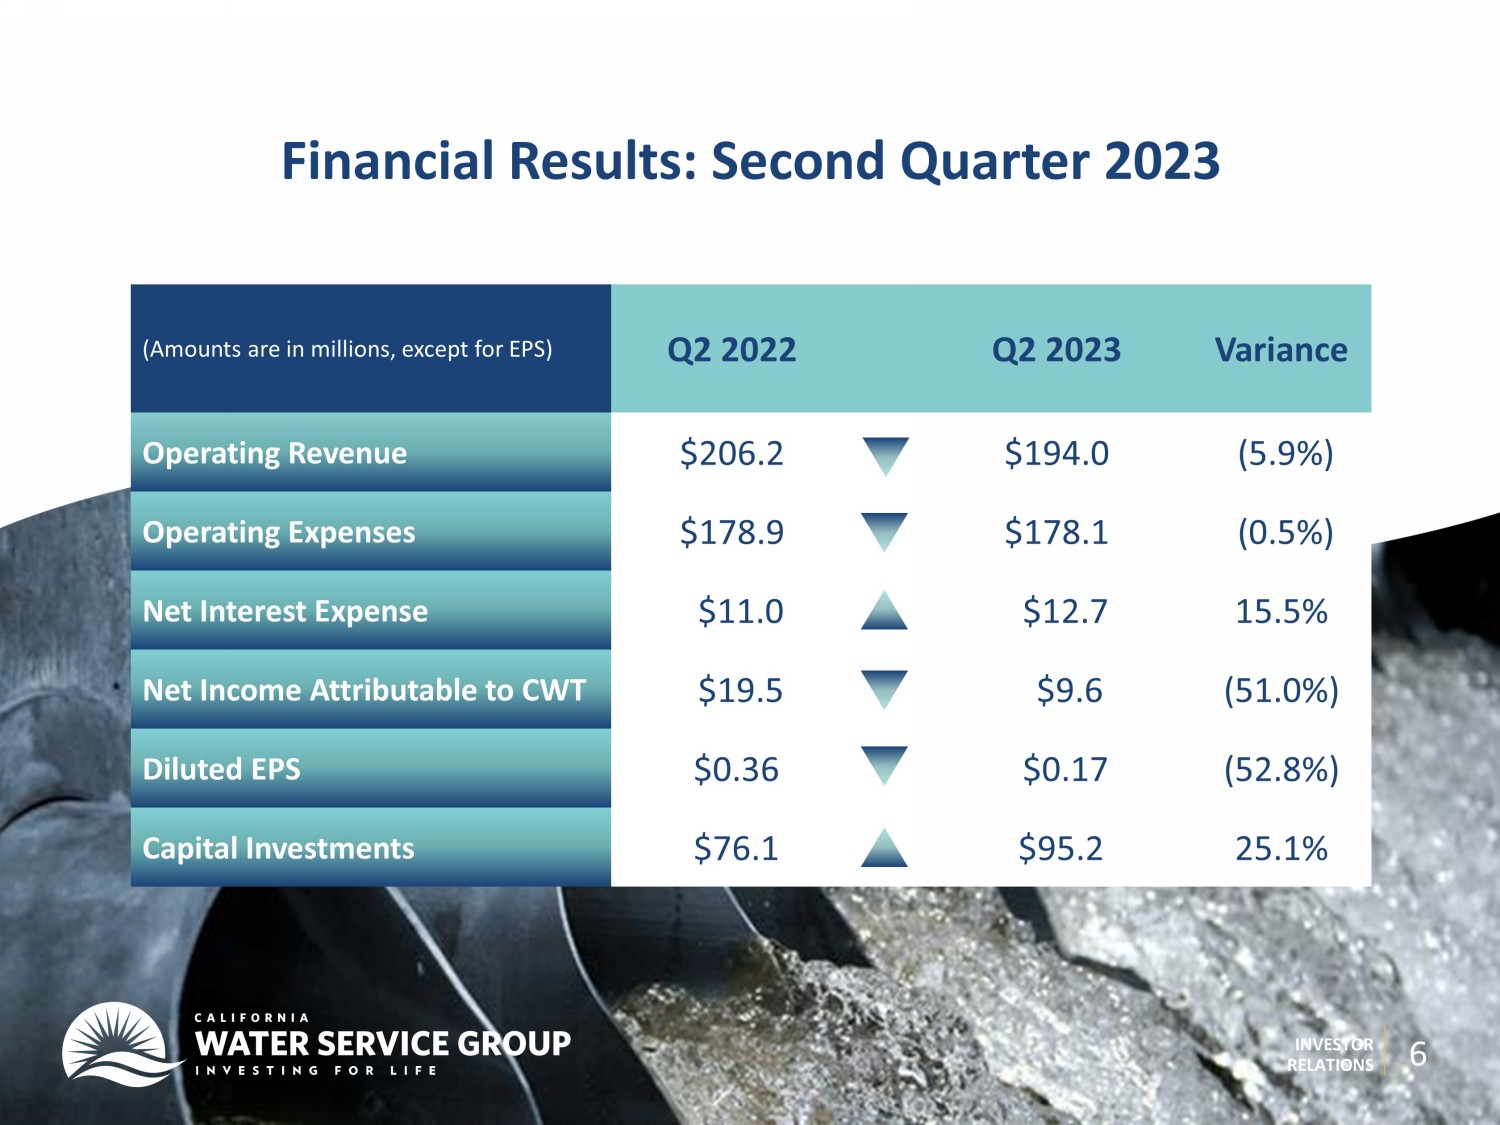
INVESTOR RELATIONS Second Quarter Financial Highlights 5 Operating revenue decreased $ 12.2M • $ 13.8M decrease in billed and unbilled metered revenue, mostly due to 10.4% decrease in customer usage • Total operating expenses decreased $ 0.8M o $2.5M reduction in deferred revenue o $1.7M decrease in bad debt expense o $1.1M decrease in water treatment chemical cost o Increases of $2.8M in labor costs and $1.6M in pension benefit costs INVESTOR RELATIONS (Amounts are in millions, except for EPS) Q2 2022 Q2 2023 Variance Operating Revenue $206.2 $194.0 (5.9%) Operating Expenses $178.9 $178.1 (0.5%) Net Interest Expense $11.0 $12.7 15.5% Net In come Attributable to CWT $19.5 $9.6 (51.0%) Diluted EPS $0.36 $0.17 (52.8%) Capital Investments $76.1 $95.2 25.1% Financial Results: Second Quarter 2023 6
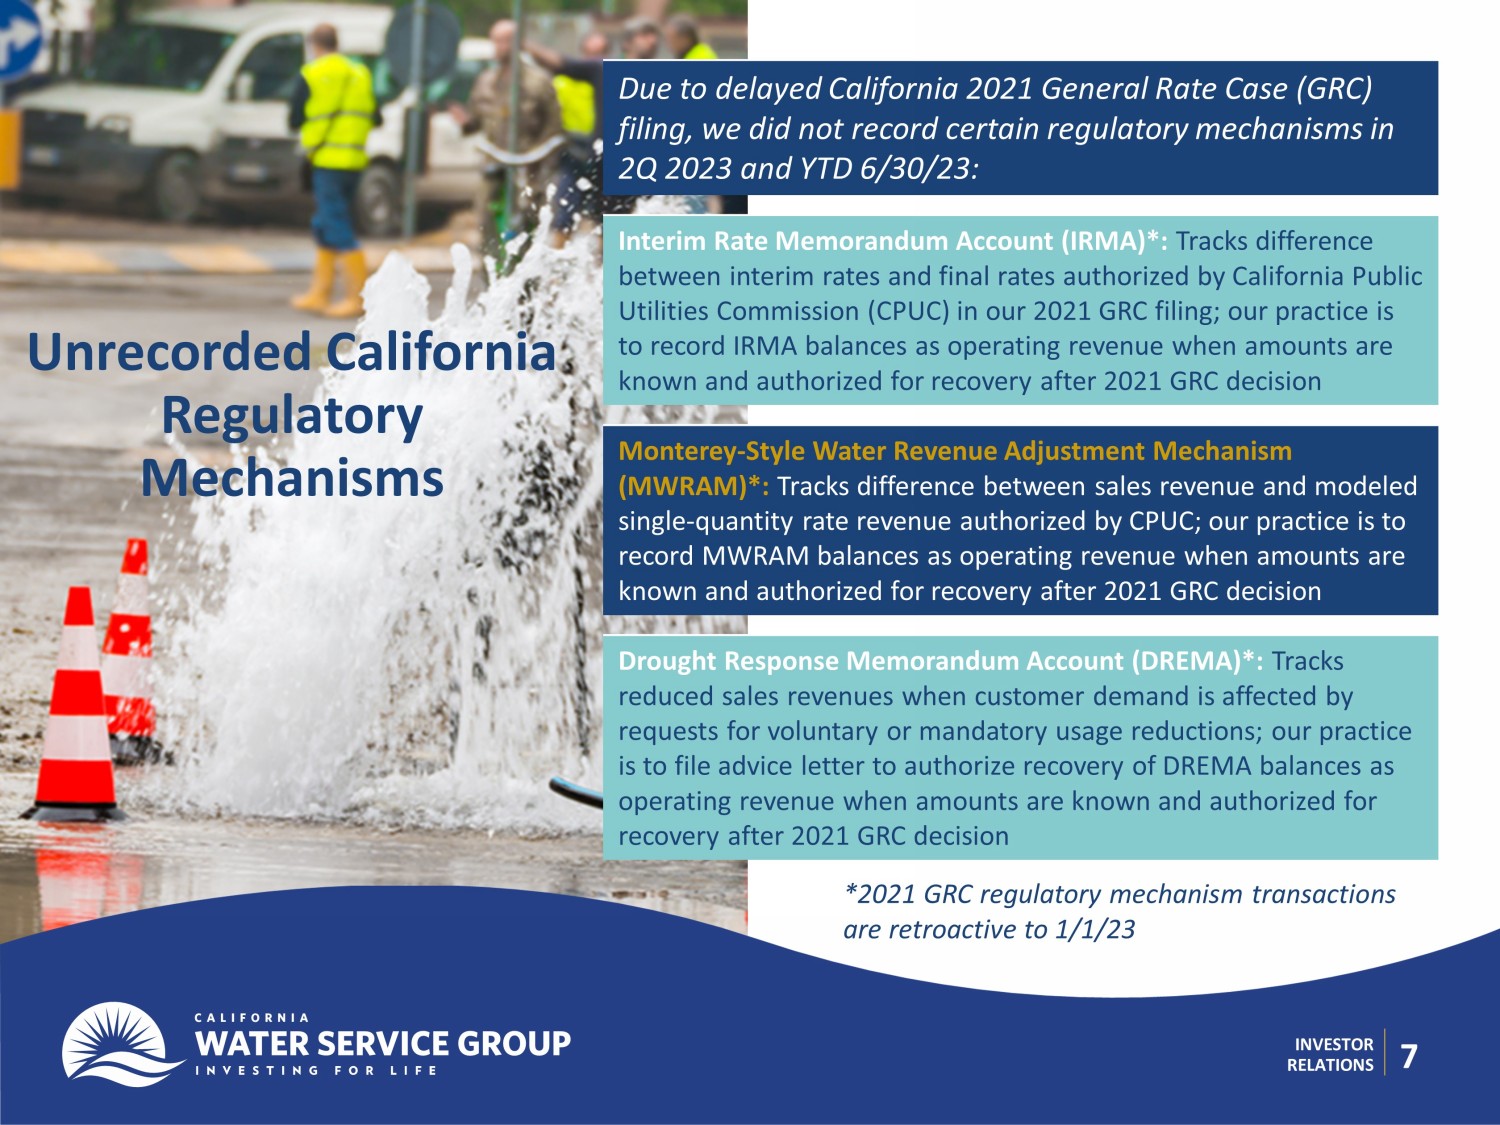
7 INVESTOR RELATIONS Unrecorded California Regulatory Mechanisms Due to delayed California 2021 General Rate Case ( GRC ) filing, we did not record certain regulatory mechanisms in 2Q 2023 and YTD 6/30/23: Interim Rate Memorandum Account (IRMA)*: Tracks difference between interim rates and final rates authorized by California Public Utilities Commission (CPUC) in our 2021 GRC filing; our practice is to record IRMA balances as operating revenue when amounts are known and authorized for recovery after 2021 GRC decision Monterey - Style Water Revenue Adjustment Mechanism ( MWRAM )*: Tracks difference between sales revenue and modeled single - quantity rate revenue authorized by CPUC; our practice is to record MWRAM balances as operating revenue when amounts are known and authorized for recovery after 2021 GRC decision Drought Response Memorandum Account ( DREMA )*: Tracks reduced sales revenues when customer demand is affected by requests for voluntary or mandatory usage reductions; our practice is to file advice letter to authorize recovery of DREMA balances as operating revenue when amounts are known and authorized for recovery after 2021 GRC decision *2021 GRC regulatory mechanism transactions are retroactive to 1/1/23 INVESTOR RELATIONS Based on current positions of parties to 2021 GRC filing, we estimated understatement of operating revenue during 2Q 2023 to be in $ 19M – $ 29M range ($0.28 to $0.43 EPS)*: Unrecorded California Regulatory M echanisms in Q2 2023 8 *IRMA value will depend on final 2021 GRC rates authorized for recovery.
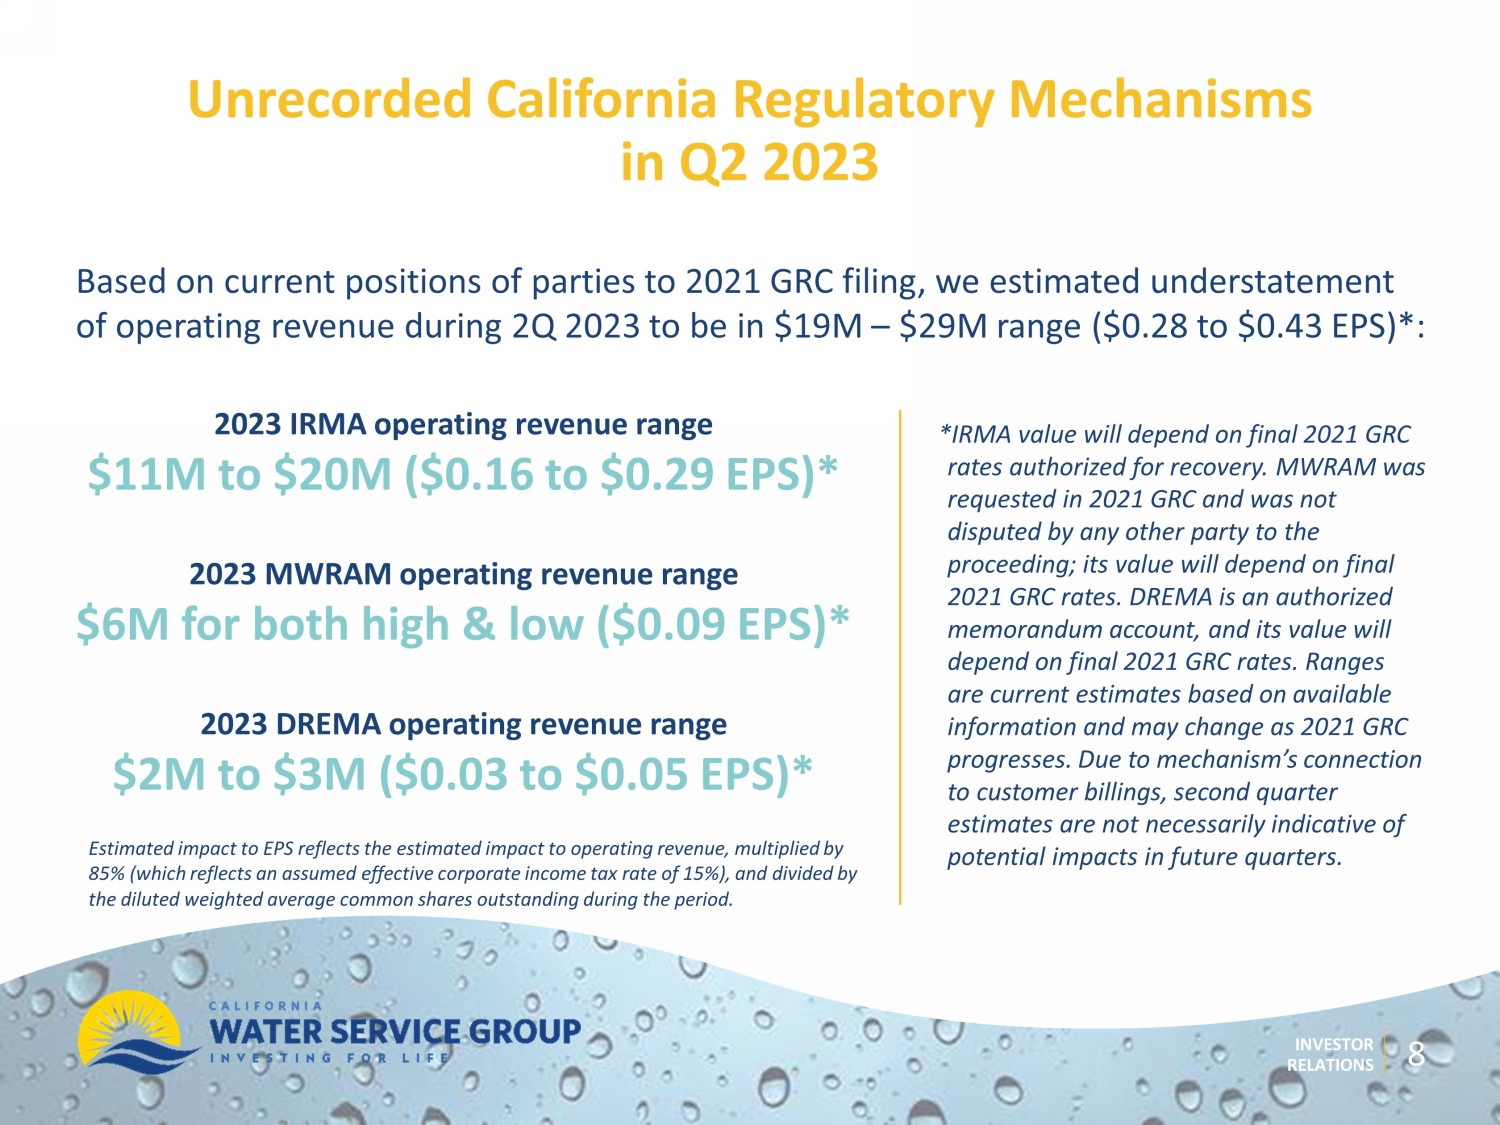
MWRAM was requested in 2021 GRC and was not disputed by any other party to the proceeding; its value will depend on final 2021 GRC rates. DREMA is an authorized memorandum account, and its value will depend on final 2021 GRC rates. Ranges are current estimates based on available information and may change as 2021 GRC progresses. Due to mechanism’s connection to customer billings, second quarter estimates are not necessarily indicative of potential impacts in future quarters. 2023 IRMA operating revenue range $ 11M to $ 20M ($0.16 to $0.29 EPS)* 2023 MWRAM operating revenue range $ 6M for both high & low ($0.09 EPS)* 2023 DREMA operating revenue range $ 2M to $3M ($0.03 to $0.05 EPS)* Estimated impact to EPS reflects the estimated impact to operating revenue, multiplied by 85% (which reflects an assumed effective corporate income tax rate of 15%), and divided by the diluted weighted average common shares outstanding during the period .
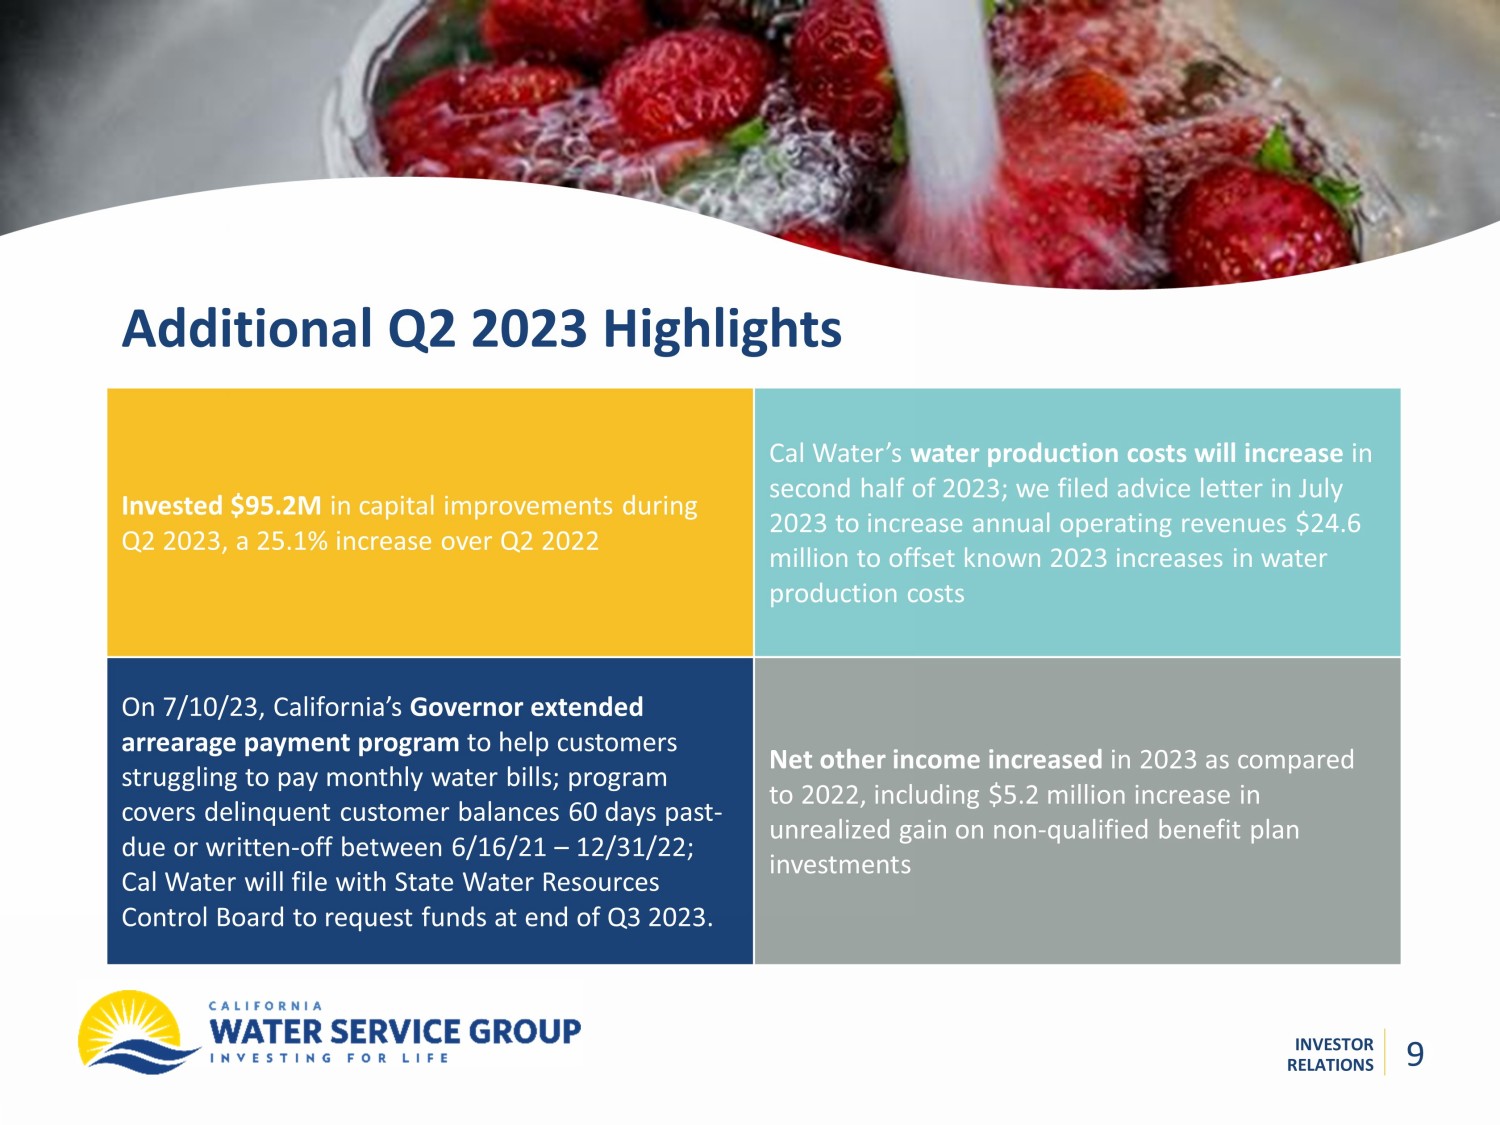
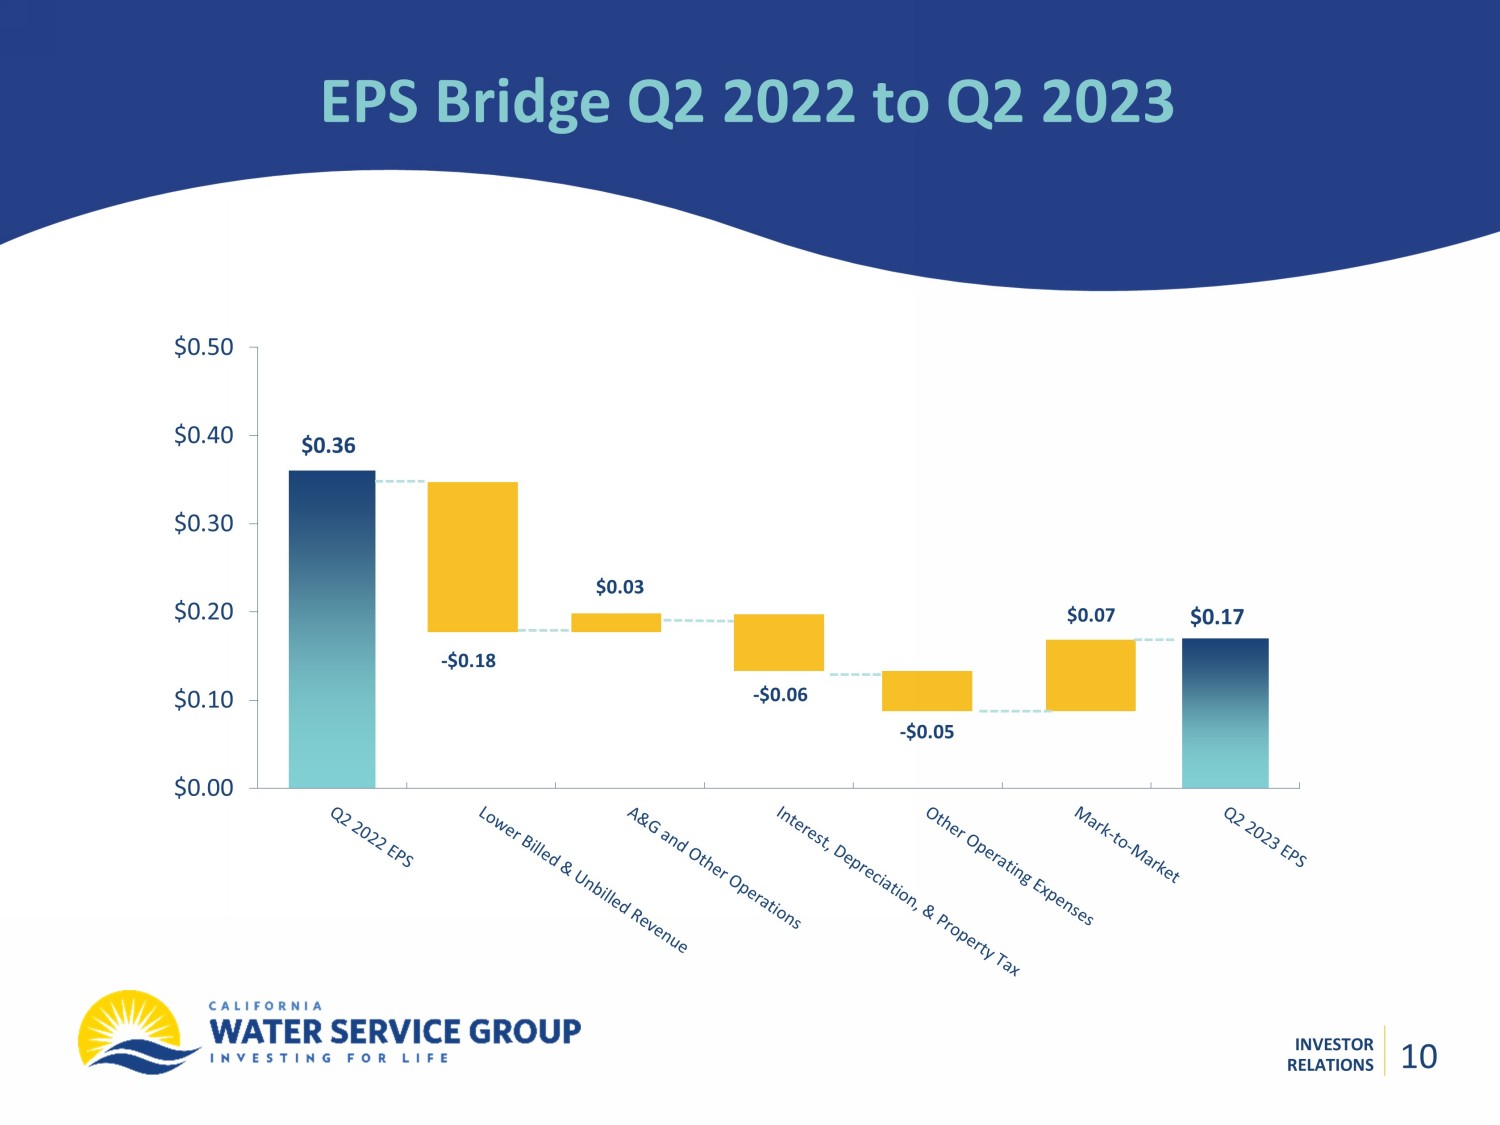
INVESTOR RELATIONS Additional Q 2 2023 Highlights 9 9 Invested $ 95.2M in capital improvements during Q2 2023, a 25.1% increase over Q2 2022 Cal Water’s water production costs will increase in second half of 2023; we filed advice letter in July 2023 to increase annual operating revenues $24.6 million to offset known 2023 increases in water production costs On 7/10/23, California’s Governor extended arrearage payment program to help customers struggling to pay monthly water bills; program covers delinquent customer balances 60 days past - due or written - off between 6/16/21 – 12/31/22; Cal Water will file with State Water Resources Control Board to request funds at end of Q3 2023. Net other income increased in 2023 as compared to 2022, including $5.2 million increase in unrealized gain on non - qualified benefit plan investments INVESTOR RELATIONS EPS Bridge Q2 2022 to Q2 2023 $0.00 $0.10 $0.20 $0.30 $0.40 $0.50 $0.07 - $0.06 $0.36 $0.03 - $0.18 $0.17 - $0.05 10
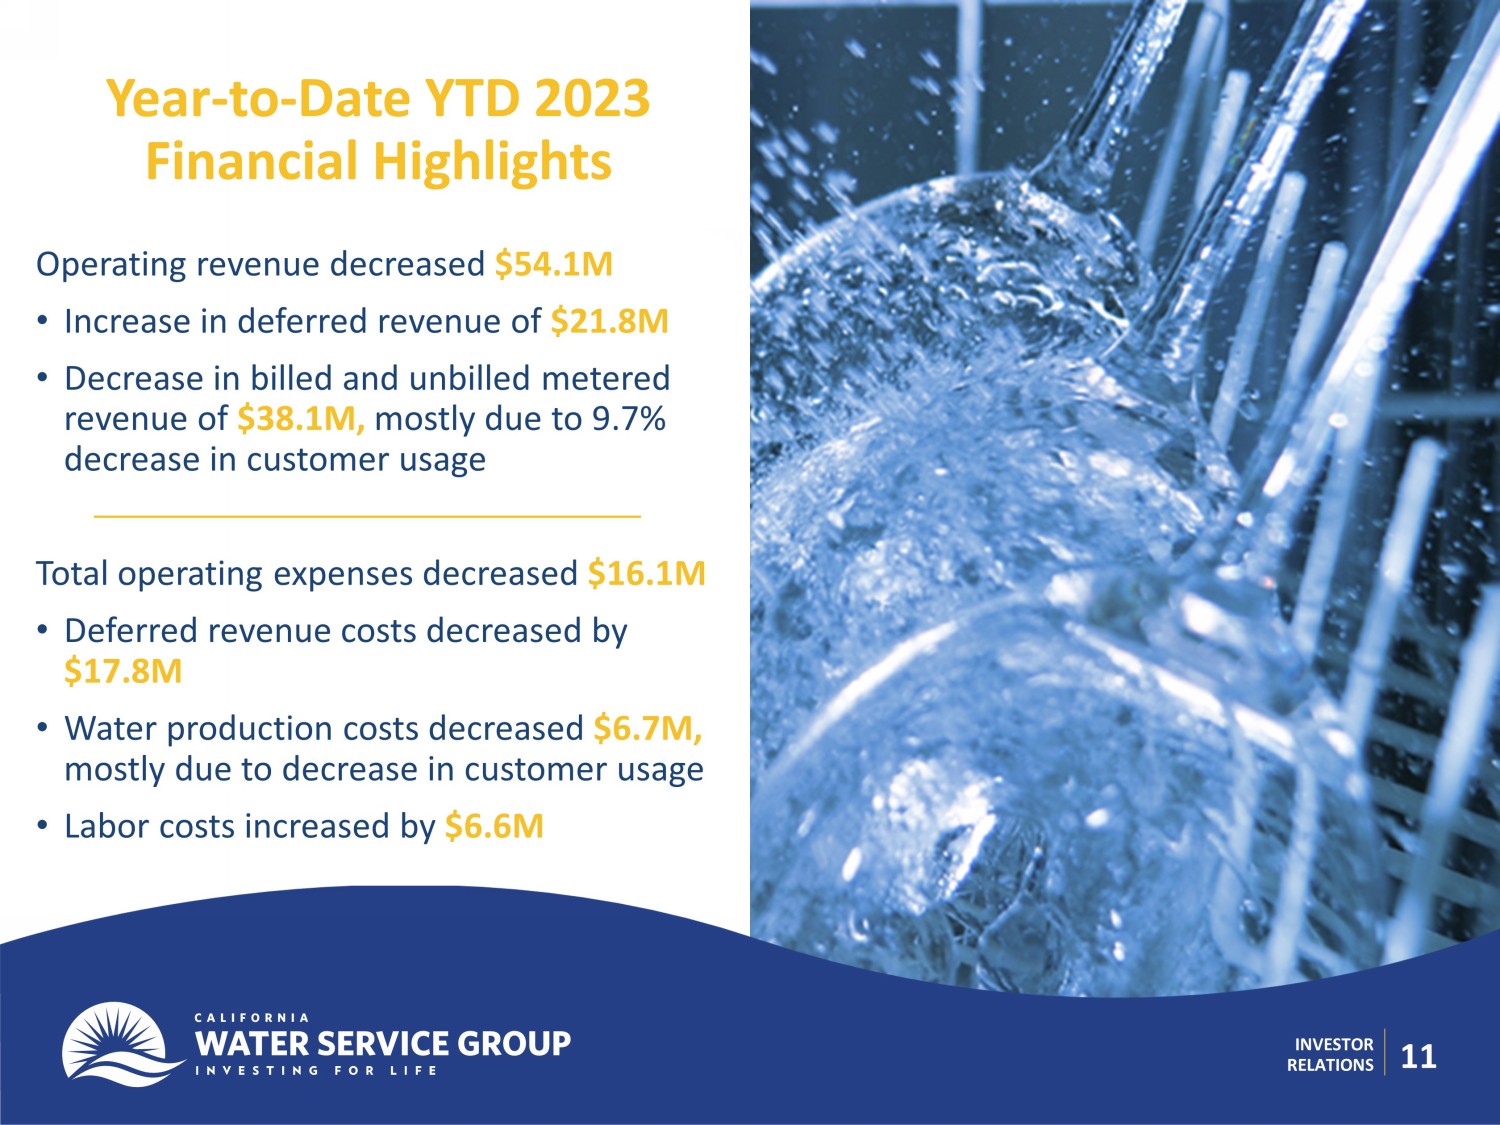
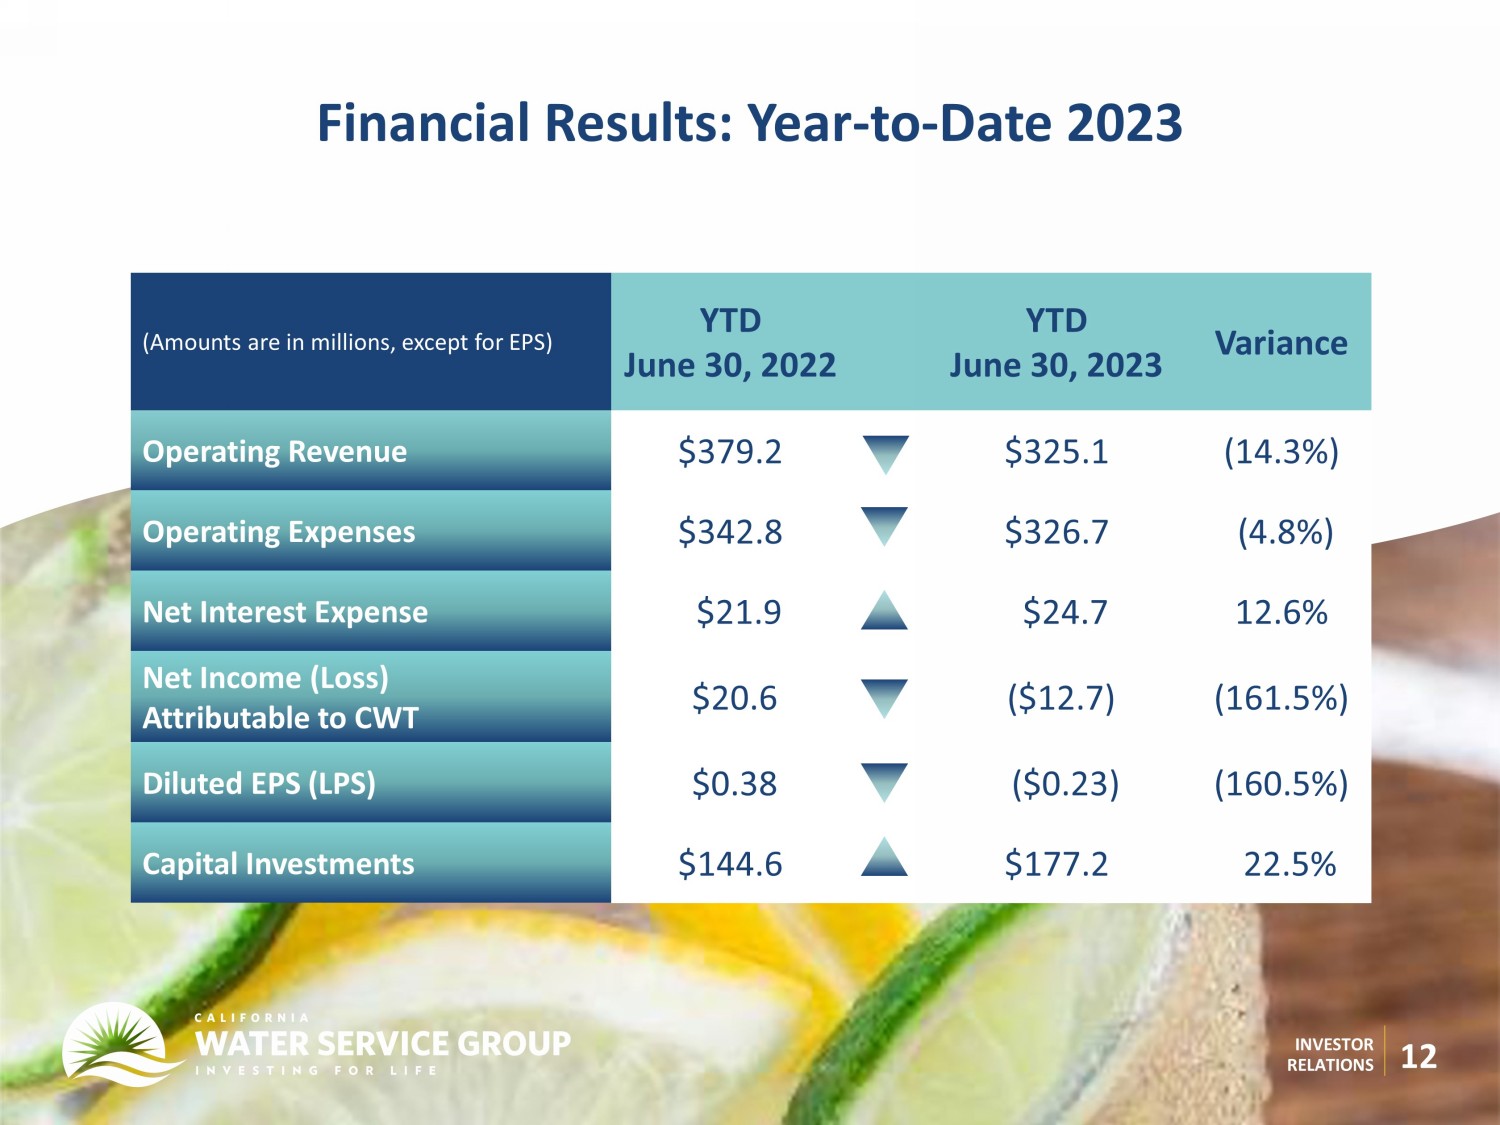
INVESTOR RELATIONS 11 Year - to - Date YTD 2023 Financial Highlights Operating revenue decreased $ 54.1M • Increase in deferred revenue of $ 21.8M • Decrease in billed and unbilled metered revenue of $38.1M, mostly due to 9.7% decrease in customer usage Total operating expenses decreased $16.1M • Deferred revenue costs decreased by $17.8M • Water production costs decreased $6.7M, mostly due to decrease in customer usage • Labor costs increased by $6.6M INVESTOR RELATIONS 12 (Amounts are in millions, except for EPS) YTD June 30, 2022 YTD June 30, 2023 Variance Operating Revenue $379.2 $325.1 (14.3%) Operating Expenses $342.8 $326.7 (4.8%) Net Interest Expense $21.9 $24.7 12.6% Net In come (Loss) Attributable to CWT $20.6 ($12.7) (161.5%) Diluted EPS (LPS) $0.38 ($0.23) (160.5%) Capital Investments $144.6 $177.2 22.5% Financial Results: Year - to - Date 2023

INVESTOR RELATIONS Based on current positions of parties to 2021 GRC filing, we estimated understatement of operating revenue YTD 6/30/23 to be in $ 43M – $ 63M range ($0.65 to $0.95 EPS)*: Unrecorded California Regulatory M echanisms Year - to - Date 2023 13 *IRMA value will depend on final 2021 GRC rates authorized for recovery. MWRAM was requested in 2021 GRC and was not disputed by any other party to the proceeding; its value would also depend on final 2021 GRC rates. DREMA is an authorized memorandum account, and its value would also depend on final 2021 GRC rates. Ranges are current estimates based on available information and may change as 2021 GRC progresses. Due to mechanism’s connection to customer billings, YTD 6/30/23 estimates are not necessarily indicative of potential impacts in future quarters. 2023 IRMA operating revenue range $ 18.5M to $ 36M ($0.28 to $0.54 EPS)* 2023 MWRAM operating revenue range $ 16.5M to $ 17M ($0.25 to $0.26 EPS)* 2023 DREMA operating revenue range $ 8M to $ 10M ($0.12 to $0.15 EPS)* Estimated impact to EPS reflects the estimated impact to operating revenue, multiplied by 85% (which reflects an assumed effective corporate income tax rate of 15%), and divided by the diluted weighted average common shares outstanding during the period .
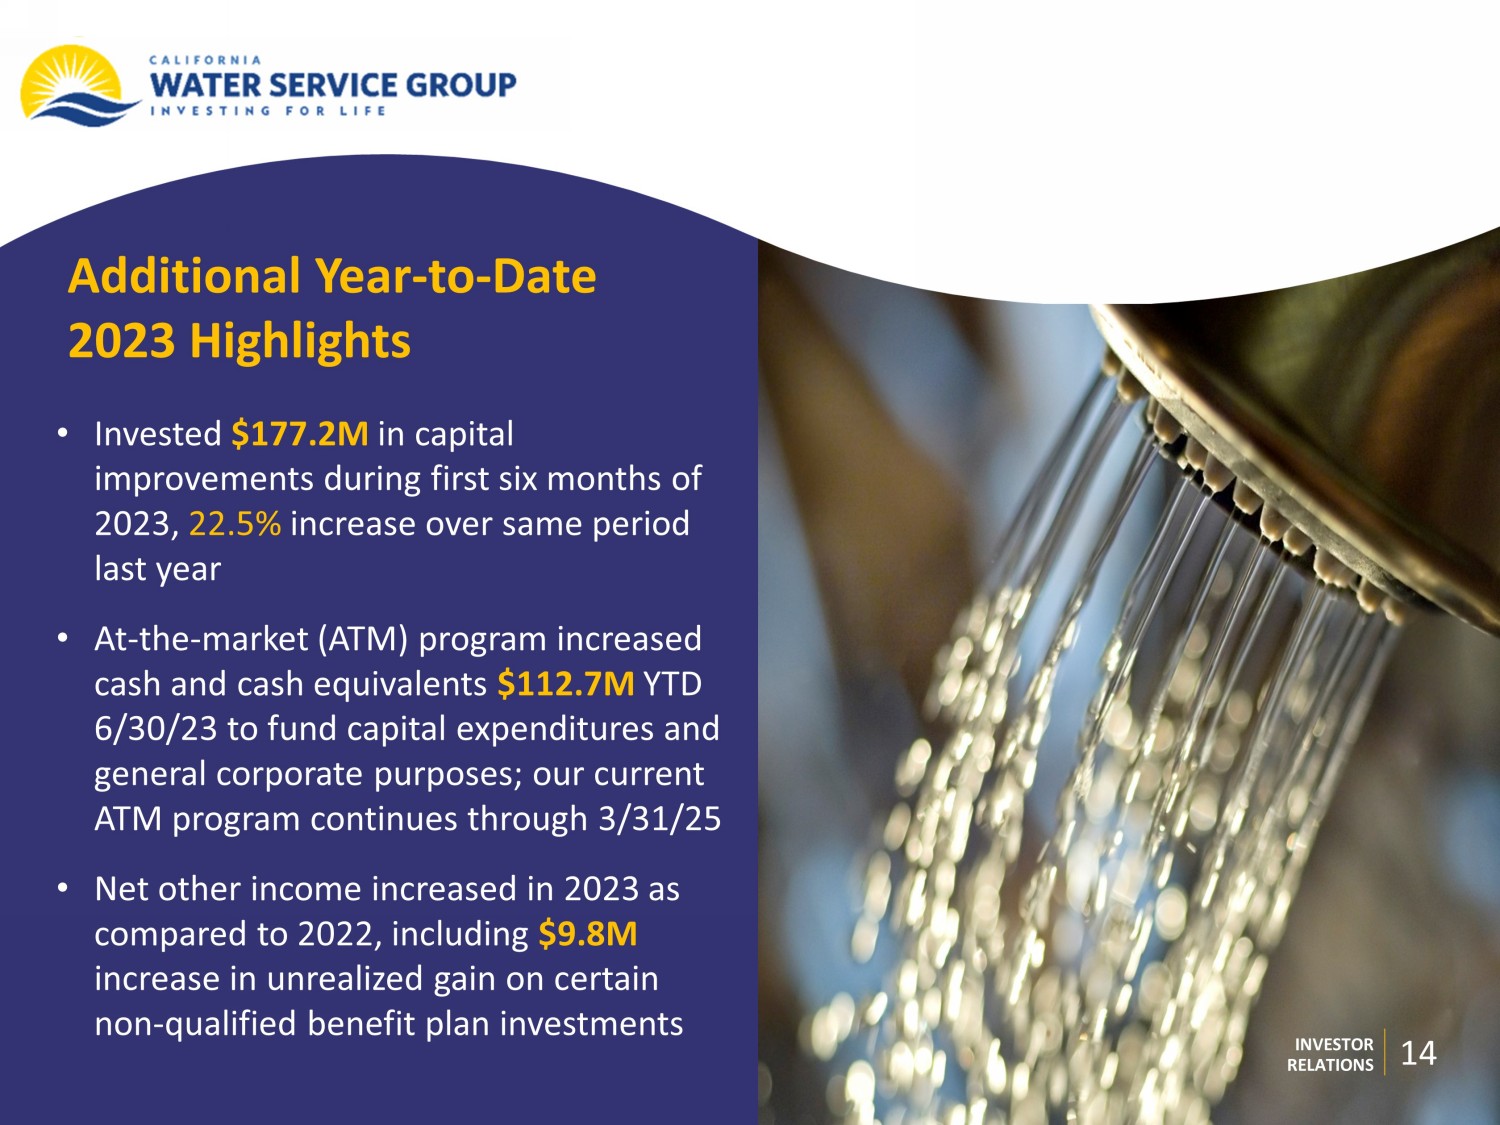
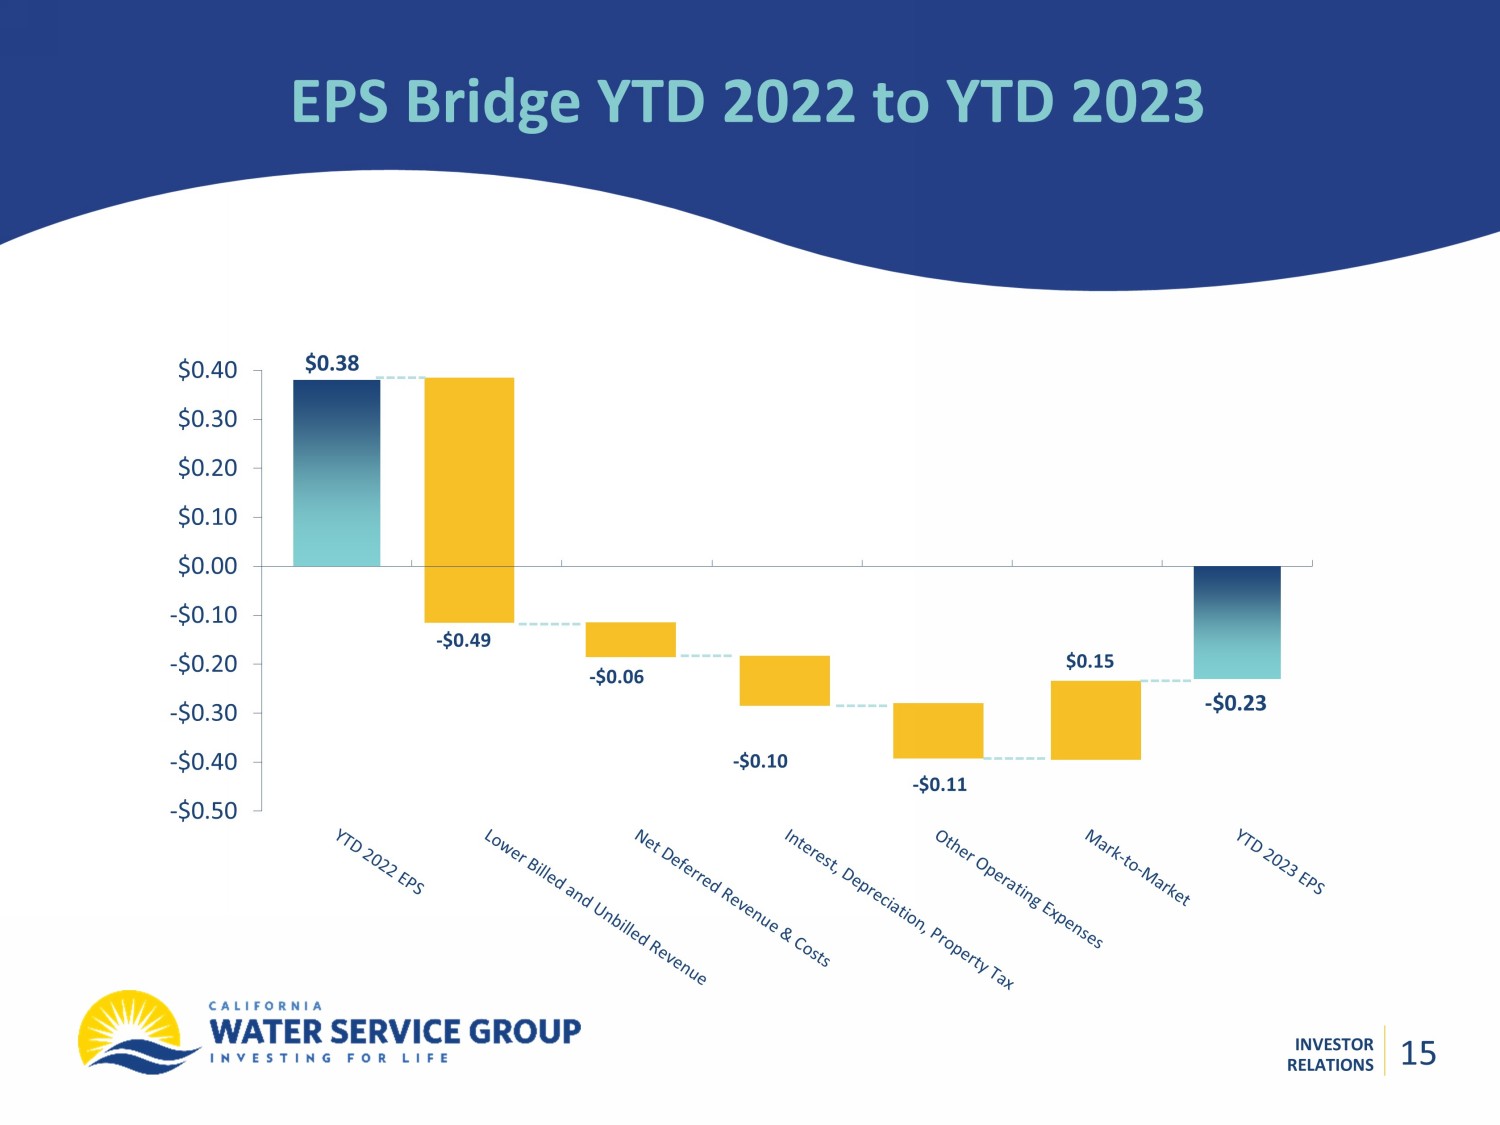
Additional Year - to - Date 2023 Highlights • Invested $177.2M in capital improvements during first six months of 2023, 22.5% increase over same period last year • At - the - market (ATM) program increased cash and cash equivalents $ 112.7M YTD 6/30/23 to fund capital expenditures and general corporate purposes; our current ATM program continues through 3/31/25 • Net other income increased in 2023 as compared to 2022, including $ 9.8M increase in unrealized gain on certain non - qualified benefit plan investments 14 INVESTOR RELATIONS INVESTOR RELATIONS EPS Bridge YTD 2022 to YTD 2023 -$0.50 -$0.40 -$0.30 -$0.20 -$0.10 $0.00 $0.10 $0.20 $0.30 $0.40 $0.15 - $0.10 $0.38 - $0.06 - $0.49 - $0.23 - $0.11 15 15
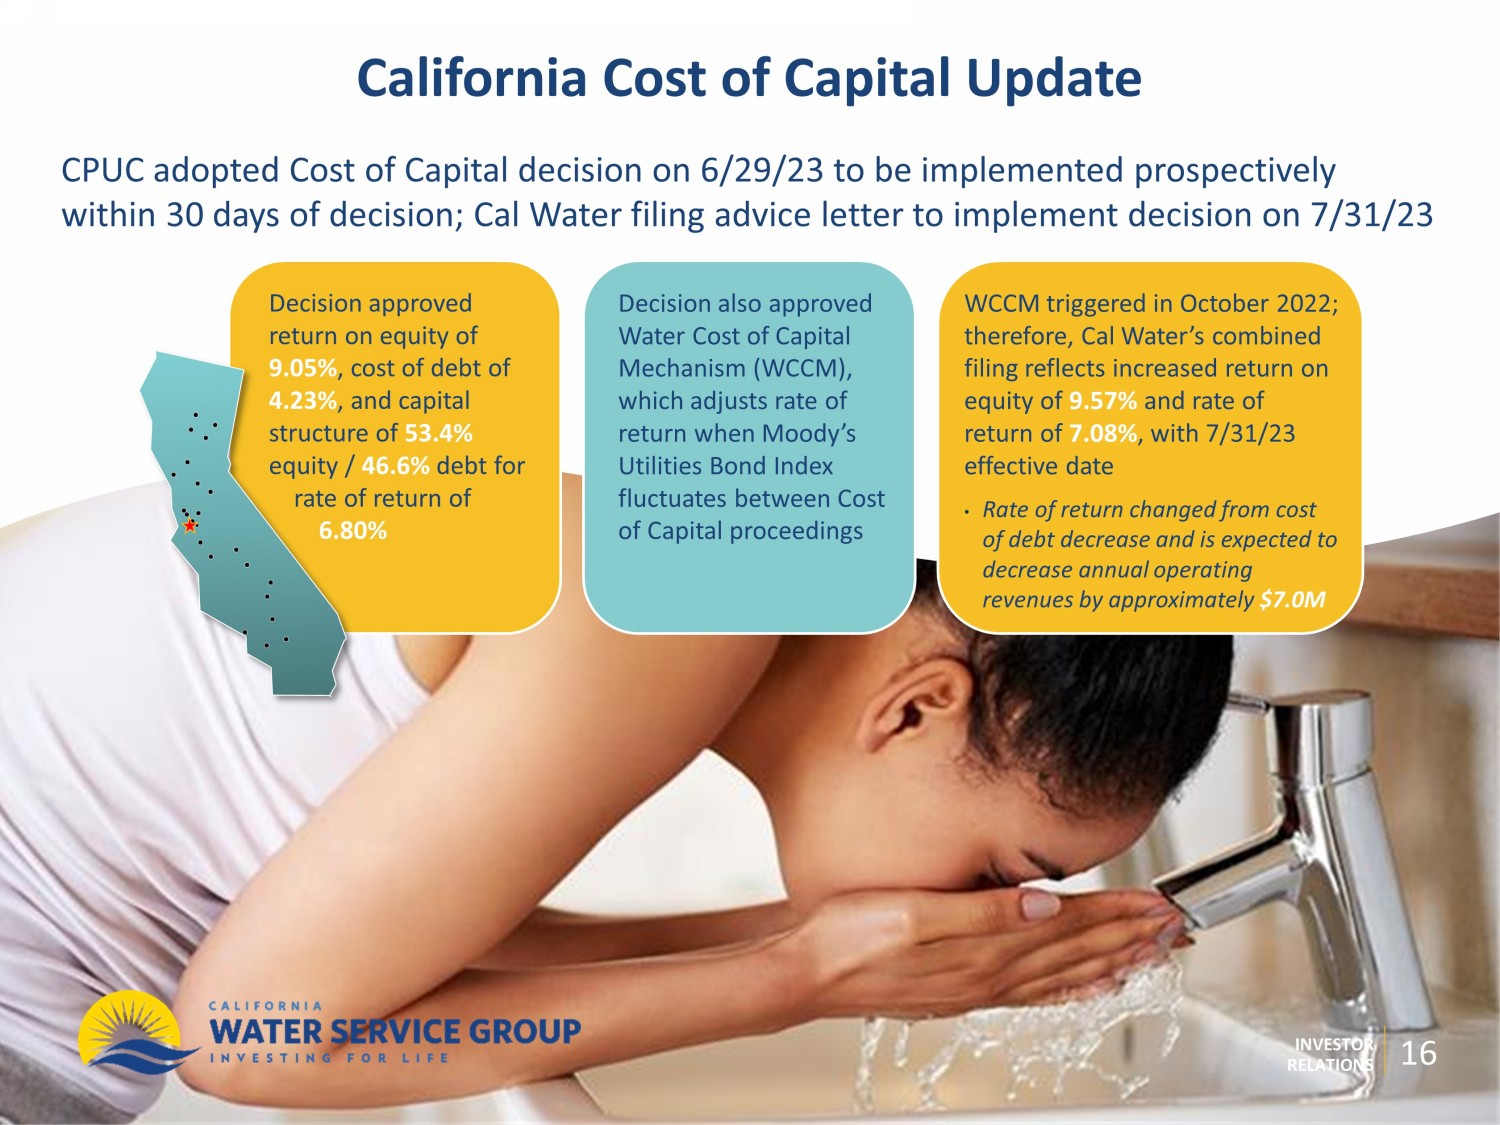
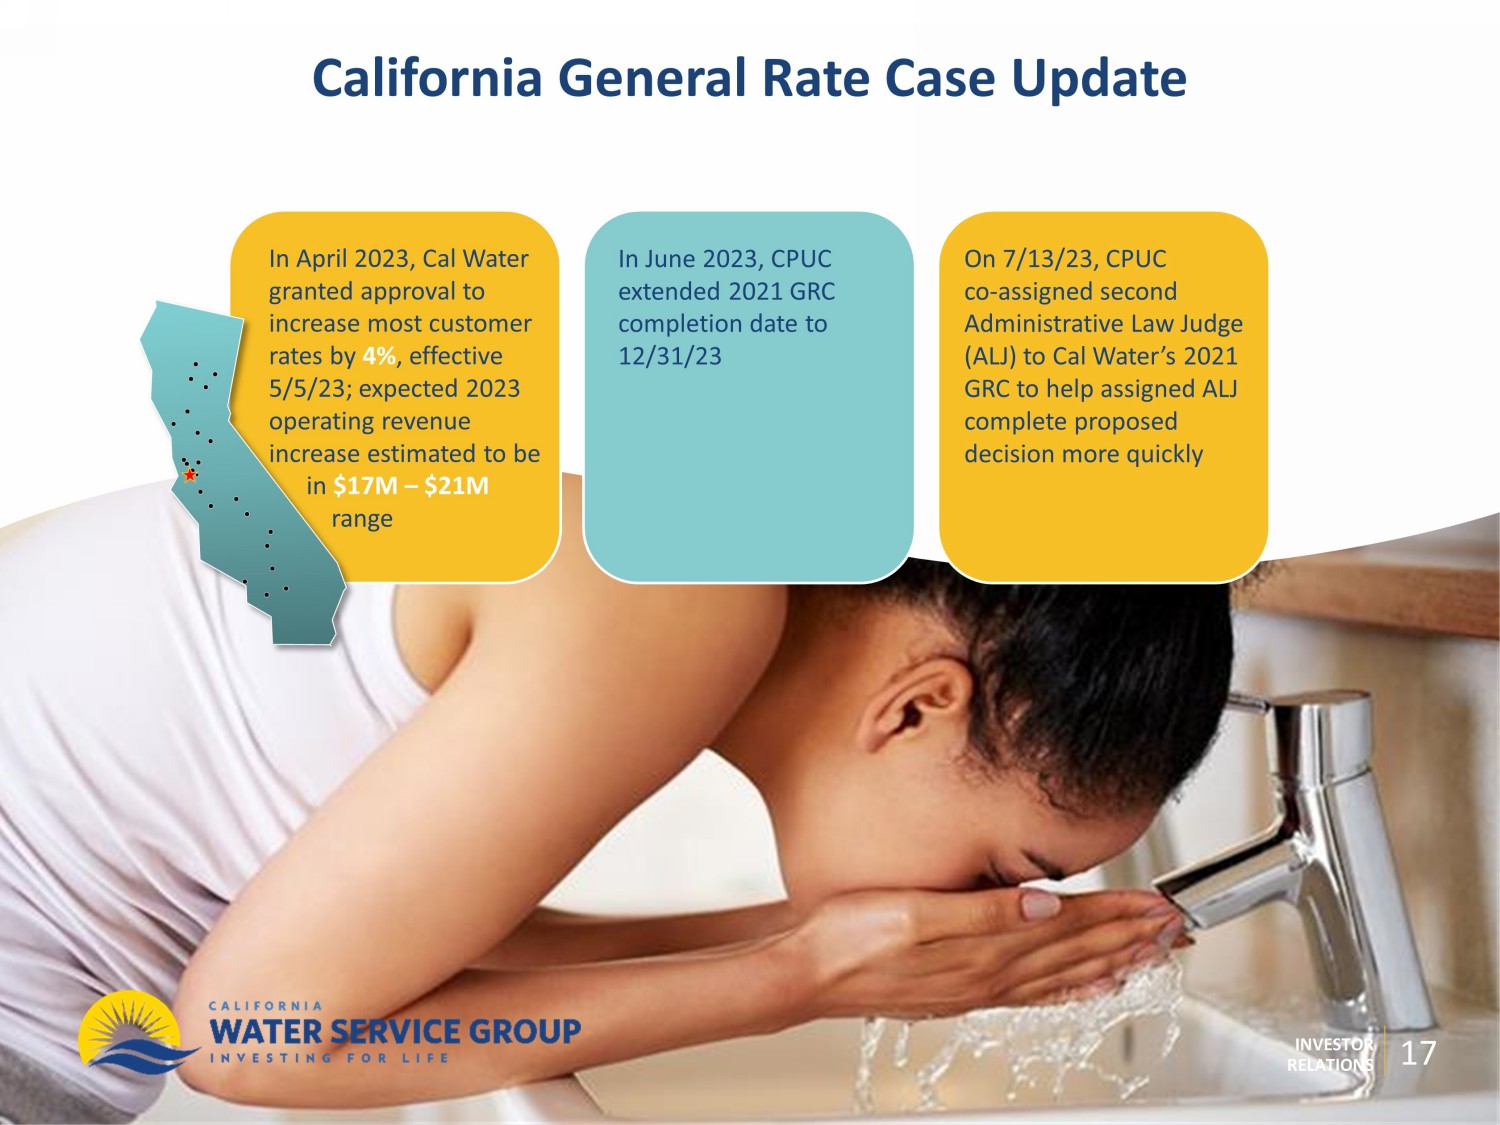
INVESTOR RELATIONS California Cost of Capital Update Decision approved return on equity of 9.05% , cost of debt of 4.23% , and capital structure of 53.4% equity / 46.6% debt for rate of return of 6.80% WCCM triggered in October 2022; therefore, Cal Water’s combined filing reflects increased return on equity of 9.57% and rate of return of 7.08% , with 7/31/23 effective date • Rate of return changed from cost of debt decrease and is expected to decrease annual operating revenues by approximately $ 7.0M Decision also approved Water Cost of Capital Mechanism (WCCM), which adjusts rate of return when Moody’s Utilities Bond Index fluctuates between Cost of Capital proceedings CPUC adopted Cost of Capital decision on 6/29/23 to be implemented prospectively within 30 days of decision; Cal Water filing advice letter to implement decision on 7/31/23 16 INVESTOR RELATIONS California General Rate Case Update In April 2023, Cal Water granted approval to increase most customer rates by 4% , effective 5/5/23; expected 2023 operating revenue increase estimated to be in $ 17M – $ 21M range On 7/13/23, CPUC co - assigned second Administrative Law Judge (ALJ) to Cal Water’s 2021 GRC to help assigned ALJ complete proposed decision more quickly In June 2023, CPUC extended 2021 GRC completion date to 12/31/23 17
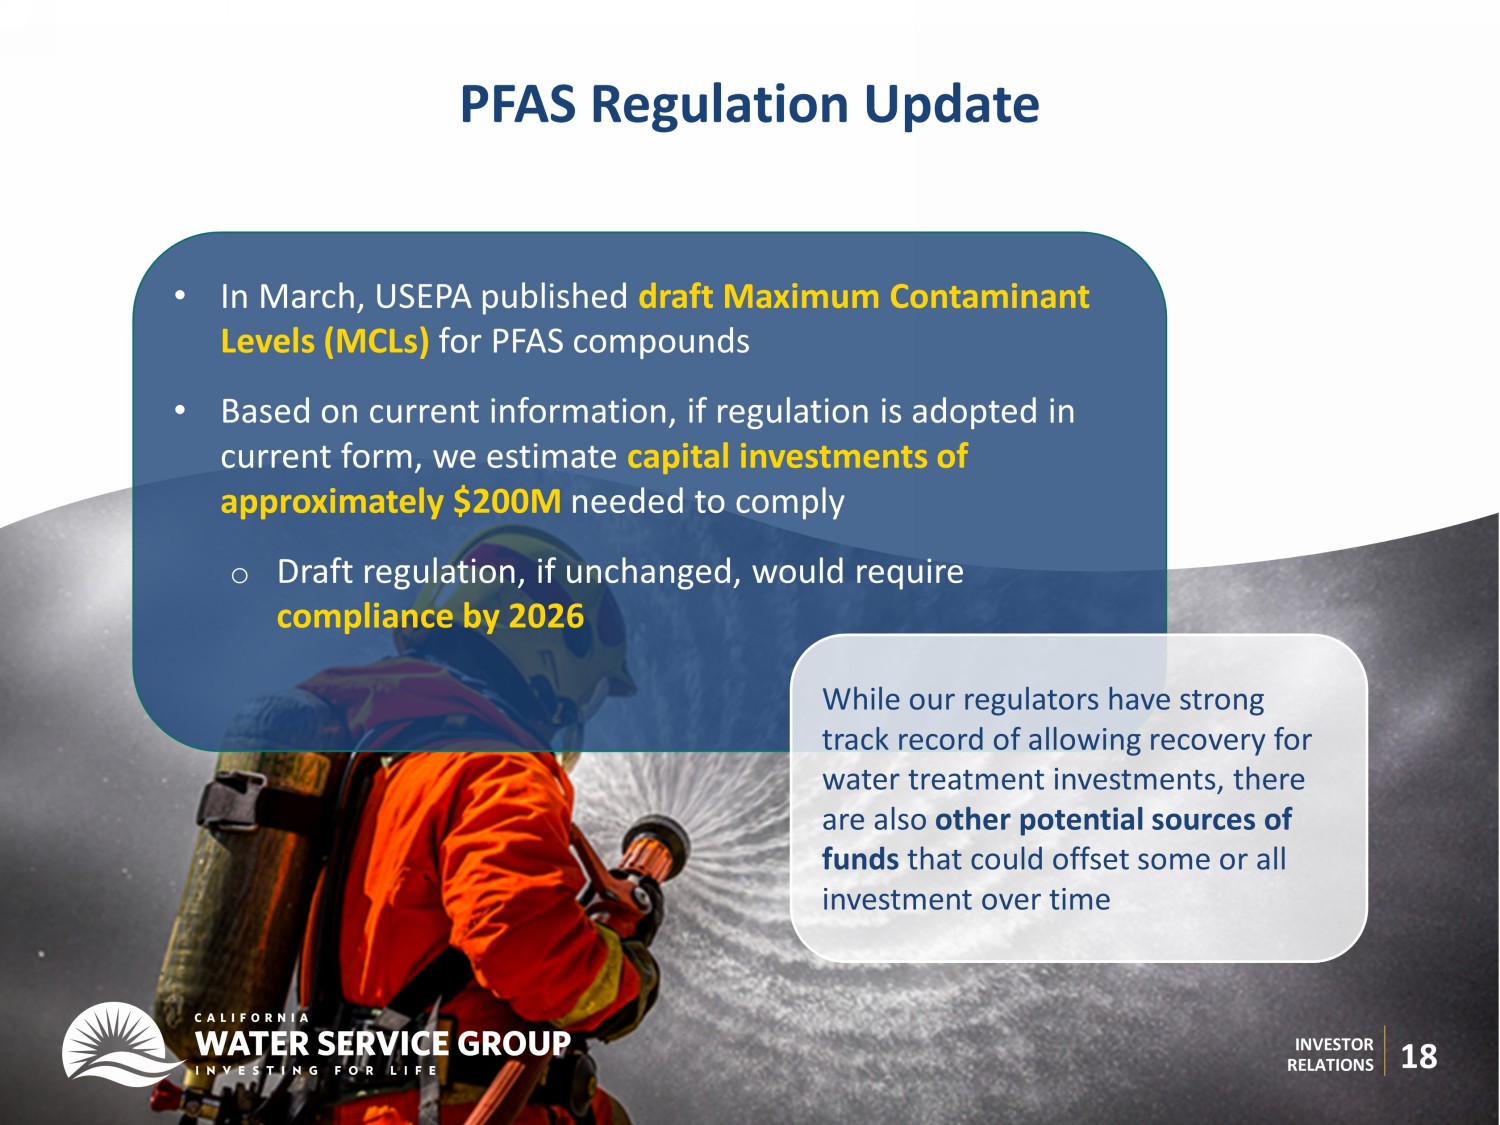
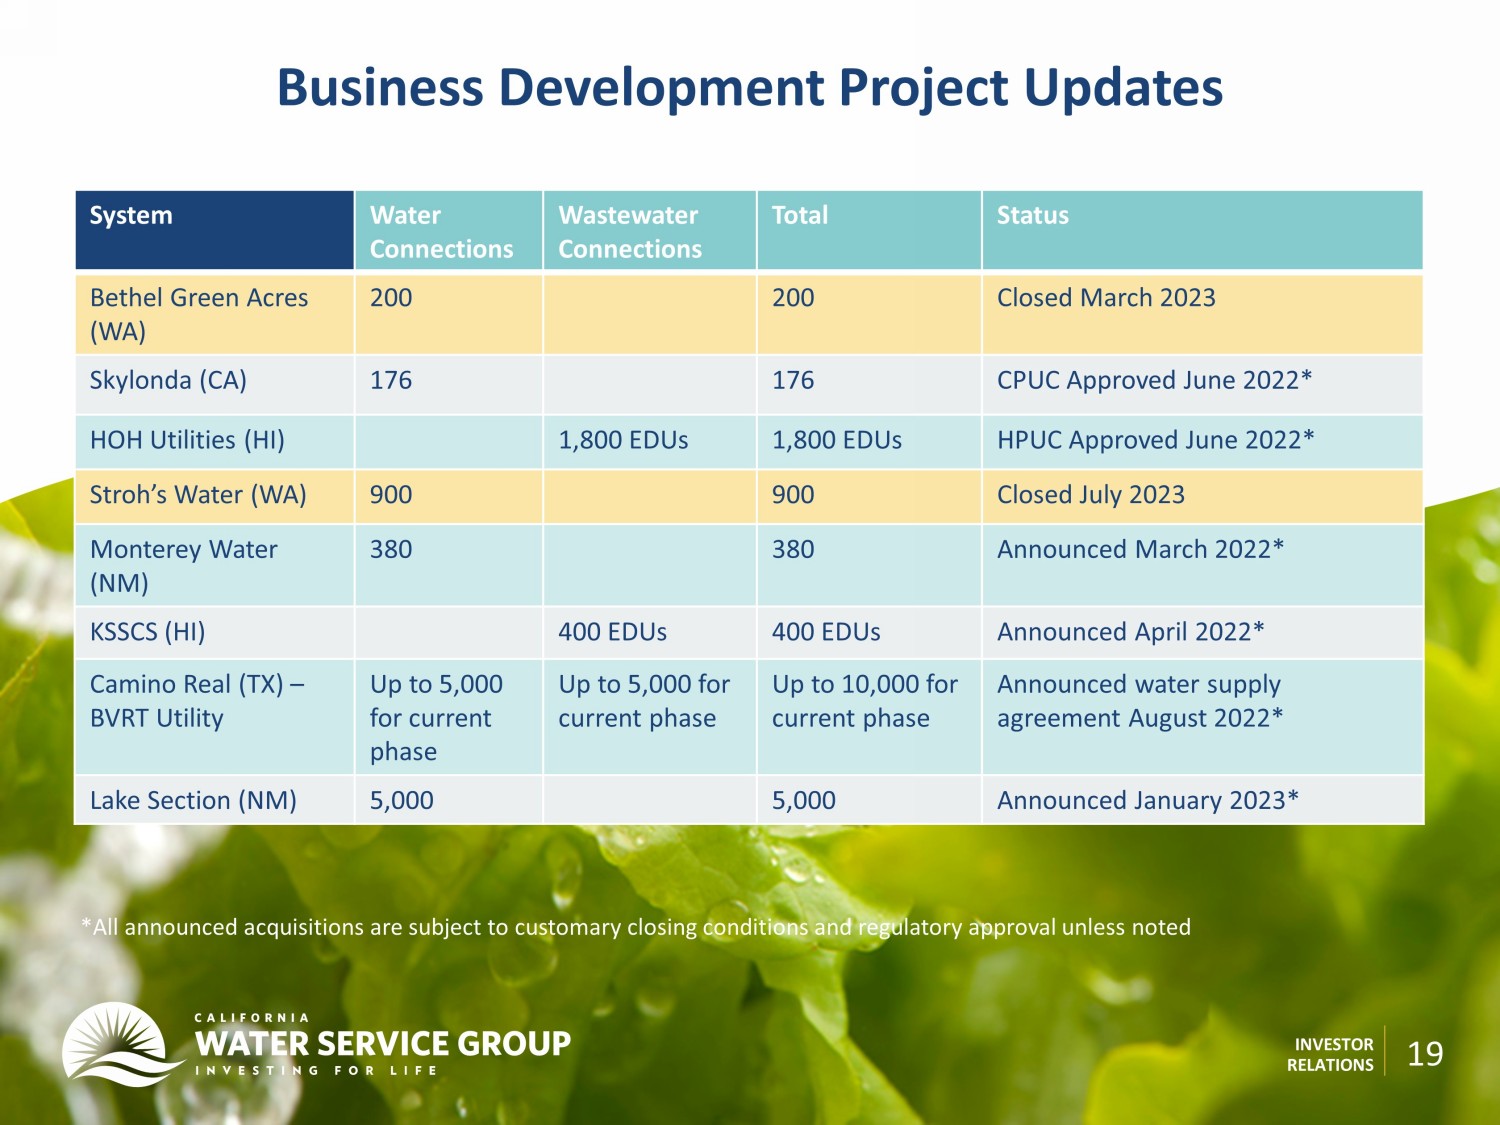
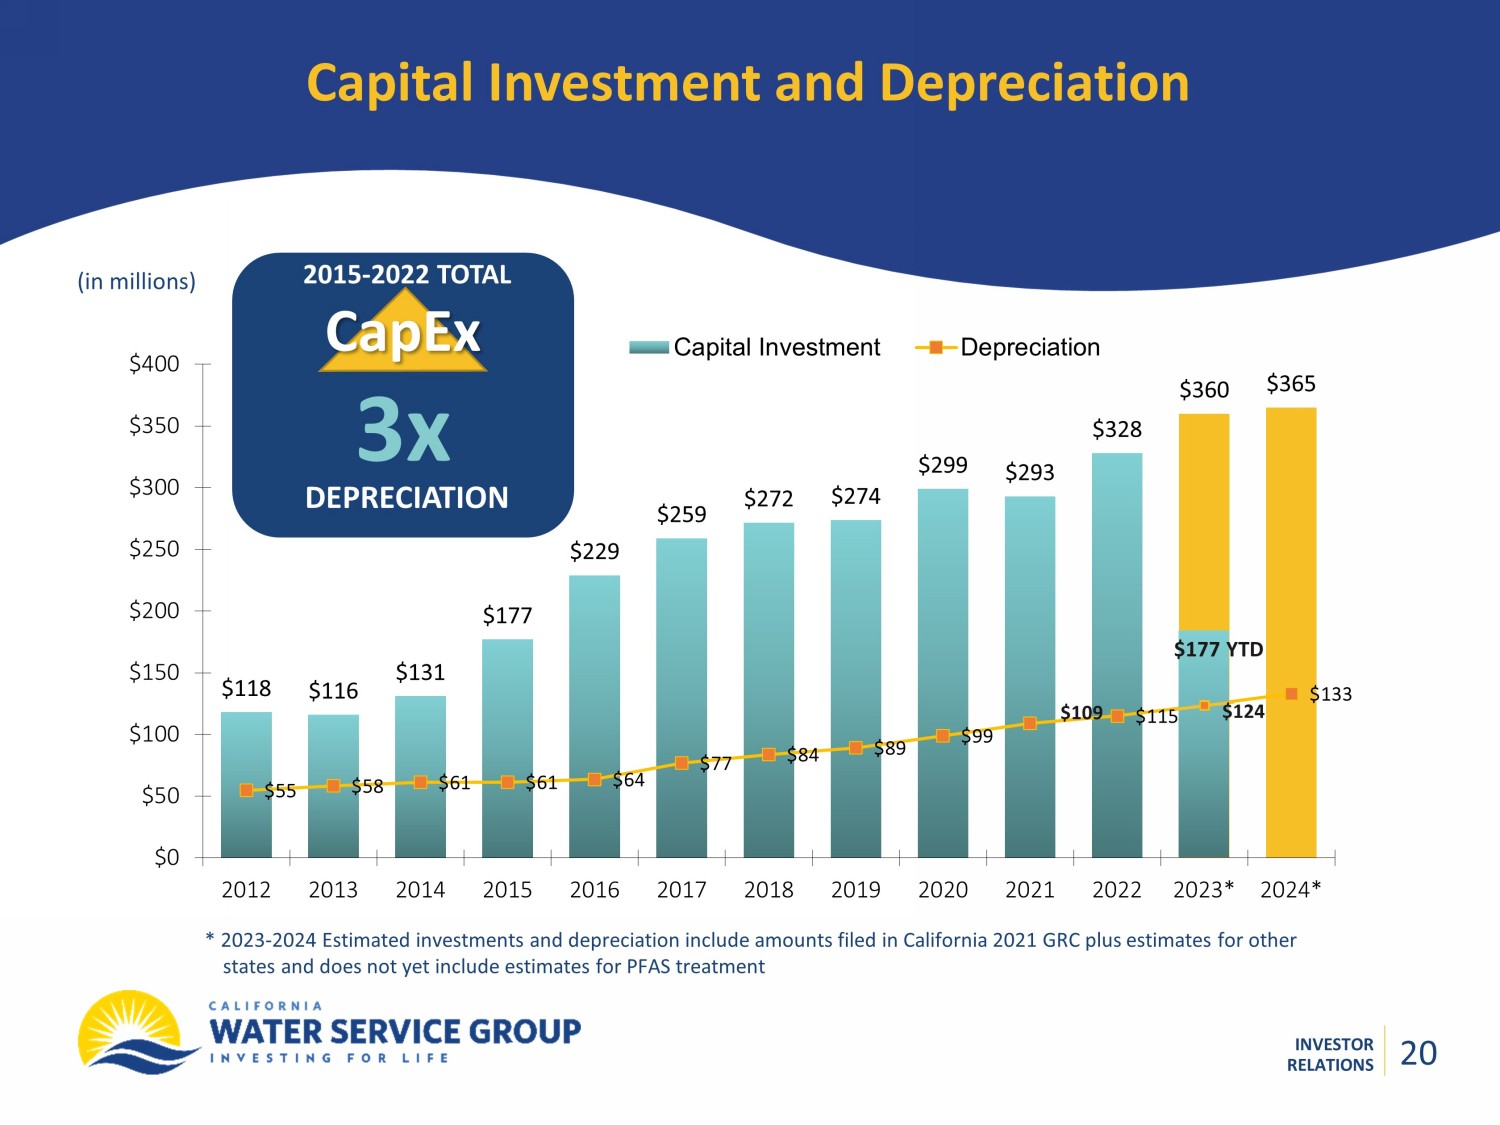
INVESTOR RELATIONS 18 PFAS Regulation Update • In March, USEPA published draft Maximum Contaminant Levels (MCLs) for PFAS compounds • Based on current information, if regulation is adopted in current form, we estimate capital investments of approximately $ 200M needed to comply o Draft regulation, if unchanged, would require compliance by 2026 While our regulators have strong track record of allowing recovery for water treatment investments, there are also other potential sources of funds that could offset some or all investment over time INVESTOR RELATIONS Business Development Project Updates System Water Connections Wastewater Connections Total Status Bethel Green Acres (WA) 200 200 Closed March 2023 Skylonda (CA) 176 176 CPUC Approved June 2022* HOH Utilities (HI) 1,800 EDUs 1,800 EDUs HPUC Approved June 2022 * Stroh’s Water (WA) 900 900 Closed July 2023 Monterey Water (NM) 380 380 Announced March 2022* KSSCS (HI) 400 EDUs 400 EDUs Announced April 2022* Camino Real (TX) – BVRT Utility Up to 5,000 for current phase Up to 5,000 for current phase Up to 10,000 for current phase Announced water supply agreement August 2022* Lake Section (NM) 5,000 5,000 Announced January 2023* *All announced acquisitions are subject to customary closing conditions and regulatory approval unless noted 19 INVESTOR RELATIONS $118 $116 $131 $177 $229 $259 $272 $274 $299 $293 $328 $360 $365 $55 $58 $61 $61 $64 $77 $84 $89 $99 $115 $133 $0 $50 $100 $150 $200 $250 $300 $350 $400 2012 2013 2014 2015 2016 2017 2018 2019 2020 2021 2022 2023* 2024* Capital Investment Depreciation Capital Investment and Depreciation (in millions) * 2023 - 2024 Estimated investments and depreciation include amounts filed in California 2021 GRC plus estimates for other states and does not yet include estimates for PFAS treatment 2015 - 2022 TOTAL CapEx 3x DEPRECIATION $109 20 $177 YTD $124 20

INVESTOR RELATIONS Estimated Regulated Rate Base of CWT (in billions) *2023 - 2025 Rate base estimates include filed proposal in 2021 California General Rate Case plus estimated rate base in other sta tes; these values are not yet adopted and are subject to review and approval of CPUC and other regulators $1.06 $1.12 $1.24 $1.61 $2.74 $1.26 $1.82 $0.0 $0.5 $1.0 $1.5 $2.0 $2.5 $3.0 2016 2017 2018 2019 2020 2021 2022 *2023 *2024 *2025 $1.95 $2.24 $2.49 21 21 INVESTOR RELATIONS In Summary 22 Results inline given delayed 2021 GRC Revenue shortfall in 2023 due to temporary absence of regulatory mechanisms; we anticipate potential future recognition of these mechanisms would result in additional revenue in a future period once proposed decision is approved While we wait for regulatory decision in California, we continue to execute our business, capital, and operational plans

DISCUSSION