UNITED STATES
SECURITIES AND EXCHANGE COMMISSION
Washington, D.C. 20549
FORM 8-K
CURRENT REPORT
Pursuant to Section 13 or 15(d) of the
Securities Exchange Act of 1934
Date of Report (Date of earliest event reported): May 4, 2023
MFA FINANCIAL, INC.
(Exact name of registrant as specified in its charter)
| Maryland | 1-13991 | 13-3974868 | ||
(State or
other jurisdiction |
(Commission File Number) |
(IRS Employer |
| One Vanderbilt Avenue, 48th Floor | ||
| New York, New York | 10017 | |
| (Address of principal executive offices) | (Zip Code) |
Registrant's telephone number, including area code: (212) 207-6400
Not Applicable
(Former name or former address, if changed since last report)
Check the appropriate box below if the Form 8-K filing is intended to simultaneously satisfy the filing obligation of the registrant under any of the following provisions (see General Instruction A.2. below):
| ¨ | Written communications pursuant to Rule 425 under the Securities Act (17 CFR 230.425) |
| ¨ | Soliciting material pursuant to Rule 14a-12 under the Exchange Act (17 CFR 240.14a-12) |
| ¨ | Pre-commencement communications pursuant to Rule 14d-2(b) under the Exchange Act (17 CFR 240.14d-2(b)) |
| ¨ | Pre-commencement communications pursuant to Rule 13e-4(c) under the Exchange Act (17 CFR 240.13e-4(c)) |
Securities registered pursuant to Section 12(b) of the Act:
| Title of each class: |
Trading
|
Name
of each |
||
| Common Stock, par value $0.01 per share | MFA | New York Stock Exchange | ||
|
7.50% Series B Cumulative Redeemable Preferred Stock, par value $0.01 per share |
MFA/PB | New York Stock Exchange | ||
| 6.50% Series C Fixed-to-Floating Rate Cumulative Redeemable Preferred Stock, par value $0.01 per share | MFA/PC | New York Stock Exchange |
Indicate by check mark whether the registrant is an emerging growth company as defined in Rule 405 of the Securities Act of 1933 (§230.405 of this chapter) or Rule 12b-2 of the Securities Exchange Act of 1934 (§240.12b-2 of this chapter).
Emerging growth company ¨
If an emerging growth company, indicate by check mark if the registrant has elected not to use the extended transition period for complying with any new or revised financial accounting standards provided pursuant to Section 13(a) of the Exchange Act. ¨
Item 2.02 Results of Operations and Financial Condition and
Item 7.01 Regulation FD Disclosure
MFA Financial, Inc. (“MFA”) issued a press release, dated May 4, 2023, announcing its financial results for the quarter ended March 31, 2023, which is attached hereto as Exhibit 99.1 and is incorporated herein by reference. In addition, in conjunction with the announcement of its financial results, MFA issued additional information relating to its 2023 first quarter financial results. Such additional information is attached to this report as Exhibit 99.2 and is incorporated herein by reference.
The information referenced in this Current Report on Form 8-K (including Exhibits 99.1 and 99.2) is being “furnished” and, as such, shall not be deemed to be “filed” for the purposes of Section 18 of the Securities Exchange Act of 1934, as amended (the “Exchange Act”), or otherwise subject to the liabilities of that Section. The information set forth in this Current Report on Form 8-K (including Exhibits 99.1 and 99.2) is and will not be incorporated by reference into any registration statement or other document filed by MFA pursuant to the Securities Act of 1933, as amended (the “Securities Act”), except as may be expressly set forth by specific reference in such filing.
As discussed therein, the press release contains forward-looking statements within the meaning of the Securities Act and the Exchange Act and, as such, may involve known and unknown risks, uncertainties and assumptions. These forward-looking statements relate to MFA’s current expectations and are subject to the limitations and qualifications set forth in the press release as well as in MFA’s other documents filed with the SEC, including, without limitation, that actual events and/or results may differ materially from those projected in such forward-looking statements.
Exhibit
| 99.1 | Press Release, dated May 4, 2023, announcing MFA’s financial results for the quarter ended March 31, 2023. |
| 99.2 | Additional information relating to the financial results of MFA for the quarter ended March 31, 2023. |
| 104 | Cover Page Interactive Data File (formatted as Inline XBRL). |
SIGNATURE
Pursuant to the requirements of the Securities Exchange Act of 1934, the registrant has duly caused this report to be signed on its behalf by the undersigned hereunto duly authorized.
| MFA FINANCIAL, INC. | ||
| (REGISTRANT) | ||
| By: | /s/ Harold E. Schwartz | |
| Name: Harold E. Schwartz | ||
| Title: Senior Vice President and General Counsel | ||
Date: May 4, 2023
EXHIBIT INDEX
| Exhibit No. | Description |
| 99.1 | Press Release, dated May 4, 2023, announcing MFA Financial Inc.’s financial results for the quarter ended March 31, 2023. |
| 99.2 | Additional information relating to the financial results of MFA Financial, Inc. for the quarter ended March 31, 2023. |
| 104 | Cover Page Interactive Data File (formatted as Inline XBRL). |
Exhibit 99.1

MFA
FINANCIAL, INC.
One Vanderbilt Ave
New York, New York 10017
| PRESS RELEASE | FOR IMMEDIATE RELEASE |
| May 4, 2023 | NEW YORK METRO |
| INVESTOR CONTACT: | InvestorRelations@mfafinancial.com | NYSE: MFA |
| 212-207-6488 | ||
| www.mfafinancial.com | ||
| MEDIA CONTACT: | Abernathy MacGregor |
| Tom Johnson | |
| 212-371-5999 |
MFA Financial, Inc. Announces First Quarter 2023 Financial Results
NEW YORK - MFA Financial, Inc. (NYSE:MFA) today provided its financial results for the first quarter ended March 31, 2023.
First Quarter 2023 financial results update:
| • | MFA generated GAAP net income for the first quarter of $64.6 million, or $0.63 per basic common share ($0.62 per diluted common share). Distributable Earnings, a non-GAAP financial measure, was $30.8 million, or $0.30 per common share. |
| • | GAAP book value at March 31, 2023 was $15.15 per common share, a 1.9% increase from December 31, 2022. Economic book value, a non-GAAP financial measure, rose 3.0% during the quarter to $16.02 per common share. |
| • | MFA generated a total economic return (based on the change in Economic book value, plus common dividends) of 5.3% for the first quarter. |
| • | MFA closed the quarter with unrestricted cash of $362 million. |
Commenting on the first quarter, Craig Knutson, MFA’s CEO and President said: “Despite another tumultuous quarter for financial markets, MFA produced strong results to begin 2023. Our emphasis on disciplined risk management once again paid off, enabling us to maintain a stable cost of funds despite a 100 basis point increase in the Fed Funds Rate since mid-December, while also protecting and growing book value in a continued environment of interest rate and credit spread volatility. We took advantage of favorable market conditions early in the quarter to price three securitizations, furthering our shift toward more durable, non-mark-to-market forms of financing. We weathered the banking crisis in March without any impact on our borrowing capacity, and continued to prioritize liquidity, ending the quarter with a substantial cash position. Finally, we added to our Agency RMBS position when spreads widened late in the quarter.”
Mr. Knutson added: “Our Lima One subsidiary originated $379 million of new business-purpose loans during the quarter. Importantly, we did this without lowering coupons or loosening underwriting standards. The average coupon in Lima’s origination pipeline continues to exceed 10%. We believe that these organically-produced assets have strong credit characteristics and provide attractive yields that we could not obtain through third party purchases.”
Q1 2023 Portfolio Activity
| • | Loan acquisitions were $455.9 million, including $364.3 million of funded originations of business purpose loans (including draws on Transitional loans) and $91.7 million of Non-QM loan acquisitions, bringing MFA’s residential whole loan balance to $7.8 billion. |
| • | Lima One continued to perform well, funding $245.1 million of new business purpose loans with a maximum loan amount of approximately $379 million. Further, $119.1 million of draws were funded on previously originated Transitional loans. Lima One generated approximately $9.0 million of origination, servicing, and other fee income. |
| • | MFA completed three loan securitizations during the quarter, collateralized by $668.2 million of unpaid principal balance (UPB) of loans. This included $313.7 million of Non-QM loans, $203.9 million of Single-family rental loans, and $150.6 million of Transitional loans. |
| • | Loan delinquencies remained low, with 60+ day delinquencies (measured as a percentage of UPB) for Purchased Performing Loans unchanged from the prior quarter at 3.1%. Combined Purchased Credit Deteriorated and Purchased Non-Performing 60+ day delinquencies declined to 30.6%. |
| • | MFA added $173.8 million of Agency MBS during the quarter, bringing its total Securities portfolio to $504.6 million. |
| • | MFA continued to reduce its REO portfolio, selling 93 properties in the first quarter for aggregate proceeds of $33.8 million and generating $5.0 million of gains. |
| • | MFA maintained its position in interest rate swaps at a notional amount of approximately $3.0 billion. At March 31, 2023, these swaps had a weighted average fixed pay interest rate of 1.58% and a weighted average variable receive interest rate of 4.87%. |
| • | MFA estimates the net effective duration of its investment portfolio at March 31, 2023 was 1.04. |
| • | MFA’s Debt/Net Equity Ratio was 3.5x and recourse leverage was 1.6x at March 31, 2023. |
Webcast
MFA Financial, Inc. plans to host a live audio webcast of its investor conference call on Thursday, May 4, 2023, at 10:00 a.m. (Eastern Time) to discuss its first quarter 2023 financial results. The live audio webcast will be accessible to the general public over the internet at http://www.mfafinancial.com through the “Webcasts & Presentations” link on MFA’s home page. Earnings presentation materials will be posted on the MFA website prior to the conference call and an audio replay will be available on the website following the call.
About MFA Financial, Inc.
MFA Financial, Inc. (NYSE: MFA) is a leading specialty finance company that invests in and finances residential mortgage assets. MFA invests, on a leveraged basis, in residential whole loans, residential mortgage-backed securities and other real estate assets. Through its subsidiaries, MFA also originates and services business purpose loans for real estate investors. MFA is an internally-managed, publicly-traded real estate investment trust.
The following table presents MFA’s asset allocation as of March 31, 2023, and the first quarter 2023 yield on average interest-earning assets, average cost of funds and net interest rate spread for the various asset types.
Table 1 - Asset Allocation
| At March 31, 2023 | Purchased Performing Loans (1) |
Purchased Credit Deteriorated Loans (2) |
Purchased Non- Performing Loans |
Securities, at fair value |
Real
Estate Owned |
Other,
net (3) |
Total | |||||||||||||||||||||
| (Dollars in Millions) | ||||||||||||||||||||||||||||
| Fair Value/Carrying Value | $ | 6,579 | $ | 440 | $ | 775 | $ | 505 | $ | 121 | $ | 700 | $ | 9,120 | ||||||||||||||
| Financing Agreements with Non-mark-to-market Collateral Provisions | (812 | ) | (35 | ) | (91 | ) | — | (8 | ) | — | (946 | ) | ||||||||||||||||
| Financing Agreements with Mark-to-market Collateral Provisions | (1,480 | ) | (85 | ) | (111 | ) | (405 | ) | (16 | ) | — | (2,097 | ) | |||||||||||||||
| Securitized Debt | (3,250 | ) | (245 | ) | (320 | ) | — | (15 | ) | — | (3,830 | ) | ||||||||||||||||
| Convertible Senior Notes | — | — | — | — | — | (228 | ) | (228 | ) | |||||||||||||||||||
| Net Equity Allocated | $ | 1,037 | $ | 75 | $ | 253 | $ | 100 | $ | 82 | $ | 472 | $ | 2,019 | ||||||||||||||
| Debt/Net Equity Ratio (4) | 5.3 | x | 4.9 | x | 2.1 | x | 4.1 | x | 0.5 | x | 3.5 | x | ||||||||||||||||
| For the Quarter Ended March 31, 2023 | ||||||||||||||||||||||||||||
| Yield on Average Interest Earning Assets (5) | 5.38 | % | 6.13 | % | 8.46 | % | 8.76 | % | N/A | 5.69 | % | |||||||||||||||||
| Less Average Cost of Funds (6) | (3.95 | ) | (2.23 | ) | (3.53 | ) | (4.52 | ) | (5.42 | ) | (3.95 | ) | ||||||||||||||||
| Net Interest Rate Spread | 1.43 | % | 3.90 | % | 4.93 | % | 4.24 | % | (5.42 | )% | 1.74 | % | ||||||||||||||||
| (1) | Includes $3.5 billion of Non-QM loans, $1.5 billion of Transitional loans, $1.5 billion of Single-family rental loans, $79.4 million of Seasoned performing loans, and $60.9 million of Agency eligible investor loans. At March 31, 2023, the total fair value of these loans is estimated to be $6.5 billion. | |
| (2) | At March 31, 2023, the total fair value of these loans is estimated to be $465.3 million. | |
| (3) | Includes $362.5 million of cash and cash equivalents, $165.1 million of restricted cash, and $28.3 million of capital contributions made to loan origination partners, as well as other assets and other liabilities. | |
| (4) | Total Debt/Net Equity ratio represents the sum of borrowings under our financing agreements as a multiple of net equity allocated. | |
| (5) | Yields reported on our interest earning assets are calculated based on the interest income recorded and the average amortized cost for the quarter of the respective asset. At March 31, 2023, the amortized cost of our Securities, at fair value, was $482.9 million. In addition, the yield for residential whole loans was 5.66%, net of two basis points of servicing fee expense incurred during the quarter. For GAAP reporting purposes, such expenses are included in Loan servicing and other related operating expenses in our statement of operations. | |
| (6) | Average cost of funds includes interest on financing agreements, Convertible Senior Notes and securitized debt. Cost of funding also includes the impact of the net carry (the difference between swap interest income received and swap interest expense paid) on our interest rate swap agreements (or Swaps). While we have not elected hedge accounting treatment for Swaps and accordingly net carry is not presented in interest expense in our consolidated statement of operations, we believe it is appropriate to allocate net carry to the cost of funding to reflect the economic impact of our Swaps on the funding costs shown in the table above. For the quarter ended March 31, 2023, this decreased the overall funding cost by 122 basis points for our overall portfolio, 127 basis points for our Residential whole loans, 129 basis points for our Purchased Performing Loans, 171 basis points for our Purchased Credit Deteriorated Loans, 77 basis points for our Purchased Non-Performing Loans and 104 basis points for our Securities, at fair value. |
The following table presents the activity for our residential mortgage asset portfolio for the three months ended March 31, 2023:
Table 2 - Investment Portfolio Activity Q1 2023
| (In Millions) | December 31, 2022 | Runoff (1) | Acquisitions (2) | Other (3) | March 31, 2023 | Change | ||||||||||||||||||
| Residential whole loans and REO | $ | 7,649 | $ | (318 | ) | $ | 456 | $ | 128 | $ | 7,915 | $ | 266 | |||||||||||
| Securities, at fair value | 333 | (5 | ) | 174 | 3 | 505 | 172 | |||||||||||||||||
| Totals | $ | 7,982 | $ | (323 | ) | $ | 630 | $ | 131 | $ | 8,420 | $ | 438 | |||||||||||
| (1) | Primarily includes principal repayments and sales of REO. | |
| (2) | Includes draws on previously originated Transitional loans. | |
| (3) | Primarily includes changes in fair value and changes in the allowance for credit losses. |
The following tables present information on our investments in residential whole loans.
Table 3 - Portfolio composition
| Held at Carrying Value | Held at Fair Value | Total | ||||||||||||||||||||||
| (Dollars in Thousands) | March 31, 2023 |
December 31, 2022 |
March 31, 2023 |
December 31, 2022 |
March 31, 2023 |
December 31, 2022 |
||||||||||||||||||
| Purchased Performing Loans: | ||||||||||||||||||||||||
| Non-QM loans | $ | 958,099 | $ | 987,282 | $ | 2,501,132 | $ | 2,372,548 | $ | 3,459,231 | $ | 3,359,830 | ||||||||||||
| Transitional loans (1) | 53,272 | 75,188 | 1,471,633 | 1,342,032 | 1,524,905 | 1,417,220 | ||||||||||||||||||
| Single-family rental loans | 201,563 | 210,833 | 1,265,246 | 1,165,741 | 1,466,809 | 1,376,574 | ||||||||||||||||||
| Seasoned performing loans | 79,465 | 82,932 | — | — | 79,465 | 82,932 | ||||||||||||||||||
| Agency eligible investor loans | — | — | 60,854 | 51,094 | 60,854 | 51,094 | ||||||||||||||||||
| Total Purchased Performing Loans | $ | 1,292,399 | $ | 1,356,235 | $ | 5,298,865 | $ | 4,931,415 | $ | 6,591,264 | $ | 6,287,650 | ||||||||||||
| Purchased Credit Deteriorated Loans | $ | 460,680 | $ | 470,294 | $ | — | $ | — | $ | 460,680 | $ | 470,294 | ||||||||||||
| Allowance for Credit Losses | $ | (33,061 | ) | $ | (35,314 | ) | $ | — | $ | — | $ | (33,061 | ) | $ | (35,314 | ) | ||||||||
| Purchased Non-Performing Loans | $ | — | $ | — | $ | 775,367 | $ | 796,109 | $ | 775,367 | $ | 796,109 | ||||||||||||
| Total Residential Whole Loans | $ | 1,720,018 | $ | 1,791,215 | $ | 6,074,232 | $ | 5,727,524 | $ | 7,794,250 | $ | 7,518,739 | ||||||||||||
| Number of loans | 6,930 | 7,126 | 17,122 | 16,717 | 24,052 | 23,843 | ||||||||||||||||||
| (1) | As of March 31, 2023 includes $825.9 million of loans collateralized by one-to-four family residential properties and $699.0 million of loans collateralized by multi-family properties. As of December 31, 2022 includes $784.9 million of loans collateralized by one-to-four family residential properties and $632.3 million of loans collateralized by multi-family properties. |
Table 4 - Yields and average balances
| For the Three-Month Period Ended | ||||||||||||||||||||||||||||||||||||
| (Dollars in Thousands) | March 31, 2023 | December 31, 2022 | March 31, 2022 | |||||||||||||||||||||||||||||||||
| Interest | Average
Balance |
Average
Yield |
Interest | Average
Balance |
Average
Yield |
Interest | Average
Balance |
Average
Yield |
||||||||||||||||||||||||||||
| Purchased Performing Loans: | ||||||||||||||||||||||||||||||||||||
| Non-QM loans | $ | 44,089 | $ | 3,803,154 | 4.64 | % | $ | 41,621 | $ | 3,767,900 | 4.42 | % | $ | 32,952 | $ | 3,658,912 | 3.60 | % | ||||||||||||||||||
| Transitional loans | 28,227 | 1,473,420 | 7.66 | % | 26,134 | 1,335,471 | 7.83 | % | 14,861 | 814,055 | 7.30 | % | ||||||||||||||||||||||||
| Single-family rental loans | 21,313 | 1,518,741 | 5.61 | % | 20,237 | 1,483,529 | 5.46 | % | 13,325 | 1,024,731 | 5.20 | % | ||||||||||||||||||||||||
| Seasoned performing loans | 1,090 | 81,388 | 5.36 | % | 1,283 | 84,876 | 6.05 | % | 1,010 | 100,031 | 4.04 | % | ||||||||||||||||||||||||
| Agency eligible investor loans | 2,857 | 380,763 | 3.00 | % | 7,631 | 1,021,007 | 2.99 | % | 7,583 | 1,075,013 | 2.82 | % | ||||||||||||||||||||||||
| Total Purchased Performing Loans | 97,576 | 7,257,466 | 5.38 | % | 96,906 | 7,692,783 | 5.04 | % | 69,731 | 6,672,742 | 4.18 | % | ||||||||||||||||||||||||
| Purchased Credit Deteriorated Loans | 7,138 | 466,123 | 6.13 | % | 7,830 | 474,971 | 6.59 | % | 9,009 | 530,828 | 6.79 | % | ||||||||||||||||||||||||
| Purchased Non-Performing Loans | 14,796 | 699,730 | 8.46 | % | 20,252 | 726,303 | 11.15 | % | 20,726 | 844,206 | 9.82 | % | ||||||||||||||||||||||||
| Total Residential Whole Loans | $ | 119,510 | $ | 8,423,319 | 5.68 | % | $ | 124,988 | $ | 8,894,057 | 5.62 | % | $ | 99,466 | $ | 8,047,776 | 4.94 | % | ||||||||||||||||||
Table 5 - Net Interest Spread
| For the Three-Month Period Ended | ||||||||||||
| March 31, 2023 |
December 31, 2022 |
March 31, 2022 |
||||||||||
| Purchased Performing Loans | ||||||||||||
| Net Yield (1) | 5.38 | % | 5.04 | % | 4.18 | % | ||||||
| Cost of Funding (2) | 3.95 | % | 3.70 | % | 2.74 | % | ||||||
| Net Interest Spread | 1.43 | % | 1.34 | % | 1.44 | % | ||||||
| Purchased Credit Deteriorated Loans | ||||||||||||
| Net Yield (1) | 6.13 | % | 6.59 | % | 6.79 | % | ||||||
| Cost of Funding (2) | 2.23 | % | 2.13 | % | 2.88 | % | ||||||
| Net Interest Spread | 3.90 | % | 4.46 | % | 3.91 | % | ||||||
| Purchased Non-Performing Loans | ||||||||||||
| Net Yield (1) | 8.46 | % | 11.15 | % | 9.82 | % | ||||||
| Cost of Funding (2) | 3.53 | % | 3.01 | % | 3.09 | % | ||||||
| Net Interest Spread | 4.93 | % | 8.14 | % | 6.73 | % | ||||||
| Total Residential Whole Loans | ||||||||||||
| Net Yield (1) | 5.68 | % | 5.62 | % | 4.94 | % | ||||||
| Cost of Funding (2) | 3.82 | % | 3.56 | % | 2.79 | % | ||||||
| Net Interest Spread | 1.86 | % | 2.06 | % | 2.15 | % | ||||||
| (1) | Reflects annualized interest income on Residential whole loans divided by average amortized cost of Residential whole loans. Excludes servicing costs. | |
| (2) | Reflects annualized interest expense divided by average balance of agreements with mark-to-market collateral provisions (repurchase agreements), agreements with non-mark-to-market collateral provisions, and securitized debt. Cost of funding shown in the table above includes the impact of the net carry (the difference between swap interest income received and swap interest expense paid) on our Swaps. While we have not elected hedge accounting treatment for Swaps, and, accordingly, net carry is not presented in interest expense in our consolidated statement of operations, we believe it is appropriate to allocate net carry to the cost of funding to reflect the economic impact of our Swaps on the funding costs shown in the table above. For the quarter ended March 31, 2023, this decreased the overall funding cost by 127 basis points for our Residential whole loans, 129 basis points for our Purchased Performing Loans, 171 basis points for our Purchased Credit Deteriorated Loans, and 77 basis points for our Purchased Non-Performing Loans. For the quarter ended December 31, 2022, this decreased the overall funding cost by 89 basis points for our Residential whole loans, 87 basis points for our Purchased Performing Loans, 141 basis points for our Purchased Credit Deteriorated Loans, and 76 basis points for our Purchased Non-Performing Loans. For the quarter ended March 31, 2022, this increased the overall funding cost by 35 basis points for our Residential whole loans, 33 basis points for our Purchased Performing Loans, 56 basis points for our Purchased Credit Deteriorated Loans, and 39 basis points for our Purchased Non-Performing Loans. |
Table 6 - Credit related metrics/Residential Whole Loans
March 31, 2023
| Weighted | ||||||||||||||||||||||||||||||||||||||||||||||||
| Fair | Unpaid | Average | Weighted | Weighted | ||||||||||||||||||||||||||||||||||||||||||||
| Value / | Principal | Weighted | Term to | Average | Average | Aging by UPB | 60+ | |||||||||||||||||||||||||||||||||||||||||
| (Dollars | Carrying | Balance | Average | Maturity | LTV | Original | Past Due Days | 60+ | LTV | |||||||||||||||||||||||||||||||||||||||
| In Thousands) | Value | (“UPB”) | Coupon (2) | (Months) | Ratio (3) | FICO (4) | Current | 30-59 | 60-89 | 90+ | DQ % | (3) | ||||||||||||||||||||||||||||||||||||
| Purchased Performing Loans: | ||||||||||||||||||||||||||||||||||||||||||||||||
| Non-QM loans | $ | 3,452,086 | $ | 3,683,664 | 5.22 | % | 349 | 65 | % | 735 | $ | 3,508,600 | $ | 74,897 | $ | 38,599 | $ | 61,568 | 2.7 | % | 65.9 | % | ||||||||||||||||||||||||||
| Transitional loans (1) | 1,521,279 | 1,537,094 | 8.07 | 11 | 65 | 746 | 1,449,593 | 14,063 | 7,522 | 65,916 | 4.8 | 66.4 | ||||||||||||||||||||||||||||||||||||
| Single-family rental loans | 1,465,469 | 1,542,253 | 5.87 | 322 | 69 | 737 | 1,492,800 | 10,113 | 5,527 | 33,813 | 2.6 | 72.0 | ||||||||||||||||||||||||||||||||||||
| Seasoned performing loans | 79,420 | 87,079 | 3.69 | 149 | 30 | 724 | 81,207 | 1,386 | 617 | 3,869 | 5.2 | 48.4 | ||||||||||||||||||||||||||||||||||||
| Agency eligible investor loans | 60,854 | 71,890 | 3.46 | 341 | 67 | 757 | 70,739 | 661 | — | 490 | 0.7 | 64.6 | ||||||||||||||||||||||||||||||||||||
| Total Purchased Performing Loans | $ | 6,579,108 | $ | 6,921,980 | 5.96 | % | 265 | 3.1 | % | |||||||||||||||||||||||||||||||||||||||
| Purchased Credit Deteriorated Loans | $ | 439,775 | $ | 543,594 | 4.71 | % | 275 | 63 | % | N/A | $ | 394,389 | $ | 44,939 | $ | 18,057 | $ | 86,209 | 19.2 | % | 72.4 | % | ||||||||||||||||||||||||||
| Purchased Non-Performing Loans | $ | 775,367 | $ | 857,388 | 5.07 | % | 275 | 67 | % | N/A | $ | 443,433 | $ | 89,259 | $ | 35,820 | $ | 288,876 | 37.9 | % | 76.3 | % | ||||||||||||||||||||||||||
| Residential whole loans, total or weighted average | $ | 7,794,250 | $ | 8,322,962 | 5.80 | % | 267 | 7.8 | % | |||||||||||||||||||||||||||||||||||||||
| (1) | As of March 31, 2023 Transitional loans includes $699.0 million of loans collateralized by multi-family properties with a weighted average term to maturity of 16 months and a weighted average LTV ratio of 73%. | |
| (2) | Weighted average is calculated based on the interest bearing principal balance of each loan within the related category. For loans acquired with servicing rights released by the seller, interest rates included in the calculation do not reflect loan servicing fees. For loans acquired with servicing rights retained by the seller, interest rates included in the calculation are net of servicing fees. | |
| (3) | LTV represents the ratio of the total unpaid principal balance of the loan to the estimated value of the collateral securing the related loan as of the most recent date available, which may be the origination date. For Transitional loans, the LTV presented is the ratio of the maximum unpaid principal balance of the loan, including unfunded commitments, to the estimated “after repaired” value of the collateral securing the related loan, where available. For certain Transitional loans, totaling $223.0 million at March 31, 2023, an after repaired valuation was not obtained and the loan was underwritten based on an “as is” valuation. The weighted average LTV of these loans based on the current unpaid principal balance and the valuation obtained during underwriting, is 69% at March 31, 2023. Excluded from the calculation of weighted average LTV are certain low value loans secured by vacant lots, for which the LTV ratio is not meaningful. 60+ LTV has been calculated on a consistent basis. | |
| (4) | Excludes loans for which no Fair Isaac Corporation (“FICO”) score is available. |
Table 7 - Shock Table
The information presented in the following “Shock Table” projects the potential impact of sudden parallel changes in interest rates on the value of our portfolio, including the impact of Swaps and securitized debt, based on the assets in our investment portfolio at March 31, 2023. Changes in portfolio value are measured as the percentage change when comparing the projected portfolio value to the base interest rate scenario at March 31, 2023.
| Change in Interest Rates |
Percentage Change in Portfolio Value |
Percentage Change in Equity |
||||||
| +100 Basis Point Increase | (1.34 | )% | (6.03 | )% | ||||
| + 50 Basis Point Increase | (0.60 | )% | (2.70 | )% | ||||
| Actual at March 31, 2023 | — | % | — | % | ||||
| - 50 Basis Point Decrease | 0.46 | % | 2.06 | % | ||||
| -100 Basis Point Decrease | 0.78 | % | 3.49 | % | ||||
MFA FINANCIAL, INC.
CONSOLIDATED BALANCE SHEETS
| (In Thousands, Except Per Share Amounts) | March 31, 2023 |
December 31, 2022 |
||||||
| (unaudited) | ||||||||
| Assets: | ||||||||
| Residential whole loans, net ($6,074,232 and $5,727,524 held at fair value, respectively) (1) | $ | 7,794,250 | $ | 7,518,739 | ||||
| Securities, at fair value | 504,639 | 333,364 | ||||||
| Cash and cash equivalents | 362,452 | 334,183 | ||||||
| Restricted cash | 165,137 | 159,898 | ||||||
| Other assets | 485,129 | 766,221 | ||||||
| Total Assets | $ | 9,311,607 | $ | 9,112,405 | ||||
| Liabilities: | ||||||||
| Financing agreements ($4,147,712 and $3,898,744 held at fair value, respectively) | $ | 7,101,318 | $ | 6,812,086 | ||||
| Other liabilities | 191,683 | 311,470 | ||||||
| Total Liabilities | $ | 7,293,001 | $ | 7,123,556 | ||||
| Stockholders’ Equity: | ||||||||
| Preferred stock, $0.01 par value; 7.5% Series B cumulative redeemable; 8,050 shares authorized; 8,000 shares issued and outstanding ($200,000 aggregate liquidation preference) | $ | 80 | $ | 80 | ||||
| Preferred stock, $0.01 par value; 6.5% Series C fixed-to-floating rate cumulative redeemable; 12,650 shares authorized; 11,000 shares issued and outstanding ($275,000 aggregate liquidation preference) | 110 | 110 | ||||||
| Common stock, $0.01 par value; 874,300 and 874,300 shares authorized; 101,912 and 101,802 shares issued and outstanding, respectively |
1,019 | 1,018 | ||||||
| Additional paid-in capital, in excess of par | 3,687,285 | 3,684,291 | ||||||
| Accumulated deficit | (1,690,113 | ) | (1,717,991 | ) | ||||
| Accumulated other comprehensive income | 20,225 | 21,341 | ||||||
| Total Stockholders’ Equity | $ | 2,018,606 | $ | 1,988,849 | ||||
| Total Liabilities and Stockholders’ Equity | $ | 9,311,607 | $ | 9,112,405 | ||||
| (1) | Includes approximately $4.6 billion and $4.0 billion of Residential whole loans transferred to consolidated variable interest entities (“VIEs”) at March 31, 2023 and December 31, 2022, respectively. Such assets can be used only to settle the obligations of each respective VIE. |
MFA FINANCIAL, INC.
CONSOLIDATED STATEMENTS OF OPERATIONS
|
Three Months Ended March 31, |
||||||||
| (In Thousands, Except Per Share Amounts) | 2023 | 2022 | ||||||
| (Unaudited) | (Unaudited) | |||||||
| Interest Income: | ||||||||
| Residential whole loans | $ | 119,510 | $ | 99,466 | ||||
| Securities, at fair value | 7,308 | 5,275 | ||||||
| Other interest-earning assets | 2,351 | 1,506 | ||||||
| Cash and cash equivalent investments | 3,036 | 102 | ||||||
| Interest Income | $ | 132,205 | $ | 106,349 | ||||
| Interest Expense: | ||||||||
| Asset-backed and other collateralized financing arrangements | $ | 88,880 | $ | 39,365 | ||||
| Other interest expense | 3,956 | 3,931 | ||||||
| Interest Expense | $ | 92,836 | $ | 43,296 | ||||
| Net Interest Income | $ | 39,369 | $ | 63,053 | ||||
| Reversal of Provision for Credit Losses on Residential Whole Loans | $ | 13 | $ | 3,511 | ||||
| Net Interest Income after Reversal of Provision for Credit Losses | $ | 39,382 | $ | 66,564 | ||||
| Other Income/(Loss), net: | ||||||||
| Net gain/(loss) on residential whole loans measured at fair value through earnings | 129,174 | (287,935 | ) | |||||
| Impairment and other net gain/(loss) on securities and other portfolio investments | 2,931 | (3,701 | ) | |||||
| Net gain on real estate owned | 3,942 | 8,732 | ||||||
| Net (loss)/gain on derivatives used for risk management purposes | (21,208 | ) | 94,101 | |||||
| Net (loss)/gain on securitized debt measured at fair value through earnings | (51,725 | ) | 64,117 | |||||
| Lima One - origination, servicing and other fee income | 8,976 | 14,494 | ||||||
| Other, net | 3,172 | 2,676 | ||||||
| Other Income/(Loss), net | $ | 75,262 | $ | (107,516 | ) | |||
| Operating and Other Expense: | ||||||||
| Compensation and benefits | $ | 20,630 | $ | 19,556 | ||||
| Other general and administrative expense | 10,391 | 8,697 | ||||||
| Loan servicing, financing and other related costs | 9,539 | 10,401 | ||||||
| Amortization of intangible assets | 1,300 | 3,300 | ||||||
| Operating and Other Expense | $ | 41,860 | $ | 41,954 | ||||
| Net Income/(Loss) | $ | 72,784 | $ | (82,906 | ) | |||
| Less Preferred Stock Dividend Requirement | $ | 8,219 | $ | 8,219 | ||||
| Net Income/(Loss) Available to Common Stock and Participating Securities | $ | 64,565 | $ | (91,125 | ) | |||
| Basic Earnings/(Loss) per Common Share | $ | 0.63 | $ | (0.86 | ) | |||
| Diluted Earnings/(Loss) per Common Share | $ | 0.62 | $ | (0.86 | ) | |||
Segment Reporting
At March 31, 2023, the Company’s reportable segments include (i) mortgage-related assets and (ii) Lima One. The Corporate column in the table below primarily consists of corporate cash and related interest income, investments in loan originators and related economics, general and administrative expenses not directly attributable to Lima One, interest expense on unsecured convertible senior notes, securitization issuance costs, and preferred stock dividends.
The following tables summarize segment financial information, which in total reconciles to the same data for the Company as a whole:
| (Dollars in Thousands) | Mortgage- Related Assets |
Lima One | Corporate | Total | ||||||||||||
| Three months ended March 31, 2023 | ||||||||||||||||
| Interest Income | $ | 84,819 | $ | 44,521 | $ | 2,865 | $ | 132,205 | ||||||||
| Interest Expense | 57,077 | 31,804 | 3,955 | 92,836 | ||||||||||||
| Net Interest Income/(Expense) | $ | 27,742 | $ | 12,717 | $ | (1,090 | ) | $ | 39,369 | |||||||
| Reversal of Provision/(Provision) for Credit Losses on Residential Whole Loans | (300 | ) | 313 | — | 13 | |||||||||||
| Net Interest Income/(Expense) after Reversal of Provision/(Provision) for Credit Losses | $ | 27,442 | $ | 13,030 | $ | (1,090 | ) | $ | 39,382 | |||||||
| Net gain on residential whole loans measured at fair value through earnings | $ | 95,509 | $ | 33,665 | $ | — | $ | 129,174 | ||||||||
| Impairment and other net gain on securities and other portfolio investments | 2,931 | — | — | 2,931 | ||||||||||||
| Net gain on real estate owned | 3,925 | 17 | — | 3,942 | ||||||||||||
| Net loss on derivatives used for risk management purposes | (16,322 | ) | (4,886 | ) | — | (21,208 | ) | |||||||||
| Net loss on securitized debt measured at fair value through earnings | (34,820 | ) | (16,905 | ) | — | (51,725 | ) | |||||||||
| Lima One - origination, servicing and other fee income | — | 8,976 | — | 8,976 | ||||||||||||
| Other, net | 2,207 | 371 | 594 | 3,172 | ||||||||||||
| Total Other Income, net | $ | 53,430 | $ | 21,238 | $ | 594 | $ | 75,262 | ||||||||
| General and administrative expenses (including compensation) | $ | — | $ | 12,535 | $ | 18,486 | $ | 31,021 | ||||||||
| Loan servicing, financing, and other related costs | 4,719 | 218 | 4,602 | 9,539 | ||||||||||||
| Amortization of intangible assets | — | 1,300 | — | 1,300 | ||||||||||||
| Net Income/(Loss) | $ | 76,153 | $ | 20,215 | $ | (23,584 | ) | $ | 72,784 | |||||||
| Less Preferred Stock Dividend Requirement | $ | — | $ | — | $ | 8,219 | $ | 8,219 | ||||||||
| Net Income/(Loss) Available to Common Stock and Participating Securities | $ | 76,153 | $ | 20,215 | $ | (31,803 | ) | $ | 64,565 | |||||||
| (Dollars in Thousands) | Mortgage- Related Assets |
Lima One | Corporate | Total | ||||||||||||
| Three Months Ended December 31, 2022 | ||||||||||||||||
| Interest Income | $ | 100,800 | $ | 39,398 | $ | 2,679 | $ | 142,877 | ||||||||
| Interest Expense | 56,046 | 27,231 | 3,949 | 87,226 | ||||||||||||
| Net Interest Income/(Expense) | $ | 44,754 | $ | 12,167 | $ | (1,270 | ) | $ | 55,651 | |||||||
| Reversal of Provision/(Provision) for Credit Losses on Residential Whole Loans | $ | 1,631 | $ | (91 | ) | $ | — | $ | 1,540 | |||||||
| Net Interest Income/(Expense) after Provision for Credit Losses | $ | 46,385 | $ | 12,076 | $ | (1,270 | ) | $ | 57,191 | |||||||
| Net (loss)/gain on residential whole loans measured at fair value through earnings | $ | (72,805 | ) | $ | 3,977 | $ | — | $ | (68,828 | ) | ||||||
| Impairment and other net loss on securities and other portfolio investments | (383 | ) | — | (8,526 | ) | (8,909 | ) | |||||||||
| Net gain on real estate owned | 5,602 | — | — | 5,602 | ||||||||||||
| Net gain on derivatives used for risk management purposes | 621 | 837 | — | 1,458 | ||||||||||||
| Net gain on securitized debt measured at fair value through earnings | 29,159 | 13,932 | — | 43,091 | ||||||||||||
| Lima One - origination, servicing and other fee income | — | 9,206 | — | 9,206 | ||||||||||||
| Other, net | 86 | 472 | 1,387 | 1,945 | ||||||||||||
| Total Other (Loss)/Income, net | $ | (37,720 | ) | $ | 28,424 | $ | (7,139 | ) | $ | (16,435 | ) | |||||
| General and administrative expenses (including compensation) | $ | — | $ | 13,026 | $ | 11,819 | $ | 24,845 | ||||||||
| Loan servicing, financing, and other related costs | 5,876 | 281 | 1,744 | 7,901 | ||||||||||||
| Amortization of intangible assets | — | 1,300 | — | 1,300 | ||||||||||||
| Net Gain/(Loss) | $ | 2,789 | $ | 25,893 | $ | (21,972 | ) | $ | 6,710 | |||||||
| Less Preferred Stock Dividend Requirement | $ | — | $ | — | $ | 8,219 | $ | 8,219 | ||||||||
| Net Gain/(Loss) Available to Common Stock and Participating Securities | $ | 2,789 | $ | 25,893 | $ | (30,191 | ) | $ | (1,509 | ) | ||||||
| (Dollars in Thousands) | Mortgage-Related Assets | Lima One | Corporate | Total | ||||||||||||
| March 31, 2023 | ||||||||||||||||
| Total Assets | $ | 6,061,481 | $ | 2,873,951 | $ | 376,175 | $ | 9,311,607 | ||||||||
| December 31, 2022 | ||||||||||||||||
| Total Assets | $ | 6,065,557 | $ | 2,618,695 | $ | 428,153 | $ | 9,112,405 | ||||||||
Reconciliation of GAAP Net Income to non-GAAP Distributable Earnings
“Distributable earnings” is a non-GAAP financial measure of our operating performance, within the meaning of Regulation G and Item 10(e) of Regulation S-K, as promulgated by the Securities and Exchange Commission. Distributable earnings is determined by adjusting GAAP net income/(loss) by removing certain unrealized gains and losses, primarily on residential mortgage investments, associated debt, and hedges that are, in each case, accounted for at fair value through earnings, certain realized gains and losses, as well as certain non-cash expenses and securitization-related transaction costs. Management believes that the adjustments made to GAAP earnings result in the removal of (i) income or expenses that are not reflective of the longer term performance of our investment portfolio, (ii) certain non-cash expenses, and (iii) expense items required to be recognized solely due to the election of the fair value option on certain related residential mortgage assets and associated liabilities. Distributable earnings is one of the factors that our Board of Directors considers when evaluating distributions to our shareholders. Accordingly, we believe that the adjustments to compute Distributable earnings specified below provide investors and analysts with additional information to evaluate our financial results.
Distributable earnings should be used in conjunction with results presented in accordance with GAAP. Distributable earnings does not represent and should not be considered as a substitute for net income or cash flows from operating activities, each as determined in accordance with GAAP, and our calculation of this measure may not be comparable to similarly titled measures reported by other companies.
The following table provides a reconciliation of our GAAP net income/(loss) used in the calculation of basic EPS to our non-GAAP Distributable earnings for the quarterly periods below:
| Quarter Ended | ||||||||||||||||||||
| (In Thousands, Except Per Share Amounts) | March 31, 2023 |
December 31, 2022 |
September 30, 2022 |
June 30, 2022 |
March 31, 2022 |
|||||||||||||||
| GAAP Net income/(loss) used in the calculation of basic EPS | $ | 64,407 | $ | (1,647 | ) | $ | (63,410 | ) | $ | (108,760 | ) | $ | (91,266 | ) | ||||||
| Adjustments: | ||||||||||||||||||||
| Unrealized and realized gains and losses on: | ||||||||||||||||||||
| Residential whole loans held at fair value | (129,174 | ) | 68,828 | 291,818 | 218,181 | 287,935 | ||||||||||||||
| Securities held at fair value | (2,931 | ) | 383 | (1,549 | ) | 1,459 | 2,934 | |||||||||||||
| Interest rate swaps | 40,747 | 12,725 | (108,917 | ) | (31,767 | ) | (80,753 | ) | ||||||||||||
| Securitized debt held at fair value | 48,846 | (44,988 | ) | (100,767 | ) | (84,348 | ) | (62,855 | ) | |||||||||||
| Investments in loan origination partners | — | 8,526 | 2,031 | 39,162 | 780 | |||||||||||||||
| Expense items: | ||||||||||||||||||||
| Amortization of intangible assets | 1,300 | 1,300 | 1,300 | 3,300 | 3,300 | |||||||||||||||
| Equity based compensation | 3,020 | 2,480 | 2,673 | 3,540 | 2,645 | |||||||||||||||
| Securitization-related transaction costs | 4,602 | 1,744 | 5,014 | 6,399 | 3,233 | |||||||||||||||
| Total adjustments | (33,590 | ) | 50,998 | 91,603 | 155,926 | 157,219 | ||||||||||||||
| Distributable earnings | $ | 30,817 | $ | 49,351 | $ | 28,193 | $ | 47,166 | $ | 65,953 | ||||||||||
| GAAP earnings/(loss) per basic common share | $ | 0.63 | $ | (0.02 | ) | $ | (0.62 | ) | $ | (1.06 | ) | $ | (0.86 | ) | ||||||
| Distributable earnings per basic common share | $ | 0.30 | $ | 0.48 | $ | 0.28 | $ | 0.46 | $ | 0.62 | ||||||||||
| Weighted average common shares for basic earnings per share | 101,900 | 101,800 | 101,795 | 102,515 | 106,568 | |||||||||||||||
The following table presents our non-GAAP Distributable earnings by segment for the quarterly periods below:
| (Dollars in Thousands) | Mortgage- Related Assets |
Lima One | Corporate | Total | ||||||||||||
| Three months ended March 31, 2023 | ||||||||||||||||
| GAAP Net income/(loss) used in the calculation of basic EPS | $ | 76,153 | $ | 20,215 | $ | (31,961 | ) | $ | 64,407 | |||||||
| Adjustments: | ||||||||||||||||
| Unrealized and realized gains and losses on: | ||||||||||||||||
| Residential whole loans held at fair value | (95,509 | ) | (33,665 | ) | — | (129,174 | ) | |||||||||
| Securities held at fair value | (2,931 | ) | — | — | (2,931 | ) | ||||||||||
| Interest rate swaps | 30,870 | 9,877 | — | 40,747 | ||||||||||||
| Securitized debt held at fair value | 32,580 | 16,266 | — | 48,846 | ||||||||||||
| Investments in loan origination partners | — | — | — | — | ||||||||||||
| Expense items: | ||||||||||||||||
| Amortization of intangible assets | — | 1,300 | — | 1,300 | ||||||||||||
| Equity based compensation | — | 127 | 2,893 | 3,020 | ||||||||||||
| Securitization-related transaction costs | — | — | 4,602 | 4,602 | ||||||||||||
| Total adjustments | $ | (34,990 | ) | $ | (6,095 | ) | $ | 7,495 | $ | (33,590 | ) | |||||
| Distributable earnings | $ | 41,163 | $ | 14,120 | $ | (24,466 | ) | $ | 30,817 | |||||||
| (Dollars in Thousands) | Mortgage- Related Assets |
Lima One | Corporate | Total | ||||||||||||
| Three months ended December 31, 2022 | ||||||||||||||||
| GAAP Net income/(loss) used in the calculation of basic EPS | $ | 2,789 | $ | 25,893 | $ | (30,329 | ) | $ | (1,647 | ) | ||||||
| Adjustments: | ||||||||||||||||
| Unrealized and realized gains and losses on: | ||||||||||||||||
| Residential whole loans held at fair value | 72,805 | (3,977 | ) | — | 68,828 | |||||||||||
| Securities held at fair value | 383 | — | — | 383 | ||||||||||||
| Interest rate swaps | 10,202 | 2,523 | — | 12,725 | ||||||||||||
| Securitized debt held at fair value | (30,453 | ) | (14,535 | ) | — | (44,988 | ) | |||||||||
| Investments in loan origination partners | — | — | 8,526 | 8,526 | ||||||||||||
| Expense items: | ||||||||||||||||
| Amortization of intangible assets | — | 1,300 | — | 1,300 | ||||||||||||
| Equity based compensation | — | 53 | 2,427 | 2,480 | ||||||||||||
| Securitization-related transaction costs | — | — | 1,744 | 1,744 | ||||||||||||
| Total adjustments | $ | 52,937 | $ | (14,636 | ) | $ | 12,697 | $ | 50,998 | |||||||
| Distributable earnings | $ | 55,726 | $ | 11,257 | $ | (17,632 | ) | $ | 49,351 | |||||||
Reconciliation of GAAP Book Value per Common Share to non-GAAP Economic Book Value per Common Share
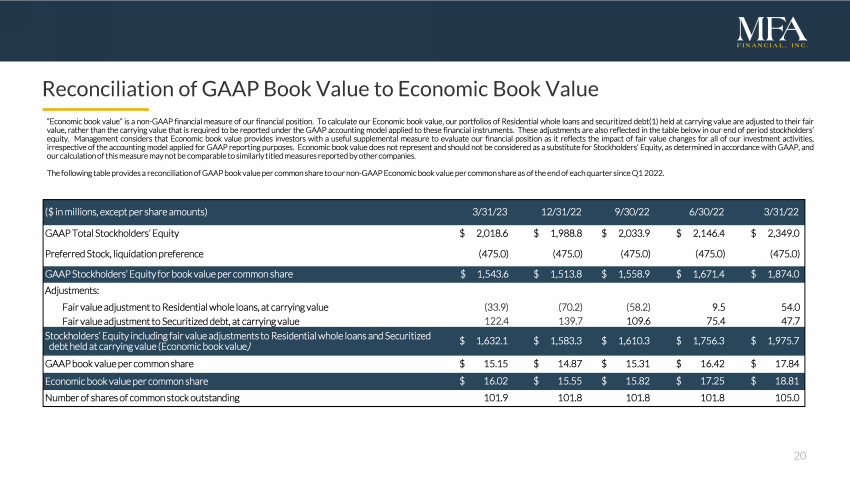
“Economic book value” is a non-GAAP financial measure of our financial position. To calculate our Economic book value, our portfolios of Residential whole loans and securitized debt held at carrying value are adjusted to their fair value, rather than the carrying value that is required to be reported under the GAAP accounting model applied to these financial instruments. These adjustments are also reflected in the table below in our end of period stockholders’ equity. Management considers that Economic book value provides investors with a useful supplemental measure to evaluate our financial position as it reflects the impact of fair value changes for all of our investment activities, irrespective of the accounting model applied for GAAP reporting purposes. Economic book value does not represent and should not be considered as a substitute for Stockholders’ Equity, as determined in accordance with GAAP, and our calculation of this measure may not be comparable to similarly titled measures reported by other companies.
The following table provides a reconciliation of our GAAP book value per common share to our non-GAAP Economic book value per common share as of the quarterly periods below:
| Quarter Ended: | ||||||||||||||||||||
| (In Millions, Except Per Share Amounts) | March 31, 2023 |
December 31, 2022 |
September 30, 2022 |
June 30, 2022 |
March 31, 2022 |
|||||||||||||||
| GAAP Total Stockholders’ Equity | $ | 2,018.6 | $ | 1,988.8 | $ | 2,033.9 | $ | 2,146.4 | $ | 2,349.0 | ||||||||||
| Preferred Stock, liquidation preference | (475.0 | ) | (475.0 | ) | (475.0 | ) | (475.0 | ) | (475.0 | ) | ||||||||||
| GAAP Stockholders’ Equity for book value per common share | 1,543.6 | 1,513.8 | 1,558.9 | 1,671.4 | 1,874.0 | |||||||||||||||
| Adjustments: | ||||||||||||||||||||
| Fair value adjustment to Residential whole loans, at carrying value | (33.9 | ) | (70.2 | ) | (58.2 | ) | 9.5 | 54.0 | ||||||||||||
| Fair value adjustment to Securitized debt, at carrying value | 122.4 | 139.7 | 109.6 | 75.4 | 47.7 | |||||||||||||||
| Stockholders’ Equity including fair value adjustments to Residential whole loans and Securitized debt held at carrying value (Economic book value) | $ | 1,632.1 | $ | 1,583.3 | $ | 1,610.3 | $ | 1,756.3 | $ | 1,975.7 | ||||||||||
| GAAP book value per common share | $ | 15.15 | $ | 14.87 | $ | 15.31 | $ | 16.42 | $ | 17.84 | ||||||||||
| Economic book value per common share | $ | 16.02 | $ | 15.55 | $ | 15.82 | $ | 17.25 | $ | 18.81 | ||||||||||
| Number of shares of common stock outstanding | 101.9 | 101.8 | 101.8 | 101.8 | 105.0 | |||||||||||||||
Cautionary Note Regarding Forward-Looking Statements
When used in this press release or other written or oral communications, statements that are not historical in nature, including those containing words such as “will,” “believe,” “expect,” “anticipate,” “estimate,” “plan,” “continue,” “intend,” “should,” “could,” “would,” “may,” the negative of these words or similar expressions, are intended to identify “forward-looking statements” within the meaning of Section 27A of the Securities Act of 1933, as amended, and Section 21E of the Securities Exchange Act of 1934, as amended, and, as such, may involve known and unknown risks, uncertainties and assumptions. These forward-looking statements include information about possible or assumed future results with respect to MFA’s business, financial condition, liquidity, results of operations, plans and objectives. Among the important factors that could cause our actual results to differ materially from those projected in any forward-looking statements that we make are: general economic developments and trends and the performance of the housing, real estate, mortgage finance, broader financial markets; inflation, increases in interest rates and changes in the market (i.e., fair) value of MFA’s residential whole loans, MBS, securitized debt and other assets, as well as changes in the value of MFA’s liabilities accounted for at fair value through earnings; the effectiveness of hedging transactions; changes in the prepayment rates on residential mortgage assets, an increase of which could result in a reduction of the yield on certain investments in its portfolio and could require MFA to reinvest the proceeds received by it as a result of such prepayments in investments with lower coupons, while a decrease in which could result in an increase in the interest rate duration of certain investments in MFA’s portfolio making their valuation more sensitive to changes in interest rates and could result in lower forecasted cash flows; credit risks underlying MFA’s assets, including changes in the default rates and management’s assumptions regarding default rates on the mortgage loans in MFA’s residential whole loan portfolio; MFA’s ability to borrow to finance its assets and the terms, including the cost, maturity and other terms, of any such borrowings; implementation of or changes in government regulations or programs affecting MFA’s business; MFA’s estimates regarding taxable income, the actual amount of which is dependent on a number of factors, including, but not limited to, changes in the amount of interest income and financing costs, the method elected by MFA to accrete the market discount on residential whole loans and the extent of prepayments, realized losses and changes in the composition of MFA’s residential whole loan portfolios that may occur during the applicable tax period, including gain or loss on any MBS disposals or whole loan modifications, foreclosures and liquidations; the timing and amount of distributions to stockholders, which are declared and paid at the discretion of MFA’s Board of Directors and will depend on, among other things, MFA’s taxable income, its financial results and overall financial condition and liquidity, maintenance of its REIT qualification and such other factors as MFA’s Board of Directors deems relevant; MFA’s ability to maintain its qualification as a REIT for federal income tax purposes; MFA’s ability to maintain its exemption from registration under the Investment Company Act of 1940, as amended (or the “Investment Company Act”), including statements regarding the concept release issued by the Securities and Exchange Commission (“SEC”) relating to interpretive issues under the Investment Company Act with respect to the status under the Investment Company Act of certain companies that are engaged in the business of acquiring mortgages and mortgage-related interests; MFA’s ability to continue growing its residential whole loan portfolio, which is dependent on, among other things, the supply of loans offered for sale in the market; targeted or expected returns on our investments in recently-originated mortgage loans, the performance of which is, similar to our other mortgage loan investments, subject to, among other things, differences in prepayment risk, credit risk and financing costs associated with such investments; risks associated with the ongoing operation of Lima One Holdings, LLC (including, without limitation, unanticipated expenditures relating to or liabilities arising from its operation (including, among other things, a failure to realize management’s assumptions regarding expected growth in business purpose loan (BPL) origination volumes and credit risks underlying BPLs, including changes in the default rates and management’s assumptions regarding default rates on the BPLs originated by Lima One)); expected returns on MFA’s investments in nonperforming residential whole loans (“NPLs”), which are affected by, among other things, the length of time required to foreclose upon, sell, liquidate or otherwise reach a resolution of the property underlying the NPL, home price values, amounts advanced to carry the asset (e.g., taxes, insurance, maintenance expenses, etc. on the underlying property) and the amount ultimately realized upon resolution of the asset; risks associated with our investments in MSR-related assets, including servicing, regulatory and economic risks; risks associated with our investments in loan originators; risks associated with investing in real estate assets generally, including changes in business conditions and the general economy; and other risks, uncertainties and factors, including those described in the annual, quarterly and current reports that we file with the SEC. These forward-looking statements are based on beliefs, assumptions and expectations of MFA’s future performance, taking into account information currently available. Readers and listeners are cautioned not to place undue reliance on these forward-looking statements, which speak only as of the date on which they are made. New risks and uncertainties arise over time and it is not possible to predict those events or how they may affect MFA. Except as required by law, MFA is not obligated to, and does not intend to, update or revise any forward-looking statements, whether as a result of new information, future events or otherwise.
|
Company Update FIRST QUARTER 2023 |
|
2
Q2 2022 Financial Snapshot
Forward-looking statements
When used in this presentation or other written or oral communications, statements that are not historical in nature, including those containing words such as “will,” “believe,” “expect,” “anticipate,” “estimate,” “plan,” “continue,”
“intend,” “should,” “could,” “would,” “may,” the negative of these words or similar expressions, are intended to identify “forward-looking statements” within the meaning of Section 27A of the Securities Act of 1933, as amended,
and Section 21E of the S |
|
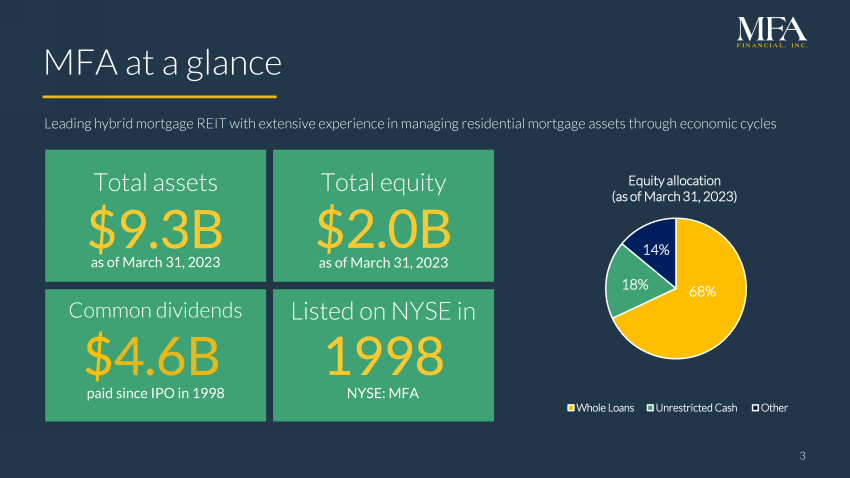
3 MFA at a glance $2.0B Total equity $4.6B Common dividends Leading hybrid mortgage REIT with extensive experience in managing residential mortgage assets through economic cycles $9.3B Total assets paid since IPO in 1998 1998 Listed on NYSE in as of March 31, 2023 as of March 31, 2023 NYSE: MFA 68% 18% 14% Equity allocation (as of March 31, 2023) Whole Loans Unrestricted Cash Other |
|
4 Q1 2023 financial snapshot MFA protected and grew book value during Q1 due to hedging and securitization activities undertaken over the past year $15.15 $16.02 GAAP net income5 $0.63 per common share Distributable earnings4 $0.30 per common share Q1 dividend $0.35 per common share GAAP book value Economic book value1 per common share per common share $362M Substantial unrestricted cash 1.6x Recourse leverage2 4 Total economic return3 5.3% for the quarter See page 24 for end notes |
|
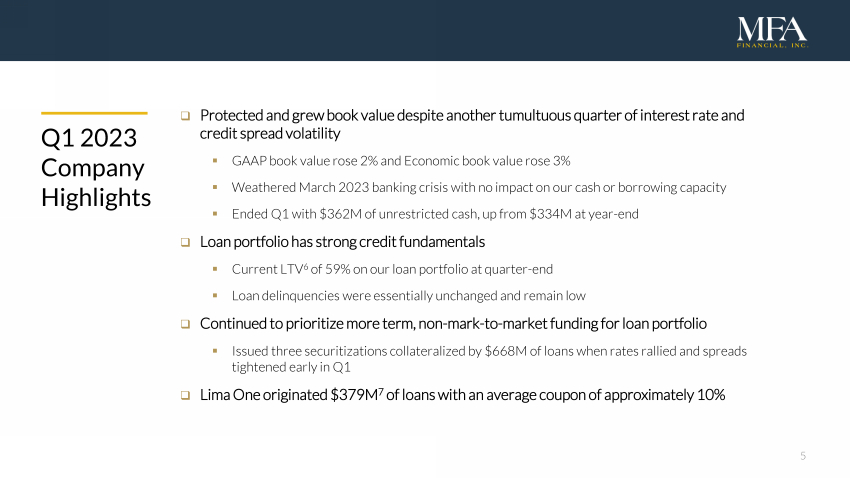
5 Q1 2023 Company Highlights Protected and grew book value despite another tumultuous quarter of interest rate and credit spread volatility GAAP book value rose 2% and Economic book value rose 3% Weathered March 2023 banking crisis with no impact on our cash or borrowing capacity Ended Q1 with $362M of unrestricted cash, up from $334M at year-end Loan portfolio has strong credit fundamentals Current LTV6 of 59% on our loan portfolio at quarter-end Loan delinquencies were essentially unchanged and remain low Continued to prioritize more term, non-mark-to-market funding for loan portfolio Issued three securitizations collateralized by $668M of loans when rates rallied and spreads tightened early in Q1 Lima One originated $379M7 of loans with an average coupon of approximately 10% |
|
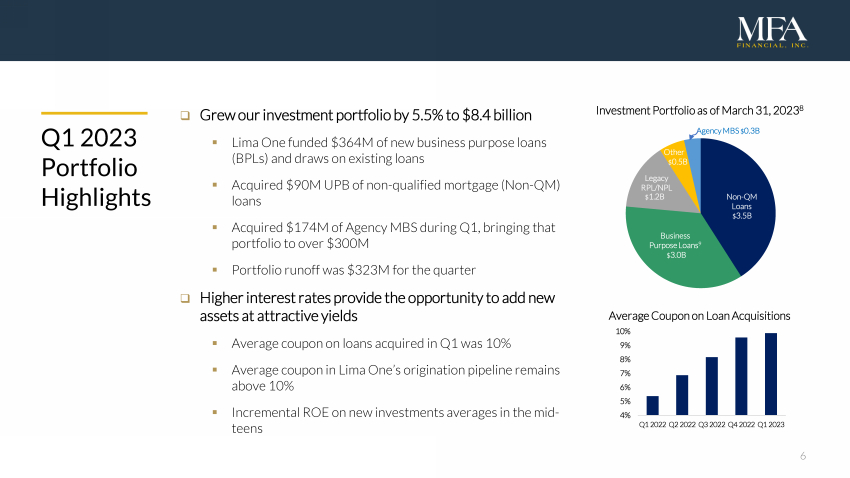
6 Grew our investment portfolio by 5.5% to $8.4 billion Lima One funded $364M of new business purpose loans (BPLs) and draws on existing loans Acquired $90M UPB of non-qualified mortgage (Non-QM) loans Acquired $174M of Agency MBS during Q1, bringing that portfolio to over $300M Portfolio runoff was $323M for the quarter Higher interest rates provide the opportunity to add new assets at attractive yields Average coupon on loans acquired in Q1 was 10% Average coupon in Lima One’s origination pipeline remains above 10% Incremental ROE on new investments averages in the mid-teens Q1 2023 Portfolio Highlights 4% 5% 6% 7% 8% 9% 10% Q1 2022 Q2 2022 Q3 2022 Q4 2022 Q1 2023 Non-QM Loans Business Purpose Loans9 Legacy RPL/NPL Other Agency MBS $0.3B $3.5B $3.0B $1.2B $0.5B Investment Portfolio as of March 31, 20238 Average Coupon on Loan Acquisitions |
|
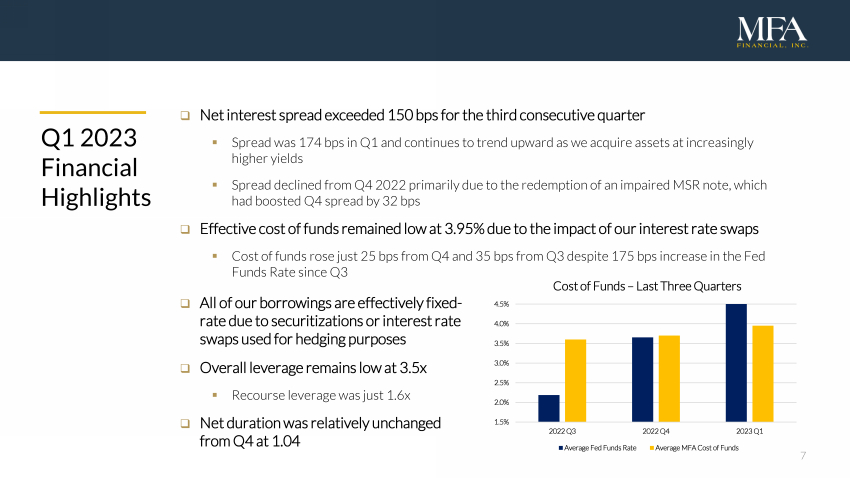
7 All of our borrowings are effectively fixed-rate due to securitizations or interest rate swaps used for hedging purposes Overall leverage remains low at 3.5x Recourse leverage was just 1.6x Net duration was relatively unchanged from Q4 at 1.04 Q1 2023 Financial Highlights Net interest spread exceeded 150 bps for the third consecutive quarter Spread was 174 bps in Q1 and continues to trend upward as we acquire assets at increasingly higher yields Spread declined from Q4 2022 primarily due to the redemption of an impaired MSR note, which had boosted Q4 spread by 32 bps Effective cost of funds remained low at 3.95% due to the impact of our interest rate swaps Cost of funds rose just 25 bps from Q4 and 35 bps from Q3 despite 175 bps increase in the Fed Funds Rate since Q3 1.5% 2.0% 2.5% 3.0% 3.5% 4.0% 4.5% 2022 Q3 2022 Q4 2023 Q1 Cost of Funds – Last Three Quarters Average Fed Funds Rate Average MFA Cost of Funds |
|
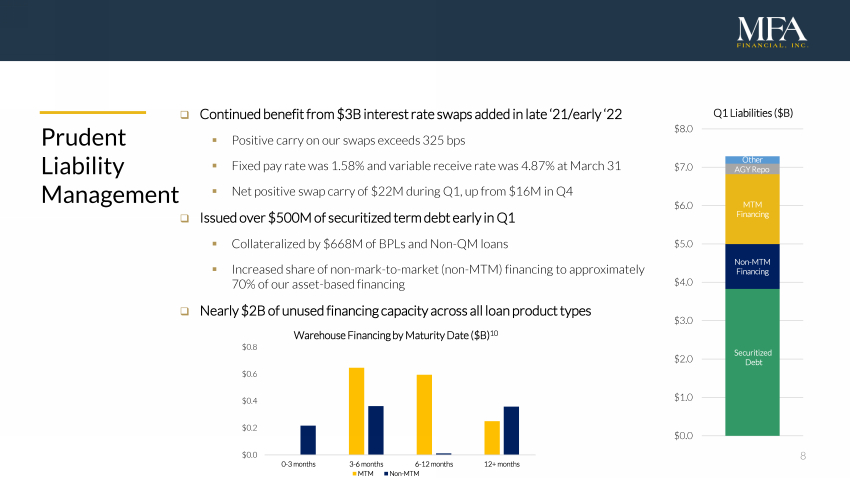
8 Continued benefit from $3B interest rate swaps added in late ‘21/early ‘22 Positive carry on our swaps exceeds 325 bps Fixed pay rate was 1.58% and variable receive rate was 4.87% at March 31 Net positive swap carry of $22M during Q1, up from $16M in Q4 Issued over $500M of securitized term debt early in Q1 Collateralized by $668M of BPLs and Non-QM loans Increased share of non-mark-to-market (non-MTM) financing to approximately 70% of our asset-based financing Nearly $2B of unused financing capacity across all loan product types Prudent Liability Management Securitized Debt Non-MTM Financing MTM Financing AGY Repo Other $0.0 $1.0 $2.0 $3.0 $4.0 $5.0 $6.0 $7.0 $8.0 Q1 Liabilities ($B) $0.0 $0.2 $0.4 $0.6 $0.8 0-3 months 3-6 months 6-12 months 12+ months Warehouse Financing by Maturity Date ($B)10 MTM Non-MTM |
|
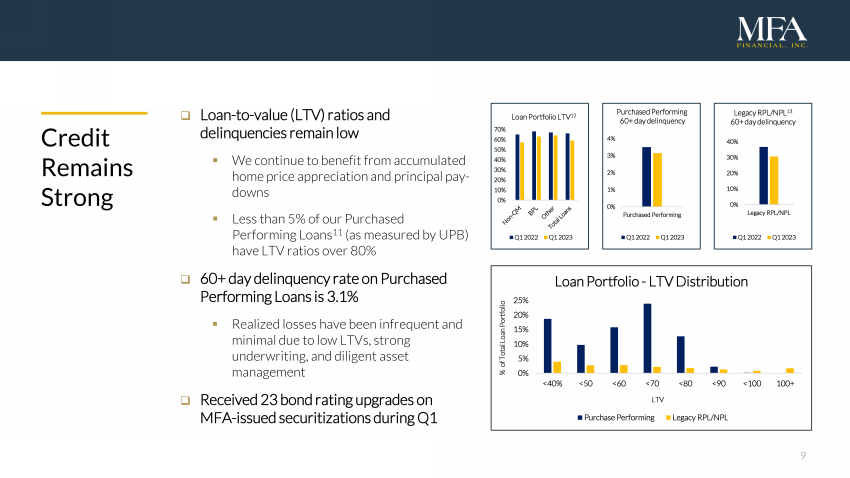
9 Loan-to-value (LTV) ratios and delinquencies remain low We continue to benefit from accumulated home price appreciation and principal pay-downs Less than 5% of our Purchased Performing Loans11 (as measured by UPB) have LTV ratios over 80% Credit Remains Strong 60+ day delinquency rate on Purchased Performing Loans is 3.1% Realized losses have been infrequent and minimal due to low LTVs, strong underwriting, and diligent asset management Received 23 bond rating upgrades on MFA-issued securitizations during Q1 0% 10% 20% 30% 40% Legacy RPL/NPL Legacy RPL/NPL13 60+ day delinquency Q1 2022 Q1 2023 0% 1% 2% 3% 4% Purchased Performing Purchased Performing 60+ day delinquency Q1 2022 Q1 2023 0% 10% 20% 30% 40% 50% 60% 70% Loan Portfolio LTV12 Q1 2022 Q1 2023 0% 5% 10% 15% 20% 25% <40% <50 <60 <70 <80 <90 <100 100+ % of Total Loan Portfolio LTV Loan Portfolio - LTV Distribution Purchase Performing Legacy RPL/NPL |
|
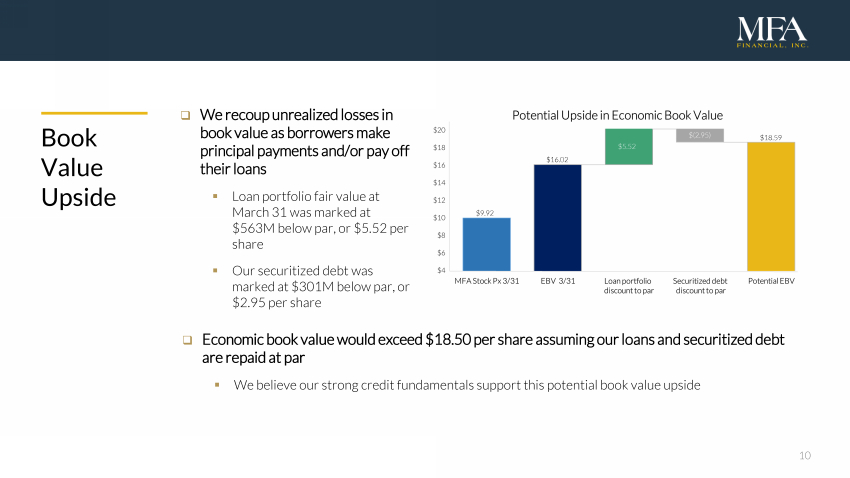
10 Book Value Upside We recoup unrealized losses in book value as borrowers make principal payments and/or pay off their loans Loan portfolio fair value at March 31 was marked at $563M below par, or $5.52 per share Our securitized debt was marked at $301M below par, or $2.95 per share Economic book value would exceed $18.50 per share assuming our loans and securitized debt are repaid at par We believe our strong credit fundamentals support this potential book value upside $9.92 $16.02 $(2.95) $5.52 $18.59 |
|
11 Continued momentum from record origination volume in 2022 $379M of originations7 with an average LTV14 of 65% and FICO score of 747 Origination volume was essentially unchanged from Q4 despite impact of higher coupons and tighter underwriting standards implemented in 2022 Combination of sector upheaval and MFA’s strong balance sheet has enabled Lima to gain market share from competing lenders Lima One segment contributed 46% of our distributable earnings Lima offers a broad range of loan products, including transitional loans, single-family rental loans and small-balance multifamily loans Origination fees, servicing fees and other fee income totaled $9M in Q1 Securitized $355M of Lima-originated loans across two issuances early in the quarter when rates rallied and spreads tightened Q1 2023 Lima One Highlights |
|
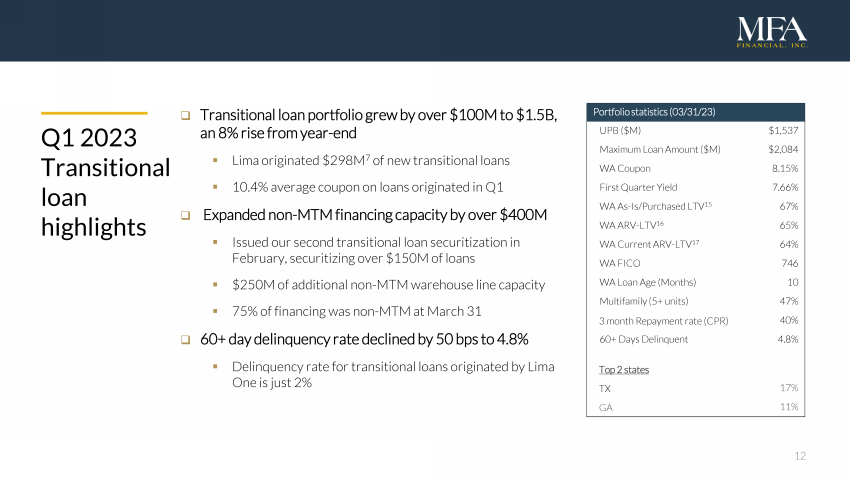
12 Portfolio statistics (03/31/23) UPB ($M) $1,537 Maximum Loan Amount ($M) $2,084 WA Coupon 8.15% First Quarter Yield 7.66% WA As-Is/Purchased LTV15 67% WA ARV-LTV16 65% WA Current ARV-LTV17 64% WA FICO 746 WA Loan Age (Months) 10 Multifamily (5+ units) 47% 3 month Repayment rate (CPR) 40% 60+ Days Delinquent 4.8% Top 2 states TX 17% GA 11% Q1 2023 Transitional loan highlights Transitional loan portfolio grew by over $100M to $1.5B, an 8% rise from year-end Lima originated $298M7 of new transitional loans 10.4% average coupon on loans originated in Q1 Expanded non-MTM financing capacity by over $400M Issued our second transitional loan securitization in February, securitizing over $150M of loans $250M of additional non-MTM warehouse line capacity 75% of financing was non-MTM at March 31 60+ day delinquency rate declined by 50 bps to 4.8% Delinquency rate for transitional loans originated by Lima One is just 2% |
|
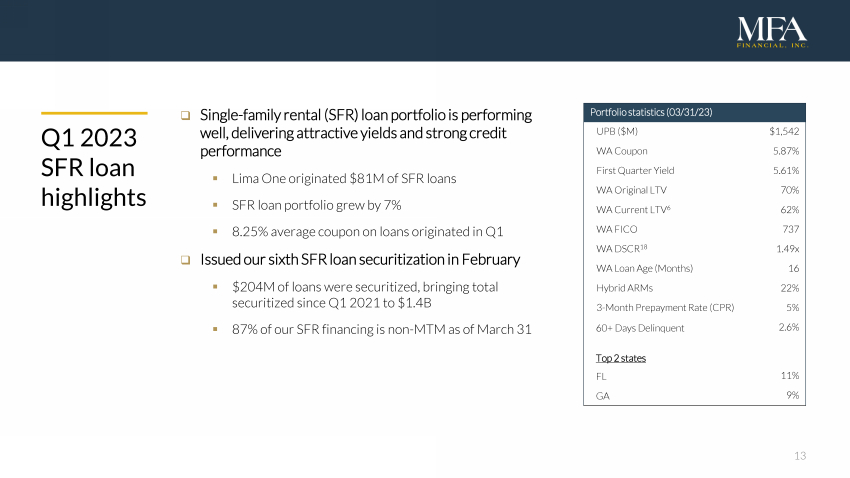
13 Portfolio statistics (03/31/23) UPB ($M) $1,542 WA Coupon 5.87% First Quarter Yield 5.61% WA Original LTV 70% WA Current LTV6 62% WA FICO 737 WA DSCR18 1.49x WA Loan Age (Months) 16 Hybrid ARMs 22% 3-Month Prepayment Rate (CPR) 5% 60+ Days Delinquent 2.6% Top 2 states FL 11% GA 9% Q1 2023 SFR loan highlights Single-family rental (SFR) loan portfolio is performing well, delivering attractive yields and strong credit performance Lima One originated $81M of SFR loans SFR loan portfolio grew by 7% 8.25% average coupon on loans originated in Q1 Issued our sixth SFR loan securitization in February $204M of loans were securitized, bringing total securitized since Q1 2021 to $1.4B 87% of our SFR financing is non-MTM as of March 31 |
|
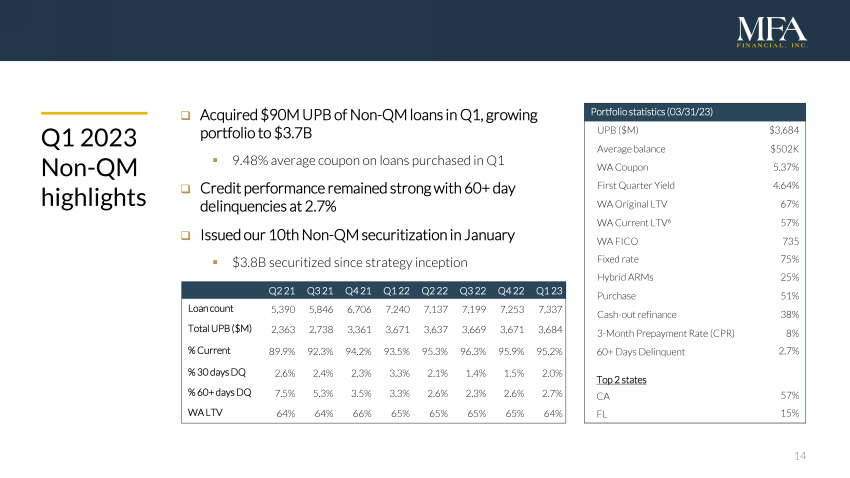
14 Q2 21 Q3 21 Q4 21 Q1 22 Q2 22 Q3 22 Q4 22 Q1 23 Loan count 5,390 5,846 6,706 7,240 7,137 7,199 7,253 7,337 Total UPB($M) 2,363 2,738 3,361 3,671 3,637 3,669 3,671 3,684 % Current 89.9% 92.3% 94.2% 93.5% 95.3% 96.3% 95.9% 95.2% % 30 daysDQ 2.6% 2.4% 2.3% 3.3% 2.1% 1.4% 1.5% 2.0% % 60+ daysDQ 7.5% 5.3% 3.5% 3.3% 2.6% 2.3% 2.6% 2.7% WA LTV 64% 64% 66% 65% 65% 65% 65% 64% Q1 2023 Non-QM highlights Acquired $90M UPB of Non-QM loans in Q1, growing portfolio to $3.7B 9.48% average coupon on loans purchased in Q1 Credit performance remained strong with 60+ day delinquencies at 2.7% Issued our 10th Non-QM securitization in January $3.8B securitized since strategy inception Portfolio statistics (03/31/23) UPB ($M) $3,684 Average balance $502K WA Coupon 5.37% First Quarter Yield 4.64% WA Original LTV 67% WA Current LTV6 57% WA FICO 735 Fixed rate 75% Hybrid ARMs 25% Purchase 51% Cash-out refinance 38% 3-Month Prepayment Rate (CPR) 8% 60+ Days Delinquent 2.7% Top 2 states CA 57% FL 15% |
|
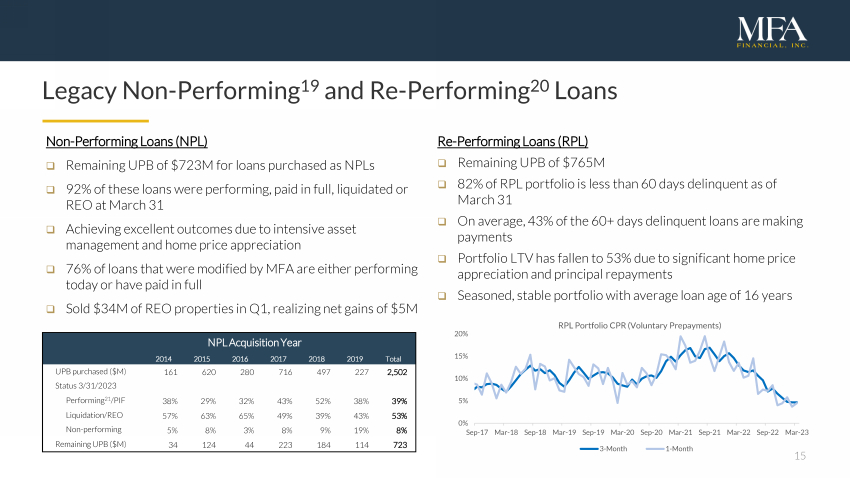
15 Legacy Non-Performing19 and Re-Performing20 Loans Non-Performing Loans (NPL) Remaining UPB of $723M for loans purchased as NPLs 92% of these loans were performing, paid in full, liquidated or REO at March 31 Achieving excellent outcomes due to intensive asset management and home price appreciation 76% of loans that were modified by MFA are either performing today or have paid in full Sold $34M of REO properties in Q1, realizing net gains of $5M Re-Performing Loans (RPL) Remaining UPB of $765M 82% of RPL portfolio is less than 60 days delinquent as of March 31 On average, 43% of the 60+ days delinquent loans are making payments Portfolio LTV has fallen to 53% due to significant home price appreciation and principal repayments Seasoned, stable portfolio with average loan age of 16 years NPL Acquisition Year 2014 2015 2016 2017 2018 2019 Total UPB purchased ($M) 161 620 280 716 497 227 2,502 Status 3/31/2023 Performing21/PIF 38% 29% 32% 43% 52% 38% 39% Liquidation/REO 57% 63% 65% 49% 39% 43% 53% Non-performing 5% 8% 3% 8% 9% 19% 8% Remaining UPB ($M) 34 124 44 223 184 114 723 0% 5% 10% 15% 20% Sep-17 Mar-18 Sep-18 Mar-19 Sep-19 Mar-20 Sep-20 Mar-21 Sep-21 Mar-22 Sep-22 Mar-23 RPL Portfolio CPR (Voluntary Prepayments) 3-Month 1-Month |
|
16 Appendix James Casebere, Landscape with Houses (Dutchess County, NY) #2, 2010 (detail) |
|
17 MFA Financial Overview MFA Financial, Inc. (NYSE: MFA) is a leading specialty finance company that invests in and finances residential mortgage assets MFA owns a diversified portfolio of residential mortgage assets, including transitional and term business purpose loans (BPLs), non-qualified mortgage (Non-QM) loans, re-performing/non-performing loans and residential mortgage-backed securities (RMBS) In 2021, MFA acquired Lima One Capital, a leading nationwide originator and servicer of BPLs with over $7B in originations since its formation MFA originates BPLs directly through Lima One and acquires Non-QM loans through flow and mini-bulk arrangements with a select group of originators with which it holds strong relationships MFA operates a leading residential credit securitization platform, with over $2.3B of issuance in 2022 and $7.3B since inception MFA has deep expertise in residential credit and a long history of investing in new asset classes when compelling opportunities arise |
|
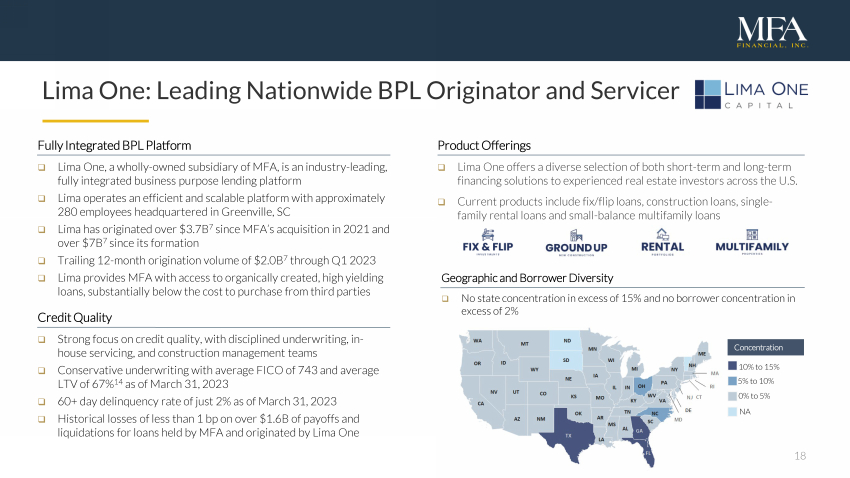
18 Lima One: Leading Nationwide BPL Originator and Servicer Product Offerings Lima One offers a diverse selection of both short-term and long-term financing solutions to experienced real estate investors across the U.S. Current products include fix/flip loans, construction loans, single-family rental loans and small-balance multifamily loans Fully Integrated BPL Platform Lima One, a wholly-owned subsidiary of MFA, is an industry-leading, fully integrated business purpose lending platform Lima operates an efficient and scalable platform with approximately 280 employees headquartered in Greenville, SC Lima has originated over $3.7B7 since MFA’s acquisition in 2021 and over $7B7 since its formation Trailing 12-month origination volume of $2.0B7 through Q1 2023 Lima provides MFA with access to organically created, high yielding loans, substantially below the cost to purchase from third parties Credit Quality Strong focus on credit quality, with disciplined underwriting, in-house servicing, and construction management teams Conservative underwriting with average FICO of 743 and average LTV of 67%14 as of March 31, 2023 60+ day delinquency rate of just 2% as of March 31, 2023 Historical losses of less than 1 bp on over $1.6B of payoffs and liquidations for loans held by MFA and originated by Lima One Geographic and Borrower Diversity No state concentration in excess of 15% and no borrower concentration in excess of 2% Concentration 10% to 15% 5% to 10% 0% to 5% NA |
|
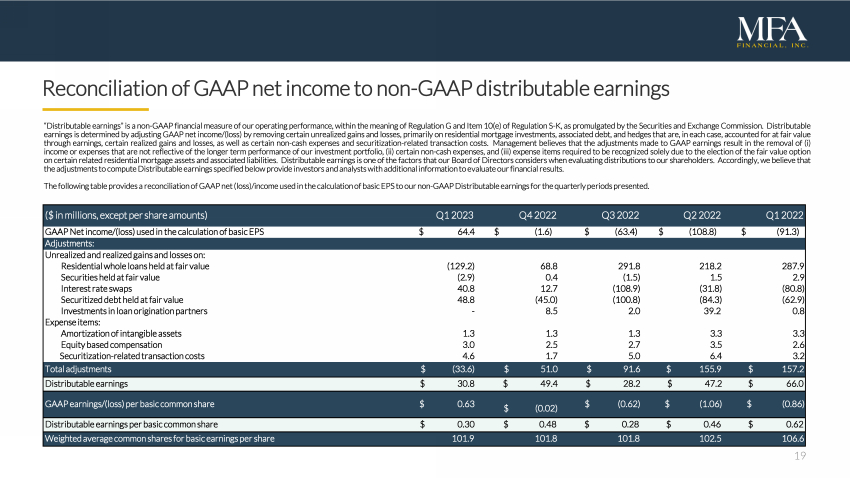
19 Reconciliation of GAAP net income to non-GAAP distributable earnings “Distributable earnings” is a non-GAAP financial measure of our operating performance, within the meaning of Regulation G and Item 10(e) of Regulation S-K, as promulgated by the Securities and Exchange Commission. Distributable earnings is determined by adjusting GAAP net income/(loss) by removing certain unrealized gains and losses, primarily on residential mortgage investments, associated debt, and hedges that are, in each case, accounted for at fair value through earnings, certain realized gains and losses, as well as certain non-cash expenses and securitization-related transaction costs. Management believes that the adjustments made to GAAP earnings result in the removal of (i) income or expenses that are not reflective of the longer term performance of our investment portfolio, (ii) certain non-cash expenses, and (iii) expense items required to be recognized solely due to the election of the fair value option on certain related residential mortgage assets and associated liabilities. Distributable earnings is one of the factors that our Board of Directors considers when evaluating distributions to our shareholders. Accordingly, we believe that the adjustments to computeDistributable earnings specified belowprovide investors and analystswith additional information to evaluate ourfinancialresults. The following table provides a reconciliation of GAAP net(loss)/income used in the calculation of basicEPS to our non-GAAP Distributable earnings forthe quarterly periodspresented. ($ in millions, except per share amounts) Q1 2023 Q4 2022 Q3 2022 Q2 2022 Q1 2022 GAAP Net income/(loss) used in the calculation of basic EPS $ 64.4 $ (1.6) $ (63.4) $ (108.8) $ (91.3) Adjustments: Unrealized and realized gains and losses on: Residential whole loans held at fair value (129.2) 68.8 291.8 218.2 287.9 Securities held at fair value (2.9) 0.4 (1.5) 1.5 2.9 Interest rate swaps 40.8 12.7 (108.9) (31.8) (80.8) Securitized debt held at fair value 48.8 (45.0) (100.8) (84.3) (62.9) Investments in loan origination partners - 8.5 2.0 39.2 0.8 Expense items: Amortization of intangible assets 1.3 1.3 1.3 3.3 3.3 Equity based compensation 3.0 2.5 2.7 3.5 2.6 Securitization-related transaction costs 4.6 1.7 5.0 6.4 3.2 Total adjustments $ (33.6) $ 51.0 $ 91.6 $ 155.9 $ 157.2 Distributable earnings $ 30.8 $ 49.4 $ 28.2 $ 47.2 $ 66.0 GAAP earnings/(loss) per basic common share $ 0.63 $ (0.02) $ (0.62) $ (1.06) $ (0.86) Distributable earnings per basic common share $ 0.30 $ 0.48 $ 0.28 $ 0.46 $ 0.62 Weighted average common shares for basic earnings per share 101.9 101.8 101.8 102.5 106.6 |
|
20 Reconciliation of GAAP Book Value to Economic Book Value “Economic book value” is a non-GAAP financial measure of our financial position. To calculate our Economic book value, our portfolios of Residential whole loans and securitized debt(1) held at carrying value are adjusted to their fair value, rather than the carrying value that is required to be reported under the GAAP accounting model applied to these financial instruments. These adjustments are also reflected in the table below in our end of period stockholders’ equity. Management considers that Economic book value provides investors with a useful supplemental measure to evaluate our financial position as it reflects the impact of fair value changes for all of our investment activities, irrespective of the accounting model applied for GAAP reporting purposes. Economic book value does notrepresent and should not be considered as a substitute for Stockholders’ Equity, as determined in accordance with GAAP, and our calculation ofthismeasuremay not be comparable to similarly titledmeasures reported by other companies. The following table provides a reconciliation of GAAP book value per common share to our non-GAAP Economic book value per common share as ofthe end of each quarter sinceQ1 2022. ($ in millions, except per share amounts) 3/31/23 12/31/22 9/30/22 6/30/22 3/31/22 GAAP Total Stockholders’ Equity $ 2,018.6 $ 1,988.8 $ 2,033.9 $ 2,146.4 $ 2,349.0 Preferred Stock, liquidation preference (475.0) (475.0) (475.0) (475.0) (475.0) GAAP Stockholders’ Equity for book value per common share $ 1,543.6 $ 1,513.8 $ 1,558.9 $ 1,671.4 $ 1,874.0 Adjustments: Fair value adjustment to Residential whole loans, at carrying value (33.9) (70.2) (58.2) 9.5 54.0 Fair value adjustment to Securitized debt, at carrying value 122.4 139.7 109.6 75.4 47.7 Stockholders’ Equity including fair value adjustments to Residential whole loans and Securitized debt held at carrying value (Economic book value) $ 1,632.1 $ 1,583.3 $ 1,610.3 $ 1,756.3 $ 1,975.7 GAAP book value per common share $ 15.15 $ 14.87 $ 15.31 $ 16.42 $ 17.84 Economic book value per common share $ 16.02 $ 15.55 $ 15.82 $ 17.25 $ 18.81 Number of shares of common stock outstanding 101.9 101.8 101.8 101.8 105.0 |
|
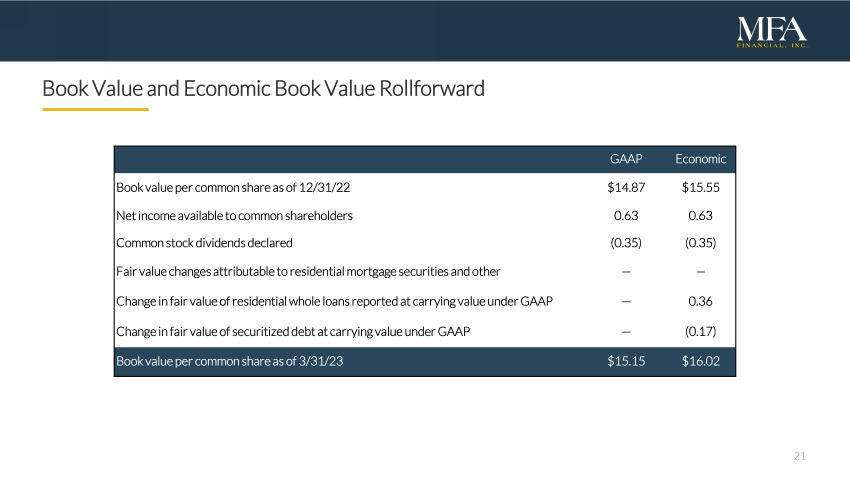
21 Book Value and Economic Book Value Rollforward GAAP Economic Book value per common share as of 12/31/22 $14.87 $15.55 Net income available to common shareholders 0.63 0.63 Common stock dividends declared (0.35) (0.35) Fair value changes attributable to residential mortgage securities and other — — Change in fair value of residential whole loans reported at carrying value under GAAP — 0.36 Change in fair value of securitized debt at carrying value under GAAP — (0.17) Book value per common share as of 3/31/23 $15.15 $16.02 |
|
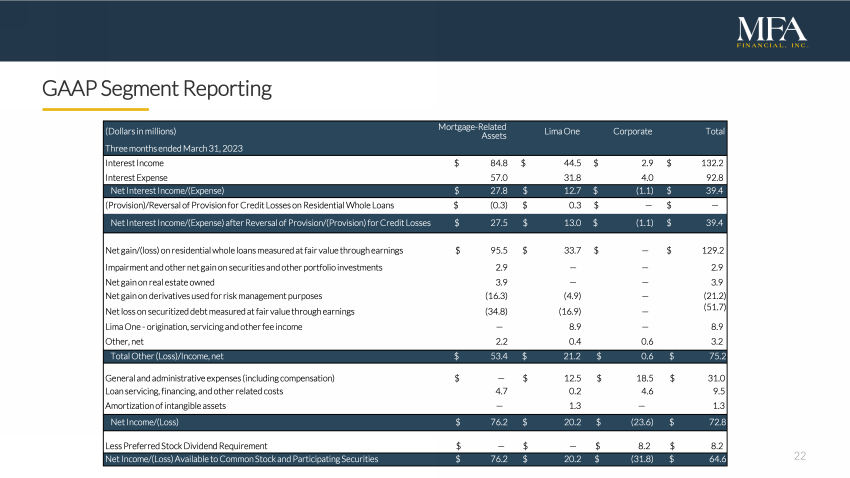
22 GAAP Segment Reporting (Dollars in millions) Mortgage-Related Assets Lima One Corporate Total Three months ended March 31, 2023 Interest Income $ 84.8 $ 44.5 $ 2.9 $ 132.2 Interest Expense 57.0 31.8 4.0 92.8 Net Interest Income/(Expense) $ 27.8 $ 12.7 $ (1.1) $ 39.4 (Provision)/Reversal of Provisionfor Credit Losses on Residential Whole Loans $ (0.3) $ 0.3 $ — $ — Net Interest Income/(Expense) after Reversal of Provision/(Provision)for Credit Losses $ 27.5 $ 13.0 $ (1.1) $ 39.4 Net gain/(loss) on residential whole loans measured at fair value through earnings $ 95.5 $ 33.7 $ — $ 129.2 Impairment and other net gain on securities and other portfolio investments 2.9 — — 2.9 Net gain on real estate owned 3.9 — — 3.9 Net gain on derivatives used for risk management purposes (16.3) (4.9) — (21.2) Net loss on securitized debt measured at fair value through earnings (34.8) (16.9) — (51.7) Lima One - origination, servicing and other fee income — 8.9 — 8.9 Other, net 2.2 0.4 0.6 3.2 Total Other (Loss)/Income, net $ 53.4 $ 21.2 $ 0.6 $ 75.2 General and administrative expenses (including compensation) $ — $ 12.5 $ 18.5 $ 31.0 Loan servicing, financing, and other related costs 4.7 0.2 4.6 9.5 Amortization of intangible assets — 1.3 — 1.3 Net Income/(Loss) $ 76.2 $ 20.2 $ (23.6) $ 72.8 Less Preferred Stock Dividend Requirement $ — $ — $ 8.2 $ 8.2 Net Income/(Loss)Available to Common Stock and Participating Securities $ 76.2 $ 20.2 $ (31.8) $ 64.6 |
|
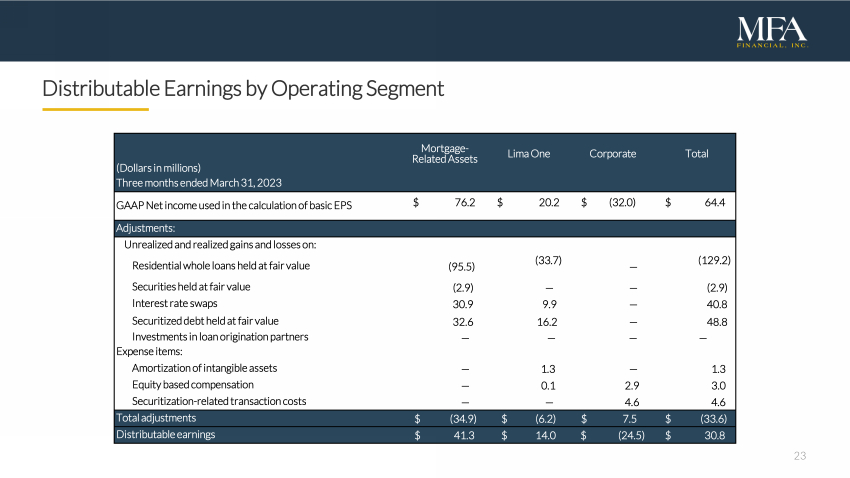
23 Distributable Earnings by Operating Segment (Dollars in millions) Mortgage-Related Assets Lima One Corporate Total Three months ended March 31, 2023 GAAP Net income used in the calculation of basic EPS $ 76.2 $ 20.2 $ (32.0) $ 64.4 Adjustments: Unrealized and realized gains and losses on: Residential whole loans held at fair value (95.5) (33.7) — (129.2) Securities held at fair value (2.9) — — (2.9) Interest rate swaps 30.9 9.9 — 40.8 Securitized debt held at fair value 32.6 16.2 — 48.8 Investments in loan origination partners — — — — Expense items: Amortization of intangible assets — 1.3 — 1.3 Equity based compensation — 0.1 2.9 3.0 Securitization-related transaction costs — — 4.6 4.6 Total adjustments $ (34.9) $ (6.2) $ 7.5 $ (33.6) Distributable earnings $ 41.3 $ 14.0 $ (24.5) $ 30.8 |
|
24 Endnotes 1) Economic book value is a non-GAAP financial measure. Refer to slide 20 for further information regarding the calculation of this measure and a reconciliation to GAAP book value. 2) Recourse leverage is the ratio of MFA’s financing liabilities (excluding non-recourse Securitized Debt) to net equity. Including Securitized Debt, MFA’s overall leverage ratio at March 31, 2023 was 3.5x. 3) Total economic return is calculated as the quarterly change in Economic Book Value (EBV) plus common dividends declared during the quarter divided by EBV at the start of the quarter. Economic return based solely on the change in GAAP book value for the quarter was 4.2%. 4) Distributable Earnings is a non-GAAP financial measure. Refer to slide 19 for further information regarding the calculation of this measure and a reconciliation to GAAP net income. 5) GAAP net income presented per basic common share. GAAP net income was $0.62 per common share on a fully diluted basis. 6) Current LTV reflects loan amortization and estimated home price appreciation (or depreciation) since acquisition. Zillow Home Value Index (ZHVI) is utilized to estimate updated LTVs. For Transitional loans, the LTV reflects after repaired loan to value. 7) Origination amounts are based on the maximum loan amount, which includes amounts initially funded plus any committed, but undrawn amounts. 8) Amounts presented reflect the aggregation of fair value and carrying value amounts as presented in MFA’s consolidated balance sheet at March 31, 2023. 9) Business Purpose Loans comprised of $1.5B of Transitional loans and $1.5B of Single-family rental loans at March 31, 2023. 10) Amounts presented include the assumed exercise of the Company’s unilateral option to extend the maturity of a $0.2B warehouse facility for one year. 11) Purchased Performing Loans includes Non-QM, Transitional, Single-family rental, Seasoned Performing and Agency eligible investor loans. 12) Loan Portfolio LTV reflects principal amortization and estimated home price appreciation (or depreciation) since acquisition. Zillow Home Value Index (ZHVI) is utilized to estimate updated LTVs. For Transitional loans, the LTV reflects after repaired loan to value. 13) Legacy RPL/NPL includes Purchased Credit Deteriorated and Purchased Non-Performing loans. 14) LTV is based on After Repaired Value (ARV) for Transitional loans and as-is LTV for Rental loans at origination. 15) Weighted average loan amount to as-is value (when available) or purchase value at origination. 16) Weighted average loan amount to after repaired value at origination. 17) Reflects loan amortization and estimated home price appreciation (or depreciation) since acquisition. Zillow Home Value Index (ZHVI) is utilized to estimate updated LTVs. 18) Weighted average debt service coverage ratio (DSCR) 19) Non-Performing at purchase refers to loans at least 60 days delinquent at purchase. 20) Includes Purchased Credit Deteriorated (PCD) and certain other loans purchased as Re-Performing Loans, but were not classified as PCD loans for accounting purposes. 21) Performing as of March 31, 2023 defined as less than 60 days delinquent or made a full P&I payment in March 2023. |