UNITED STATES
SECURITIES AND EXCHANGE COMMISSION
WASHINGTON, D.C. 20549
FORM 8-K
CURRENT REPORT
Pursuant to Section 13 OR 15(d) of the Securities Exchange Act of 1934
Date of Report (Date of earliest event reported): November 8, 2022
American Public Education, Inc.
(Exact name of registrant as specified in its charter)
| Delaware | 001-33810 | 01-0724376 | ||
|
(State or other jurisdiction of incorporation) |
(Commission File Number) |
(IRS Employer Identification No.) |
|
111 W. Congress Street Charles Town, West Virginia |
25414 | |
| (Address of principal executive offices) | (Zip Code) |
Registrant’s telephone number, including area code: 304-724-3700
Check the appropriate box below if the Form 8-K filing is intended to simultaneously satisfy the filing obligation of the registrant under any of the following provisions:
| ¨ | Written communications pursuant to Rule 425 under the Securities Act (17 CFR 230.425) |
| ¨ | Soliciting material pursuant to Rule 14a-12 under the Exchange Act (17 CFR 240.14a-12) |
| ¨ | Pre-commencement communications pursuant to Rule 14d-2(b) under the Exchange Act (17 CFR 240.14d-2(b)) |
| ¨ | Pre-commencement communications pursuant to Rule 13e-4(c) under the Exchange Act (17 CFR 240.13e-4(c)) |
Securities registered pursuant to Section 12(b) of the Act:
| Title of each class | Trading Symbol(s) | Name of each exchange on which registered |
| Common Stock, $0.01 par value per share | APEI | Nasdaq Global Select Market |
Indicate by check mark whether the registrant is an emerging growth company as defined in Rule 405 of the Securities Act of 1933 (§230.405 of this chapter) or Rule 12b-2 of the Exchange Act of 1934 (§240.12b-2 of this chapter).
Emerging growth company ¨
If an emerging growth company, indicate by check mark if the registrant has elected not to use the extended transition period for complying with any new or revised financial accounting standards provided pursuant to Section 13(a) of the Exchange Act. ¨
Section 2 – Financial Information
Item 2.02 Results of Operations and Financial Condition.
On November 8, 2022, American Public Education, Inc. (the “Company”) issued a press release reporting financial results for the three and nine months ended September 30, 2022. A copy of the Company’s press release is attached to this report as Exhibit 99.1 and is incorporated in this report by reference. The Company has scheduled a webcast for 5:00 p.m. ET on November 8, 2022 to discuss its financial results, and slides for that webcast are attached to this report as Exhibit 99.2 and are incorporated in this report by reference.
Section 9 – Financial Statements and Exhibits
Item 9.01 Financial Statements and Exhibits.
| (d) | Exhibits | ||
| 99.1 | American Public Education, Inc. press release dated November 8, 2022, reporting financial results for the three and nine months ended September 30, 2022. | ||
| 99.2 | American Public Education, Inc. slides for November 8, 2022 conference call and Webcast for the three and nine months ended September 30, 2022. | ||
| 104 | Cover Page Interactive Data File (embedded within the Inline XBRL document). |
SIGNATURES
Pursuant to the requirements of the Securities Exchange Act of 1934, the registrant has duly caused this report to be signed on its behalf by the undersigned hereunto duly authorized.
| American Public Education, Inc. | |||
| Date: November 8, 2022 | By: | /s/ Richard W. Sunderland, Jr. | |
|
Richard W. Sunderland, Jr. Executive Vice President and Chief Financial Officer |
|||
Exhibit 99.1

American Public Education Reports Third Quarter 2022 Results
CHARLES TOWN, WV (November 08, 2022) – American Public Education, Inc. (Nasdaq: APEI) announced financial results for the quarter ended September 30, 2022.
Third Quarter Highlights:
| • | Consolidated revenue increased 52% year-over-year to $149.5 million |
| • | Total cash and cash equivalents was approximately $185.5 million, compared to $149.6 million as of December 31, 2021, representing increase of $35.9 million or 24.0% |
| • | Our net loss for the period was $3.8 million, compared to net loss of $0.3 million for the three months ended September 30, 2021, an increase in the net loss of $3.5 million. |
| • | Adjusted EBITDA was $9.5 million for the third quarter 2022 |
We completed the acquisitions of Rasmussen University (“RU”) and Graduate School USA (“GSUSA”) on September 1, 2021 and January 1, 2022, respectively. Our financial results do not include the financial results of these companies prior to their respective acquisition closing dates. Accordingly, the financial results for the three and nine months ended September 30, 2021, include results of operations of RU for the month of September 2021 and do not include the results of operations of GSUSA. Therefore, the prior year period presented is not directly comparable to the current period.
Financial Results:
Three months ended September 30, 2022 compared to three months ended September 30, 2021:
| • | Total consolidated revenue for 2022 increased 52.2% to $149.5 million, compared to total revenue of $98.2 million in 2021, due to: |
| o | the inclusion of RU Segment revenue and GSUSA revenue for the three months ended September 30, 2022 of $40.4 million and $7.9 million, respectively; |
| o | an increase of $2.8 million, or 4.3%, in revenue from American Public University System (“APUS”) due to a net course registration increase of 3.2% compared to prior year; and |
| o | an increase of $0.2 million, or 1.5%, in revenue from Hondros College of Nursing (“HCN”), reflecting an increase in total student enrollment of 3.7%. |
| • | Total costs and expenses increased to $150.6 million for 2022, compared to $97.0 million for the same period in 2021. The increase in costs and expenses for the three months ended September 30, 2022 was primarily the result of the inclusion of other RU Segment and GSUSA costs and expenses of $47.3 million and $6.3 million, respectively, for the three months ended September 30, 2022, compared to one month of RU Segment costs and expenses and no GSUSA costs and expenses in the prior year period. |
| ○ | Instructional costs and services increased $29.3 million in 2022 to $71.8 million, compared to $42.5 million in 2021, primarily due to the inclusion of RU Segment and GSUSA instructional costs and services expenses of $23.0 million and $3.9 million, respectively, for the three months ended September 30, 2022, compared to one month of RU Segment instructional costs and services expenses and no GSUSA instructional costs and services expenses in the prior year period. |
| ○ | Selling and promotional expenses increased $17.5 million to $40.9 million, compared to $23.5 million in 2021, primarily due to the inclusion of RU Segment and GSUSA selling and promotional expenses of $16.0 million and $1.1 million, respectively, for the three months ended September 30, 2022, compared to one month of RU Segment selling and promotional expenses and no GSUSA selling and promotional expenses in the prior year period. |
| ○ | General and administrative (“G&A”) expenses increased $3.1 million to $29.7 million, compared to $26.6 million in 2021, primarily due to the inclusion of RU Segment and GSUSA G&A expenses of $4.1 million and $1.2 million, respectively, as well as an increase in employee compensation costs in our HCN Segment and Corporate and Other, and increases in Title IV costs and bad debt expense in our HCN Segment, partially offset by decreases in professional fees in our APUS Segment and Corporate and Other and a decrease in legal costs in Corporate and Other. |
| ○ | Depreciation and amortization expenses increased to $8.0 million in 2022, or 5.3% of revenue, compared to $4.4 million and 4.5% in 2021, primarily due to the addition of the RU Segment and GSUSA depreciation and amortization expenses of $4.1 million and $0.2 million, respectively, as compared to the prior period. |
| o | Costs and expenses in 2022 include $0.9 million in information technology costs related to our multi-year technology transformation program in our APUS Segment and M&A-related professional fees of $0.3 million associated with the Rasmussen and GSUSA acquisitions in Corporate and Other. M&A-related professional fees, which are included within G&A expenses, were associated with the RU and GSUSA acquisitions, and compared to $1.8 million of M&A-related professional fees primarily associated with the RU acquisition in 2021. |
| • | Interest expense was $3.6 million in 2022, compared to interest expense of $1.3 million in 2021. The increase in interest expense was due to the inclusion of three months of interest expense related to the senior secured term loan facility in an aggregate original principal amount of $175.0 million issued in connection with the Rasmussen acquisition, compared to one month of interest expense in the prior year period. |
| • | Net loss was $3.8 million in 2022, compared to net loss of $0.3 million in 2021, primarily driven by increases in costs discussed above. |
| • | Net loss per diluted share was $0.20, compared to net loss of $0.01 per diluted share in the same period of 2021. |
| • | Adjusted EBITDA was $9.5 million in 2022, compared to $9.3 million in 2021. |
Balance Sheet and Liquidity:
| • | Total cash and cash equivalents as of September 30, 2022 was approximately $185.5 million, compared to $149.6 million as of December 31, 2021, representing an increase of $35.9 million or 24.0%. The increase in cash was due to cash provided by operating activities, partially offset by increases in capital expenditures and payments of principal and interest on our debt obligations. |
| • | During the third quarter, the Army transitioned from the initial version of ArmyIgnitED to ArmyIgnitED 2.0, with a new third-party service provider, and announced that all TA requests for courses beginning on or after October 1, 2022 must be submitted via ArmyIgnitED 2.0. As part of this change, the Army stopped allowing institutions to submit invoices July 30, 2022 until August 29, 2022, which has impacted our ability to collect on our accounts receivable and caused our accounts receivable to increase. As of September 30, 2022, approximately $13.8 million, of which $6.3 million is older than 60 days from the course start date, was due from the Army. While we are taking efforts to mitigate any adverse impact of the transition to ArmyIgnitED 2.0 on accounts receivable, bad debt, and cash flow, there can be no assurance that these efforts will be successful or ArmyIgnitED 2.0 will work as expected. Difficulties associated with the upgrade or transition to a new service provider, including the related data migration, could cause further disruption to soldiers’ ability to seek and obtain TA and to the Army’s processing of invoices and payments to APUS. |
Registrations and Enrollment:
| 2022 | 2021 | % Change | ||||||||||
| American Public University System1 | ||||||||||||
| For the three months ended September 30, Net Course Registrations | 85,800 | 83,100 | 3 | % | ||||||||
| For the nine months ended September 30, Net Course Registrations | 263,200 | 258,700 | 2 | % | ||||||||
| Rasmussen University2 | ||||||||||||
| For the three months ended September 30, Total Student Enrollment | 15,000 | 16,300 | (8 | )% | ||||||||
| Hondros College of Nursing3 | ||||||||||||
| For the three months ended September 30, Total Student Enrollment | 2,410 | 2,320 | 4 | % | ||||||||
1APUS Net Course Registrations represents the approximate aggregate number of courses for which students remain enrolled after the date by which they may drop a course without financial penalty. Excludes students in doctoral programs.
2Rasmussen Total Student Enrollment represents students in an active status as of the full-term census or billing date.
3HCN Total Student Enrollment represents the approximate number of students enrolled in a course after the date by which students may drop a course without financial penalty.
Fourth Quarter 2022 Outlook:
The following statements are based on APEI’s current expectations. These statements are forward-looking and actual results may differ materially. APEI undertakes no obligation to update publicly any forward-looking statements for any reason unless required by law. Refer to APEI’s earnings conference call and presentation for further details.
| Fourth Quarter 2022 Guidance | Full Year 2022 Guidance | |||||||||||||||
| (Approximate) | (% Yr/Yr) | (Approximate) | (% Yr/Yr) | |||||||||||||
| APUS Net course registrations | 84,000 to 87,500 | -3% to +1% | 347,300 to 350,800 | 1% to 2% | ||||||||||||
| HCN Student enrollment | 2,600 | 4 | % | 2,600 | 4 | % | ||||||||||
| RU Student enrollment | 15,600 | -9 | % | 15,600 | -9 | % | ||||||||||
| - Nursing | 7,600 | -12 | % | 7,600 | -12 | % | ||||||||||
| - Non-Nursing | 8,000 | -5 | % | 8,000 | -5 | % | ||||||||||
| ($ in millions except EPS) | ||||||||||||||||
| APEI Consolidated revenue | $151.2 to $154.2 | -2% to 0% | $605.1 to $608.1 | 44% to 45% | ||||||||||||
| APEI Consolidated net income | -$3.9 to -$2.4 | -141% to -126% | -$112.3 to -$110.9 | n.m. | ||||||||||||
| APEI Adjusted EBITDA | $13.9 to $16.7 | -53% to -43% | $55.2 to $58.0 | -15% to -10% | ||||||||||||
| APEI Diluted EPS | -$0.20 to -$0.13 | -140% to -126% | -$5.94 to -$5.87 | n.m. | ||||||||||||
Non-GAAP Financial Measures:
This press release contains the non-GAAP financial measures of EBITDA (earnings before interest, taxes, depreciation, and amortization) and Adjusted EBITDA (EBITDA less non-cash expenses such as stock compensation and non-recurring expenses). APEI believes that the use of these measures is useful because they allow investors to better evaluate APEI’s operating profit and cash generation capabilities.
For the three months ended September 30, 2022 and 2021, adjusted EBITDA excludes non-cash compensation expense, loss on disposals of long-lived assets, and M&A-related professional fees.
These non-GAAP measures should not be considered in isolation or as an alternative to measures determined in accordance with generally accepted accounting principles in the United States (GAAP). The principal limitation of our non-GAAP measures are that they exclude expenses that are required by GAAP to be recorded. In addition, non-GAAP measures are subject to inherent limitations as they reflect the exercise of judgment by management about which expenses are excluded.
APEI is presenting EBITDA and adjusted EBITDA in connection with its GAAP results and urges investors to review the reconciliation of EBITDA and adjusted EBITDA to the comparable GAAP financial measures that are included in the tables following this press release (under the captions “GAAP Net Income to Adjusted EBITDA,” and “GAAP Outlook Net Income to Outlook Adjusted EBITDA”) and not to rely on any single financial measure to evaluate its business.
Webcast:
A live webcast of the APEI’s third quarter 2022 earnings conference call will be held today at 5:00 p.m. Eastern time. This webcast will be open to listeners who log in through the APEI’s investor relations website, www.apei.com.
A replay of the live webcast will also be available starting approximately one hour after the conclusion of the live webcast. The replay will be archived and available to listeners through APEI’s investor relations website for one year.
About American Public Education
American Public Education, Inc. (Nasdaq: APEI), through its institutions American Public University System (APUS), Rasmussen University, Hondros College of Nursing, and Graduate School USA, educate the service-minded student by providing career-focused higher education and career learning.
APUS, which operates through American Military University and American Public University, is the leading educator to active-duty military and veteran students* and serves approximately 88,000 adult learners worldwide via accessible and affordable higher education.
Rasmussen University is a 120-year-old nursing and health sciences-focused institution that serves approximately 15,000 students across its 23 campuses and student service centers in six states and online. It also has schools of Business, Technology, Design, Early Education and Justice Studies.
Hondros College of Nursing focuses on educating pre-licensure nursing students at eight campuses (six in Ohio, one in Indiana, and one in Michigan). It is the largest educator of PN (LPN) nurses in the state of Ohio** and serves approximately 2,410 total students. Graduate School USA is a leading training provider to the federal workforce with an extensive portfolio of government agency customers. It serves the federal workforce through customized contract training (B2G) to federal agencies and through open enrollment (B2C) to government professionals.
Both APUS and Rasmussen are institutionally accredited by the Higher Learning Commission (HLC), an institutional accreditation agency recognized by the U.S. Department of Education. Hondros is accredited by the Accrediting Bureau of Health Education Schools (ABHES). GSUSA is accredited by the Accrediting Council for Continuing Education & Training (ACCET). For additional information, visit www.apei.com.
*Based on FY 2019 Department of Defense tuition assistance and Veterans Administration student enrollment data, as reported by Military Times, 2020.
**Based on information compiled by the National Council of State Boards of Nursing and Ohio Board of Nursing.
Forward Looking Statements
Statements made in this press release regarding APEI or its subsidiaries that are not historical facts are forward-looking statements based on current expectations, assumptions, estimates and projections about APEI and the industry. In some cases, forward-looking statements can be identified by words such as “anticipate,” “believe,” “seek,” “could,” “estimate,” “expect,” “intend,” “may,” “plan,” “should,” “will,” “would,” and similar words or their opposites. Forward-looking statements include, without limitation, statements regarding expected growth, registration and enrollments, revenues, income and adjusted EBITDA and EBITDA, impacts of the upgrade to ArmyIgnitED 2.0 and plans with respect to recent, current and future initiatives.
Forward-looking statements are subject to risks and uncertainties that could cause actual results to differ materially from those expressed or implied by such statements. Such risks and uncertainties include, among others, risks related to: the impacts of inflation, increases in labor costs, and enrollment trends, including on APEI’s operating margins; APEI’s dependence on the effectiveness of its ability to attract students who persist in its institutions’ programs; changing market demands; APEI’s inability to effectively market its institutions’ programs; APEI’s inability to maintain strong relationships with the military and maintain course registrations and enrollments from military students; APEI’s loss of its ability to receive funds under tuition assistance programs or the reduction, elimination, or suspension of tuition assistance; the effects, duration, and severity of and APEI’s response to the COVID-19 pandemic; adverse effects on demand as the pandemic abates; adverse effects of changes APEI makes to improve the student experience and enhance the ability to identify and enroll students who are likely to succeed; APEI’s need to successfully adjust to future market demands by updating existing programs and developing new programs; APEI’s failure to comply with regulatory and accrediting agency requirements and to maintain institutional accreditation; APEI’s loss of eligibility to participate in Title IV programs or ability to process Title IV financial aid; business combinations and acquisitions, including the integration of RU and GSUSA and APEI’s inability to realize the expected benefits of their acquisition; incurring substantial debt, the cost of servicing that debt, and APEI’s inability in the future to service that debt; APEI’s dependence on and the need to continue to invest in its technology infrastructure; and the various risks described in the “Risk Factors” section and elsewhere in APEI’s Quarterly Report on Form 10-Q for the period ended September 30, 2022 and Annual Report on Form 10-K for the year ended December 31, 2021, and in other filings with the SEC. You should not place undue reliance on any forward-looking statements. APEI undertakes no obligation to update publicly any forward-looking statements for any reason, unless required by law, even if new information becomes available or other events occur in the future.
Contacts:
Ryan Koren
AVP, Investor Relations & Corporate Development (In thousands, except per share data)
(610) 428-7376
###
American Public Education, Inc.
Consolidated Statement of Income
| Three Months Ended | ||||||||
| September 30, | ||||||||
| 2022 | 2021 | |||||||
| (unaudited) | ||||||||
| Revenues | $ | 149,535 | $ | 98,248 | ||||
| Costs and expenses: | ||||||||
| Instructional costs and services | 71,817 | 42,544 | ||||||
| Selling and promotional | 40,917 | 23,458 | ||||||
| General and administrative | 29,667 | 26,598 | ||||||
| Impairment of goodwill and intangible assets | — | — | ||||||
| (Gain) loss on disposals of long-lived assets | 178 | — | ||||||
| Depreciation and amortization | 7,982 | 4,386 | ||||||
| Total costs and expenses | 150,561 | 96,986 | ||||||
| (Loss) income from operations before interest and income taxes | (1,026 | ) | 1,262 | |||||
| Gain on acquisition | - | — | ||||||
| Interest (expense) income | (3,594 | ) | (1,305 | ) | ||||
| (Loss) income before income taxes | (4,620 | ) | (43 | ) | ||||
| Income tax (benefit) expense | (860 | ) | 224 | |||||
| Equity investment loss | (2 | ) | - | |||||
| Net (loss) income | $ | (3,762 | ) | $ | (267 | ) | ||
| Net (loss) income per common share: | ||||||||
| Basic | $ | (0.20 | ) | $ | (0.01 | ) | ||
| Diluted | $ | (0.20 | ) | $ | (0.01 | ) | ||
| Weighted average number of common shares: | ||||||||
| Basic | 18,885 | 18,700 | ||||||
| Diluted | 18,927 | 18,855 | ||||||
| Three Months Ended | ||||||||
| Segment Information: | September 30, | |||||||
| 2022 | 2021 | |||||||
| Revenues: | ||||||||
| APUS Segment | $ | 68,735 | $ | 65,906 | ||||
| RU Segment | $ | 61,548 | $ | 21,132 | ||||
| HCN Segment | $ | 11,409 | $ | 11,240 | ||||
| Corporate and other1 | $ | 7,843 | $ | (30 | ) | |||
| Income (loss) from operations before interest and income taxes: | ||||||||
| APUS Segment | $ | 12,532 | $ | 7,825 | ||||
| RU Segment | $ | (7,900 | ) | $ | (999 | ) | ||
| HCN Segment | $ | (1,392 | ) | $ | 448 | |||
| Corporate and other1 | $ | (4,266 | ) | $ | (6,012 | ) | ||
| Nine Months Ended | ||||||||
| September 30, | ||||||||
| 2022 | 2021 | |||||||
| (unaudited) | ||||||||
| Revenues | $ | 453,890 | $ | 264,803 | ||||
| Costs and expenses: | ||||||||
| Instructional costs and services | 215,604 | 105,257 | ||||||
| Selling and promotional | 116,082 | 60,350 | ||||||
| General and administrative | 89,179 | 75,579 | ||||||
| Impairment of goodwill and intangible assets | 144,900 | — | ||||||
| Loss on disposals of long-lived assets | 962 | 182 | ||||||
| Depreciation and amortization | 24,249 | 9,561 | ||||||
| Total costs and expenses | 590,976 | 250,929 | ||||||
| (Loss) income from operations before interest income and income taxes | (137,086 | ) | 13,874 | |||||
| Gain on acquisition | 3,828 | — | ||||||
| Interest (expense) income | (10,339 | ) | (1,167 | ) | ||||
| (Loss) income before income taxes | (143,597 | ) | 12,707 | |||||
| Income tax (benefit) expense | (35,152 | ) | 3,509 | |||||
| Equity investment income (loss) | (13 | ) | (827 | ) | ||||
| Net (loss) income | $ | (108,458 | ) | $ | 8,371 | |||
| Net (loss) income per common share: | ||||||||
| Basic | $ | (5.75 | ) | $ | 0.47 | |||
| Diluted | $ | (5.74 | ) | $ | 0.46 | |||
| Weighted average number of common shares: | ||||||||
| Basic | 18,854 | 17,874 | ||||||
| Diluted | 18,906 | 18,048 | ||||||
| Nine Months Ended | ||||||||
| Segment Information: | September 30, | |||||||
| 2022 | 2021 | |||||||
| Revenues: | ||||||||
| APUS Segment | $ | 211,729 | $ | 210,321 | ||||
| RU Segment | $ | 192,538 | $ | 21,132 | ||||
| HCN Segment | $ | 34,436 | $ | 33,506 | ||||
| Corporate and other1 | $ | 15,187 | $ | (156 | ) | |||
| (Loss) income from operations before interest income and income taxes: | ||||||||
| APUS Segment | $ | 39,338 | $ | 30,969 | ||||
| RU Segment | $ | (153,562 | ) | $ | (999 | ) | ||
| HCN Segment | $ | (3,017 | ) | $ | 1,348 | |||
| Corporate and other1 | $ | (19,845 | ) | $ | (17,444 | ) | ||
The RU Segment reflects the operations of RU, which was acquired on the RU Closing Date. The Company did not consolidate the financial results of the RU Segment prior to the RU Closing Date.
1. Corporate and Other includes tuition and contract training revenue earned by GSUSA from the GSUSA Closing Date through September 30, 2022. Contract training revenue represents both individual and customized training programs and is recognized when the services are performed. Additionally, the APUS Segment charges the HCN Segment and corporate employees for the value of courses taken by HCN Segment employees and corporate employees at APUS. The elimination of this intersegment revenue is included within Corporate and Other.
GAAP Net Income to Adjusted EBITDA:
The following table sets forth the reconciliation of the Company’s reported GAAP net income to the calculation of adjusted EBITDA for the three and nine months ended September 30, 2022 and 2021:
| Three Months Ended | Nine Months Ended | |||||||||||||||
| September 30, | September 30, | |||||||||||||||
| (in thousands, except per share data) | 2022 | 2021 | 2022 | 2021 | ||||||||||||
| Net (loss) income | $ | (3,762 | ) | $ | (267 | ) | (108,458 | ) | 8,371 | |||||||
| Income tax (benefit) expense | (860 | ) | 224 | (35,152 | ) | 3,509 | ||||||||||
| Interest expense (income) | 3,594 | 1,305 | 10,339 | 1,167 | ||||||||||||
| Equity investment loss | 2 | - | 13 | 827 | ||||||||||||
| Depreciation and amortization | 7,982 | 4,386 | 24,249 | 9,561 | ||||||||||||
| EBITDA | 6,956 | 5,648 | (109,009 | ) | 23,435 | |||||||||||
| Impairment of goodwill and intangible assets | - | - | 144,900 | - | ||||||||||||
| Adjustment to gain on acquisition | - | - | (3,828 | ) | - | |||||||||||
| Stock compensation | 1,997 | 1,804 | 6,703 | 5,969 | ||||||||||||
| Loss on disposals of long-lived assets | 178 | - | 962 | 182 | ||||||||||||
| M&A and integration | 329 | 1,816 | 1,602 | 5,783 | ||||||||||||
| Adjusted EBITDA | $ | 9,460 | $ | 9,268 | 41,330 | 35,369 | ||||||||||
GAAP Outlook Net Income to Outlook Adjusted EBITDA:
The following table sets forth the reconciliation of the Company’s projected GAAP net income to the calculation of projected adjusted EBITDA for the three months and twelve months ending December 31, 2022:
| Three Months Ending | Twelve Months Ending | |||||||||||||||
| December 31, 2022 | December 31, 2022 | |||||||||||||||
| (in thousands, except per share data) | Low | High | Low | High | ||||||||||||
| Net income | $ | (3,855 | ) | $ | (1,727 | ) | $ | (112,313 | ) | $ | (110,185 | ) | ||||
| Income tax expense | (1,217 | ) | (545 | ) | (36,369 | ) | (35,697 | ) | ||||||||
| Interest expense, net | 3,931 | 3,931 | 14,270 | 14,270 | ||||||||||||
| Equity investment loss (income) | - | - | 13 | 13 | ||||||||||||
| Depreciation and amortization | 8,318 | 8,318 | 32,567 | 32,567 | ||||||||||||
| EBITDA | 7,177 | 9,977 | (101,832 | ) | (99,032 | ) | ||||||||||
| Impairment of goodwill and intangible assets | - | - | 144,900 | 144,900 | ||||||||||||
| Adjustment to gain on acquisition | - | - | (3,828 | ) | (3,828 | ) | ||||||||||
| Stock compensation | 2,712 | 2,712 | 9,415 | 9,415 | ||||||||||||
| Loss on disposals of long-lived assets | - | - | 962 | 962 | ||||||||||||
| M&A and integration | 4,017 | 4,017 | 5,619 | 5,619 | ||||||||||||
| Adjusted EBITDA | $ | 13,906 | $ | 16,706 | $ | 55,236 | $ | 58,036 | ||||||||
Exhibit 99.2

PRESENTED BY Angela Selden President and CEO Richard Sunderland, CPA Executive VP and CFO American Public Education, Inc. Third Quarter 2022 Results November 8, 2022
Safe Harbor Statement Please note that statements made in this presentation regarding American Public Education, Inc . and its subsidiaries (the “Company”) that are not historical facts may be forward - looking statements based on current expectations, assumptions, estimates and projections about the Company and the industry . These forward - looking statements are subject to risks and uncertainties that could cause actual future events or results to differ materially from those expressed or implied by such statements . Forward - looking statements may be able to be identified by words such as anticipate, believe, seek, could, estimate, expect, intend, may, plan, should, will, would, transition, interest, on track, entering and similar words or their opposites . Forward - looking statements include, without limitation, expected growth, registrations and enrollments, revenues, net income, earnings per share, adjusted EBITDA and EBITDA, impacts of the upgrade to ArmyIgnitED 2 . 0 , interest in and success of new campuses, and the impact of inflation . Actual results could differ materially from those expressed or implied by forward - looking statements as a result of various factors, including risks related to dependence on the effectiveness of the Company’s ability to attract students who persist in its institutions’ programs, changing market demands, the inability to effectively market the Company’s programs, the inability to maintain strong relationships with the military and maintain course registrations and enrollments from military students, the loss of ability to receive funds under tuition assistance programs or the reduction, elimination, or suspension of tuition assistance, risks related to the effects of and the Company’s response to the COVID - 19 pandemic, impacts on the demand environment as the pandemic abates, effects of changes the Company makes to improve the student experience and enhance the ability to identify and enroll students who are likely to succeed, the need to successfully adjust to future market demands by updating existing programs and developing new programs, the failure to comply with regulatory and accrediting agency requirements and to maintain institutional accreditation, the loss of eligibility to participate in Title IV programs or ability to process Title IV financial aid, business combinations and acquisitions, including the integration of Rasmussen University and Graduate School USA and the inability to realize the expected benefits of their acquisition, incurring substantial debt, the cost of servicing that debt, and the inability in the future to service that debt, dependence on and the need to continue to invest in the Company’s technology infrastructure, and the risk factors described in the risk factor section and elsewhere in the Company’s annual report on Form 10 - K and in the Company’s other SEC filings . You should not place any undue reliance on any forward - looking statements . The Company undertakes no obligation to update publicly any forward - looking statements for any reason, unless required by law, even if new information becomes available or other events occur in the future . 2

3 Table of Contents 1. APEI and Education Unit Enrollment Updates 2. 3Q'22 Financial Results & 4Q'22 Outlook
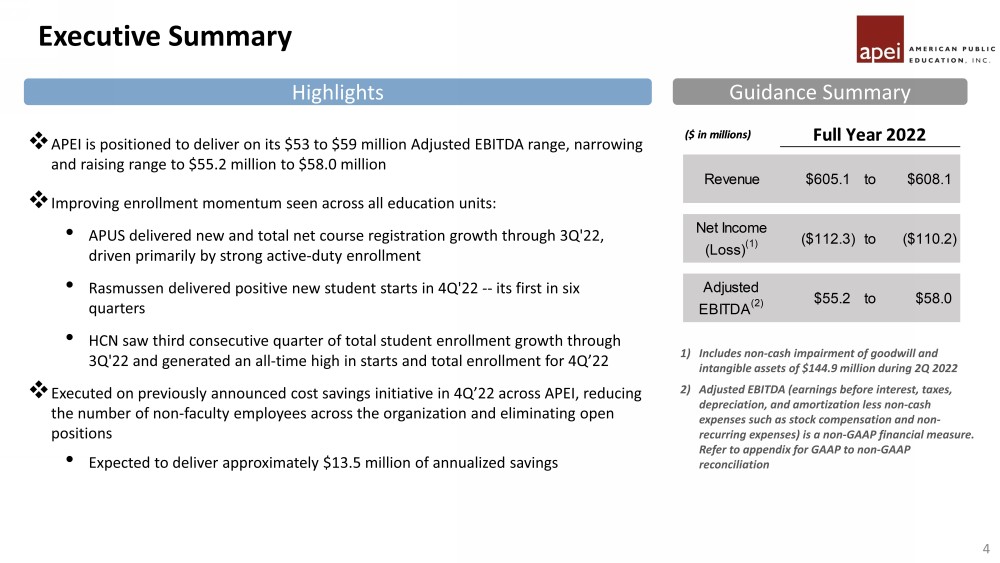
Executive Summary 4 □ APEI is positioned to deliver on its $53 to $59 million Adjusted EBITDA range, narrowing and raising range to $55.2 million to $58.0 million □ Improving enrollment momentum seen across all education units: • APUS delivered new and total net course registration growth through 3Q'22, driven primarily by strong active - duty enrollment • Rasmussen delivered positive new student starts in 4Q'22 -- its first in six quarters • HCN saw third consecutive quarter of total student enrollment growth through 3Q'22 and generated an all - time high in starts and total enrollment for 4Q’22 □ Executed on previously announced cost savings initiative in 4Q’22 across APEI, reducing the number of non - faculty employees across the organization and eliminating open positions • Expected to deliver approximately $13.5 million of annualized savings 1) Includes non - cash impairment of goodwill and intangible assets of $144.9 million during 2Q 2022 2) Adjusted EBITDA (earnings before interest, taxes, depreciation, and amortization less non - cash expenses such as stock compensation and non - recurring expenses) is a non - GAAP financial measure. Refer to appendix for GAAP to non - GAAP reconciliation Highlights Guidance Summary

• 4Q'22 registrations of approximately - 3% to +1% growth versus prior year period, or between 84.0k and 87.5K enrollments • Strong military registrations offset partly by non - military and veteran declines • New President, Nuno Fernandes is spearheading efforts to attract new corporate and self - funded student segments APUS Registration and Education Unit Update 3Q'22 Forecast 4Q'22 and Education Unit Update 5 • 3Q'22 net course registrations increase driven by strong military growth: • 3Q'22 military registrations +8% compared to 3Q'21 • 3Q'22 Army registrations +14% compared to 3Q’21 • New student registrations growth across all lines of business • ArmyIgnitED transition to version 2.0 has been substantially completed without incident 92.9K 82.6K 83.1K 86.6K 345.2K 94.0K 83.5K 85.8K 1Q 2Q 3Q 4Q Full Year APUS Net Course Registrations 2021 2022 +1% +1% +1% to + 2% +3% - 3% to +1 % Forecast Period 87.5k - 84.0k 350.8k - 347.3k

Rasmussen Enrollment and Education Unit Update 6 • 3Q'22 nursing enrollment contracted by 8% compared to 3Q’21 • Partially impacted by self - imposed caps in Twin Cities market • 2 - year CAGR growth of +3.5% • 3Q’22 non - nursing enrollment contracted by 8% compared to 3Q’21 • Tight labor market and higher wages deterred adult learners 3Q'22 Forecast 4Q'22 and Education Unit Update • Positive 4Q'22 new student starts , first in six quarters • Growth momentum positions Rasmussen for 2H’23 total enrollment growth • Success despite Florida enrollment impact from Hurricane Ian 8,200 8,400 8,300 8,200 8,300 7,700 8,700 7,600 9,100 7,800 8,600 7,700 8,000 7,300 8,400 8,000 17,300 16,200 16,900 15,900 16,300 15,000 17,100 15,600 1Q 2021 1Q 2022 2Q 2021 2Q 2022 3Q 2021 3Q 2022 4Q 2021 4Q 2022 Rasmussen Enrollment Non-nursing Nursing

Rasmussen Operational Update Center for Educational Readiness Center for Nursing Excellence 7 Organizational Realignment • Focus is to ensure campus preparedness for faculty, clinicals, and students ▪ Align student enrollments and corresponding clinical site and adjunct faculty needs for at least three terms in advance ▪ Ensure student preparedness to be start ready (e.g. vaccinations) • Focus is to increase NCLEX first time pass rates for all nursing students • Aims to enhance performance through three primary tools: ▪ Pinpoint student specific challenge areas and customize tutoring support ▪ Additional NCLEX simulation ▪ Initiate curriculum review • Implemented organizational simplification to align into two operating units: ▪ Rasmussen University Campus - on ground nursing, clinical healthcare, and law enforcement ▪ Rasmussen University Online – all other programs

• 3Q'22 HCN nursing enrollment growth continued, up 4% from strong 3Q'21 levels • Strong 2 - year CAGR of +11% from 2020 • Received approval for Michigan campus opening , with strong initial interest in the program HCN Enrollment and Education Unit Update 8 +10% 2 Yr CAGR 3Q'22 Forecast 4Q'22 and Education Unit Update • 4Q'22 HCN enrollment growth of 4% versus prior year comparable period, +10% 2 - year CAGR • Launched Initial cohort of fully sponsored ADN students during 4Q’22 term with large national healthcare provider • Welcomed first Michigan cohort as planned 2,270 2,380 2,320 2,510 2,460 2,440 2,410 2,600 1Q 2Q 3Q 4Q HCN Enrollment 2021 2022 +8% +3% +4% +4%

Table of Contents 9 1. APEI and Education Unit Enrollment Updates 2. 3Q'22 Financial Results & 4Q'22 Outlook

3Q'22 Financial Highlights Financial Summary Capitalization and Liquidity (1) During the third quarter of 2021, we revised our reportable segments and updated the results for the prior period to conform to the current period presentation. Additionally, during the first quarter of 2022, we added Graduate School USA to Corporate and Other. (2) EBITDA plus stock compensation, loss on disposal of long - lived assets, goodwill and intangible impairments and M&A - related prof essional and integration fees. Please refer to Appendix for GAAP to Non - GAAP reconciliation. 10 Solid liquidity position: • $159 million of unrestricted cash • $20 million undrawn revolver • $8 million of net debt Three Months Ended Nine Months Ended September 30, September 30, 2021 2022 % Change 2021 2022 % Change ($ in millions) APUS Revenue (1) 65.9 68.7 4% 210.3 211.7 1% Rasmussen Revenue 21.1 61.5 NM 21.1 192.5 NM HCN Revenue 11.2 11.4 2% 33.5 34.4 3% Corporate and Other (1) (0.0) 7.8 NM (0.2) 15.2 NM Total revenue 98.2 149.5 52% 264.8 453.9 71% Net income (loss) (0.3) (3.8) NM 8.4 (108.5) NM Adjusted EBITDA (2) 9.3 9.5 2% 35.4 41.3 17% EPS (diluted) (0.01) (0.20) NM 0.46 (5.74) NM

These statements are based on current expectations. These statements are forward - looking and actual results may differ materially. (1) APUS Net course registrations represent the approximate aggregate number of courses for which students remain enrolled after the date by which they may drop a course without financial penalty. (2) HCN and Rasmussen student enrollment represents the total number of students enrolled in a course after the date by which stu den ts may drop a course without financial penalty. (3) Please refer to Appendix for GAAP to Non - GAAP reconciliation APEI’s 4Q'22 and Full Year 2022 Outlook 11 Fourth Quarter 2022 Guidance Full Year 2021 Guidance (Approximate) (% Yr/Yr Change) APUS Net course registrations 1 84,000 to 87,500 -3% to +1% HCN Student enrollment 2 2,600 4% RU Student enrollment 2 15,600 -9% - Nursing 7,600 -12% - Non-Nursing 8,000 -5% ($ in millions except EPS) APEI Consolidated revenue $151.2 to $154.2 -2% to 0% APEI Consolidated net income -$3.9 to -$2.4 -141% to -126% APEI Adjusted EBITDA 3 $13.9 to $16.7 -53% to -43% APEI Diluted EPS -$0.20 to -$0.13 -140% to -126%

Thank You

Appendix: Enrollment and Registration Summary 13 3Q 2022 3Q 2021 % Change APUS Registrations 85,800 83,100 3% Total Rasmussen Enrollment 15,000 16,300 -8% Rasmussen Nursing Enrollment 7,700 8,300 -8% Rasmussen Non-Nursing Enrollment 7,300 8,000 -8% HCN Enrollment 2,410 2,320 4%

American Public Education is presenting adjusted EBITDA in connection with its GAAP results and urges investors to review the reconciliation of adjusted net income to the comparable GAAP financial measure that is included in the table below (under the caption “GAAP Net Income to Adjusted EBITDA”) and not to rely on any single financial measure to evaluate its business . Appendix: Disclosures 14 GAAP Net Income to Adjusted EBITDA: (in thousands, except per share data) Net (loss) income $ (3,762) $ (267) (108,458) 8,371 Income tax (benefit) expense (860) 224 (35,152) 3,509 Interest expense (income) 3,594 1,305 10,339 1,167 Equity investment loss 2 - 13 827 Depreciation and amortization 7,982 4,386 24,249 9,561 EBITDA 6,956 5,648 (109,009) 23,435 Impairment of goodwill and intangible assets - - 144,900 - Adjustment to gain on acquisition - - (3,828) - Stock compensation 1,997 1,804 6,703 5,969 Loss on disposals of long-lived assets 178 - 962 182 M&A and integration 329 1,816 1,602 5,783 Adjusted EBITDA $ 9,460 $ 9,268 41,330 35,369 Nine Months Ended September 30, 2022 2021 The following table sets forth the reconciliation of the Company’s reported GAAP net income to the calculation of adjusted EBITDA for the three and nine months ended September 30, 2022 and 2021: Three Months Ended September 30, 2022 2021

American Public Education is presenting adjusted EBITDA in connection with its GAAP outlook and urges investors to review the reconciliation of projected adjusted net income to the comparable GAAP financial measure that is included in the table below (under the caption “GAAP Outlook Net Income to Outlook Adjusted EBITDA”) and not to rely on any single financial measure to evaluate its business . Appendix: Disclosures (continued) 15 GAAP Outlook Net Income to Outlook Adjusted EBITDA: (in thousands, except per share data) Net income $ (3,855) $ (1,727) $ (112,313) $ (110,185) Income tax expense (1,217) (545) (36,369) (35,697) Interest expense, net 3,931 3,931 14,270 14,270 Equity investment loss (income) - - 13 13 Depreciation and amortization 8,318 8,318 32,567 32,567 EBITDA 7,177 9,977 (101,832) (99,032) Impairment of goodwill and intangible assets - - 144,900 144,900 Adjustment to gain on acquisition - - (3,828) (3,828) Stock compensation 2,712 2,712 9,415 9,415 Loss on disposals of long-lived assets - - 962 962 M&A and integration 4,017 4,017 5,619 5,619 Adjusted EBITDA $ 13,906 $ 16,706 $ 55,236 $ 58,036 The following table sets forth the reconciliation of the Company’s projected GAAP net income to the calculation of projected adjusted EBITDA for the three months and twelve months ending December 31, 2022: Three Months Ending Twelve Months Ending December 31, 2022 Low High December 31, 2022 Low High