UNITED STATES
SECURITIES AND EXCHANGE COMMISSION
Washington, D.C. 20459
FORM 8-K
CURRENT REPORT PURSUANT TO SECTION 13 OR 15(D)
OF THE SECURITIES EXCHANGE ACT OF 1934
Date of report: July 28, 2022
(Date of earliest event reported)
LTC PROPERTIES, INC.
(Exact name of Registrant as specified in its charter)
| Maryland | 1-11314 | 71-0720518 | ||
| (State or other jurisdiction of | (Commission file number) | (I.R.S. Employer | ||
| incorporation or organization) | Identification No) |
2829 Townsgate Road, Suite 350
Westlake Village, CA 91361
(Address of principal executive offices)
(805) 981-8655
(Registrant’s telephone number, including area code)
Check the appropriate box below if the Form 8-K filing is intended to simultaneously satisfy the filing obligation of the registrant under any of the following provisions (see General Instruction A.2. below):
| ¨ | Written communications pursuant to Rule 425 under the Securities Act (17 CFR 230.425) |
| ¨ | Soliciting material pursuant to Rule 14a-12 under the Exchange Act (17 CFR 240.14a-12) |
| ¨ | Pre-commencement communications pursuant to Rule 14d-2(b) under the Exchange Act (17 CFR 240.14d-2(b)) |
| ¨ | Pre-commencement communications pursuant to Rule 13e-4(c) under the Exchange Act (17 CFR 240.13e-4(c)) |
Securities registered pursuant to Section 12(b) of the Act:
| Title of each class | Trading symbol(s) | Name of each exchange on which registered |
| Common stock, $.01 par value | LTC | New York Stock Exchange |
Indicate by check mark whether the registrant is an emerging growth company as defined in Rule 405 of the Securities Act of 1933 (§230.405 of this chapter) or Rule 12b-2 of the Securities Exchange Act of 1934 (§240.12b-2 of this chapter).
Emerging growth company ¨
If an emerging growth company, indicate by check mark if the registrant has elected not to use the extended transition period for complying with any new or revised financial accounting standards provided pursuant to Section 13(a) of the Exchange Act. ¨
Item 2.02. — Results of Operations and Financial Condition
On July 28, 2022, LTC Properties, Inc. announced the operating results for the three months ended June 30, 2022. The text of the press release and the supplemental information package are furnished herewith as Exhibits 99.1 and 99.2, respectively, and are specifically incorporated by reference herein.
The information in this Form 8-K and the related information in the exhibits attached hereto shall not be deemed “filed” for purposes of Section 18 of the Securities Exchange Act of 1934, as amended (the “Exchange Act”), or otherwise subject to the liabilities of that section and shall not be incorporated by reference into any filing of LTC under the Securities Act of 1933, as amended, or the Exchange Act, regardless of any general incorporation language in such filing, except as shall be expressly set forth by specific reference in any such filing.
Item 9.01. — Financial Statements and Exhibits
| 99.1 | Press Release issued July 28, 2022. |
| 99.2 | LTC Properties, Inc. Supplemental Information Package for the period ending June 30, 2022. |
| 104 | Cover Page Interactive Data File (embedded within the Inline XBRL document) |
SIGNATURE
Pursuant to the requirements of Section 13 or 15(d) of the Securities Exchange Act of 1934, the Registrant has duly caused this report to be signed on its behalf by the undersigned, hereunto duly authorized.
| LTC PROPERTIES, INC. | ||
| Dated: July 28, 2022 | By: | /s/ WENDY L. SIMPSON |
| Wendy L. Simpson | ||
| Chairman & CEO | ||
Exhibit 99.1
 |
FOR IMMEDIATE RELEASE
For more information contact: Mandi Hogan (805) 981-8655 |
LTC REPORTS 2022 SECOND QUARTER RESULTS
AND DISCUSSES RECENT ACTIVITIES
WESTLAKE VILLAGE, CALIFORNIA, July 28, 2022 -- LTC Properties, Inc. (NYSE: LTC) (“LTC” or the “Company”), a real estate investment trust that primarily invests in seniors housing and health care properties, today announced operating results for the second quarter ended June 30, 2022.
| Three Months Ended | ||||||||
| June 30, | ||||||||
| 2022 | 2021 | |||||||
| (unaudited) | ||||||||
| Net income available to common stockholders | $ | 54,065 | $ | 18,126 | ||||
| Diluted earnings per common share | $ | 1.36 | $ | 0.46 | ||||
| NAREIT funds from operations ("FFO”) attributable to common stockholders | $ | 25,350 | $ | 22,171 | ||||
| NAREIT diluted FFO per common share | $ | 0.64 | $ | 0.57 | ||||
| FFO attributable to common stockholders, excluding non-recurring items | $ | 24,491 | $ | 22,304 | ||||
| Funds available for distribution ("FAD") | $ | 26,779 | $ | 22,781 | ||||
| FAD, excluding non-recurring items | $ | 25,598 | $ | 22,914 | ||||
Second quarter 2022 results were impacted by:
| · | Higher rental income due to: |
| o | a $1.2 million lease termination fee received in connection with the sale of a 74-unit assisted living community; |
| o | rent received from properties transitioned from the former Senior Lifestyle and Senior Care portfolios; |
| o | increases in property tax revenue from properties formerly leased to Senior Care and the acquisition of four skilled nursing centers during the 2022 second quarter; and |
| o | rental income from completed development projects and annual rent escalations. |
| · | The increase in rental income was partially offset by: |
| o | the sale of three assisted living communities and a skilled nursing center during the 2022 second quarter, and a skilled nursing center during 2021; and, |
| o | temporary rent deferrals. |
| · | Higher interest income from mortgage loans due to mortgage loan originations in 2022 and 2021. |
| · | Higher interest and other income due to a mezzanine loan origination and additional funding under working capital loans partially offset by loan payoffs. |
|
|
| · | Higher interest expense due to 2021 term loan originations, the issuance of $75.0 million senior unsecured notes during the quarter and higher interest rates on LTC’s revolving line of credit, partially offset by a lower outstanding balance, and scheduled principal paydowns on its senior unsecured notes. |
| · | Higher provision for credit losses due to 2022 second quarter mortgage loan originations, partially offset by principal paydowns. |
| · | Higher general and administrative expenses due to increased costs related to conference sponsorships and travel, as well as higher non-cash compensation charges, and increases in overall costs due to inflationary pressures. |
During the second quarter of 2022, LTC completed the following:
| · | Acquired four newer skilled nursing centers located in Texas with a combined total of 339 beds for $51.5 million and leased these centers to an affiliate of Ignite Medical Resorts (“Ignite”), a current LTC operating partner. The lease term is 10 years, with two five-year renewal options, and contains a purchase option beginning in the sixth lease year through the end of the seventh lease year. The Company expects to receive rent of approximately $1.0 million in each of the third and fourth quarters of 2022, and approximately $4.3 million during 2023. Rent will increase annually beginning on the third anniversary of the lease by 2.0% to 4.0% based on the change in the Medicare Market Basket Rate. Additionally, LTC provided Ignite a 10-year working capital loan for up to $2.0 million, of which $1.9 million has been funded, at 8% for first year, increasing to 8.25% for the second year, then increasing annually with the lease rate. |
| · | Originated two mortgage loans for $35.9 million secured by four newer assisted living communities and a land parcel. The four assisted living communities located in North Carolina, have a combined total of 217 units, and are operated by an existing LTC partner. The communities are newly constructed with an average age of under four years. The land parcel includes approximately 7.6 acres adjacent to one of the assisted living communities and is being held for the future development of a seniors housing community. The loans are cross-defaulted, have a four-year term, an interest rate of 7.25% and an IRR of 8%. |
| · | Sold three assisted living communities and a skilled nursing center as follows: |
| o | Two assisted living communities in California with a total of 232 units to the operator pursuant to the purchase option under their lease for $43.7 million, and recognized a gain on sale of $25.9 million. The communities had a gross book value of $31.8 million and a net book value of $16.8 million; |
| o | A 121-bed skilled nursing center in California for $13.3 million, and recognized a gain on sale of $10.8 million. The property had a gross book value of $4.6 million and a net book value of $1.8 million; and, |
| o | A 74-unit assisted living community in Virginia for $16.9 million, and recognized a gain on sale of $1.3 million. The community had a gross book value of $16.9 million and a net book value of $15.5 million. In connection with the sale, the current operator paid LTC a $1.2 million lease termination fee. |
| · | Received $5.3 million of principal paydown on a working capital loan with HMG Healthcare. The current outstanding balance under the working capital loan is $13.3 million, with a remaining availability of up to $11.7 million; |
|
|
| · | Provided a temporary reduction of rent totaling $600,000 in the second quarter 2022 to Anthem and provided a $900,000 temporary reduction of rent for third quarter 2022 to $1.8 million. However, LTC anticipates receiving total annual cash rent from Anthem in 2022 of approximately $10.8 million as LTC believes occupancy at the properties under Anthem’s master lease will recover and Anthem expects to receive additional stimulus funds from the Employee Retention Tax Credit program that will be used to pay the deferred rent. Anthem has paid its agreed upon rent of $600,000 for the month of July 2022. |
| · | Provided $702,000 of net deferred rent, which excludes the deferred rent provided to Anthem discussed above, and $1.2 million of abated rent. |
| · | Sold $75.0 million aggregate principal amount of 3.66% senior unsecured notes. The notes have an average 10-year life, scheduled principal payments and will mature on May 17, 2033. |
| · | Repaid $101.9 million under the Company’s revolving line of credit. |
| · | Sold 909,800 shares of common stock for $34.2 million in net proceeds under the Company’s equity distribution agreement. The proceeds from the sale were used to paydown LTC’s unsecured revolving line of credit which was used to fund investments and for general corporate purposes. |
Subsequent to June 30, 2022, LTC completed the following:
| · | Terminated a master lease covering 12 assisted living communities with a total of 625 units, and transitioned the communities to an existing LTC operator. The former operator was one of the few for whom we had provided assistance in form of rent deferrals and abatements. LTC is evaluating options for this portfolio. |
| o | In connection with the lease termination, LTC abated rent for June 2022 and has forgiven the former operator’s outstanding deferred rent balance of $7.1 million. Also, LTC paid the former operator a $500,000 lease termination fee in exchange for cooperation and assistance in facilitating an orderly transition; and, |
| o | The new master lease has a two-year term, with zero rent for the first four months. Thereafter, cash rent will be based on mutually agreed upon fair market rent. In connection with the new master lease, LTC paid the new operator a $410,000 lease incentive payment which will be amortized as a yield adjustment to rental income over the two-year lease term. |
| · | Provided $240,000 of abated rent in July 2022 and agreed to provide rent abatements up to $240,000 for each of August and September of 2022 to an operator pursuant to a master lease covering two assisted living communities. LTC is evaluating options for these communities. |
| · | Agreed to defer $150,000 of the $445,000 monthly contractual rent for August and September of 2022 from a lessee that operates eight assisted living communities under a master lease. The operator requested rent assistance due to protracted lease-up of their portfolio during COVID. LTC anticipates they will be able to repay the total $300,000 of deferred rent in 2023, upon receipt of additional stimulus funds from the Employee Retention Credit program. This operator is current on rent through July 2022. |
| · | Borrowed a net of $20.5 million under its unsecured revolving line of credit. |
| · | Paid $20.2 million in regular scheduled principal paydowns under LTC’s senior unsecured notes; and, |
|
|
| · | Sold 125,200 shares of common stock for $4.8 million in net proceeds under its equity distribution agreement. The proceeds from the sale were used to paydown LTC’s unsecured revolving line of credit and for general corporate purposes. |
Conference Call Information
LTC will conduct a conference call on Friday, July 29, 2022, at 8:00 a.m. Pacific Time (11:00 a.m. Eastern Time), to provide commentary on its performance and operating results for the quarter ended June 30, 2022. The conference call is accessible by telephone and the internet. Interested parties may access the live conference call via the following:
| Webcast | www.LTCReit.com | ||
| USA Toll-Free Number | 1-844-200-6205 | ||
| Canada Toll-Free Number | 1-833-950-0062 | ||
| Conference Access Code | 898490 |
Additionally, an audio replay of the call will be available one hour after the live call and through August 12, 2022 via the following:
| USA Toll-Free Number | 1-866-813-9403 | |
| Canada Local Number | 1-226-828-7578 | |
| International Toll-Free Number | +44 204 525 0658 | |
| Conference Number | 214260 |
About LTC
LTC is a real estate investment trust (REIT) investing in seniors housing and health care properties primarily through sale-leasebacks, mortgage financing, joint-ventures and structured finance solutions including preferred equity and mezzanine lending. LTC’s investment portfolio includes 202 properties in 29 states with 32 operating partners. Based on its gross real estate investments, LTC’s investment portfolio is comprised of approximately 50% seniors housing and 50% skilled nursing properties. Learn more at www.LTCreit.com.
|
|
Forward-Looking Statements
This press release includes statements that are not purely historical and are “forward-looking statements” within the meaning of Section 27A of the Securities Act of 1933, as amended, and Section 21E of the Securities Exchange Act of 1934, as amended, including statements regarding the Company’s expectations, beliefs, intentions or strategies regarding the future. All statements other than historical facts contained in this press release are forward-looking statements. These forward-looking statements involve a number of risks and uncertainties. Please see LTC’s most recent Annual Report on Form 10-K, its subsequent Quarterly Reports on Form 10-Q, and its other publicly available filings with the Securities and Exchange Commission for a discussion of these and other risks and uncertainties. All forward-looking statements included in this press release are based on information available to the Company on the date hereof, and LTC assumes no obligation to update such forward-looking statements. Although the Company’s management believes that the assumptions and expectations reflected in such forward-looking statements are reasonable, no assurance can be given that such expectations will prove to have been correct. The actual results achieved by the Company may differ materially from any forward-looking statements due to the risks and uncertainties of such statements.
(financial tables follow)
|
|
LTC PROPERTIES, INC.
CONSOLIDATED STATEMENTS OF INCOME
(unaudited, amounts in thousands, except per share amounts)
| Three Months Ended | Six Months Ended | |||||||||||||||
| June 30, | June 30, | |||||||||||||||
| 2022 | 2021 | 2022 | 2021 | |||||||||||||
| Revenues: | ||||||||||||||||
| Rental income | $ | 31,628 | $ | 29,804 | $ | 61,952 | $ | 61,777 | ||||||||
| Interest income from mortgage loans | 10,097 | 7,933 | 19,733 | 15,855 | ||||||||||||
| Interest and other income | 1,299 | 392 | 2,126 | 777 | ||||||||||||
| Total revenues | 43,024 | 38,129 | 83,811 | 78,409 | ||||||||||||
| Expenses: | ||||||||||||||||
| Interest expense | 7,523 | 6,860 | 14,666 | 13,832 | ||||||||||||
| Depreciation and amortization | 9,379 | 9,508 | 18,817 | 19,385 | ||||||||||||
| Provision (recovery) for credit losses | 305 | — | 659 | (9 | ) | |||||||||||
| Transaction costs | 67 | 133 | 99 | 225 | ||||||||||||
| Property tax expense | 4,019 | 3,800 | 8,001 | 7,781 | ||||||||||||
| General and administrative expenses | 5,711 | 5,337 | 11,519 | 10,370 | ||||||||||||
| Total expenses | 27,004 | 25,638 | 53,761 | 51,584 | ||||||||||||
| Other operating income: | ||||||||||||||||
| Gain on sale of real estate, net | 38,094 | 5,463 | 38,196 | 4,690 | ||||||||||||
| Operating income | 54,114 | 17,954 | 68,246 | 31,515 | ||||||||||||
| Income from unconsolidated joint ventures | 376 | 376 | 751 | 665 | ||||||||||||
| Net income | 54,490 | 18,330 | 68,997 | 32,180 | ||||||||||||
| Income allocated to non-controlling interests | (107 | ) | (91 | ) | (202 | ) | (179 | ) | ||||||||
| Net income attributable to LTC Properties, Inc. | 54,383 | 18,239 | 68,795 | 32,001 | ||||||||||||
| Income allocated to participating securities | (318 | ) | (113 | ) | (407 | ) | (233 | ) | ||||||||
| Net income available to common stockholders | $ | 54,065 | $ | 18,126 | $ | 68,388 | $ | 31,768 | ||||||||
| Earnings per common share: | ||||||||||||||||
| Basic | $ | 1.37 | $ | 0.46 | $ | 1.74 | $ | 0.81 | ||||||||
| Diluted | $ | 1.36 | $ | 0.46 | $ | 1.73 | $ | 0.81 | ||||||||
| Weighted average shares used to calculate earnings per common share: | ||||||||||||||||
| Basic | 39,492 | 39,169 | 39,347 | 39,135 | ||||||||||||
| Diluted | 39,665 | 39,170 | 39,520 | 39,136 | ||||||||||||
| Dividends declared and paid per common share | $ | 0.57 | $ | 0.57 | $ | 1.14 | $ | 1.14 | ||||||||
|
|
Supplemental Reporting Measures
FFO and FAD are supplemental measures of a real estate investment trust’s (“REIT”) financial performance that are not defined by U.S. generally accepted accounting principles (“GAAP”). Investors, analysts and the Company use FFO and FAD as supplemental measures of operating performance. The Company believes FFO and FAD are helpful in evaluating the operating performance of a REIT. Real estate values historically rise and fall with market conditions, but cost accounting for real estate assets in accordance with GAAP assumes that the value of real estate assets diminishes predictably over time. We believe that by excluding the effect of historical cost depreciation, which may be of limited relevance in evaluating current performance, FFO and FAD facilitate like comparisons of operating performance between periods. Occasionally, the Company may exclude non-recurring items from FFO and FAD in order to allow investors, analysts and our management to compare the Company’s operating performance on a consistent basis without having to account for differences caused by unanticipated items.
FFO, as defined by the National Association of Real Estate Investment Trusts (“NAREIT”), means net income available to common stockholders (computed in accordance with GAAP) excluding gains or losses on the sale of real estate and impairment write-downs of depreciable real estate, plus real estate depreciation and amortization, and after adjustments for unconsolidated partnerships and joint ventures. The Company’s computation of FFO may not be comparable to FFO reported by other REITs that do not define the term in accordance with the current NAREIT definition or have a different interpretation of the current NAREIT definition from that of the Company; therefore, caution should be exercised when comparing our Company’s FFO to that of other REITs.
We define FAD as FFO excluding the effects of straight-line rent, amortization of lease inducement, effective interest income, deferred income from unconsolidated joint ventures, non-cash compensation charges, capitalized interest and non-cash interest charges. GAAP requires rental revenues related to non-contingent leases that contain specified rental increases over the life of the lease to be recognized evenly over the life of the lease. This method results in rental income in the early years of a lease that is higher than actual cash received, creating a straight-line rent receivable asset included in our consolidated balance sheet. At some point during the lease, depending on its terms, cash rent payments exceed the straight-line rent which results in the straight-line rent receivable asset decreasing to zero over the remainder of the lease term. Effective interest method, as required by GAAP, is a technique for calculating the actual interest rate for the term of a mortgage loan based on the initial origination value. Similar to the accounting methodology of straight-line rent, the actual interest rate is higher than the stated interest rate in the early years of the mortgage loan thus creating an effective interest receivable asset included in the interest receivable line item in our consolidated balance sheet and reduces down to zero when, at some point during the mortgage loan, the stated interest rate is higher than the actual interest rate. FAD is useful in analyzing the portion of cash flow that is available for distribution to stockholders. Investors, analysts and the Company utilize FAD as an indicator of common dividend potential. The FAD payout ratio, which represents annual distributions to common shareholders expressed as a percentage of FAD, facilitates the comparison of dividend coverage between REITs.
While the Company uses FFO and FAD as supplemental performance measures of our cash flow generated by operations and cash available for distribution to stockholders, such measures are not representative of cash generated from operating activities in accordance with GAAP, and are not necessarily indicative of cash available to fund cash needs and should not be considered an alternative to net income available to common stockholders.
|
|
Reconciliation of FFO and FAD
The following table reconciles GAAP net income available to common stockholders to each of NAREIT FFO attributable to common stockholders and FAD (unaudited, amounts in thousands, except per share amounts):
| Three Months Ended | Six Months Ended | |||||||||||||||
| June 30, | June 30, | |||||||||||||||
| 2022 | 2021 | 2022 | 2021 | |||||||||||||
| GAAP net income available to common stockholders | $ | 54,065 | $ | 18,126 | $ | 68,388 | $ | 31,768 | ||||||||
| Add: Depreciation and amortization | 9,379 | 9,508 | 18,817 | 19,385 | ||||||||||||
| Less: Gain on sale of real estate, net | (38,094 | ) | (5,463 | ) | (38,196 | ) | (4,690 | ) | ||||||||
| NAREIT FFO attributable to common stockholders | 25,350 | 22,171 | 49,009 | 46,463 | ||||||||||||
| Add: Non-recurring items | (859 | )(1) | 133 | (3) | (436 | )(4) | 1,183 | (6) | ||||||||
| FFO attributable to common stockholders, excluding non-recurring items | $ | 24,491 | $ | 22,304 | $ | 48,573 | $ | 47,646 | ||||||||
| NAREIT FFO attributable to common stockholders | $ | 25,350 | $ | 22,171 | $ | 49,009 | $ | 46,463 | ||||||||
| Non-cash income: | ||||||||||||||||
| Less: straight-line rental adjustment (income) | 293 | 19 | 527 | (663 | )(7) | |||||||||||
| Add: amortization of lease incentives | 206 | 116 | 602 | (5) | 228 | |||||||||||
| Add: Other non-cash expense | — | — | — | 758 | (8) | |||||||||||
| Less: Effective interest income from mortgage loans | (1,387 | ) | (1,483 | ) | (2,789 | ) | (3,227 | )(7) | ||||||||
| Net non-cash income | (888 | ) | (1,348 | ) | (1,660 | ) | (2,904 | ) | ||||||||
| Non-cash expense: | ||||||||||||||||
| Add: Non-cash compensation charges | 2,012 | 1,958 | 3,937 | 3,810 | ||||||||||||
| Less: Provision (recovery) for credit losses | 305 | — | 659 | (9 | ) | |||||||||||
| Net non-cash expense | 2,317 | 1,958 | 4,596 | 3,801 | ||||||||||||
| Funds available for distribution (FAD) | $ | 26,779 | $ | 22,781 | $ | 51,945 | $ | 47,360 | ||||||||
| Add: Non-recurring items | (1,181 | )(2) | 133 | (3) | (1,181 | )(2) | 1,337 | (9) | ||||||||
| FAD, excluding non-recurring items | $ | 25,598 | $ | 22,914 | $ | 50,764 | $ | 48,697 | ||||||||
| (1) | Represents (2) below partially offset by the provision for credit losses related to the origination of two mortgage loans during 2022 second quarter ($322). |
| (2) | Represents the lease termination fee received in connection with the sale of a 74-unit assisted living community ($1,181). |
| (3) | Represents the GAAP and cash impact of the 50% reduction of 2021 rent escalation. |
| (4) | Represents (2) from above partially offset by the provision for credit losses related to the origination of two mortgage loans during the second quarter of 2022 and a $25,000 mezzanine loan during the first quarter of 2022 ($572) and (5) below. |
| (5) | Includes a lease incentive balance write-off of $173 related to a closed property and subsequent lease termination. |
| (6) | Represents the GAAP impact of the 50% reduction of 2021 rent and interest escalation. |
| (7) | Includes the impact of the 50% reduction of 2021 rent and interest escalation on straight-line rent and effective interest. |
| (8) | Represents a straight-line rent receivable write-off due to transitioning rental revenue to cash basis. |
| (9) | Represents the cash impact of the 50% reduction of 2021 rent and interest escalation. |
(Reconciliation of FFO and FAD continued on next page)
|
|
Reconciliation of FFO and FAD (continued)
The following table continues the reconciliation between GAAP net income available to common stockholders and each of NAREIT FFO attributable to common stockholders and FAD (unaudited, amounts in thousands, except per share amounts):
| Three Months Ended | Six Months Ended | |||||||||||||||
| June 30, | June 30, | |||||||||||||||
| 2022 | 2021 | 2022 | 2021 | |||||||||||||
| NAREIT Basic FFO attributable to common stockholders per share | $ | 0.64 | $ | 0.57 | $ | 1.25 | $ | 1.19 | ||||||||
| NAREIT Diluted FFO attributable to common stockholders per share | $ | 0.64 | $ | 0.57 | $ | 1.24 | $ | 1.19 | ||||||||
| NAREIT Diluted FFO attributable to common stockholders | $ | 25,350 | $ | 22,171 | $ | 49,009 | $ | 46,696 | ||||||||
| Weighted average shares used to calculate NAREIT diluted FFO per share attributable to common stockholders | 39,665 | 39,170 | 39,520 | 39,333 | ||||||||||||
| Diluted FFO attributable to common stockholders, excluding non-recurring items | $ | 24,491 | $ | 22,417 | $ | 48,573 | $ | 47,879 | ||||||||
| Weighted average shares used to calculate diluted FFO, excluding non-recurring items, per share attributable to common stockholders | 39,665 | 39,369 | 39,520 | 39,333 | ||||||||||||
| Diluted FAD | $ | 26,779 | $ | 22,894 | $ | 51,945 | $ | 47,593 | ||||||||
| Weighted average shares used to calculate diluted FAD per share | 39,665 | 39,369 | 39,520 | 39,333 | ||||||||||||
| Diluted FAD, excluding non-recurring items | $ | 25,598 | $ | 23,027 | $ | 50,764 | $ | 48,930 | ||||||||
| Weighted average shares used to calculate diluted FAD, excluding non-recurring items, per share | 39,665 | 39,369 | 39,520 | 39,333 | ||||||||||||
|
|
LTC PROPERTIES, INC.
CONSOLIDATED BALANCE SHEETS
(amounts in thousands, except per share)
| June 30, 2022 | December 31, 2021 | |||||||
| (unaudited) | (audited) | |||||||
| ASSETS | ||||||||
| Investments: | ||||||||
| Land | $ | 125,786 | $ | 123,239 | ||||
| Buildings and improvements | 1,284,151 | 1,285,318 | ||||||
| Accumulated depreciation and amortization | (374,170 | ) | (374,606 | ) | ||||
| Real property investments, net | 1,035,767 | 1,033,951 | ||||||
| Mortgage loans receivable, net of loan loss reserve: 2022—$3,830; 2021—$3,473 | 379,817 | 344,442 | ||||||
| Real estate investments, net | 1,415,584 | 1,378,393 | ||||||
| Notes receivable, net of loan loss reserve: 2022—$588; 2021—$286 | 58,206 | 28,337 | ||||||
| Investments in unconsolidated joint ventures | 19,340 | 19,340 | ||||||
| Investments, net | 1,493,130 | 1,426,070 | ||||||
| Other assets: | ||||||||
| Cash and cash equivalents | 6,401 | 5,161 | ||||||
| Debt issue costs related to revolving line of credit | 2,681 | 3,057 | ||||||
| Interest receivable | 42,713 | 39,522 | ||||||
| Straight-line rent receivable | 22,689 | 24,146 | ||||||
| Lease incentives | 1,910 | 2,678 | ||||||
| Prepaid expenses and other assets | 8,703 | 4,191 | ||||||
| Total assets | $ | 1,578,227 | $ | 1,504,825 | ||||
| LIABILITIES | ||||||||
| Revolving line of credit | $ | 56,000 | $ | 110,900 | ||||
| Term loans, net of debt issue costs: 2022—$563; 2021—$637 | 99,437 | 99,363 | ||||||
| Senior unsecured notes, net of debt issue costs: 2022—$1,549; 2021—$524 | 579,431 | 512,456 | ||||||
| Accrued interest | 3,946 | 3,745 | ||||||
| Accrued expenses and other liabilities | 28,917 | 33,234 | ||||||
| Total liabilities | 767,731 | 759,698 | ||||||
| EQUITY | ||||||||
| Stockholders’ equity: | ||||||||
| Common stock: $0.01 par value; 60,000 shares authorized; shares issued and outstanding: 2022—40,380; 2021—39,374 | 404 | 394 | ||||||
| Capital in excess of par value | 893,155 | 856,895 | ||||||
| Cumulative net income | 1,513,431 | 1,444,636 | ||||||
| Accumulated other comprehensive income (loss) | 6,139 | (172 | ) | |||||
| Cumulative distributions | (1,610,155 | ) | (1,565,039 | ) | ||||
| Total LTC Properties, Inc. stockholders’ equity | 802,974 | 736,714 | ||||||
| Non-controlling interests | 7,522 | 8,413 | ||||||
| Total equity | 810,496 | 745,127 | ||||||
| Total liabilities and equity | $ | 1,578,227 | $ | 1,504,825 | ||||
|
|
Exhibit 99.2
RENEWAL AND TRANSITION SUPPLEMENTAL OPERATING AND FINANCIAL DATA SECOND QUARTER 2022
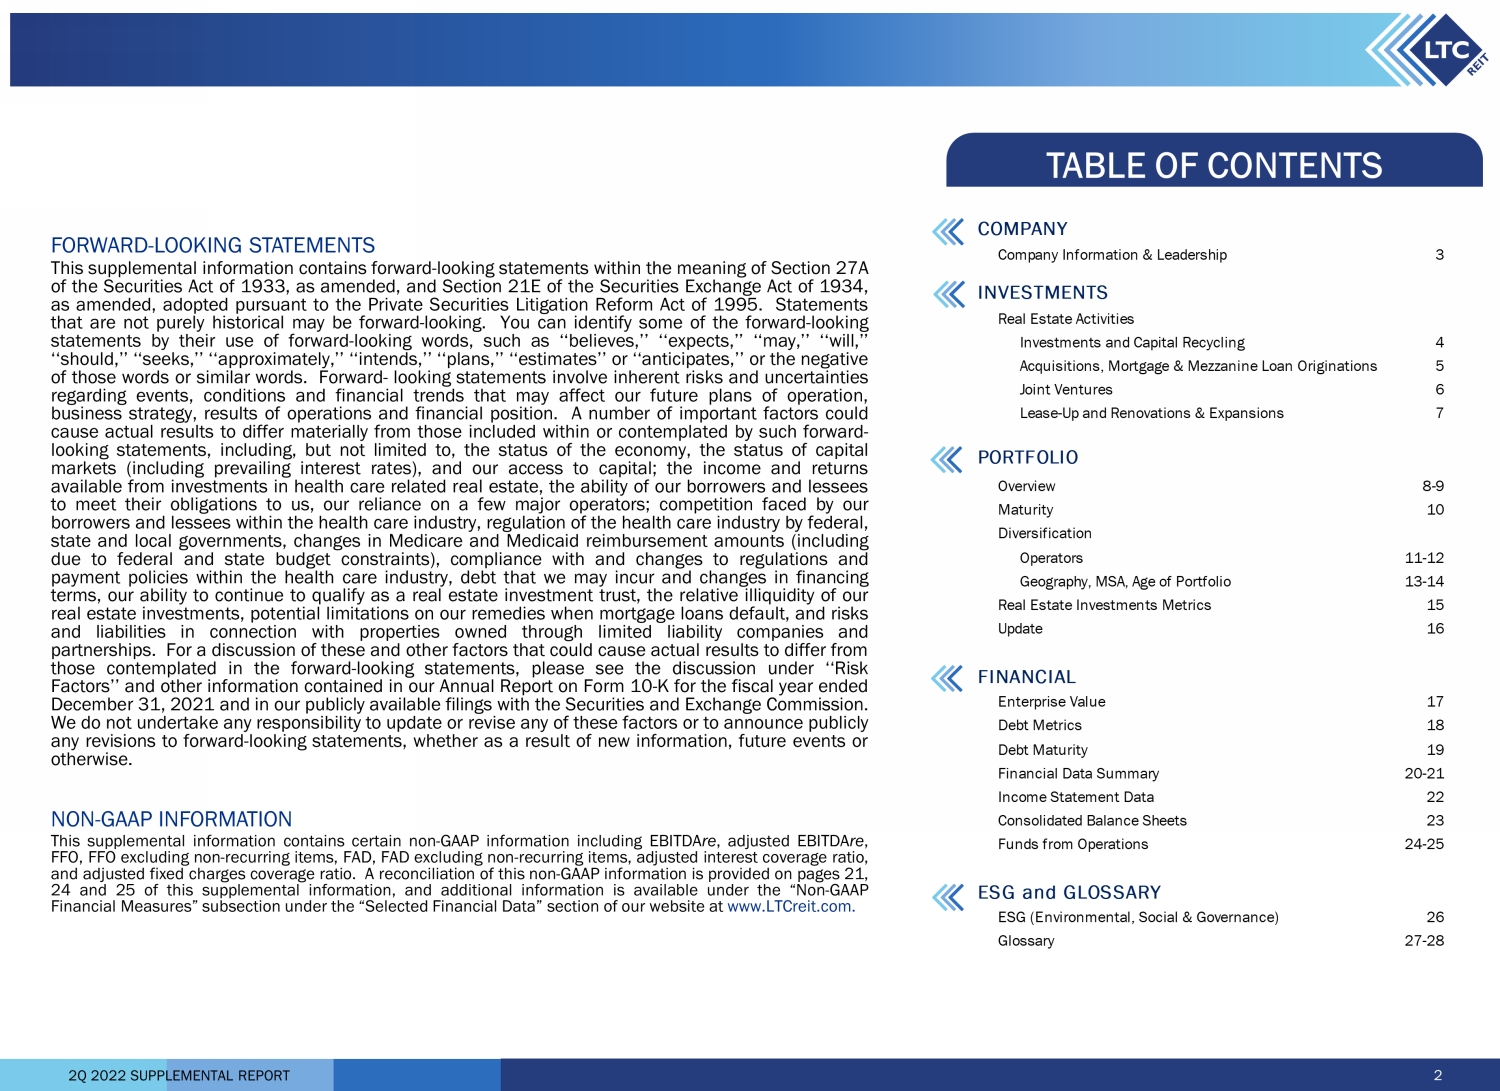
2Q 2022 SUPPLEMENTAL REPORT FORWARD - LOOKING STATEMENTS This supplemental information contains forward - looking statements within the meaning of Section 27 A of the Securities Act of 1933 , as amended, and Section 21 E of the Securities Exchange Act of 1934 , as amended, adopted pursuant to the Private Securities Litigation Reform Act of 1995 . Statements that are not purely historical may be forward - looking . You can identify some of the forward - looking statements by their use of forward - looking words, such as ‘‘believes,’’ ‘‘expects,’’ ‘‘may,’’ ‘‘will,’’ ‘‘should,’’ ‘‘seeks,’’ ‘‘approximately,’’ ‘‘intends,’’ ‘‘plans,’’ ‘‘estimates’’ or ‘‘anticipates,’’ or the negative of those words or similar words . Forward - looking statements involve inherent risks and uncertainties regarding events, conditions and financial trends that may affect our future plans of operation, business strategy, results of operations and financial position . A number of important factors could cause actual results to differ materially from those included within or contemplated by such forward - looking statements, including, but not limited to, the status of the economy, the status of capital markets (including prevailing interest rates), and our access to capital ; the income and returns available from investments in health care related real estate, the ability of our borrowers and lessees to meet their obligations to us, our reliance on a few major operators ; competition faced by our borrowers and lessees within the health care industry, regulation of the health care industry by federal, state and local governments, changes in Medicare and Medicaid reimbursement amounts (including due to federal and state budget constraints), compliance with and changes to regulations and payment policies within the health care industry, debt that we may incur and changes in financing terms, our ability to continue to qualify as a real estate investment trust, the relative illiquidity of our real estate investments, potential limitations on our remedies when mortgage loans default, and risks and liabilities in connection with properties owned through limited liability companies and partnerships . For a discussion of these and other factors that could cause actual results to differ from those contemplated in the forward - looking statements, please see the discussion under ‘‘Risk Factors’’ and other information contained in our Annual Report on Form 10 - K for the fiscal year ended December 31 , 2021 and in our publicly available filings with the Securities and Exchange Commission . We do not undertake any responsibility to update or revise any of these factors or to announce publicly any revisions to forward - looking statements, whether as a result of new information, future events or otherwise . NON - GAAP INFORMATION This supplemental information contains certain non - GAAP information including EBITDA re , adjusted EBITDA re , FFO, FFO excluding non - recurring items, FAD, FAD excluding non - recurring items, adjusted interest coverage ratio, and adjusted fixed charges coverage ratio . A reconciliation of this non - GAAP information is provided on pages 21 , 24 and 25 of this supplemental information, and additional information is available under the “Non - GAAP Financial Measures” subsection under the “Selected Financial Data” section of our website at www . LTCreit . com . TABLE OF CONTENTS 2 COMPANY Company Information & Leadership 3 INVESTMENTS Real Estate Activities Investments and Capital Recycling 4 Acquisitions, Mortgage & Mezzanine Loan Originations 5 Joint Ventures 6 Lease-Up and Renovations & Expansions 7 PORTFOLIO Overview 8-9 Maturity 10 Diversification Operators 11-12 Geography, MSA, Age of Portfolio 13-14 Real Estate Investments Metrics 15 Update 16 FINANCIAL Enterprise Value 17 Debt Metrics 18 Debt Maturity 19 Financial Data Summary 20-21 Income Statement Data 22 Consolidated Balance Sheets 23 Funds from Operations 24-25 ESG and GLOSSARY ESG (Environmental, Social & Governance) 26 Glossary 27-28

2Q 2022 SUPPLEMENTAL REPORT 3 Founded in 1992 , LTC Properties, Inc . (NYSE : LTC) is a self - administered real estate investment trust (REIT) investing in seniors housing and health care properties primarily through sale - leaseback transactions, mortgage financing and structured finance solutions including preferred equity and mezzanine lending . LTC’s portfolio encompasses Skilled Nursing Facilities (SNF), Assisted Living Communities (ALF), Independent Living Communities (ILF), Memory Care Communities (MC) and combinations thereof . Our main objective is to build and grow a diversified portfolio that creates and sustains shareholder value while providing our stockholders current distribution income . To meet this objective, we seek properties operated by regional operators, ideally offering upside and portfolio diversification (geographic, operator, property type and investment vehicle) . For more information, visit www . LTCreit . com . Any opinions, estimates, or forecasts regarding LTC’s performance made by the analysts listed above do not represent the opinions, estimates, and forecasts of LTC or its management. BOARD OF DIRECTORS ANALYSTS WENDY SIMPSON Chairman and Chief Executive Officer PAM KESSLER Co - President, CFO and Secretary CLINT MALIN Co - President and Chief Investment Officer CECE CHIKHALE Executive Vice President, Chief Accounting Officer and Treasurer DOUG KOREY Executive Vice President, Managing Director of Business Development PETER LYEW Vice President, Director of Taxes GIBSON SATTERWHITE Senior Vice President, Asset Management MANDI HOGAN Vice President of Marketing, Investor Relations and ESG MIKE BOWDEN Vice President, Investments LEADERSHIP RACHEL SON Vice President and Controller LTC PROPERTIES, INC. 2829 Townsgate Road Suite 350 Westlake Village, CA 91361 805 - 981 - 8655 www.LTCreit.com TRANSFER AGENT Broadridge Shareholder Services c/o Broadridge Corporate Issuer Solutions 1155 Long Island Avenue Edgewood, NY 11717 - 8309 ATTN: IWS 866 - 708 - 5586 WENDY SIMPSON Chairman CORNELIA CHENG ESG Committee Chairman BOYD HENDRICKSON Lead Independent Director and Nominating & Corporate Governance Committee Chairman JAMES PIECZYNSKI Investment Committee Chairman DEVRA SHAPIRO Audit Committee Chairman TIMOTHY TRICHE, MDCompensation Committee Chairman CONNOR SIVERSKY Berenberg Capital Markets JUAN SANABRIA BMO Capital Markets Corp. DANIEL BERNSTEIN CapitalOne TAYO OKUSANYA Credit Suisse Securities (USA) LLC AARON HECHT JMP Securities, LLC AUSTIN WURSCHMIDTKeyBanc Capital Markets, Inc. MIKE CARROLL RBC Capital Markets Corporation RICHARD ANDERSONSMBC Nikko Securities STEVE MANAKER Stifel, Nicolaus & Company, Inc.

2Q 2022 SUPPLEMENTAL REPORT Million $ 392.6 Total Sales (2) (1) Represents total investments. (2) Reflects total sales price. INVESTMENTS I 4 Million 177.4 Total Gains $ Billion $ 1.7 Total Investments (1) MILLION REAL ESTATE ACTIVITIES – INVESTMENTS AND CAPITAL RECYCLING SINCE 2010 (FROM JANUARY 1, 2010 THROUGH JUNE 30, 2022) $0 $50 $100 $150 $200 $250 $300 $350 $400 $450 2010 2011 2012 2013 2014 2015 2016 2017 2018 2019 2020 2021 YTD 2022 Investments Sales

2Q 2022 SUPPLEMENTAL REPORT ACQUISITIONS MORTGAGE LOANS 5 INVESTMENTS I REAL ESTATE ACTIVITIES – ACQUISITIONS, MORTGAGE & MEZZANINE LOAN ORIGINATIONS (DOLLAR AMOUNTS IN THOUSANDS) CONTRACTUAL # OF PROPERTY # OF DATE OF INITIAL PURCHASE PROPERTIES TYPE BEDS LOCATION OPERATOR CONSTRUCTION CASH YIELD PRICE 2022 4/1 4 SNF 339 beds Various cities in TX Ignite Medical Resorts 2017-2018 8.00% 51,534$ (1) DATE (1) We entered into a one - year loan agreement secured by a parcel of land for a future development of a post - acute skilled nursing c enter to be operated by Ignite Medical Resorts. (2) The loan includes a 12 - month extension option and the remaining commitment is for capital improvement. See page 7 for Renovation s and Expansions. (3) The remaining commitment of $4,177 is for the construction of a memory care addition to the property. See page 7 for Renovati ons and Expansions. (4) The initial rate is 7.25% with an 8.00% IRR. The remaining commitment is comprised of a $6,098 capital improvement commitment an d a $650 working capital commitment, which has been fully funded. See page 7 for Renovations and Expansions. (5) The initial rate is 7.25% with an 8.00% IRR. The remaining commitment is for working capital. (6) Represents a mortgage loan on a parcel of land adjacent to one of the assisted living communities secured under the $35,074 A LG mortgage loan. The land is being held for the future development of a seniors housing community. The initial rate is 7.25% with an 8.00% IRR. MEZZANINE LOANS (1) The loan includes two 12 - month extension options. The initial cash rate is 8.00% for the first 18 months then increasing to 10.5 0% thereafter with a 10.50% IRR. Our investment represents approximately 8.00% of the total investment. (2) The loan includes two 12 - month extension options. The initial cash rate is 8.00% with a 11.00% IRR. Our investment represents ap proximately 12.00% of the total investment. # OF PROPERTY # OF MATURITY PROPERTIES TYPE UNITS LOCATION OPERATOR DATE 2021 1 ILF 136 units Bend, OR BPM Senior Living Oct-2024 8.00% (1) 4,355$ 2022 5 ILF/ALF/MC 621 units Various cities in OR & MT The Springs Living May-2027 8.00% (2) 25,000$ CONTRACTUAL YEAR RATE BALANCE COMMITMENT INITIAL INVESTMENT (1) The lease term is 10 years, with two 5 - year renewal options, and contains a purchase option beginning in the sixth lease year th rough the end of the seventh lease year. We expect to receive rent of approximately $1,000 in each of 3Q22 and 4Q22 and approximately $4,300 during 2023. Rent will increase annually beginning on the third anniversary of the lease by 2.0% to 4.0% based on the change in the Medicare Market Basket Rate. Additionally, we provided a 10 - year working capital loan for up to $2,000, of which $1,867 has been funded, at 8.00% for first y ear increasing to 8.25% for the second year then increasing annually with the lease rate. CONTRACTUAL # OF PROPERTY # BEDS/ MATURITY INITIAL INITIAL PROPERTIES TYPE UNITS LOCATION OPERATOR DATE RATE ORIGINATION INVESTMENT 2021 9/30 — (1) OTH N/A St Peters, MO N/A (1) Oct-2022 7.50% 1,780$ 1,780$ —$ 10/1 1 SNF 189 beds Lafayette, LA Crossroads Area Management Oct-2024 7.50% 27,347 27,047 300 (2) 10/5 1 ALF/MC 68 units Ocala, FL Pointe Group Care Sep-2025 7.75% 16,707 12,530 4,177 (3) 12/1 13 ALF/MC/ILF 523 units Various cities in NC & SC ALG Senior Living Dec-2025 7.25% 59,250 52,502 6,748 (4) 15 189 beds/591 units 105,084$ 93,859$ 11,225$ 2022 5/5 4 ALF 217 units Various cities in NC ALG Senior Living Jun-2026 7.25% 35,074$ 33,842$ 1,232$ (5) 5/5 — (6) OTH N/A Mills River, NC ALG Senior Living Jun-2026 7.25% 826 826 — 4 217 units 35,900$ 34,668$ 1,232$ INITIAL DATE COMMITMENT ADDITIONAL
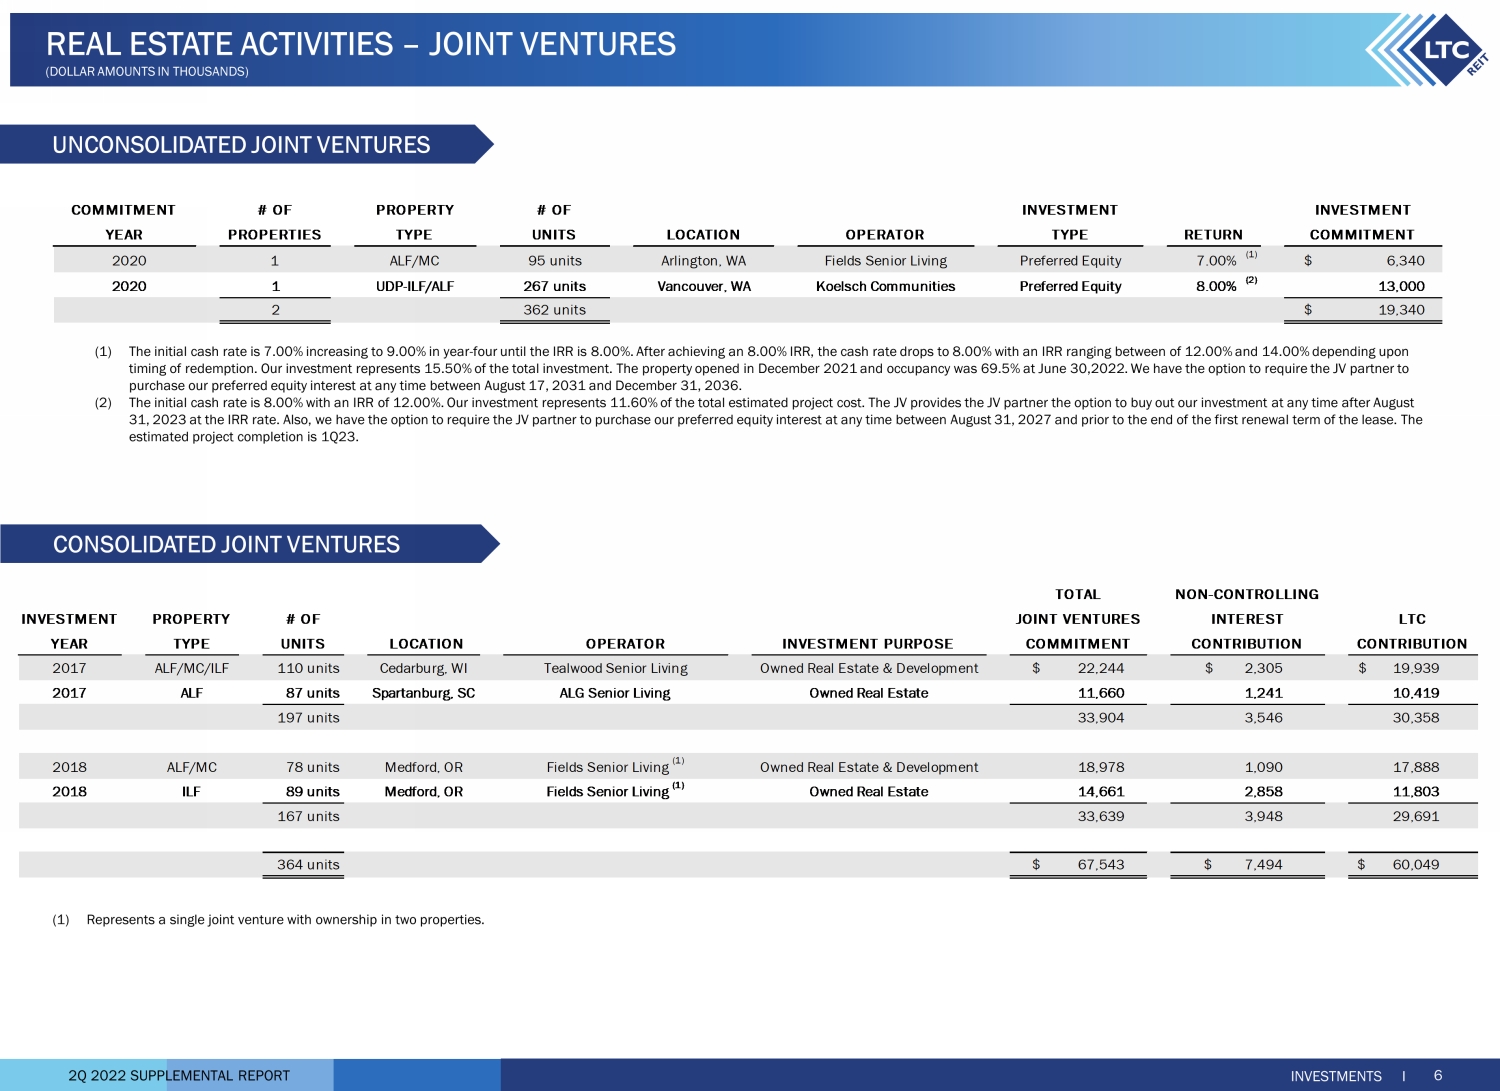
2Q 2022 SUPPLEMENTAL REPORT INVESTMENT PROPERTY # OF YEAR TYPE UNITS LOCATION OPERATOR INVESTMENT PURPOSE 2017 ALF/MC/ILF 110 units Cedarburg, WI Tealwood Senior Living Owned Real Estate & Development 22,244$ 2,305$ 19,939$ 2017 ALF 87 units Spartanburg, SC ALG Senior Living Owned Real Estate 11,660 1,241 10,419 197 units 33,904 3,546 30,358 2018 ALF/MC 78 units Medford, OR Fields Senior Living (1) Owned Real Estate & Development 18,978 1,090 17,888 2018 ILF 89 units Medford, OR Fields Senior Living (1) Owned Real Estate 14,661 2,858 11,803 167 units 33,639 3,948 29,691 364 units 67,543$ 7,494$ 60,049$ CONTRIBUTION LTCJOINT VENTURES INTEREST TOTAL NON-CONTROLLING CONTRIBUTIONCOMMITMENT (1) Represents a single joint venture with ownership in two properties. (1) The initial cash rate is 7.00% increasing to 9.00% in year - four until the IRR is 8.00%. After achieving an 8.00% IRR, the cash r ate drops to 8.00% with an IRR ranging between of 12.00% and 14.00% depending upon timing of redemption. Our investment represents 15.50% of the total investment. The property opened in December 2021 and occu pan cy was 69.5% at June 30,2022. We have the option to require the JV partner to purchase our preferred equity interest at any time between August 17, 2031 and December 31, 2036. (2) The initial cash rate is 8.00% with an IRR of 12.00%. Our investment represents 11.60% of the total estimated project cost. T he JV provides the JV partner the option to buy out our investment at any time after August 31, 2023 at the IRR rate. Also, we have the option to require the JV partner to purchase our preferred equity interest at any ti me between August 31, 2027 and prior to the end of the first renewal term of the lease. The estimated project completion is 1Q23. CONSOLIDATED JOINT VENTURES UNCONSOLIDATED JOINT VENTURES INVESTMENTS I 6 REAL ESTATE ACTIVITIES – JOINT VENTURES (DOLLAR AMOUNTS IN THOUSANDS) # OF PROPERTY # OF INVESTMENT PROPERTIES TYPE UNITS LOCATION OPERATOR TYPE 2020 1 ALF/MC 95 units Arlington, WA Fields Senior Living Preferred Equity 7.00% (1) 6,340$ 2020 1 UDP-ILF/ALF 267 units Vancouver, WA Koelsch Communities Preferred Equity 8.00% (2) 13,000 2 362 units 19,340$ COMMITMENT INVESTMENT YEAR COMMITMENTRETURN
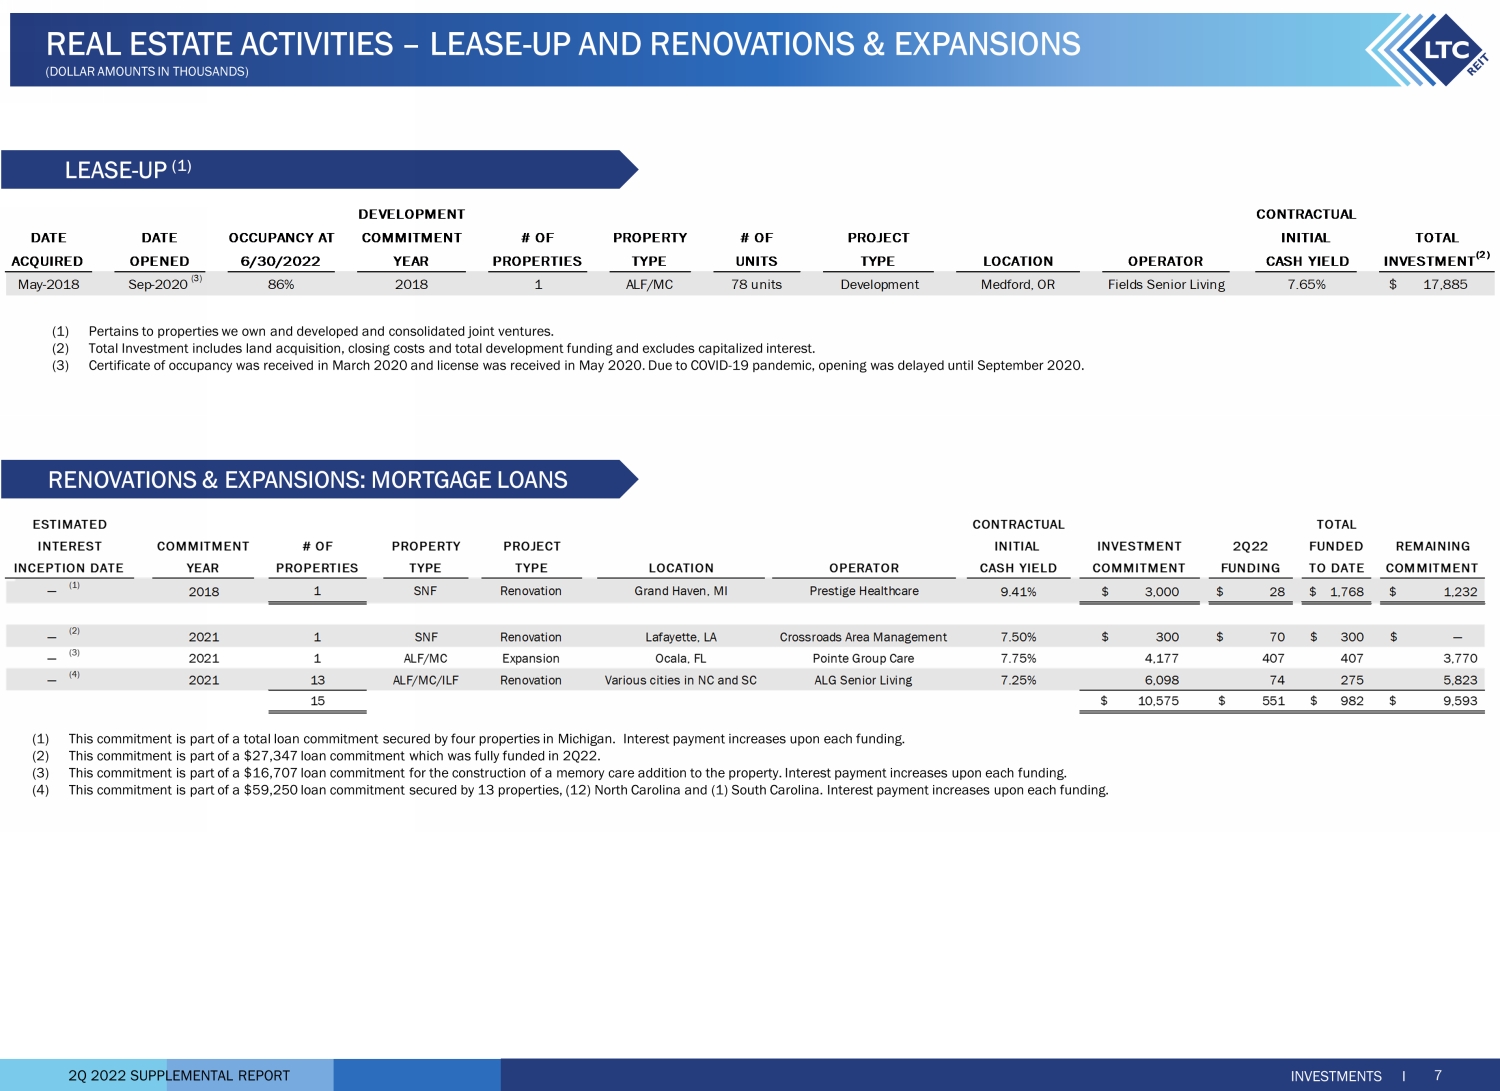
2Q 2022 SUPPLEMENTAL REPORT CONTRACTUAL TOTAL COMMITMENT # OF PROPERTY PROJECT INITIAL INVESTMENT 2Q22 FUNDED REMAINING YEAR PROPERTIES TYPE TYPE LOCATION OPERATOR CASH YIELD TO DATE COMMITMENT — (1) 2018 1 SNF Renovation Grand Haven, MI Prestige Healthcare 9.41% 3,000$ 28$ 1,768$ 1,232$ — (2) 2021 1 SNF Renovation Lafayette, LA Crossroads Area Management 7.50% 300$ 70$ 300$ —$ — (3) 2021 1 ALF/MC Expansion Ocala, FL Pointe Group Care 7.75% 4,177 407 407 3,770 — (4) 2021 13 ALF/MC/ILF Renovation Various cities in NC and SC ALG Senior Living 7.25% 6,098 74 275 5,823 15 10,575$ 551$ 982$ 9,593$ INCEPTION DATE COMMITMENT FUNDING INTEREST ESTIMATED (1) This commitment is part of a total loan commitment secured by four properties in Michigan. Interest payment increases upon e ach funding. (2) This commitment is part of a $27,347 loan commitment which was fully funded in 2Q22. (3) This commitment is part of a $16,707 loan commitment for the construction of a memory care addition to the property. Interest pa yment increases upon each funding. (4) This commitment is part of a $59,250 loan commitment secured by 13 properties, (12) North Carolina and (1) South Carolina. In ter est payment increases upon each funding. (1) Pertains to properties we own and developed and consolidated joint ventures. (2) Total Investment includes land acquisition, closing costs and total development funding and excludes capitalized interest. (3) Certificate of occupancy was received in March 2020 and license was received in May 2020. Due to COVID - 19 pandemic, opening was delayed until September 2020. LEASE - UP (1) RENOVATIONS & EXPANSIONS: MORTGAGE LOANS INVESTMENTS I 7 REAL ESTATE ACTIVITIES – LEASE - UP AND RENOVATIONS & EXPANSIONS (DOLLAR AMOUNTS IN THOUSANDS) DEVELOPMENT CONTRACTUAL DATE DATE OCCUPANCY AT COMMITMENT # OF PROPERTY # OF PROJECT INITIAL ACQUIRED OPENED 6/30/2022 YEAR PROPERTIES TYPE UNITS TYPE LOCATION OPERATOR CASH YIELD May-2018 Sep-2020 (3) 86% 2018 1 ALF/MC 78 units Development Medford, OR Fields Senior Living 7.65% 17,885$ INVESTMENT (2) TOTAL
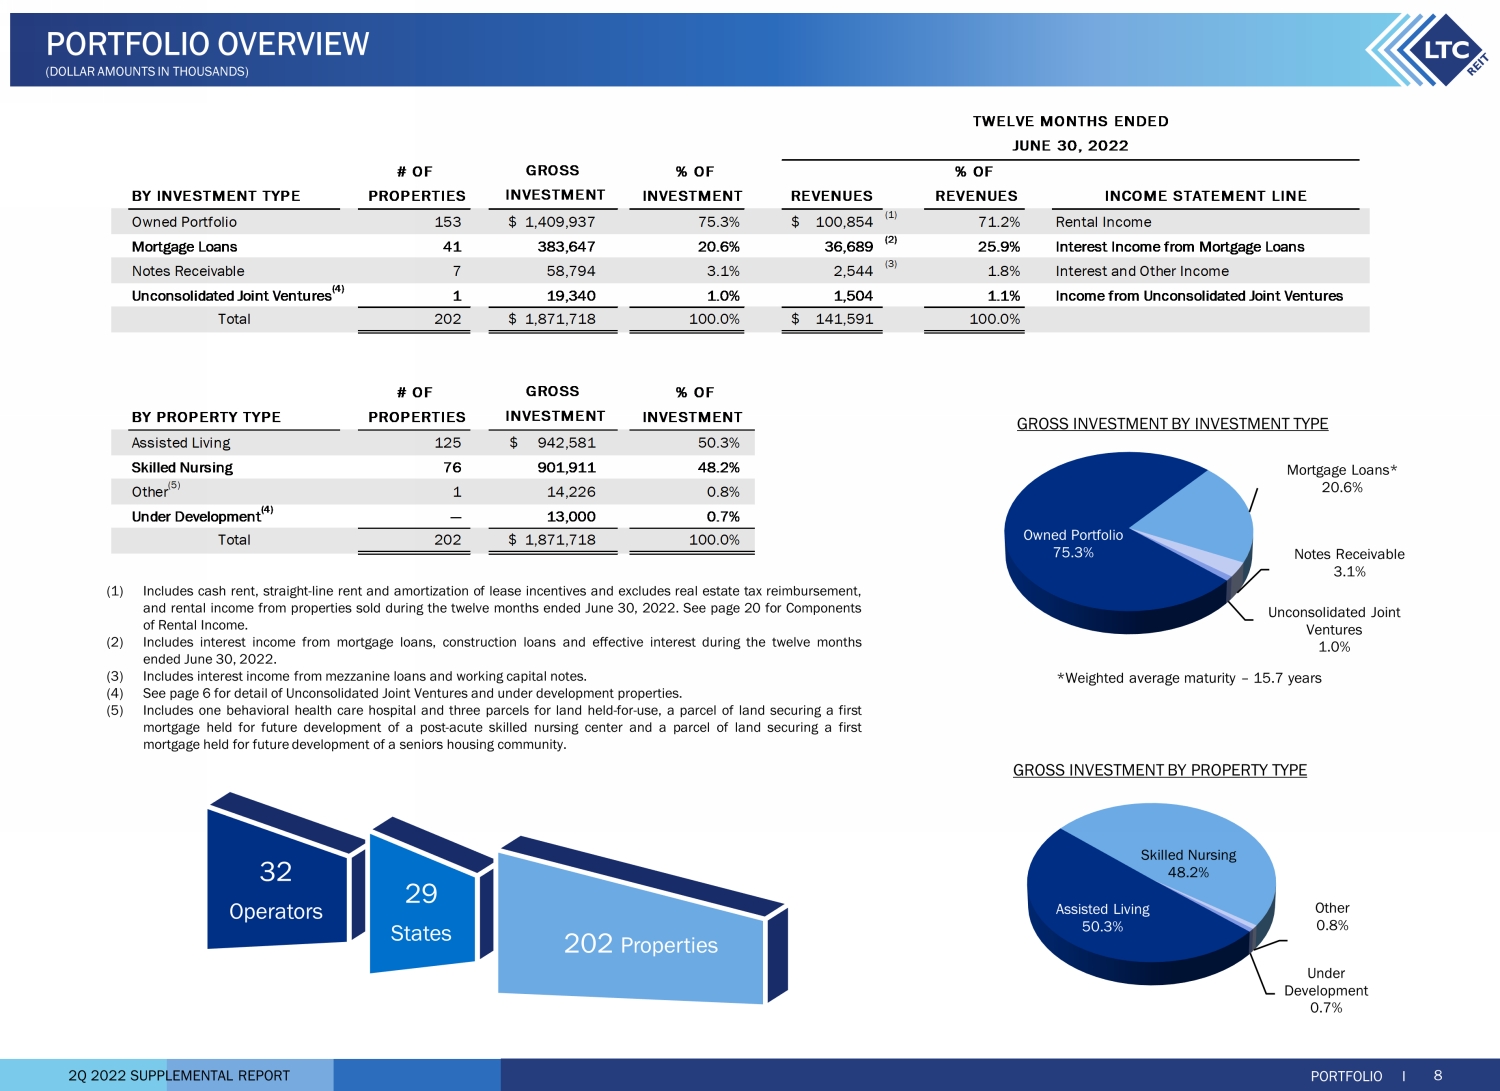
2Q 2022 SUPPLEMENTAL REPORT # OF % OF % OF BY INVESTMENT TYPE PROPERTIES INVESTMENT REVENUES REVENUES INCOME STATEMENT LINE Owned Portfolio 153 1,409,937$ 75.3% 100,854$ (1) 71.2% Rental Income Mortgage Loans 41 383,647 20.6% 36,689 (2) 25.9% Interest Income from Mortgage Loans Notes Receivable 7 58,794 3.1% 2,544 (3) 1.8% Interest and Other Income Unconsolidated Joint Ventures (4) 1 19,340 1.0% 1,504 1.1% Income from Unconsolidated Joint Ventures Total 202 1,871,718$ 100.0% 141,591$ 100.0% # OF % OF BY PROPERTY TYPE PROPERTIES INVESTMENT Assisted Living 125 942,581$ 50.3% Skilled Nursing 76 901,911 48.2% Other (5) 1 14,226 0.8% Under Development (4) — 13,000 0.7% Total 202 1,871,718$ 100.0% INVESTMENT GROSS INVESTMENT TWELVE MONTHS ENDED JUNE 30, 2022 GROSS Owned Portfolio 75.3% Mortgage Loans* 20.6% Notes Receivable 3.1% Unconsolidated Joint Ventures 1.0% Assisted Living 50.3% Skilled Nursing 48.2% Other 0.8% Under Development 0.7% (1) Includes cash rent, straight - line rent and amortization of lease incentives and excludes real estate tax reimbursement, and rental income from properties sold during the twelve months ended June 30 , 2022 . See page 20 for Components of Rental Income . (2) Includes interest income from mortgage loans, construction loans and effective interest during the twelve months ended June 30 , 2022 . (3) Includes interest income from mezzanine loans and working capital notes . (4) See page 6 for detail of Unconsolidated Joint Ventures and under development properties . (5) Includes one behavioral health care hospital and three parcels for land held - for - use, a parcel of land securing a first mortgage held for future development of a post - acute skilled nursing center and a parcel of land securing a first mortgage held for future development of a seniors housing community . 32 Operators 29 States 202 Properties PORTFOLIO I 8 PORTFOLIO OVERVIEW (DOLLAR AMOUNTS IN THOUSANDS) *Weighted average maturity – 15.7 years GROSS INVESTMENT BY INVESTMENT TYPE GROSS INVESTMENT BY PROPERTY TYPE
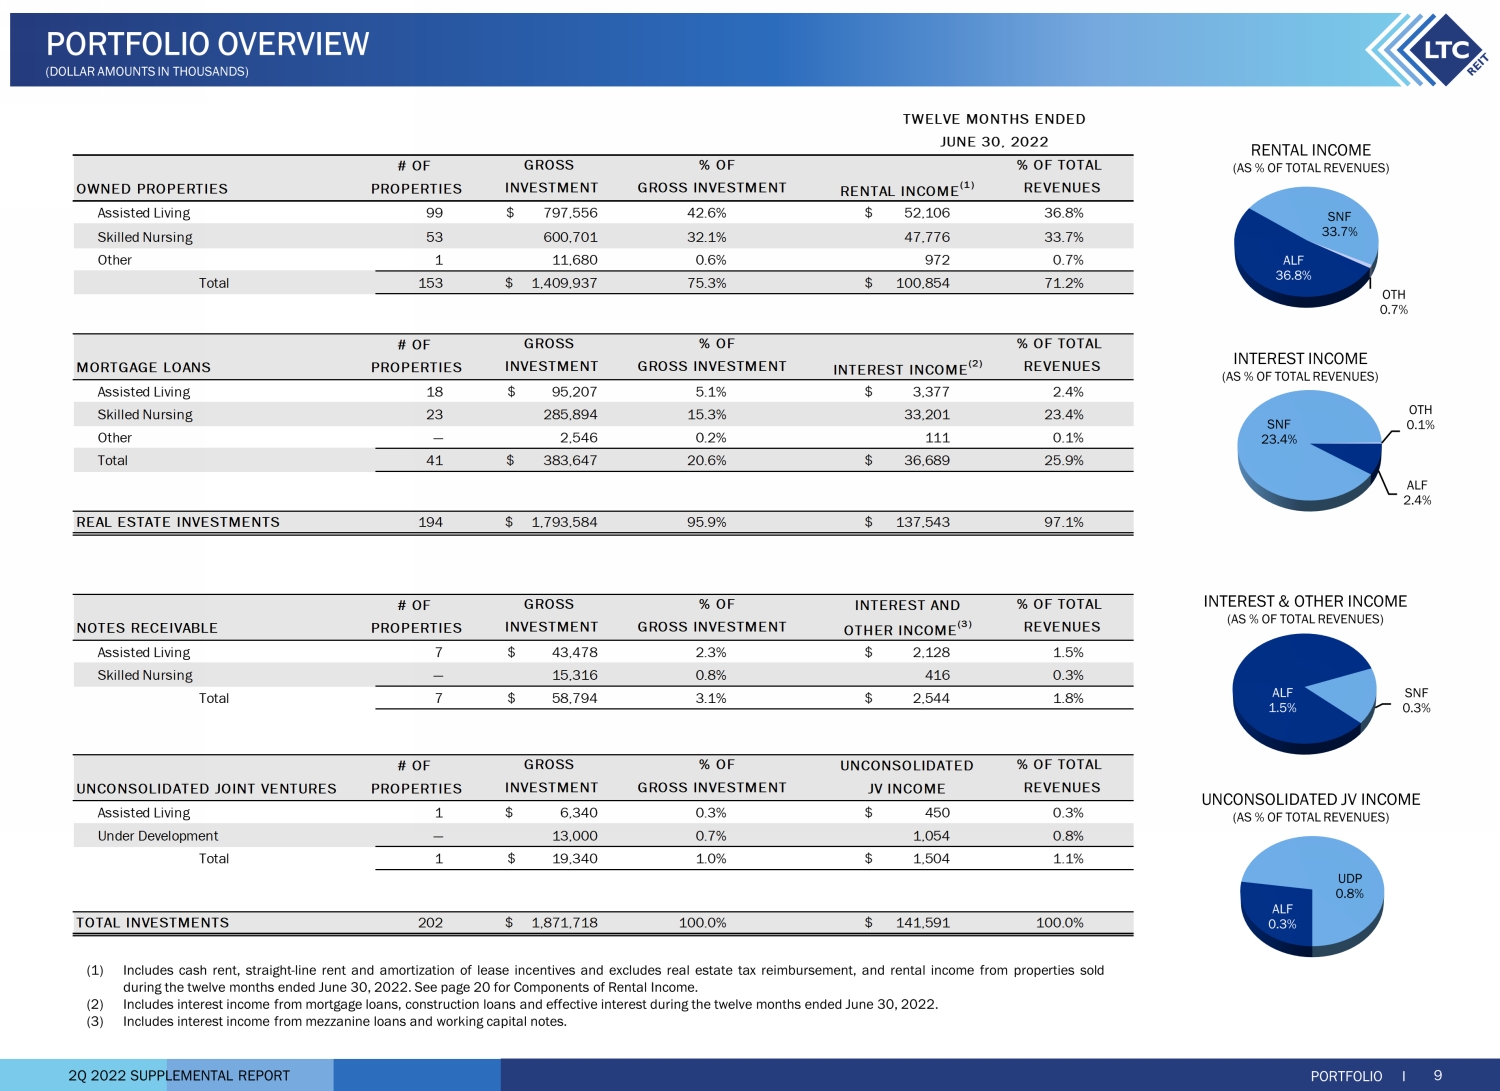
2Q 2022 SUPPLEMENTAL REPORT (1) Includes cash rent, straight - line rent and amortization of lease incentives and excludes real estate tax reimbursement, and rental income from properties sold during the twelve months ended June 30 , 2022 . See page 20 for Components of Rental Income . (2) Includes interest income from mortgage loans, construction loans and effective interest during the twelve months ended June 30 , 2022 . (3) Includes interest income from mezzanine loans and working capital notes . ALF 36.8% SNF 33.7% OTH 0.7% PORTFOLIO I 9 PORTFOLIO OVERVIEW (DOLLAR AMOUNTS IN THOUSANDS) RENTAL INCOME (AS % OF TOTAL REVENUES) INTEREST INCOME (AS % OF TOTAL REVENUES) ALF 1.5% SNF 0.3% INTEREST & OTHER INCOME (AS % OF TOTAL REVENUES) ALF 0.3% UDP 0.8% UNCONSOLIDATED JV INCOME (AS % OF TOTAL REVENUES) ALF 2.4% SNF 23.4% OTH 0.1% # OF OWNED PROPERTIES PROPERTIES RENTAL INCOME (1) Assisted Living 99 797,556$ 42.6% 52,106$ 36.8% Skilled Nursing 53 600,701 32.1% 47,776 33.7% Other 1 11,680 0.6% 972 0.7% Total 153 1,409,937$ 75.3% 100,854$ 71.2% # OF MORTGAGE LOANS PROPERTIES INTEREST INCOME (2) Assisted Living 18 95,207$ 5.1% 3,377$ 2.4% Skilled Nursing 23 285,894 15.3% 33,201 23.4% Other — 2,546 0.2% 111 0.1% Total 41 383,647$ 20.6% 36,689$ 25.9% REAL ESTATE INVESTMENTS 194 1,793,584$ 95.9% 137,543$ 97.1% # OF INTEREST AND NOTES RECEIVABLE PROPERTIES OTHER INCOME (3) Assisted Living 7 43,478$ 2.3% 2,128$ 1.5% Skilled Nursing — 15,316 0.8% 416 0.3% Total 7 58,794$ 3.1% 2,544$ 1.8% # OF UNCONSOLIDATED UNCONSOLIDATED JOINT VENTURES PROPERTIES JV INCOME Assisted Living 1 6,340$ 0.3% 450$ 0.3% Under Development — 13,000 0.7% 1,054 0.8% Total 1 19,340$ 1.0% 1,504$ 1.1% TOTAL INVESTMENTS 202 1,871,718$ 100.0% 141,591$ 100.0% REVENUES % OF TOTAL REVENUES % OF TOTAL REVENUES % OF TOTAL % OF GROSS INVESTMENT % OF GROSS INVESTMENT INVESTMENT GROSS GROSS INVESTMENT GROSS INVESTMENT % OF GROSS INVESTMENT INVESTMENT TWELVE MONTHS ENDED JUNE 30, 2022 GROSS % OF GROSS INVESTMENT REVENUES % OF TOTAL
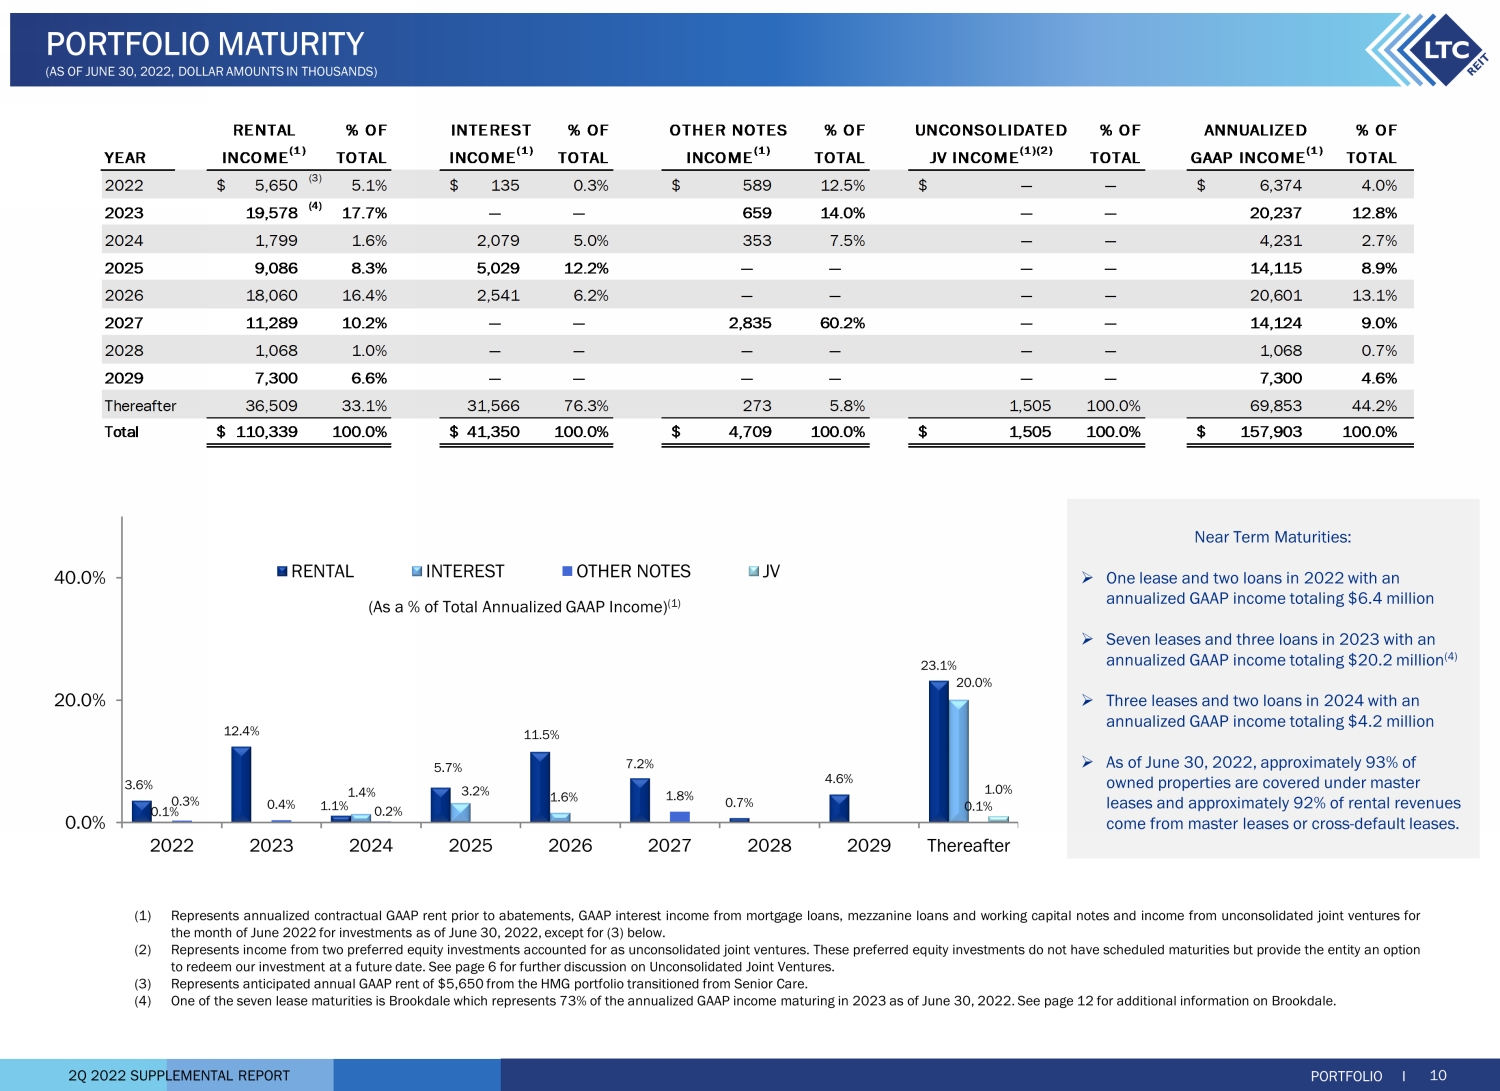
2Q 2022 SUPPLEMENTAL REPORT 3.6% 12.4% 1.1% 5.7% 11.5% 7.2% 0.7% 4.6% 23.1% 0.1% 1.4% 3.2% 1.6% 20.0% 0.3% 0.4% 0.2% 1.8% 0.1% 1.0% 0.0% 20.0% 40.0% 2022 2023 2024 2025 2026 2027 2028 2029 Thereafter RENTAL INTEREST OTHER NOTES JV (As a % of Total Annualized GAAP Income) (1) Near Term Maturities: » One lease and two loans in 2022 with an annualized GAAP income totaling $6.4 million » Seven leases and three loans in 2023 with an annualized GAAP income totaling $20.2 million (4) » Three leases and two loans in 2024 with an annualized GAAP income totaling $4.2 million » As of June 30, 2022, approximately 93% of owned properties are covered under master leases and approximately 92% of rental revenues come from master leases or cross - default leases. (1) Represents annualized contractual GAAP rent prior to abatements, GAAP interest income from mortgage loans, mezzanine loans and working capital notes and income from unconsolidated joint ventures for the month of June 2022 for investments as of June 30 , 2022 , except for ( 3 ) below . (2) Represents income from two preferred equity investments accounted for as unconsolidated joint ventures . These preferred equity investments do not have scheduled maturities but provide the entity an option to redeem our investment at a future date . See page 6 for further discussion on Unconsolidated J oint Ventures . (3) Represents anticipated annual GAAP rent of $ 5 , 650 from the HMG portfolio transitioned from Senior Care . (4) One of the seven lease maturities is Brookdale which represents 73 % of the annualized GAAP income maturing in 2023 as of June 30 , 2022 . See page 12 for additional information on Brookdale . PORTFOLIO MATURITY (AS OF JUNE 30, 2022, DOLLAR AMOUNTS IN THOUSANDS) % OF % OF % OF % OF % OF YEAR TOTAL TOTAL TOTAL TOTAL TOTAL 2022 5,650$ (3) 5.1% 135$ 0.3% 589$ 12.5% —$ — 6,374$ 4.0% 2023 19,578 (4) 17.7% — — 659 14.0% — — 20,237 12.8% 2024 1,799 1.6% 2,079 5.0% 353 7.5% — — 4,231 2.7% 2025 9,086 8.3% 5,029 12.2% — — — — 14,115 8.9% 2026 18,060 16.4% 2,541 6.2% — — — — 20,601 13.1% 2027 11,289 10.2% — — 2,835 60.2% — — 14,124 9.0% 2028 1,068 1.0% — — — — — — 1,068 0.7% 2029 7,300 6.6% — — — — — — 7,300 4.6% Thereafter 36,509 33.1% 31,566 76.3% 273 5.8% 1,505 100.0% 69,853 44.2% Total 110,339$ 100.0% 41,350$ 100.0% 4,709$ 100.0% 1,505$ 100.0% 157,903$ 100.0% INCOME (1) INCOME (1) INCOME (1) JV INCOME (1)(2) GAAP INCOME (1) RENTAL INTEREST OTHER NOTES UNCONSOLIDATED ANNUALIZED PORTFOLIO I 10
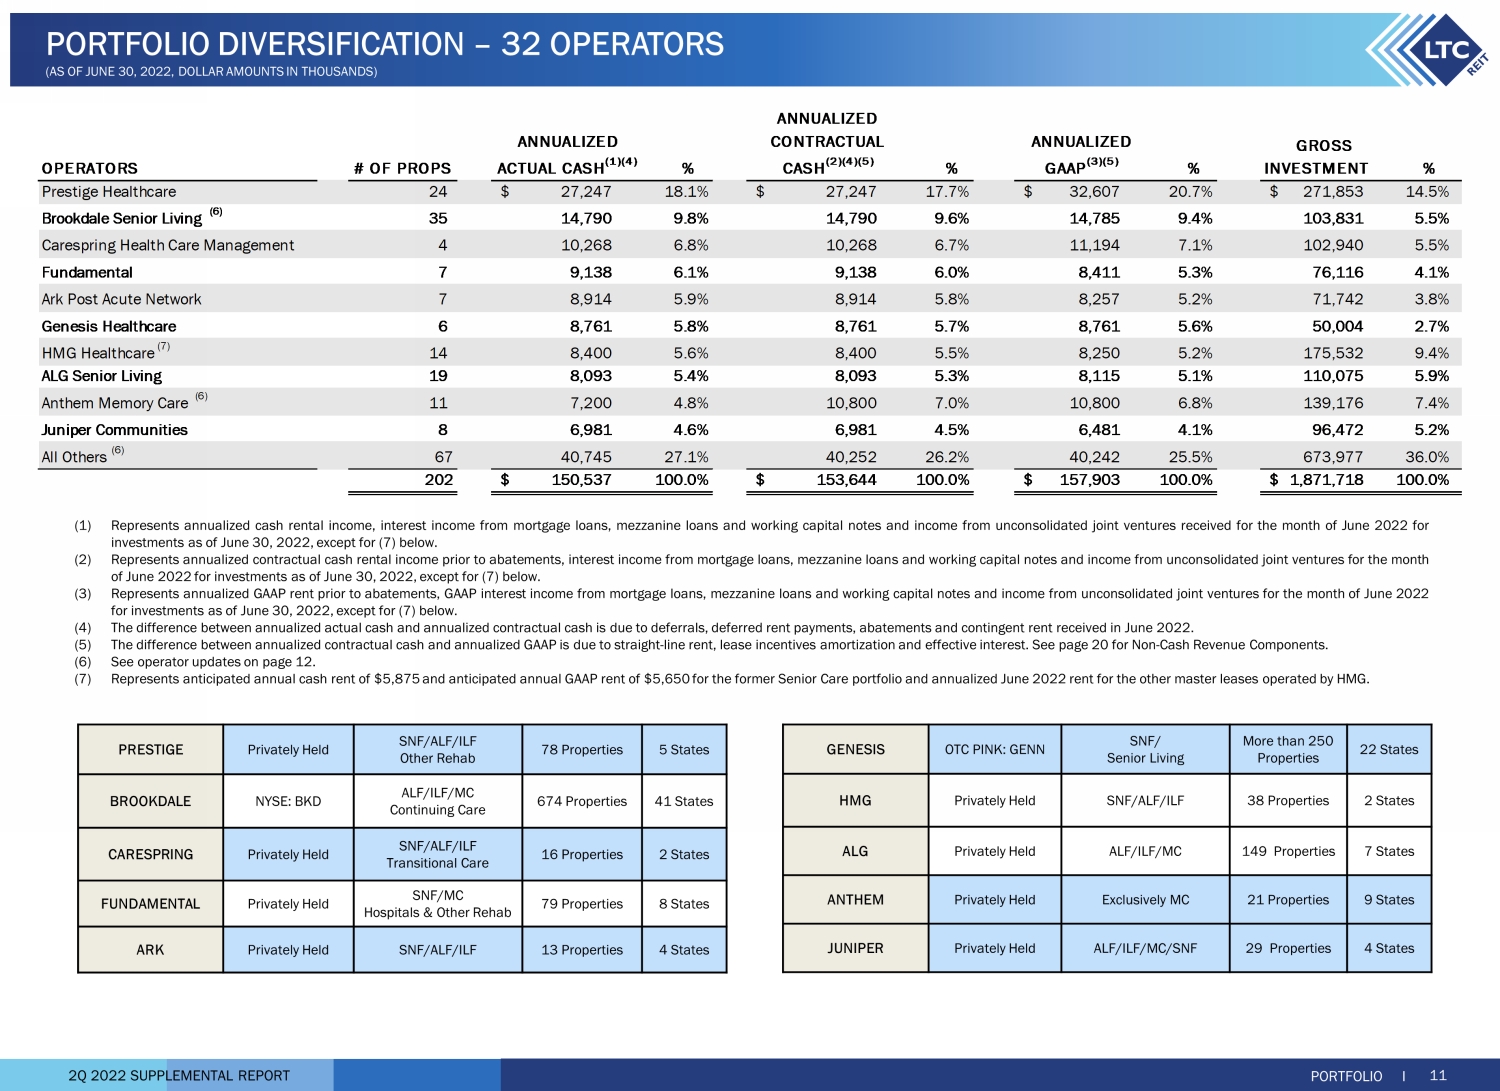
2Q 2022 SUPPLEMENTAL REPORT PORTFOLIO I 11 PORTFOLIO DIVERSIFICATION – 32 OPERATORS (AS OF JUNE 30, 2022, DOLLAR AMOUNTS IN THOUSANDS) GENESIS OTC PINK: GENN SNF/ Senior Living More than 250 Properties 22 States HMG Privately Held SNF/ALF/ILF 38 Properties 2 States ALG Privately Held ALF/ILF/MC 149 Properties 7 States ANTHEM Privately Held Exclusively MC 21 Properties 9 States JUNIPER Privately Held ALF/ILF/MC/SNF 29 Properties 4 States PRESTIGE Privately Held SNF/ALF/ILF Other Rehab 78 Properties 5 States BROOKDALE NYSE: BKD ALF/ILF/MC Continuing Care 674 Properties 41 States CARESPRING Privately Held SNF/ALF/ILF Transitional Care 16 Properties 2 States FUNDAMENTAL Privately Held SNF/MC Hospitals & Other Rehab 79 Properties 8 States ARK Privately Held SNF/ALF/ILF 13 Properties 4 States OPERATORS # OF PROPS % % % GROSS INVESTMENT % Prestige Healthcare 24 27,247$ 18.1% 27,247$ 17.7% 32,607$ 20.7% 271,853$ 14.5% Brookdale Senior Living (6) 35 14,790 9.8% 14,790 9.6% 14,785 9.4% 103,831 5.5% Carespring Health Care Management 4 10,268 6.8% 10,268 6.7% 11,194 7.1% 102,940 5.5% Fundamental 7 9,138 6.1% 9,138 6.0% 8,411 5.3% 76,116 4.1% Ark Post Acute Network 7 8,914 5.9% 8,914 5.8% 8,257 5.2% 71,742 3.8% Genesis Healthcare 6 8,761 5.8% 8,761 5.7% 8,761 5.6% 50,004 2.7% HMG Healthcare (7) 14 8,400 5.6% 8,400 5.5% 8,250 5.2% 175,532 9.4% ALG Senior Living 19 8,093 5.4% 8,093 5.3% 8,115 5.1% 110,075 5.9% Anthem Memory Care (6) 11 7,200 4.8% 10,800 7.0% 10,800 6.8% 139,176 7.4% Juniper Communities 8 6,981 4.6% 6,981 4.5% 6,481 4.1% 96,472 5.2% All Others (6) 67 40,745 27.1% 40,252 26.2% 40,242 25.5% 673,977 36.0% 202 150,537$ 100.0% 153,644$ 100.0% 157,903$ 100.0% 1,871,718$ 100.0% ANNUALIZED GAAP (3)(5) ANNUALIZED ACTUAL CASH (1)(4) ANNUALIZED CONTRACTUAL CASH (2)(4)(5) (1) Represents annualized cash rental income, interest income from mortgage loans, mezzanine loans and working capital notes and income from unconsolidated joint ventures received for the month of June 2022 for investments as of June 30 , 2022 , except for ( 7 ) below . (2) Represents annualized contractual cash rental income prior to abatements, interest income from mortgage loans, mezzanine loans and working capital notes and income from unconsolidated joint ventures for the month of June 2022 for investments as of June 30 , 2022 , except for ( 7 ) below . (3) Represents annualized GAAP rent prior to abatements, GAAP interest income from mortgage loans, mezzanine loans and working capital notes and income from unconsolidated joint ventures for the month of June 2022 for investments as of June 30 , 2022 , except for ( 7 ) below . (4) The difference between annualized actual cash and annualized contractual cash is due to deferrals, deferred rent payments, abatements and contingent rent received in June 2022 . (5) The difference between annualized contractual cash and annualized GAAP is due to straight - line rent, lease incentives amortization and effective interest . See page 20 for Non - Cash Revenue Components . (6) See operator updates on page 12 . (7) Represents anticipated annual cash rent of $ 5 , 875 and anticipated annual GAAP rent of $ 5 , 650 for the former Senior Care portfolio and annualized June 2022 rent for the other master leases operated by HMG .
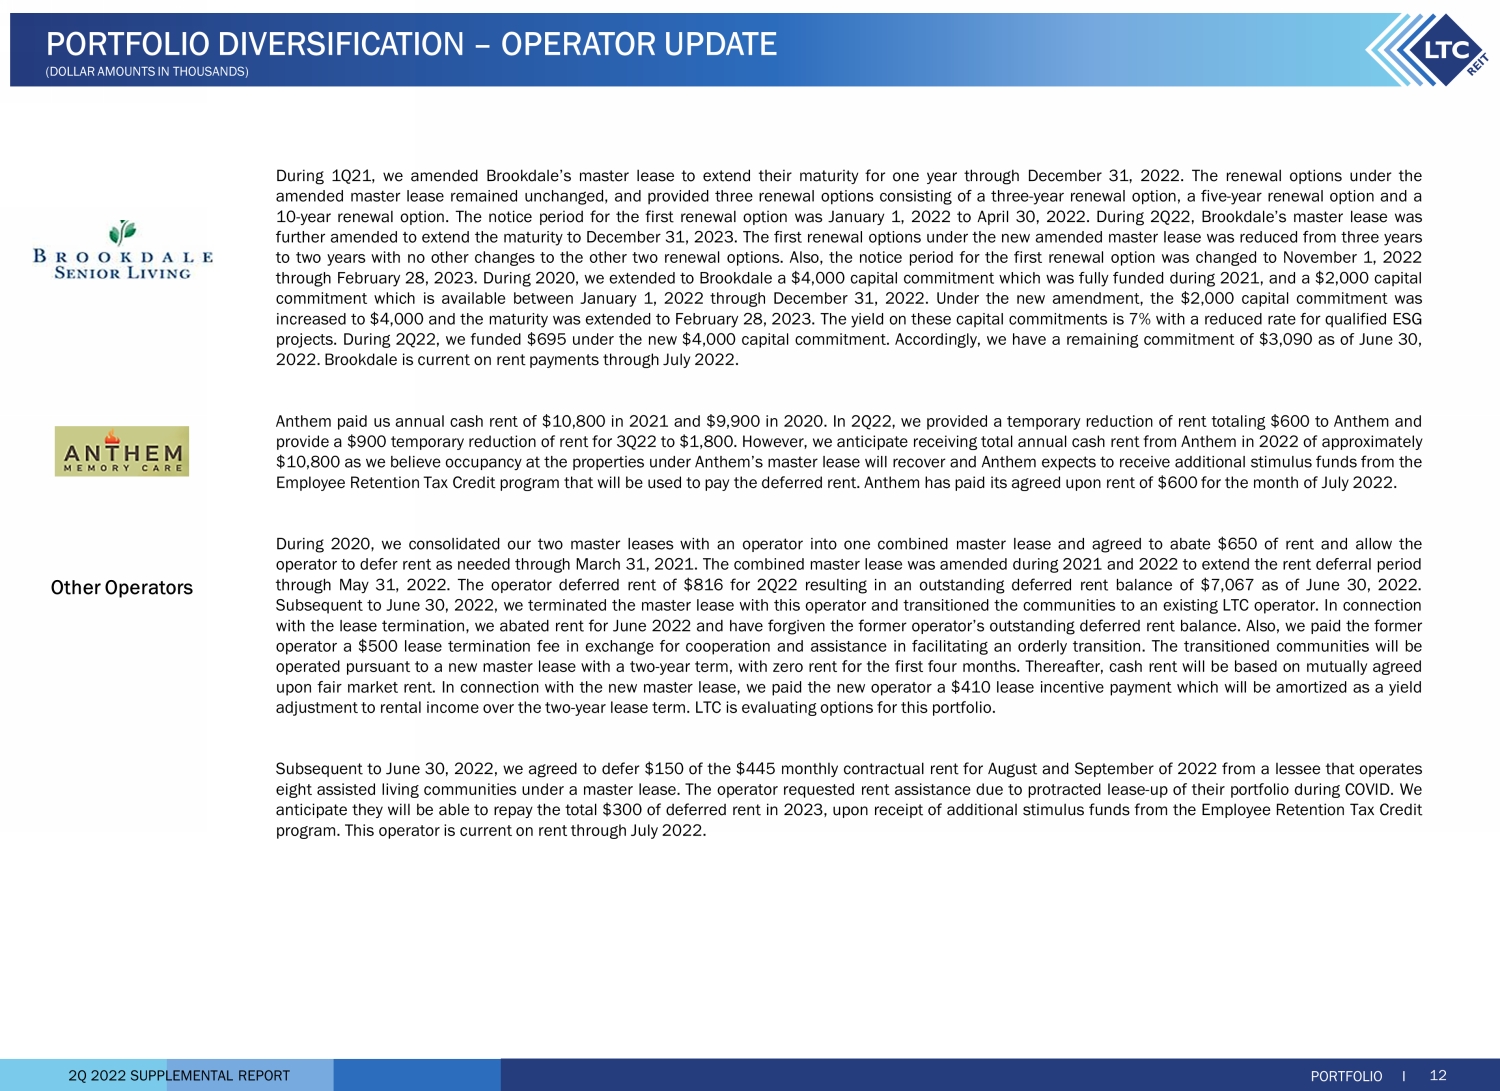
2Q 2022 SUPPLEMENTAL REPORT PORTFOLIO I 12 PORTFOLIO DIVERSIFICATION – OPERATOR UPDATE (DOLLAR AMOUNTS IN THOUSANDS) During 1 Q 21 , we amended Brookdale’s master lease to extend their maturity for one year through December 31 , 2022 . The renewal options under the amended master lease remained unchanged, and provided three renewal options consisting of a three - year renewal option, a five - year renewal option and a 10 - year renewal option . The notice period for the first renewal option was January 1 , 2022 to April 30 , 2022 . During 2 Q 22 , Brookdale’s master lease was further amended to extend the maturity to December 31 , 2023 . The first renewal options under the new amended master lease was reduced from three years to two years with no other changes to the other two renewal options . Also, the notice period for the first renewal option was changed to November 1 , 2022 through February 28 , 2023 . During 2020 , we extended to Brookdale a $ 4 , 000 capital commitment which was fully funded during 2021 , and a $ 2 , 000 capital commitment which is available between January 1 , 2022 through December 31 , 2022 . Under the new amendment, the $ 2 , 000 capital commitment was increased to $ 4 , 000 and the maturity was extended to February 28 , 2023 . The yield on these capital commitments is 7 % with a reduced rate for qualified ESG projects . During 2 Q 22 , we funded $ 695 under the new $ 4 , 000 capital commitment . Accordingly, we have a remaining commitment of $ 3 , 090 as of June 30 , 2022 . Brookdale is current on rent payments through July 2022 . Anthem paid us annual cash rent of $ 10 , 800 in 2021 and $ 9 , 900 in 2020 . In 2 Q 22 , we provided a temporary reduction of rent totaling $ 6 00 to Anthem and provide a $ 900 temporary reduction of rent for 3 Q 22 to $ 1 , 800 . However, we anticipate receiving total annual cash rent from Anthem in 2022 of approximately $ 10 , 800 as we believe occupancy at the properties under Anthem’s master lease will recover and Anthem expects to receive additional stimulus funds from the Employee Retention Tax Credit program that will be used to pay the deferred rent . Anthem has paid its agreed upon rent of $ 600 for the month of Jul y 2022 . During 2020 , we consolidated our two master leases with an operator into one combined master lease and agreed to abate $ 650 of rent and allow the operator to defer rent as needed through March 31 , 2021 . The combined master lease was amended during 2021 and 2022 to extend the rent deferral period through May 31 , 2022 . The operator deferred rent of $ 816 for 2 Q 22 resulting in an outstanding deferred rent balance of $ 7 , 067 as of June 30 , 2022 . Subsequent to June 30 , 2022 , we terminated the master lease with this operator and transitioned the communities to an existing LTC operator . In connection with the lease termination, we abated rent for June 2022 and have forgiven the former operator’s outstanding deferred rent balance . Also, we paid the former operator a $ 500 lease termination fee in exchange for cooperation and assistance in facilitating an orderly transition . The transitioned communities will be operated pursuant to a new master lease with a two - year term, with zero rent for the first four months . Thereafter, cash rent will be based on mutually agreed upon fair market rent . In connection with the new master lease, we paid the new operator a $ 410 lease incentive payment which will be amortized as a yield adjustment to rental income over the two - year lease term . LTC is evaluating options for this portfolio . Subsequent to June 30 , 2022 , we agreed to defer $ 150 of the $ 445 monthly contractual rent for August and September of 2022 from a lessee that operates eight assisted living communities under a master lease . The operator requested rent assistance due to protracted lease - up of their portfolio during COVID . We anticipate they will be able to repay the total $ 300 of deferred rent in 2023 , upon receipt of additional stimulus funds from the Employee Retention Tax Credit program . This operator is current on rent through July 2022 . Other Operators
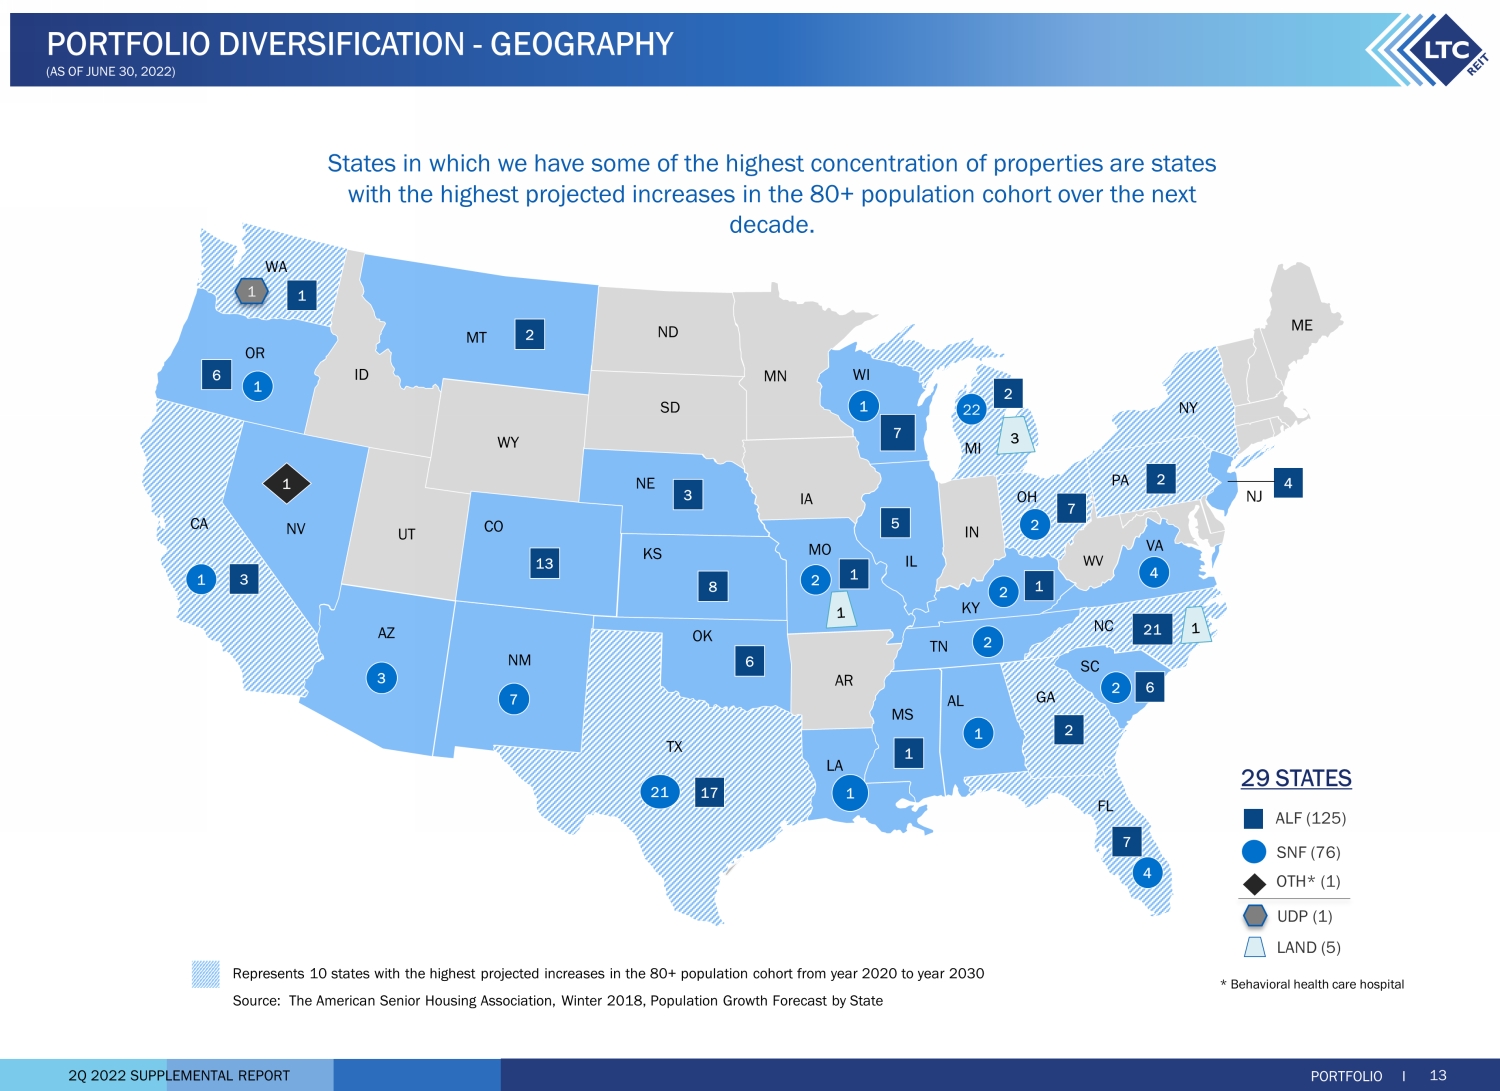
2Q 2022 SUPPLEMENTAL REPORT States in which we have some of the highest concentration of properties are states with the highest projected increases in the 80+ population cohort over the next decade. Represents 10 states with the highest projected increases in the 80+ population cohort from year 2020 to year 2030 Source: The American Senior Housing Association, Winter 2018, Population Growth Forecast by State PORTFOLIO I 13 PORTFOLIO DIVERSIFICATION - GEOGRAPHY (AS OF JUNE 30, 2022) 1 29 STATES * Behavioral health care hospital SNF (76) ALF (125) OTH* (1) LAND (5) UDP (1) CA WA ME NV WY IL AR WV ND NY OR AZ NM TX UT ID MT SD NE KS OK MS MN WI FL AL GA SC TN MO IA IN OH PA NJ NC VA CO KY 4 21 1 1 3 1 2 4 2 1 3 6 17 21 2 7 7 3 8 4 13 7 6 1 22 2 5 7 1 1 2 1 2 6 2 2 MI 1 1 1 LA 2
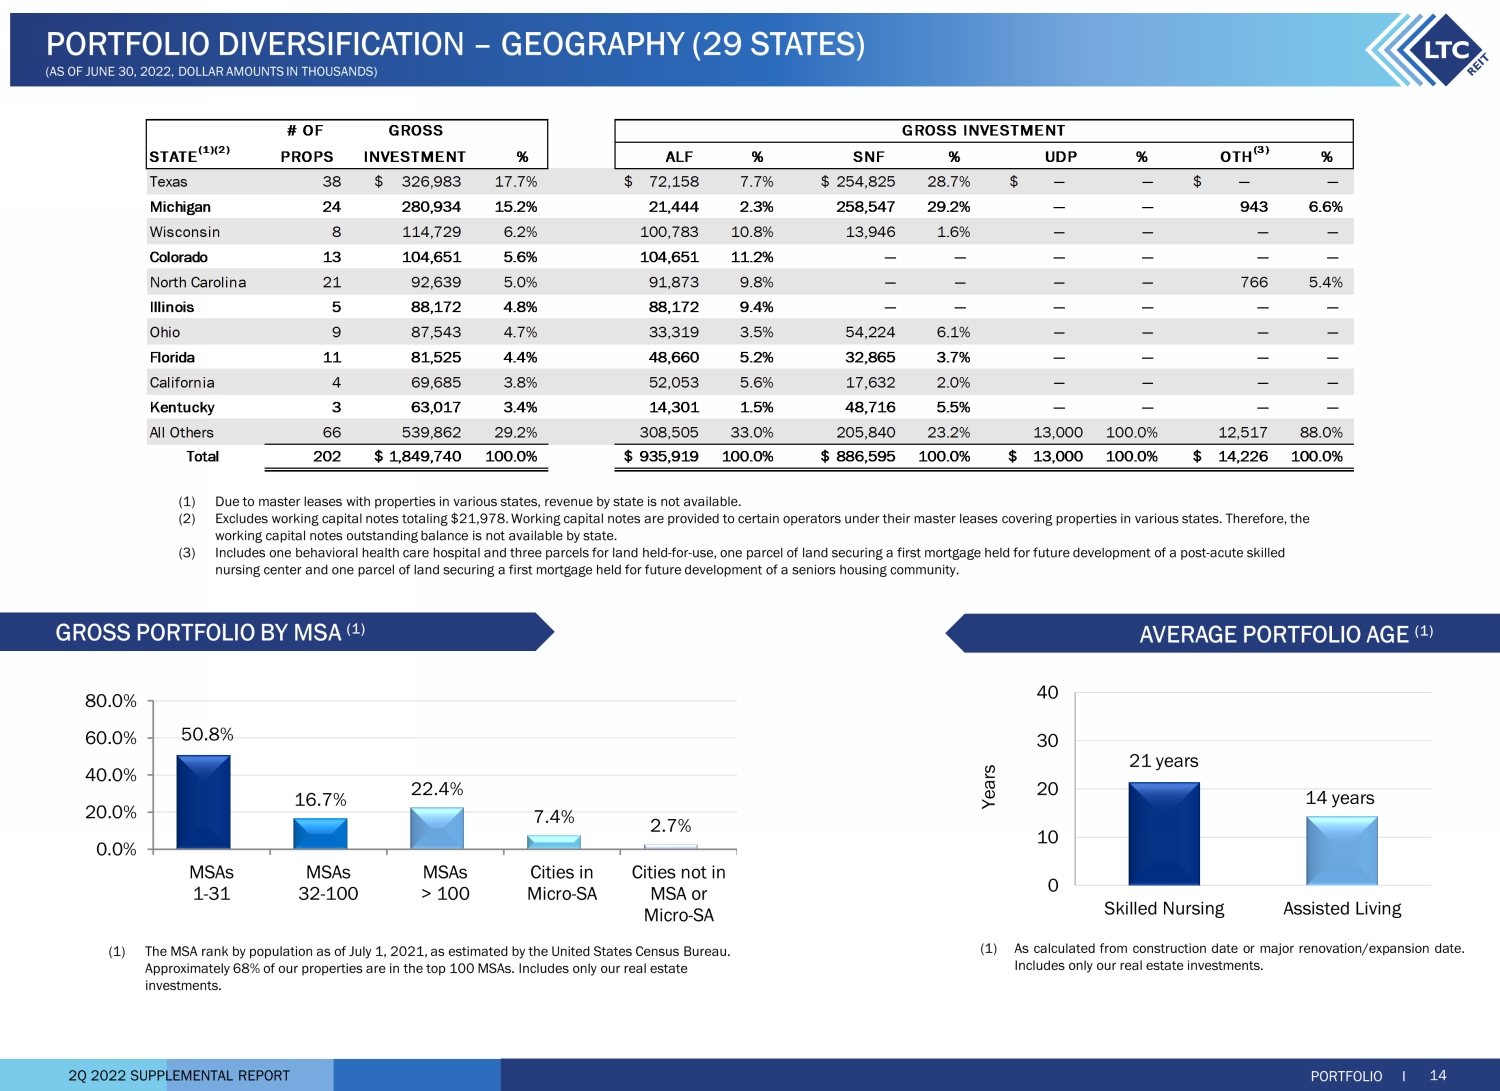
2Q 2022 SUPPLEMENTAL REPORT 50.8% 16.7% 22.4% 7.4% 2.7% 0.0% 20.0% 40.0% 60.0% 80.0% MSAs 1-31 MSAs 32-100 MSAs > 100 Cities in Micro-SA Cities not in MSA or Micro-SA 21 years 14 years 0 10 20 30 40 Skilled Nursing Assisted Living Years (1) The MSA rank by population as of July 1, 2021, as estimated by the United States Census Bureau. Approximately 68% of our properties are in the top 100 MSAs. Includes only our real estate investments. (1) Due to master leases with properties in various states, revenue by state is not available. (2) Excludes working capital notes totaling $21,978. Working capital notes are provided to certain operators under their master l eas es covering properties in various states. Therefore, the working capital notes outstanding balance is not available by state. (3) Includes one behavioral health care hospital and three parcels for land held - for - use, one parcel of land securing a first mortga ge held for future development of a post - acute skilled nursing center and one parcel of land securing a first mortgage held for future development of a seniors housing community. (1) As calculated from construction date or major renovation/expansion date . Includes only our real estate investments . GROSS PORTFOLIO BY MSA (1) AVERAGE PORTFOLIO AGE (1) PORTFOLIO I 14 PORTFOLIO DIVERSIFICATION – GEOGRAPHY (29 STATES) (AS OF JUNE 30, 2022, DOLLAR AMOUNTS IN THOUSANDS) # OF STATE (1)(2) PROPS % ALF % SNF % UDP % % Texas 38 326,983$ 17.7% 72,158$ 7.7% 254,825$ 28.7% —$ — —$ — Michigan 24 280,934 15.2% 21,444 2.3% 258,547 29.2% — — 943 6.6% Wisconsin 8 114,729 6.2% 100,783 10.8% 13,946 1.6% — — — — Colorado 13 104,651 5.6% 104,651 11.2% — — — — — — North Carolina 21 92,639 5.0% 91,873 9.8% — — — — 766 5.4% Illinois 5 88,172 4.8% 88,172 9.4% — — — — — — Ohio 9 87,543 4.7% 33,319 3.5% 54,224 6.1% — — — — Florida 11 81,525 4.4% 48,660 5.2% 32,865 3.7% — — — — California 4 69,685 3.8% 52,053 5.6% 17,632 2.0% — — — — Kentucky 3 63,017 3.4% 14,301 1.5% 48,716 5.5% — — — — All Others 66 539,862 29.2% 308,505 33.0% 205,840 23.2% 13,000 100.0% 12,517 88.0% Total 202 1,849,740$ 100.0% 935,919$ 100.0% 886,595$ 100.0% 13,000$ 100.0% 14,226$ 100.0% OTH (3) INVESTMENT GROSS INVESTMENTGROSS
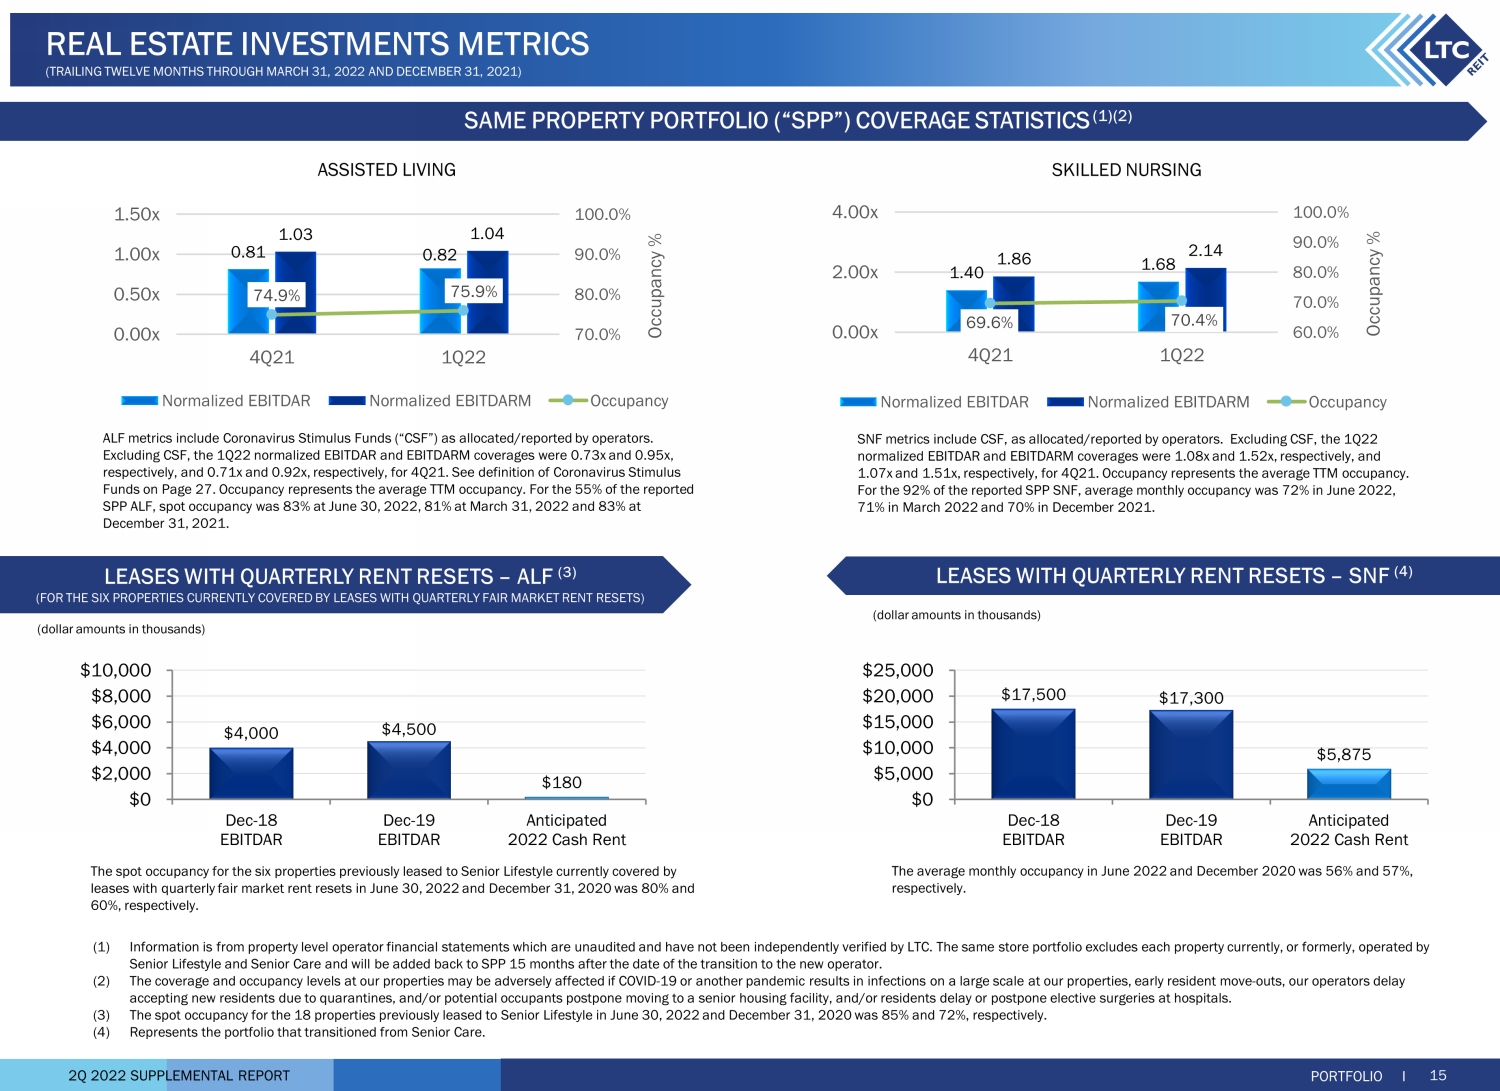
2Q 2022 SUPPLEMENTAL REPORT $17,500 $17,300 $5,875 $0 $5,000 $10,000 $15,000 $20,000 $25,000 Dec-18 EBITDAR Dec-19 EBITDAR Anticipated 2022 Cash Rent (1) Information is from property level operator financial statements which are unaudited and have not been independently verified by LTC. The same store portfolio excludes each property currently, or formerly, operated by Senior Lifestyle and Senior Care and will be added back to SPP 15 months after the date of the transition to the new operator . (2) The coverage and occupancy levels at our properties may be adversely affected if COVID - 19 or another pandemic results in infecti ons on a large scale at our properties, early resident move - outs, our operators delay accepting new residents due to quarantines, and/or potential occupants postpone moving to a senior housing facility, and/or r esi dents delay or postpone elective surgeries at hospitals. (3) The spot occupancy for the 18 properties previously leased to Senior Lifestyle in June 30, 2022 and December 31, 2020 was 85% an d 72%, respectively. (4) Represents the portfolio that transitioned from Senior Care. ASSISTED LIVING SKILLED NURSING 1.40 1.68 1.86 2.14 69.6% 70.4% 60.0% 70.0% 80.0% 90.0% 100.0% 0.00x 2.00x 4.00x 4Q21 1Q22 Occupancy % Normalized EBITDAR Normalized EBITDARM Occupancy 0.81 0.82 1.03 1.04 74.9% 75.9% 70.0% 80.0% 90.0% 100.0% 0.00x 0.50x 1.00x 1.50x 4Q21 1Q22 Occupancy % Normalized EBITDAR Normalized EBITDARM Occupancy SNF metrics include CSF, as allocated/reported by operators. Excluding CSF, the 1Q22 normalized EBITDAR and EBITDARM coverages were 1.08x and 1.52x, respectively, and 1.07x and 1.51x, respectively, for 4Q21. Occupancy represents the average TTM occupancy. For the 92% of the reported SPP SNF, average monthly occupancy was 72% in June 2022, 71% in March 2022 and 70% in December 2021. ALF metrics include Coronavirus Stimulus Funds (“CSF”) as allocated/reported by operators. Excluding CSF, the 1Q22 normalized EBITDAR and EBITDARM coverages were 0.73x and 0.95x, respectively, and 0.71x and 0.92x, respectively, for 4Q21. See definition of Coronavirus Stimulus Funds on Page 27. Occupancy represents the average TTM occupancy. For the 55% of the reported SPP ALF, spot occupancy was 83% at June 30, 2022, 81% at March 31, 2022 and 83% at December 31, 2021. PORTFOLIO I 15 REAL ESTATE INVESTMENTS METRICS (TRAILING TWELVE MONTHS THROUGH MARCH 31, 2022 AND DECEMBER 31, 2021) SAME PROPERTY PORTFOLIO (“SPP”) COVERAGE STATISTICS (1)(2) The spot occupancy for the six properties previously leased to Senior Lifestyle currently covered by leases with quarterly fair market rent resets in June 30, 2022 and December 31, 2020 was 80% and 60%, respectively. $4,000 $4,500 $180 $0 $2,000 $4,000 $6,000 $8,000 $10,000 Dec-18 EBITDAR Dec-19 EBITDAR Anticipated 2022 Cash Rent LEASES WITH QUARTERLY RENT RESETS – ALF (3) (FOR THE SIX PROPERTIES CURRENTLY COVERED BY LEASES WITH QUARTER LY FAIR MARKET RENT RESETS) LEASES WITH QUARTERLY RENT RESETS – SNF (4) (dollar amounts in thousands) (dollar amounts in thousands) The average monthly occupancy in June 2022 and December 2020 was 56% and 57%, respectively.

2Q 2022 SUPPLEMENTAL REPORT PORTFOLIO I 16 PORTFOLIO UPDATE (AMOUNTS IN THOUSANDS) ABATED RENT ▪ $1,172 abated rent during 2Q22 ▪ $452 of the $1,172 abated rent was provided to an operator in connection with a lease termination subsequent to June 30, 2022. See page 12 for further discussion. ▪ Deferred rent of $816, excluding the Anthem rent reduction, and received $114 of deferred repayments during 2Q22. ▪ As of June 30, 2022, outstanding non - accrued deferred rent of $7,669 related to assisted living communities. $7,067 of the outstanding balance relates to an operator of 12 assisted living communities that, subsequent to June 30, 2022, were transitioned to another operator. In connection with the termination of the master lease, the deferred rent balance was forgiven. See page 12 for further discussion. ▪ Our rent deferral agreements generally require the deferred rent to be paid within 12 to 36 months. ▪ Reduced agreed upon rent from Anthem by $600 during 2Q22. See page 12 for further discussion. ▪ LTC evaluated deferral requests with close attention to ongoing operations, rent coverage, corporate financial health and liquidity of the operator. DEFERRED RENT CONTRACTUAL 2Q22 RENT AND MORTGAGE INTEREST ▪ Provided $240 of abated rent in July 2022 and agreed to provide rent abatements up to $240 for each of August and September 2022 to an operator pursuant to a master lease covering two assisted living communities. We are evaluating options for these communities. ▪ Agreed to reduce expected rent from Anthem by $300 for each of July, August and September 2022. See page 12 for further discussion. ▪ Agreed to defer $150 of the $445 monthly contractual rent for August and September 2022 from a lessee that operates eight assisted living communities under a master lease. See page 12 for further discussion. SUBSEQUENT TO JUNE 30, 2022 COLLECTED 94.9% ($35,035) ABATED 3.2% ($1,172) NET DEFERRED 1.9% ($702)
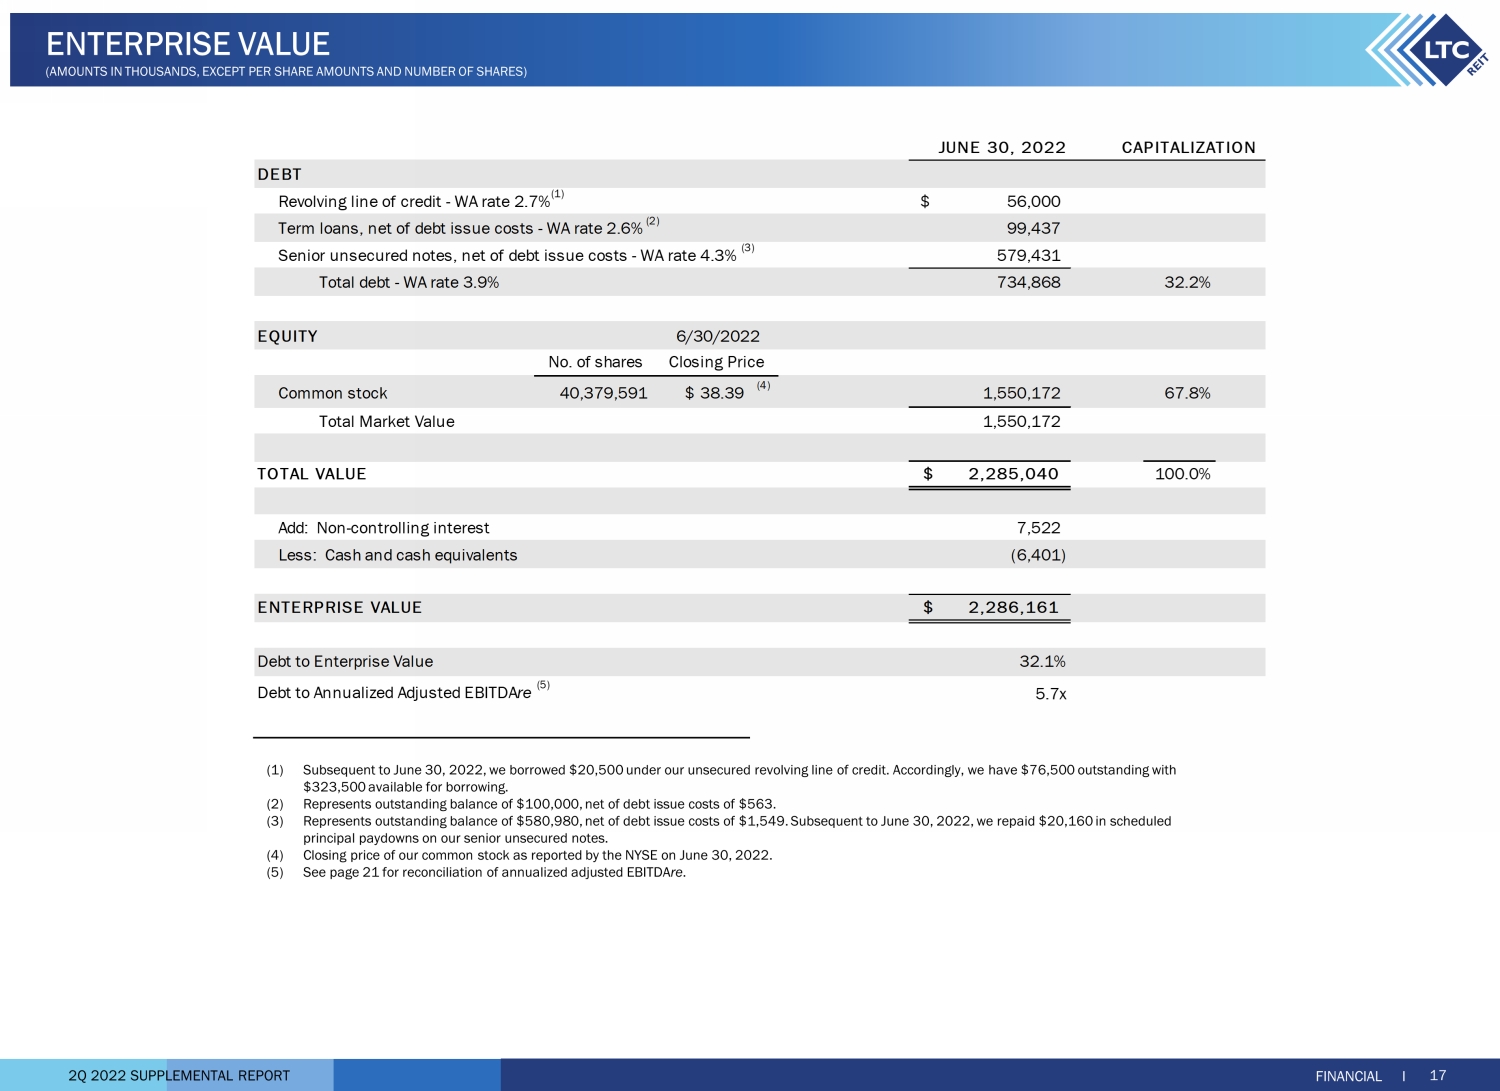
2Q 2022 SUPPLEMENTAL REPORT JUNE 30, 2022 Revolving line of credit - WA rate 2.7% (1) 56,000$ Term loans, net of debt issue costs - WA rate 2.6% (2) 99,437 Senior unsecured notes, net of debt issue costs - WA rate 4.3% (3) 579,431 Total debt - WA rate 3.9% 734,868 32.2% No. of shares Common stock 40,379,591 38.39$ (4) 1,550,172 67.8% Total Market Value 1,550,172 2,285,040$ 100.0% Add: Non-controlling interest 7,522 Less: Cash and cash equivalents (6,401) 2,286,161$ Debt to Enterprise Value 32.1% Debt to Annualized Adjusted EBITDAre (5) 5.7x ENTERPRISE VALUE TOTAL VALUE CAPITALIZATION DEBT EQUITY 6/30/2022 Closing Price (1) Subsequent to June 30, 2022, we borrowed $20,500 under our unsecured revolving line of credit. Accordingly, we have $76,500 o uts tanding with $323,500 available for borrowing. (2) Represents outstanding balance of $100,000, net of debt issue costs of $563. (3) Represents outstanding balance of $580,980, net of debt issue costs of $1,549. Subsequent to June 30, 2022, we repaid $20,160 in scheduled principal paydowns on our senior unsecured notes. (4) Closing price of our common stock as reported by the NYSE on June 30, 2022. (5) See page 21 for reconciliation of annualized adjusted EBITDA re . FINANCIAL I 17 ENTERPRISE VALUE (AMOUNTS IN THOUSANDS, EXCEPT PER SHARE AMOUNTS AND NUMBER OF SH ARES)

2Q 2022 SUPPLEMENTAL REPORT LEVERAGE RATIOS COVERAGE RATIOS LINE OF CREDIT LIQUIDITY FINANCIAL I 18 DEBT METRICS (DOLLAR AMOUNTS IN THOUSANDS) $56,000 $110,900 $89,900 $93,900 $344,000 $289,100 $510,100 $506,100 $- $100,000 $200,000 $300,000 $400,000 $500,000 $600,000 2Q22 2021 2020 2019 Balance Available 5.7x 4.3x 6.0x 4.4x 4.4x 4.9x 4.6x 4.8x 0.0x 2.0x 4.0x 6.0x 8.0x Debt to Adjusted EBITDAre Adjusted EBITDAre/ Fixed Charges 2Q22 2021 2020 2019 37.6% 32.1% 38.4% 34.9% 35.8% 29.8% 37.2% 28.0% 0.0% 10.0% 20.0% 30.0% 40.0% 50.0% Debt to Gross Asset Value Debt to Total Enterprise Value 2Q22 2021 2020 2019

2Q 2022 SUPPLEMENTAL REPORT Senior Unsecured Notes 78.8% Term Loans 13.6% Revolving Line of Credit 7.6% $56,000 $50,000 $50,000 $41,160 $49,160 $49,160 $49,500 $51,500 $54,500 $55,000 $63,000 $168,000 $- $100,000 $200,000 $300,000 $400,000 2022 2023 2024 2025 2026 2027 2028 2029 Thereafter Revolving Line of Credit Term Loans Senior Unsecured Notes (1) Subsequent to June 30, 2022, we borrowed $20,500 under our unsecured revolving line of credit. Accordingly, we have $76,500 o uts tanding with $323,500 available for borrowing. (2) Reflects scheduled principal payments. Subsequent to June 30, 2022, we repaid $20,160 in scheduled principal paydowns on our sen ior unsecured notes. (3) Excludes debt issue costs which are netted against the principal outstanding in the term loans and senior unsecured notes bal anc e on our Consolidated Balance Sheets shown on page 23. DEBT STRUCTURE (3) FINANCIAL I 19 DEBT MATURITY (AS OF JUNE 30, 2022, DOLLAR AMOUNTS IN THOUSANDS) REVOLVING SENIOR LINE OF TERM UNSECURED % OF YEAR CREDIT (1) LOANS (2) NOTES (2) TOTAL TOTAL 2022 —$ —$ 41,160$ 41,160$ 5.6% 2023 — — 49,160 49,160 6.7% 2024 — — 49,160 49,160 6.7% 2025 56,000 50,000 49,500 155,500 21.1% 2026 — 50,000 51,500 101,500 13.8% 2027 — — 54,500 54,500 7.4% 2028 — — 55,000 55,000 7.4% 2029 — — 63,000 63,000 8.5% Thereafter — — 168,000 168,000 22.8% Total 56,000$ 100,000$ (3) 580,980$ (3) 736,980$ (3) 100.0%
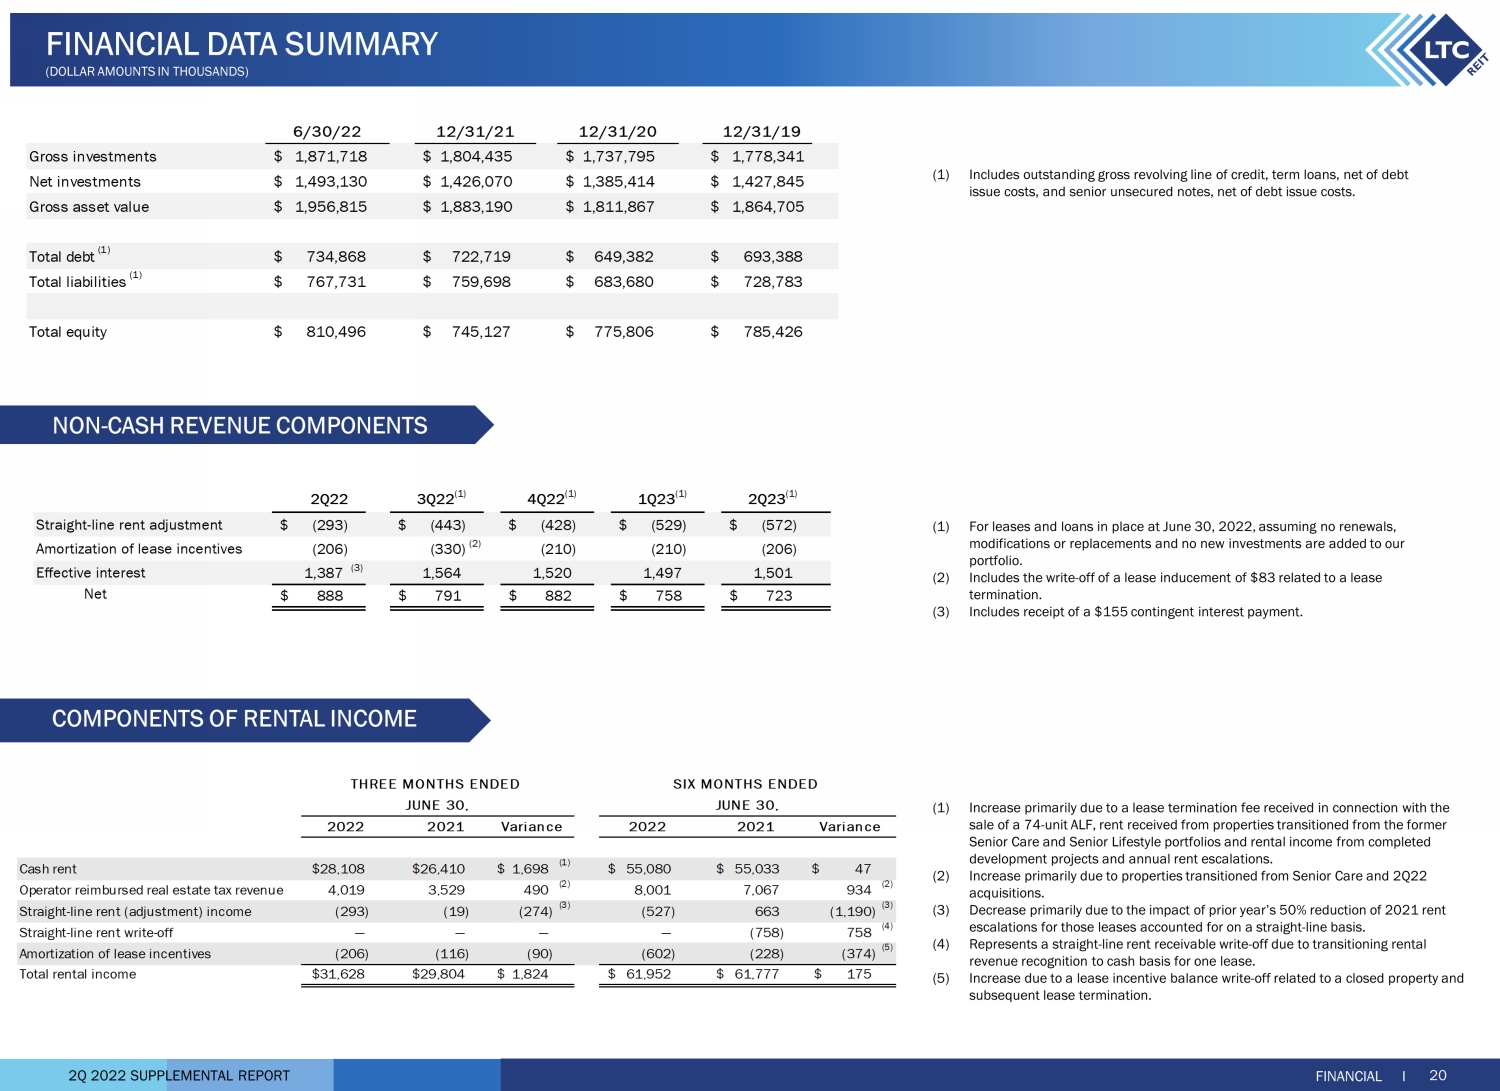
2Q 2022 SUPPLEMENTAL REPORT (1) Includes outstanding gross revolving line of credit, term loans, net of debt issue costs, and senior unsecured notes, net of debt issue costs. (1) For leases and loans in place at June 30, 2022, assuming no renewals, modifications or replacements and no new investments are added to our portfolio. (2) Includes the write - off of a lease inducement of $83 related to a lease termination. (3) Includes receipt of a $155 contingent interest payment. (1) Increase primarily due to a lease termination fee received in connection with the sale of a 74 - unit ALF, rent received from properties transitioned from the former Senior Care and Senior Lifestyle portfolios and rental income from completed development projects and annual rent escalations. (2) Increase primarily due to properties transitioned from Senior Care and 2Q22 acquisitions. (3) Decrease primarily due to the impact of prior year’s 50% reduction of 2021 rent escalations for those leases accounted for on a straight - line basis. (4) Represents a straight - line rent receivable write - off due to transitioning rental revenue recognition to cash basis for one lease. (5) Increase due to a lease incentive balance write - off related to a closed property and subsequent lease termination. NON - CASH REVENUE COMPONENTS COMPONENTS OF RENTAL INCOME FINANCIAL I 20 FINANCIAL DATA SUMMARY (DOLLAR AMOUNTS IN THOUSANDS) 12/31/19 Gross investments $ 1,871,718 $ 1,804,435 $ 1,737,795 $ 1,778,341 Net investments $ 1,493,130 $ 1,426,070 $ 1,385,414 $ 1,427,845 Gross asset value $ 1,956,815 $ 1,883,190 $ 1,811,867 $ 1,864,705 Total debt (1) $ 734,868 $ 722,719 $ 649,382 $ 693,388 Total liabilities (1) $ 767,731 $ 759,698 $ 683,680 $ 728,783 Total equity $ 810,496 $ 745,127 $ 775,806 $ 785,426 12/31/2012/31/216/30/22 Cash rent 28,108$ 26,410$ 1,698$ (1) 55,080$ 55,033$ 47$ Operator reimbursed real estate tax revenue 4,019 3,529 490 (2) 8,001 7,067 934 (2) Straight-line rent (adjustment) income (293) (19) (274) (3) (527) 663 (1,190) (3) Straight-line rent write-off — — — — (758) 758 (4) Amortization of lease incentives (206) (116) (90) (602) (228) (374) (5) Total rental income 31,628$ 29,804$ 1,824$ 61,952$ 61,777$ 175$ Variance THREE MONTHS ENDED SIX MONTHS ENDED JUNE 30,JUNE 30, 2022 2021 2022 2021Variance 2Q22 3Q22 (1) 4Q22 (1) 1Q23 (1) 2Q23 (1) (293)$ (443)$ (428)$ (529)$ (572)$ (206) (330) (2) (210) (210) (206) 1,387 (3) 1,564 1,520 1,497 1,501 888$ 791$ 882$ 758$ 723$ Straight-line rent adjustment Amortization of lease incentives Effective interest Net
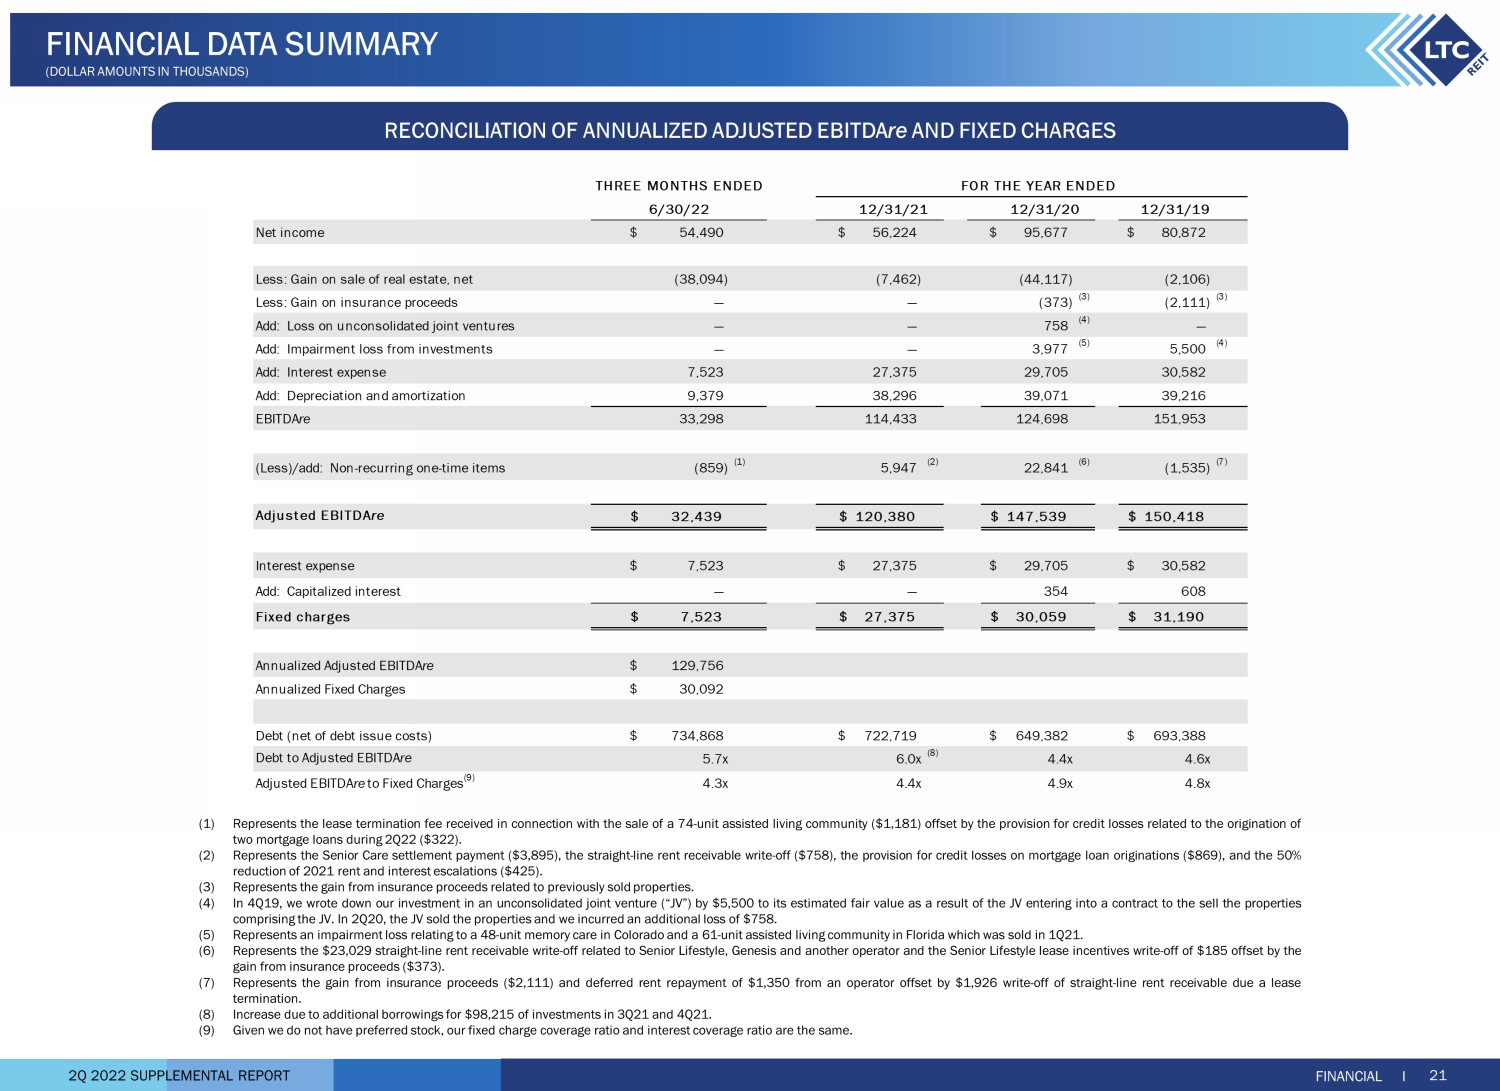
2Q 2022 SUPPLEMENTAL REPORT RECONCILIATION OF ANNUALIZED ADJUSTED EBITDA re AND FIXED CHARGES FINANCIAL I 21 FINANCIAL DATA SUMMARY (DOLLAR AMOUNTS IN THOUSANDS) Net income 54,490$ 56,224$ 95,677$ 80,872$ Less: Gain on sale of real estate, net (38,094) (7,462) (44,117) (2,106) Less: Gain on insurance proceeds — — (373) (3) (2,111) (3) Add: Loss on unconsolidated joint ventures — — 758 (4) — Add: Impairment loss from investments — — 3,977 (5) 5,500 (4) Add: Interest expense 7,523 27,375 29,705 30,582 Add: Depreciation and amortization 9,379 38,296 39,071 39,216 EBITDAre 33,298 114,433 124,698 151,953 (Less)/add: Non-recurring one-time items (859) (1) 5,947 (2) 22,841 (6) (1,535) (7) Adjusted EBITDAre 32,439$ 120,380$ 147,539$ 150,418$ Interest expense 7,523$ 27,375$ 29,705$ 30,582$ Add: Capitalized interest — — 354 608 Fixed charges 7,523$ 27,375$ 30,059$ 31,190$ Annualized Adjusted EBITDAre 129,756$ Annualized Fixed Charges 30,092$ Debt (net of debt issue costs) 734,868$ 722,719$ 649,382$ 693,388$ Debt to Adjusted EBITDAre 5.7x 6.0x (8) 4.4x 4.6x Adjusted EBITDAreto Fixed Charges (9) 4.3x 4.4x 4.9x 4.8x THREE MONTHS ENDED FOR THE YEAR ENDED 12/31/21 6/30/22 12/31/20 12/31/19 (1) Represents the lease termination fee received in connection with the sale of a 74 - unit assisted living community ( $ 1 , 181 ) offset by the provision for credit losses related to the origination of two mortgage loans during 2 Q 22 ( $ 322 ) . (2) Represents the Senior Care settlement payment ( $ 3 , 895 ), the straight - line rent receivable write - off ( $ 758 ), the provision for credit losses on mortgage loan originations ( $ 869 ), and the 50 % reduction of 2021 rent and interest escalations ( $ 425 ) . (3) Represents the gain from insurance proceeds related to previously sold properties . (4) In 4 Q 19 , we wrote down our investment in an unconsolidated joint venture (“JV”) by $ 5 , 500 to its estimated fair value as a result of the JV entering into a contract to the sell the properties comprising the JV . In 2 Q 20 , the JV sold the properties and we incurred an additional loss of $ 758 . (5) Represents an impairment loss relating to a 48 - unit memory care in Colorado and a 61 - unit assisted living community in Florida which was sold in 1 Q 21 . (6) Represents the $ 23 , 029 straight - line rent receivable write - off related to Senior Lifestyle, Genesis and another operator and the Senior Lifestyle lease incentives write - off of $ 185 offset by the gain from insurance proceeds ( $ 373 ) . (7) Represents the gain from insurance proceeds ( $ 2 , 111 ) and deferred rent repayment of $ 1 , 350 from an operator offset by $ 1 , 926 write - off of straight - line rent receivable due a lease termination . (8) Increase due to additional borrowings for $ 98 , 215 of investments in 3 Q 21 and 4 Q 21 . (9) Given we do not have preferred stock, our fixed charge coverage ratio and interest coverage ratio are the same .

2Q 2022 SUPPLEMENTAL REPORT FINANCIAL I 22 INCOME STATEMENT DATA (UNAUDITED, AMOUNTS IN THOUSANDS, EXCEPT PER SHARE AMOUNTS) 2022 2021 2022 2021 Revenues Rental income 31,628$ 29,804$ 61,952$ 61,777$ Interest income from mortgage loans 10,097 7,933 19,733 15,855 Interest and other income 1,299 392 2,126 777 Total revenues 43,024 38,129 83,811 78,409 Expenses Interest expense 7,523 6,860 14,666 13,832 Depreciation and amortization 9,379 9,508 18,817 19,385 Provision (recovery) for credit losses 305 — 659 (9) Transaction costs 67 133 99 225 Property tax expense 4,019 3,800 8,001 7,781 General and administrative expenses 5,711 5,337 11,519 10,370 Total expenses 27,004 25,638 53,761 51,584 Other Operating Income Gain on sale of real estate, net 38,094 5,463 38,196 4,690 Operating Income 54,114 17,954 68,246 31,515 Income from unconsolidated joint ventures 376 376 751 665 Net Income 54,490 18,330 68,997 32,180 Income allocated to non-controlling interests (107) (91) (202) (179) Net income attributable to LTC Properties, Inc. 54,383 18,239 68,795 32,001 Income allocated to participating securities (318) (113) (407) (233) Net income available to common stockholders 54,065$ 18,126$ 68,388$ 31,768$ Earnings per common share: Basic $1.37 $0.46 $1.74 $0.81 Diluted $1.36 $0.46 $1.73 $0.81 Weighted average shares used to calculate earnings per common share: Basic 39,492 39,169 39,347 39,135 Diluted 39,665 39,170 39,520 39,136 Dividends declared and paid per common share $0.57 $0.57 $1.14 $1.14 THREE MONTHS ENDED JUNE 30, JUNE 30, SIX MONTHS ENDED
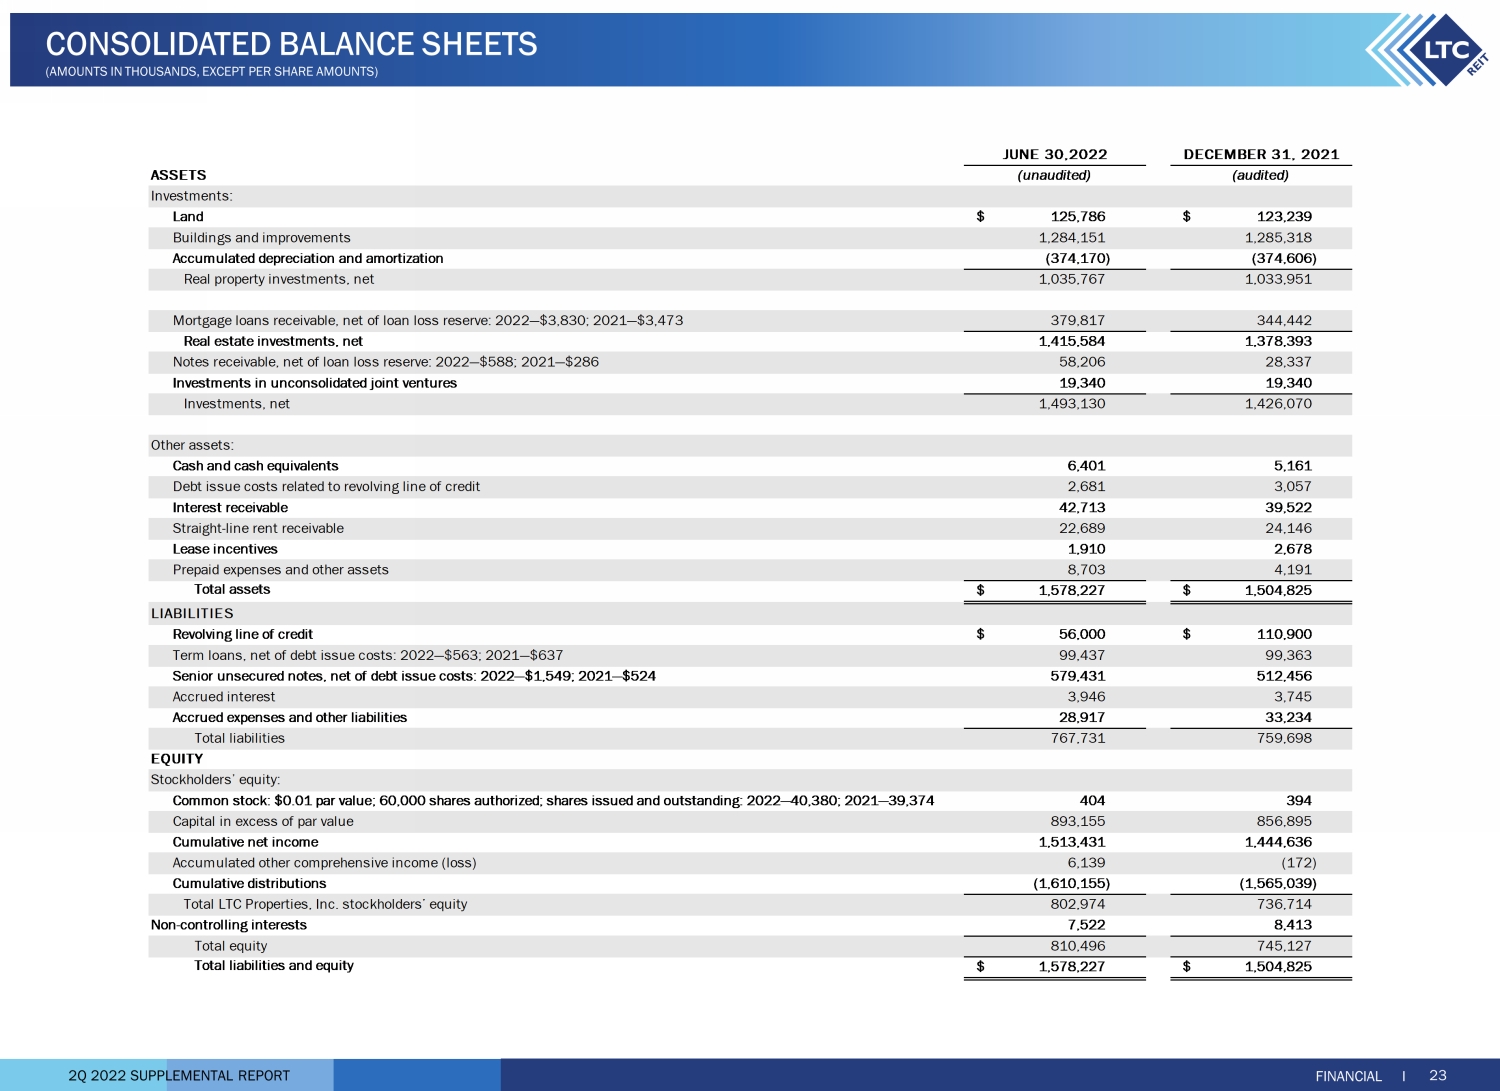
2Q 2022 SUPPLEMENTAL REPORT FINANCIAL I 23 CONSOLIDATED BALANCE SHEETS (AMOUNTS IN THOUSANDS, EXCEPT PER SHARE AMOUNTS) ASSETS Investments: Land $ 125,786 $ 123,239 Buildings and improvements 1,284,151 1,285,318 Accumulated depreciation and amortization (374,170) (374,606) Real property investments, net 1,035,767 1,033,951 Mortgage loans receivable, net of loan loss reserve: 2022—$3,830; 2021—$3,473 379,817 344,442 Real estate investments, net 1,415,584 1,378,393 Notes receivable, net of loan loss reserve: 2022—$588; 2021—$286 58,206 28,337 Investments in unconsolidated joint ventures 19,340 19,340 Investments, net 1,493,130 1,426,070 Other assets: Cash and cash equivalents 6,401 5,161 Debt issue costs related to revolving line of credit 2,681 3,057 Interest receivable 42,713 39,522 Straight-line rent receivable 22,689 24,146 Lease incentives 1,910 2,678 Prepaid expenses and other assets 8,703 4,191 Total assets $ 1,578,227 $ 1,504,825 LIABILITIES Revolving line of credit $ 56,000 $ 110,900 Term loans, net of debt issue costs: 2022—$563; 2021—$637 99,437 99,363 Senior unsecured notes, net of debt issue costs: 2022—$1,549; 2021—$524 579,431 512,456 Accrued interest 3,946 3,745 Accrued expenses and other liabilities 28,917 33,234 Total liabilities 767,731 759,698 EQUITY Stockholders’ equity: Common stock: $0.01 par value; 60,000 shares authorized; shares issued and outstanding: 2022—40,380; 2021—39,374 404 394 Capital in excess of par value 893,155 856,895 Cumulative net income 1,513,431 1,444,636 Accumulated other comprehensive income (loss) 6,139 (172) Cumulative distributions (1,610,155) (1,565,039) Total LTC Properties, Inc. stockholders’ equity 802,974 736,714 Non-controlling interests 7,522 8,413 Total equity 810,496 745,127 Total liabilities and equity $ 1,578,227 $ 1,504,825 (unaudited) (audited) DECEMBER 31, 2021JUNE 30,2022
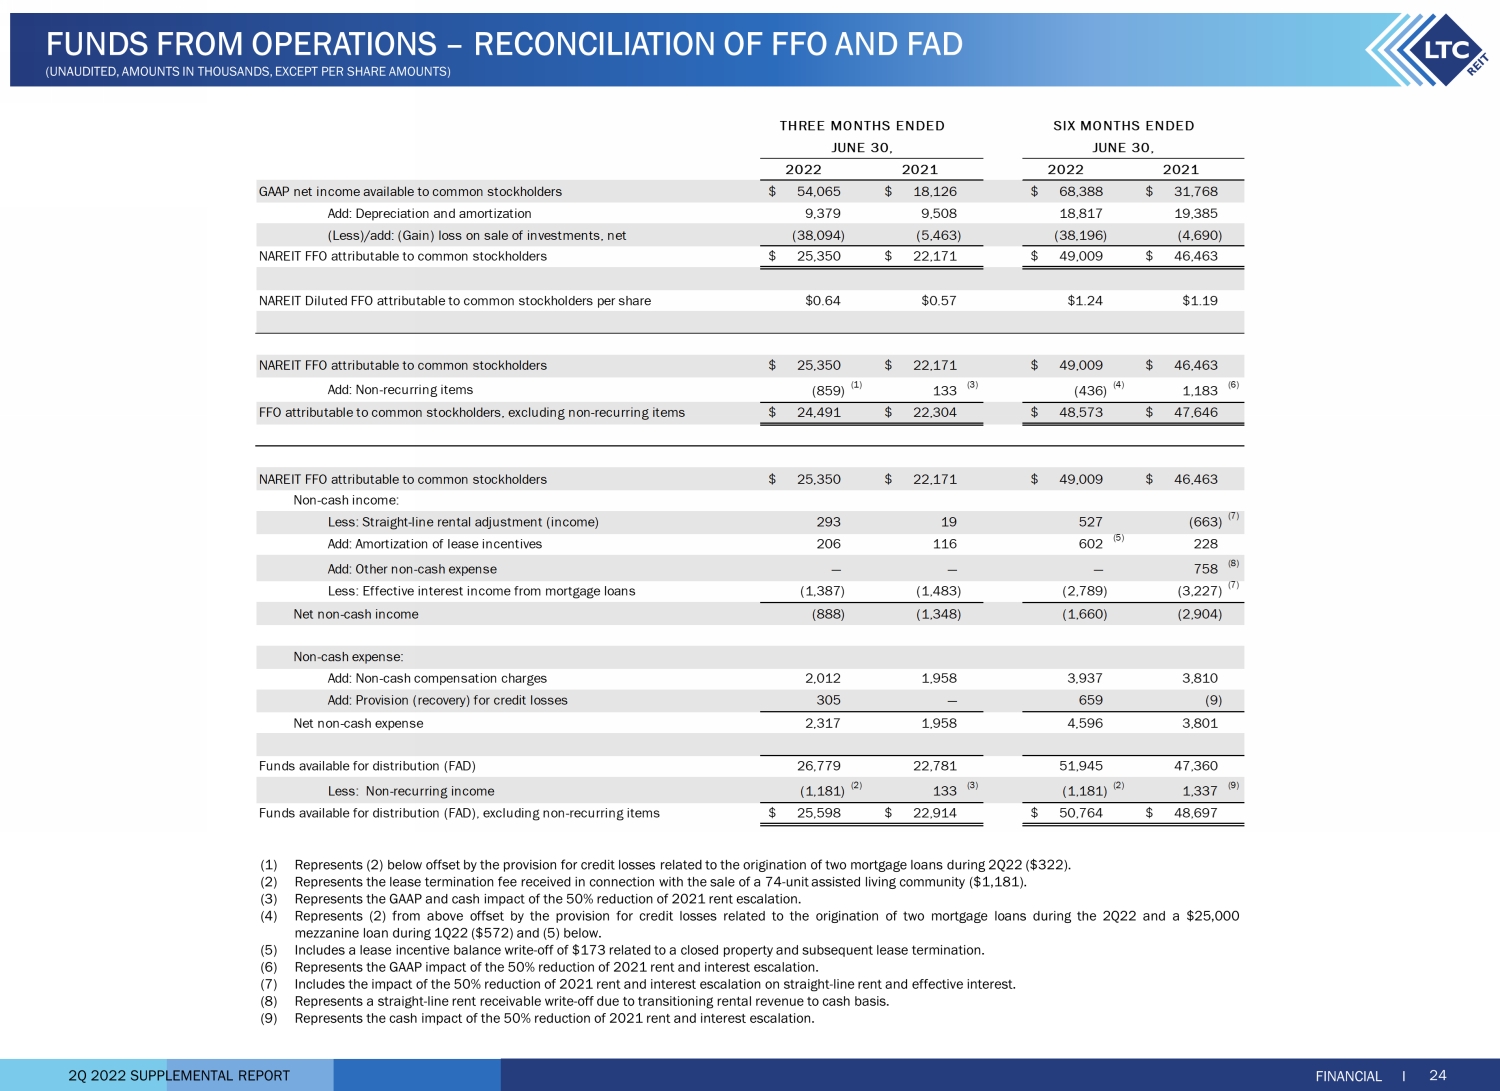
2Q 2022 SUPPLEMENTAL REPORT (1) Represents ( 2 ) below offset by the provision for credit losses related to the origination of two mortgage loans during 2 Q 22 ( $ 322 ) . (2) Represents the lease termination fee received in connection with the sale of a 74 - unit assisted living community ( $ 1 , 181 ) . (3) Represents the GAAP and cash impact of the 50 % reduction of 2021 rent escalation . (4) Represents ( 2 ) from above offset by the provision for credit losses related to the origination of two mortgage loans during the 2 Q 22 and a $ 25 , 000 mezzanine loan during 1 Q 22 ( $ 572 ) and ( 5 ) below . (5) Includes a lease incentive balance write - off of $ 173 related to a closed property and subsequent lease termination . (6) Represents the GAAP impact of the 50 % reduction of 2021 rent and interest escalation . (7) Includes the impact of the 50 % reduction of 2021 rent and interest escalation on straight - line rent and effective interest . (8) Represents a straight - line rent receivable write - off due to transitioning rental revenue to cash basis . (9) Represents the cash impact of the 50 % reduction of 2021 rent and interest escalation . FINANCIAL I 24 FUNDS FROM OPERATIONS – RECONCILIATION OF FFO AND FAD (UNAUDITED, AMOUNTS IN THOUSANDS, EXCEPT PER SHARE AMOUNTS) 2022 2021 2022 2021 GAAP net income available to common stockholders 54,065$ 18,126$ 68,388$ 31,768$ Add: Depreciation and amortization 9,379 9,508 18,817 19,385 (Less)/add: (Gain) loss on sale of investments, net (38,094) (5,463) (38,196) (4,690) NAREIT FFO attributable to common stockholders 25,350$ 22,171$ 49,009$ 46,463$ $0.64 $0.57 $1.24 $1.19 NAREIT FFO attributable to common stockholders 25,350$ 22,171$ 49,009$ 46,463$ Add: Non-recurring items (859) (1) 133 (3) (436) (4) 1,183 (6) 24,491$ 22,304$ 48,573$ 47,646$ NAREIT FFO attributable to common stockholders 25,350$ 22,171$ 49,009$ 46,463$ Non-cash income: Less: Straight-line rental adjustment (income) 293 19 527 (663) (7) Add: Amortization of lease incentives 206 116 602 (5) 228 Add: Other non-cash expense — — — 758 (8) Less: Effective interest income from mortgage loans (1,387) (1,483) (2,789) (3,227) (7) Net non-cash income (888) (1,348) (1,660) (2,904) Non-cash expense: Add: Non-cash compensation charges 2,012 1,958 3,937 3,810 Add: Provision (recovery) for credit losses 305 — 659 (9) Net non-cash expense 2,317 1,958 4,596 3,801 Funds available for distribution (FAD) 26,779 22,781 51,945 47,360 Less: Non-recurring income (1,181) (2) 133 (3) (1,181) (2) 1,337 (9) Funds available for distribution (FAD), excluding non-recurring items 25,598$ 22,914$ 50,764$ 48,697$ FFO attributable to common stockholders, excluding non-recurring items THREE MONTHS ENDED SIX MONTHS ENDED JUNE 30, JUNE 30, NAREIT Diluted FFO attributable to common stockholders per share

2Q 2022 SUPPLEMENTAL REPORT FOR THE THREE MONTHS ENDED JUNE 30, FFO/FAD attributable to common stockholders 25,350$ 22,171$ 26,779$ 22,781$ Non-recurring one-time items (859) (1) 133 (3) (1,181) (2) 133 (3) FFO/FAD attributable to common stockholders excluding non-recurring items 24,491 22,304 25,598 22,914 Effect of dilutive securities: Participating securities — 113 — 113 Diluted FFO/FAD excluding non-recurring items 24,491$ 22,417$ 25,598$ 23,027$ 39,492 39,169 39,492 39,169 Effect of dilutive securities: Stock options — 1 — 1 Performance-based stock units 173 — 173 — Participating securities — 199 — 199 Shares for diluted FFO/FAD per share 39,665 39,369 39,665 39,369 FOR THE SIX MONTHS ENDED JUNE 30, FFO/FAD attributable to common stockholders 49,009$ 46,463$ 51,945$ 47,360$ Non-recurring one-time items (436) (4) 1,183 (5) (1,181) (2) 1,337 (6) FFO/FAD attributable to common stockholders excluding non-recurring items 48,573 47,646 50,764 48,697 Effect of dilutive securities: Participating securities — 233 — 233 Diluted FFO/FAD 48,573$ 47,879$ 50,764$ 48,930$ 39,347 39,135 39,347 39,135 Effect of dilutive securities: Stock options — 1 — 1 Performance based stock units 173 — 173 — Participating securities — 197 — 197 Shares for diluted FFO/FAD per share 39,520 39,333 39,520 39,333 Shares for basic FFO/FAD per share 2022 2021 2021 Shares for basic FFO/FAD per share FFO FAD 2022 FFO FAD 2022 2021 2022 2021 FINANCIAL I 25 FUNDS FROM OPERATIONS – RECONCILIATION OF FFO PER SHARE (UNAUDITED, AMOUNTS IN THOUSANDS, EXCEPT PER SHARE AMOUNTS) (1) Represents ( 2 ) below offset by the provision for credit losses related to the origination of two mortgage loans during 2 Q 22 ( $ 322 ) . (2) Represents the lease termination fee received in connection with the sale of a 74 - unit assisted living community ( $ 1 , 181 ) . (3) Represents the GAAP and cash impact of the 50 % reduction of 2021 rent escalation . (4) Represents ( 2 ) from above offset by the provision for credit losses related to the origination of two mortgage loans during 2 Q 22 and a $ 25 , 000 mezzanine loan during the first quarter of 2022 ( $ 572 ) and a lease incentive balance write - off of $ 173 related to a closed property and subsequent lease termination . (5) Represents the GAAP impact of the 50 % reduction of 2021 rent and interest escalation . (6) Represents the cash impact of the 50 % reduction of 2021 rent and interest escalation .

2Q 2022 SUPPLEMENTAL REPORT 26 ESG (ENVIRONMENTAL, SOCIAL & GOVERNANCE) ESG I ESG PEOPLE. PLANET. INTEGRITY. Implementing corporate stewardship through socially responsible and sustainable practices. 2021 2022 Board established an ESG committee to oversee practices and performance Created and published an Environmental Sustainability Commitment and Human Capital Management and Labor Rights Guidelines Enhanced our disclosures to highlight ESG initiatives Aligning with the Sustainability Accounting Standards Board (SASB) reporting framework and adopting select United Nations Sustainable Development Goals (SDGs) in guiding us to provide shareholders with relevant information on our environmental impact Visit our website to learn more about our ESG initiatives. www.ltcreit.com/esg
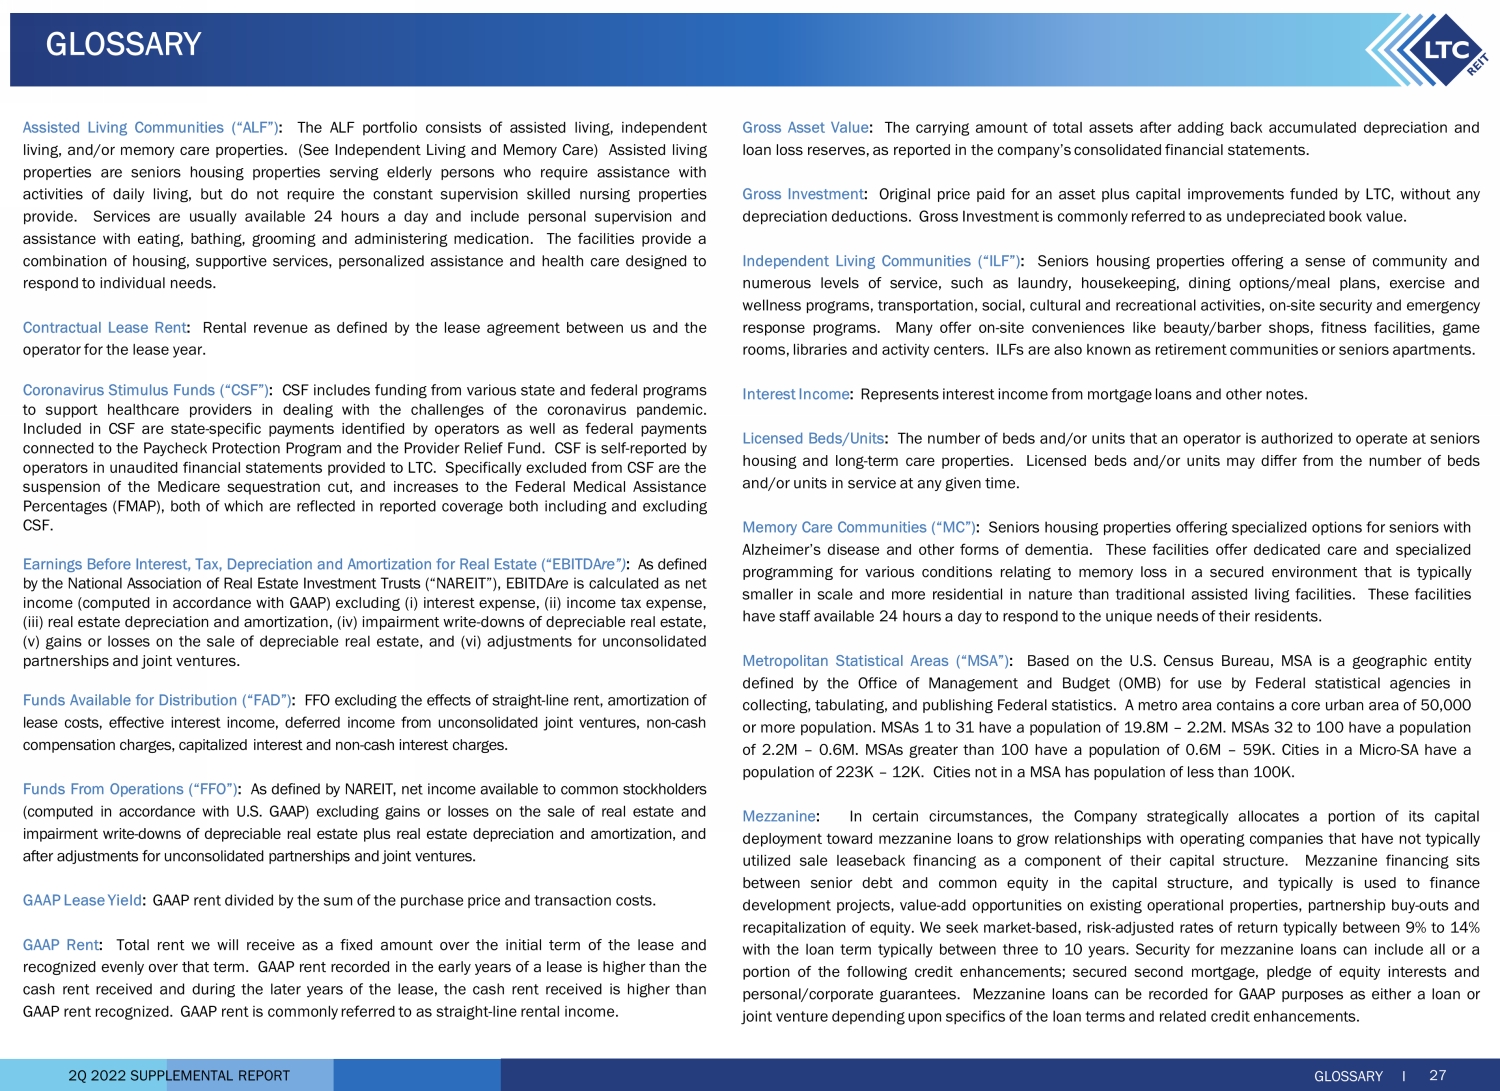
2Q 2022 SUPPLEMENTAL REPORT Assisted Living Communities (“ALF”) : The ALF portfolio consists of assisted living, independent living, and/or memory care properties . (See Independent Living and Memory Care) Assisted living properties are seniors housing properties serving elderly persons who require assistance with activities of daily living, but do not require the constant supervision skilled nursing properties provide . Services are usually available 24 hours a day and include personal supervision and assistance with eating, bathing, grooming and administering medication . The facilities provide a combination of housing, supportive services, personalized assistance and health care designed to respond to individual needs . Contractual Lease Rent : Rental revenue as defined by the lease agreement between us and the operator for the lease year . Coronavirus Stimulus Funds (“CSF”) : CSF includes funding from various state and federal programs to support healthcare providers in dealing with the challenges of the coronavirus pandemic . Included in CSF are state - specific payments identified by operators as well as federal payments connected to the Paycheck Protection Program and the Provider Relief Fund . CSF is self - reported by operators in unaudited financial statements provided to LTC . Specifically excluded from CSF are the suspension of the Medicare sequestration cut, and increases to the Federal Medical Assistance Percentages (FMAP), both of which are reflected in reported coverage both including and excluding CSF . Earnings Before Interest, Tax, Depreciation and Amortization for Real Estate (“EBITDA re”) : As defined by the National Association of Real Estate Investment Trusts (“ NAREIT”), EBITDA re is calculated as net income (computed in accordance with GAAP) excluding (i) interest expense, (ii) income tax expense, (iii) real estate depreciation and amortization, (iv) impairment write - downs of depreciable real estate, (v) gains or losses on the sale of depreciable real estate, and (vi) adjustments for unconsolidated partnerships and joint ventures . Funds Available for Distribution (“FAD”) : FFO excluding the effects of straight - line rent, amortization of lease costs, effective interest income, deferred income from unconsolidated joint ventures, non - cash compensation charges, capitalized interest and non - cash interest charges . Funds From Operations (“FFO”) : A s defined by NAREIT, net income available to common stockholders (computed in accordance with U . S . GAAP) excluding gains or losses on the sale of real estate and impairment write - downs of depreciable real estate plus real estate depreciation and amortization, and after adjustments for unconsolidated partnerships and joint ventures . GAAP Lease Yield : GAAP rent divided by the sum of the purchase price and transaction costs . GAAP Rent : Total rent we will receive as a fixed amount over the initial term of the lease and recognized evenly over that term . GAAP rent recorded in the early years of a lease is higher than the cash rent received and during the later years of the lease, the cash rent received is higher than GAAP rent recognized . GAAP rent is commonly referred to as straight - line rental income . Gross Asset Value : The carrying amount of total assets after adding back accumulated depreciation and loan loss reserves, as reported in the company’s consolidated financial statements . Gross Investment : Original price paid for an asset plus capital improvements funded by LTC, without any depreciation deductions . Gross Investment is commonly referred to as undepreciated book value . Independent Living Communities (“ILF”) : Seniors housing properties offering a sense of community and numerous levels of service, such as laundry, housekeeping, dining options/meal plans, exercise and wellness programs, transportation, social, cultural and recreational activities, on - site security and emergency response programs . Many offer on - site conveniences like beauty/barber shops, fitness facilities, game rooms, libraries and activity centers . ILFs are also known as retirement communities or seniors apartments . Interest Income : Represents interest income from mortgage loans and other notes . Licensed Beds/Units : The number of beds and/or units that an operator is authorized to operate at seniors housing and long - term care properties . Licensed beds and/or units may differ from the number of beds and/or units in service at any given time . Memory Care Communities (“MC”) : Seniors housing properties offering specialized options for seniors with Alzheimer’s disease and other forms of dementia . These facilities offer dedicated care and specialized programming for various conditions relating to memory loss in a secured environment that is typically smaller in scale and more residential in nature than traditional assisted living facilities . These facilities have staff available 24 hours a day to respond to the unique needs of their residents . Metropolitan Statistical Areas (“MSA”) : Based on the U . S . Census Bureau, MSA is a geographic entity defined by the Office of Management and Budget (OMB) for use by Federal statistical agencies in collecting, tabulating, and publishing Federal statistics . A metro area contains a core urban area of 50 , 000 or more population . MSAs 1 to 31 have a population of 19 . 8 M – 2 . 2 M . MSAs 32 to 100 have a population of 2 . 2 M – 0 . 6 M . MSAs greater than 100 have a population of 0 . 6 M – 59 K . Cities in a Micro - SA have a population of 223 K – 12 K . Cities not in a MSA has population of less than 100 K . Mezzanine : In certain circumstances, the Company strategically allocates a portion of its capital deployment toward mezzanine loans to grow relationships with operating companies that have not typically utilized sale leaseback financing as a component of their capital structure . Mezzanine financing sits between senior debt and common equity in the capital structure, and typically is used to finance development projects, value - add opportunities on existing operational properties, partnership buy - outs and recapitalization of equity . We seek market - based, risk - adjusted rates of return typically between 9 % to 14 % with the loan term typically between three to 10 years . Security for mezzanine loans can include all or a portion of the following credit enhancements ; secured second mortgage, pledge of equity interests and personal/corporate guarantees . Mezzanine loans can be recorded for GAAP purposes as either a loan or joint venture depending upon specifics of the loan terms and related credit enhancements . GLOSSARY I 27 GLOSSARY
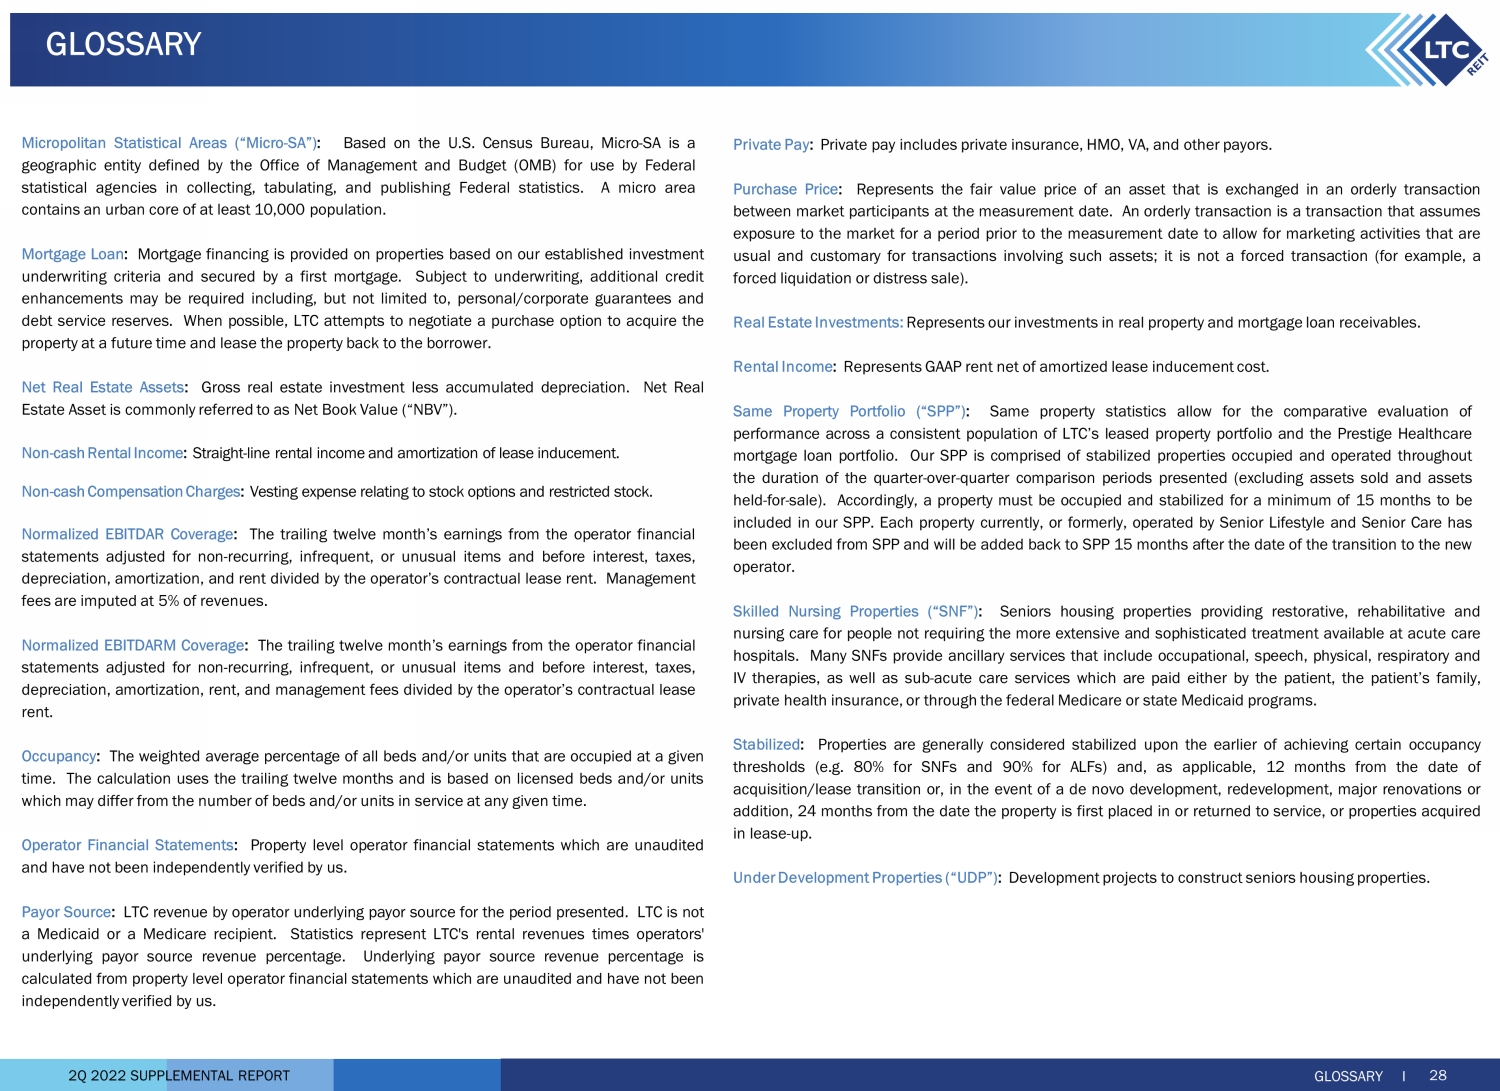
2Q 2022 SUPPLEMENTAL REPORT Micropolitan Statistical Areas (“Micro - SA”) : Based on the U . S . Census Bureau, Micro - SA is a geographic entity defined by the Office of Management and Budget (OMB) for use by Federal statistical agencies in collecting, tabulating, and publishing Federal statistics . A micro area contains an urban core of at least 10 , 000 population . Mortgage Loan : Mortgage financing is provided on properties based on our established investment underwriting criteria and secured by a first mortgage . Subject to underwriting, additional credit enhancements may be required including, but not limited to, personal/corporate guarantees and debt service reserves . When possible, LTC attempts to negotiate a purchase option to acquire the property at a future time and lease the property back to the borrower . Net Real Estate Assets : Gross real estate investment less accumulated depreciation . Net Real Estate Asset is commonly referred to as Net Book Value (“NBV”) . Non - cash Rental Income : Straight - line rental income and amortization of lease inducement . Non - cash Compensation Charges : Vesting expense relating to stock options and restricted stock . Normalized EBITDAR Coverage : The trailing twelve month’s earnings from the operator financial statements adjusted for non - recurring, infrequent, or unusual items and before interest, taxes, depreciation, amortization, and rent divided by the operator’s contractual lease rent . Management fees are imputed at 5 % of revenues . Normalized EBITDARM Coverage : The trailing twelve month’s earnings from the operator financial statements adjusted for non - recurring, infrequent, or unusual items and before interest, taxes, depreciation, amortization, rent, and management fees divided by the operator’s contractual lease rent . Occupancy : The weighted average percentage of all beds and/or units that are occupied at a given time . The calculation uses the trailing twelve months and is based on licensed beds and/or units which may differ from the number of beds and/or units in service at any given time . Operator Financial Statements : Property level operator financial statements which are unaudited and have not been independently verified by us . Payor Source : LTC revenue by operator underlying payor source for the period presented . LTC is not a Medicaid or a Medicare recipient . Statistics represent LTC's rental revenues times operators' underlying payor source revenue percentage . Underlying payor source revenue percentage is calculated from property level operator financial statements which are unaudited and have not been independently verified by us . Private Pay : Private pay includes private insurance, HMO, VA, and other payors . Purchase Price : Represents the fair value price of an asset that is exchanged in an orderly transaction between market participants at the measurement date . An orderly transaction is a transaction that assumes exposure to the market for a period prior to the measurement date to allow for marketing activities that are usual and customary for transactions involving such assets ; it is not a forced transaction (for example, a forced liquidation or distress sale) . Real Estate Investments : Represents our investments in real property and mortgage loan receivables . Rental Income : Represents GAAP rent net of amortized lease inducement cost . Same Property Portfolio (“SPP”) : Same property statistics allow for the comparative evaluation of performance across a consistent population of LTC’s leased property portfolio and the Prestige Healthcare mortgage loan portfolio . Our SPP is comprised of stabilized properties occupied and operated throughout the duration of the quarter - over - quarter comparison periods presented (excluding assets sold and assets held - for - sale) . Accordingly, a property must be occupied and stabilized for a minimum of 15 months to be included in our SPP . Each property currently, or formerly, operated by Senior Lifestyle and Senior Care has been excluded from SPP and will be added back to SPP 15 months after the date of the transition to the new operator . Skilled Nursing Properties (“SNF”) : Seniors housing properties providing restorative, rehabilitative and nursing care for people not requiring the more extensive and sophisticated treatment available at acute care hospitals . Many SNFs provide ancillary services that include occupational, speech, physical, respiratory and IV therapies, as well as sub - acute care services which are paid either by the patient, the patient’s family, private health insurance, or through the federal Medicare or state Medicaid programs . Stabilized : Properties are generally considered stabilized upon the earlier of achieving certain occupancy thresholds (e . g . 80 % for SNFs and 90 % for ALFs) and, as applicable, 12 months from the date of acquisition/lease transition or, in the event of a de novo development, redevelopment, major renovations or addition, 24 months from the date the property is first placed in or returned to service, or properties acquired in lease - up . Under Development Properties (“UDP”) : Development projects to construct seniors housing properties . GLOSSARY I 28 GLOSSARY